
Numerical Assessment of Safe Separation Distance in the Wildland–Urban Interfaces


 ,
,  , ,
, ,  and
and
Abstract
1. Introduction
2. Materials and Methods
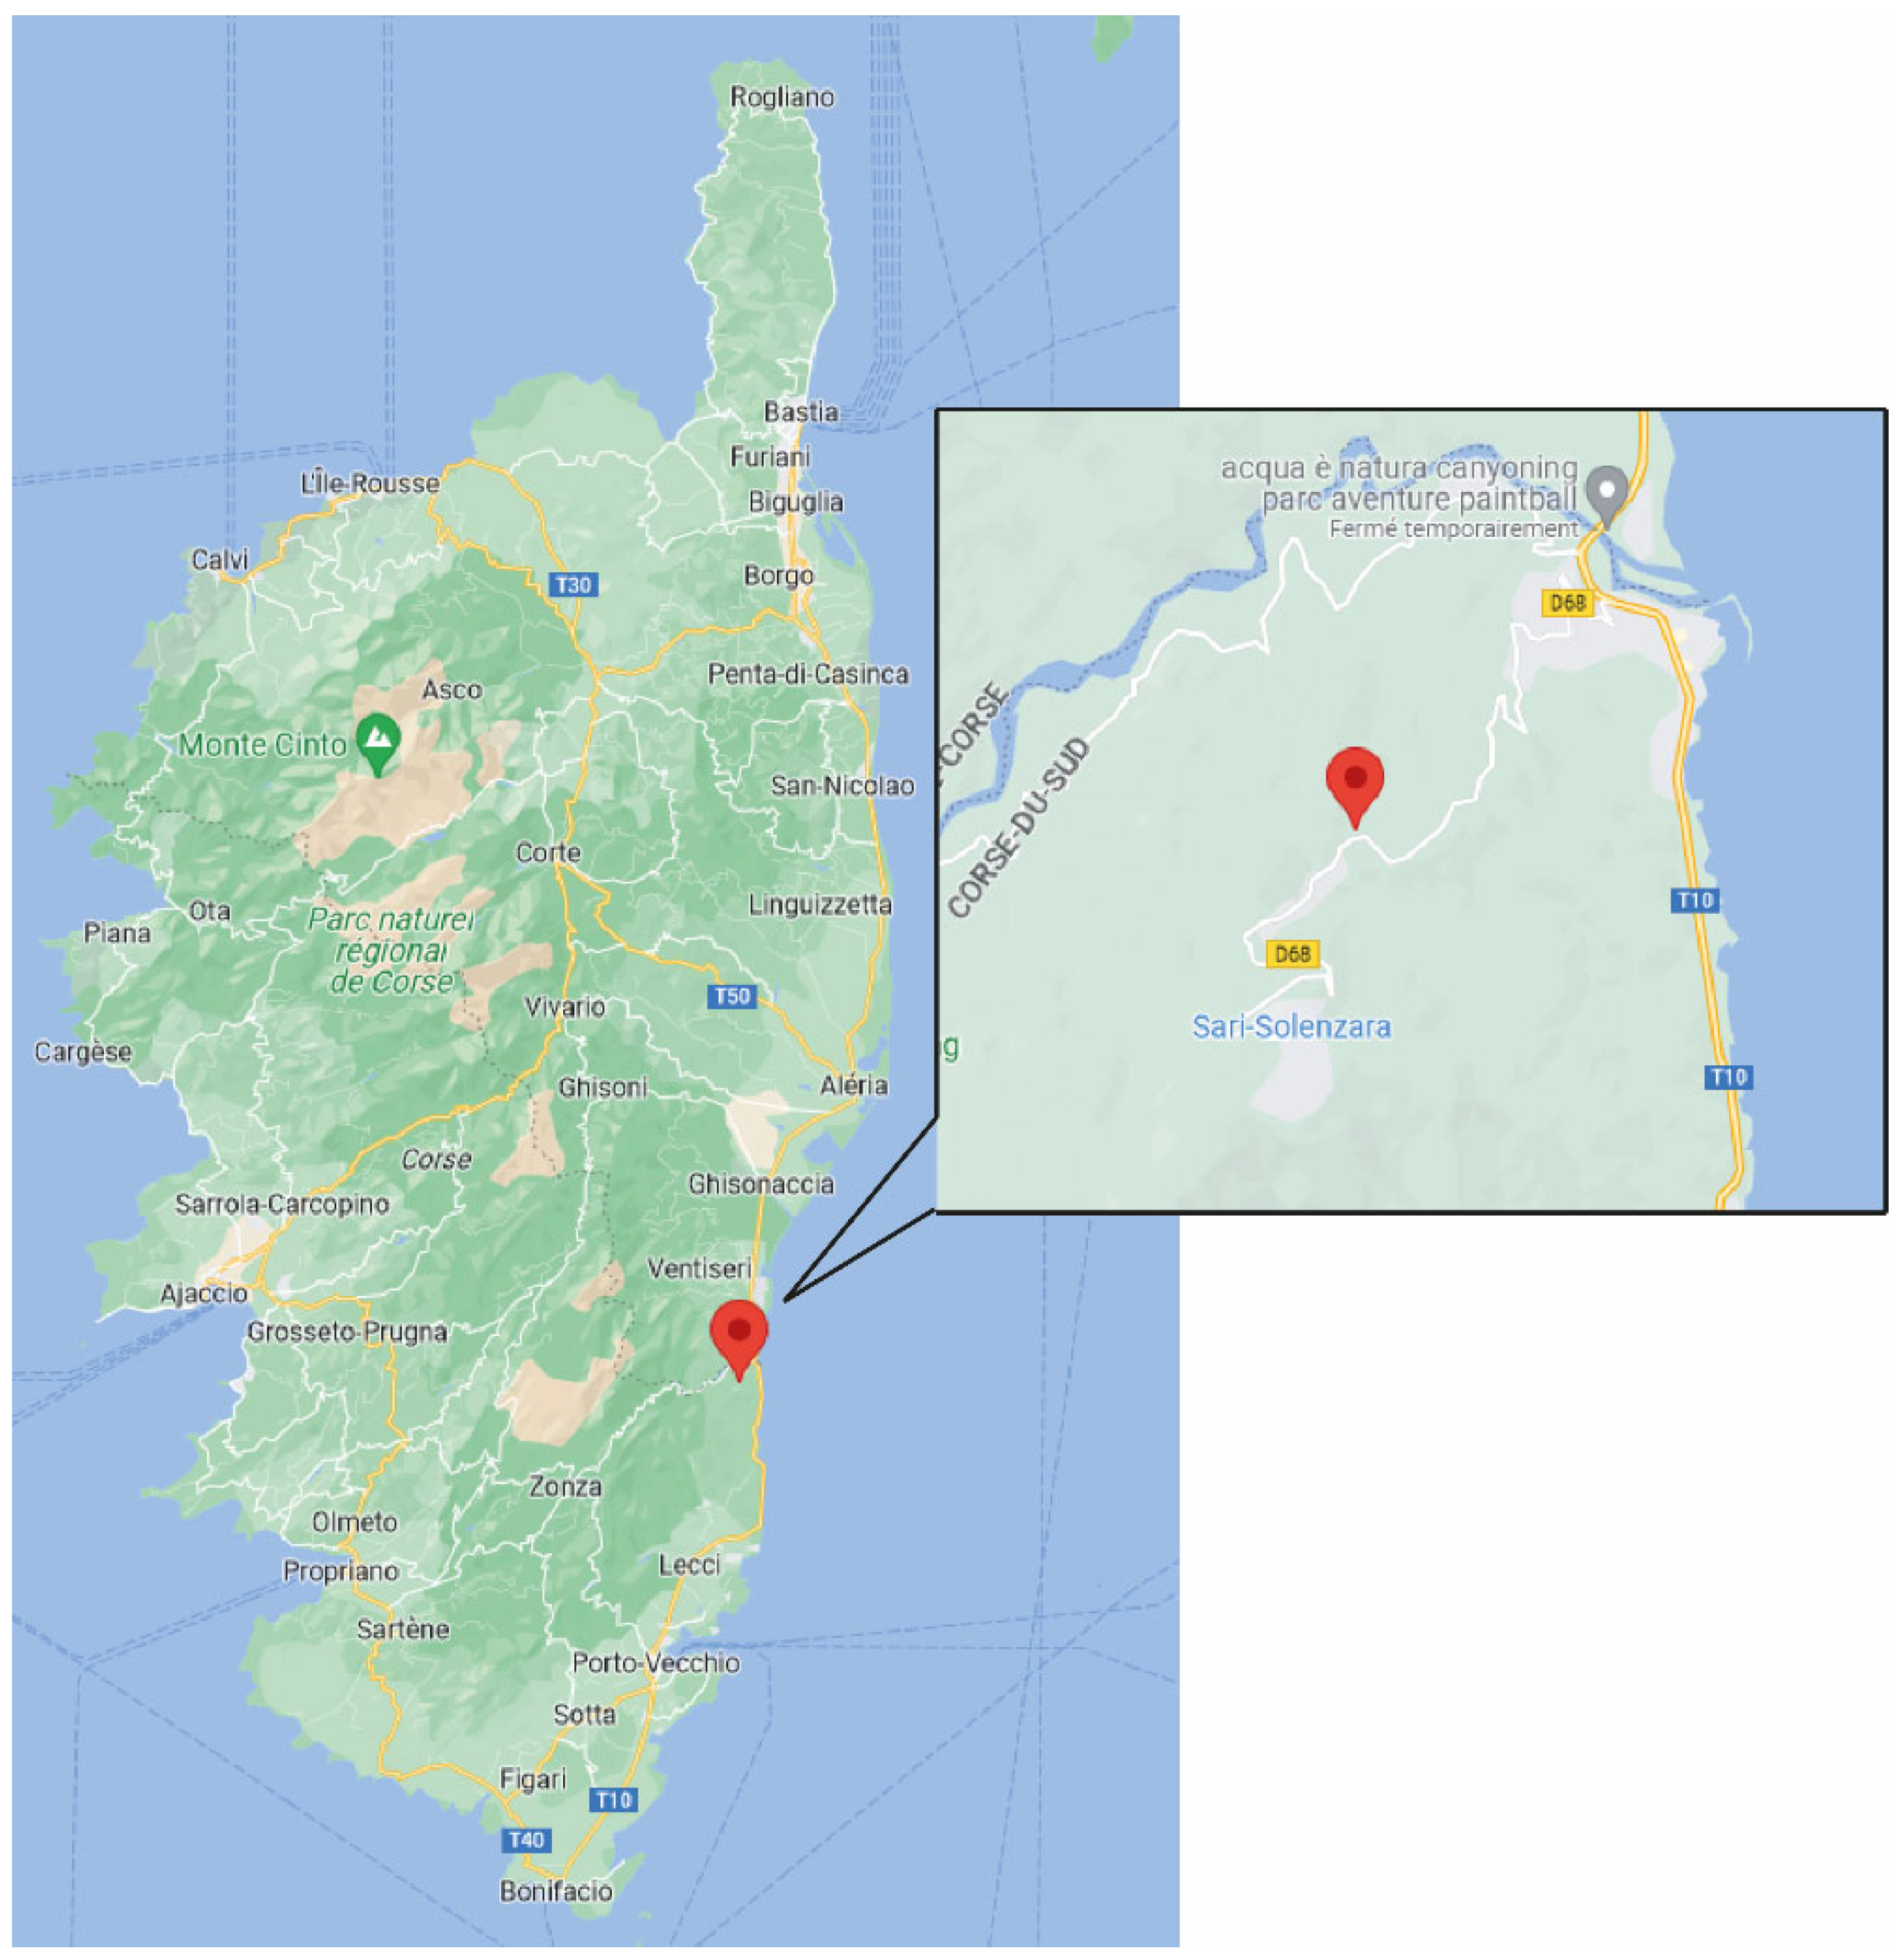
2.1. Characteristics of the Case Study
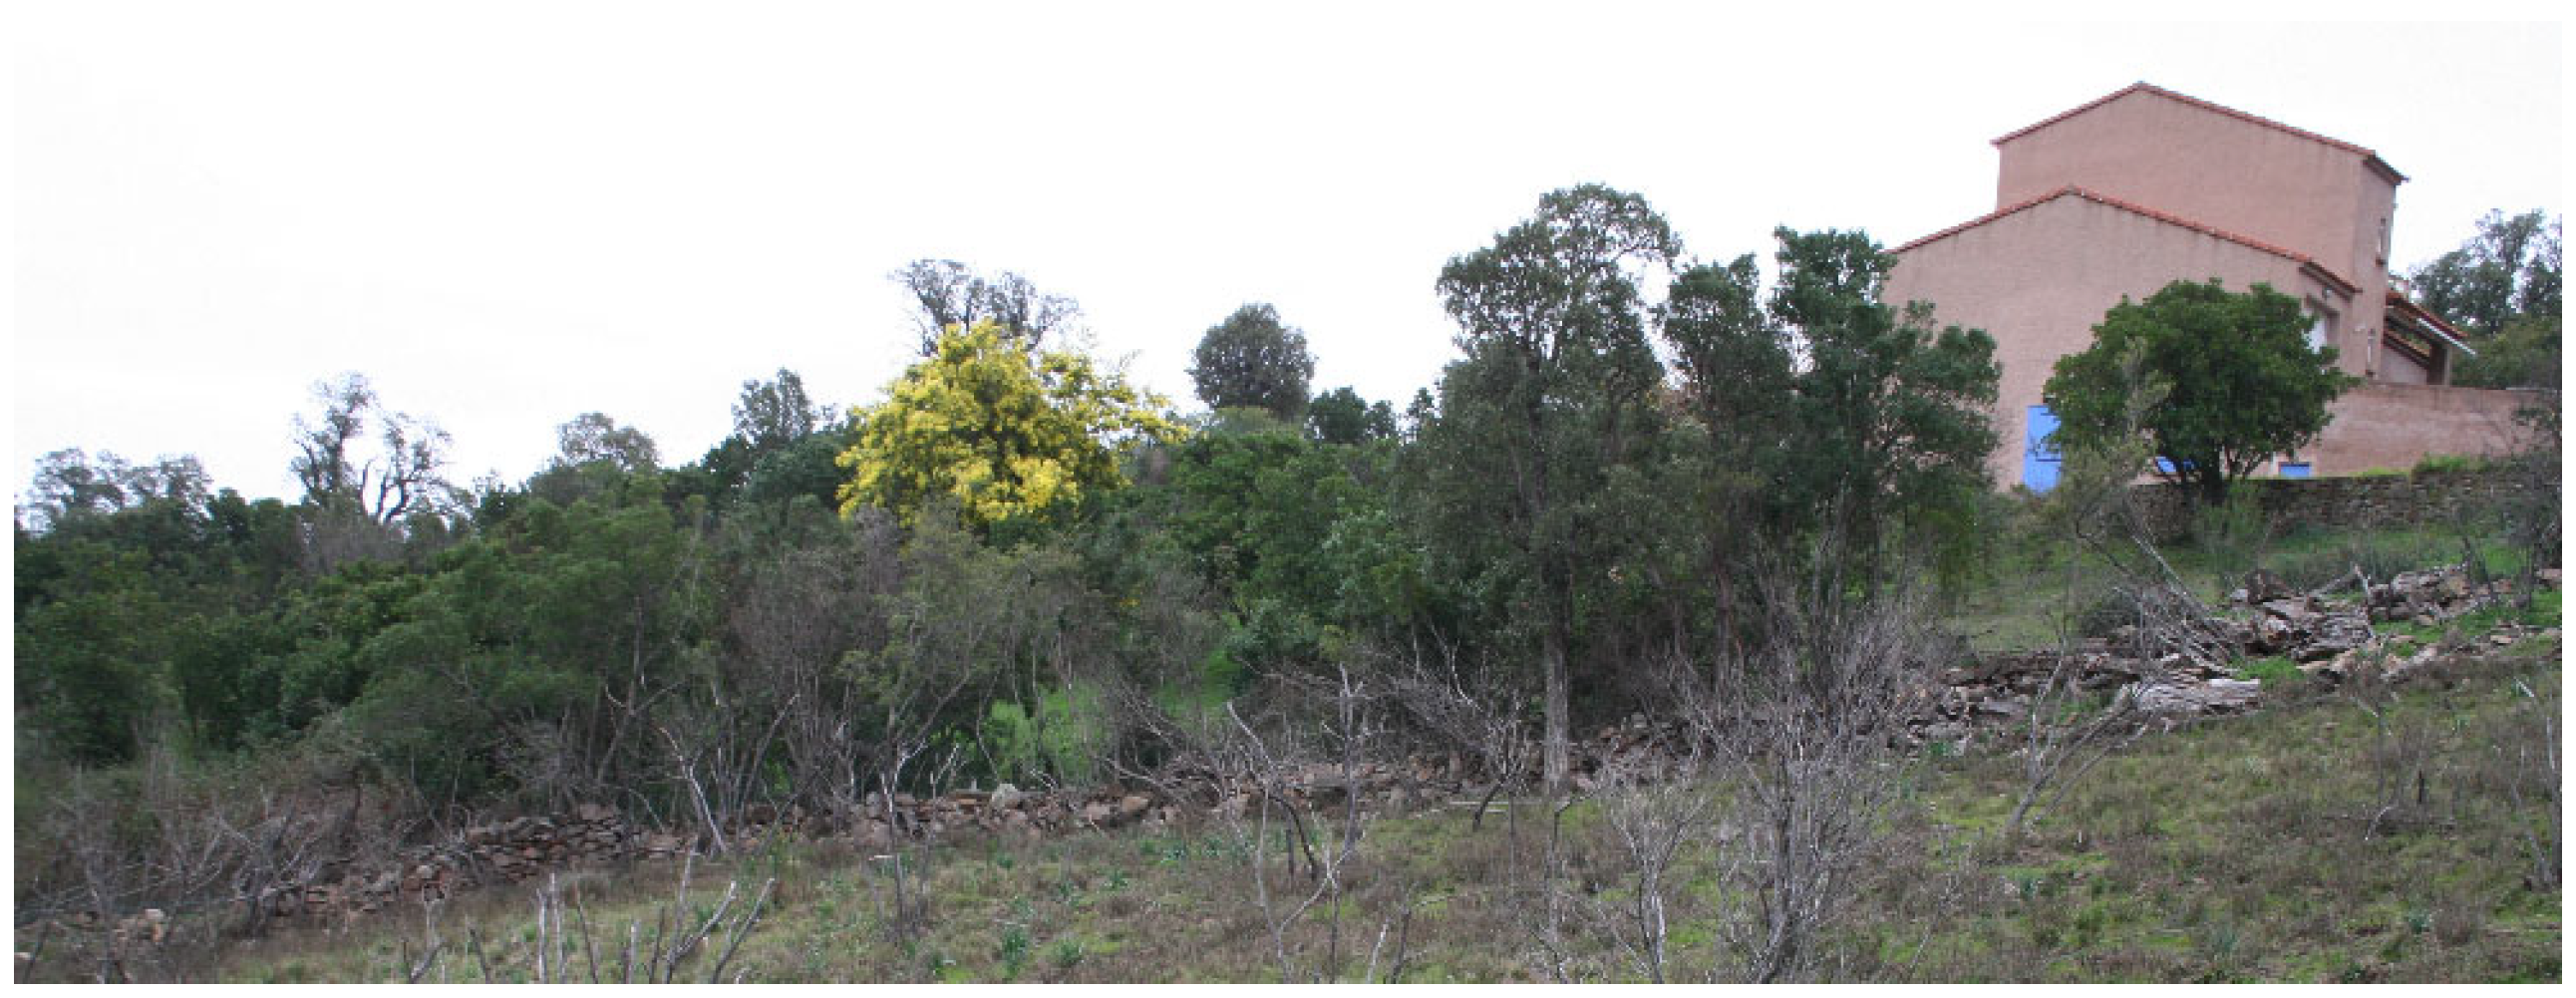
2.1.1. Site Description
2.1.2. Characterization of the Vegetation and Meteorology
2.1.3. Description of the Targets
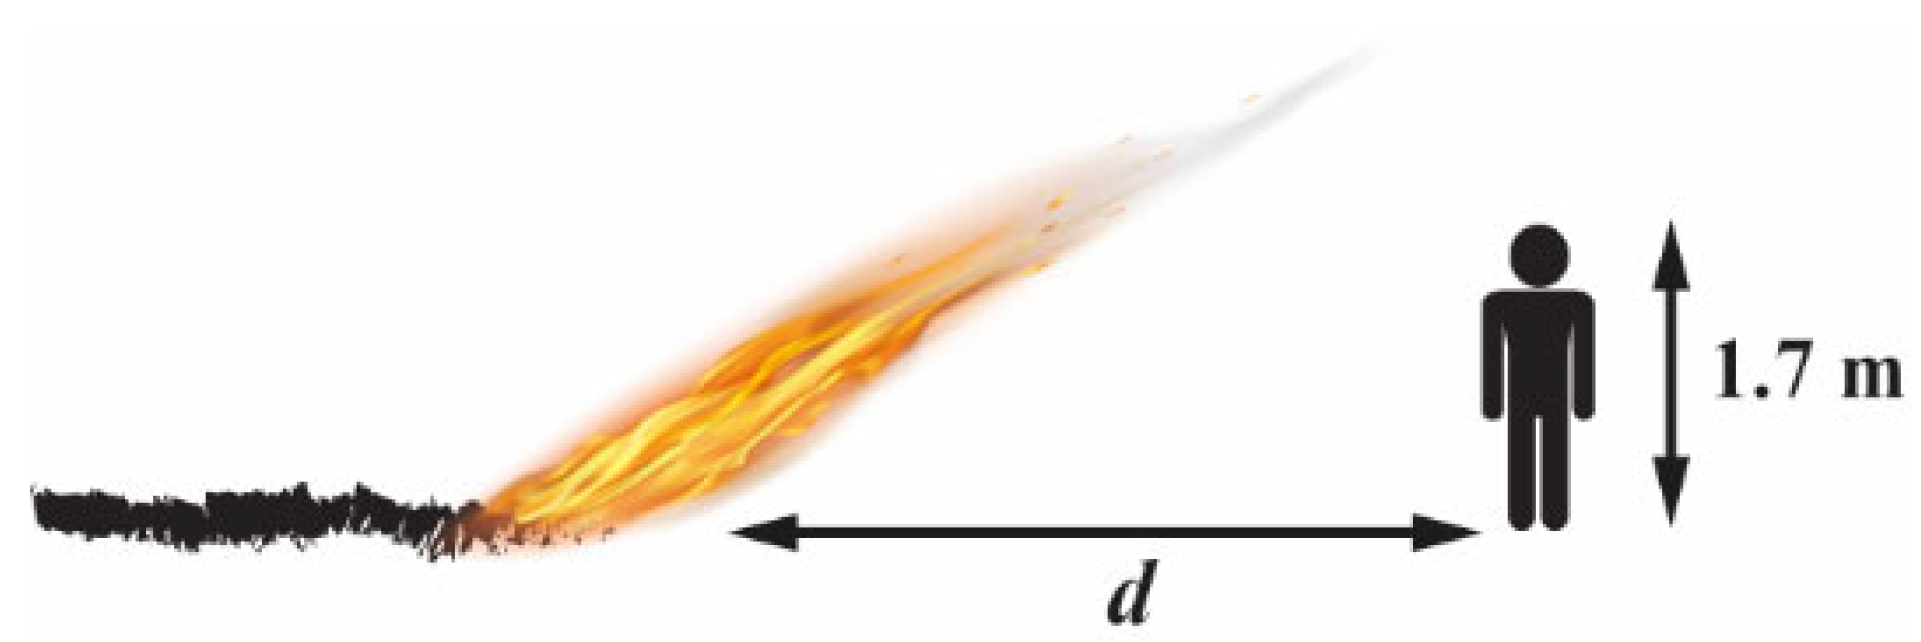
- Human body target: A person with an average height of 1.70 m is considered as the target for the calculation of the different heat fluxes (radiative and convective). As shown in Figure 3, the person is assumed to be standing perpendicular to the ground at a distance d from the flame front.
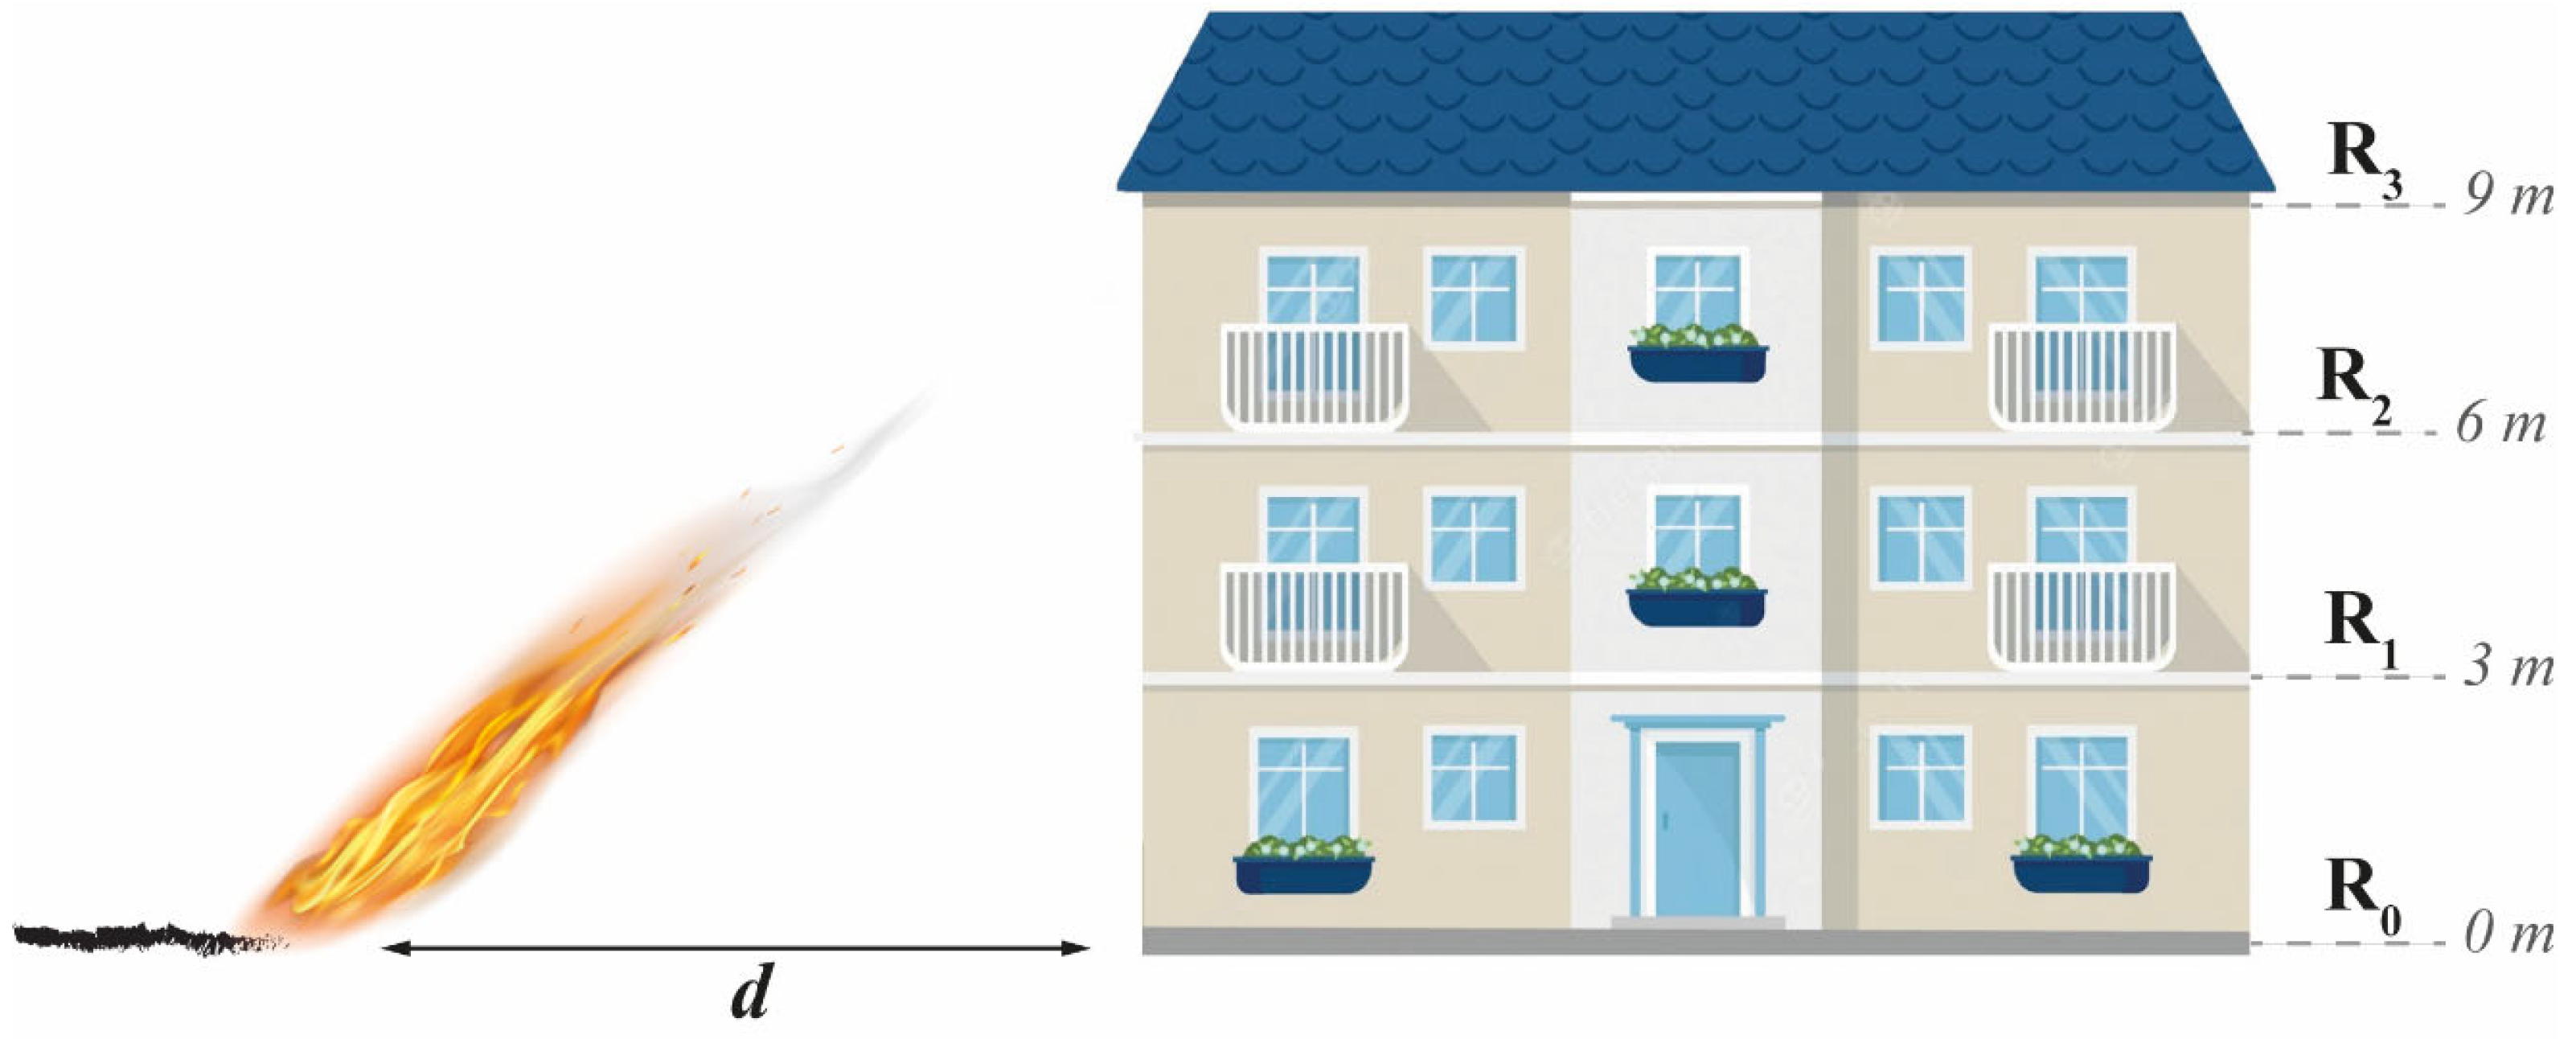
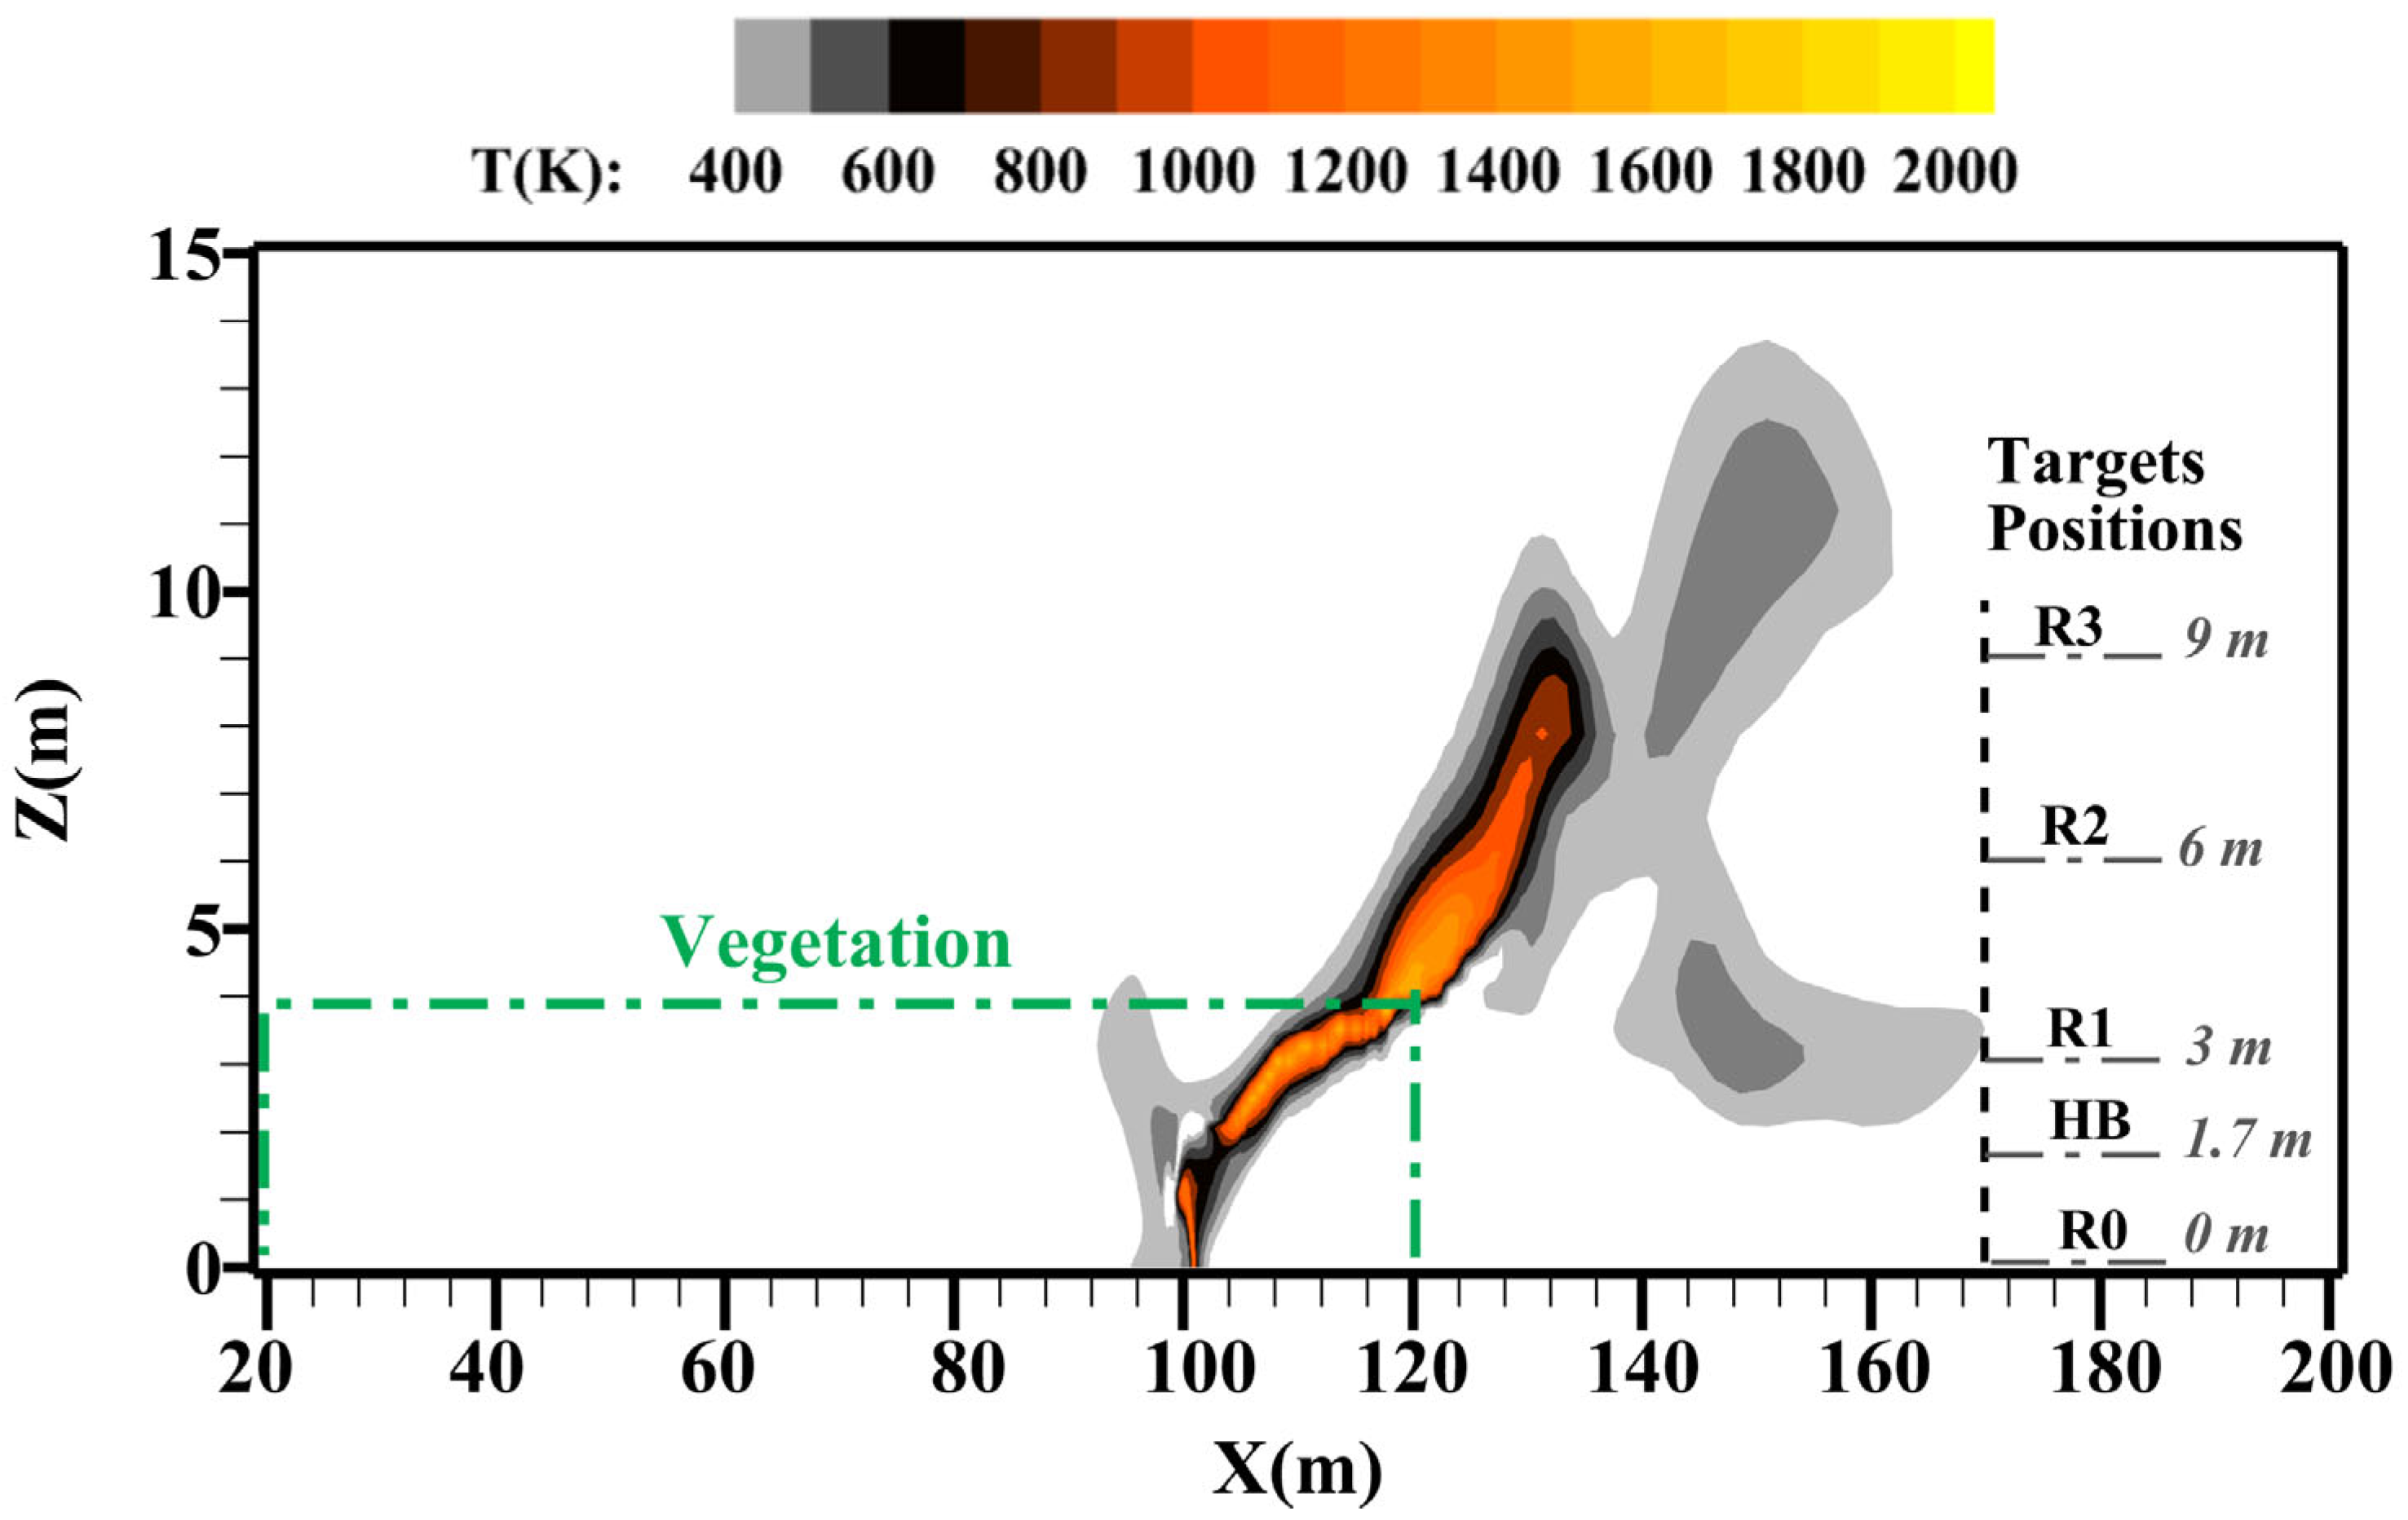
- Building target: A three-level building with a 10 m wide façade is considered. R0 is the level at 0 m, R1 is the level at 3 m, R2 at 6 m and the roof R3 at 9 m (Figure 4). Radiative and convective heat fluxes are assessed at these levels, and the SSD values are then determined based on the maximum tolerable heat flux related to the type of construction material at each level of the building.
2.2. Numerical Method
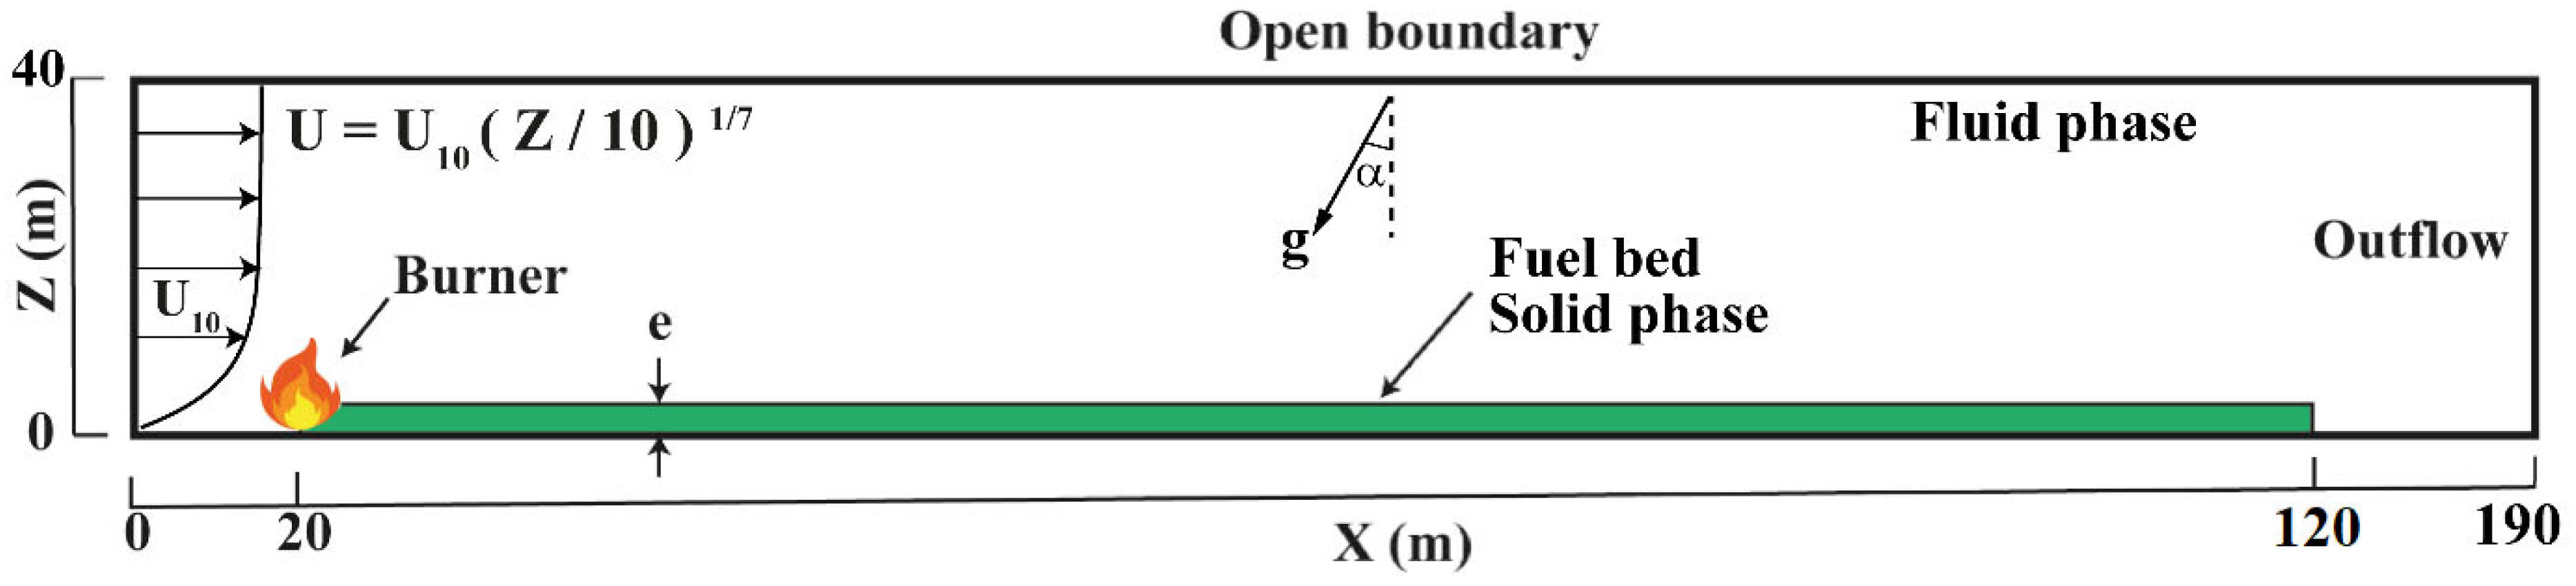
2.2.1. Numerical Configuration
2.2.2. Calculation Methods
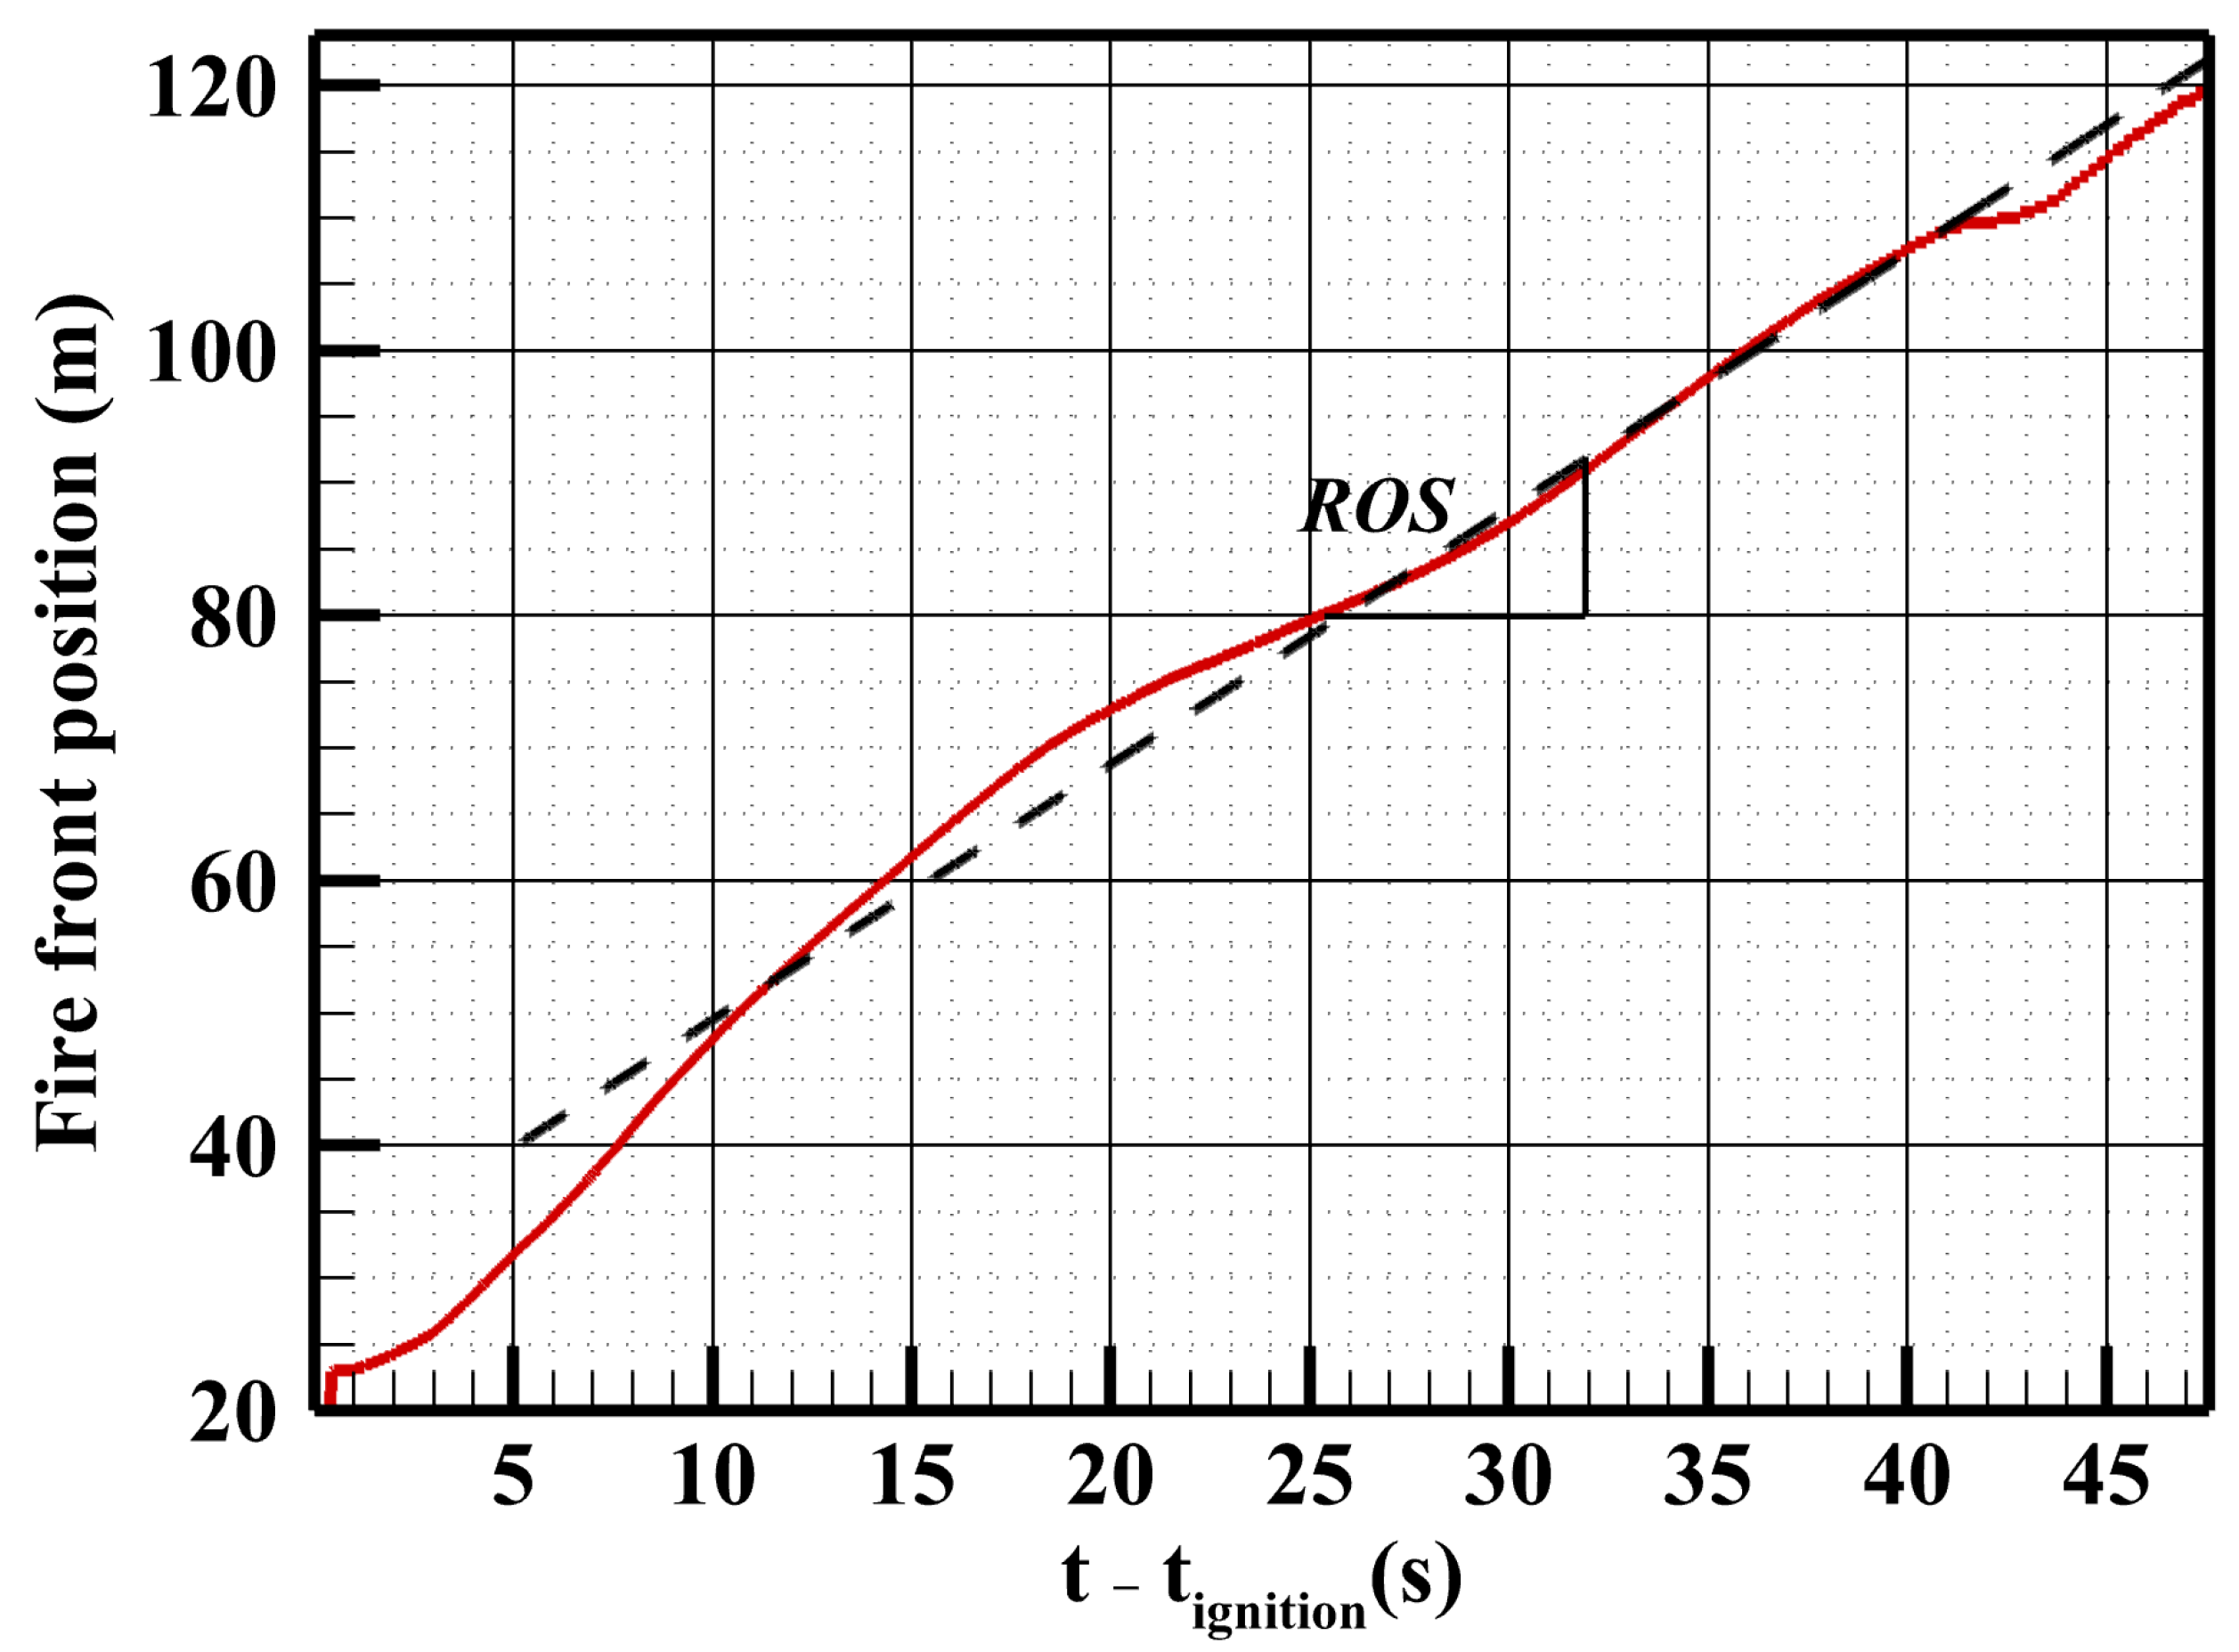
- Rate of spread
- Fireline intensity
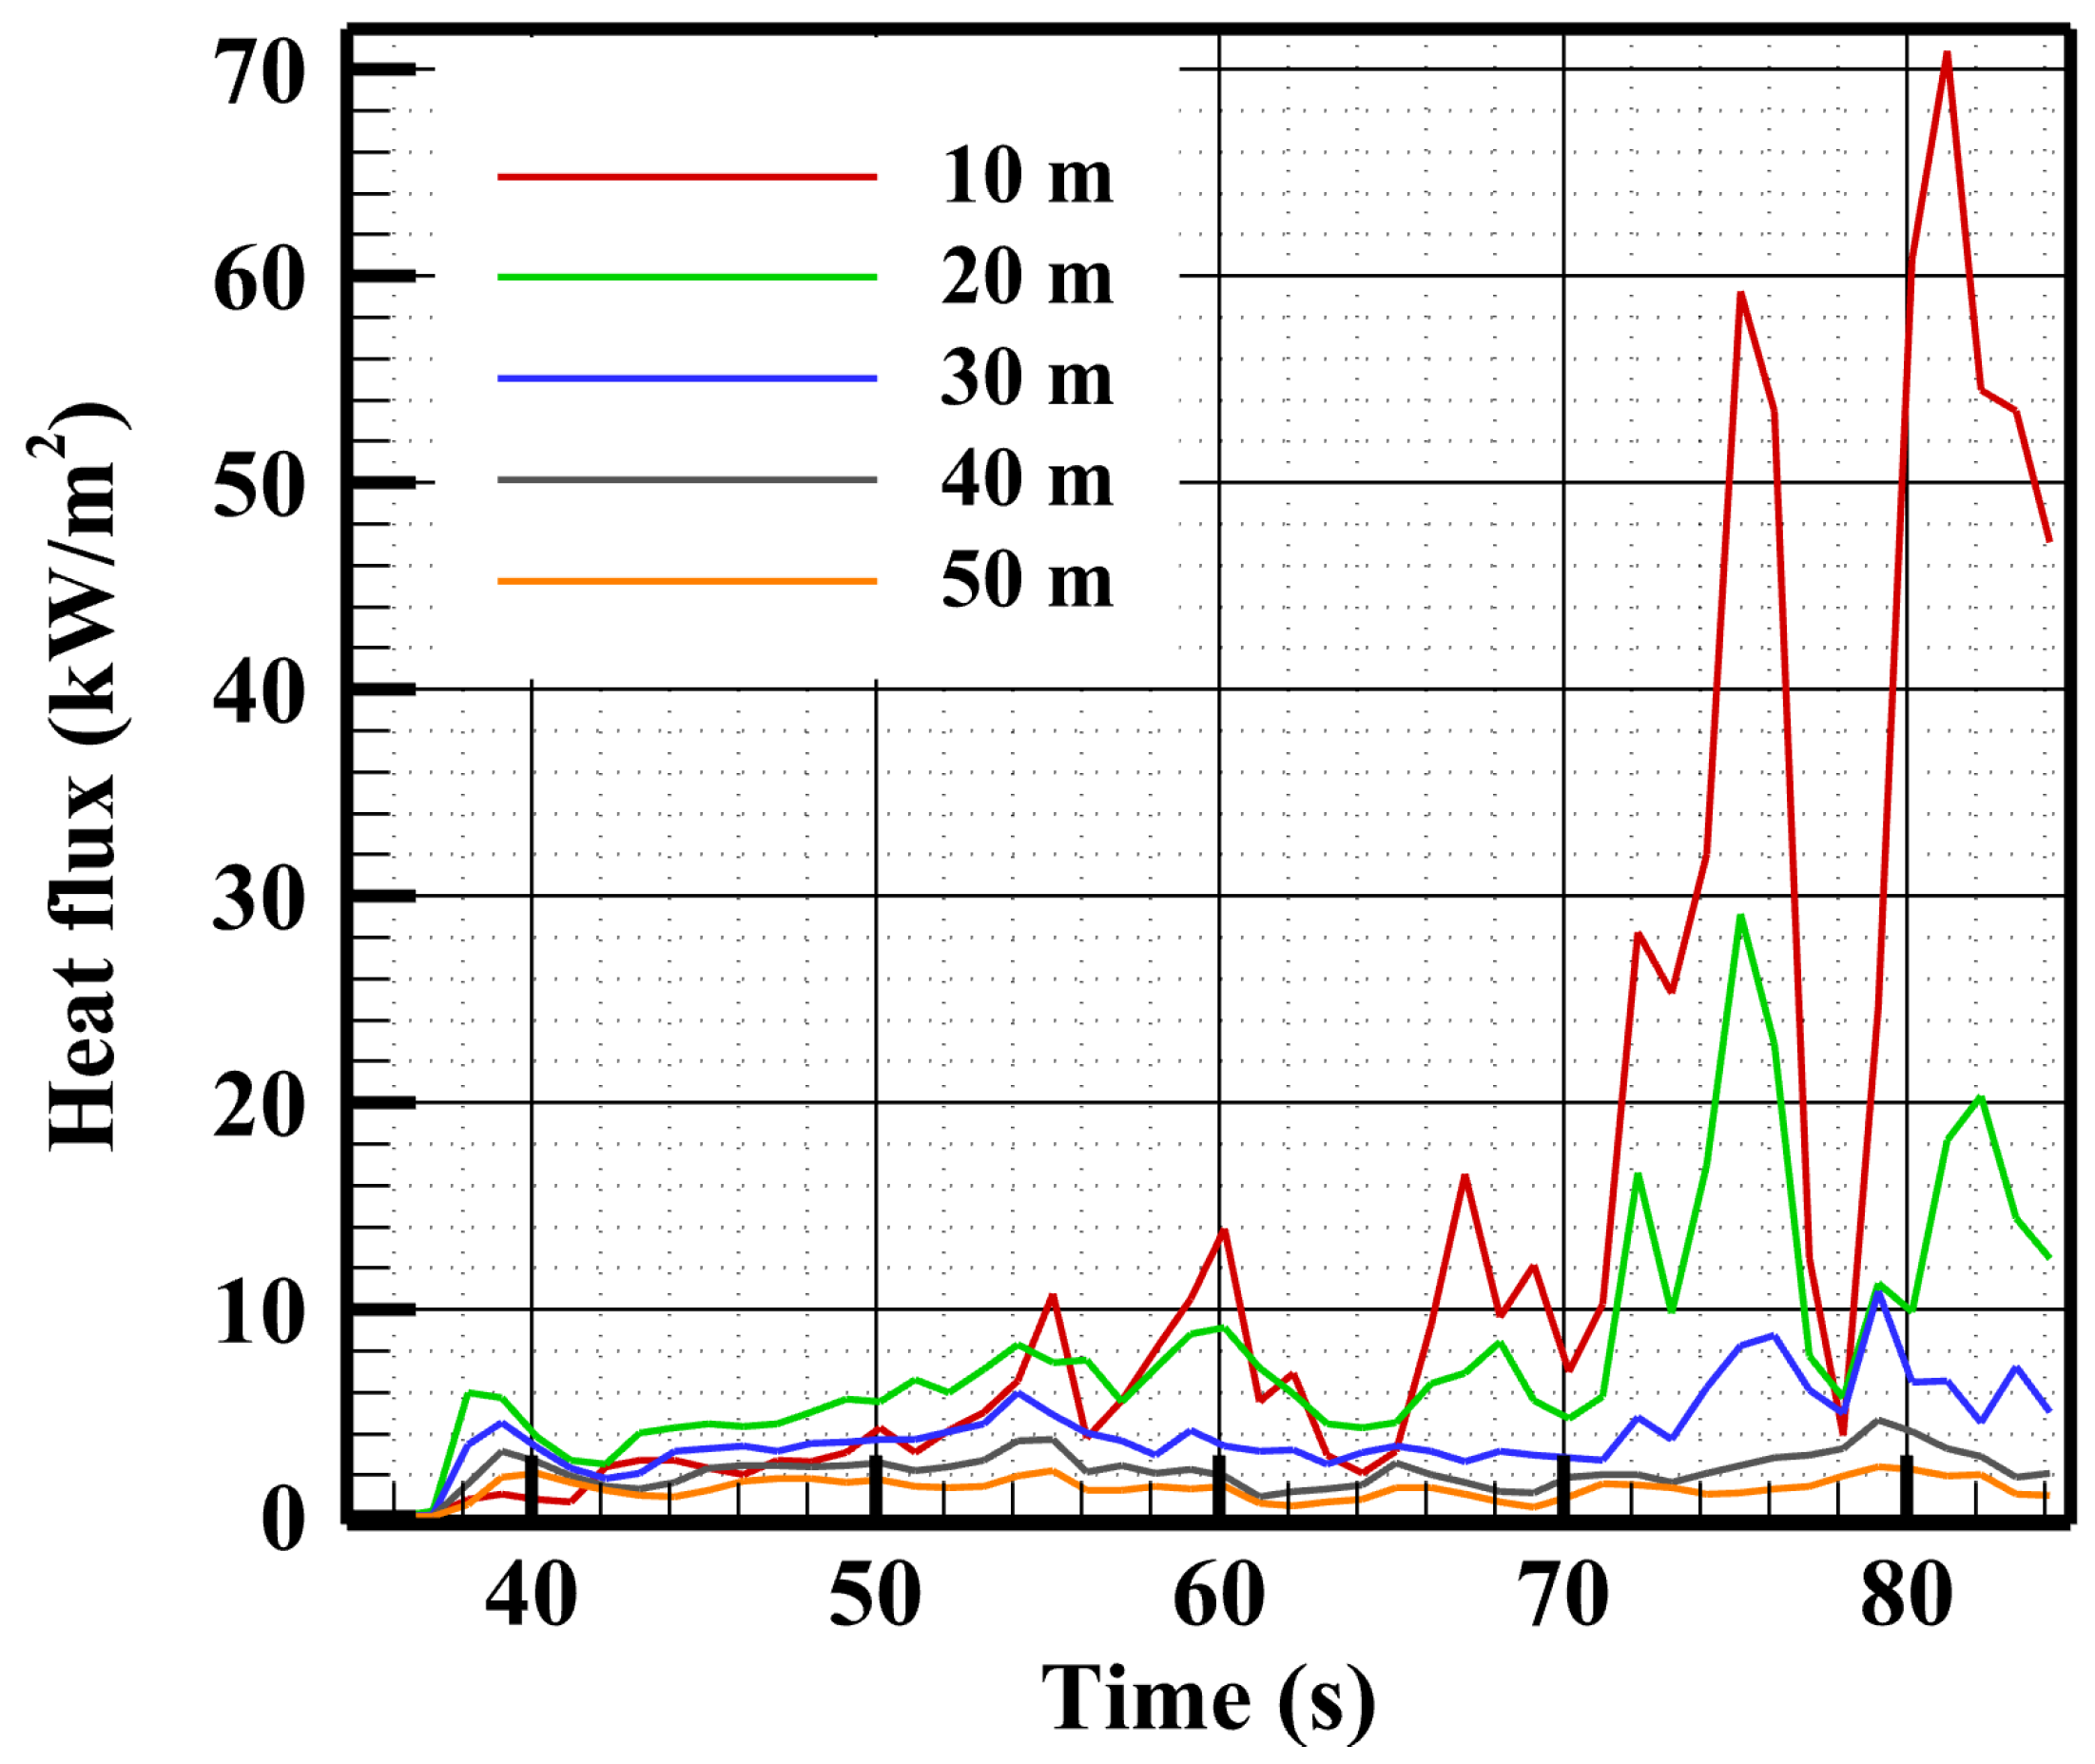
- Heat fluxes
3. Results and Discussion
3.1. Fire Behavior
3.2. Fire Impact
3.2.1. Human Body Target
3.2.2. Building
3.2.3. Numerical Correlations for the SSD Evaluation
4. Conclusions
Author Contributions
Funding
Institutional Review Board Statement
Informed Consent Statement
Data Availability Statement
Acknowledgments
Conflicts of Interest
Nomenclature
| B | Stephan–Boltzmann constant (W/m2·K4) |
| Ct | Turbulent natural convection constant (W/m2·K4/3) |
| Cp | Fuel specific heat (J/kg/K) |
| e | Fuel bed depth (m) |
| FMC | Fuel moisture content (mass of water/mass of dry fuel) |
| g | Gravity (m/s2) |
| Convective heat transfer coefficient for a human body (W/m2·K) | |
| Convective heat transfer coefficient for the exterior surface building (W/m2·K) | |
| Hf | Flame height (m) |
| Byram fireline intensity evaluated numerically (W/m) | |
| I | Radiation intensity (W/m2) |
| J | Total irradiance (W/m2) |
| Qconv | Convective heat flux received by a target (W/m2) |
| Qrad | Radiative heat flux received by a target (W/m2) |
| Qtot | Total heat flux received by a target (W/m2) |
| RH | Relative humidity (%) |
| ROS | Rate of spread (m/s) |
| s | Surface area to volume ratio (m−1) |
| sg | Absorption coefficient of gas/soot mixture |
| T0 | Gas mixture temperature (K) |
| Ta | Ambient temperature (K) |
| Ts | Fuel particle temperature (K) |
| Ux | Wind speed at x meters above the ground (m/s) |
| V0 | Gas flow speed (m/s) |
| ΔHc | Fuel yield heat (J/kg) |
| Vegetation mass loss rate (kg/m·s) | |
| Rate of dry material pyrolysis (kg/m·s) | |
| Rate of charcoal combustion (kg/m·s) | |
| Greek | |
| α | Slope angle |
| ρs | Fuel particle density (kg/m3) |
| βs | Volume fraction of the solid phase |
| σ | Dry fuel load (kg/m2) |
| βg | Volume fraction of the gaseous phase |
References
- Van Wagner, C.E. Drought, Timelag, and Fire Danger Rating. In Proceedings of the Eighth Conference on Fire and Meteorology, Detroit, MI, USA, 29 April–2 May 1985; Foresters, S., Ed.; American Meteorological Society: Boston, MA, USA, 1985; pp. 178–185. [Google Scholar]
- Finney, M.A.; Forthofer, J.; Grenfell, I.C.; Adam, B.A.; Akafuah, N.K.; Saito, K. A Study of Flame Spread in Engineered Cardboard Fuelbeds: Part I: Correlations and Observations. In Proceedings of the Seventh International Symposium on Scale Modeling, Hirosaki, Japan, 6–9 August 2013. [Google Scholar]
- Rossi, J.-L.; Komac, B.; Migliorini, M.; Schwarze, R.; Sigmund, Z.; Awad, C.; Chatelon, F.-J.; Goldammer, J.G.; Marcelli, T.; Morvan, D.; et al. Evolving Risk of Wildfires in Europe—The Changing Nature of Wildfire Risk Calls for a Shift in Policy Focus from Suppression to Prevention; UN Office for Disaster Risk Reduction: Brussels, Belgium, 2020. [Google Scholar]
- Hirsch, K.; Martell, D. A Review of Initial Attack Fire Crew Productivity and Effectiveness. Int. J. Wildl. Fire 1996, 6, 199–215. [Google Scholar] [CrossRef]
- Alexander, M.E.; Cole, F.V. Predicting and Interpreting Fire Intensities in Alaskan Black Spruce Forests Using the Canadian System of Fire Danger Rating. In Proceedings of the Managing Forests to Meet People’s Needs, Anchorage, AK, USA, 18–22 September 1994; Publication 95-02. Society of American Forest: Bethesda, MD, USA; pp. 185–192. [Google Scholar]
- Ganteaume, A.; Barbero, R.; Jappiot, M.; Maillé, E. Understanding Future Changes to Fires in Southern Europe and Their Impacts on the Wildland-Urban Interface. J. Saf. Sci. Resil. 2021, 2, 20–29. [Google Scholar] [CrossRef]
- Castro Rego, F.M.C.; Moreno Rodriguez, J.M.; Vallejo Calzada, V.R.; Xanthopoulos, G. Forest Fires—Sparking Firesmart Policies in the EU; Faivre, N., Ed.; Publications Office of the European Union: Luxembourg, 2018. [Google Scholar]
- Butler, C. The Urban/Wildland Fire Interface. Proc. West. States Sect. Inst. Pap. 1974, 74, 1–17. [Google Scholar]
- Jappiot, M.; González-Olabarria, J.R.; Lampin-Maillet, C.; Borgniet, L. Assessing Wildfire Risk in Time and Space. In Living with Wildfires: What Science Can Tell Us? A Contribution to the Science-Policy Dialogue; Birot, Y., Ed.; European Forest Institute, Mediterranean Regional Office—EFIMED: Joensuu, Finland, 2009; pp. 41–48. ISBN 987-952-5453-29-4. [Google Scholar]
- Radeloff, V.C.; Hammer, R.B.; Stewart, S.I.; Fried, J.S.; Holcomb, S.S.; Mckeefry, J.F. The Wildland–Urban Interface in the United States. Commun. Ecol. Appl. 2005, 15, 799–805. [Google Scholar] [CrossRef]
- Davis, J.B. The Wildland-Urban Interface: Paradise or Battleground? J. For. 1990, 88, 26–31. [Google Scholar]
- Argañaraz, J.P.; Radeloff, V.C.; Bar-Massada, A.; Gavier-Pizarro, G.I.; Scavuzzo, C.M.; Bellis, L.M. Assessing Wildfire Exposure in the Wildland-Urban Interface Area of the Mountains of Central Argentina. J. Environ. Manag. 2017, 196, 499–510. [Google Scholar] [CrossRef]
- Buxton, M.; Haynes, R.; Mercer, D.; Butt, A. Vulnerability to Bushfire Risk at Melbourne’s Urban Fringe: The Failure of Regulatory Land Use Planning. Geogr. Res. 2011, 49, 1–12. [Google Scholar] [CrossRef]
- Van Wilgen, B.W.; Forsyth, G.G.; Prins, P. The Management of Fire-Adapted Ecosystems in an Urban Setting: The Case of Table Mountain National Park, South Africa. Ecol. Soc. 2012, 17, 8. [Google Scholar] [CrossRef]
- Radeloff, V.C.; Helmers, D.P.; Anu Kramer, H.; Mockrin, M.H.; Alexandre, P.M.; Bar-Massada, A.; Butsic, V.; Hawbaker, T.J.; Martinuzzi, S.; Syphard, A.D.; et al. Rapid Growth of the US Wildland-Urban Interface Raises Wildfire Risk. Proc. Natl. Acad. Sci. USA 2018, 115, 3314–3319. [Google Scholar] [CrossRef]
- U.S. Fire Administration. US Fire Administration Wildland Urban Interface: A Look at Issues and Resolutions a Report of Recommendations for Elected Officials, Policymakers and All Levels of Government, Tribal and Response Agencies; FEMA, U.S. Fire Administration: Emmitsburg, MD, USA, 2022. [Google Scholar]
- Moreno, J.M.; Vázquez, A.; Vélez, R. Recent History of Forest Fires in Spain. In Large Forest Fires; Moreno, J.M., Ed.; Backhuys Publishers: Leiden, The Netherlands, 1998; pp. 159–185. [Google Scholar]
- Doerr, S.H.; Santin, C. What Links Portugal’s Deadliest Wildfre to Grenfell Tower? Economics and Neglect. Available online: https://theconversation.com/what-links-portugals-deadliest-wildfir…ics-and-neglect-79815?utm_source=twitter&utm_medium=twitterbutton (accessed on 17 March 2023).
- Bento-Gonçalves, A.; Vieira, A.; Da Vinha, L.; Hamada, S. Changes in Mainland Portuguese Forest Areas since the Last Decade of the XXth Century. Mediterranee 2018, 130. [Google Scholar] [CrossRef]
- Leite, F.F.; Bento-Gonçalves, A.; Vieira, A.; Da Vinha, L. Mega-Fires around the World: A Literature Review. In Wildland Fires: A Worldwide Reality; Nova Science Publishers: New York, NY, USA, 2015; pp. 15–34. ISBN 978-1-63483-408-7. [Google Scholar]
- Tedim, F.; Xanthopoulos, G.; Leone, V. Chapter 5—Forest Fires in Europe: Facts and Challenges. In Wildfire Hazards, Risks and Disasters; Shroder, J.F., Paton, R., Disasters, D.B.T.-W.H., Eds.; Elsevier: Oxford, UK, 2015; pp. 77–99. ISBN 978-0-12-410434-1. [Google Scholar]
- Oliveira, R.; Oliveira, S.; Zêzere, J.; Viegas, D. Human Perception of Fire Hazard in Wildland Urban Interface Areas—A Portuguese Survey Analysis of Spot Fires. In Advances in Forest Fire Research 2018; Viegas, D.X., Ed.; Imprensa da Universidade de Coimbra: Coimbra, Portugal, 2018; pp. 1130–1136. ISBN 9789892616506. [Google Scholar]
- Europe Set for Record Wildfire Land Loss in 2022—DW—08/14/2022. Available online: https://www.dw.com/en/europe-set-for-record-wildfire-destruction-in-2022/a-62802068 (accessed on 15 March 2023).
- Buccio, F. Incendies Été 2022—Gironde et Landes, Retour d’expérience. 2022. Available online: https://www.gironde.gouv.fr/contenu/telechargement/64007/426953/file/RETEX%20incendies%20-%20Gironde%20et%20Landes%20%20octobre%202022.pdf (accessed on 17 March 2023).
- Portugal: Plus de 100 000 Hectares Brûlés Par Les Feux de Forêt Cette Année. Available online: https://www.sudouest.fr/environnement/portugal-plus-de-100-000-hectares-brules-par-les-feux-de-foret-cette-annee-12023067.php (accessed on 5 April 2023).
- Zhang, J.Q.; Lu, S.X.; Yuan, M.; Li, C.H.; Li, Q. Safe Separation Distance Calculation Model with Changing Area of Fuel Packages in Large Space. Procedia Eng. 2011, 11, 666–674. [Google Scholar] [CrossRef]
- USDA Forest Service the Safe Separation Distance Evaluator: Is My Safety Zone Big. Available online: https://www.fs.usda.gov/research/rmrs/products/sycu/safe-separation-distance-evaluator-my-safety-zone-big-enough (accessed on 17 March 2023).
- Rossi, J.L.; Simeoni, A.; Moretti, B.; Leroy-Cancellieri, V. An Analytical Model Based on Radiative Heating for the Determination of Safety Distances for Wildland Fires. Fire Saf. J. 2011, 46, 520–527. [Google Scholar] [CrossRef]
- Bisgambiglia, P.-A.; Rossi, J.-L.; Franceschini, R.; Chatelon, F.-J.; Bisgambiglia, P.A.; Rossi, L.; Marcelli, T. DIMZAL: A Software Tool to Compute Acceptable Safety Distance. Open J. For. 2017, 7, 11–33. [Google Scholar] [CrossRef]
- Zárate, L.; Arnaldos, J.; Casal, J. Establishing Safety Distances for Wildland Fires. Fire Saf. J. 2008, 43, 565–575. [Google Scholar] [CrossRef]
- Butler, B.W.; Cohen, J.D. Firefighter safety zones: How big is big enough? Fire Manag. Notes 1998, 58, 13–16. [Google Scholar]
- Butler, B.W. Wildland Firefighter Safety Zones: A Review of Past Science and Summary of Future Needs. Int. J. Wildl. Fire 2014, 23, 295–308. [Google Scholar] [CrossRef]
- Green, L.R.; Schimke, H.E. Guides for Fuel-Breaks in Sierra Nevada Mixed-Conifer Type; Forest Service US Department of Agriculture: Washington, DC, USA, 1971. [Google Scholar]
- Rossi, J.L.; Chatelon, F.J.; Marcelli, T. Fire Intensity. In Encyclopedia of Wildfires and Wildland-Urban Interface (WUI) Fires; Manzello, S.L., Ed.; Springer International Publishing: Cham, Switzerland, 2018; pp. 1–6. ISBN 978-3-319-51727-8. [Google Scholar]
- Alexander, M.E.; Cruz, M.G. Fireline Intensity. In Encyclopedia of Wildfires and Wildland-Urban Interface (WUI) Fires; Springer: Berlin/Heidelberg, Germany, 2019; pp. 1–8. [Google Scholar]
- Butler, B.W.; Finney, M.A.; Andrews, P.L.; Albini, F. A Radiation-Driven Model for Crown Fire Spread. Can. J. For. Res. 2004, 34, 1588–1599. [Google Scholar] [CrossRef]
- Byram, G.M. Combustion of Forest Fuels. In Forest Fire: Control and Use; Davis, K.P., Ed.; New York McGraw Hill: New York, NY, USA, 1959; pp. 61–89. [Google Scholar]
- Catchpole, W.R.; Bradstock, R.A.; Choate, J.; Fogarty, L.G.; Gellie, N.; McCarthy, G.; McCaw, W.L.; Marsden-Smedley, J.B.; Pearce, G. Cooperative Development of Equations for Heathland Fire Behaviour. In Proceedings of the 3rd International Conference on Forest Fire Research and 14th Conference on Fire and Forest Meteorology, Luso, Portugal, 16–20 November 1998; Viegas, D.X., Ed.; Volume 2, pp. 16–20. [Google Scholar]
- Nelson, R.M., Jr. Flame Characteristics for Fires in Southern Fuels. In USDA Forest Service, General Research Paper SE-205; Southeast Forest Experimental Station: Asheville, NC, USA, 1980. [Google Scholar]
- Vega, J.A.; Cuinas, P.; Fonturbel, T.; Perez-Gorostiaga, P.; Fernandez, C. Predicting Fire Behavior in Galician (NW Spain) Shrubland Fuel Complexes. In Proceedings of the 3rd International Conference on Forest Fire Research and 14th Conference on Fire and Forest Meteorology, Luso, Portugal, 16–20 November 1998; Viegas, D.X., Ed.; University of Coimbra: Coimbra, Portugal; Volume II, pp. 713–728. [Google Scholar]
- Butler, B.W.; Parsons, R.A.; Mell, W. Recent Findings Relating to Firefighter Safety Zones. In Proceedings of the Large Wildland Fires Conference, Missoula, MT, USA, 19–23 May 2014; Proc. RMRS-P-73. U.S. Department of Agriculture, Forest Service, Rocky Mountain Research Station: Fort Collins, CO, USA, 2014; pp. 30–34. [Google Scholar]
- Fayad, J.; Morandini, F.; Accary, G.; Chatelon, F.; Wandon, C.; Burglin, A.; Rossi, L.; Marcelli, T.; Cancellieri, D.; Cancellieri, V.; et al. A Study of Two High Intensity Fires across Corsican Shrubland. Atmosphere 2023, 14, 473. [Google Scholar] [CrossRef]
- Fayad, J.; Rossi, L.; Frangieh, N.; Awad, C.; Accary, G.; Chatelon, F.-J.; Morandini, F.; Marcelli, T.; Cancellieri, V.; Cancellieri, D.; et al. Numerical Study of an Experimental High-Intensity Prescribed Fire across Corsican Genista Salzmannii Vegetation. Fire Saf. J. 2022, 131, 103600. [Google Scholar] [CrossRef]
- Awad, C.; Frangieh, N.; Marcelli, T.; Accary, G.; Morvan, D.; Meradji, S.; Chatelon, F.-J.; Rossi, J.-L. Numerical Study of the Moisture Content Threshold under Prescribed Burning Conditions. Fire Saf. J. 2021, in press. [Google Scholar] [CrossRef]
- Awad, C.; Morvan, D.; Rossi, J.-L.; Marcelli, T.; Chatelon, F.J.; Morandini, F.; Balbi, J.-H. Fuel Moisture Content Threshold Leading to Fire Extinction under Marginal Conditions. Fire Saf. J. 2020, 118, 11. [Google Scholar] [CrossRef]
- Morvan, D.; Dupuy, J.L. Modeling the Propagation of a Wildfire through a Mediterranean Shrub Using a Multiphase Formulation. Combust. Flame 2004, 138, 199–210. [Google Scholar] [CrossRef]
- Morvan, D.; Meradji, S.; Accary, G. Wildfire Behavior Study in a Mediterranean Pine Stand Using a Physically Based Model. Combust. Sci. Technol. 2008, 180, 230–248. [Google Scholar] [CrossRef]
- Morvan, D.; Dupuy, J.L. Modeling of Fire Spread through a Forest Fuel Bed Using a Multiphase Formulation. Combust. Flame 2001, 127, 1981–1994. [Google Scholar] [CrossRef]
- Morvan, D. Numerical Study of the Effect of Fuel Moisture Content (FMC) upon the Propagation of a Surface Fire on a Flat Terrain. Fire Saf. J. 2013, 58, 121–131. [Google Scholar] [CrossRef]
- GOLIAT—Groupement d’Outils Pour La Lutte Incendie et l’Aménagement Du Territoire. Available online: https://goliat.universita.corsica/ (accessed on 5 May 2021).
- Marcelli, T.; Rossi, L.; Accary, G.; Awad, C.; Burglin, A.; Cancellieri, D.; Cancellieri, V.; Chatelon, F.-J.; Fayad, J.; Ferrat, L.; et al. GOLIAT, a Project to Develop Tools for Firefighting and Land Use Planning. In Proceedings of the Advances in Forest Fire Research 2022, Coimbra, Portugal, 11–18 November 2022; Viegas, D.X., Ribeiro, L.M., Eds.; pp. 234–239. [Google Scholar]
- Rigolot, E.; Costa, M. Conception Des Coupures de Combustible; de la Cardère, M., Ed.; Réseau Cou.: Portoi-Vecchio, France, 2000. [Google Scholar]
- Vaiciulyte, S.; Galea, E.R.; Veeraswamy, A.; Hulse, L.M. Island Vulnerability and Resilience to Wildfires: A Case Study of Corsica. Int. J. Disaster Risk Reduct. 2019, 40, 101272. [Google Scholar] [CrossRef]
- Mouillot, F.; Ratte, J.P.; Joffre, R.; Mouillot, D.; Rambal, S. Long-Term Forest Dynamic after Land Abandonment in a Fire Prone Mediterranean Landscape (Central Corsica, France). Landsc. Ecol. 2005, 20, 101–112. [Google Scholar] [CrossRef]
- Pasqualini, V.; Oberti, P.; Vigetta, S.; Riffard, O.; Panaïotis, C.; Cannac, M.; Ferrat, L. A GIS-Based Multicriteria Evaluation for Aiding Risk Management Pinus Pinaster Ait. Forests: A Case Study in Corsican Island, Western Mediterranean Region. Environ. Manag. 2011, 48, 38–56. [Google Scholar] [CrossRef]
- Rothermel, R.C. A Mathematical Model for Predicting Fire Spread in Wildland Fuels; USDA Forest Service, Research Paper INT-115; Intermountain Forest and Range Experiment Station: Ogden, UT, USA, 1972. [Google Scholar]
- Arca, B.; Duce, P.; Laconi, M.; Pellizzaro, G.; Salis, M.; Spano, D. Evaluation of FARSITE Simulator in Mediterranean Maquis. Int. J. Wildl. Fire 2007, 16, 563. [Google Scholar] [CrossRef]
- Grishin, A.M. Mathematical Modeling of Forest Fires and New Methods of Fighting Them; Albini, F.A., Ed.; Publishing House of the Tomsk University: Tomsk, Russia, 1996. [Google Scholar]
- Morvan, D.; Méradji, S.; Accary, G. Physical Modelling of Fire Spread in Grasslands. Fire Saf. J. 2009, 44, 50–61. [Google Scholar] [CrossRef]
- Chatelon, F.J.; Balbi, J.H.; Cruz, M.G.; Morvan, D.; Rossi, J.L.; Awad, C.; Frangieh, N.; Fayad, J.; Marcelli, T. Extension of the Balbi Fire Spread Model to Include the Field Scale Conditions of Shrubland Fires. Int. J. Wildl. Fire 2022, 31, 176–192. [Google Scholar] [CrossRef]
- Morvan, D. Physical Phenomena and Length Scales Governing the Behaviour of Wildfires: A Case for Physical Modelling. Fire Technol. 2011, 47, 437–460. [Google Scholar] [CrossRef]
- Siegel, R.; Howell, J.R. Thermal Radiation Heat Transfer—Third Edition; Hemisphere Publishing Corporation: Washington, DC, USA, 1992; ISBN 0-89116-271-2. [Google Scholar]
- Owen, M.S. 2009 ASHRAE Handbook: Fundamentals. In 2009 Ashrae Handbook—Fundamentals; American Society of Heating, Refrigeration and Air-Conditioning Engineers: Peachtree Corners, GA, USA, 2009; ISBN 9781933742557. [Google Scholar]
- Oguro, M.; Arens, E.; de Dear, R.; Zhang, H.; Katayama, T. Convective Heat Transfer Coefficients and Clothing Insulations for Parts of the Clothed Human Body under Airflow Conditions. J. Archit. Plan. Environ. Eng. 2002, 561, 21–29. [Google Scholar] [CrossRef]
- Yazdanian, M.; Klems, J.H. Measurement of the Exterior Convective Film Coefficient for Windows in Low-Rise Buildings. ASHRAE Trans. 1994, 100, 17. [Google Scholar]
- Imessad, K.; Messaoudène, N.A. Modèle Mathématique de Prédiction de La Sensation Thermique et de La Réponse Physiologique Chez l ’ Être Humain. Rev. Des Energ. Renouvelables 2008, 11, 545–556. [Google Scholar]
- Cai, R.; Zhang, N. Explicit Analytical Solutions of 2-D Laminar Natural Convection. Int. J. Heat Mass Transf. 2003, 46, 931–934. [Google Scholar] [CrossRef]
- Blocken, B.; Defraeye, T.; Derome, D.; Carmeliet, J. High-Resolution CFD Simulations for Forced Convective Heat Transfer Coefficients at the Facade of a Low-Rise Building. Build. Environ. 2009, 44, 2396–2412. [Google Scholar] [CrossRef]
- Mirsadeghi, M.; Cóstola, D.; Blocken, B.; Hensen, J.L.M. Review of External Convective Heat Transfer Coefficient Models in Building Energy Simulation Programs: Implementation and Uncertainty. Appl. Therm. Eng. 2013, 56, 134–151. [Google Scholar] [CrossRef]
- Hensen, J.L.M.; Lamberts, R.; Negrao, C.O.R. A View of Energy and Building Performance Simulation at the Start of the Third Millennium. Energy Build. 2002, 34, 853–855. [Google Scholar] [CrossRef]
- API STANDARD 521. Pressure-Relieving and Depressuring Systems, 6th ed.; American Petroleum Institute, Ed.; API Publishing Services: Washington, DC, USA, 2014; ISBN 5925731107. [Google Scholar]
- Raj, P.K. A Review of the Criteria for People Exposure to Radiant Heat Flux from Fires. J. Hazard. Mater. 2008, 159, 61–71. [Google Scholar] [CrossRef]
- Butler, B.; Cohen, J. Firefighter Safety Zones: A Theoretical Model Based on Radiative Heating. Int. J. Wildl. Fire 1998, 8, 73–77. [Google Scholar] [CrossRef]
- Casal Fàbrega, J.; Montiel Boadas, H.; Planas Cuchi, E.; Vílchez Sánchez, J.A. Análisis Del Riesgo En Instalaciones Industriales; Edicions UPC: Barcelona, Spain, 1999. [Google Scholar]
- Crocker, W.P.; Napier, D.H. Thermal Radiation Hazards of Liquid Pool Fires and Tank Fires. Inst. Chem. Eng. Symp. Ser. 1986, 97, 159–184. [Google Scholar]
- Lilley, D.G. Minimum Safe Distance from Pool Fires. J. Propuls. Power 2000, 16, 649–652. [Google Scholar] [CrossRef]
- Page, W.G.; Butler, B.W. An Empirically Based Approach to Defining Wildland Firefighter Safety and Survival Zone Separation Distances. Int. J. Wildl. Fire 2017, 26, 655–667. [Google Scholar] [CrossRef]
- Campbell, M.J.; Dennison, P.E.; Thompson, M.P.; Butler, B.W. Assessing Potential Safety Zone Suitability Using a New Online Mapping Tool. Fire 2022, 5, 5. [Google Scholar] [CrossRef]


| Region | Type | Fuel Bed Depth, e (m) | Dry Fuel Load, σ (kg/m2) | Surface Area to Volume Ratio, s (m−1) | Fuel Moisture Content, FMC (%) |
|---|---|---|---|---|---|
| Corsica | Shrubland | 4 | 0.89 (1.79) | 5544 (4766) | 8 (100) |
| (kg/m3) | Fuel Specific Heat, Cp (J/kg/K) | Heat of Combustion, ΔHc (J/kg) | |||
| 720 | 1912 | 19,640 | |||
| Fuel Characteristics | |
|---|---|
| Fuel moisture content, FMC (%) | 69.45 |
| Fuel bed depth, e (m) | 4 |
| Dry fuel load, (kg/m2) | 2.68 |
| Volume fraction, | |
| Surface area to volume ratio, s (m−1) | 5024 |
| Meteorological and Topography Conditions | |
| Average wind speed in the slope direction, U10 (m/s) | 16.6 |
| Ambient temperature, Ta (°C) | 35 |
| Relative humidity, RH (%) | 20 |
| Terrain slope value, (°) | 12 |
| Wind Direction | (W/m2·K)4/3 | a (W/m2·K (m/s)b) | b | rms (W/m2·K) |
|---|---|---|---|---|
| Windward | 0.840.015 | 2.380.036 | 0.890.009 | 0.91 |
| Heat Flux Threshold (kW/m2) | Criterion |
|---|---|
| 5 | Maximum tolerable value for non-protected people |
| 7 | Maximum tolerable value for completely protected firefighter |
| 12 | Unpiloted wood ignition |
| 10 | Ignition of certain polymers |
| 25 | Thin steel can lose mechanical integrity |
| 37.5 | Instantaneous death, damage to process equipment and collapse of mechanical structures |
| A | B | R2 | |
|---|---|---|---|
| Human body (1.7 m height) | −2 | 0.9474 | |
| Building level R0 (0.21 m) | −1.756 | 0.9829 | |
| Building level R1 (3 m) | −2.285 | 0.9999 | |
| Building level R2 (6 m) | −2.71 | 0.9906 | |
| Building level R3 (9 m) | −1.417 | 0.9316 |
Disclaimer/Publisher’s Note: The statements, opinions and data contained in all publications are solely those of the individual author(s) and contributor(s) and not of MDPI and/or the editor(s). MDPI and/or the editor(s) disclaim responsibility for any injury to people or property resulting from any ideas, methods, instructions or products referred to in the content. |
© 2023 by the authors. Licensee MDPI, Basel, Switzerland. This article is an open access article distributed under the terms and conditions of the Creative Commons Attribution (CC BY) license (https://creativecommons.org/licenses/by/4.0/).
Share and Cite
Fayad, J.; Accary, G.; Morandini, F.; Chatelon, F.-J.; Rossi, L.; Marcelli, T.; Cancellieri, D.; Cancellieri, V.; Rahib, Y.; Morvan, D.; et al. Numerical Assessment of Safe Separation Distance in the Wildland–Urban Interfaces. Fire 2023, 6, 209. https://doi.org/10.3390/fire6050209
Fayad J, Accary G, Morandini F, Chatelon F-J, Rossi L, Marcelli T, Cancellieri D, Cancellieri V, Rahib Y, Morvan D, et al. Numerical Assessment of Safe Separation Distance in the Wildland–Urban Interfaces. Fire. 2023; 6(5):209. https://doi.org/10.3390/fire6050209
Chicago/Turabian StyleFayad, Jacky, Gilbert Accary, Frédéric Morandini, François-Joseph Chatelon, Lucile Rossi, Thierry Marcelli, Dominique Cancellieri, Valérie Cancellieri, Yassine Rahib, Dominique Morvan, and et al. 2023. "Numerical Assessment of Safe Separation Distance in the Wildland–Urban Interfaces" Fire 6, no. 5: 209. https://doi.org/10.3390/fire6050209
APA StyleFayad, J., Accary, G., Morandini, F., Chatelon, F.-J., Rossi, L., Marcelli, T., Cancellieri, D., Cancellieri, V., Rahib, Y., Morvan, D., Meradji, S., Pieri, A., Duret, J.-Y., & Rossi, J.-L. (2023). Numerical Assessment of Safe Separation Distance in the Wildland–Urban Interfaces. Fire, 6(5), 209. https://doi.org/10.3390/fire6050209