Abstract
Existing fire smoke detectors use the intensity of scattering light or the light extinction coefficient as the indicator of fire smoke to trigger fire alarms. However, false fire alarms could be triggered by dust and water fog. Achieving reliable early fire detection with minimal false alarms is a challenge. Based on the Mie scattering theory of spherical particles, it is derived that the ratio of scattering intensity and the ratio of optical extinction of two incident lights with different wavelengths only depends on the intrinsic properties of the aerosol (the average particle size and refractive index). This paper then presents an improved dual-wavelength smoke detection by measuring scattering light and extinction simultaneously to reduce false alarms. Simulations and verification with test fires of European Standard EN 54 were performed, demonstrating that fires can be distinguished from nuisance sources without complicated calculations. These results indicate that the improved detection system can be applied for smoke monitoring and fire protection.
1. Introduction
Thanks to highly sensitive sensors, Fire Detection and Alarm Systems (FDAS) are used to identify fires at an early stage, which can be seen as a key part of the strategy to protect life and keep property safe from fires [1]. One of the most critical techniques used in FDAS is smoke detection. It has been reported that a working smoke detector can reduce the risk of death from residential fires by 50% to 70% [2]. There are two fire particle detection sensing modes, one ionisation and the other photoelectric. Ionisation smoke detectors are generally more responsive to smaller combustion products (<0.1 μm). On the other hand, photoelectric smoke sensors are more responsive to smaller combustion products (>0.1 μm) [3,4]. Ionisation smoke detectors have been phased out in many countries due to radioactivity, with photoelectric smoke sensors becoming the mainstream. Based on Festag’s investigations [5], the false alarm ratio triggered by installed FDAS has been almost 90% in Germany in the last decade. From 2000 to 2014, over half of the fire alarms were false alarms in Great Britain, according to annual statistics compiled from Fire and Rescue Service records of incidents attended by fire and rescue authorities across Great Britain [6]. The National Fire Protection Association (NFPA) reports that actual smoke alarm utilisation is more likely to be 92% in the United States, but almost 60% of home fire deaths have resulted from fires in properties with no smoke alarms (41%) or smoke alarms that did not work (16%) [7]. According to this report, the leading cause of smoke alarms’ failure to operate was typically because of disconnected or non-working power sources. Power sources are often disabled because of unwanted alarms or false alarms. Frequent nuisance alarms can generate a dangerous sense of complacency, resulting in needless fatalities. Therefore, improving the reliability of photoelectric smoke detectors is very significant.
Common photoelectric smoke detectors consist of a near-infrared (NIR) light-emitting diode (LED) as a light source and a silicon photodiode (PD) as a light receptor. When no smoke is present, no light is detected by the photosensor. When smoke enters the chamber, the smoke particles partially absorb and partially scatter light in many directions, with some scattered light hitting the PD. The alarm goes off until the amount of incident light reaches a predetermined threshold. Unfortunately, other particles instead of smoke, including dust and water stream [8,9,10], could have interfered with the intensity of scattered light to judge whether a fire had occurred.
The amount of light scattered by smoke is exceptionally complicated and is related to numerous factors, e.g., particle number density and size distribution, refractive index, light source wavelength, polarisation, and the angle between the light source and receiver. To reduce false alarms caused by non-fire particles, studies on the optical characteristics of smoke particles and other nuisance particles that change with angle and particle size have been conducted by the following authors. Loepfe et al. and Keller et al. measured angle- and polarisation-dependent light-scattering behaviours of fire aerosols from test fires of European Standard EN 54 and water vapour [11,12]. West et al. proposed the polarisation and scattering behaviours of mineral dust [13]. Zhao [14] measured the total scattering characteristics of fire smoke. Wang et al. proposed that the false alarms caused by interfering aerosols can be eliminated from multi-angle scattering detection [15]. A practical application adopting multi-angle detection to eliminate false alarms caused by dust was described by Greenberg et al. [16], who established a paraxial fire detection system in spacecraft to measure the surface area concentration and the volume concentration of the aerosols with a single-wavelength light source and dual received angles. Philipp et al. [17] demonstrated the false alarm robustness of an optical sensor based on dual-wavelength light sources and multiple received angles to measure aerosols; they solved the problem of false alarms caused by dust, which is also the nuisance test specified in the UL 217 standard, but the interference of water mist cannot be effectively removed.
Recently, Shu Wang et al. [18,19] utilised the scattering intensity ratio of two different wavelength incident lights, which represents the Sauter Mean Diameter of aerosol particles under the theoretical deduction of the Mie scattering theory of homogeneous sphere particles [20], to distinguish fire smoke and non-fire aerosols. These studies are very inspiring. However, the experiment setting was ideal, with measuring smoke particles generated by a monodisperse aerosol generator (MAG). Fire smoke is actually heterogeneous, and the scanning electron microscope images showed that some smoke particles have an approximate fractal structure [21,22]. The simple spherical hypothesis will increase the detection error in practical situations, which has also been found in our supplementary experiments in fire and interfering scenarios (especially the water vapour scenario). To distinguish non-spherical fire smoke from non-fire particles, some scholars have adopted models closer to the actual shape of soot particles. For example, Zhang [23] used the Discrete Dipole Approximation (DDA) method to simulate the soot fractal agglomerates and demonstrated a significant difference between the DDA and spherical approximation for smoke scattering simulations. However, the scattering matrices measurement with polarised light that he used is unsuitable for engineering applications because its apparatus is too complex and bulky. A faster way to process received light signals for fire detection applications should be adopted to avoid increasing the response time.
Owing to the uncertainty of non-spherical characteristics of smoke particles on fire detection, this paper aims to introduce one more parameter to the work of Shu Wang et al., the extinction coefficient, to reduce uncertainties and resist false alarms. A Dual-Wavelength smoke detector measuring both light Scattering and Extinction (DWSE) is developed to reduce false alarms caused by dust and water vapour aerosols. First, through simplified spherical particle Mie scattering theory analysis, it is proved that the ratio of scattering intensity and the ratio of optical extinction of different wavelengths depends on the intrinsic particle size and refractive index of aerosol particles. In this way, both ratios can be utilised as fingerprints of the aerosols, and the supplementary measurement of extinction may somewhat eliminate the uncertainty brought by smoke particle shape. Then, three coefficients—the ratio of the scattering measures of two light sources , the ratio of the extinction measures of two light sources , and the ratio of the scattering measure to the extinction measure for one incident light —are proposed to distinguish smoke from dust and water mist. Next, to validate whether these three coefficients work for non-spherical fire smoke particles, the scattering simulation with the DDA method is made, and optimal detection angles for the two light sources are determined with real fire experiments. Finally, the proposed DWSE detector is verified with EN54 test fires.
Our study has two-fold contributions. First, it simultaneously measures the scattering and extinction of dual-wavelength light sources in one detector. The introduction of extinction has been proven to improve detection accuracy and reduce false alarms. Second, we introduce an alarm method with three coefficients , , and . Without complicated calculations of the Mie scattering or the DDA modelling of agglomerates, this alarm method is feasible for application in FDAS.
2. Theory
2.1. Mie Scattering and Extinction
Mie scattering theory was founded in 1908, as an analytical solution of Maxwell’s equations under the boundary conditions of monochromatic parallel light for an isotropic single dielectric sphere in a homogeneous medium. The Mie scattering coefficients are:
where is the size parameter, is the equivalent spherical diameter of the particle, is the wavelength of incident light, and is the complex refractive index [24].
Equations (1) and (2) are known as Riccati–Bessel functions and are related to Bessel and Hankel functions [25,26]:
The scattering coefficient is:
Similarly, the extinction coefficient is:
The light intensity is as follows due to extinction:
where is the light intensity of the light source, is the distance from the light source, and is derived from .
Mie scattering theory is a precise description of the interaction between aerosol and particle. However, in this theoretical model, the optical scattering and extinction vary irregularly due to the coupled contributions of many factors, including particle shape and size, incident wavelength, etc. Therefore, using the Mie theory, it is difficult to examine the effect of a single factor for scattering. Thus, we will use a macroscopic scattering model called the “three regions” law to analyse the ratio of scattering intensity of two incident lights with different wavelengths, as well as the ratio of optical extinction.
2.2. The Ratio of Scattering Intensity
The “three regions” law was proposed by Gebhart in 2005 [27]. It describes how the scattering intensity varies with respect to particle size in the statistical measurement of aerosols. Let the intensity of light scattered by the unit volume of the spherical particle be:
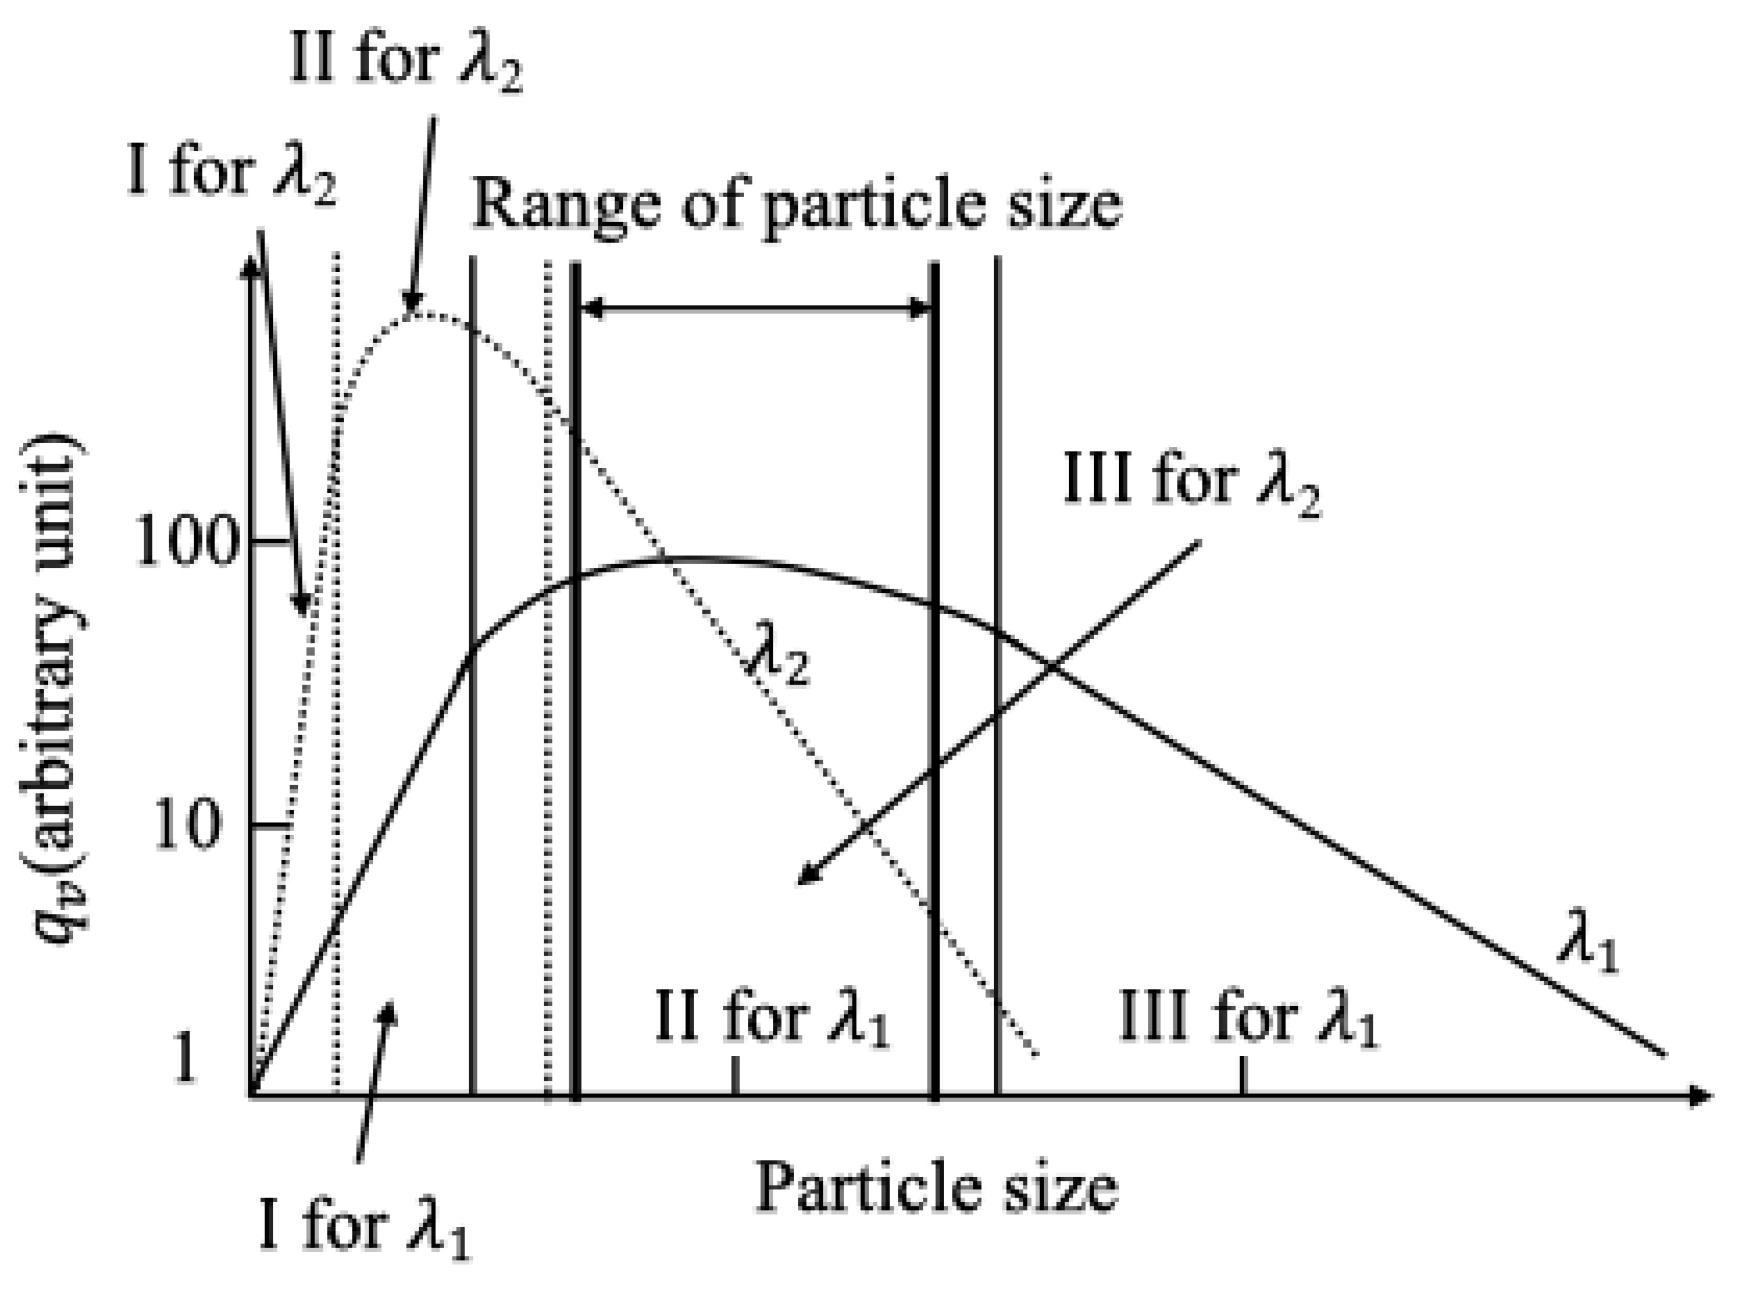
where is the scattering intensity due to a single amplitude and is the observation angle from the emitter to the receiver. The relation between , , and is shown in Figure 1, and it can be divided into three regions:
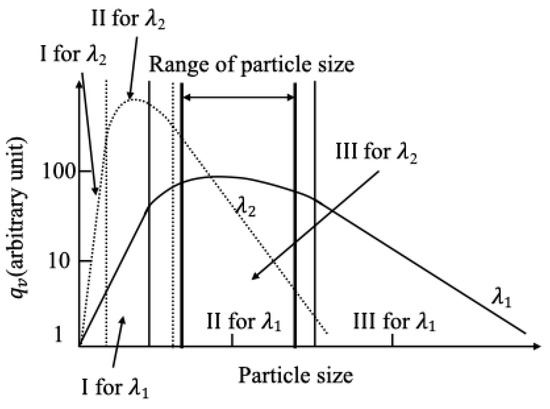
Figure 1.
“Three regions” law of the relation of scattering intensity by the unit volume of the spherical particle and particle size with the wavelength of incident light .
(I) When , , ;
(II) When , , , which is proportional to the volume of the particle;
(III) When , , , which is proportional to the surface area of the particle.
, , and are the conversion factors for and in each region, , , and , respectively. From the continuity of the curve, it can be obtained that and , which means that and .
Since the aerosol is composed of particles with different sizes, let the distribution function be , and then the scattering intensity of the aerosol is:
where is the number concentration of the aerosol. The design of our proposed DWSE learns from Shu Wang’s work [19], picking the long wave at region II and the short wave at region III. Therefore, the scattering intensity can be expressed as:
where is the volume concentration of the aerosol and is the surface concentration of the aerosol. Taking the ratio of Equations (10) and (11), the following result can be obtained:
The concept of Sauter Mean Diameter (SMD) is hereby introduced:
Therefore, . When the incident light wavelengths and the observation angles are fixed, is related to the refractive index . That is, the ratio of the scattering power with different incident light wavelengths depends on the average particle size and the refraction index.
2.3. The Ratio of Optical Extinction
For extinction, the parameter in Equation (7) is related to Sauter Mean Diameter , the particle number concentration , and the wavelength . This can be represented by the following formula [28]:
where is a dimensionless number. The ratio of the extinction coefficient can be defined as:
By substituting Equation (6), it can be obtained:
When the incident light wavelengths are fixed , the ratio is related to Mie coefficients ( and ). Mie coefficients are related to the particle size parameter and the refraction index. That is, the ratio of optical extinction with incident light wavelengths also depends on the average particle size and the refraction index.
To summarise, for our proposed DWSE, the wavelengths of two incident lights are fixed, and the ratio of scattering intensity and the ratio of optical extinction only depend on the intrinsic properties of the aerosol (the average particle size and the refractive index), which in theory can be used as characteristics to differentiate smoke aerosol and non-smoke aerosol.
3. Design of the DWSE Detector
3.1. Optical Setup
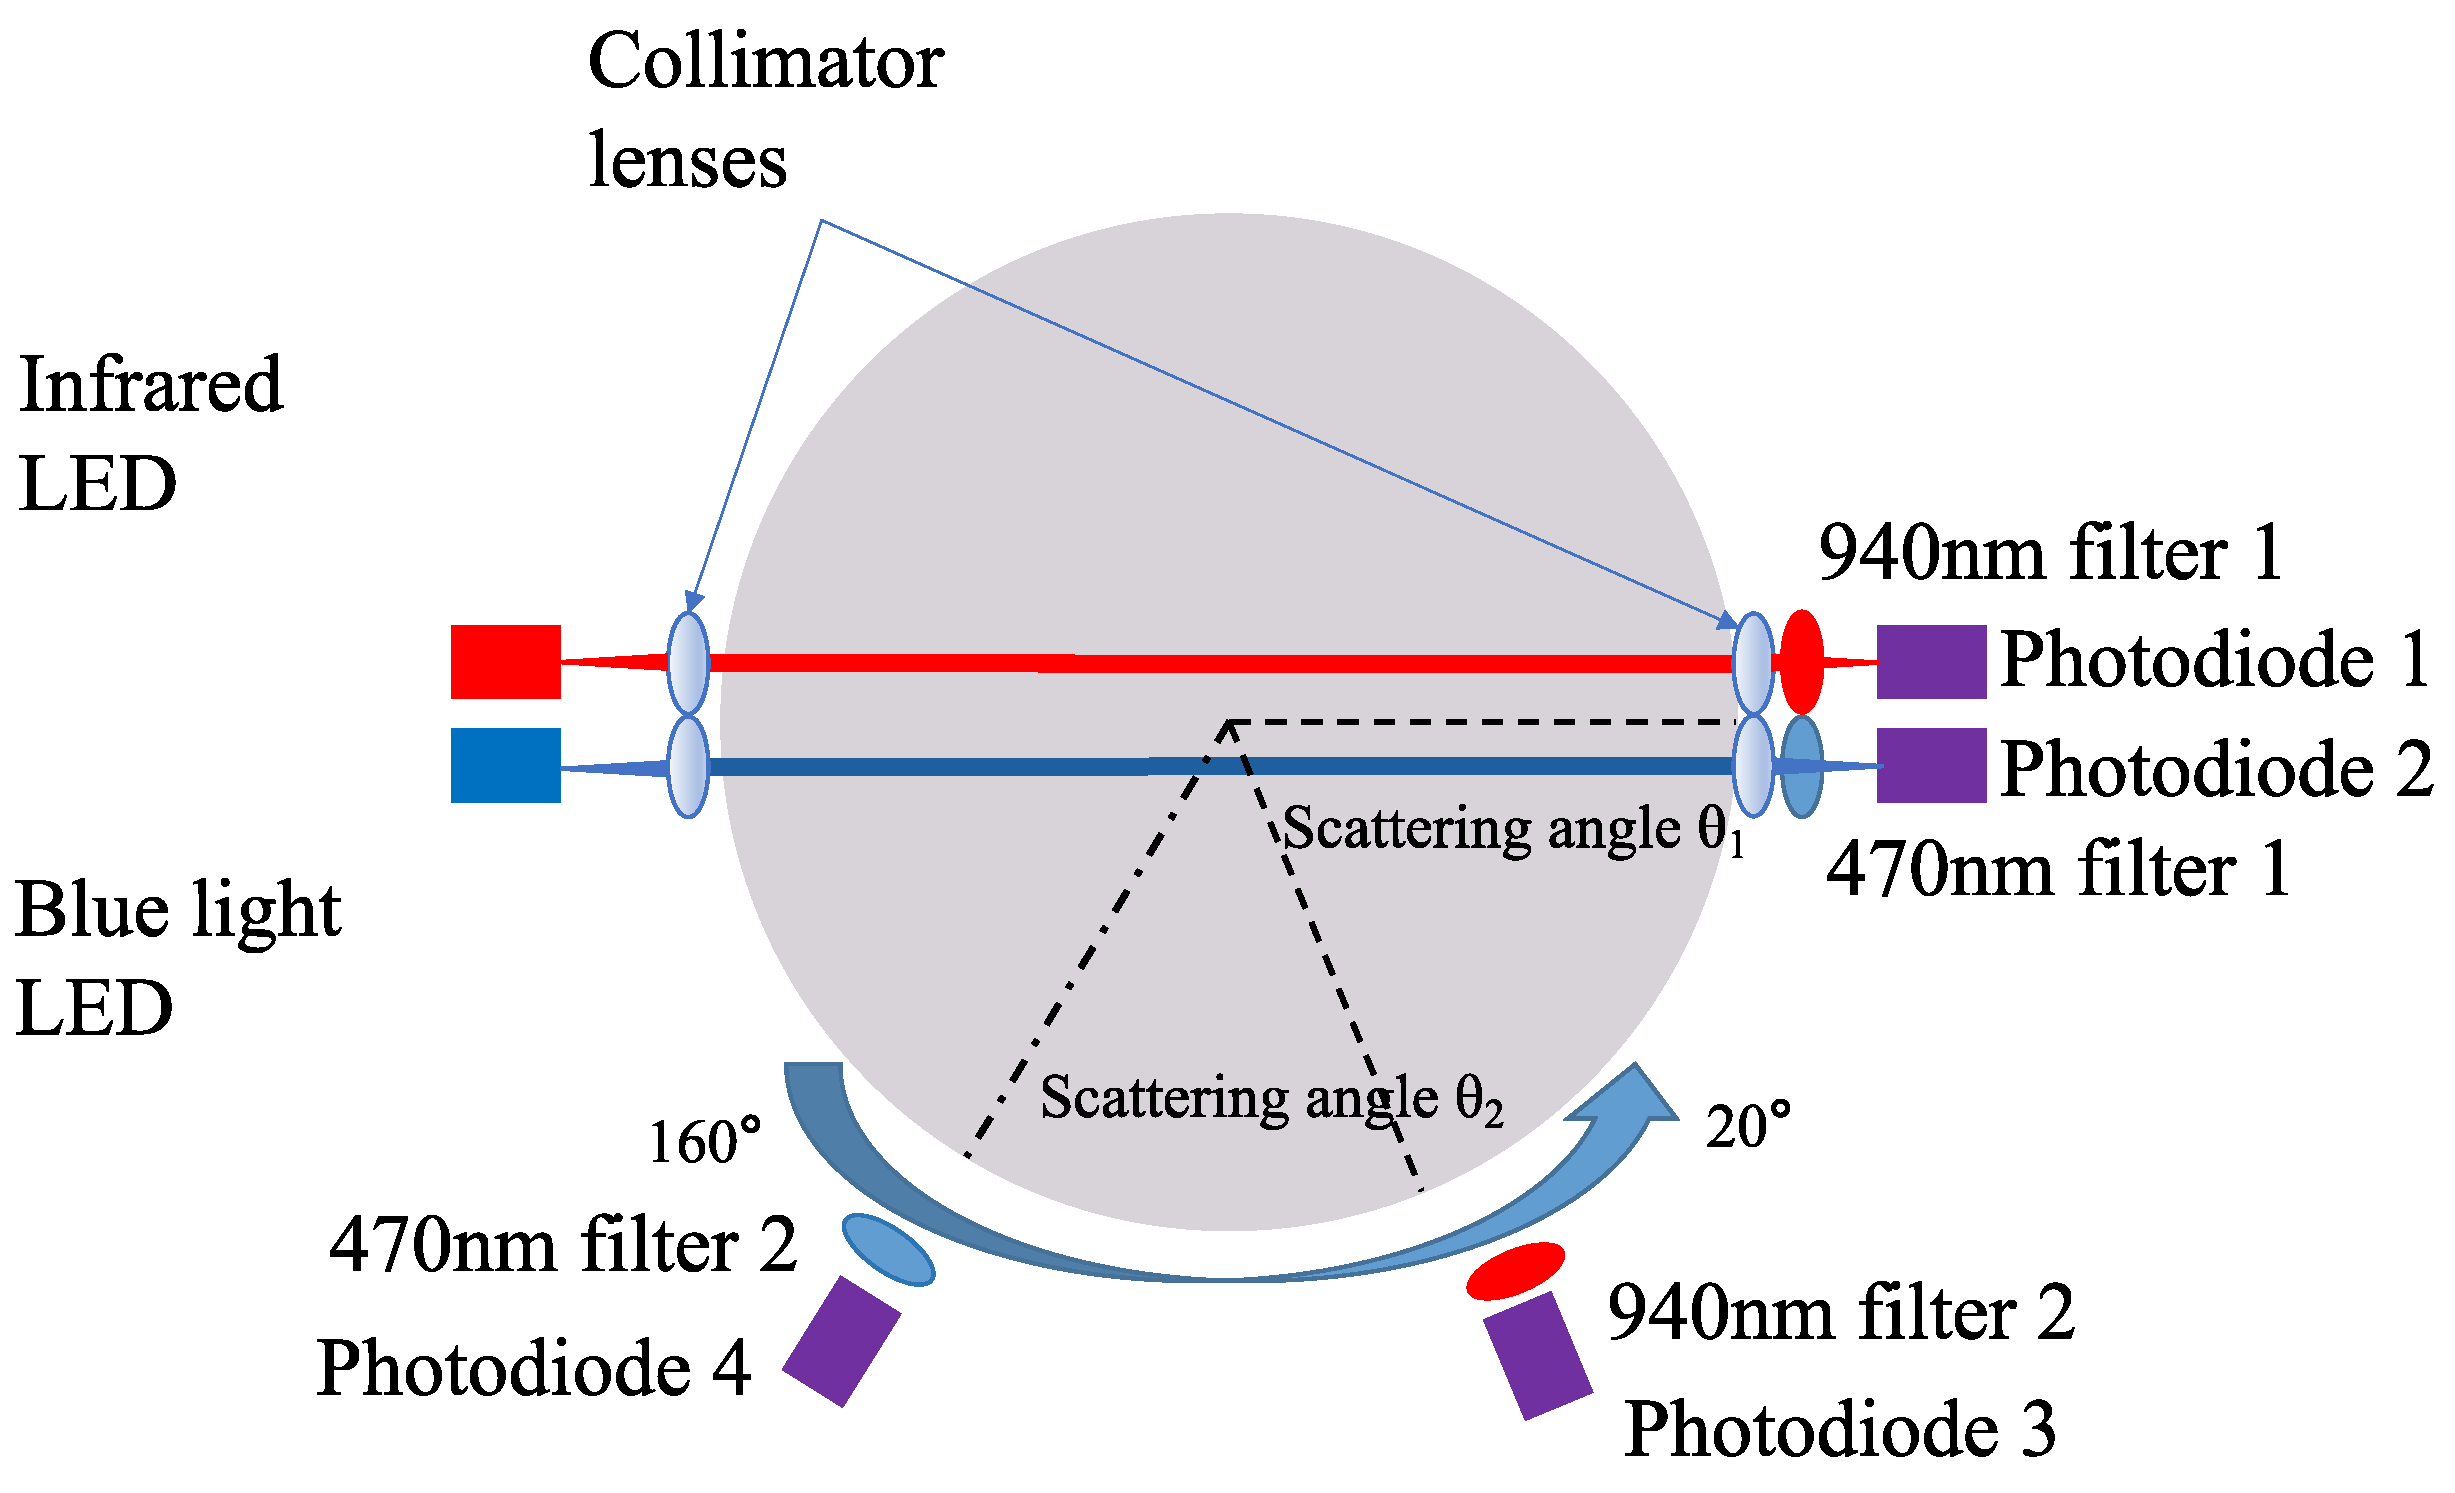
Figure 2 shows the simplified design of the DWSE detector. It consists of a 15 μW IR LED (Everlight IR333C) with a peak wavelength of 940 nm () and a 15 μW LED (Everlight 333-SUBC/C470/S440-A6) with a peak wavelength of 470 nm (). The selection of wavelengths for dual-wavelength measurement was based on the “three regions” law described in Section 2.2, where belongs to region III and belongs to region II.
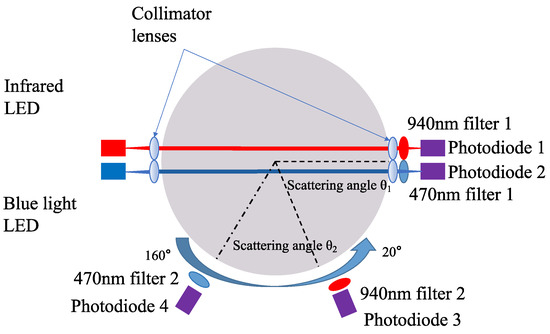
Figure 2.
Simplified design of the DWSE detector.
All four receivers were silicon PIN photodiodes (Vishay BPV10) of the same model, with a spectral bandwidth from 380 nm to 1100 nm. Two infrared narrow bandpass filters (940 nm) and two blue narrow bandpass filters (470 nm) were placed in front of the corresponding scattering-receiving photodiodes and extinction-receiving photodiodes to eliminate interference between light sources. All components in the system were matt-painted to avoid stray light affecting the measurement results. Light beams were collimated by two pairs of lenses placed between the LEDs and the extinction PDs of both wavelengths.
Light sources and extinction receivers were fixed, while the position of scattering receivers can be moved around the circumference to detect light intensities at different scattering angles , i.e., from 20° to 160° in this study. The optimal scattering detection angles to distinguish fire smoke particles and interference sources would be determined through experiments, which will be discussed in the next section.
3.2. Definition of Coefficients , , and
The differences between the three coefficients, , , and mainly depend on the properties of the particles being studied. Based on the theoretical analysis in Section 2, we find that both and relate to the particle size and the refractive index. That is, relying solely on one of and , we will not be able to eliminate the interference sources. Thus, we use both of them. In addition, serves as a supplementary variable, since it focuses mainly on the ratio between scattering and absorption over extinction, which mainly relates to the refractive index. Using all three coefficients provides additional dimensions for distinguishing particles of different sizes and refractive indices. This is important because it helps to eliminate the potential influence of particles that have similar sizes.
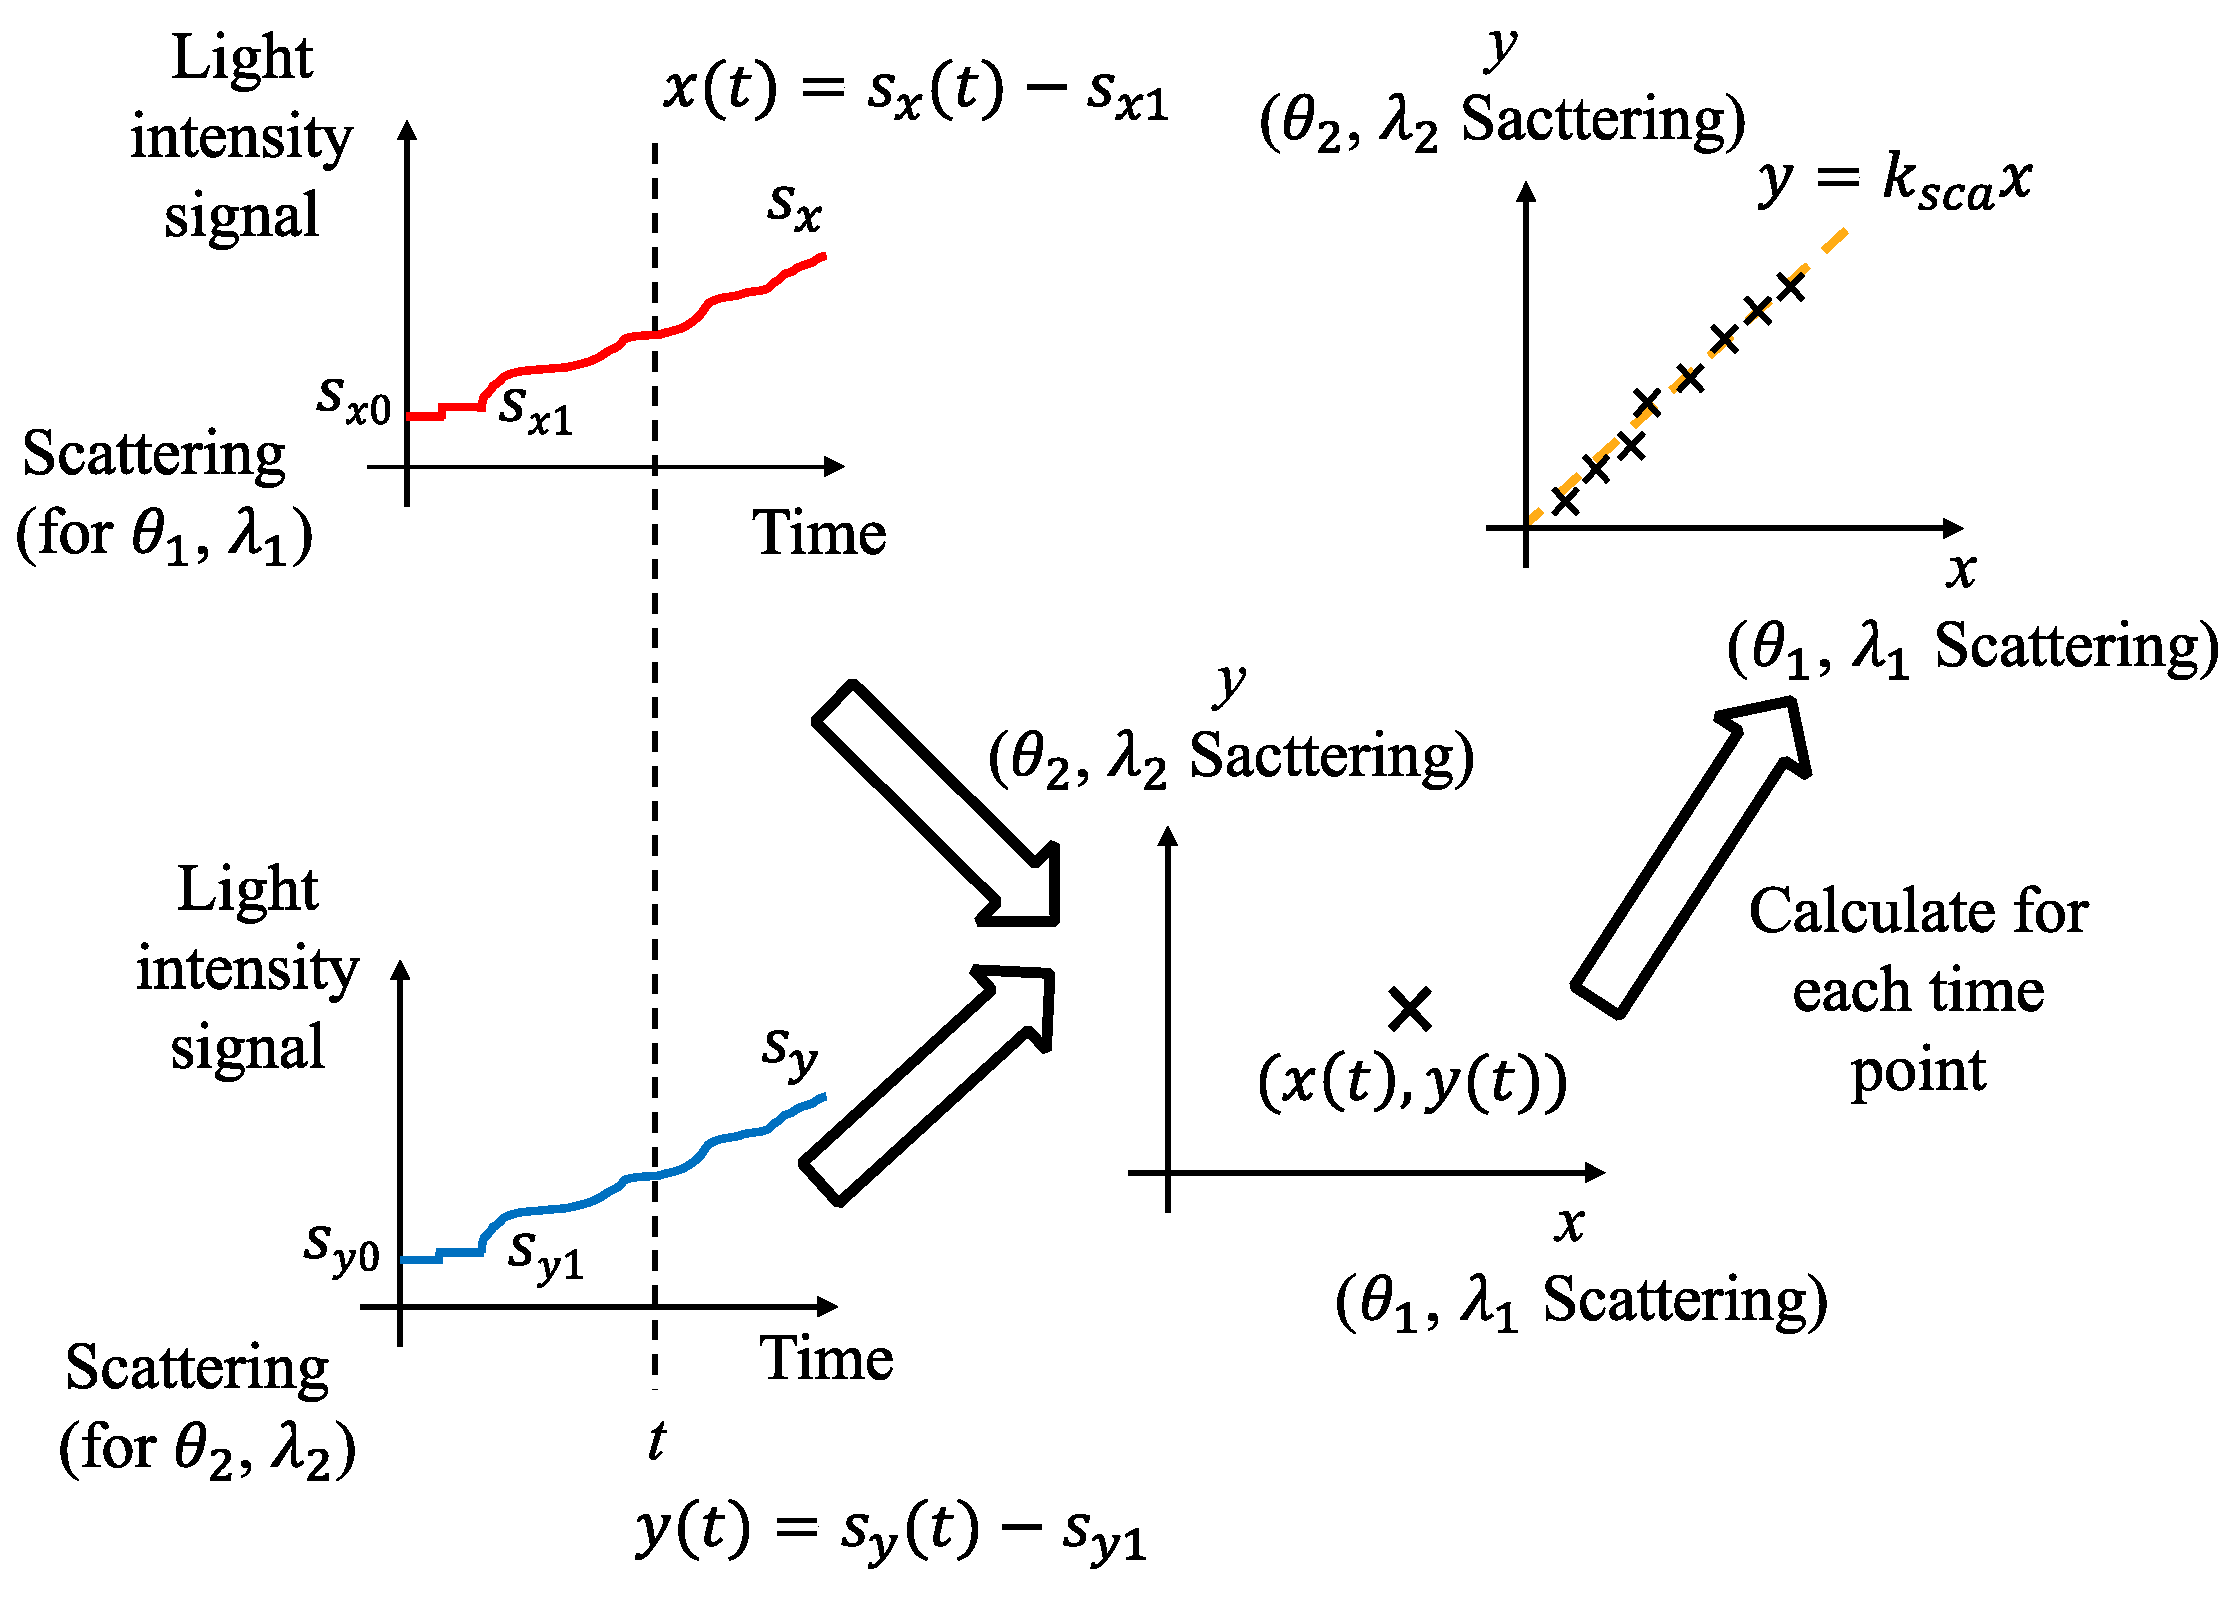
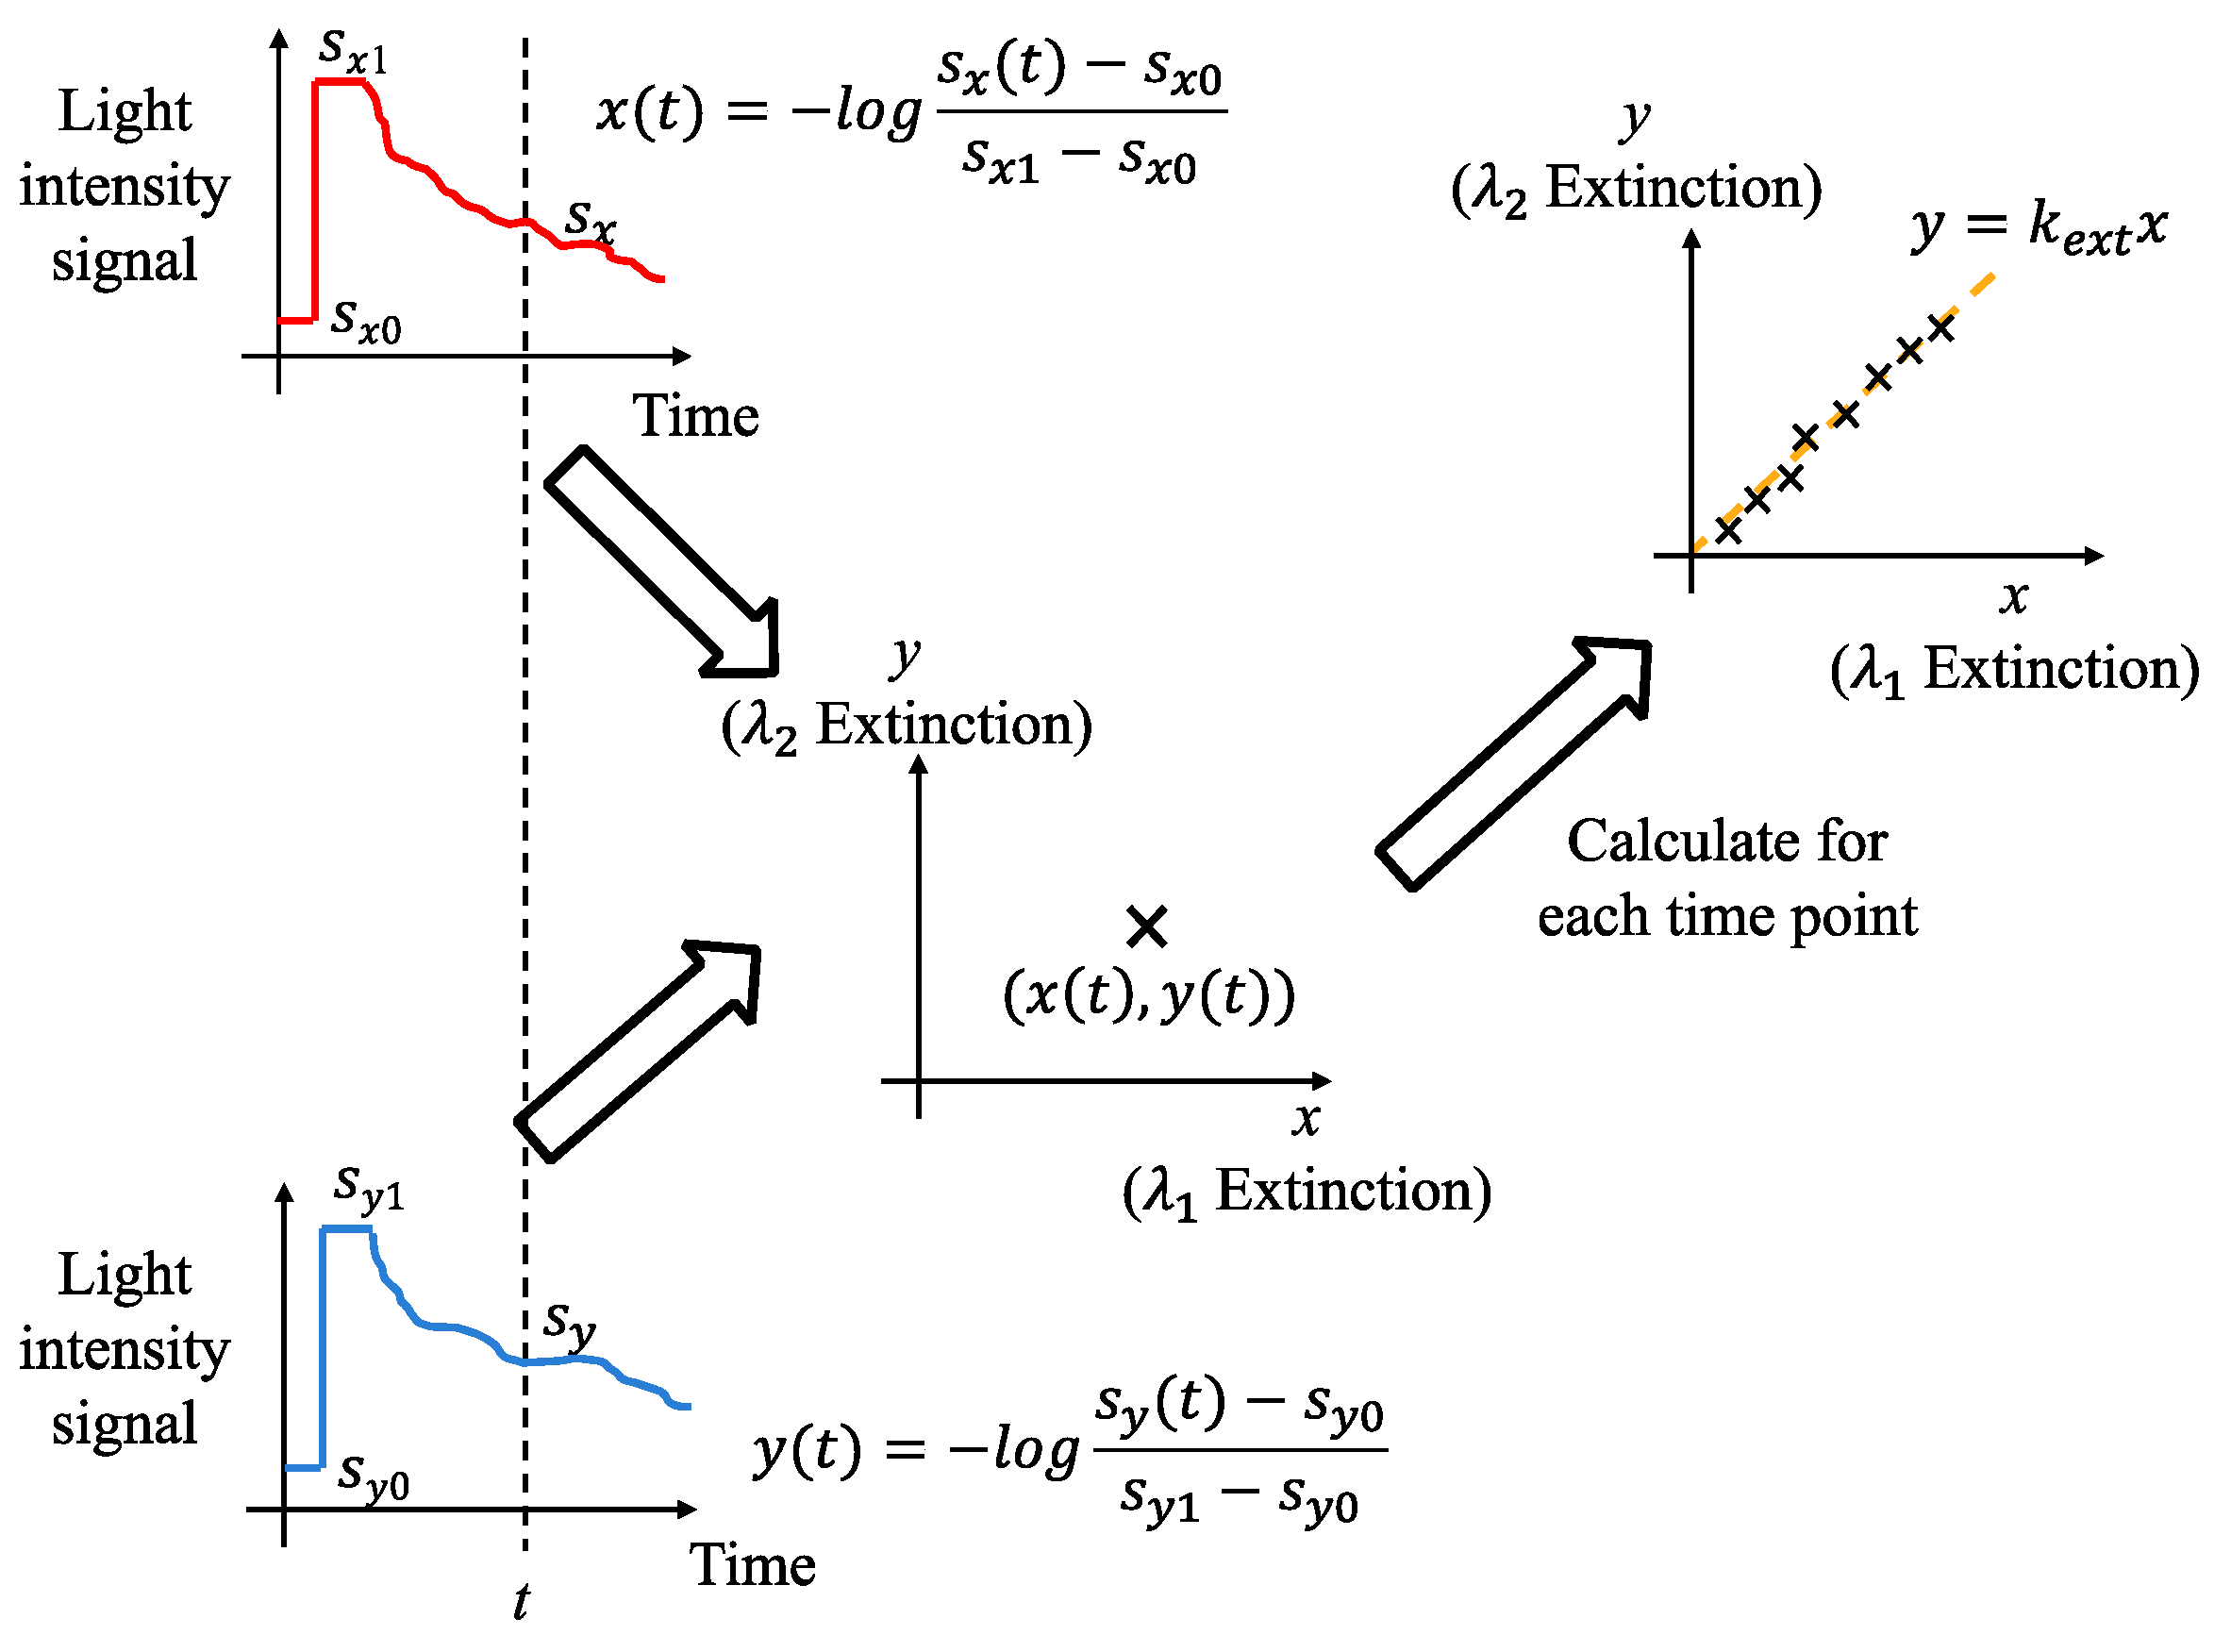
The coefficient is defined as the ratio of the scattering measures of blue light to infrared light, which is shown in Figure 3. The coefficient is defined as the ratio of the extinction measures of blue and infrared light, and Figure 4 plots its calculation process.
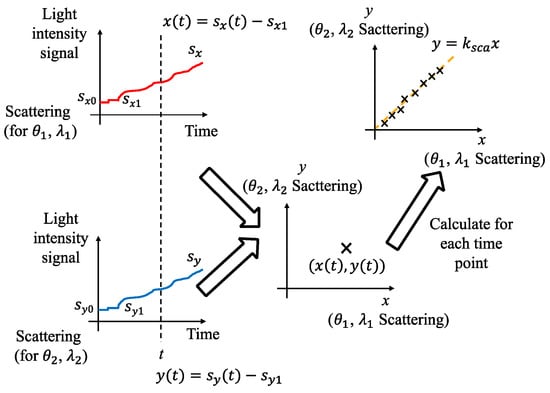
Figure 3.
Calculation process of .
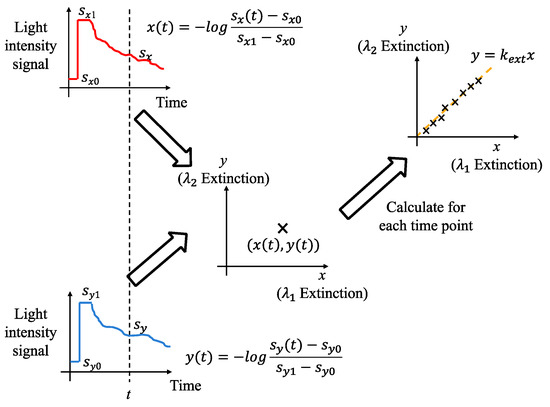
Figure 4.
Calculation process of .
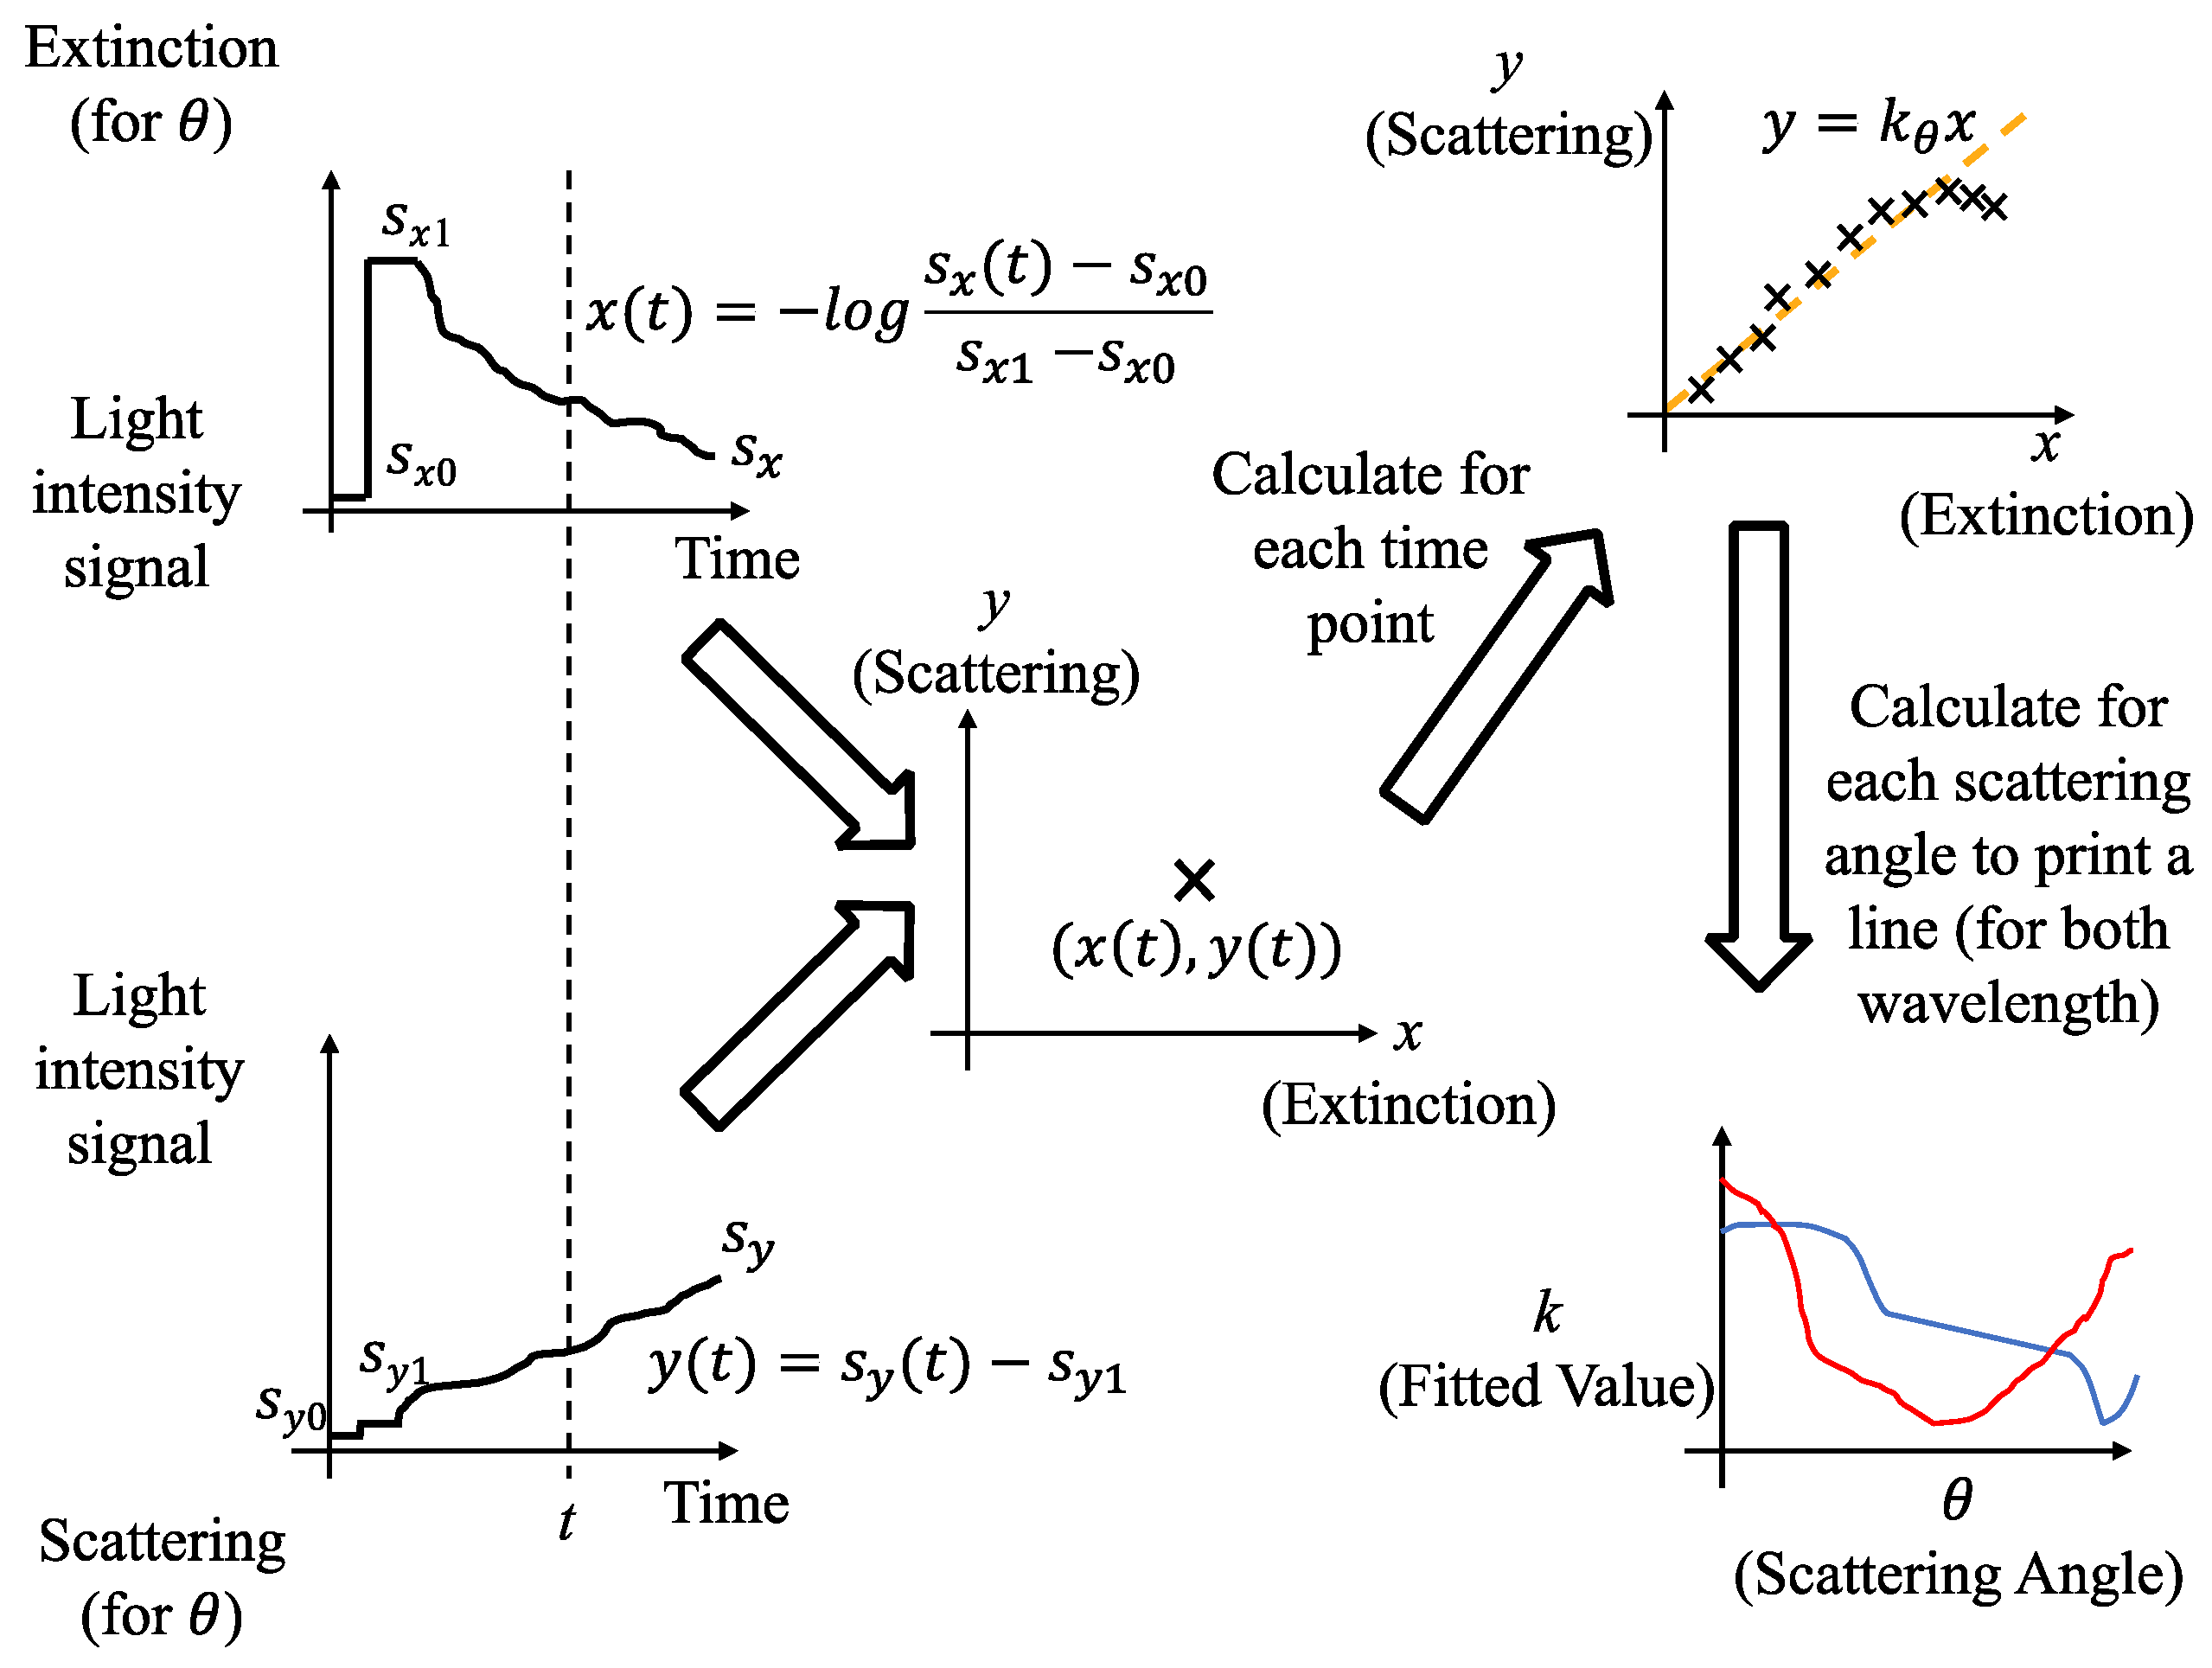
To consider the effect of particle shape uncertainty, we also introduce a ratio of scattering to extinction at each wavelength. The coefficient ( and ) is defined as the ratio of scattering to extinction for one incident light. Figure 5 shows the calculation process of . First, the extinction and scattered light intensity signals at time were processed to obtain a point where the extinction is the coordinate and the scattering is the coordinate. The coefficients and are the background signals of the receiver, while and are the received light intensity without scattering and extinction caused by particles. Signals received at each time point were then calculated and plotted in the coordinates plane mentioned above, and the result was fitted with a line of . At last, for both wavelengths, the fitted value was calculated for each scattering angle to print lines, respectively.
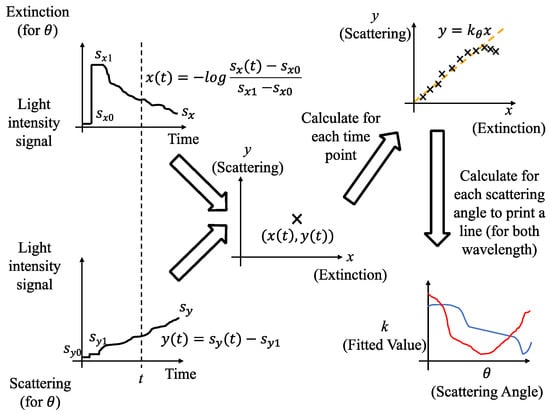
Figure 5.
Calculation process of .
It can be seen that the , , and values obtained through the above process are the fitting slope coefficients calculated from many different particle concentration situations, which can exclude the influence of particle concentration on the coefficient.
4. Determination of Scattering Detection Angles
Both numerical simulations and experiments were carried out in this section. In the simulations, DDA-modelled fire smoke particles, paraffin aerosols, and two nuisance particles, i.e., fine water droplets and dust, were used to determine the optimal scattering detection angles. In the experiments, only paraffin aerosols and interfering particles were used since real fire is difficult to control, with it being unrealistic to conduct numerous fire experiments in this section. The real fire tests of EN54 were conducted in the next section for verification.
4.1. Calculation of Agglomerates Optical Properties by Discrete Dipole Approximation
Although paraffin aerosols can be regarded as spherical particles, real smoke particles are not spherical due to soot particles agglomerated and grown [21]. Therefore, their scattering and extinction characteristics cannot be calculated directly by the Mie theory, and corresponding numerical calculation methods are required. The Discrete Dipole Approximation (DDA) method was used to determine more accurately the light scattering and extinction of soot aggregates and spheres derived from discrete element modelling. The DDA calculations were performed using open-source DDSCAT 7.3 code [29]. To accomplish DDA computations, a number of parameters need to be determined.
The number of soot particles in an aggregate is given by:
where is the radius of the individual soot particles, is the radius of gyration, and and are the mass fractal dimension and fractal prefactor, respectively [24]. According to Qiao’s research [30], the radius of an individual soot particle was set to 30.8 nm. The coefficients and were determined to be 2.38 and 1.54, respectively, referring to Shu et al. [21]. The number of soot particles was specified as a maximum of 370, following a log-normal distribution with parameters and of 2.58 and 2.35, respectively. The refractive indices were set to 1.545 + 0.02i for both wavelengths.
4.2. Simulation
Paraffin aerosols, fine water droplets, and dust are all spherical particles, the scattering and extinction characteristics of which can be calculated by the Mie theory given the particle distribution. Therefore, measuring particle size distributions is the first step. The paraffin aerosols were produced by the aerosols generator (Aobosi ABS-Y02) used for fire detection testing according to EN 54, while the dust is ISO 12103-1, A2 fine test dust produced by Powder Technology Inc. The fine water droplets were generated by a household humidifier, which is reasonably similar to the actual scene. Particle size distributions of these particles were measured by a Malvern Spraytec system. This system measures spray droplets and sprays particle size distribution through laser diffraction. The refractive indices of paraffin aerosols, fine water droplets, and dust were set to 1.47, 1.33, and 1.51, respectively, according to the literature and databases, to ensure the accuracy of particle size distribution measurement [31,32,33].
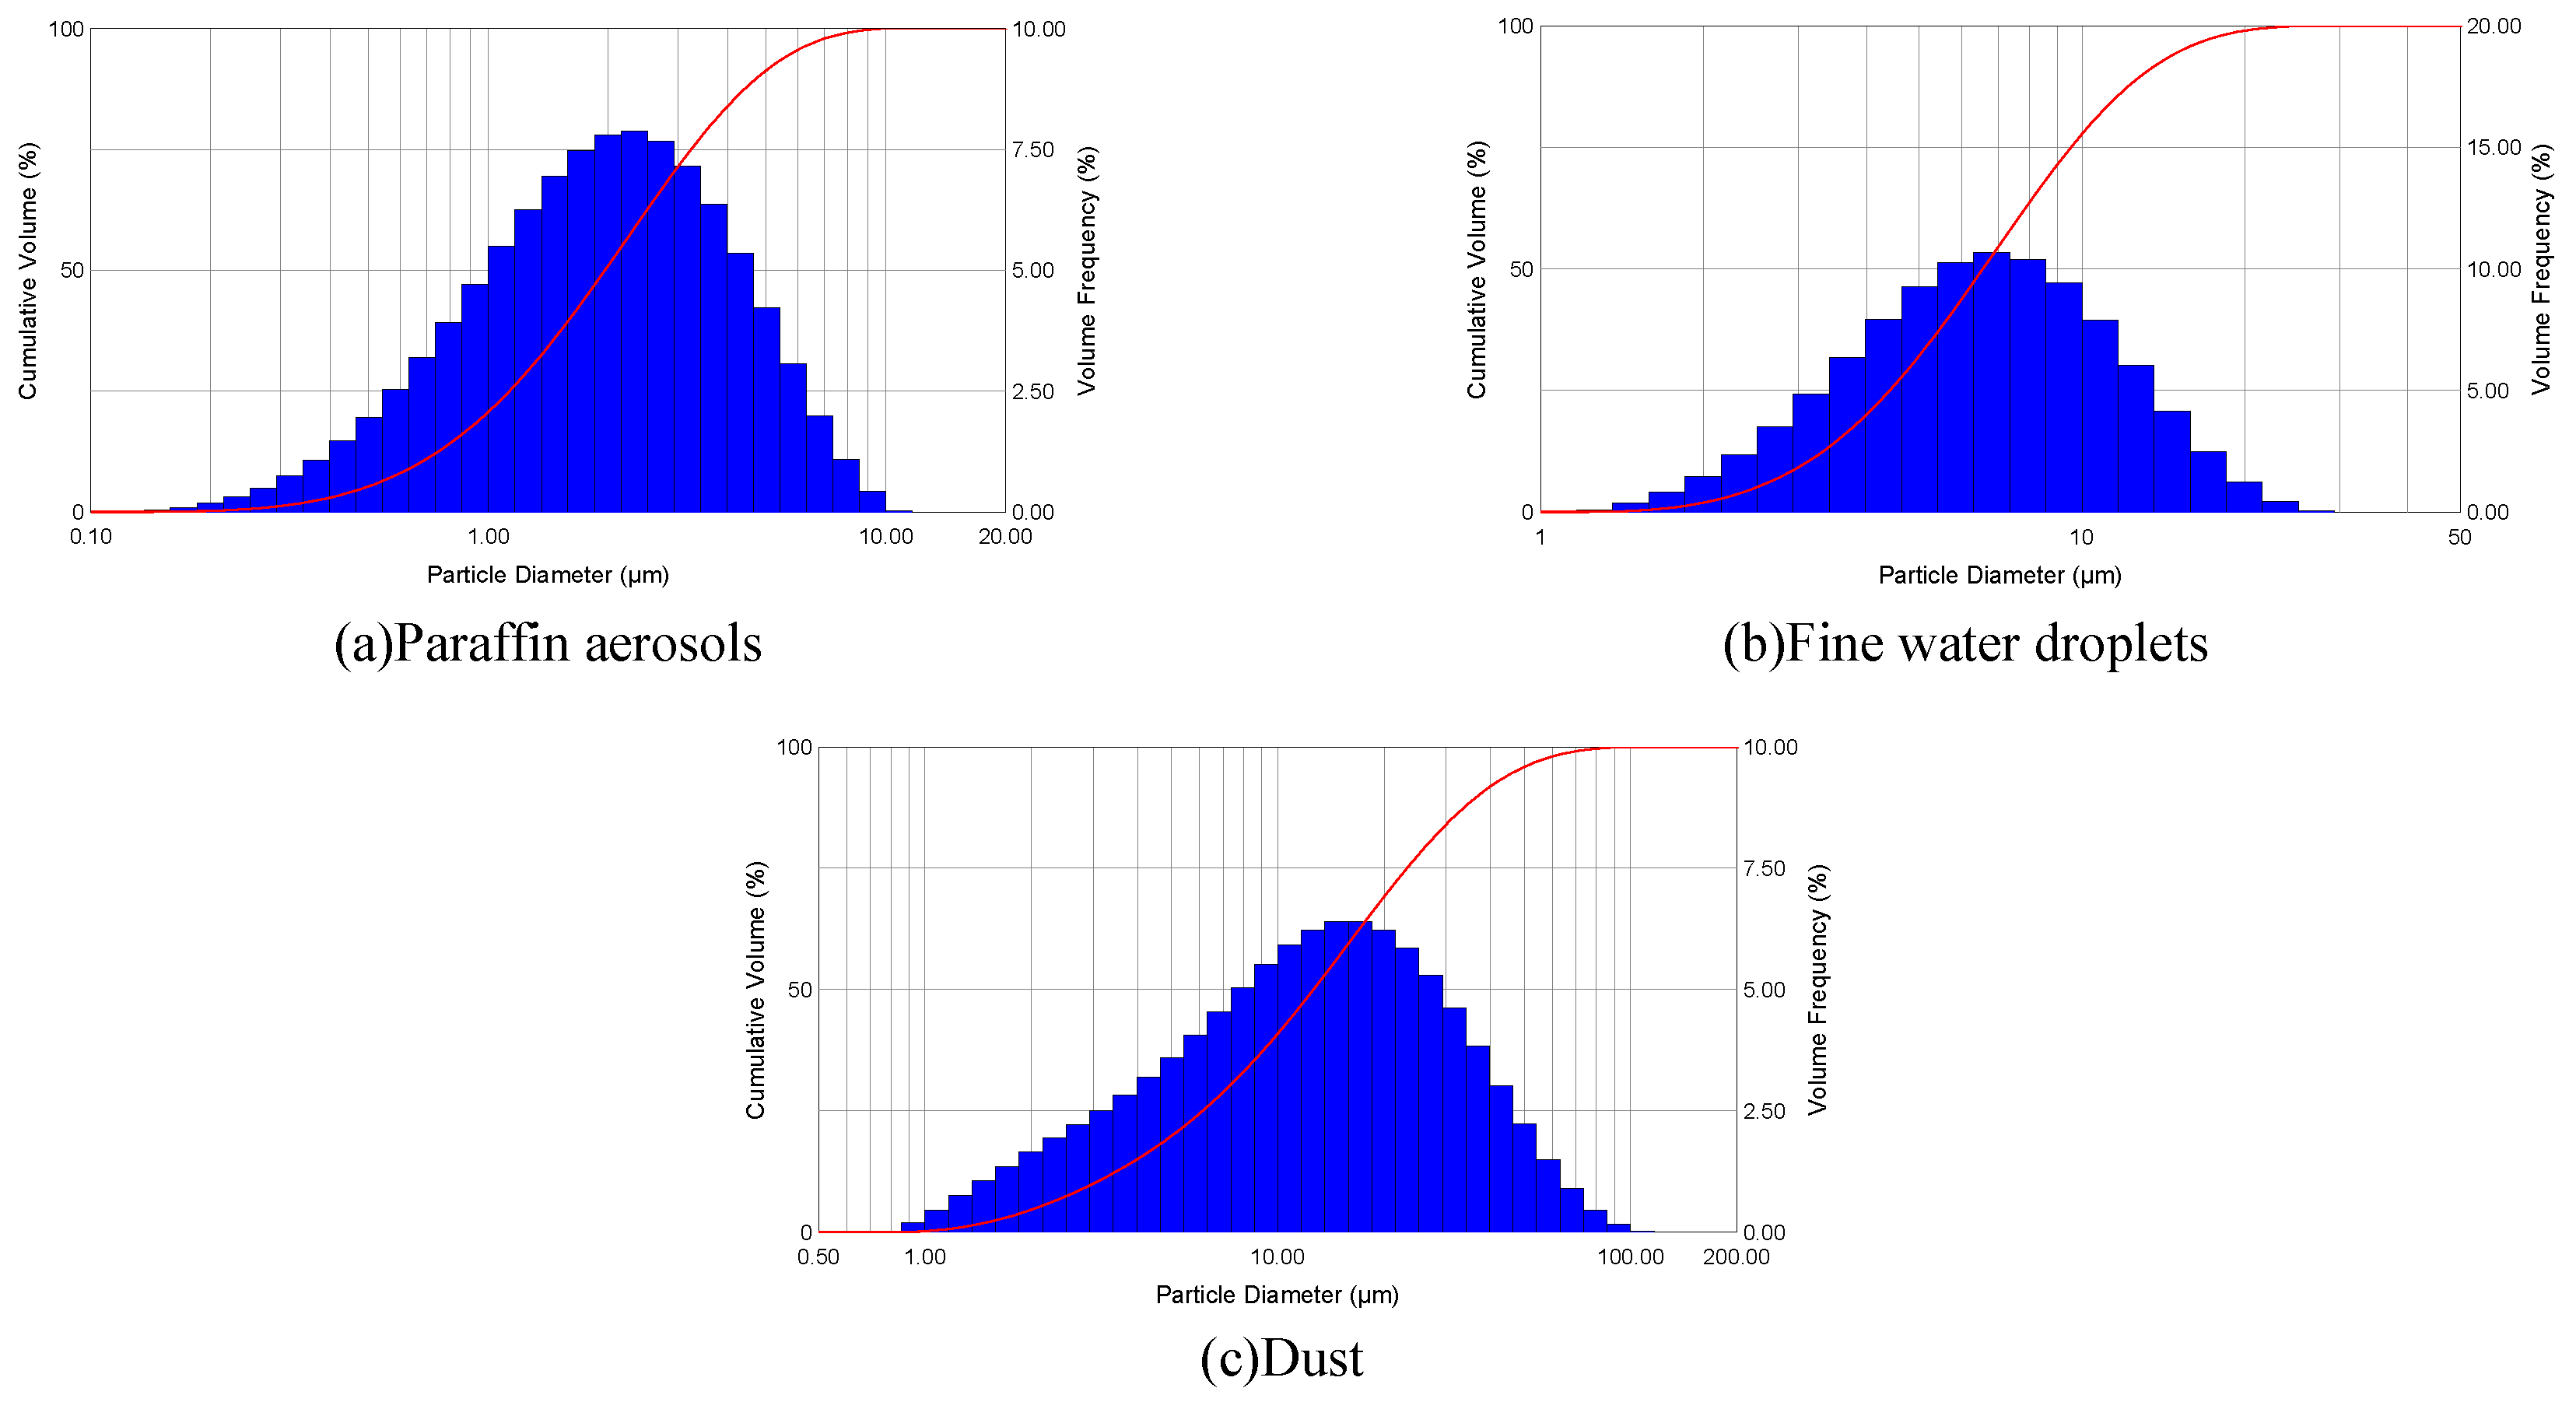
Figure 6 plots the particle distributions by volume of paraffin aerosols, fine water droplets, and dust, respectively. The volume-based median diameters () and Sauter diameters (, SMD) of these particles calculated from measured particle size distributions are listed in Table 1. Combined with Figure 3 and Table 1, there are apparent differences in particle size between aerosols, fine water droplets, and dust. The median particle size by volume of the aerosols is the smallest, 1.8 μm, while fine water droplets and dust are larger than 5 μm, which are also larger than the particle size of ordinary soot particles [34]. In addition, it can be seen that the dust test data are roughly consistent with the standard distribution data provided by the manufacturer, as detailed in Table 2.
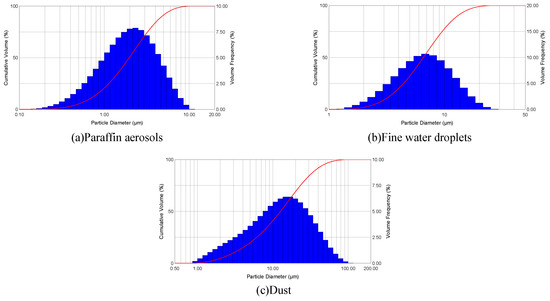
Figure 6.
Particle distributions by volume of paraffin aerosols, fine water droplets, and dust.

Table 1.
Measured diameters of paraffin aerosols, fine water droplets, and dust.

Table 2.
ISO test dust particle size distributions by volume %.
The simulation results of paraffin aerosols, fine water droplets, dust, and DDA-modelled soot particles are presented in Figure 7 and Figure 8. Figure 7 illustrates the simulated of four different particles. It can be seen that of agglomerates is significantly larger than the other three particles that can be regarded as spherical. As shown in Figure 8, the relation curves of and the scattering angles indicate that all particles have angular symmetry scattering characteristics to some extent except for the agglomerates, as predicted. The simulation results indicate that for all scattering angles, aerosols and agglomerates can be distinguished from fine water droplets and dust. In addition to smoke agglomerates, paraffin aerosols also need to be identified because they are used in the sensitivity test of EN 54.
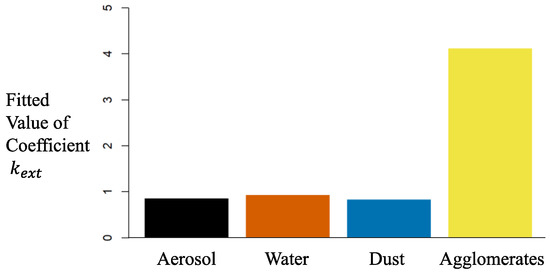
Figure 7.
Simulated of four particles.
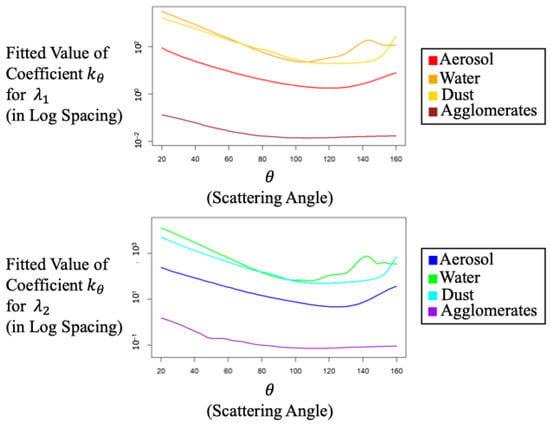
Figure 8.
Relation curves of and the scattering angle.
4.3. Experiments
Although the simulation result is satisfactory, the actual situation still may have discrepancies with the simulation, which needs further confirmation by experiments. Three spherical particles (paraffin aerosols, fine water droplets, and dust) were tested. Particles were fed into the circumference centre within the DWSE detector through a unique tube to measure light intensities correctly. The background (, ), scattering, and extinction intensities without particles (, ) must be gauged before the test started. In each group of experiments, the scattering and extinction signals (, ) of the scattering angle from 20° to 160° were measured in steps of 5°.
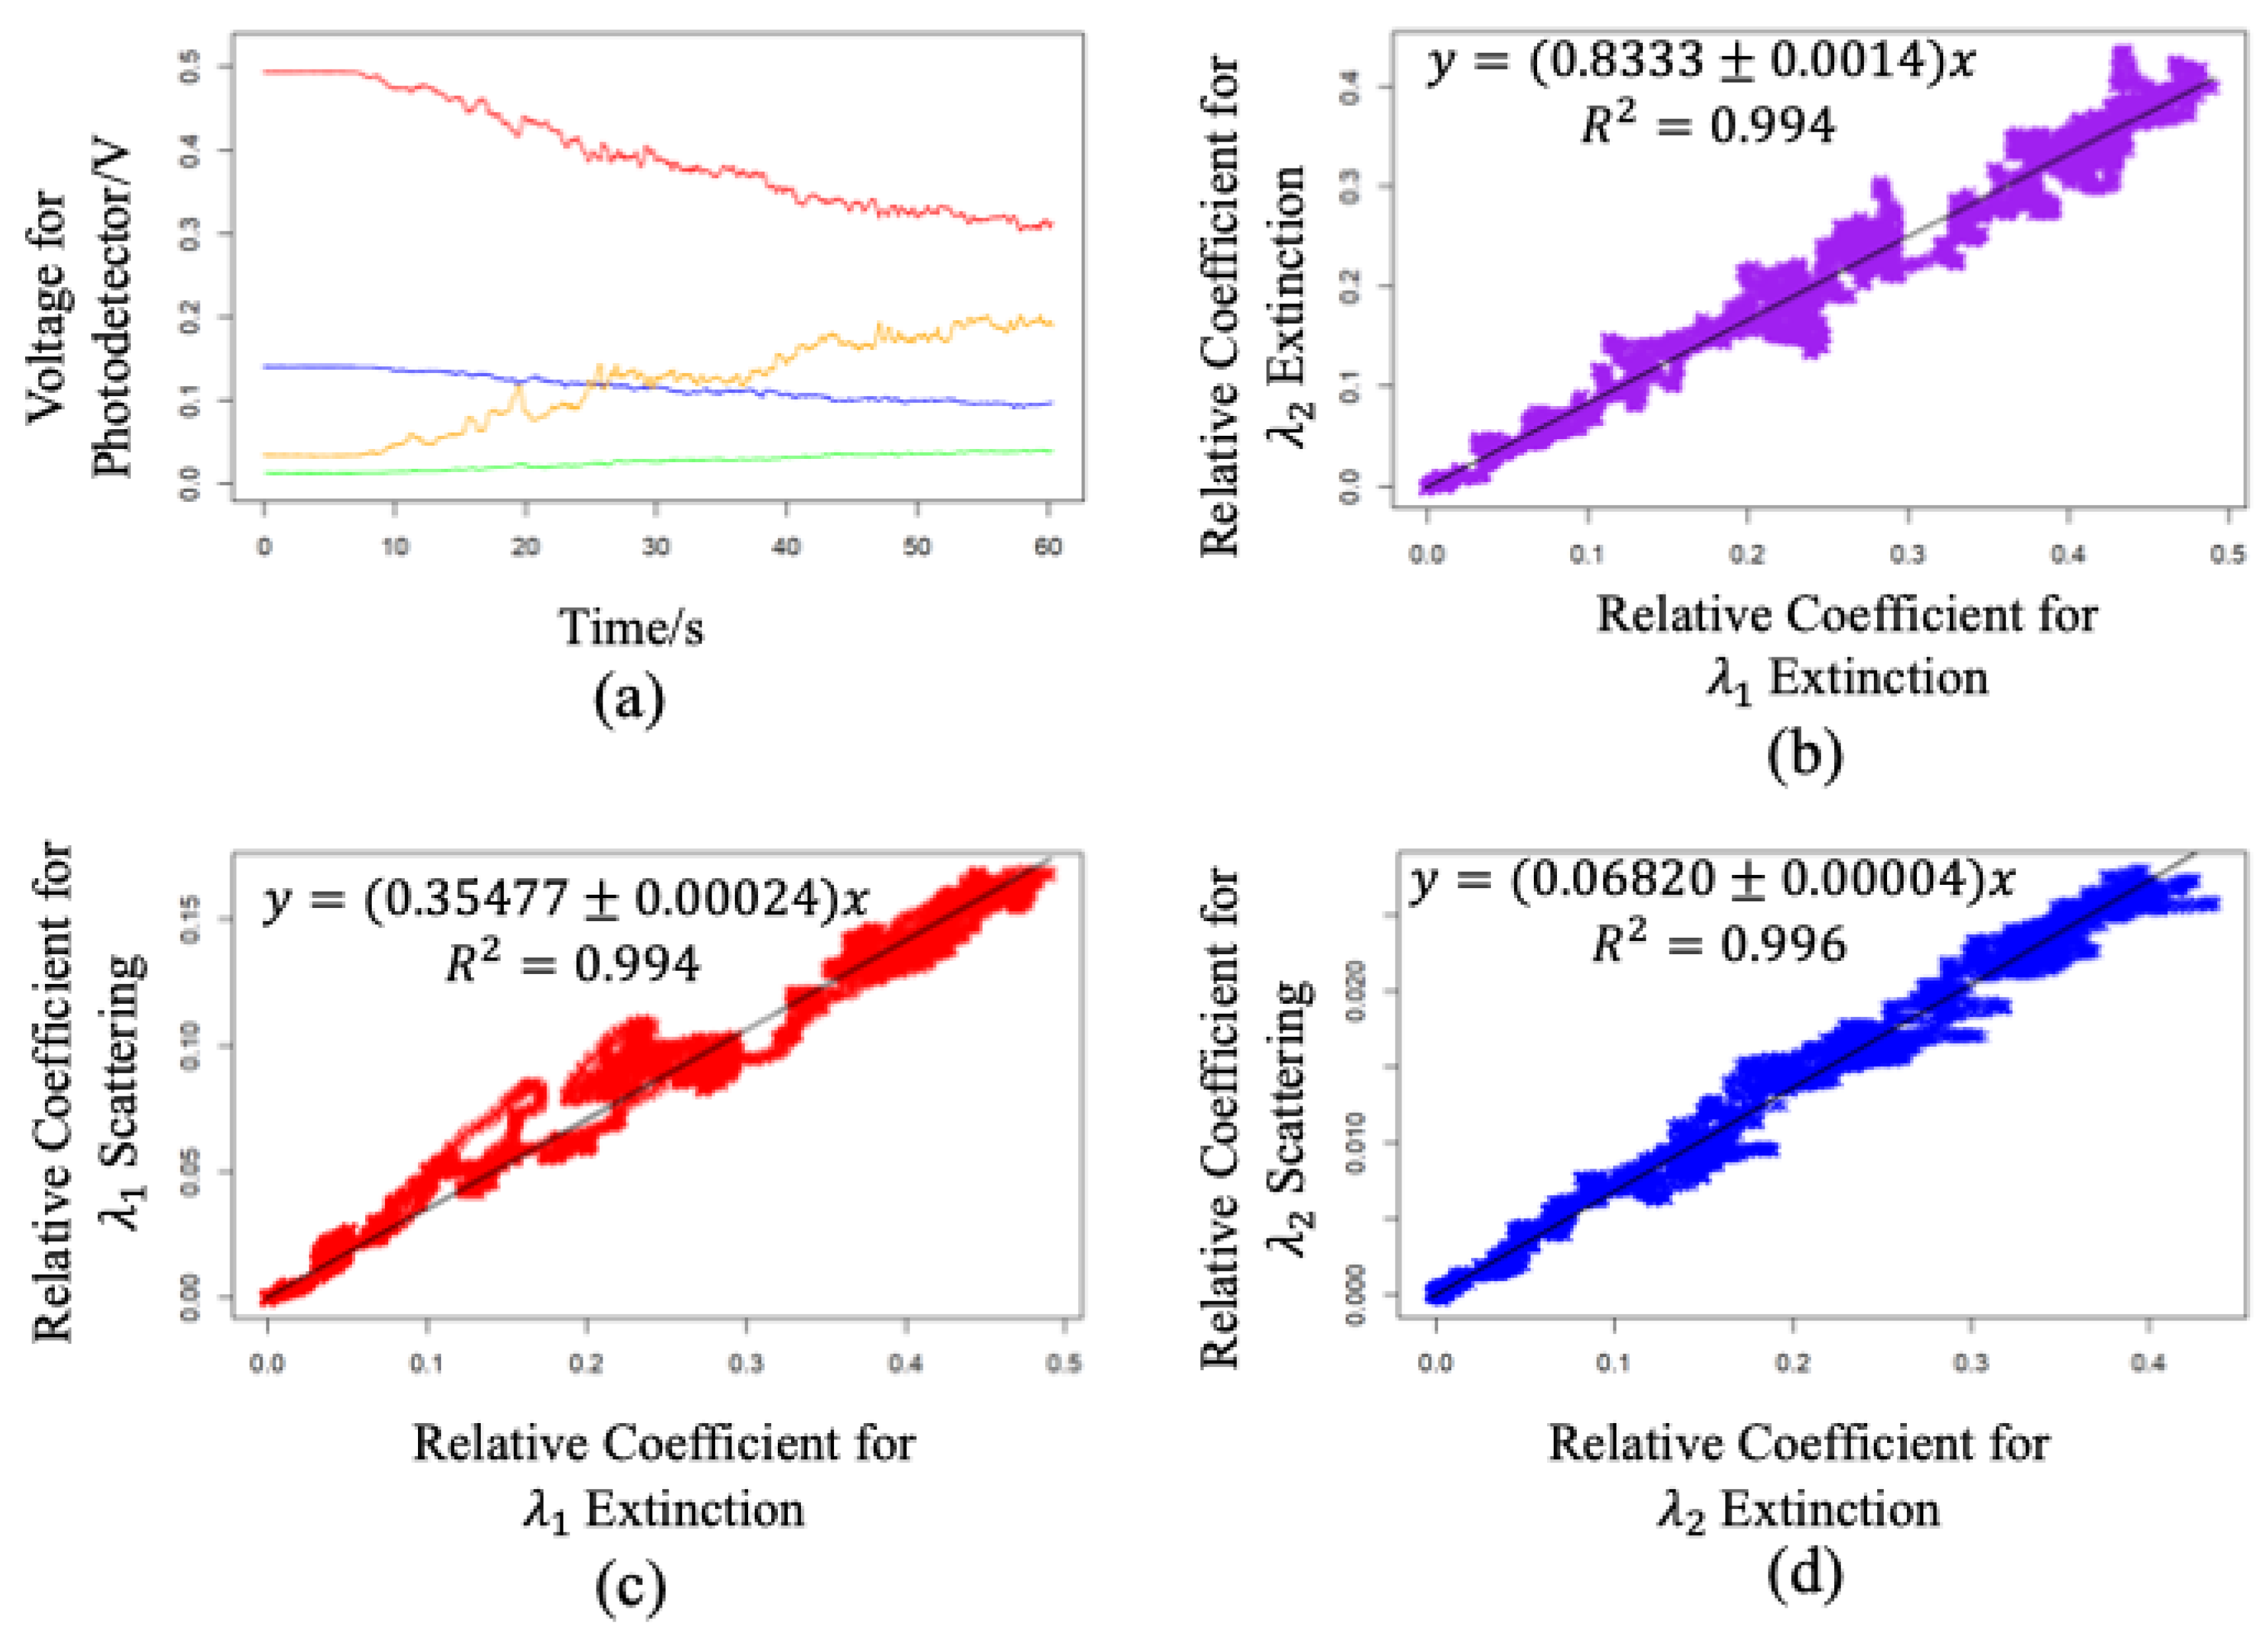
Figure 9 shows an example of the results obtained during an angle determination test with paraffin aerosols, where the scattering angles were set to 90° for both wavelengths. The upper right plot (a) in Figure 9 contains the time behaviour of the extinction and scattering signals from photodiodes in voltage. The paraffin aerosols generator was turned on at s and emitted aerosols continuously and in a controlled manner into the detector so that the concentration rose linearly. At the same time, the extinction signals for both wavelengths reduced gradually due to the extinction of paraffin aerosols. The yellow line shows the voltage of the scattering channel for and the green line shows the voltage of the scattering channel for ; they increased proportionally to the scattering as simulated. As can be seen from Figure 9b–d, the calculated results of coefficients for , for , and are 0.35477 ± 0.00024, 0.06820 ± 0.00004, and 0.8333 ± 0.0014, respectively.
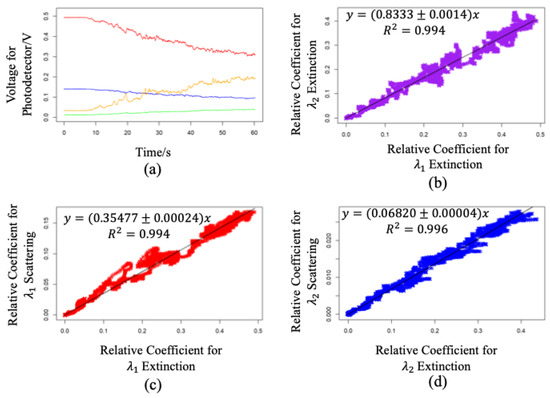
Figure 9.
Received signals and calculated coefficients of paraffin aerosols at 90°. The red and yellow lines in Figure 9a are the extinction and scattering signals of , respectively, and the blue and green lines are the extinction and scattering signals of , respectively.
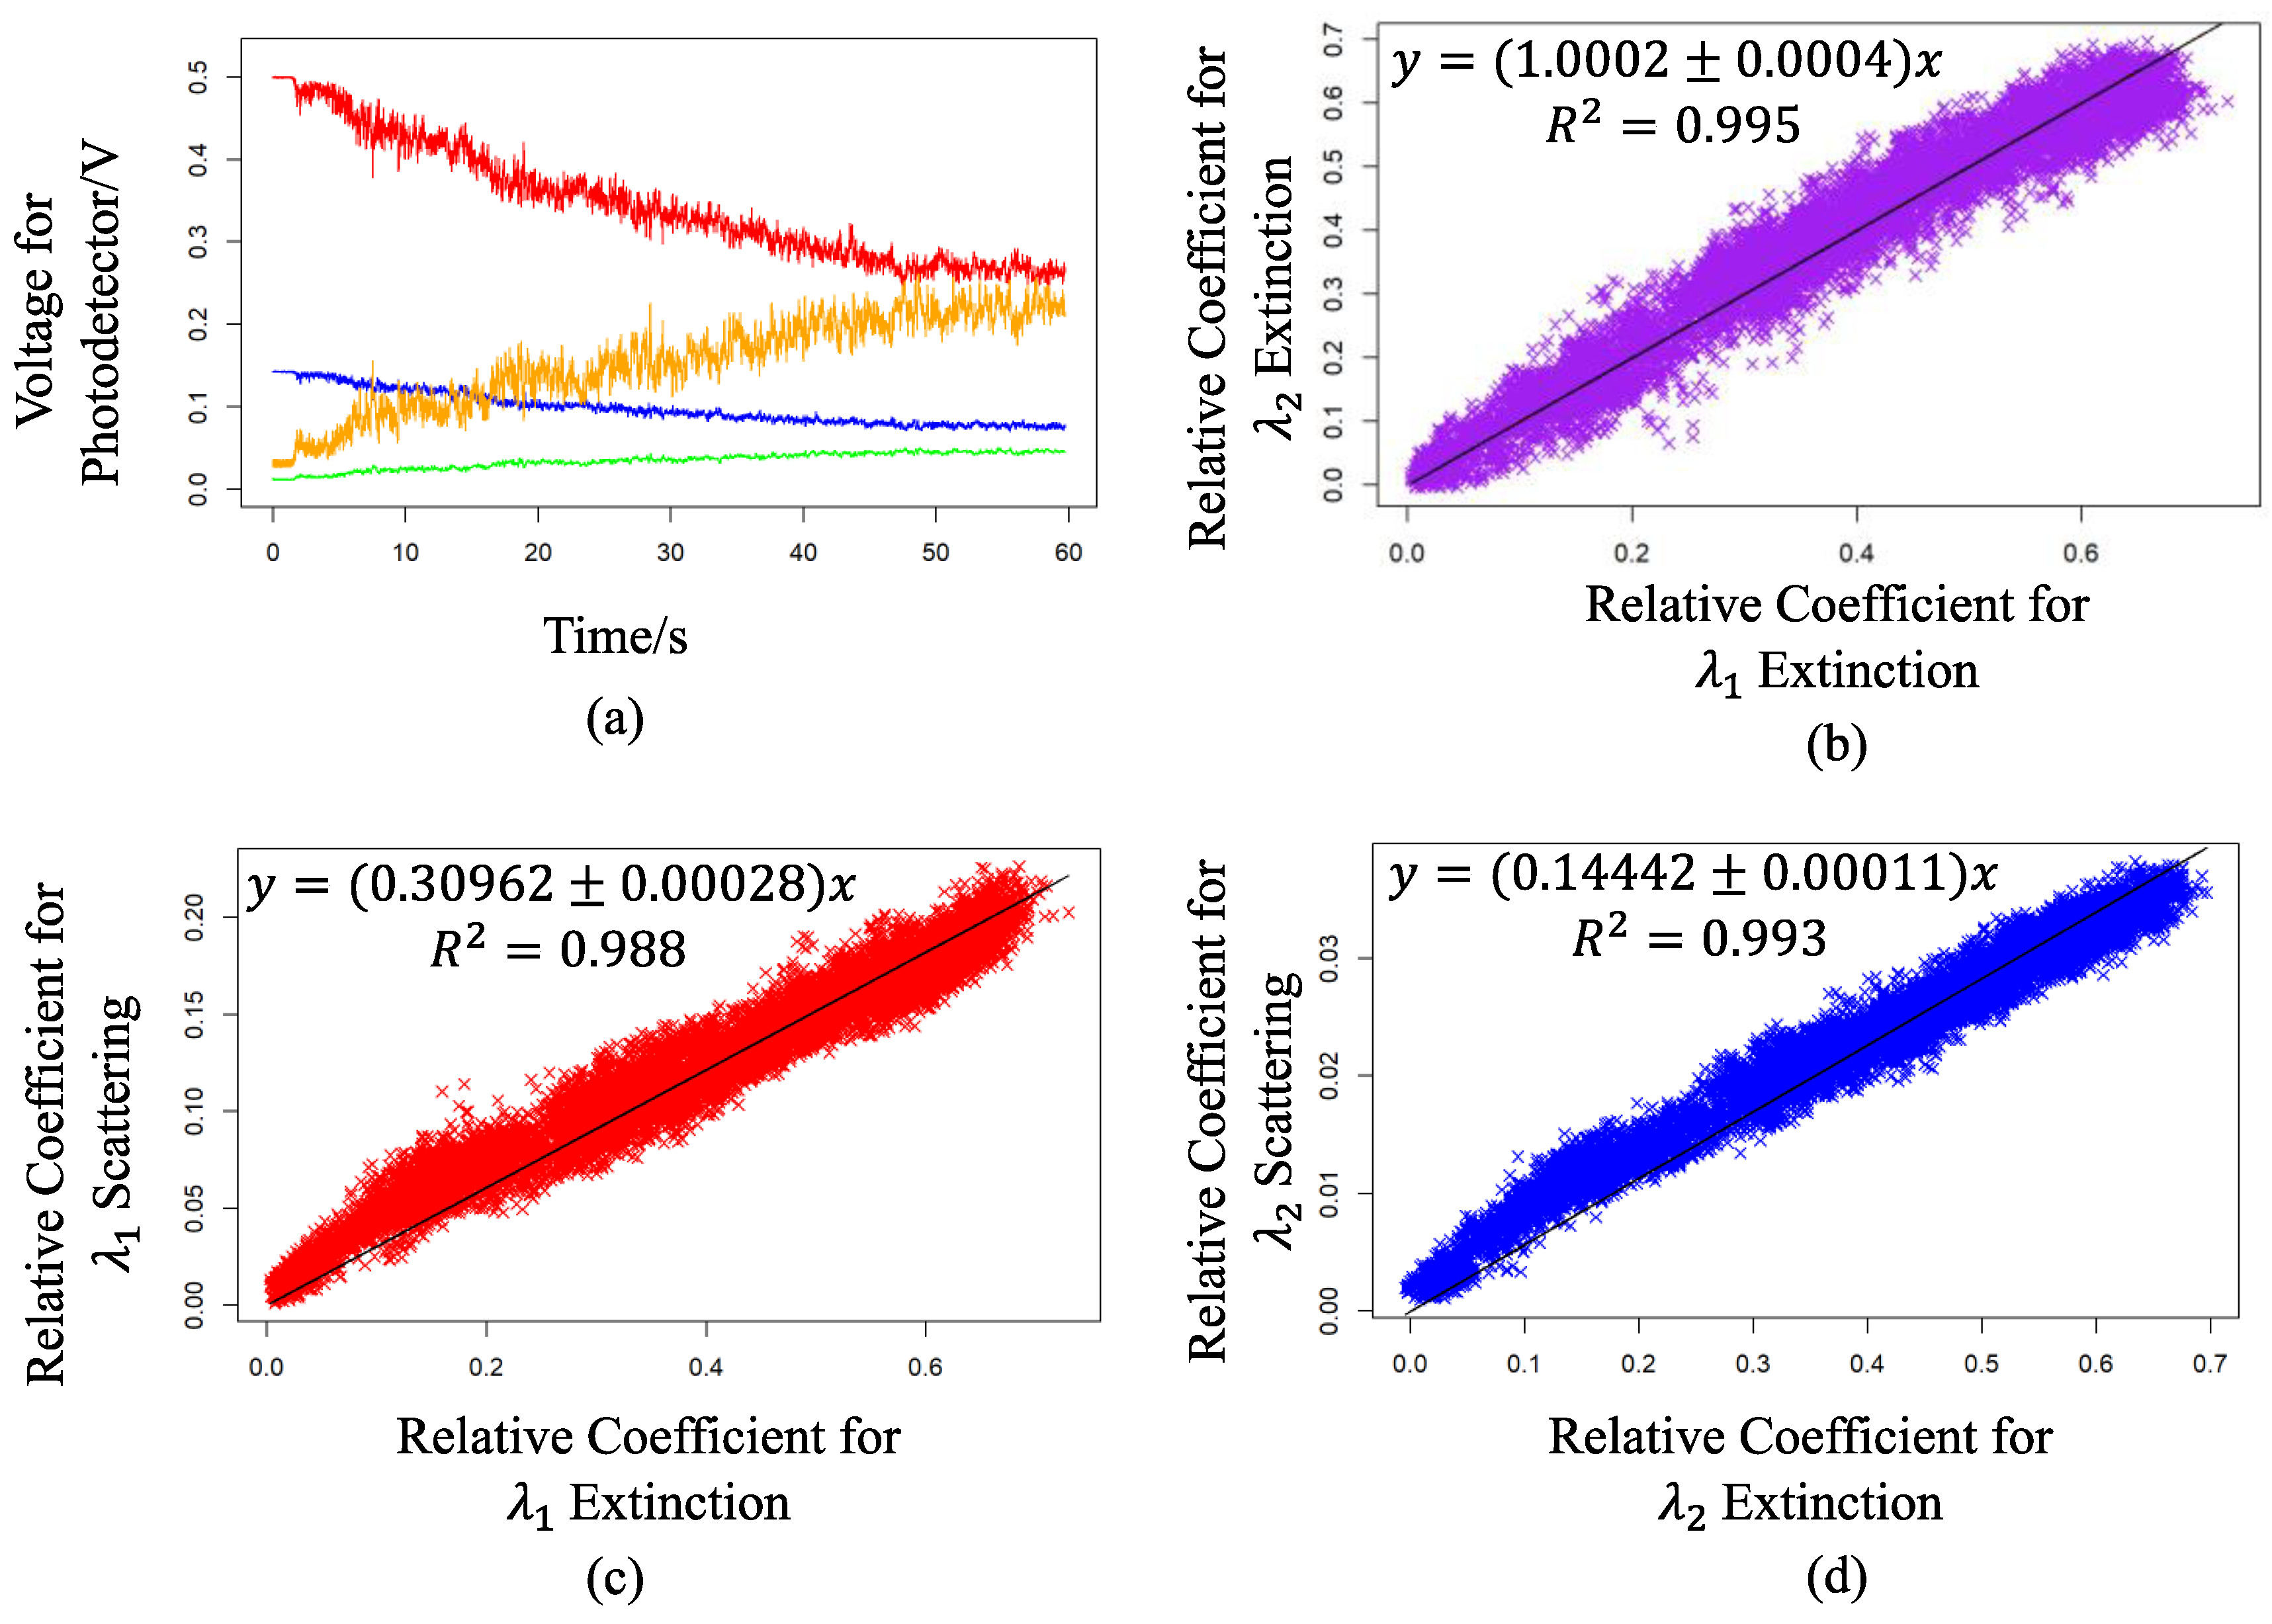
Figure 10 represents an example of the results obtained during an angle determination test with fine water droplets, where the scattering angles were set to 90° for both wavelengths. As per Figure 9, the upper right plots (a) in Figure 10 present the time behaviour of the extinction and scattering signals in voltage. It can be seen that after the humidifier was turned on at s, two scattering channels for and increased proportionally to the scattering in a similar nature to the aerosols. As shown in Figure 10b–d, the calculated results of coefficients for , for , and are 0.30962 ± 0.00028, 0.14442 ± 0.00011, and 1.0002 ± 0.0004, respectively.
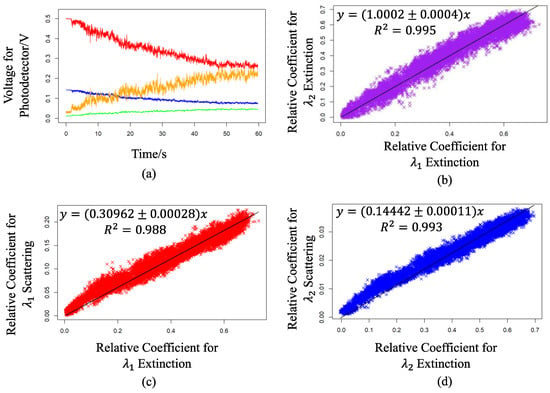
Figure 10.
Received signals and calculated coefficients of fine water droplets at 90°. The red and yellow lines in Figure 10a are the extinction and scattering signals of , respectively, and the blue and green lines are the extinction and scattering signals of , respectively.
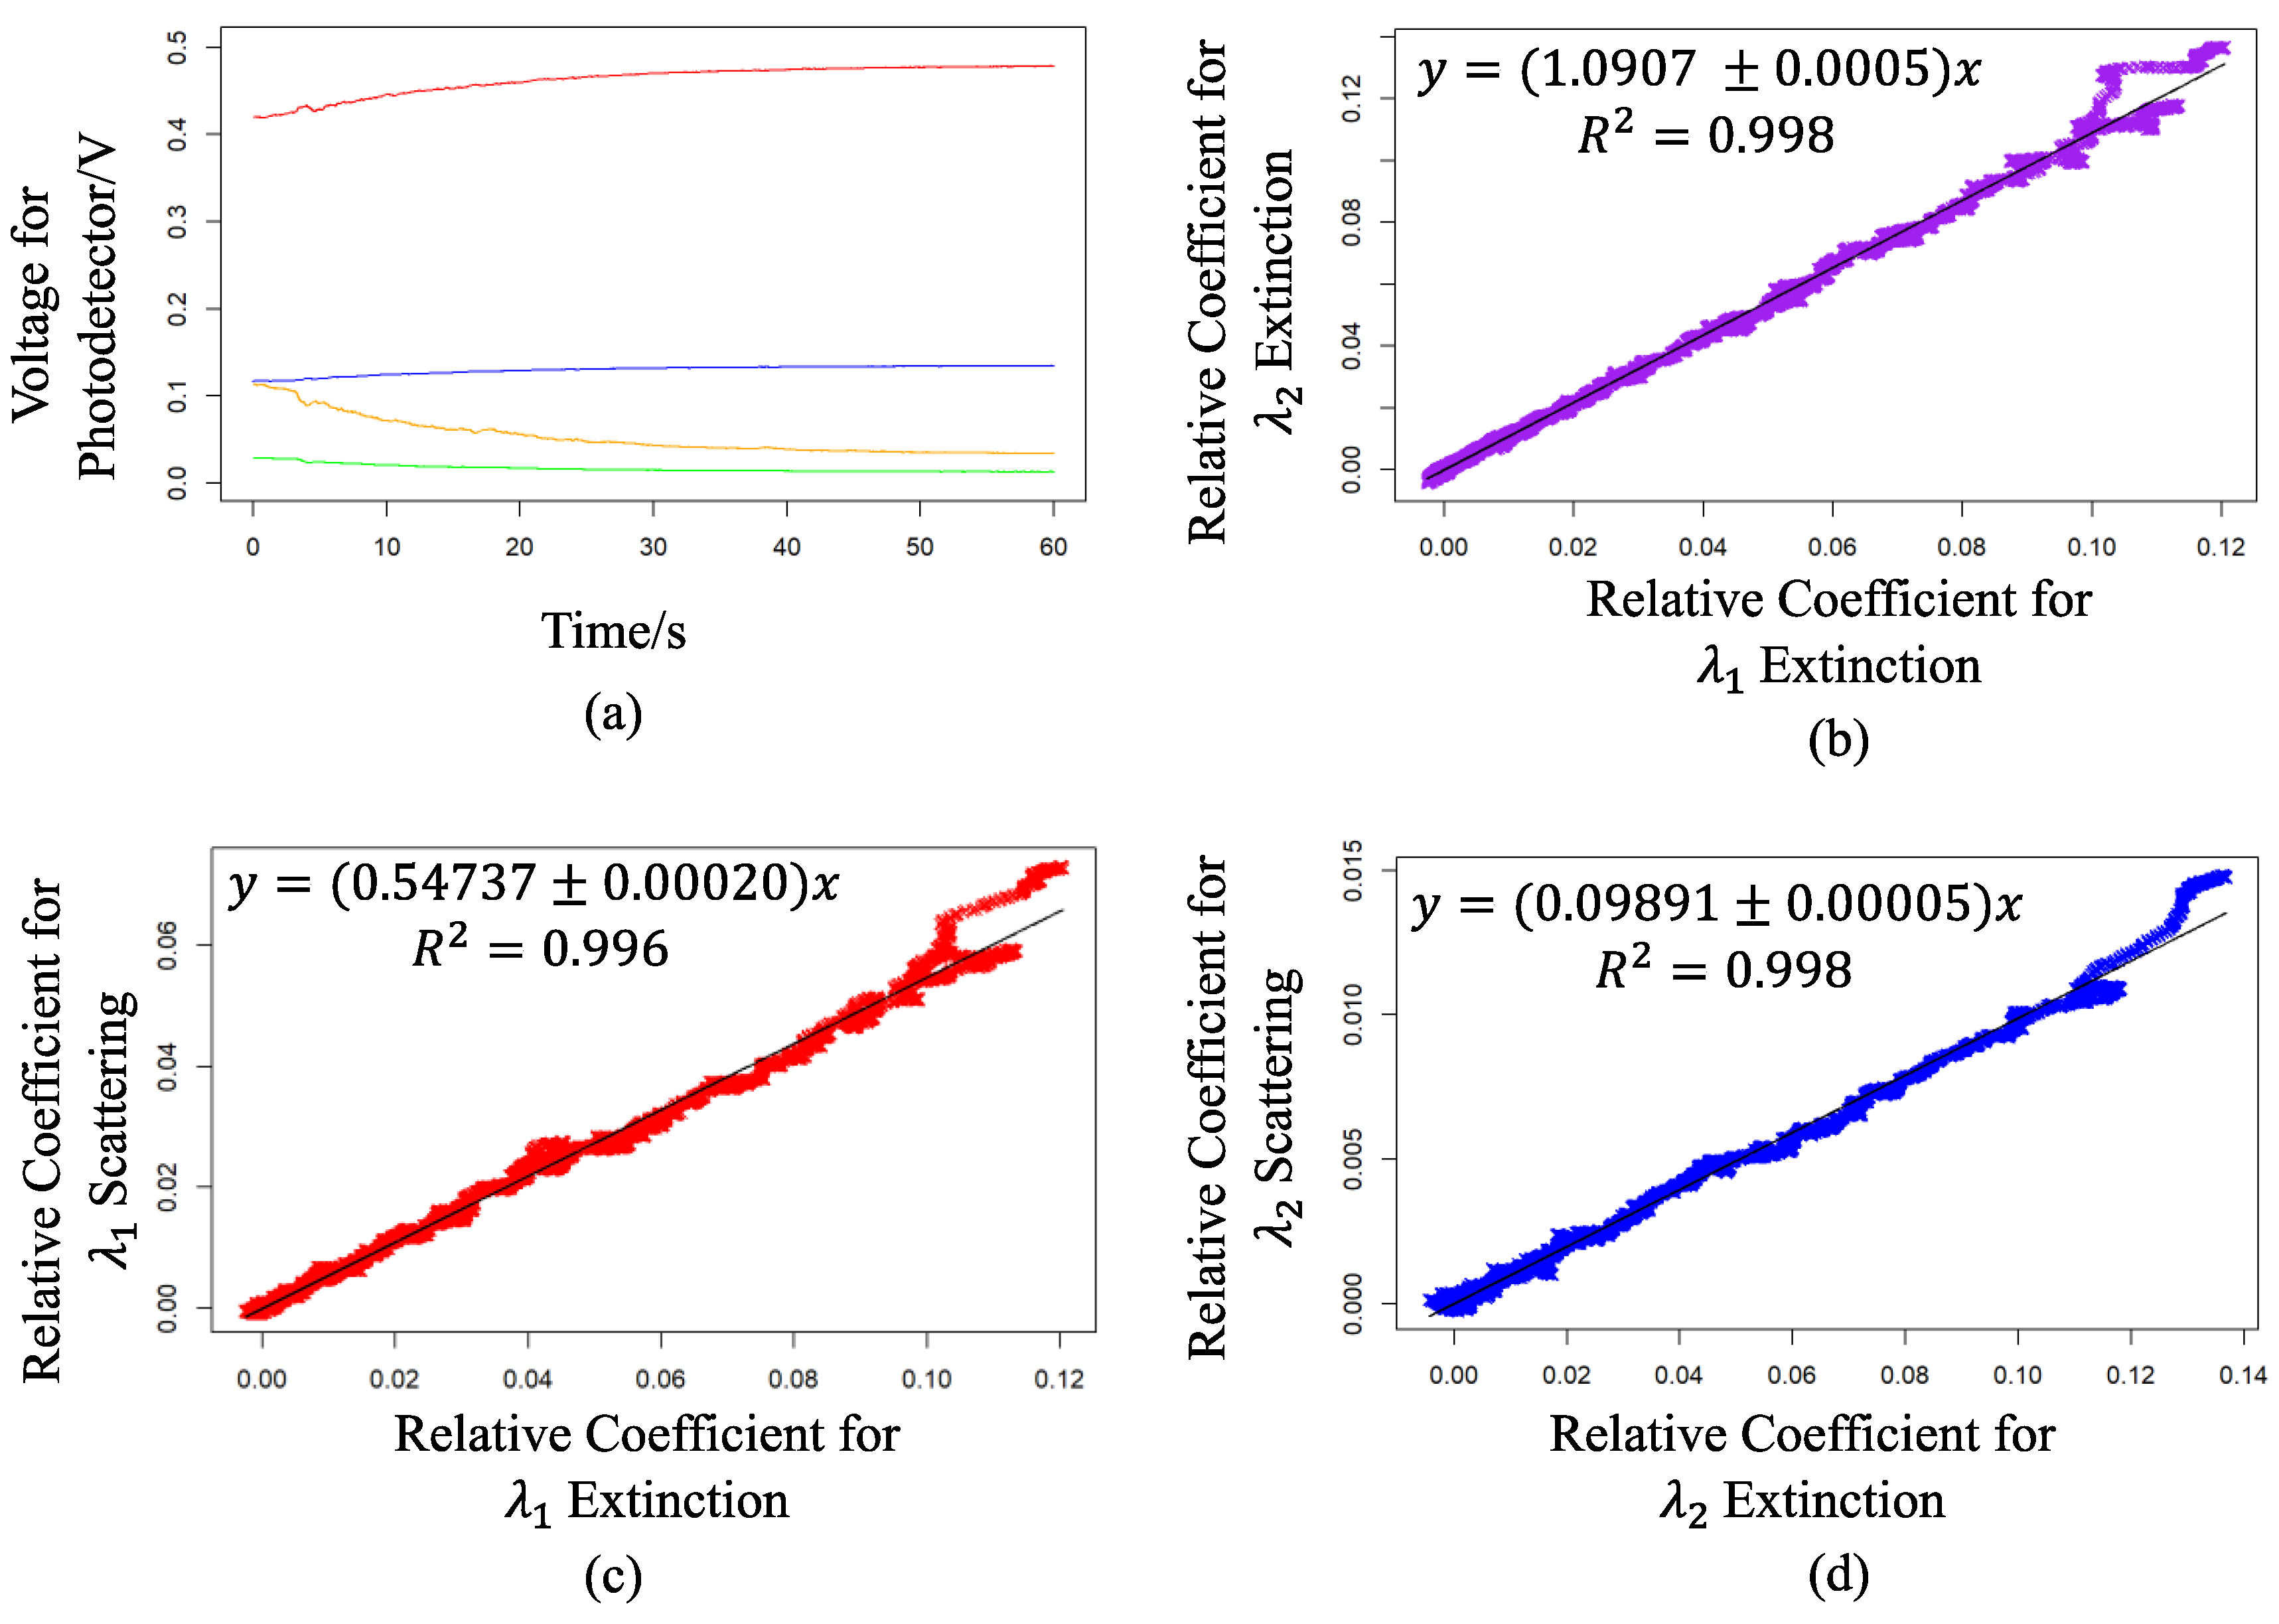
Figure 11 presents an example of the results obtained during an angle determination test with the dust settled at a scattering angle of 90° for both wavelengths. Unlike Figure 9 and Figure 10, the design of the experimental device cannot increase the dust concentration linearly and can only be completed by reversing the timing sequence. Figure 11 shows that the dust reached the highest value at the beginning of the test. The ventilation system was then activated, the dust concentration gradually decreased, the scattering signals also weakened, and the extinction signals gradually strengthened back to the initial value when there were no particles. According to Figure 11b–d, the calculated results of coefficients for , for , and are 0.54737 ± 0.00020, 0.09891 ± 0.00005, and 1.0907 ± 0.0005, respectively.

Figure 11.
Received signals and calculated coefficients of dust at 90°. The red and yellow lines in Figure 11a are the extinction and scattering signals of , respectively, and the blue and green lines are the extinction and scattering signals of , respectively.
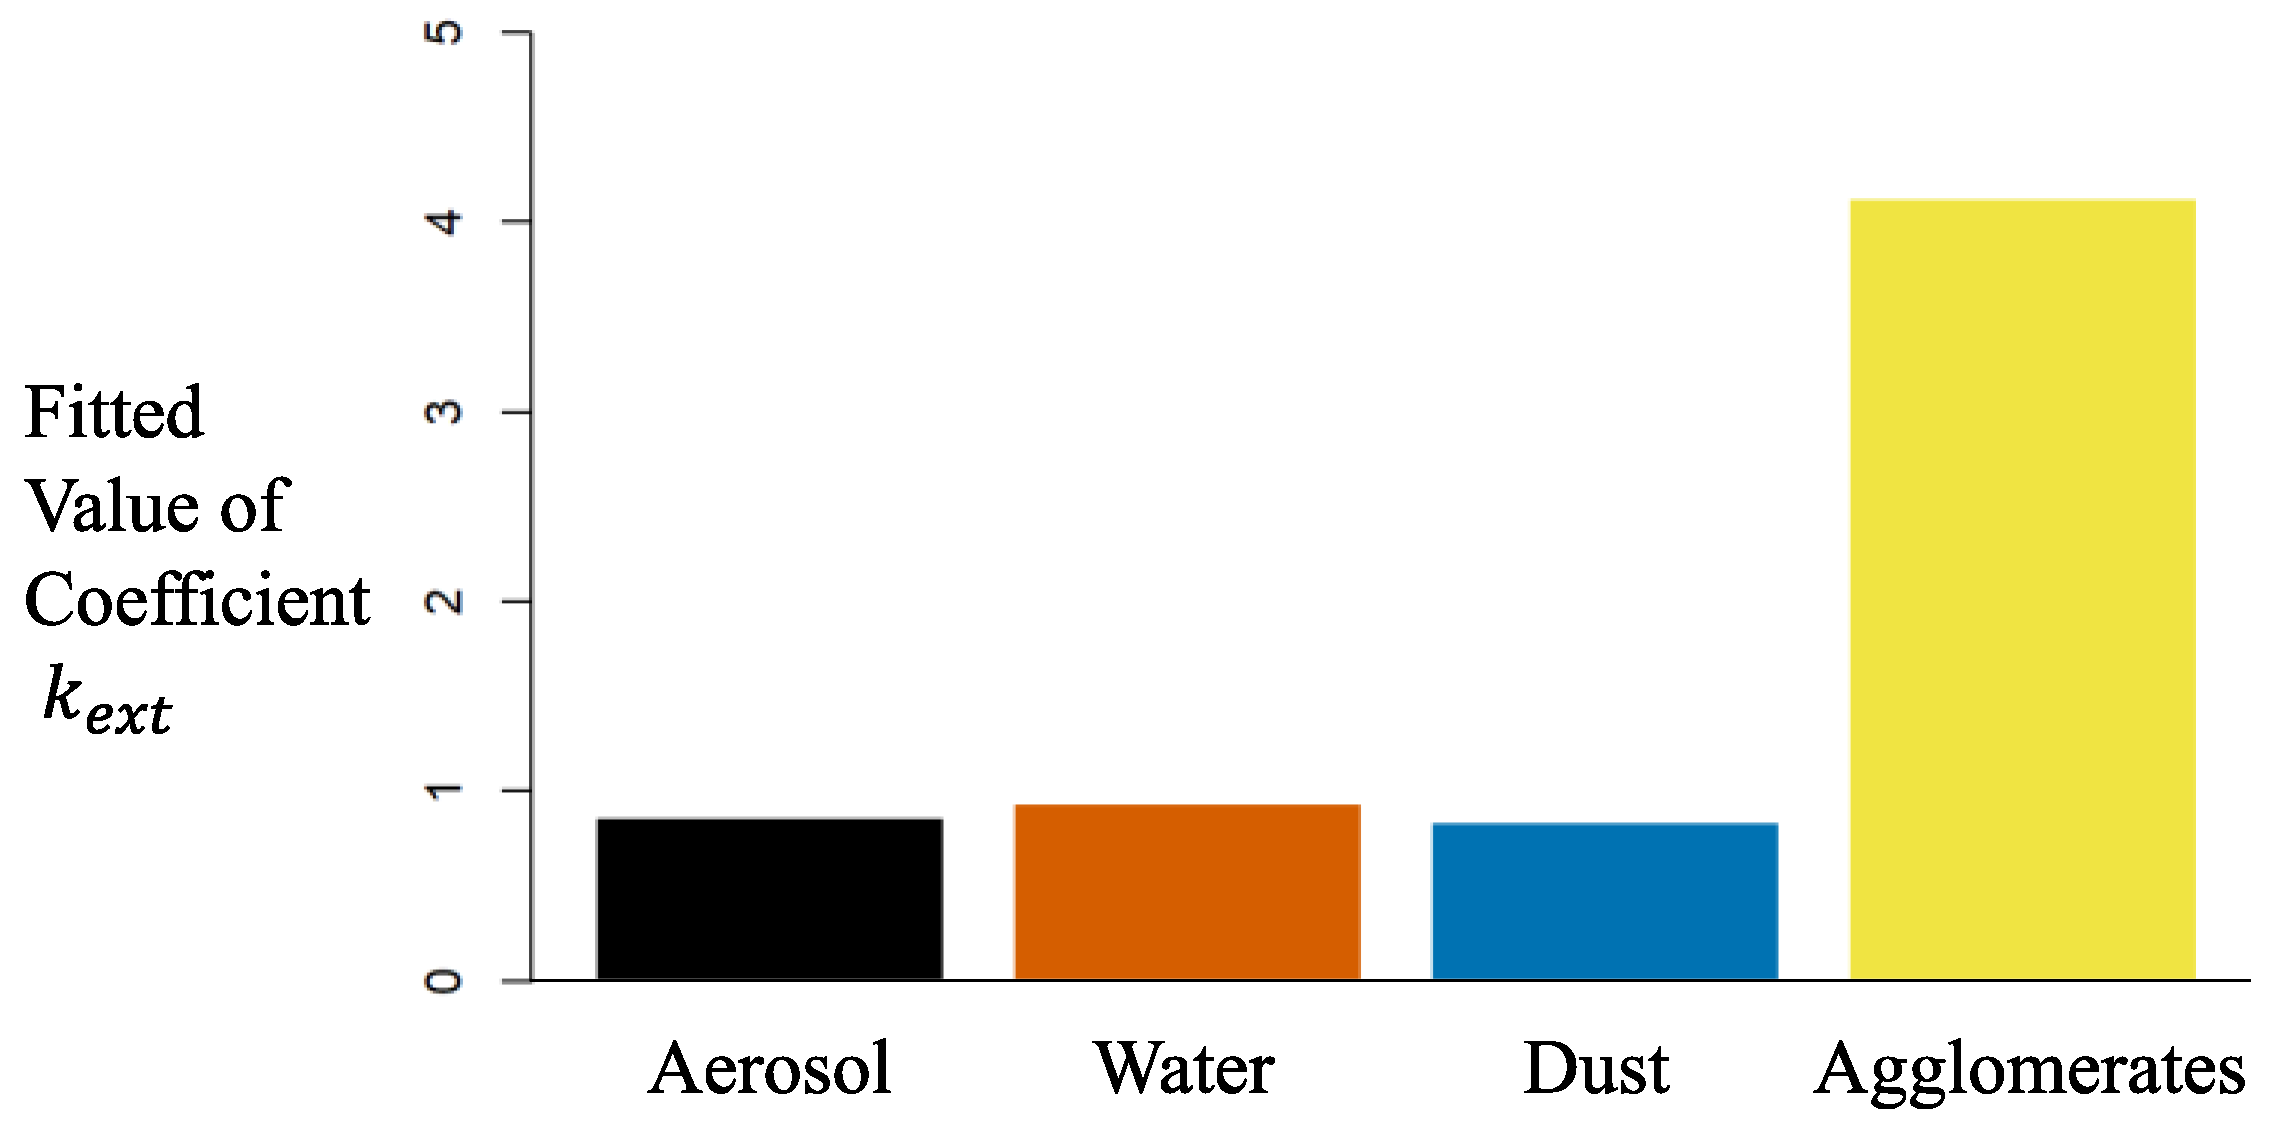
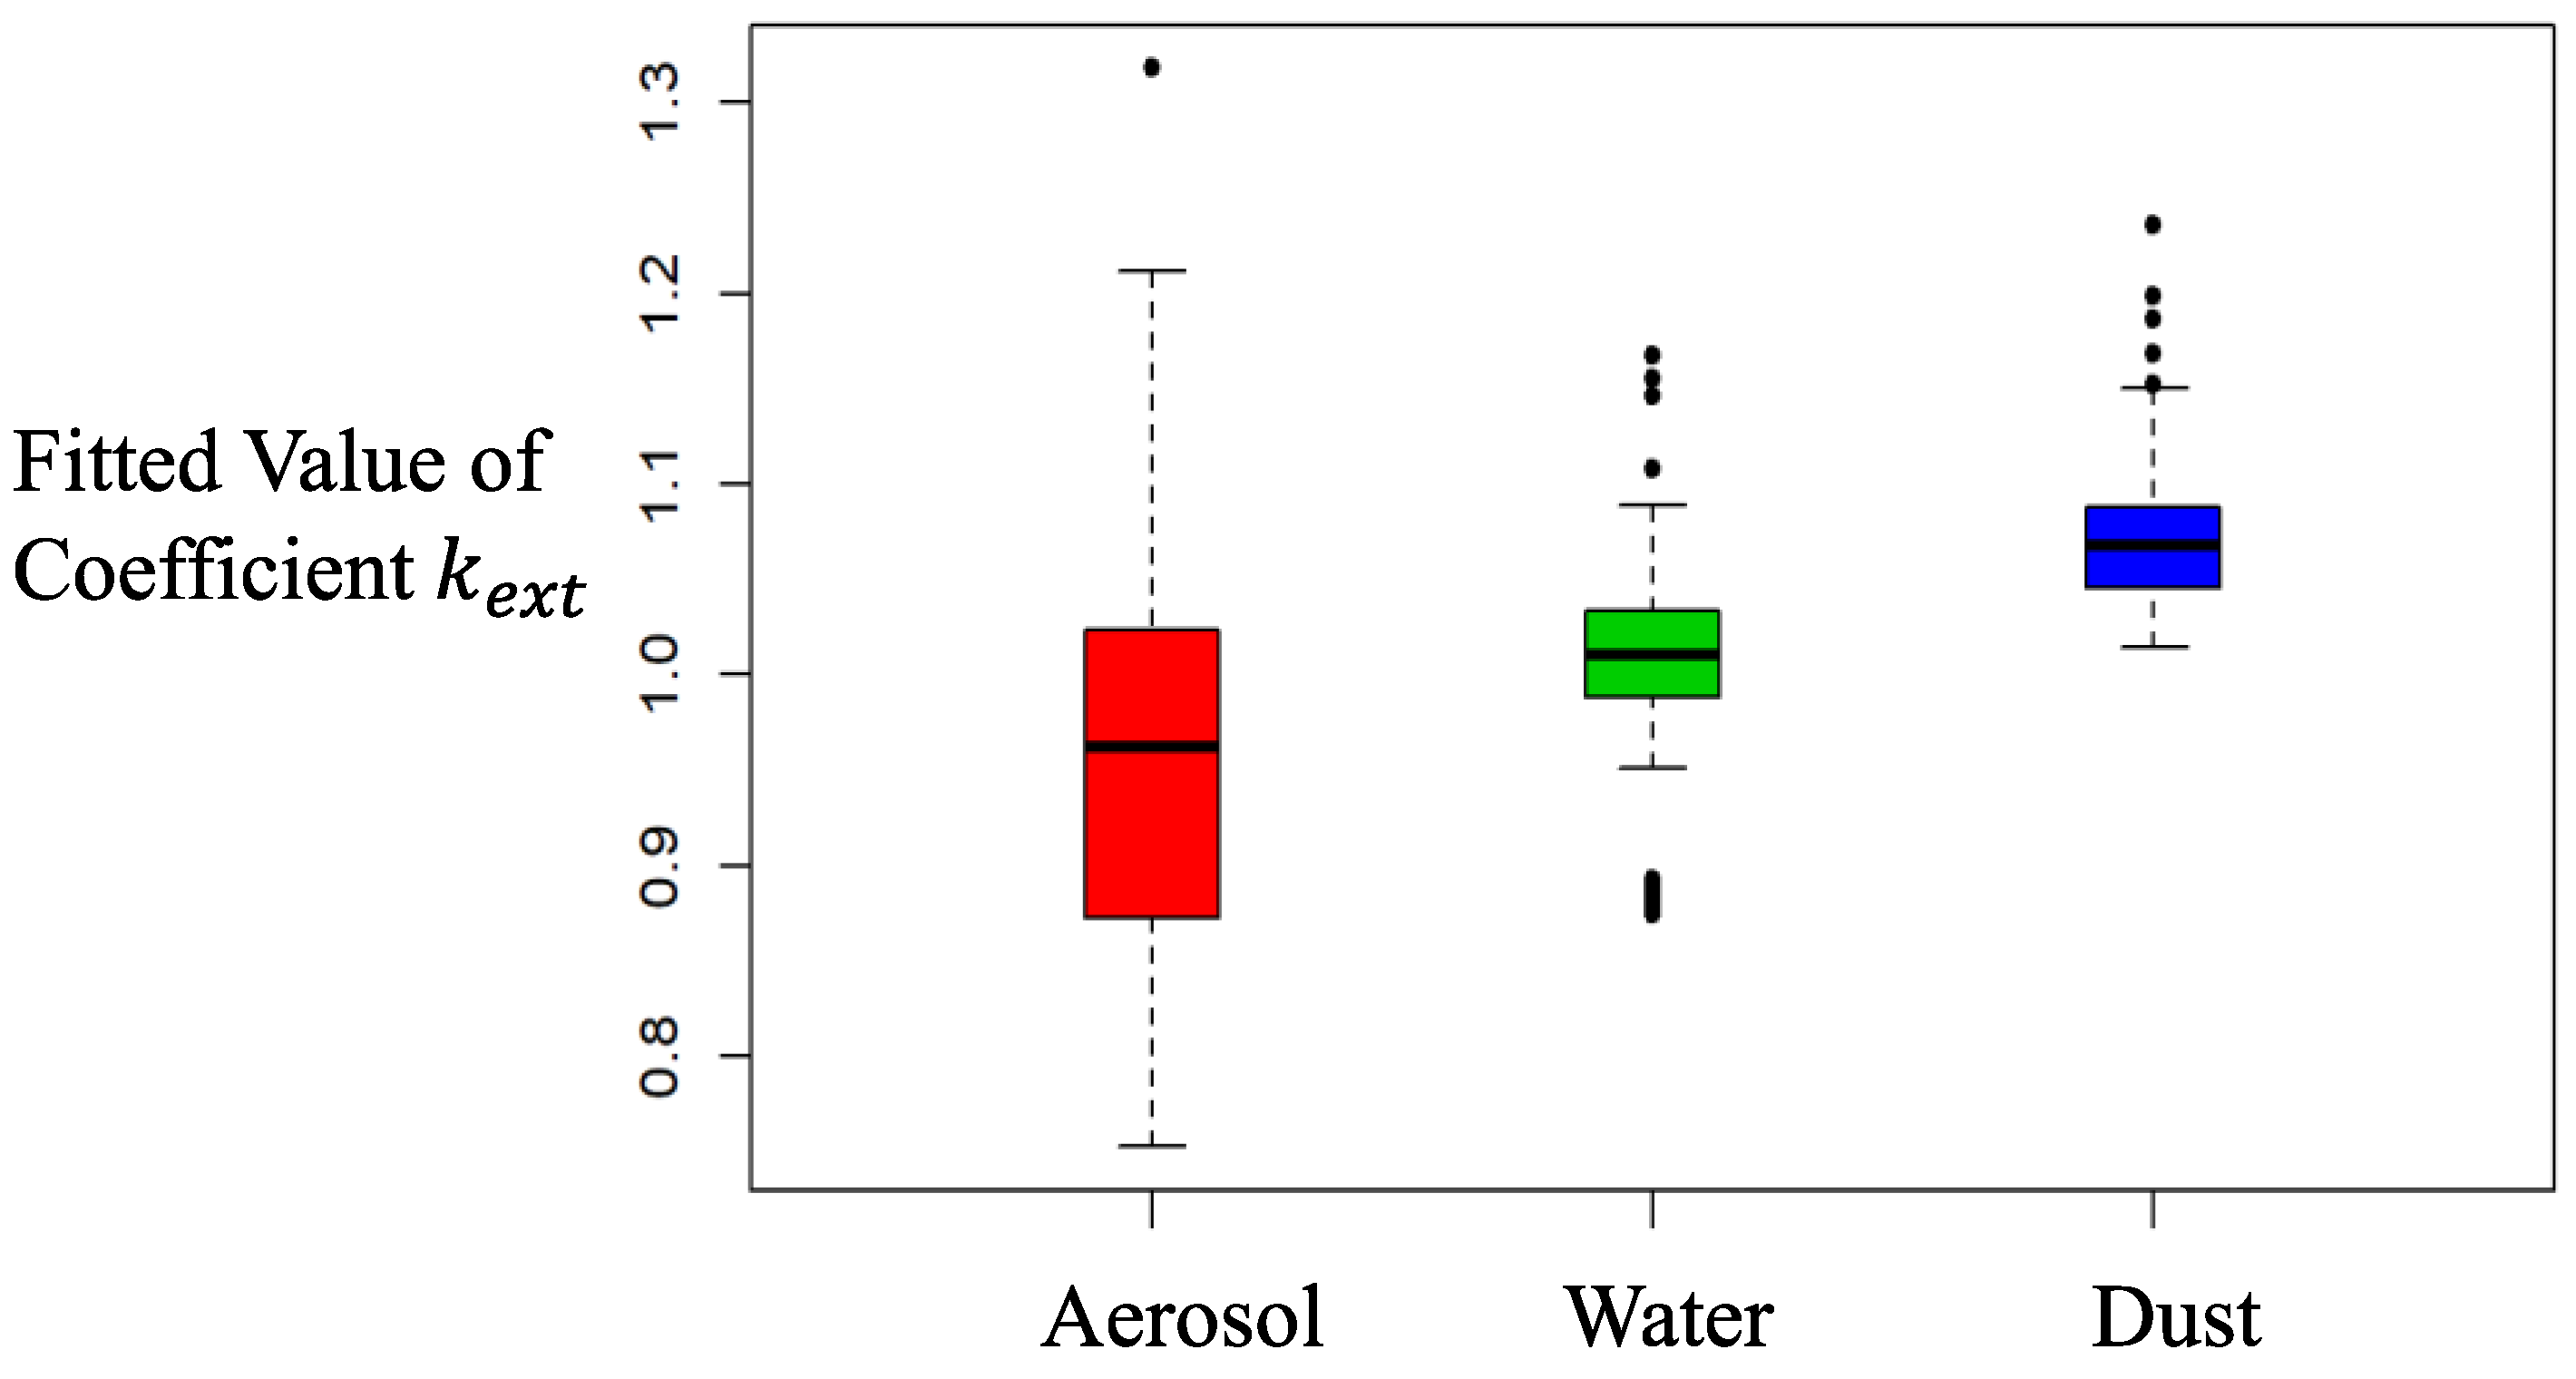
Figure 12 shows the experimental coefficients of extinction of three different particles for over . The ratios of these particles are very close to each other, as shown in the simulation results in Figure 7, and the significant uncertainty of the ratios cannot be neglected due to measurement errors. The results appear to demonstrate that this extinction detection has inadequate discrimination of aerosols, fine water droplets, and dust. It might be reasonable to suppose that distinguishing the above particles by relying only on extinction is not practical. The results suggest that could be used as an auxiliary fire judgment.
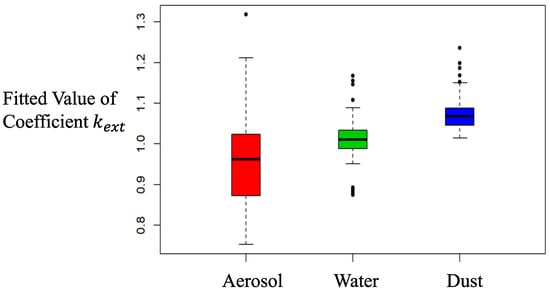
Figure 12.
Comparison of coefficients of extinction between three measured particles.
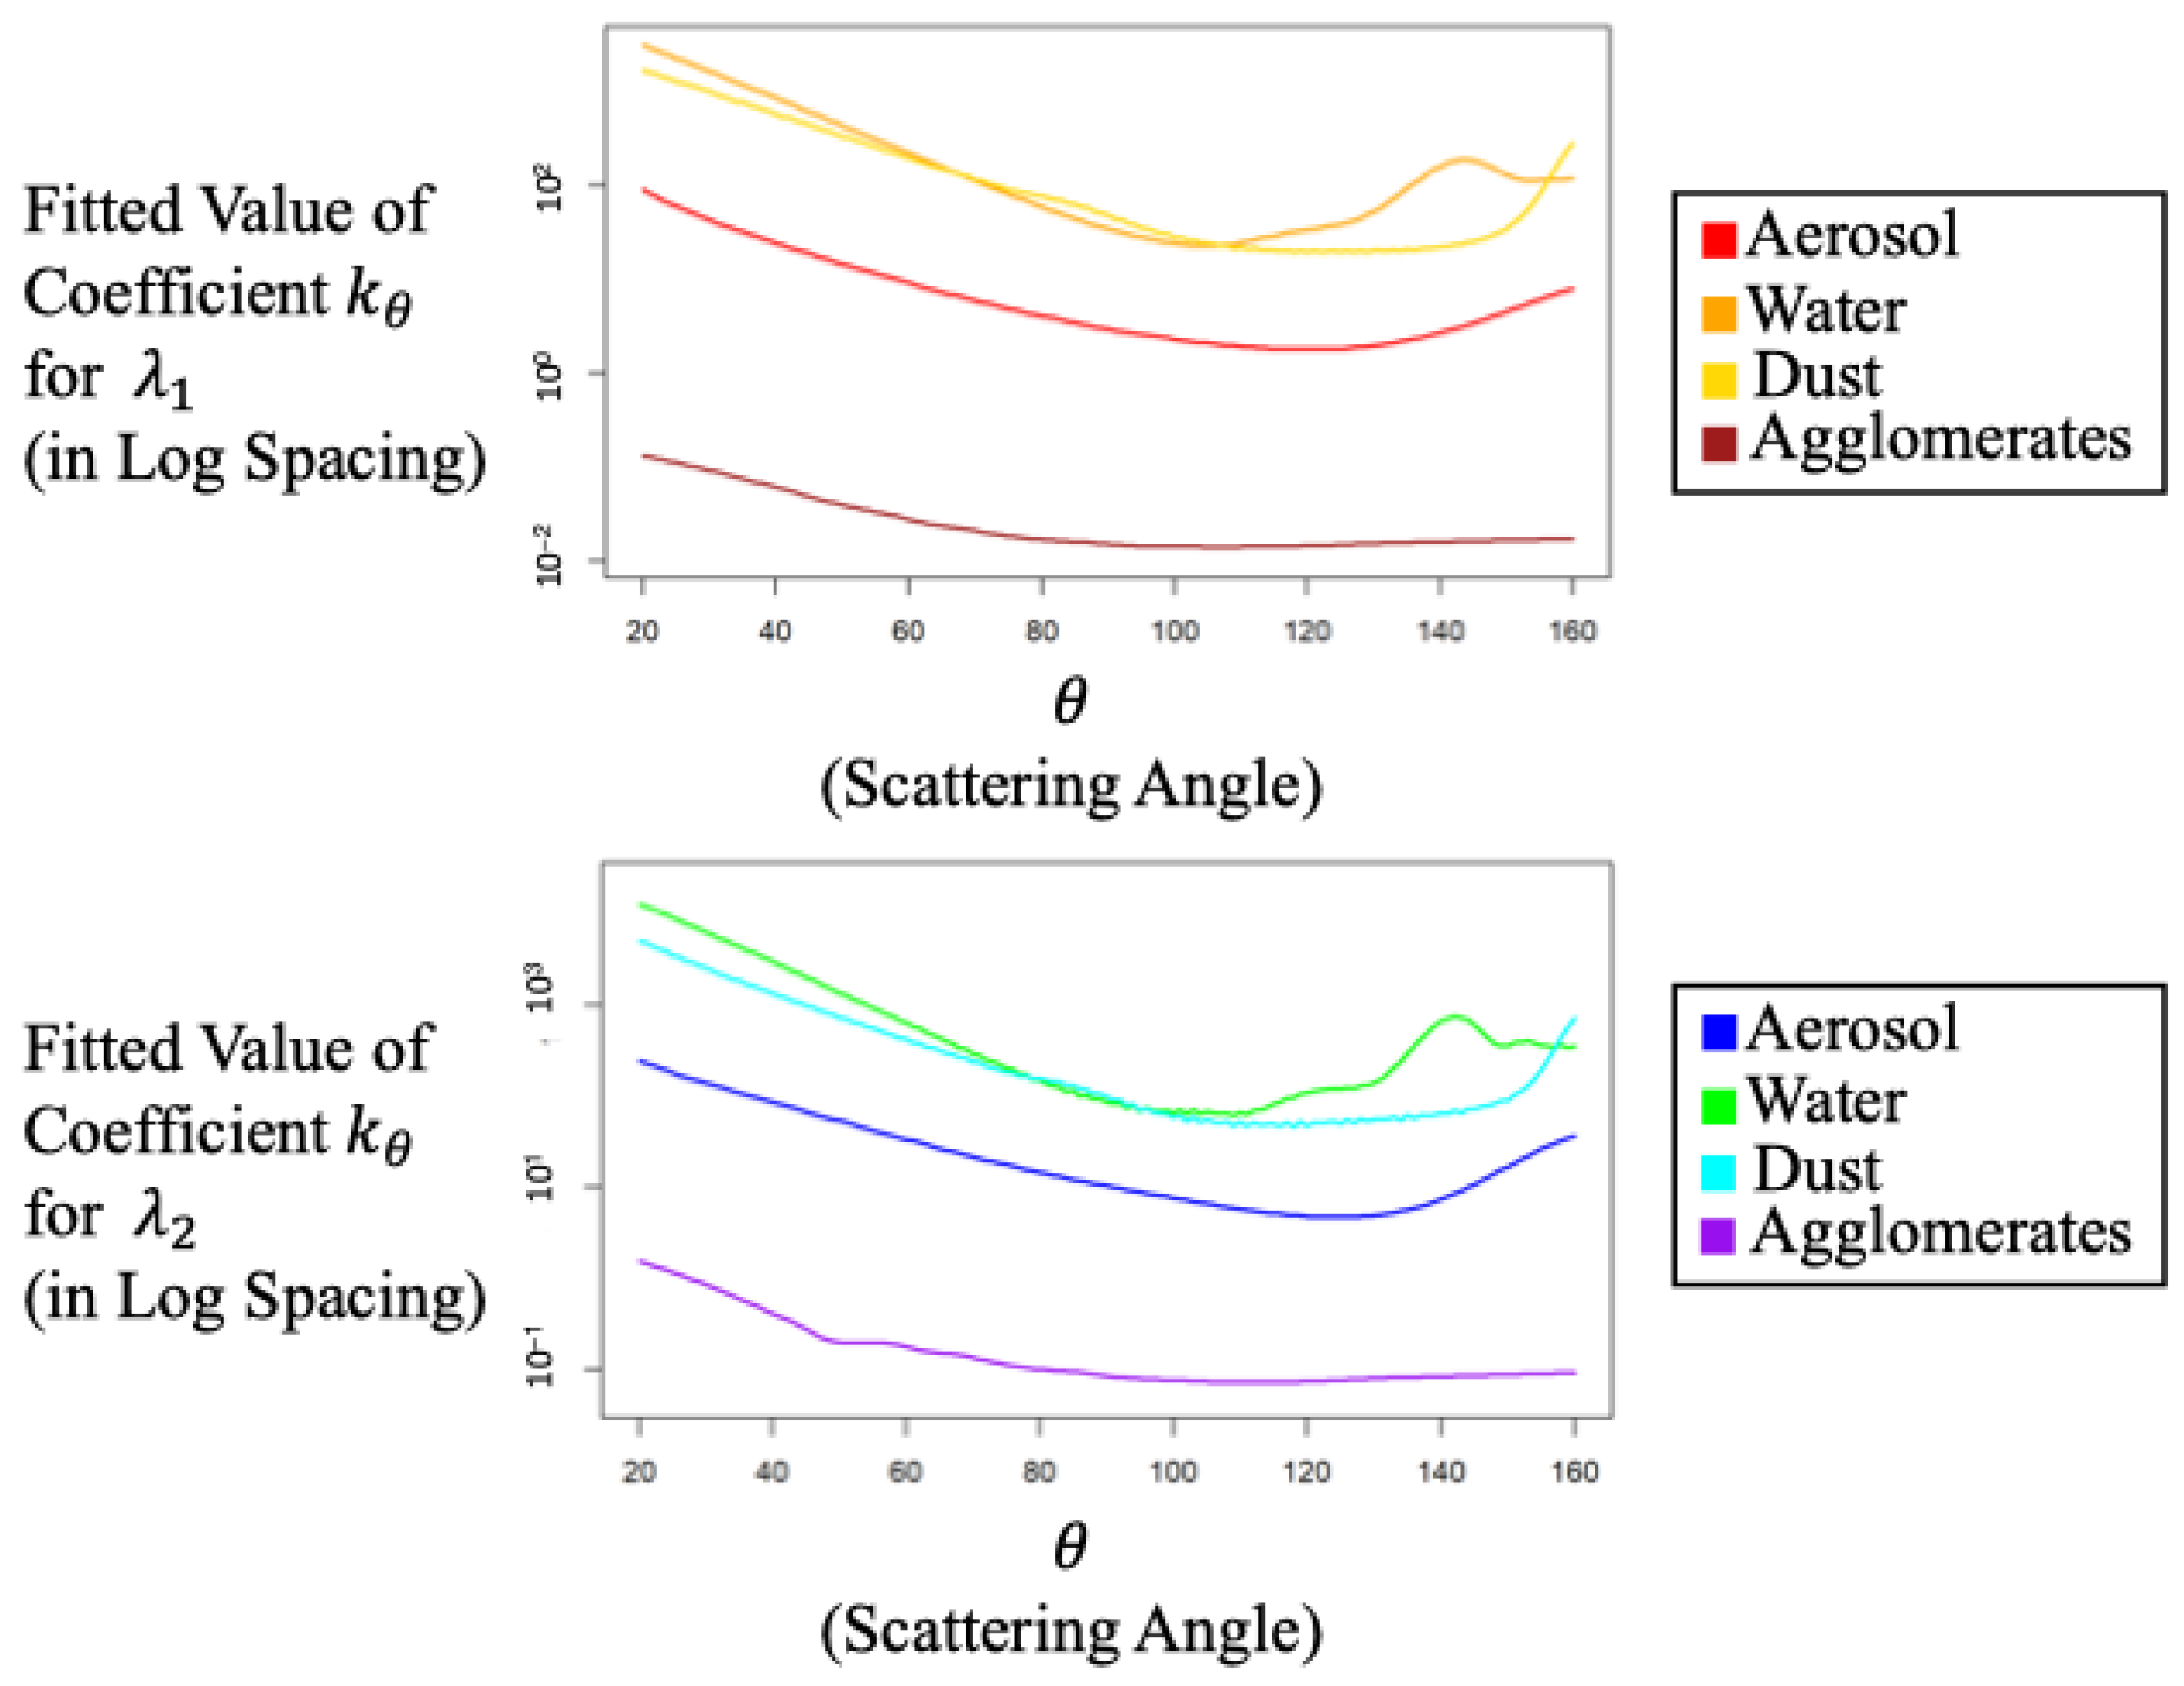
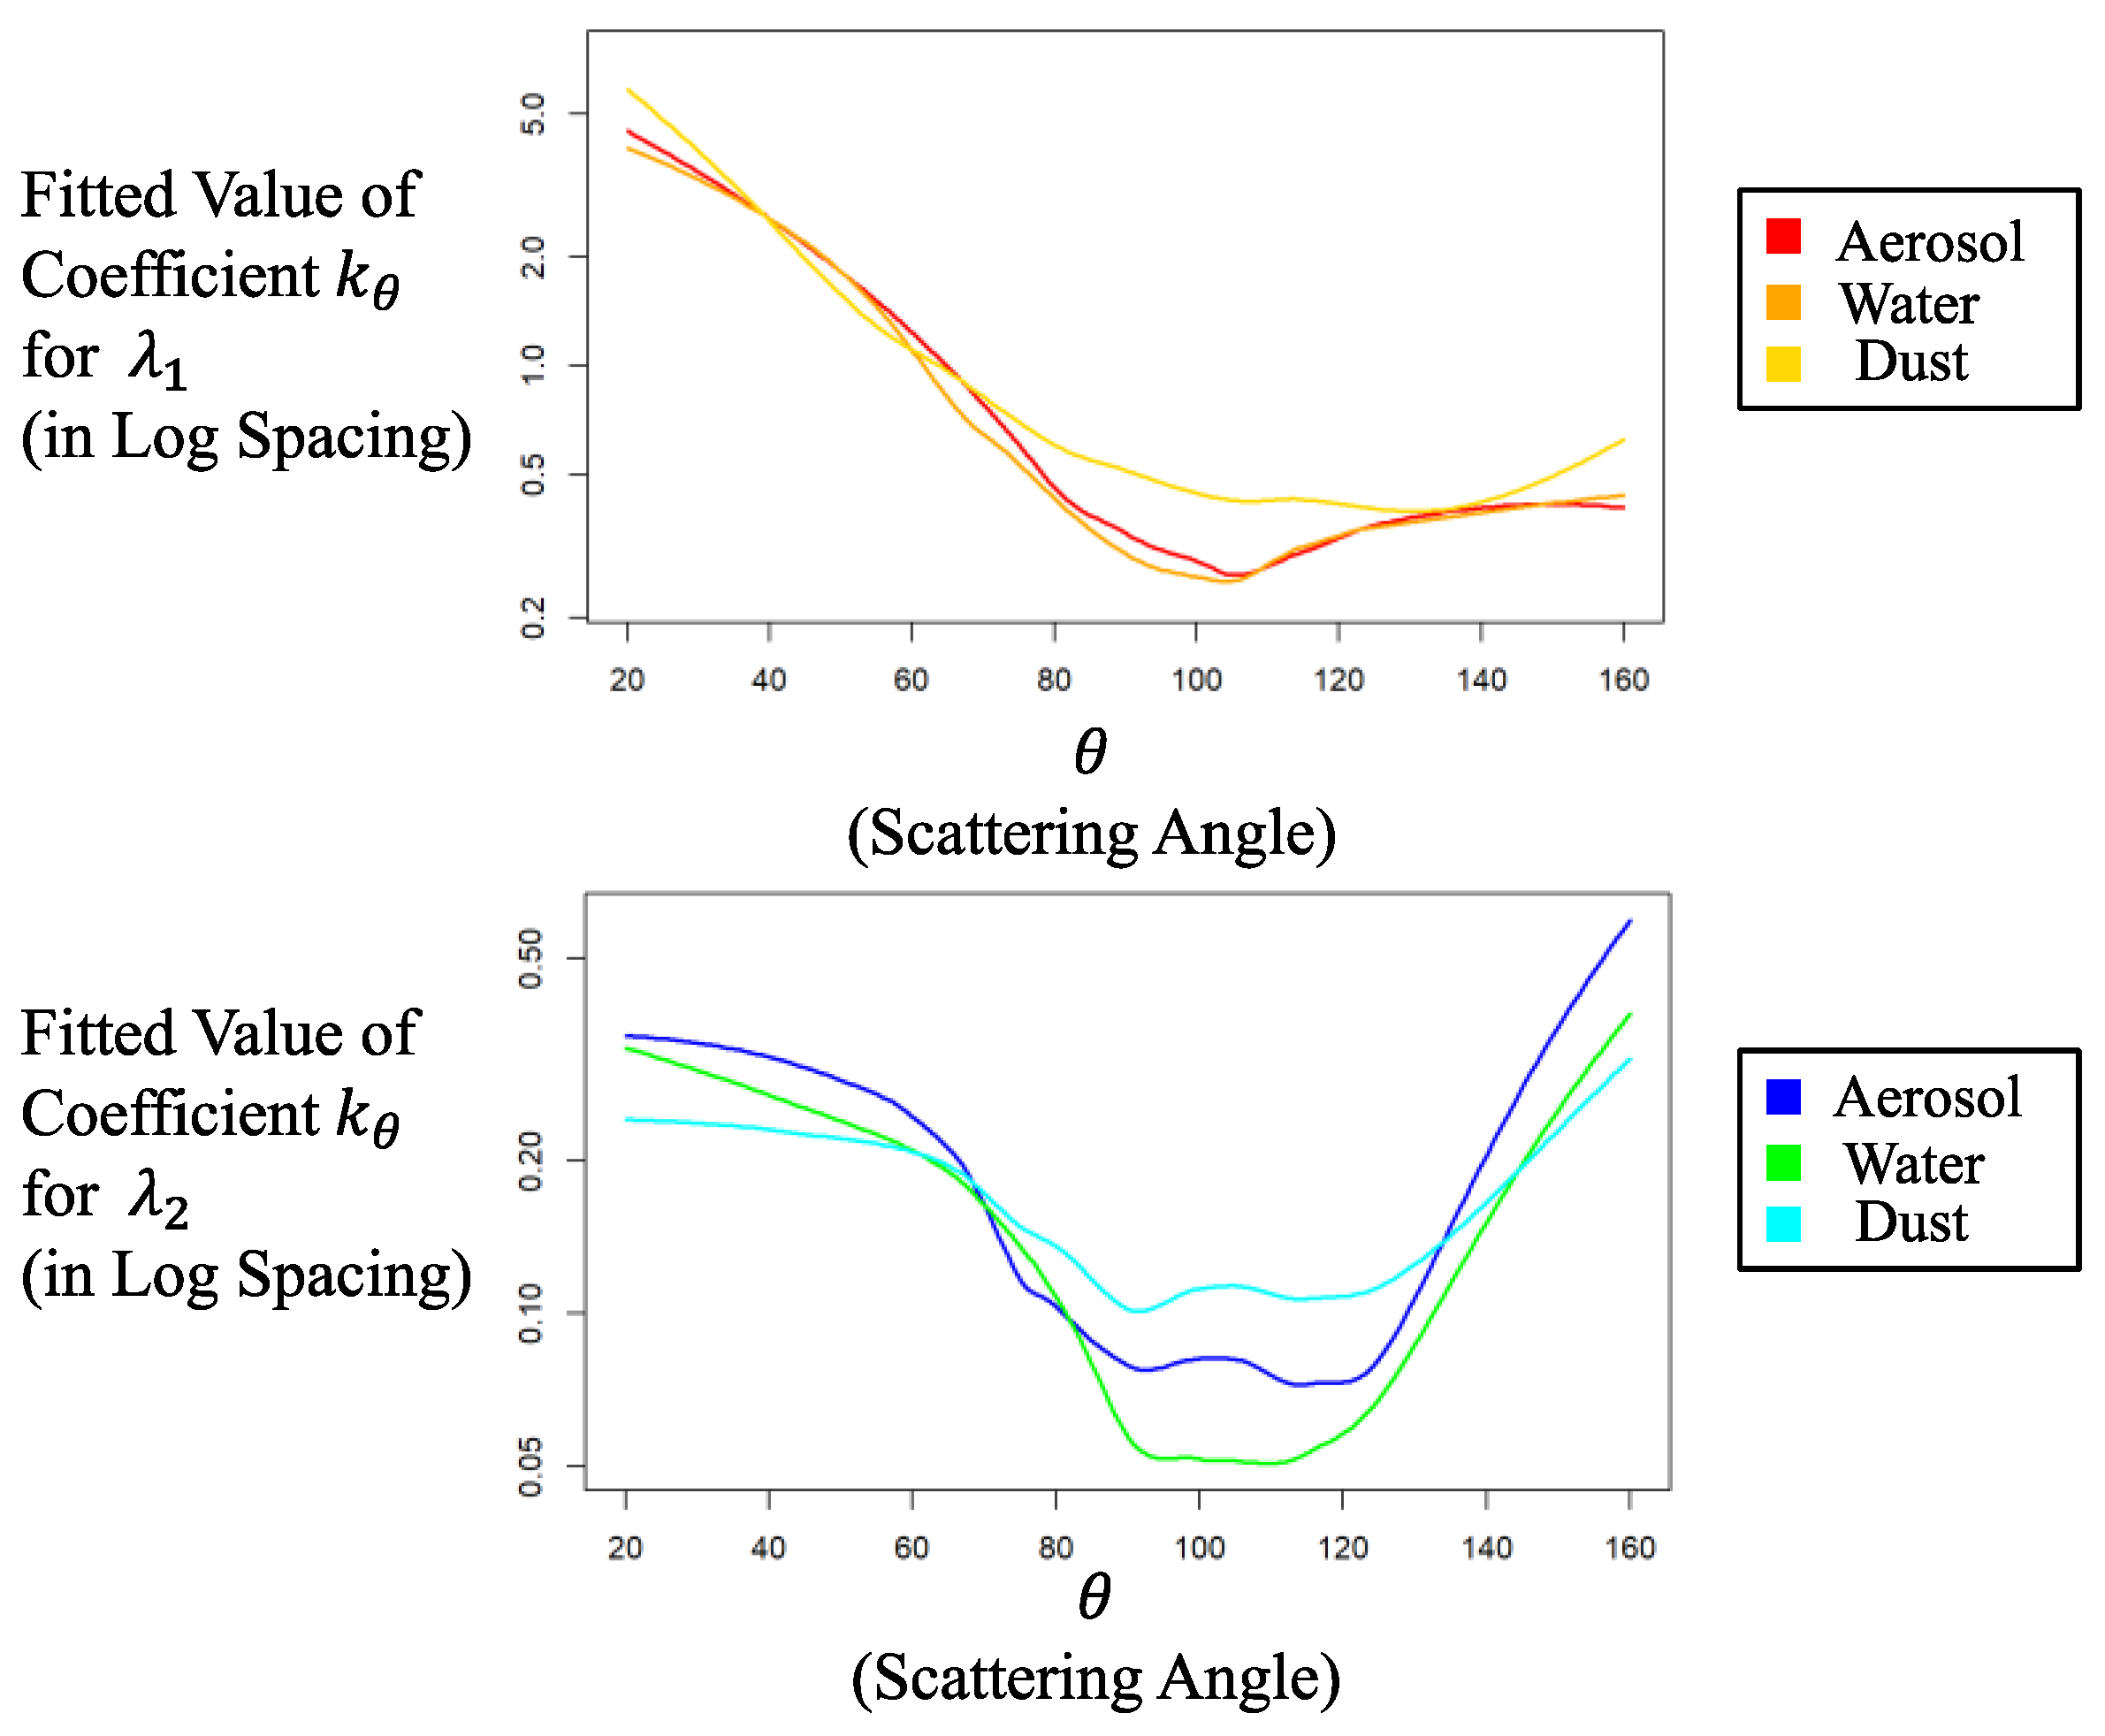
Figure 13 provides the of the four types of particles in log spacing for both wavelengths. It is noted that since the LED’s emission efficiency and the photodetector’s receiving efficiency are different between the two wavelengths, only the relative magnitude can be compared here rather than the absolute value. For , since its wavelength is close to the size of these particles, the scattering properties vary with the angle and are not as symmetrical as , which has a relatively shorter wavelength. Compared with the simulation results shown in Figure 8, it seems that the discriminations are not as clear due to experimental error.
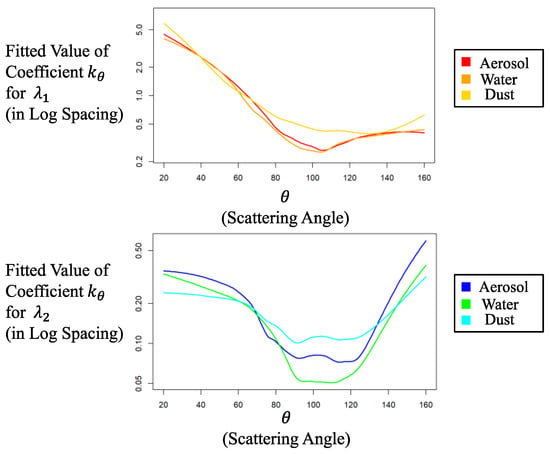
Figure 13.
Angular distribution of measured coefficients of scattering over extinction for both wavelengths.
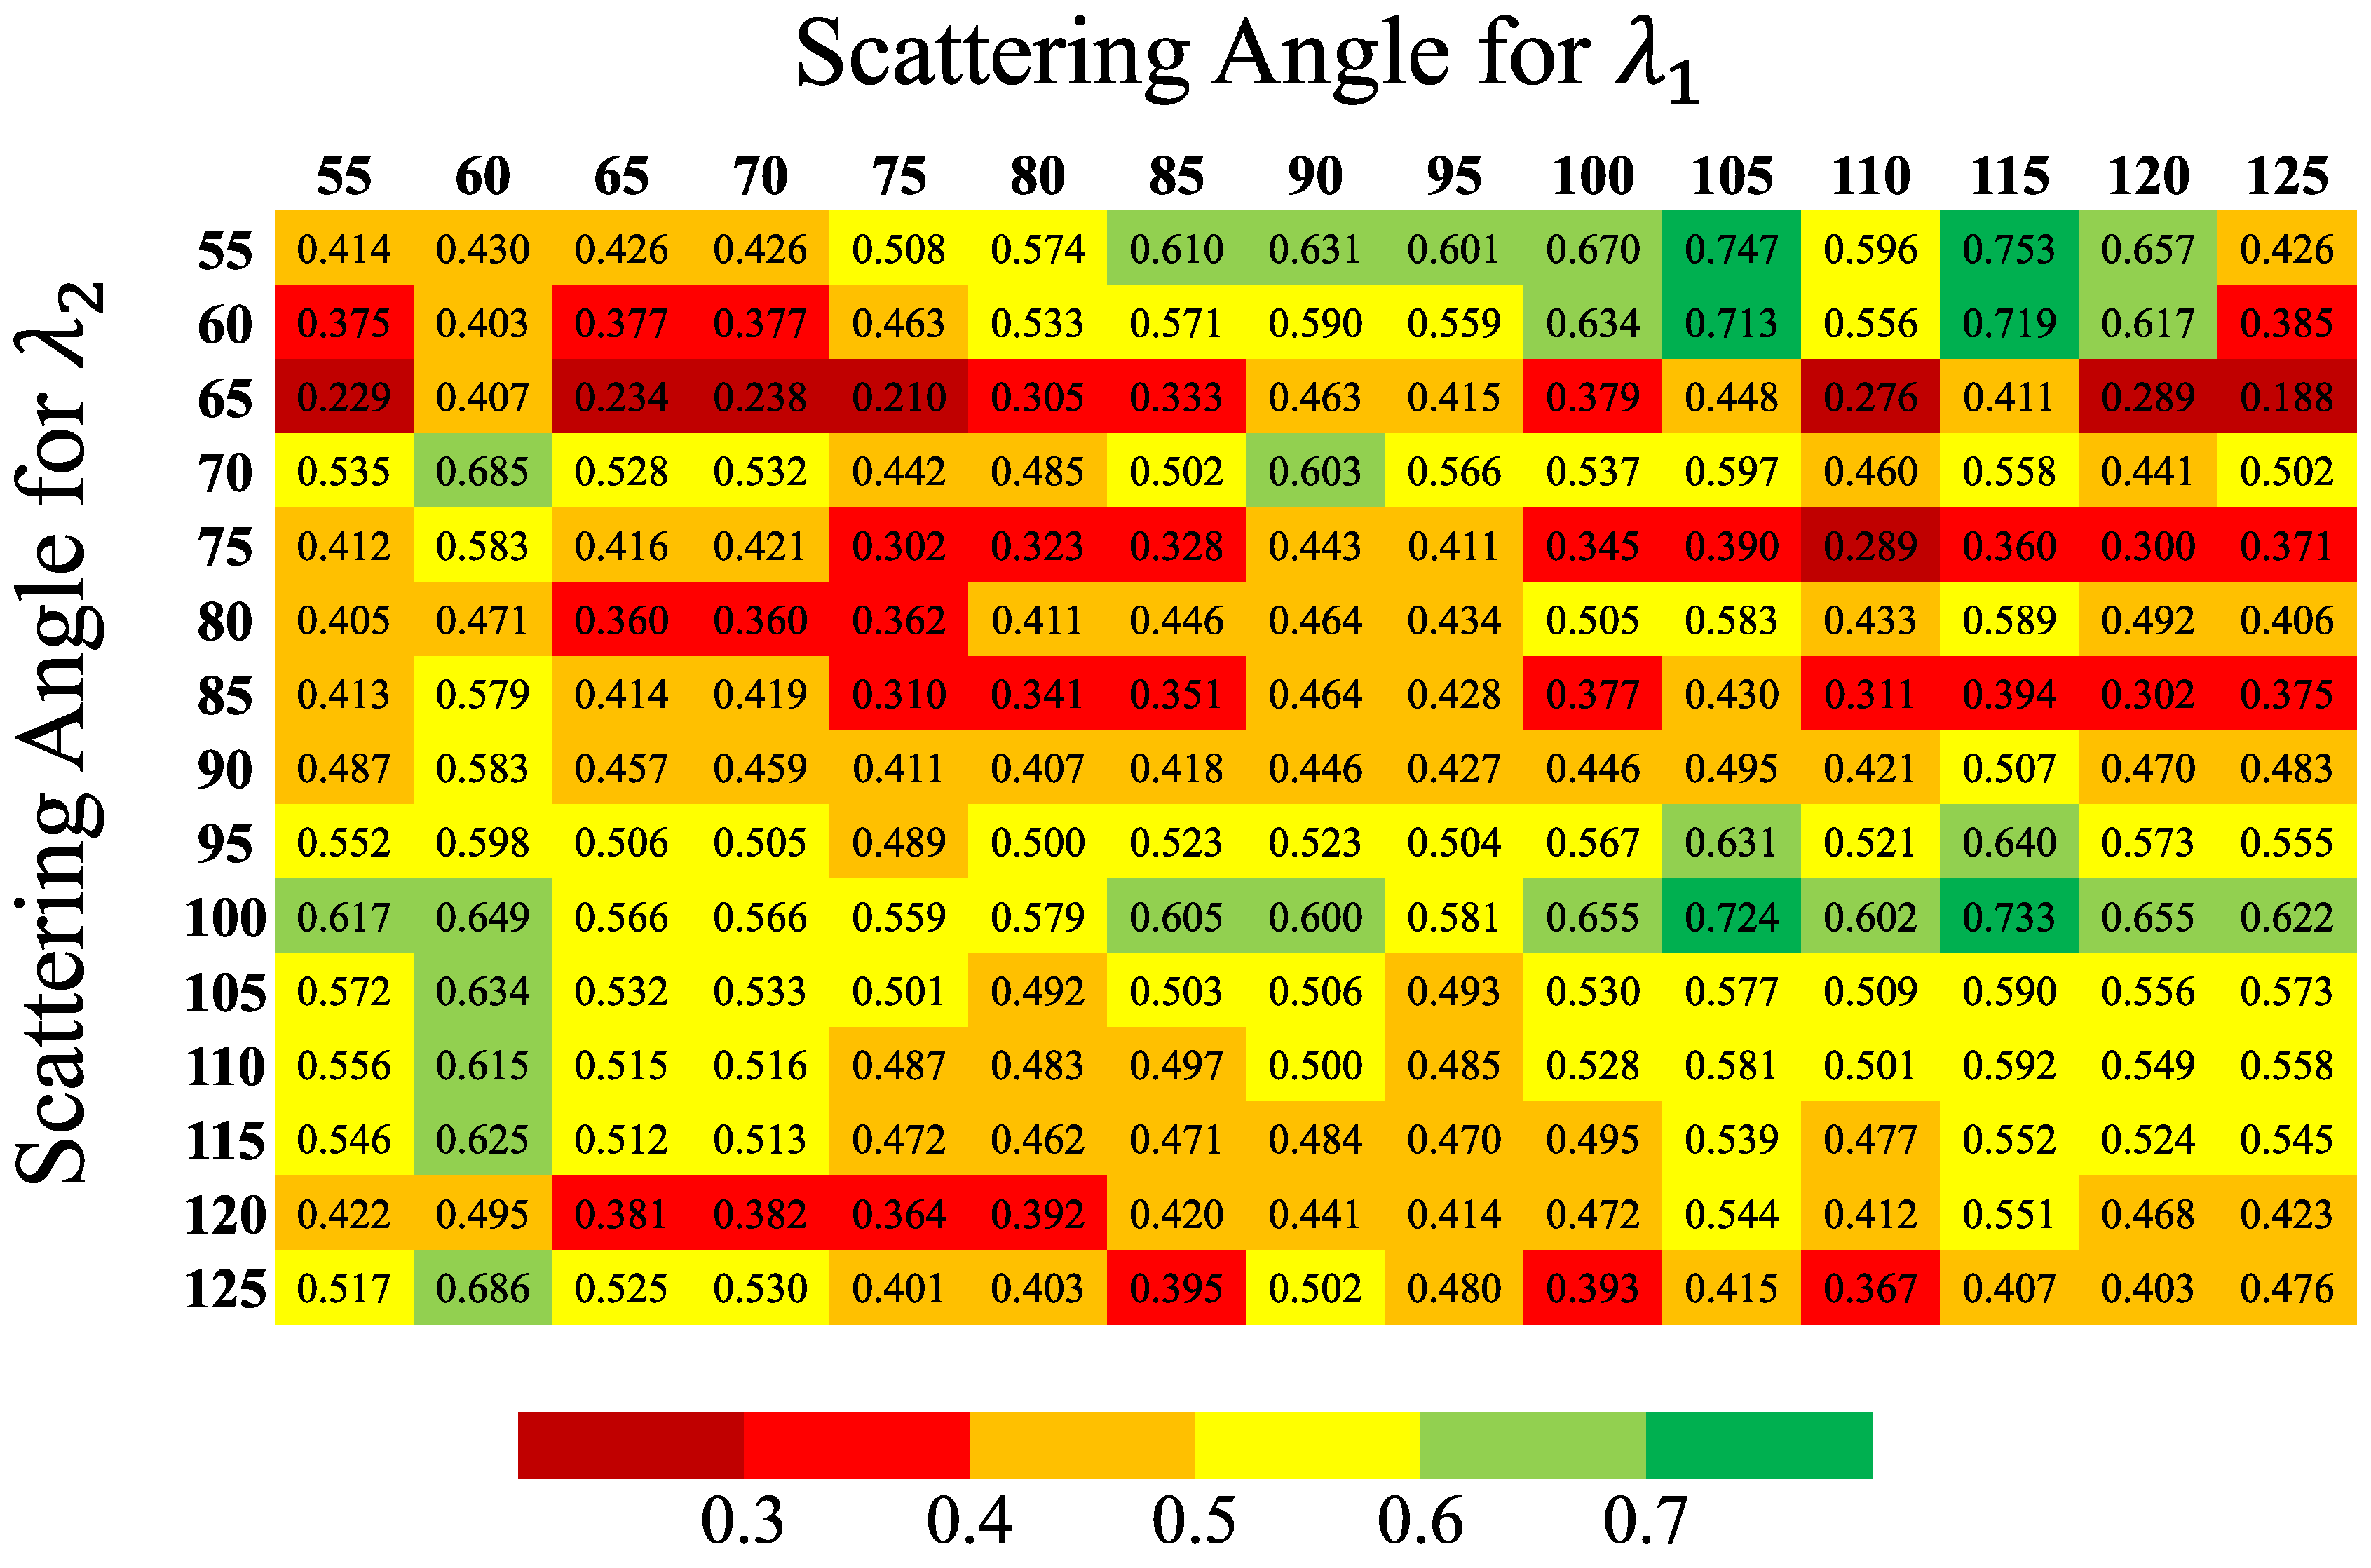
Relying solely on scattering or extinction is ineffective in distinguishing different particles. It is therefore necessary to combine scattering and extinction to detect these particles. In order to obtain the optimal scattering detection angles, the Euclidean distance of the four coefficients of each angle combination (, , , and ) between two particles for an arbitrary scattering angle combination were calculated. The average Euclidean distance between the three particles was then shown in Figure 14. The larger the Euclidean distance, the stronger the ability of this scattering detection angle to distinguish particles. The red grid indicates poor discrimination ability, while the dark green grid indicates strong discrimination ability, which is also the optimal detection angle required by this research. According to these guidelines, scattering angles of 115° for and 60° for were selected as the scattering detection angles for the optimal DWSE detector. Although other dark green grids may also be suitable, they should not impact the efficacy of our method and process.
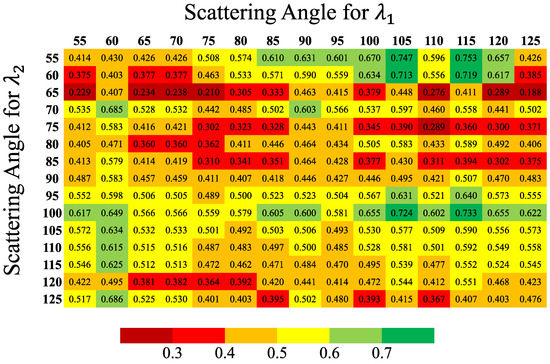
Figure 14.
Euclidean distance with four coefficients between different particles (in log value).
5. Verification Fire Tests of EN 54
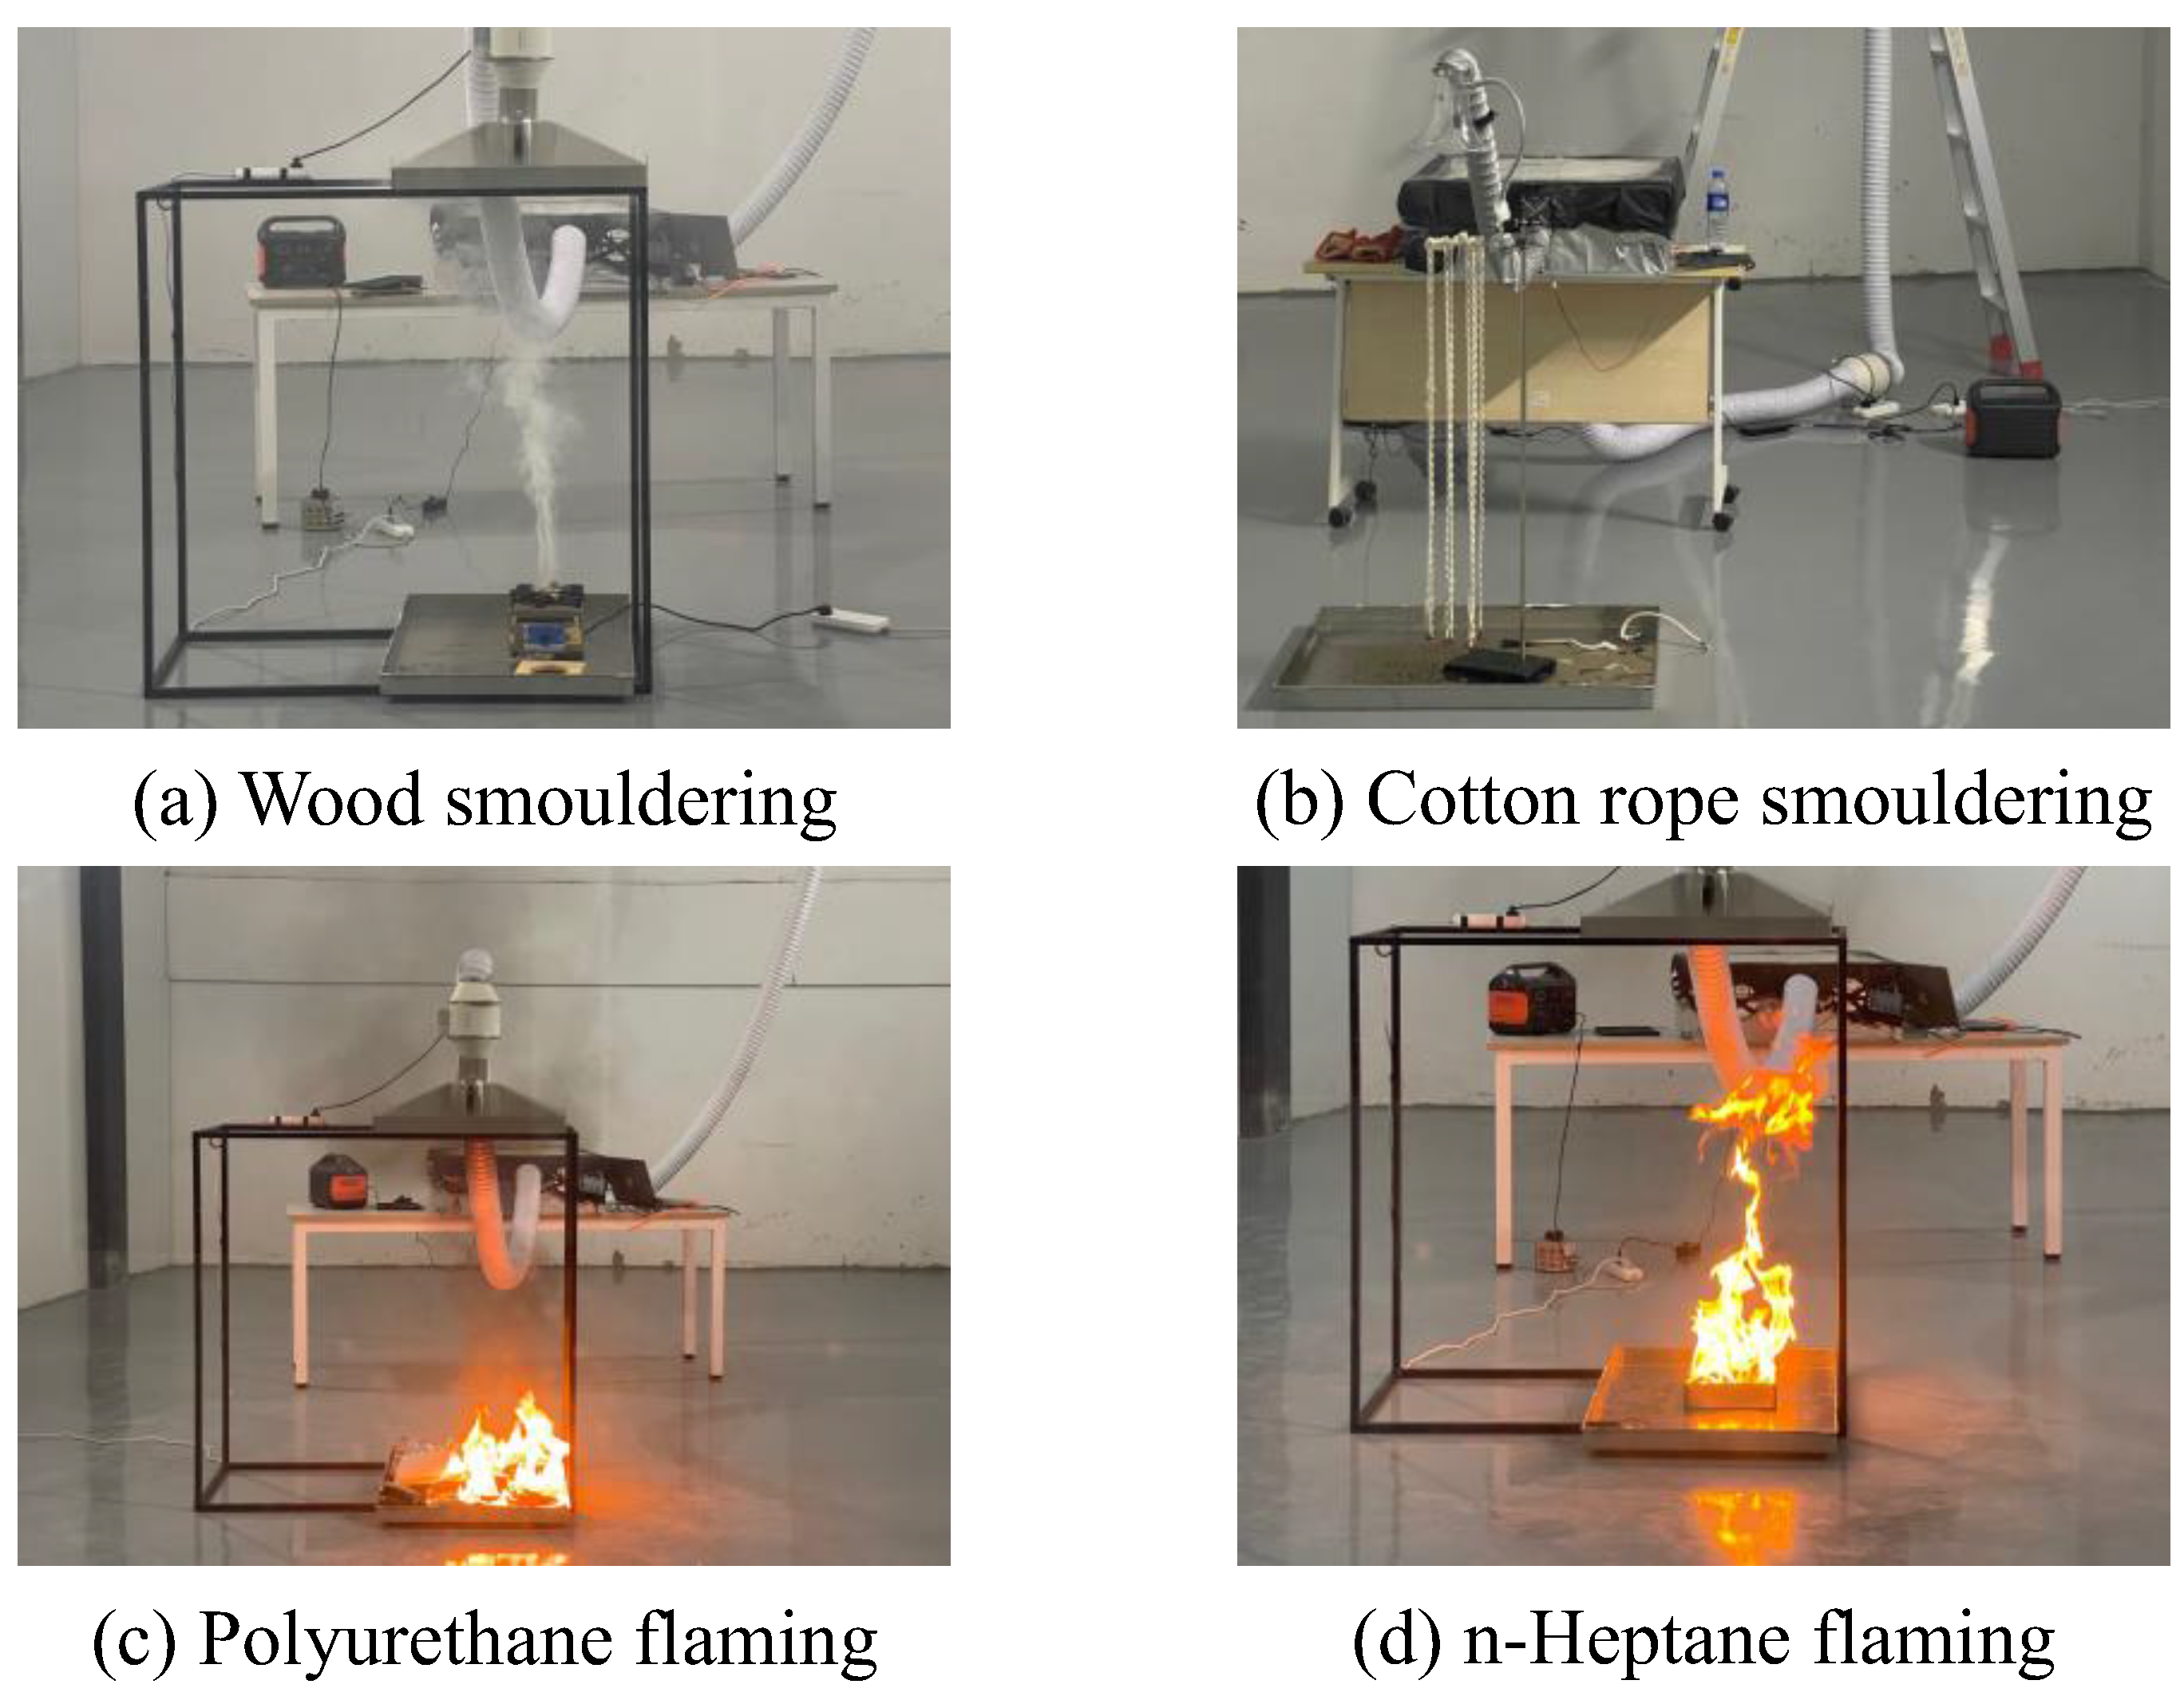
In order to verify if this optimal DWSE detector could detect fire accurately and reduce false alarms caused by fine water droplets and dust, four types of EN 54 fire tests, presented in Table 3, in a fire test chamber (10 m × 7 m × 4 m) were conducted with multiple times, as shown in Figure 15 [35,36].

Table 3.
Four types of EN54 test fires.
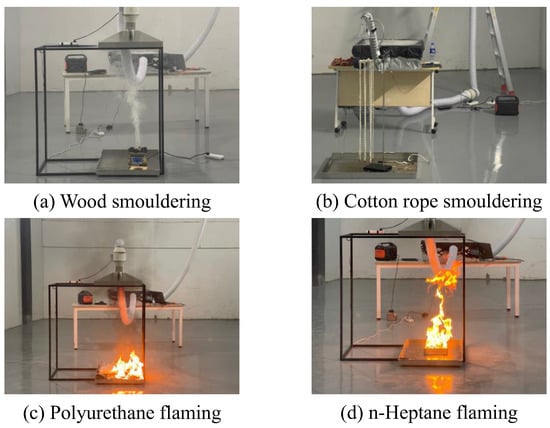
Figure 15.
Verification process in the fire test chamber.
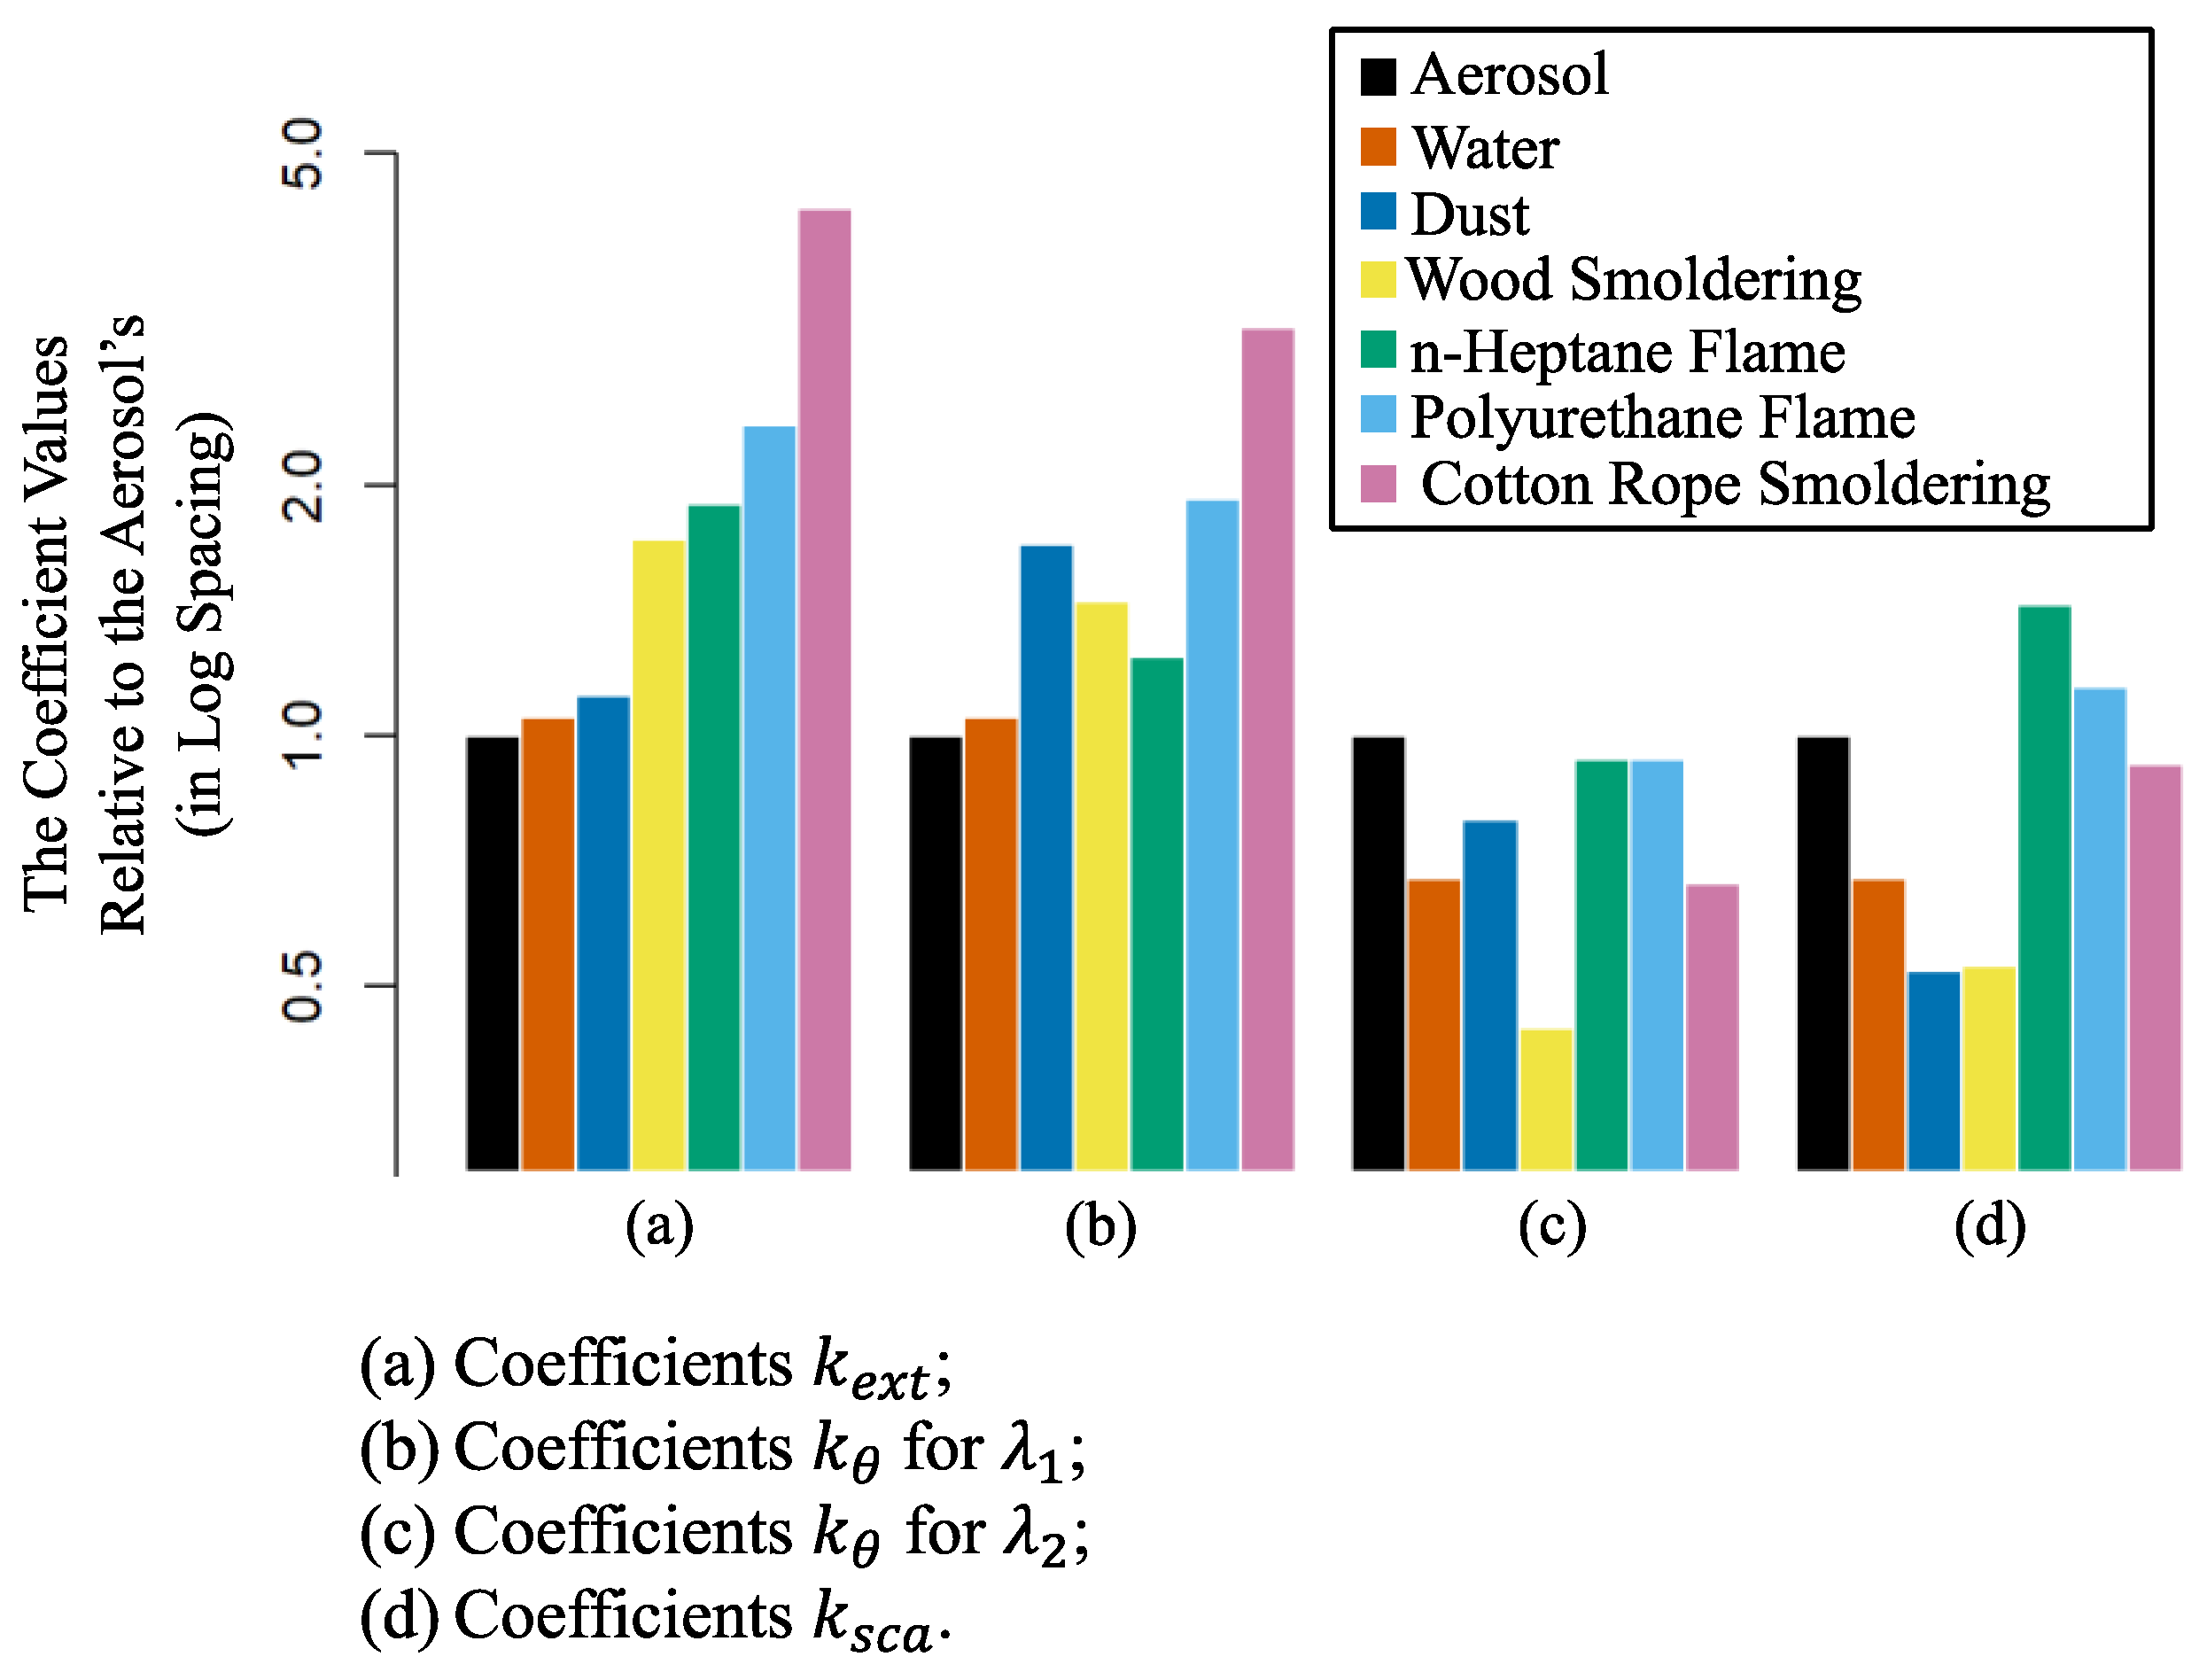
As displayed in Figure 16, the coefficients of paraffin aerosols were set to unity for comparison since the aerosols were generated standardly. Comparing these coefficients shows that the for each particle is the most effective basis for distinguishing between fire and nuisance sources, as shown in Figure 16a, though the paraffin aerosol cannot be identified from nuisance particles. As represented in Figure 16d, the coefficients can also partially distinguish the fire from the interfering matters, especially for the paraffin aerosols, but the wood smouldering is close to dust, making the effect worse. Unfortunately, it is found that the of test fires and of nuisance particles for each wavelength vary in the same range, leading to an inconclusive judgement for this fire detection method. According to the above experimental results, and considering that the scattering signals are more sensitive than the extinction signals, the can be used as a leading judgement, the can be used as an auxiliary judgement to improve the accuracy, and, finally, verify for and for to ensure that there will be no false alarms.
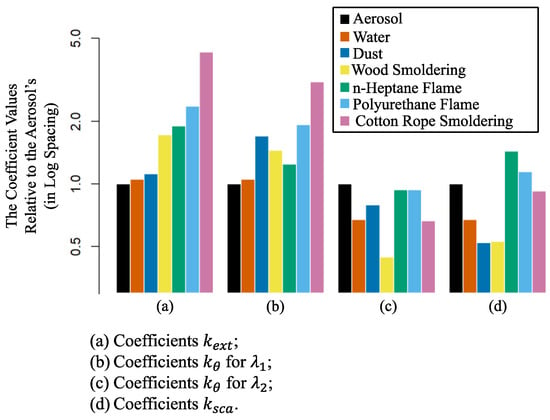
Figure 16.
Comparison of measured coefficient values of aerosols, dust, water fog, and smoke.
In summary, the combination of scattering coefficients and and extinction coefficient is sufficient as a fire alarm criterion to distinguish between fire and interference sources.
6. Conclusions
Prior works have documented that false alarms caused by dust and fine water droplets should be reduced to ensure continuous smoke monitoring and fire protection. Philipp et al. [15], for example, demonstrated an optical sensor based on dual-wavelength light sources with multiple received angles to detect smoke with no dust interference. However, fine water droplets can still cause false alarms with this optical sensor. In this study, we presented an improved Dual-Wavelength smoke detector measuring both light Scattering and Extinction (DWSE) to reduce false alarms caused by fine water droplets and dust.
Two extinction-detection photodiodes were added to the improved DWSE detector to strengthen detection accuracy. It was found that fires can be distinguished from nuisance sources by comparing the calculated scattering coefficients and and extinction coefficient with optimal scattering angles of 115° for 940 nm and 60° for 470 nm. This study indicates that the DWSE detector and alarm method are suitable for smoke monitoring and fire protection because there is no complicated calculation of the Mie scattering or the DDA modelling of agglomerates. Fire scenarios might be inconsistent with verification experiments, but our results still provide theoretical possibilities for accomplishing real-world fire detection and reducing false alarms.
Some limitations of the research are worth noting. Firstly, the work on the optimal scattering angle needs to be better developed, and other combinations of relatively good scattering angles (dark green grids) need to be considered. Further research will be conducted to identify the best scattering angle for detecting smoke from actual fires, building upon the intriguing differences we observed in our study of other real fire tests and incidents. Another limitation is a better experimental chamber to facilitate quantitative measurements of physical parameters such as particle flow rate, thus making our coefficient determinations more accurate. It has only been proved that coefficients , , and can distinguish nuisance sources through simulation and limited experiments. However, we did not provide an intelligent fire alarm algorithm for the DWSE detector. The classification of different types of fire smoke needs to be considered in future work. Specifically, if enough dual-wavelength coefficients of different types of fire smoke can be accumulated, that is, to increase the amount of data, it will be helpful for the feasibility of intelligent identification and the improvement of detection accuracy.
Author Contributions
Conceptualization, K.L. and H.Y.; Methodology, K.L. and G.L.; Formal analysis, K.L. and G.L.; Investigation, K.L., G.L., Y.C., Y.D. and X.M.; Resources, K.L. and Y.C.; Writing—original draft preparation, K.L. and Y.K.; Visualization, K.L. and G.L.; Data curation, K.L. and G.L.; Project administration, K.L. and H.Y.; Software, G.L.; Supervision, H.Y. and L.H.; Funding acquisition, H.Y. and L.H.; Writing—review and editing, L.H. All authors have read and agreed to the published version of the manuscript.
Funding
This study was supported by National Key R&D Program of China (Grant No. 2021YFC1523500).
Institutional Review Board Statement
Not applicable.
Informed Consent Statement
Not applicable.
Data Availability Statement
Data sets generated during the current study are available from the corresponding author on reasonable request.
Conflicts of Interest
The authors declare that they have no known competing financial interest or personal relationships that could have appeared to influence the work reported in this paper.
References
- Newman, J.S.; Yee, G.G.; Su, P. Smoke Characterization and Damage Potentials; Springer: New York, NY, USA, 2016; pp. 724–744. [Google Scholar] [CrossRef]
- Ahrens, M. The US Experience with Smoke Detectors and Other Fire Detectors; National Fire Protection Association, Fire Analysis and Research Division: Quincy, MA, USA, 1997. [Google Scholar]
- Schifiliti, R.P.; Custer, R.L.P.; Meacham, B.J. Design of Detection Systems; Springer: New York, NY, USA, 2016; pp. 1314–1377. [Google Scholar] [CrossRef]
- National Fire Protection Association. Ionization vs. Photoelectric. 2015. Available online: https://www.nfpa.org/Public-Education/Staying-safe/Safety-equipment/Smoke-alarms/Ionization-vs-photoelectric (accessed on 4 March 2022).
- Festag, S. False alarm ratio of fire detection and fire alarm systems in Germany—A meta analysis. Fire Saf. J. 2016, 79, 119–126. [Google Scholar] [CrossRef]
- Crowhurst, E. Fire Statistics: Great Britain April 2013 to March 2014; Department for Communities and Local Government: London, UK, 2015. Available online: https://assets.publishing.service.gov.uk/government/uploads/system/uploads/attachment_data/file/325696/Fire_Statistics_Monitor_April_2013_to_March_2014_final__3_.pdf (accessed on 28 July 2022).
- Ahrens, M. Smoke Alarms in US Home Fires; National Fire Protection Association, Fire Analysis and Research Division: Quincy, MA, USA, 2021; Available online: https://www.nfpa.org/-/media/Files/News-and-Research/Fire-statistics-and-reports/Detection-and-signaling/ossmokealarms.pdf (accessed on 28 July 2022).
- Tao, Z.; Yang, R.; Li, C.; Yao, Y.; Zhu, P.; Zhang, H. Experimental study on liquid fire behavior at different effective ceiling heights in a full-size simulated cargo compartment. J. Therm. Anal. Calorim. 2018, 133, 1617–1626. [Google Scholar] [CrossRef]
- Tao, Z.; Yang, R.; Li, C.; Yao, Y.; Zhang, P.; Zhang, H. An experimental study on fire behavior of an inclined ceiling jet in a low-pressure environment. Int. J. Therm. Sci. 2019, 138, 487–495. [Google Scholar] [CrossRef]
- Zheng, R.; Lu, S.; Shi, Z.C.; Li, C.; Jia, H.M.; Wang, S. Research on the aerosol identification method for the fire smoke detection in aircraft cargo compartment. Fire Saf. J. 2022, 130, 103574. [Google Scholar] [CrossRef]
- Loepfe, M.; Ryser, P.; Tompkin, C.; Wieser, D. Optical properties of fire and non-fire aerosols. Fire Saf. J. 1997, 29, 185–194. [Google Scholar] [CrossRef]
- Keller, A.; Loepfe, M.; Nebiker, P.; Pleisch, R.; Burtscher, H. On-line determination of the optical properties of particles produced by test fires. Fire Saf. J. 2006, 41, 266–273. [Google Scholar] [CrossRef]
- West, R.A.; Doose, L.R.; Eibl, A.M.; Tomasko, M.G.; Mishchenko, M.I. Laboratory measurements of mineral dust scattering phase function and linear polarization. J. Geophys. Res. Atmos. 1997, 102, 16871–16881. [Google Scholar] [CrossRef]
- Zhao, J.H. Study on the detection of fire smoke by multi-wavelength laser total scattering method. Appl. Laser-Shanghai 2001, 21, 79–81. [Google Scholar]
- Wen-Qing, W.; Gang, P.; Xiao-Lu, L.; Yong-Yu, W.; Yu-Bao, L.; Bo, L.; Ling, J. Multi-angle scattering characteristic of test fire smoke and typical interference aerosol. Procedia Eng. 2011, 11, 466–472. [Google Scholar] [CrossRef]
- Greenberg, P.; Fischer, D. Advanced particulate sensors for spacecraft early warning fire detection. In Proceedings of the 40th International Conference on Environmental Systems, Barcelona, Spain, 11–15 July 2010; p. 6243. [Google Scholar] [CrossRef]
- Philipp, J.B.; Kirbach, K.; Hofmann, M.; Hppfe, A.; Schank, M. False alarm resisting smoke detector for mobility application. In Proceedings of the 16th International Conference on Automatic Fire Detection, Hyattsville, MD, USA, 12–14 September 2017. [Google Scholar]
- Deng, T.; Wang, S.; Zhu, M. Dual-wavelength optical sensor for measuring the surface area concentration and the volume concentration of aerosols. Sens. Actuators B Chem. 2016, 236, 334–342. [Google Scholar] [CrossRef]
- Wang, S.; Xiao, X.; Deng, T.; Chen, A.; Zhu, M. A Sauter mean diameter sensor for fire smoke detection. Sens. Actuators B Chem. 2018, 281, 920–932. [Google Scholar] [CrossRef]
- Bohren, C.F.; Huffman, D.R. Absorption and Scattering of Light by Small Particles; John Wiley & Sons: Hoboken, NJ, USA, 2008. [Google Scholar] [CrossRef]
- Shu, X.M.; Fang, J.; Shen, S.F.; Lu, Y.J.; Yuan, H.Y.; Fan, W.C. Study on fractal coagulation characteristics of fire smoke particles. Acta Phys. Sin. 2006, 55, 4466–4471. [Google Scholar] [CrossRef]
- Snegirev, A.; Makhviladze, G.; Roberts, J. The effect of particle coagulation and fractal structure on the optical properties and detection of smoke. Fire Saf. J. 2001, 36, 73–95. [Google Scholar] [CrossRef]
- Zhang, Q.X. Scattering Matrices of Smoke: Measurement, Modelling and Inversion for Particle Size Distrbution and Refractive Index. Ph.D. Thesis, University of Science and Technology of China, Hefei, China, 2011. [Google Scholar]
- Modest, M.F. Radiative Heat Transfer, 3rd ed.; Academic Press: New York, NY, USA, 2013. [Google Scholar]
- Wylie, C.R. Advanced Engineering Mathematics, 3rd ed.; McGraw-Hill: New York, NY, USA, 1966. [Google Scholar]
- Stegun, I.A. Handbook of Mathematical Functions: With Formulas, Graphs, and Mathematical Tables; Dover Publications: New York, NY, USA, 1972. [Google Scholar]
- Baron, P.A.; Willeke, K. Aerosol Measurement: Principles, Techniques, and Applications, 2nd ed.; John Wiley & Sons, Inc.: Hoboken, NJ, USA, 2005. [Google Scholar]
- McCartney, E.J. Optics of the Atmosphere: Scattering by Molecules and Particles; John Wiley & Sons, Inc.: New York, NY, USA, 1976. [Google Scholar]
- Draine, B.T.; Flatau, P.J. Discrete-Dipole Approximation for Scattering Calculations. J. Opt. Soc. Am. A 1994, 11, 1491–1499. [Google Scholar] [CrossRef]
- Qiao, L.F. Study on Polarized Light Scattering Characteristics of Fire Smoke Particles. Ph.D. Thesis, University of Science and Technology of China, Hefei, China, 2008. [Google Scholar]
- Cooper, P.R. Refractive-index measurements of paraffin, a silicone elastomer, and an epoxy resin over the 500–1500-nm spectral range. Appl. Opt. 1982, 21, 3413–3415. [Google Scholar] [CrossRef] [PubMed]
- Kedenburg, S.; Vieweg, M.; Gissibl, T.; Giessen, H. Linear refractive index and absorption measurements of nonlinear optical liquids in the visible and near-infrared spectral region. Opt. Mater. Express 2012, 2, 1588–1611. [Google Scholar] [CrossRef]
- Glen, A.; Brooks, S.D. A new method for measuring optical scattering properties of atmospherically relevant dusts using the Cloud and Aerosol Spectrometer with Polarization (CASPOL). Atmos. Meas. Tech. 2013, 13, 1345–1356. [Google Scholar] [CrossRef]
- Ma, S.H. Fire Smoke Praticle Size Distribution Measurement and Evolution Simulation. Ph.D. Thesis, University of Science and Technology of China, Hefei, China, 2006. [Google Scholar]
- Tao, Z.; Bathras, B.; Kwon, B.; Biallas, B.; Gollner, M.J.; Yang, R. Effect of firebrand size and geometry on heating from a smoldering pile under wind. Fire Saf. J. 2020, 120, 103031. [Google Scholar] [CrossRef]
- Tao, Z.; Yang, W.; Sun, Z.; Chen, M.; Wang, J.; Yang, R.; Zhang, H. Experimental study of oil pool shape and environment pressure on the wall fire behavior in an airplane cargo compartment. Int. J. Therm. Sci. 2022, 174, 107440. [Google Scholar] [CrossRef]
Disclaimer/Publisher’s Note: The statements, opinions and data contained in all publications are solely those of the individual author(s) and contributor(s) and not of MDPI and/or the editor(s). MDPI and/or the editor(s) disclaim responsibility for any injury to people or property resulting from any ideas, methods, instructions or products referred to in the content. |
© 2023 by the authors. Licensee MDPI, Basel, Switzerland. This article is an open access article distributed under the terms and conditions of the Creative Commons Attribution (CC BY) license (https://creativecommons.org/licenses/by/4.0/).

