


Fire Protection and Evacuation Analysis in Underground Interchange Tunnels by Integrating BIM and Numerical Simulation


Abstract
1. Introduction
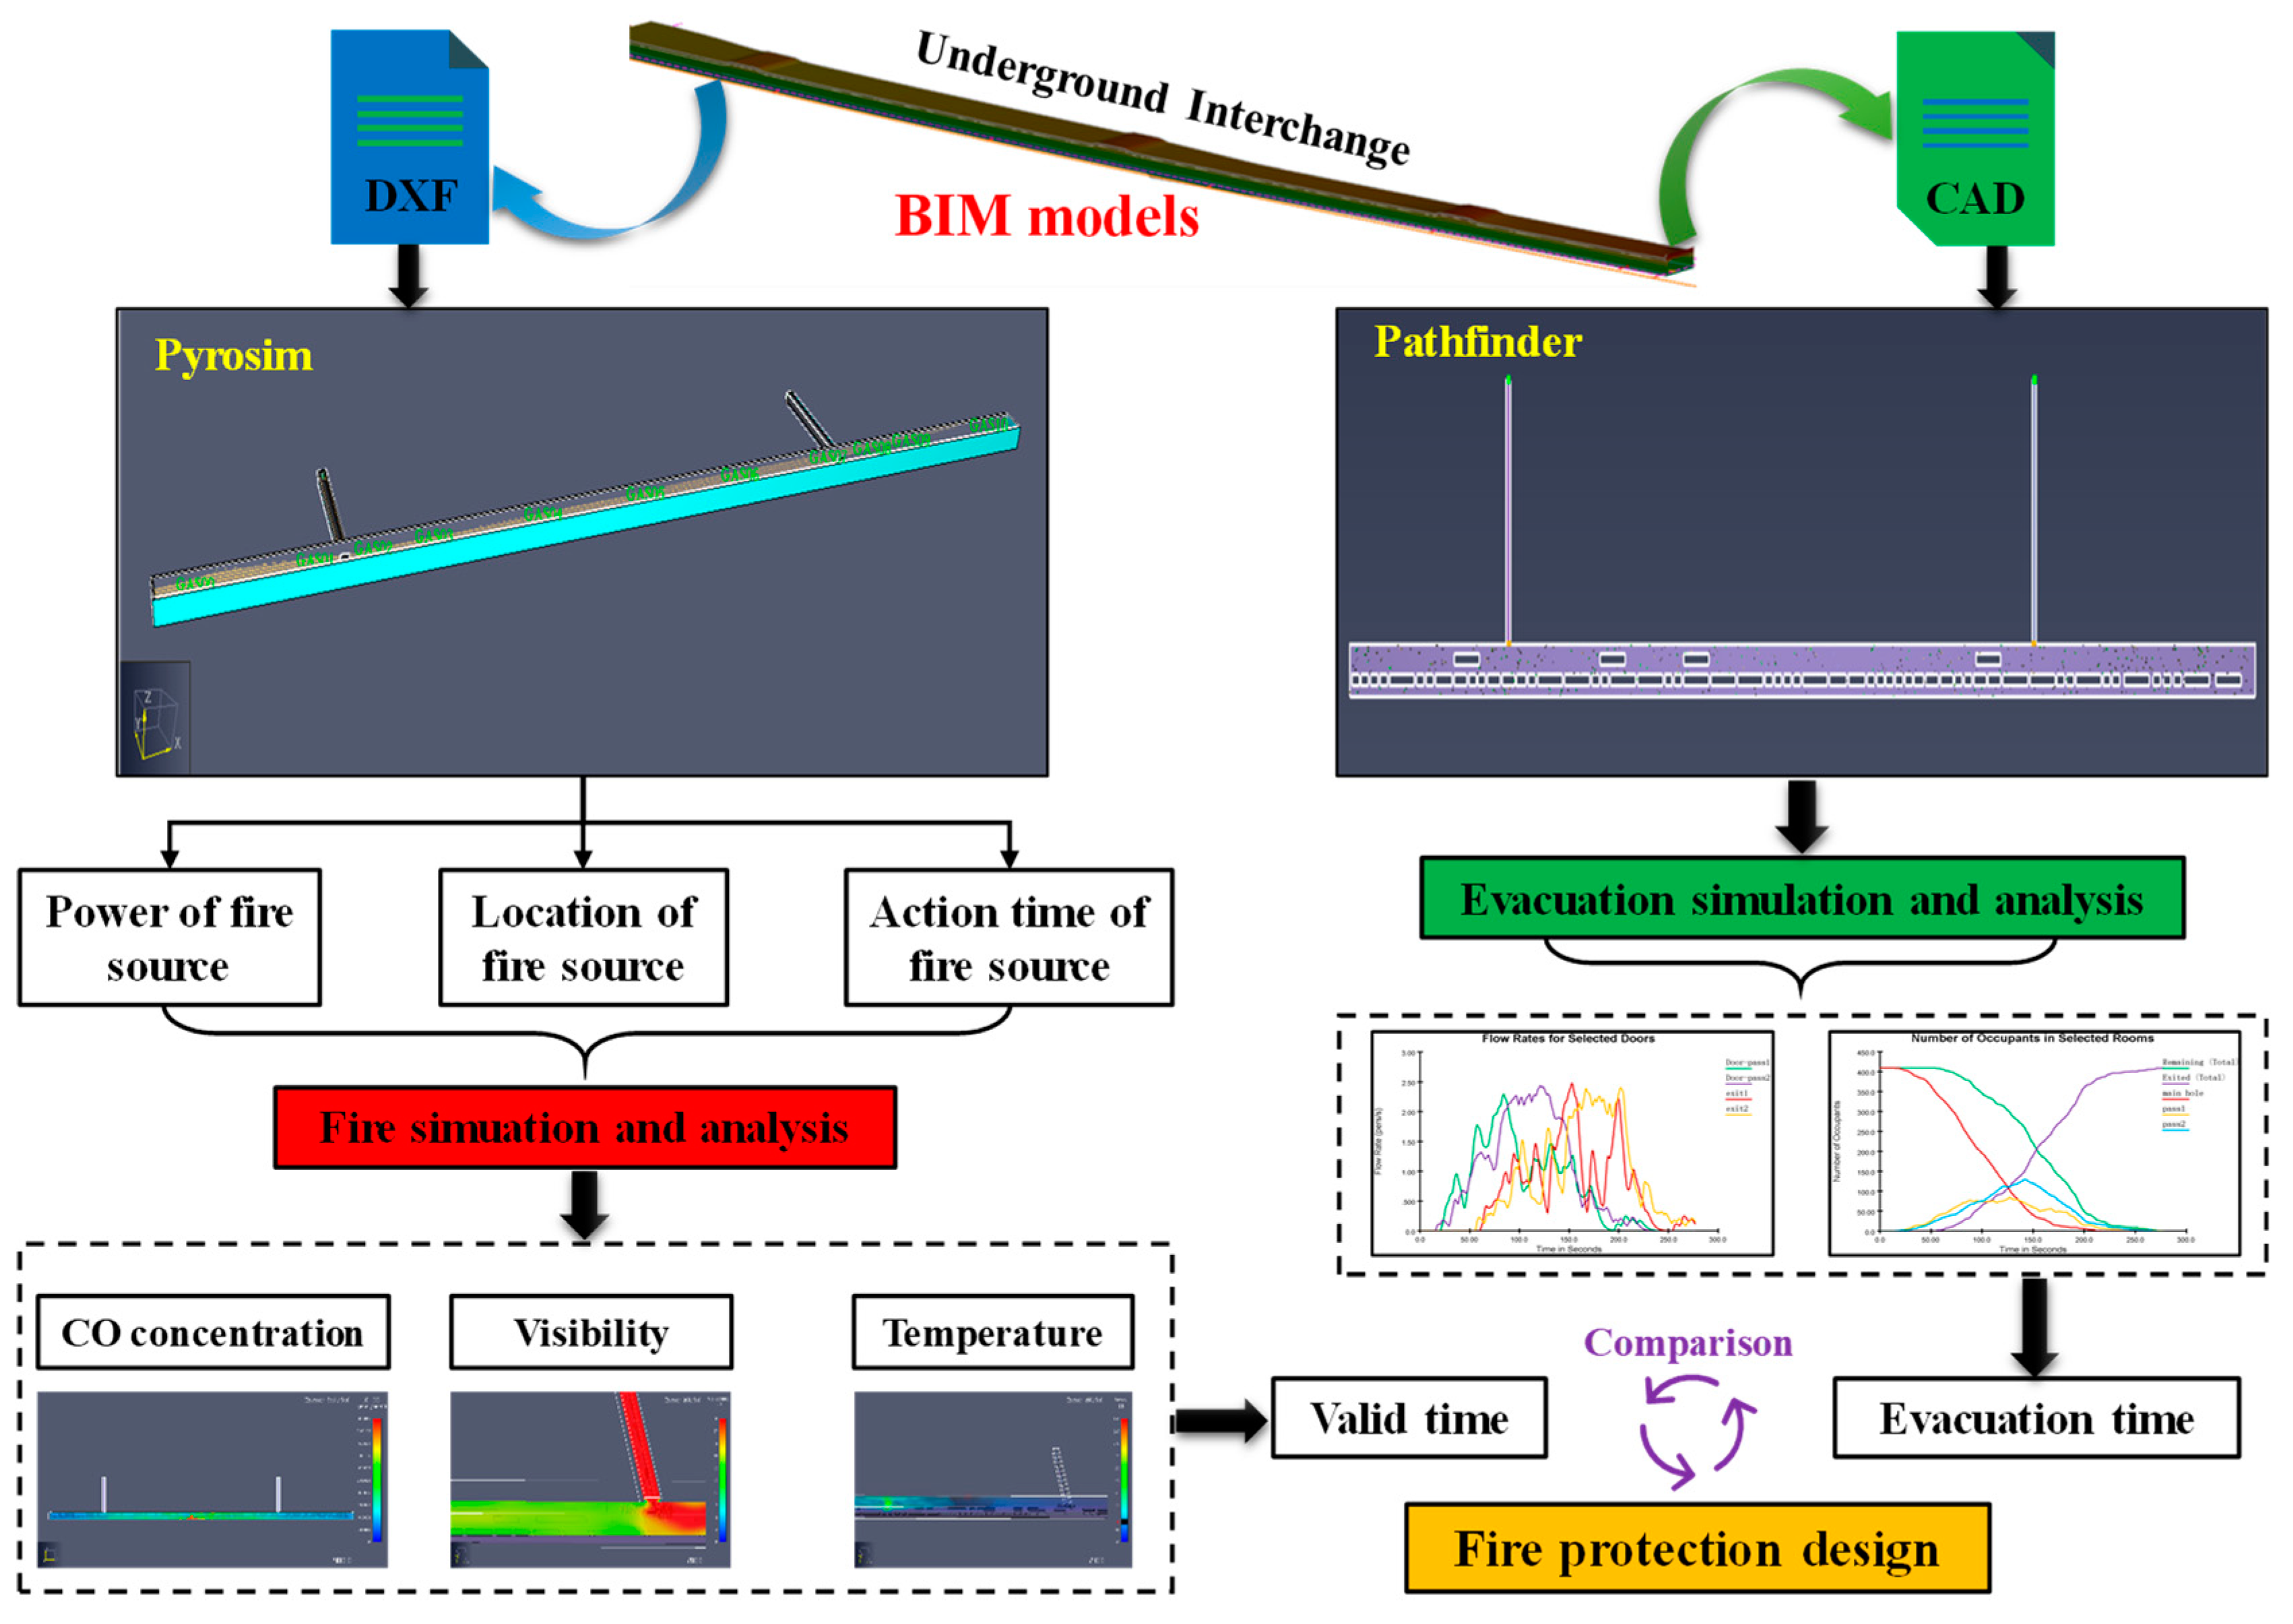
2. Methodology
2.1. BIM Models of Underground Interchange
2.2. Fire Characteristics Simulation
2.3. Determination and Verification of Critical Ventilation Velocity
2.4. Evacuation Simulation
- Working condition #1: the vehicle congestion density was 150 vehicles/km, and the total number of evacuees was 410.
- Working condition #2: the vehicle congestion density was 200 vehicles/km, and the total number of evacuees was 540.
3. Simulations and Analysis of Fire Characteristics
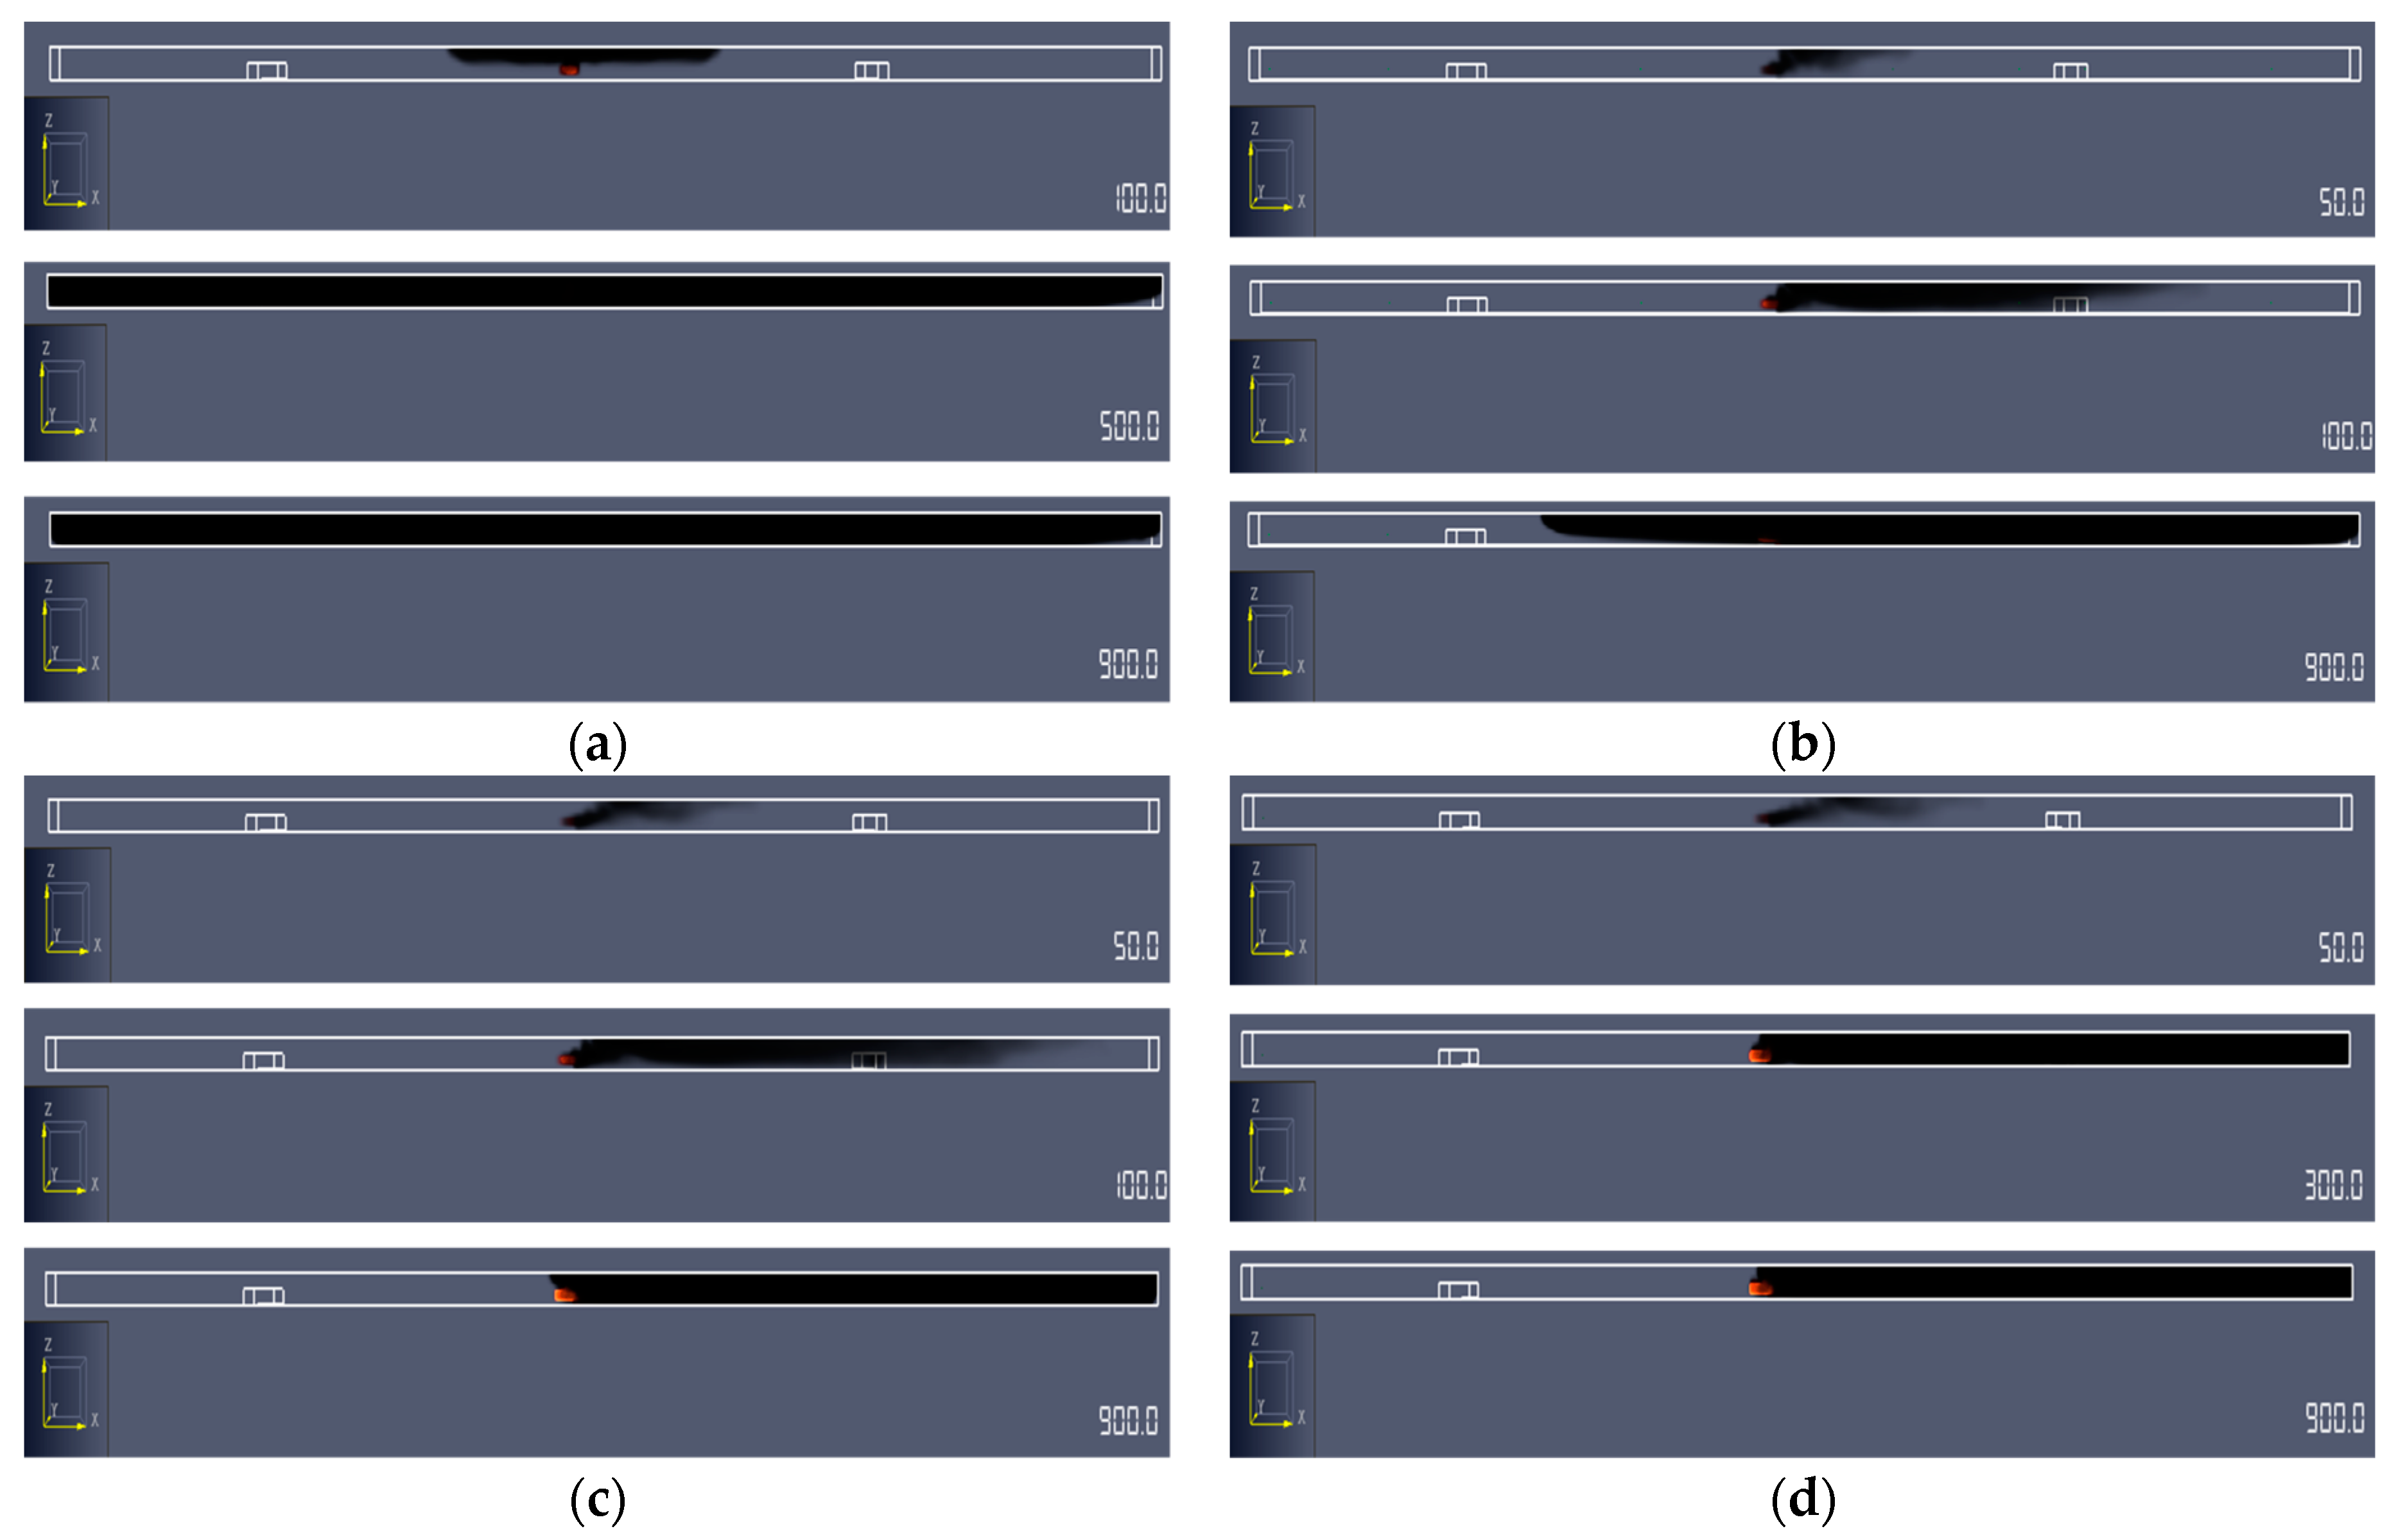
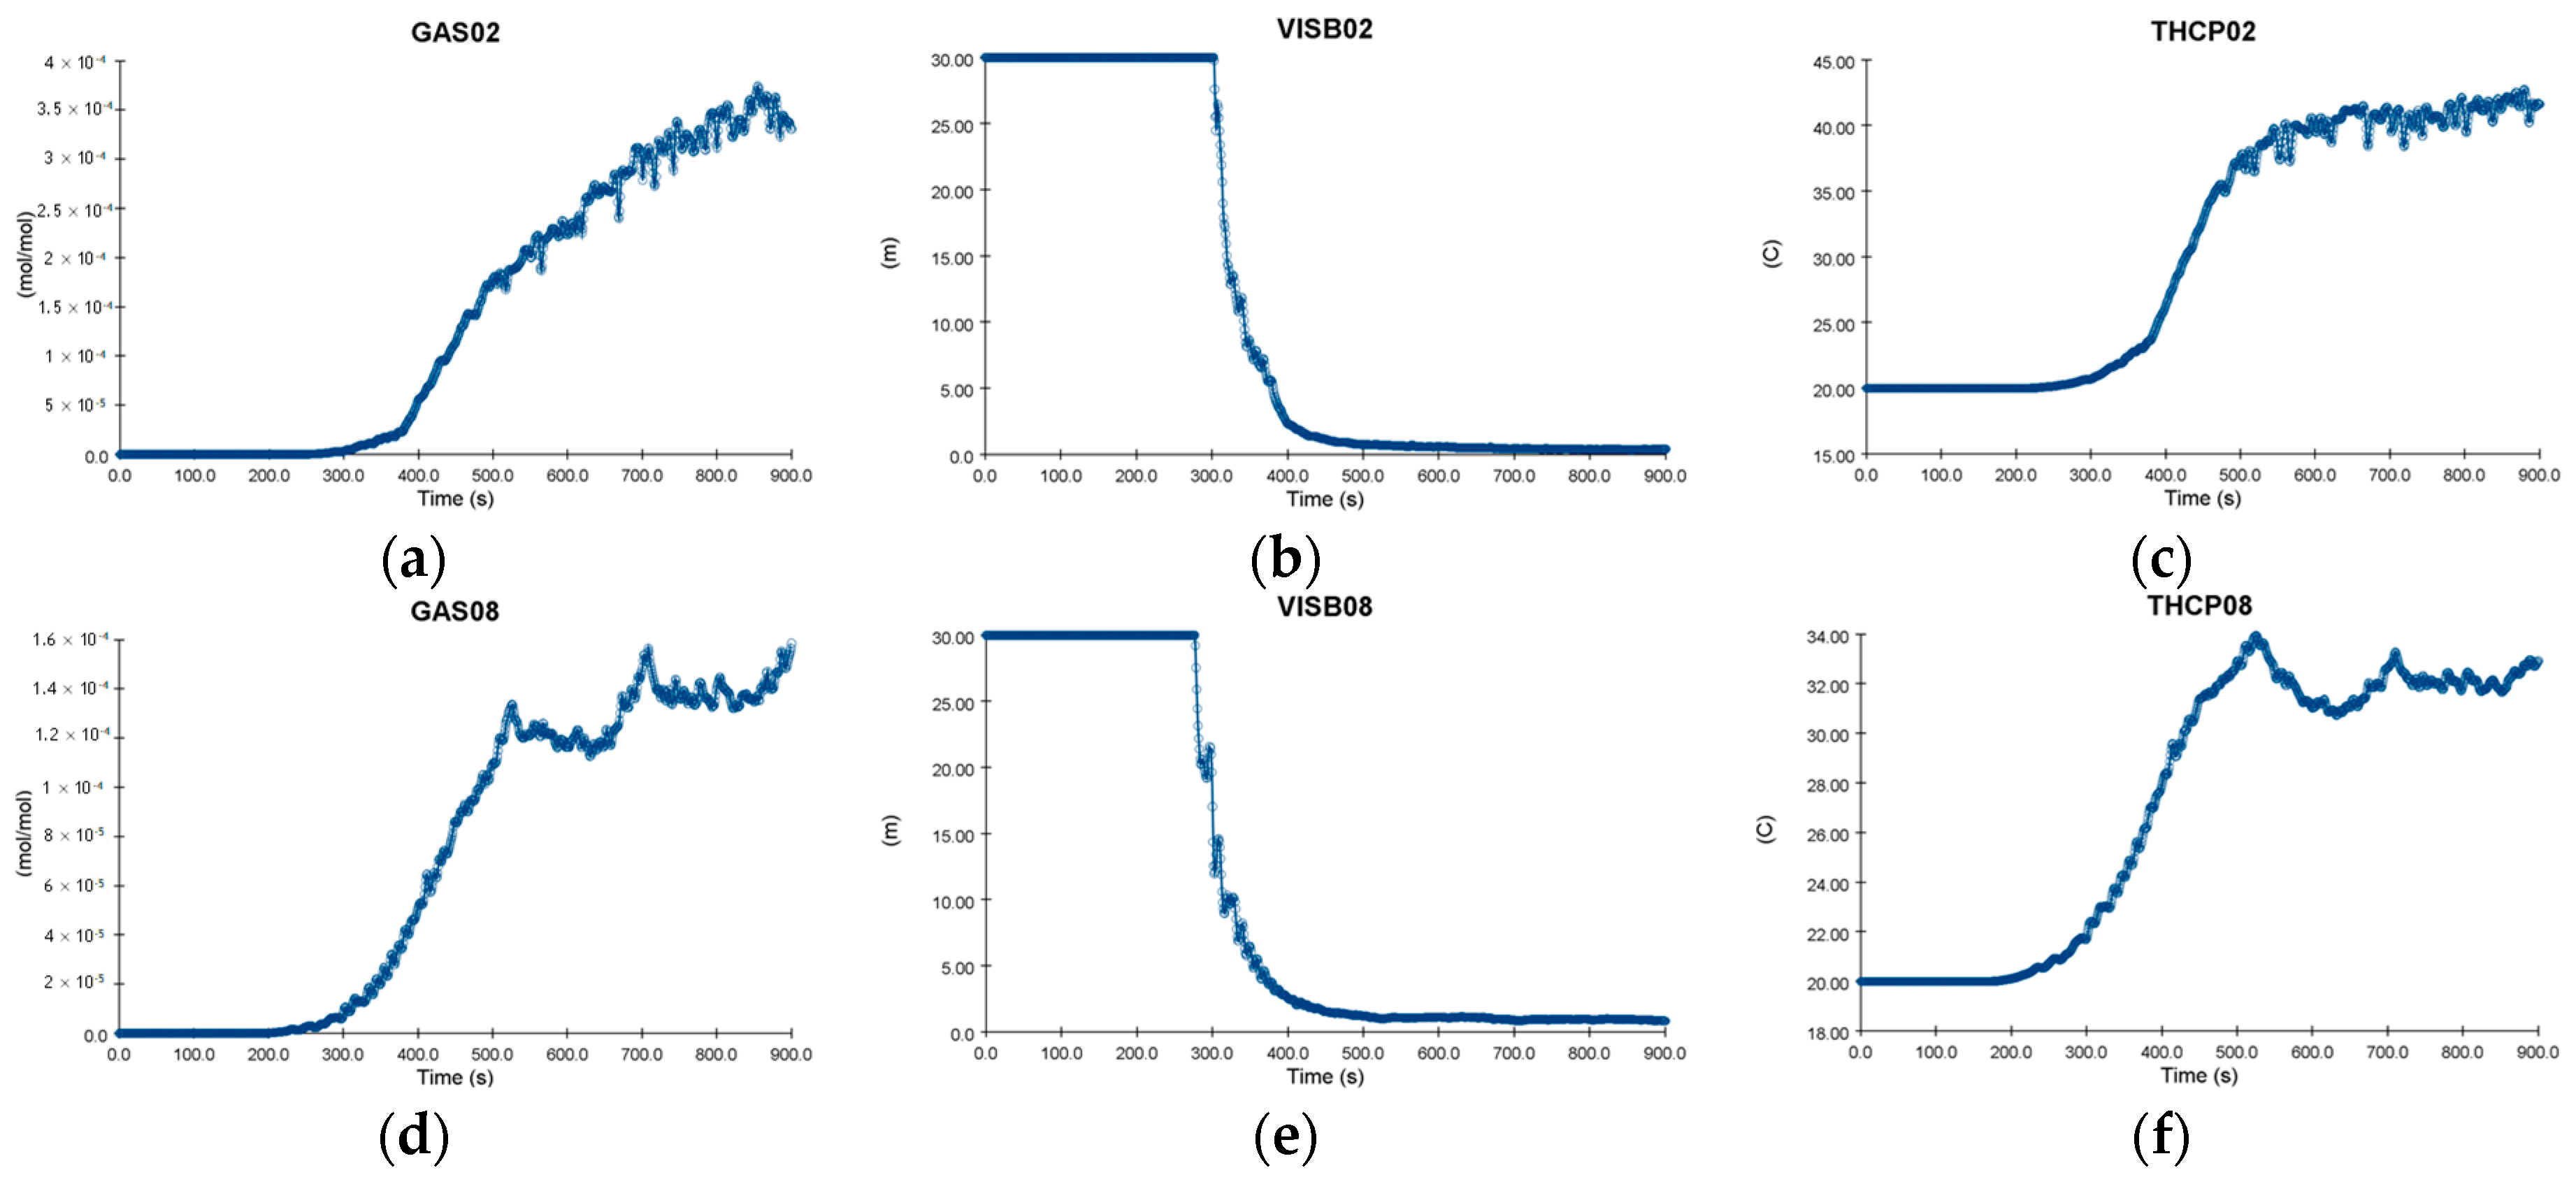
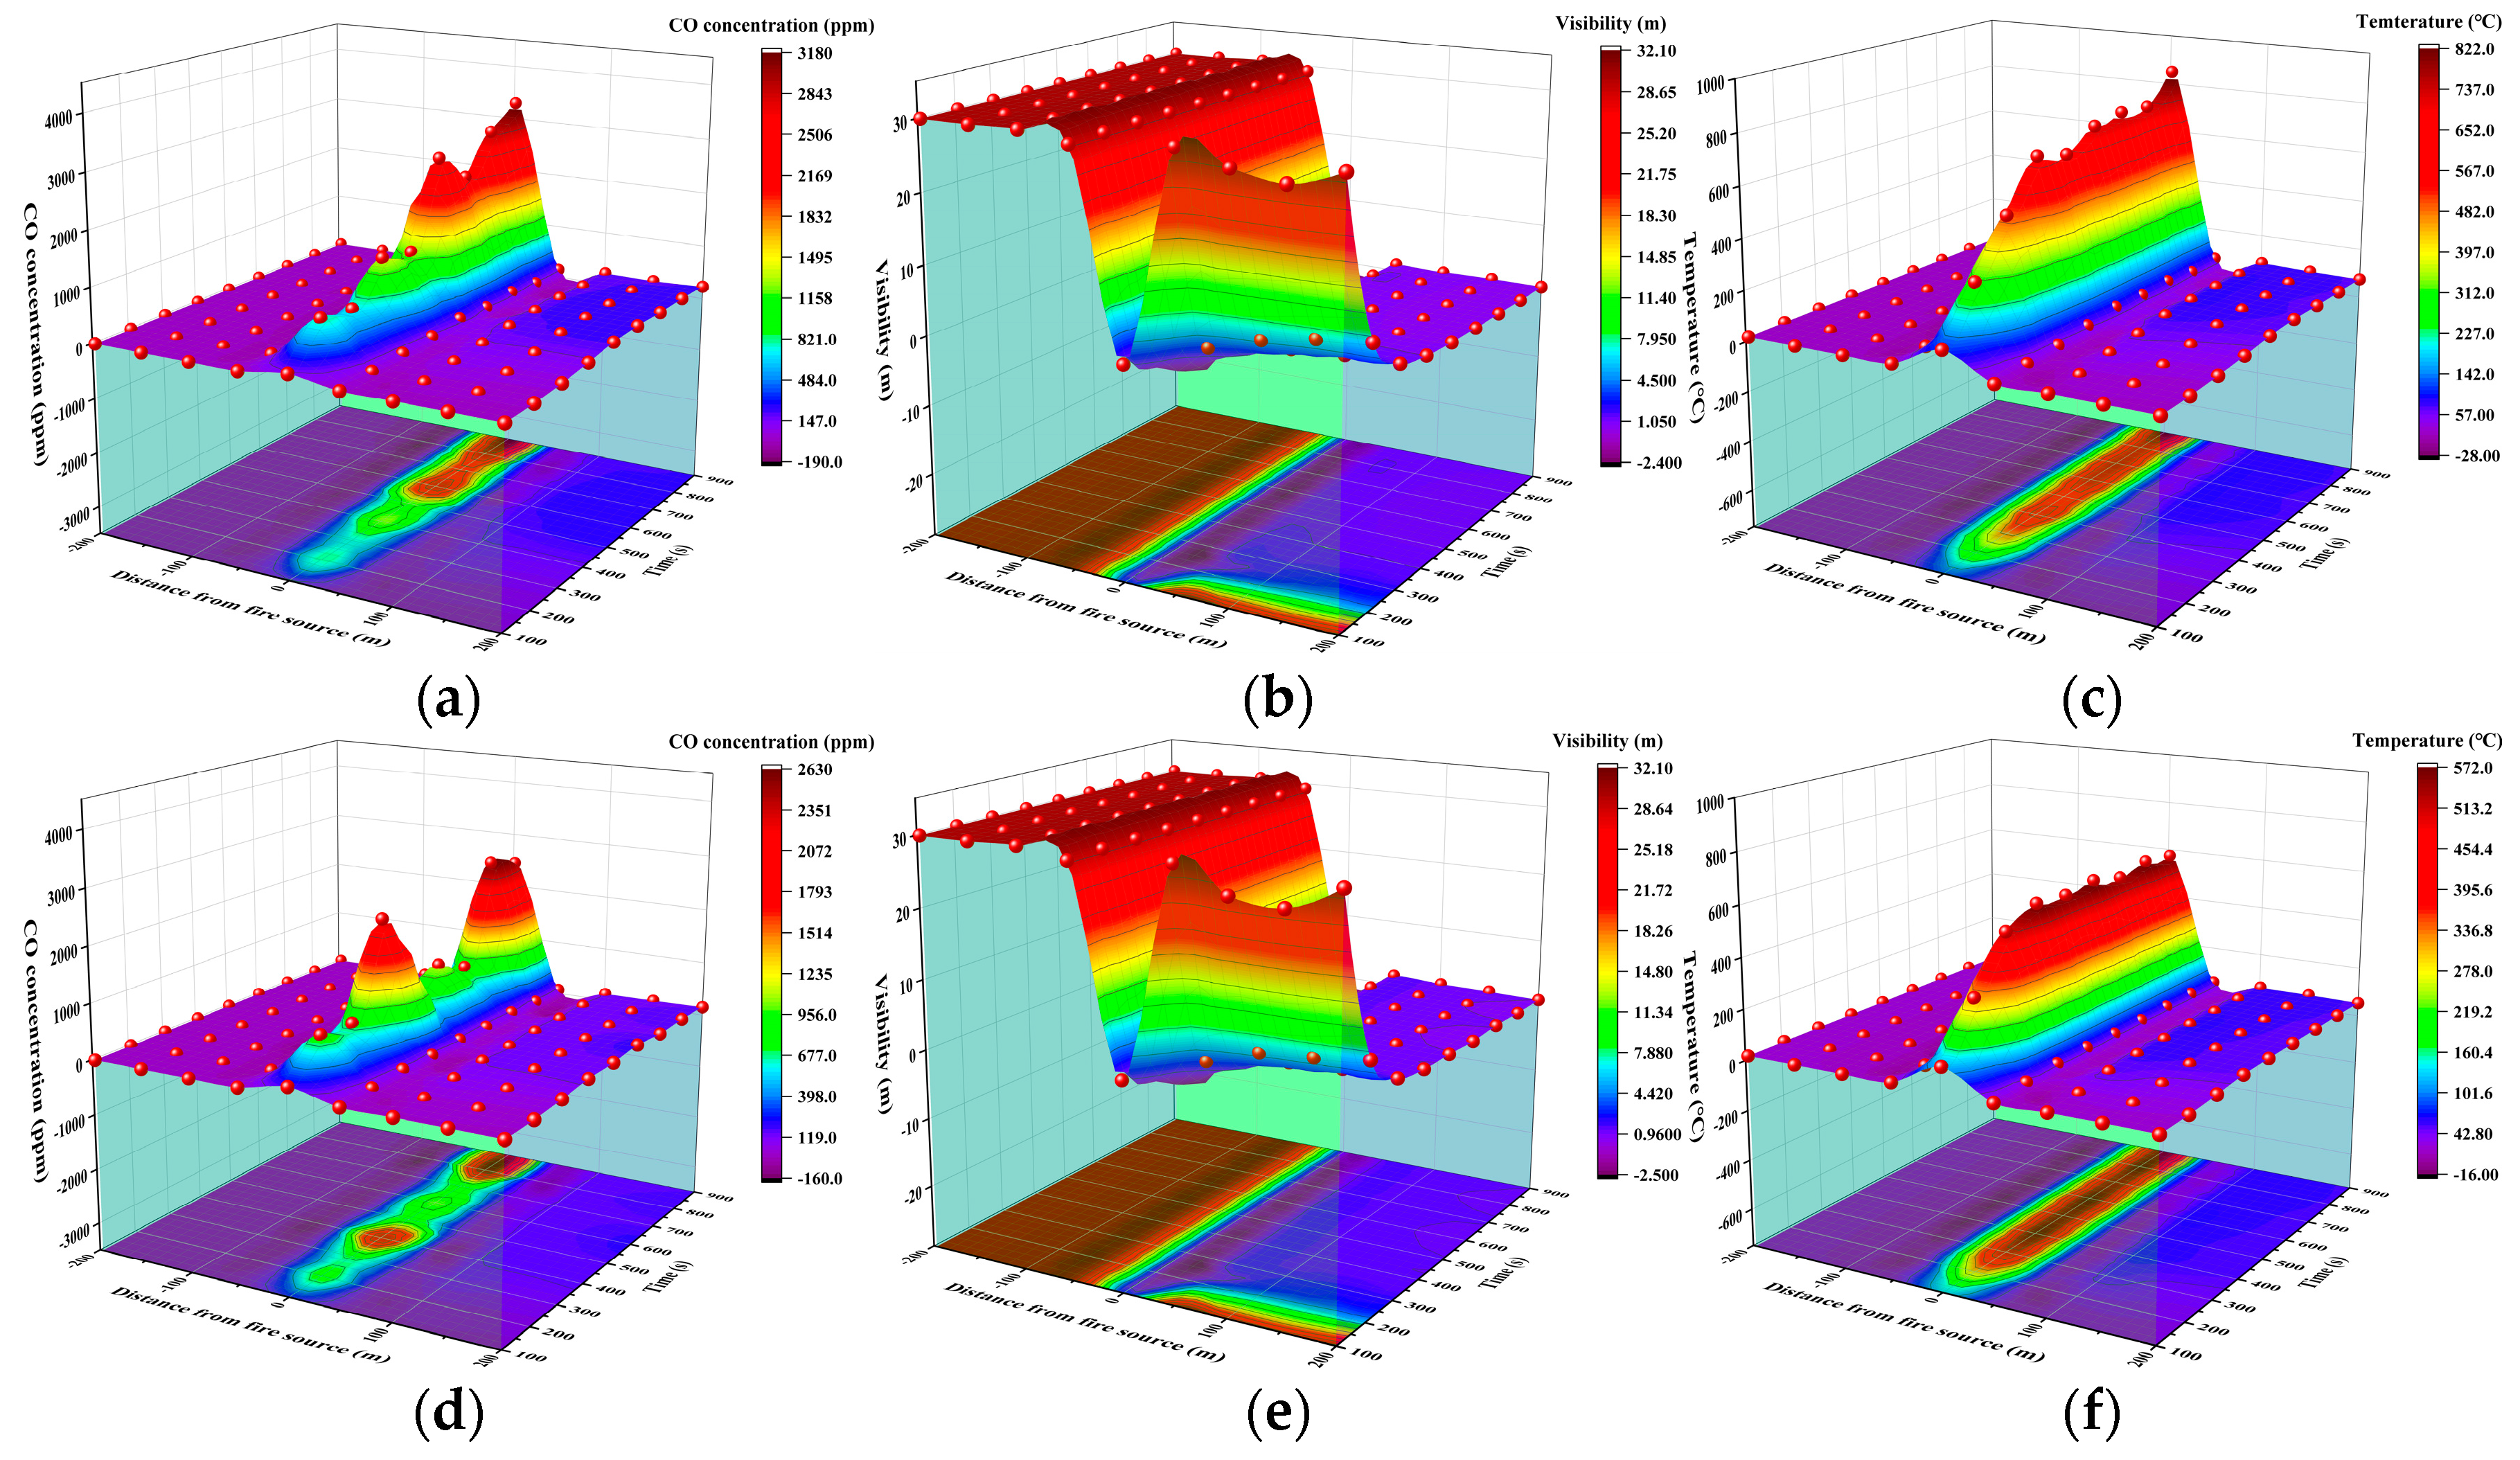
3.1. Analysis of Fire Characteristics under Different Critical Ventilation Velocities
3.1.1. CO Concentration
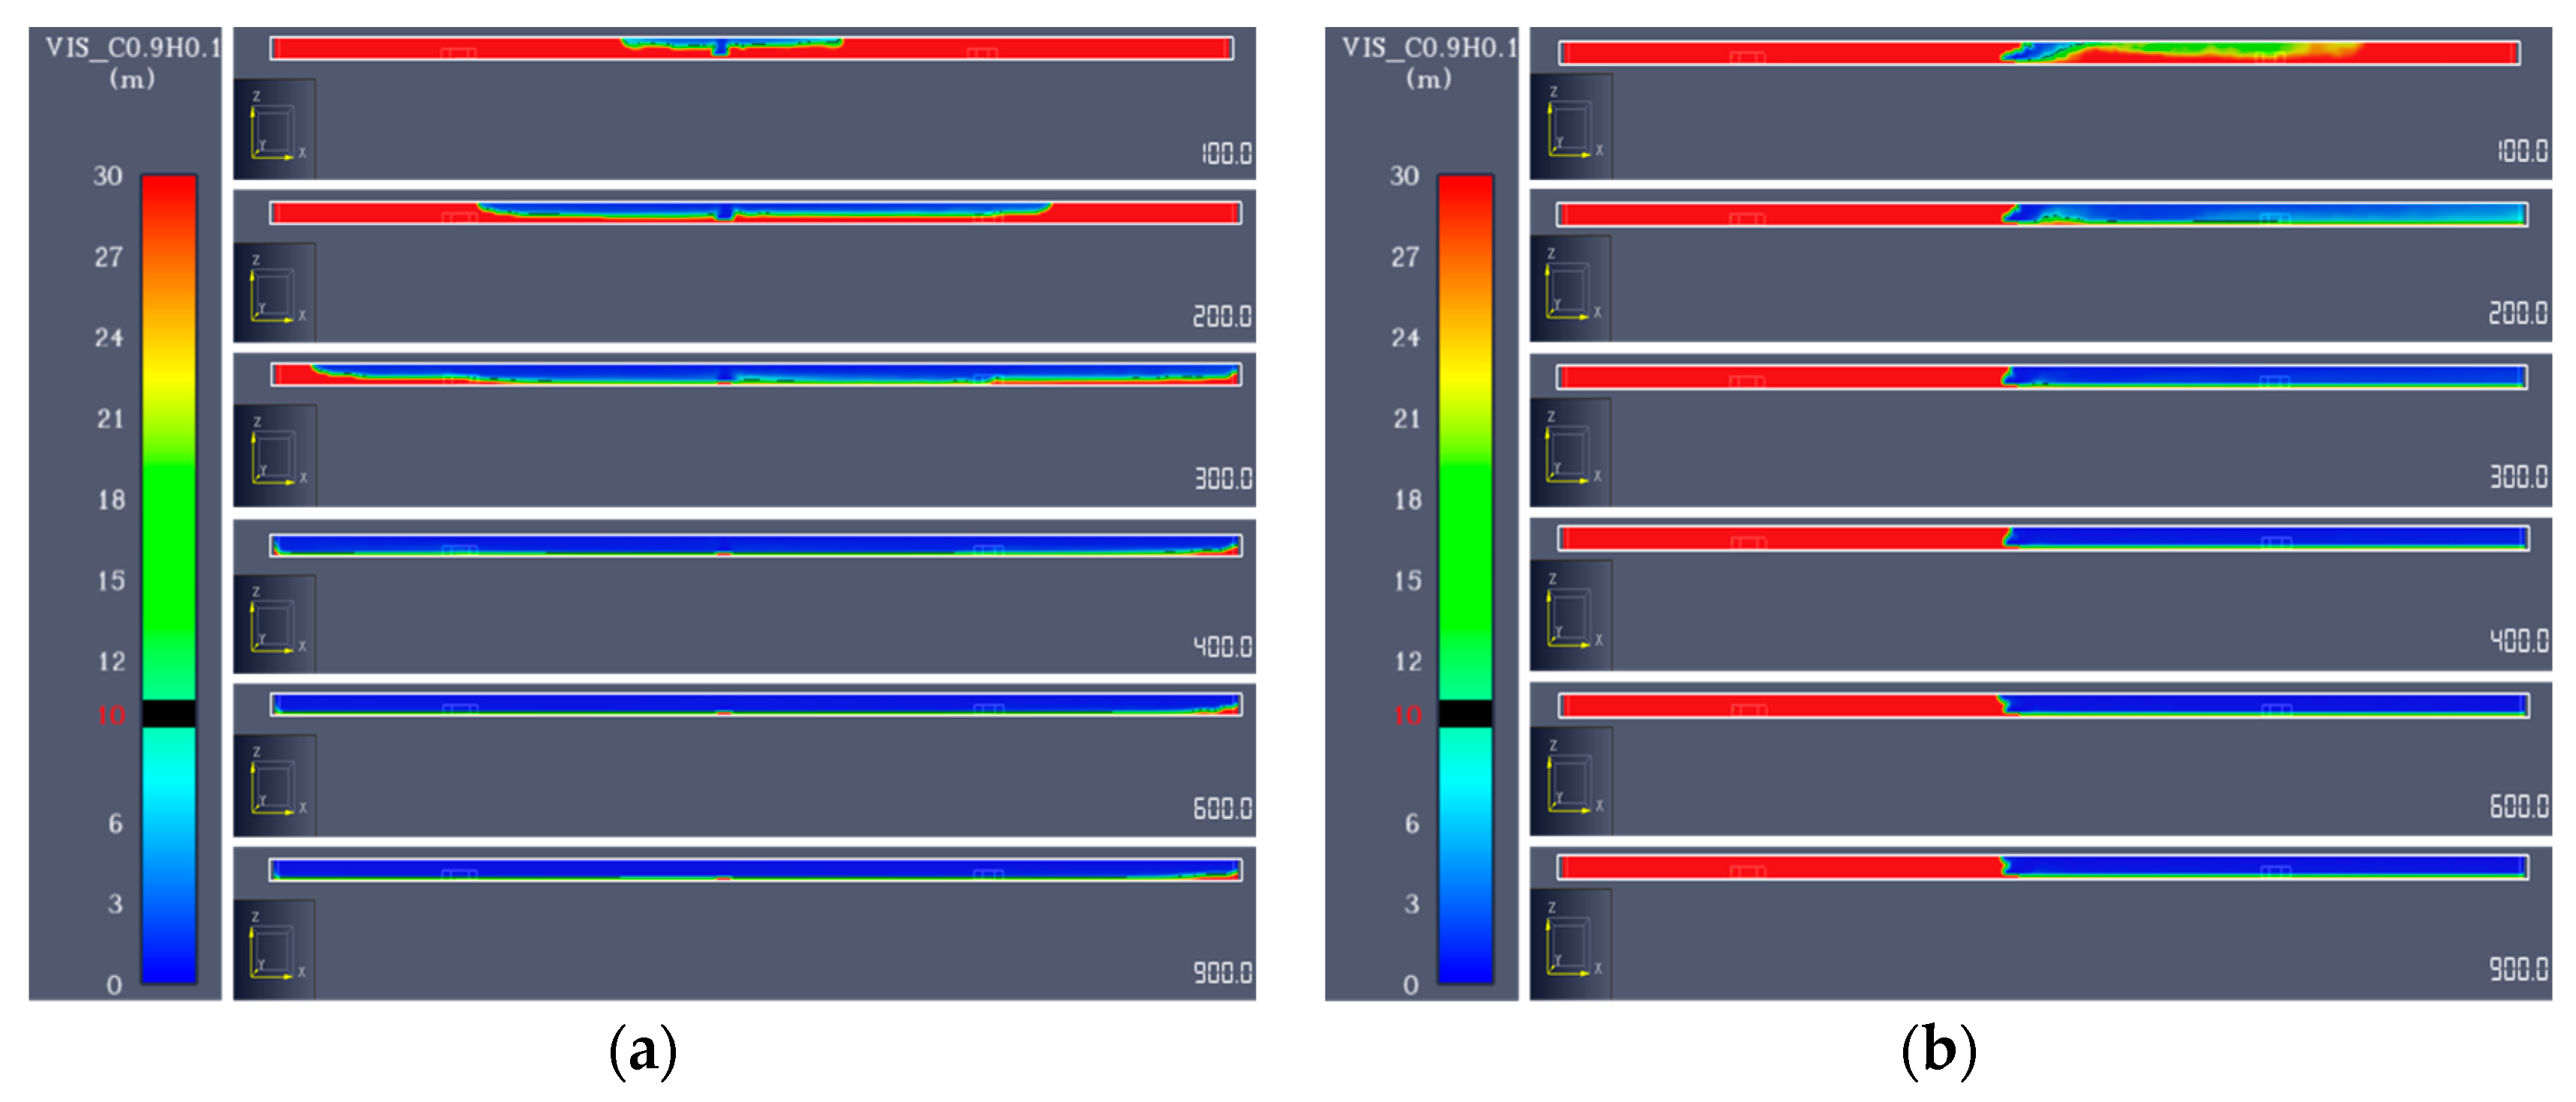
3.1.2. Visibility
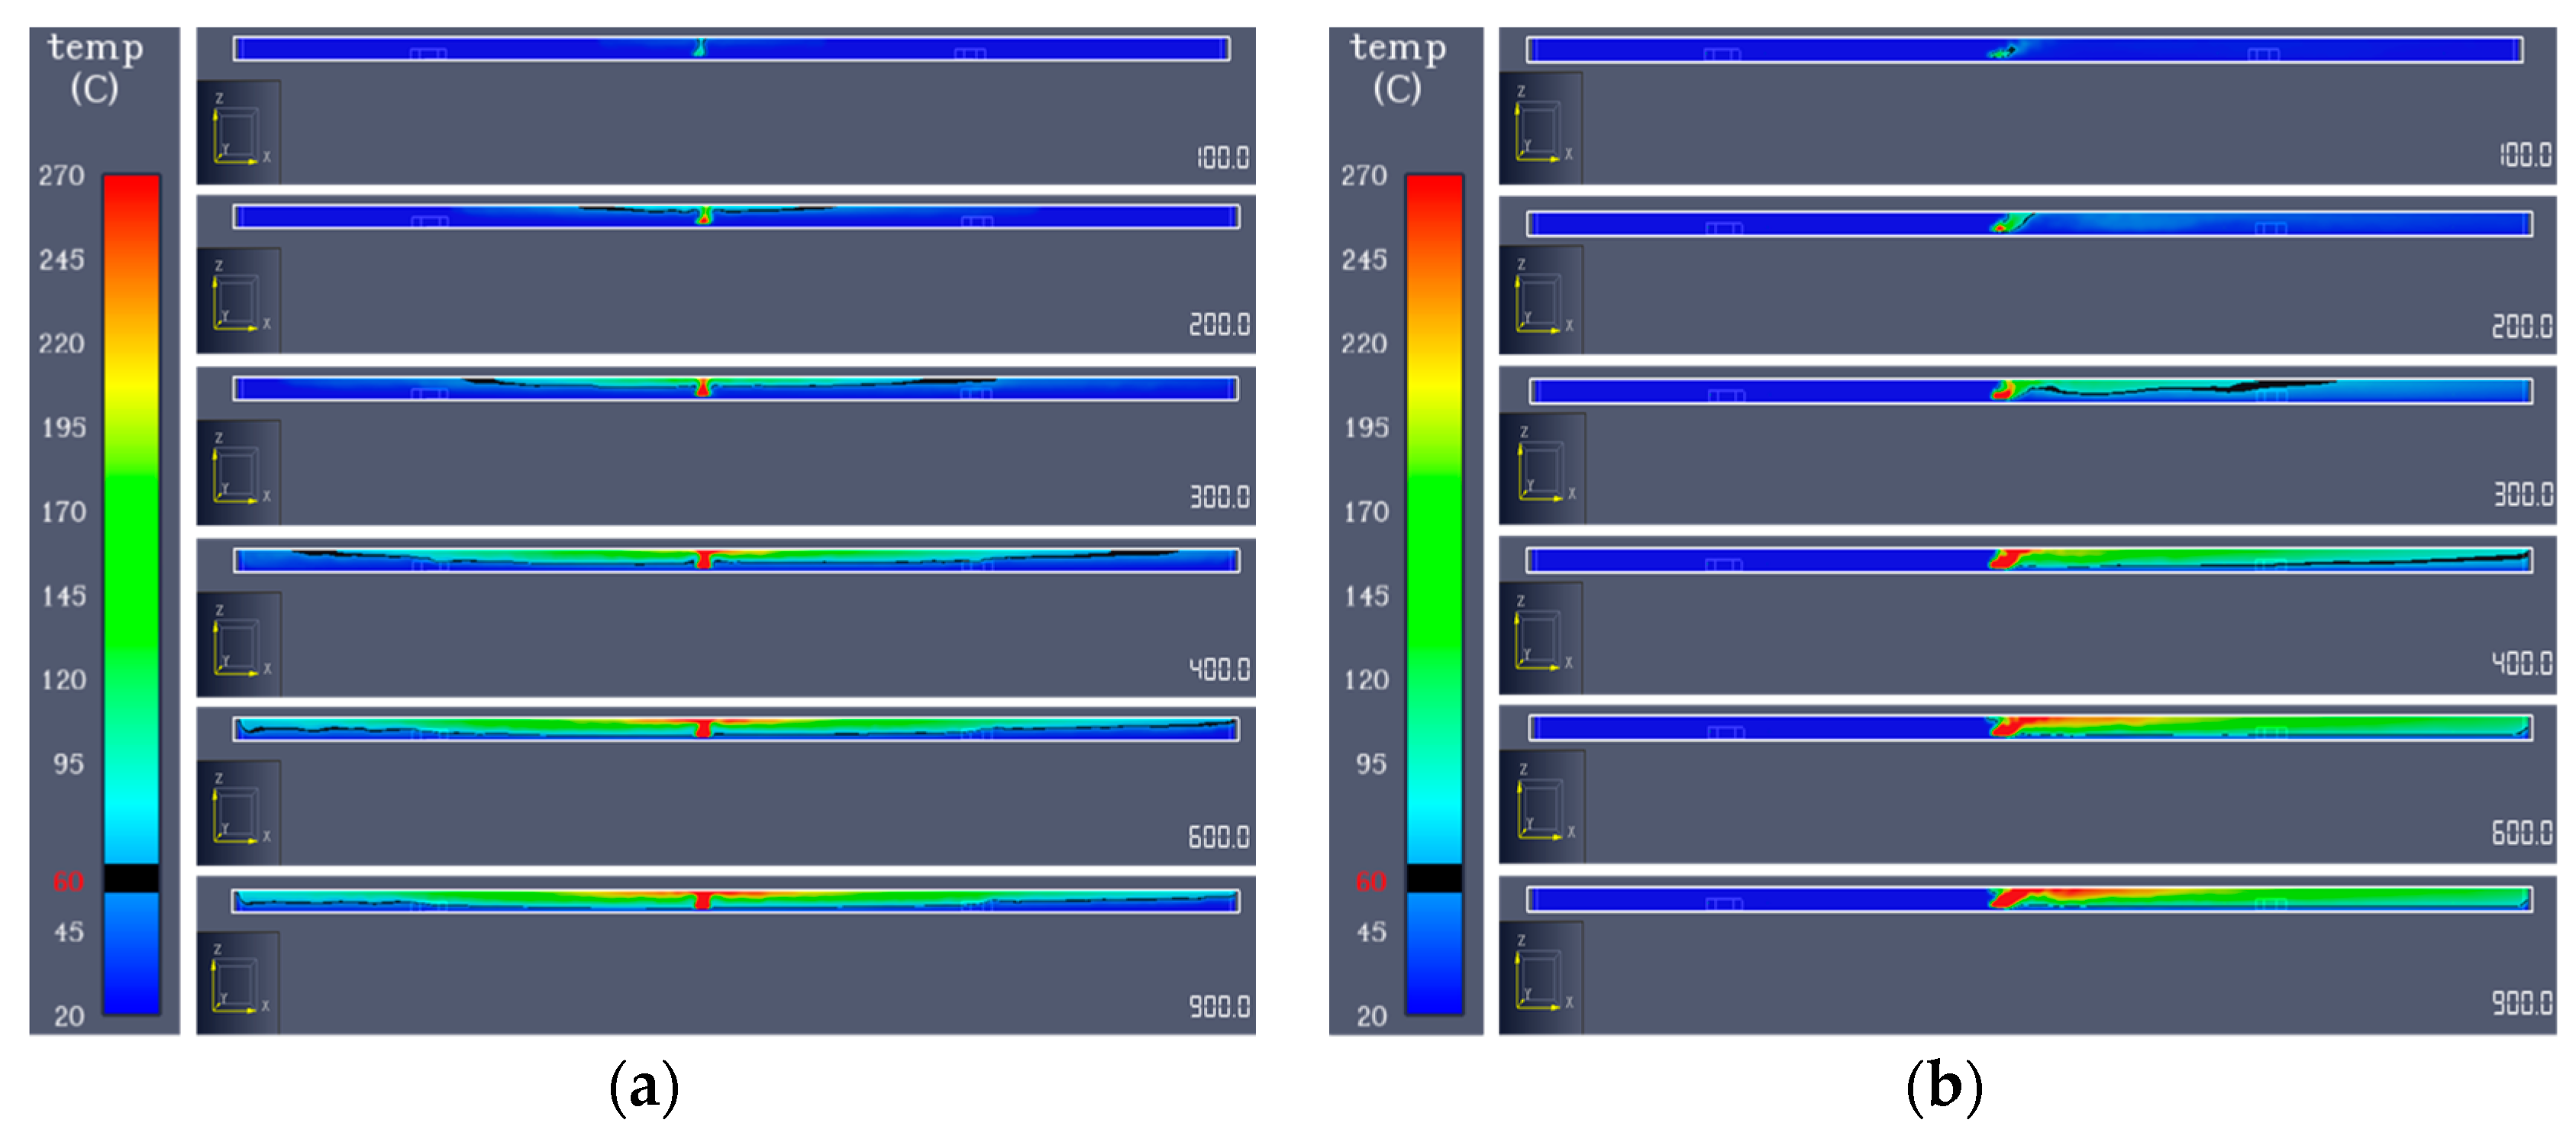
3.1.3. Temperature
3.2. Ventilation Velocity of the Cross Passage
- Working condition A: the ventilation velocity of the left and right transverse passageways was 0.5 m/s.
- Working condition B: the ventilation velocity of the left and right transverse passageways was 1.0 m/s.
3.3. Analysis of Fire Characteristics under Different Fire Scales
4. Simulations and Analysis of Evacuation
4.1. Analysis of Evacuation Simulation Results under Different Vehicle Congestion Densities
4.1.1. Working Condition #1
4.1.2. Working Condition #2
4.2. Analysis of Evacuation Simulation Results with Different Fire Escapes
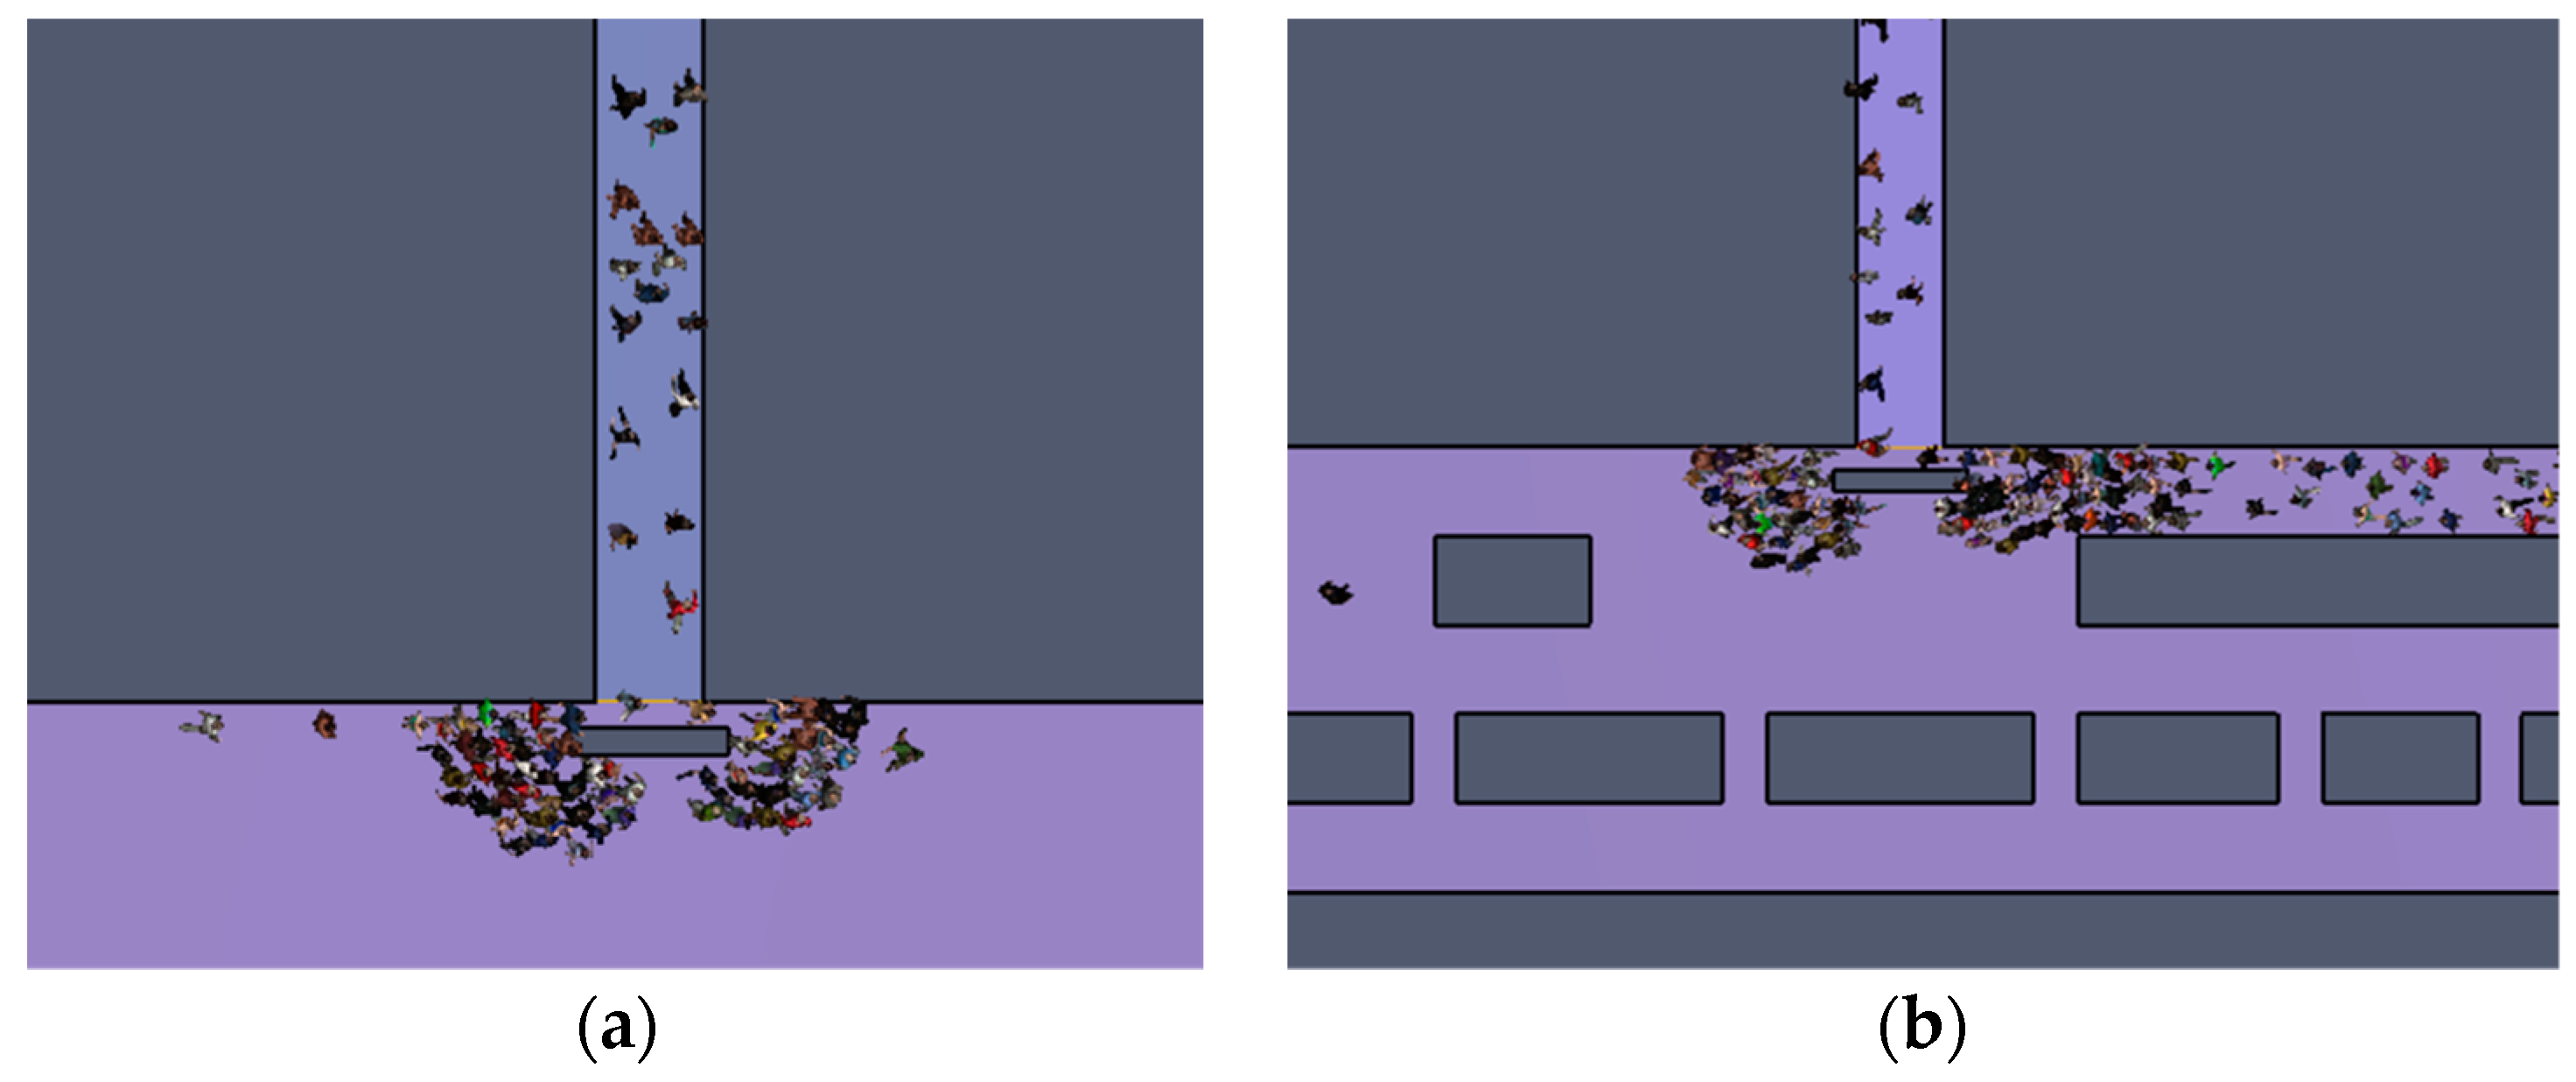
4.2.1. Effect of the Fire Escape Patency on the Evacuation Simulation
4.2.2. Effect of the Fire Escape Width on the Evacuation Simulation
4.3. Safety Analysis of Personnel Escape
4.4. Extraction and Rescue Strategies
- (A)
- Ventilation and smoke evacuation:
- (1)
- To ensure that the stratification of high-temperature smoke is not destroyed during the safe evacuation stage, the airflow velocity near the fire point should not be too large;
- (2)
- In the fire suppression stage, the ventilation velocity in the underground interchange must be greater than the critical ventilation velocity of fire to ensure that the firefighters can safely arrive at the fire site from the upwind side of the underground interchange;
- (3)
- The open fans should be increased when the smoke is upstream of the fire countercurrent. When the downstream smoke speed of the fire source is too fast or is obviously blown away, the number of fans should be reduced, the air supply or exhaust system should be started after the evacuation of personnel in the tunnel, and the smoke exhaust speed should be increased.
- (B)
- Personnel guidance and evacuation:
- (1)
- In the case of fire, there is usually no guide for an underground interchange. Thus, it is necessary to set up eye-catching guide signs in the underground interchange;
- (2)
- In the early stage of tunnel fires, personnel evacuation should be given priority, and fire suppression and smoke exhaust measures should be carried out after the evacuation of personnel;
- (3)
- When a traffic jam inside the local underpass is serious, firefighting vehicles should drive into the adjacent tunnel and enter the transverse passage entrance near the fire-starting point for rescue and fire suppression.
5. Conclusions
- (1)
- The peak values of CO concentration, visibility, and temperature all appeared above the fire source. The CO concentration and temperature downstream of the fire source increased, and the visibility decreased with increasing ventilation velocity. Therefore, taking a low ventilation speed is conducive to the evacuation of personnel from the fire downstream in the escape stage; the critical ventilation velocity during the rescue phase is conducive to the entry of fire personnel from upstream of the fire source;
- (2)
- When the critical ventilation velocity was 3.6 m/s, the ventilation volume in the tunnel met the requirement of no adverse flow of smoke in the longitudinal smoke evacuation mode. As well as meeting the requirements for the safe evacuation of vehicles and personnel, it can ensure the safety of fire sources upstream and downstream without causing tunnel congestion. After the fire, the longitudinal ventilation velocity of the non-fire side can be appropriately increased to prevent flue gas backflow in the main tunnel;
- (3)
- Visibility is the main factor affecting escape. When obstacles were placed at the cross-passage entrance, these two increased by 20% and 8.7%, respectively, which was mainly due to the reduced visibility caused by smoke diffusion. A 2.5-m-wide transverse passage was effective in reducing the escape time. The patency of the fire exits has an obvious effect on the escape time.
Author Contributions
Funding
Institutional Review Board Statement
Informed Consent Statement
Data Availability Statement
Acknowledgments
Conflicts of Interest
References
- Barati, N.; Zadegan, S.A.H.; Kasravi, R. The role of survey details for wayfinding problem in complex pedestrian underground interchange with poor architectural configuration. Tunn. Undergr. Space Technol. 2021, 108, 103718. [Google Scholar] [CrossRef]
- Kodur, V.; Naser, M.Z. Fire hazard in transportation infrastructure: Review, assessment, and mitigation strategies. Front. Struct. Civ. Eng. 2021, 15, 46–60. [Google Scholar] [CrossRef]
- Qu, L.; Chow, W. Numerical studies on density jump in a long corridor fire. Tunn. Undergr. Space Technol. 2012, 32, 113–126. [Google Scholar] [CrossRef]
- Domingo, J.; Barbero, R.; Iranzo, A.; Cuadra, D.; Servert, J.; Marcos, M.A. Analysis and optimization of ventilation systems for an underground transport interchange building under regular and emergency scenarios. Tunn. Undergr. Space Technol. 2011, 26, 179–188. [Google Scholar] [CrossRef]
- Byström, A.; Cheng, X.; Wickström, U.; Veljkovic, M. Full-scale experimental and numerical studies on compartment fire under low ambient temperature. Build. Environ. 2012, 51, 255–262. [Google Scholar] [CrossRef]
- Wahlqvist, J.; van Hees, P. Implementation and validation of an environmental feedback pool fire model based on oxygen depletion and radiative feedback in FDS. Fire Saf. J. 2016, 85, 35–49. [Google Scholar] [CrossRef]
- Guo, J.; Gao, W.; Cai, G.; Liu, Y.; Wen, H. Numerical study on fire-induced smoke temperature characteristics in small curvature radius UTLT-like tunnels under emergency state. Tunn. Undergr. Space Technol. 2022, 127, 104599. [Google Scholar] [CrossRef]
- Dahanayake, K.C.; Yang, Y.; Wan, Y.; Han, S.; Chow, C.L. Study on the fire growth in underground green corridors. Build. Simul. 2020, 13, 627–635. [Google Scholar] [CrossRef]
- Yang, Y.; Xiong, Y.; Li, Y.; Meng, X.; Wang, P.; Cai, T. Temperature and structural responses of a single-section utility tunnel throughout fire exposure. Front. Struct. Civ. Eng. 2022, 16, 1351–1364. [Google Scholar] [CrossRef]
- Xu, T.; Zhao, D.; Tao, H.; Lei, P. Extended CFD models for numerical simulation of tunnel fire under natural ventilation: Comparative analysis and experimental verification. Case Stud. Therm. Eng. 2022, 31, 101815. [Google Scholar] [CrossRef]
- Yao, Y.; Qu, B.; Zhu, H.; Wang, J.; Zhao, S.; Wang, Q. Theoretical and numerical study on critical velocity and driving force for preventing smoke backlayering in a connection roadway fire of coal mines. Tunn. Undergr. Space Technol. 2022, 127, 104566. [Google Scholar] [CrossRef]
- Ranjbarnia, M.; Zaheri, M.; Dias, D. Three-dimensional finite difference analysis of shallow sprayed concrete tunnels crossing a reverse fault or a normal fault: A parametric study. Front. Struct. Civ. Eng. 2020, 14, 998–1011. [Google Scholar] [CrossRef]
- Yang, S.-Q.; Chen, M.; Fang, G.; Wang, Y.-C.; Meng, B.; Li, Y.-H.; Jing, H.-W. Physical experiment and numerical modelling of tunnel excavation in slanted upper-soft and lower-hard strata. Tunn. Undergr. Space Technol. 2018, 82, 248–264. [Google Scholar] [CrossRef]
- Hong, T.-K.; Park, S.-H. Numerical Analysis of Smoke Behavior and Detection of Solid Combustible Fire Developed in Manned Exploration Module Based on Exploration Gravity. Fire 2021, 4, 85. [Google Scholar] [CrossRef]
- Xiaojun, C.; Lizhong, Y.; Zhihua, D.; Weicheng, F. A multi-layer zone model for predicting fire behavior in a fire room. Fire Saf. J. 2005, 40, 267–281. [Google Scholar] [CrossRef]
- Wang, Y.; Jiang, J.; Zhu, D. Diesel oil pool fire characteristic under natural ventilation conditions in tunnels with roof openings. J. Hazard. Mater. 2009, 166, 469–477. [Google Scholar] [CrossRef] [PubMed]
- Węgrzyński, W. Partitions and the Flow of Smoke in Large Volume Buildings. Arch. Civ. Eng. Environ. 2018, 11, 155–164. [Google Scholar] [CrossRef]
- Kim, J.Y.; Kim, K.Y. Experimental and numerical analyses of train-induced unsteady tunnel flow in subway. Tunn. Undergr. Space Technol. Inc. Trenchless Technol. Res. 2007, 22, 166–172. [Google Scholar] [CrossRef]
- Zhang, G.; Guo, D.; Li, B.; Zhang, Z.; Yuan, D. An Experimental Investigation of the Influence of Flow and Pipe Diameter on the Fire Extinguishing Efficiency of Nitrogen Injection in a Narrow Confined Underground Space. Fire 2022, 5, 202. [Google Scholar] [CrossRef]
- Li, J.; Liu, W.; Li, Y.; Chow, W.; Chow, C.; Cheng, C. Scale modelling experiments on the effect of longitudinal ventilation on fire spread and fire properties in tunnel. Tunn. Undergr. Space Technol. 2022, 130. [Google Scholar] [CrossRef]
- Giachetti, B.; Couton, D.; Plourde, F. Smoke spreading analysis from an experimental subway scale model. Fire Saf. J. 2016, 86, 75–82. [Google Scholar] [CrossRef]
- Wang, Y.F.; Qin, T.; Sun, X.F.; Liu, S.; Jiang, J.C. Full-scale fire experiments and simulation of tunnel with vertical shafts. Appl. Therm. Eng. 2016, 105, 243–255. [Google Scholar] [CrossRef]
- Liu, Z.; Gu, X.; Ren, H. Rutting prediction of asphalt pavement with semi-rigid base: Numerical modeling on laboratory to accelerated pavement testing. Constr. Build. Mater. 2023, 375, 130903. [Google Scholar] [CrossRef]
- Cui, B.; Gu, X.; Wang, H.; Hu, D. Numerical and experimental evaluation of adhesion properties of asphalt-aggregate interfaces using molecular dynamics simulation and atomic force microscopy. Road Mater. Pavement Des. 2022, 23, 1564–1584. [Google Scholar] [CrossRef]
- Liu, Z.; Gu, X.; Ren, H.; Wang, X.; Dong, Q. Three-dimensional finite element analysis for structural parameters of asphalt pavement: A combined laboratory and field accelerated testing approach. Case Stud. Constr. Mater. 2022, 17, e01221. [Google Scholar] [CrossRef]
- Janardhan, R.K.; Hostikka, S. Predictive Computational Fluid Dynamics Simulation of Fire Spread on Wood Cribs. Fire Technol. 2019, 55, 2245–2268. [Google Scholar] [CrossRef]
- Gu, X.; Zhang, J.; Pan, Y.; Ni, Y.; Ma, C.; Zhou, W.; Wang, Y. Hazard analysis on tunnel hydrogen jet fire based on CFD simulation of temperature field and concentration field. Saf. Sci. 2020, 122, 104532. [Google Scholar] [CrossRef]
- Liu, Z.; Gu, X.; Chen, J.; Wang, D.; Chen, Y.; Wang, L. Automatic recognition of pavement cracks from combined GPR B-scan and C-scan images using multiscale feature fusion deep neural networks. Autom. Constr. 2023, 146, 104698. [Google Scholar] [CrossRef]
- Wang, D.; Liu, Z.; Gu, X.; Wu, W.; Chen, Y.; Wang, L. Automatic Detection of Pothole Distress in Asphalt Pavement Using Improved Convolutional Neural Networks. Remote. Sens. 2022, 14, 3892. [Google Scholar] [CrossRef]
- Liu, Z.; Yeoh, J.K.; Gu, X.; Dong, Q.; Chen, Y.; Wu, W.; Wang, L.; Wang, D. Automatic pixel-level detection of vertical cracks in asphalt pavement based on GPR investigation and improved mask R-CNN. Autom. Constr. 2023, 146, 104698. [Google Scholar] [CrossRef]
- Liu, Z.; Gu, X.; Dong, Q.; Tu, S.; Li, S. 3D Visualization of Airport Pavement Quality Based on BIM and WebGL Integration. J. Transp. Eng. Part B Pavements 2021, 147, 4021024. [Google Scholar] [CrossRef]
- Costin, A.; Adibfar, A.; Hu, H.; Chen, S.S. Building Information Modeling (BIM) for transportation infrastructure—Literature review, applications, challenges, and recommendations. Automat. Constr. 2018, 94, 257–281. [Google Scholar] [CrossRef]
- Liu, Z.; Gu, X.; Wang, L. Research on information management of Airport pavement quality based on BIM and GIS integration. In Green and Intelligent Technologies for Sustainable and Smart Asphalt Pavements; CRC Press: Boca Raton, FL, USA, 2021; pp. 432–436. [Google Scholar] [CrossRef]
- Liu, Z.; Gu, X.; Chen, Y.; Chen, Y. System Architecture and Key Technologies for the Whole Life Cycle of Smart Road. Proc. J. Phys. Conf. Ser. 2021, 12105. [Google Scholar] [CrossRef]
- Chen, X.-S.; Liu, C.-C.; Wu, I.-C. A BIM-based visualization and warning system for fire rescue. Adv. Eng. Inform. 2018, 37, 42–53. [Google Scholar] [CrossRef]
- Li, N.; Becerik-Gerber, B.; Krishnamachari, B.; Soibelman, L. A BIM centered indoor localization algorithm to support building fire emergency response operations. Autom. Constr. 2014, 42, 78–89. [Google Scholar] [CrossRef]
- Wang, S.; Wainer, G. A simulation as a service methodology with application for crowd modeling, simulation and visualization. Simulation 2015, 91, 71–95. [Google Scholar] [CrossRef]
- Liu, Z.; Chen, Y.; Gu, X.; Yeoh, J.K.; Zhang, Q. Visibility classification and influencing-factors analysis of airport: A deep learning approach. Atmos. Environ. 2022, 278, 119085. [Google Scholar] [CrossRef]
- Ren, R.; Zhou, H.; Hu, Z.; He, S.; Wang, X. Statistical analysis of fire accidents in Chinese highway tunnels 2000–2016. Tunn. Undergr. Space Technol. 2019, 83, 452–460. [Google Scholar] [CrossRef]
- Li, Y.Z.; Ingason, H. Overview of research on fire safety in underground road and railway tunnels. Tunn. Undergr. Space Technol. 2018, 81, 568–589. [Google Scholar] [CrossRef]
- Dimyadi, J. Generating FDS Fire Simulation Input Using IFC-Based Building Information Model; University of Canterbury New Zealand: Christchurch, New Zealand, 2014. [Google Scholar]
- Mirahadi, F.; McCabe, B.; Shahi, A. IFC-centric performance-based evaluation of building evacuations using fire dynamics simulation and agent-based modeling. Autom. Constr. 2019, 101, 1–16. [Google Scholar] [CrossRef]


| Number | Working Conditions | Escape Time (s) | Critical Time (s) | ||||
|---|---|---|---|---|---|---|---|
| Congestion | Transverse Passage Condition | Strat of Escape | Completely Escape | CO (ppm) | V (m) | T (°C) | |
| 1 | Moderate | N | 218 | 277 | N | N | N |
| 2 | Heavy | N | 229 | 288 | N | 206 | N |
| 3 | Moderate | Internal congestion | 218 | 323 | N | 204 | N |
| 4 | Heavy | External congestion | 234 | 364 | N | 202 | N |
| 5 | Moderate | Internal congestion | 260 | 309 | N | 203 | N |
| 6 | Heavy | External congestion | 334 | 386 | N | 203 | N |
| 7 | Moderate | Width is 2.5 m | 218 | 277 | N | N | N |
| 8 | Heavy | Width is 2.5 m | 228 | 288 | N | 206 | N |
Disclaimer/Publisher’s Note: The statements, opinions and data contained in all publications are solely those of the individual author(s) and contributor(s) and not of MDPI and/or the editor(s). MDPI and/or the editor(s) disclaim responsibility for any injury to people or property resulting from any ideas, methods, instructions or products referred to in the content. |
© 2023 by the authors. Licensee MDPI, Basel, Switzerland. This article is an open access article distributed under the terms and conditions of the Creative Commons Attribution (CC BY) license (https://creativecommons.org/licenses/by/4.0/).
Share and Cite
Liu, Z.; Gu, X.; Hong, R. Fire Protection and Evacuation Analysis in Underground Interchange Tunnels by Integrating BIM and Numerical Simulation. Fire 2023, 6, 139. https://doi.org/10.3390/fire6040139
Liu Z, Gu X, Hong R. Fire Protection and Evacuation Analysis in Underground Interchange Tunnels by Integrating BIM and Numerical Simulation. Fire. 2023; 6(4):139. https://doi.org/10.3390/fire6040139
Chicago/Turabian StyleLiu, Zhen, Xingyu Gu, and Rui Hong. 2023. "Fire Protection and Evacuation Analysis in Underground Interchange Tunnels by Integrating BIM and Numerical Simulation" Fire 6, no. 4: 139. https://doi.org/10.3390/fire6040139
APA StyleLiu, Z., Gu, X., & Hong, R. (2023). Fire Protection and Evacuation Analysis in Underground Interchange Tunnels by Integrating BIM and Numerical Simulation. Fire, 6(4), 139. https://doi.org/10.3390/fire6040139