Article

Simulation Study on Suppressing Shielded Fires by Water Mist Systems

Department of Energy (DENERG), Politecnico di Torino, Corso Duca degli Abruzzi 24, 10129 Torino, Italy
*
Author to whom correspondence should be addressed.
Fire 2023, 6(4), 129; https://doi.org/10.3390/fire6040129
Submission received: 8 February 2023 / Revised: 17 March 2023 / Accepted: 20 March 2023 / Published: 23 March 2023
(This article belongs to the Special Issue Advances in Fire Suppression)

Abstract

:
This article presents a numerical analysis of the performance of three water mist fire suppression systems, with different characteristics, on shielded fires as representing more realistic fire scenarios in an enclosure. A diesel pool fire with a peak heat release rate (HRR) value of 75 kW is covered by an obstacle above it with different shielding conditions to investigate the influence of the obstacle size and the vertical distance between the obstacle and the nozzle on the efficiency of the water mist systems. The obstacle prevents a large number of droplets from directly reaching the fuel surface and flames. The modeling and numerical analysis of this study were carried out by the fire dynamics simulator (FDS) programming tool, and the designed model was validated against the experimental data for both dry and wet tests. The results show that two of the analyzed mist sprays could successfully extinguish the shielded fires in a short time with an obstacle size of 25 cm × 25 cm and 50 cm × 50 cm, placed at two heights. However, the third mist system had a longer extinguishing time compared to the first two nozzles. All three nozzles failed to suppress the fire covered by the largest obstacle (1 m × 1 m). The shielding conditions and nozzle characteristics can affect the performance of water mist systems to some extent.

1. Introduction

Due to the increasing number of fire incidents and hazards in different spaces, the development of active fire suppression systems has been at the center of attention recently. Fire suppression systems are effective tools to control and extinguish fires preventing death and injury, and severe damage to structures. Water-based fire suppression systems, including water mist and water sprinkler systems, have been developed to control fires effectively. According to NFPA 750 [1], water mist systems are classified into various types based on different criteria, including system application, nozzle type, system operation method, and system media type. Water mist systems can also be categorized as low-pressure (pressure ≤ 12.1 bar), intermediate-pressure (12.1 bar < pressure < 34.5 bar), and high-pressure (34.5 bar ≤ pressure) systems. The working pressure of the nozzles can change the mist droplet size and dominant fire-extinguishing mechanisms.
The fire extinguishing performance of water mist systems has been discussed in recent years. Although experimental fire tests (large-scale or reduced-scale experiments) are generally very costly, their obtained results are valuable and significant in order to design more effective fire suppression systems. There have been several experimental tests analyzing the performance of water mist systems in various spaces like tunnels and enclosures [2,3]. Laser-based experimental tests have been carried out to study water mist and nozzle characteristics. These techniques, such as that facilitated by a phase doppler particle analyzer (PDPA), have been developed to measure droplet size distribution and to find out the optimal droplet size [4,5]. Laser experiments have been employed to measure different characteristics, such as Sauter mean diameter (SMD, D32), velocity, cumulative volume diameter (CVM), and volumetric median diameter (VMD, Dv,50). For instance, the characteristics of a low-pressure twin-fluid water mist system were measured using a particle/droplet image analyzer (PDIA) technique to find out the optimum conditions for extinguishing small pool fires [4]. Many studies have performed other laser-based techniques to investigate the spray behavior and droplet size measurements [6,7,8].
In addition to the characterization studies, many efforts have been made to assess and optimize the performance of water mist systems for different fire scenarios [9,10,11,12]. Yinshui et al. [13] suggested two ways to improve the suppression performance of water mist systems. The first method is to decrease the flow rate and the spray angle and increase the water discharge duration. The second way is to increase the flow rate and the spray angle and reduce the water discharge duration. Other parameters, like the ventilation condition in tunnels, can also impact the performance of water mist systems. Fan et al. [14] investigated the effect of longitudinal ventilation in a tunnel fire, and they proposed the optimal condition of a water mist system.
As mentioned before, due to the cost of experimental tests and engineering constraints, numerical tools have been developed to simulate different fire scenarios. The fire dynamics simulator (FDS) developed by the National Institute of Standards and Technology (NIST-USA) is a popular open-source computational fluid dynamics (CFD) tool in the fire science literature, and numerous research works have employed FDS to simulate different fire scenarios and water mist systems [15,16,17]. The FDS prediction on the effectiveness of mist application for different fire scenarios has been discussed and challenged by these researchers. The details of the FDS modeling of the current work will be demonstrated in the next section. Several papers have focused on the performance of water mist systems in extinguishing fire scenarios in different environments like tunnels [18,19,20]. The immediate temperature drop after using water mist systems was seen in an FDS modeling of an enclosed-space fire suppression [21]. Although there are several successfully validated models in the literature proving the capability of FDS for extinguishing simulations, Kim and Ryou [22] reported their failure to simulate the suppression stage.
In real fire scenarios, the fire can be blocked by obstacles preventing mist droplets from directly reaching flames and fuel surfaces. These obstacles above the fire can represent the ceiling of cars and trains in road or railway tunnel fires or any other kind of shields in enclosure fires. Thus, investigating the interaction between mist droplets and the shielded fire is important. Fire extinguishing mechanisms, including endothermic cooling, oxygen displacement, thermal radiation attenuation, and kinetics disturbance, are involved in suppressing class A and B fires to some extent [23]. Ferng and Liu [15] demonstrated that the dominant extinguishing mechanism for larger droplets is fuel surface cooling, and for finer droplets, oxygen displacement and evaporation are used. However, the dominant extinguishing mechanism in shielded fire suppression scenarios should be further discussed. The general fire-extinguishing mechanisms are depicted in Figure 1. There is a limited number of research studies focusing on shielded fires and suppression systems [24,25,26]. They have tried to assess the plume–spray thrust ratio and the interaction between the upward fire plume thrust and the downward water mist thrust defined by Alpert [27].
Our current knowledge about shielded fires and proper extinguishing systems is very limited. The shielded fire is a more realistic fire scenario, and the complex physics happening in the area of shielded fire suppression is still unknown. In the current work, three different water mist systems, including low-pressure and high-pressure single-orifice nozzles, are employed to numerically investigate their capabilities to extinguish or control the shielded fire in an enclosure using FDS. Three different obstacle sizes, two different vertical distances between the obstacle and the nozzle, and different nozzle characteristics are considered the variables of this paper. The validation of the FDS model against the experimental data and the grid sensitivity analysis are reported in detail. A total number of 23 cases are defined, and the results are evaluated in terms of the extinguishing time, the HRR evolution, and the temperature fields and the capability of water mist systems to control fires with various shielding conditions is discussed. This research work contains valuable outputs that are useful for advancing mist technology and performance-based designs.

2. Methodology

2.1. Numerical Procedure in FDS

One of the most reliable tools in fire-related topics is FDS (version 6.7.9) to solve the Navier-Stokes equations for low-speed flows based on Large Eddy Simulations (LES) [28]. In order to visualize the results for postprocessing purposes, Smokeview (SMV) program is used [29]. Some scripts are also written in MATLAB and Python environments for better data visualization.
The basic governing equations in FDS, including mass, momentum, and energy conservation equations and Radiation Transport Equation (RTE), are coupled to solve the fire-mist problem. It should be noted that interested readers can refer to the FDS technical reference guide [30] for detailed mathematical modeling of FDS and formulations. In addition to the above-mentioned equations, the initial and boundary conditions must be defined, and the equation of state should be added to make the complete set of equations. It is worth mentioning that in FDS, air, fuel, and products consisting of primitive species are considered lumped species to formulate combustion. Moreover, a pressure zone is defined in this study by considering a bigger computational domain, and the external boundaries are selected as ‘OPEN’. For air extraction, the ‘EXHAUST’ vent is considered as the volumetric flow of the air blower is known. The general steps of the numerical procedure of this study are depicted in Figure 2.
According to [28], there are three basic principles for simulating the water suppression phenomenon in FDS, namely, transporting the water droplets through the air, tracking the water along the solid surface, and predicting the reduction of the burning rate. The local mass loss rate of the fuel and, consequently, HRR in the suppression model of FDS is formulated as follows [28]:
m ˙ f ( t ) = m ˙ f , 0 e   k ( t ) d t
where m ˙ f , 0 is the mass loss rate per unit area in case of dry test, and k ( t ) is a function of the water mass per unit area ( m ˙ w ) and is defined as follows:
k ( t ) = α m ˙ w ( t )
The coefficient α is obtained experimentally or through sensitivity analysis. In FDS, an ‘e_coefficient’ can be introduced to see the reduction in the burning rate in HRR curves after nozzle activation.
The extinction and evaporation models in FDS and their formulations are demonstrated here and can also be found in [28,30]. In order to simulate the flame extinction using water mist droplets, two extinction models, namely ‘EXTINCTION 1’ and ‘EXTINCTION 2’ are introduced in FDS. The ‘EXTINCTION 1’ model is based on oxygen concentration, whereas the ‘EXTINCTION 2’ model is based on both fuel and oxygen concentration. In the current work, ‘EXTINCTION 2’ is implemented into the model. In this model, the Critical Flame Temperature (CFT— T O I ) is of importance, and if the temperature of a cell goes below the CFT, the fire is suppressed. The CFT can be calculated as follows:
T O I = T 0 + X O I Δ H c r n c p ¯  
where T 0 , X O I , Δ H c r , n , and c p ¯ are the initial temperature of the fuel/air mixture, the limiting oxygen volume fraction, the heat of combustion per mole of oxygen consumed, the number of moles of products of combustion per mole of fuel/air mixture, and the average heat capacity of products of combustion, respectively [28].
Additionally, in order to capture the evaporation effect of water mist droplets on the fire suppression process, it is critical to understand and define the evaporation model in FDS. The heat and mass transfer in this model can be estimated as follows [31]:
d m p d t = A p , s h m ρ f ( Y α , l Y α , g )  
ρ g V d Y α , g d t = ( 1 Y α , g ) d m p d t  
d T p d t = 1 m p c p [ q ˙ r + A p , s h g ( T g T p ) + A p , s h w ( T w T p ) + d m p d t h v ]  
d T g d t = 1 m g c g [ A p , s h g ( T p T g ) + d m p d t ( h α , p h α , g ) ]  
d T w d t = A p , s h w m w c w ( T w T p )  
where the subscripts α , g, and p refer to the gas species, the average of the quantity in the cell occupied by the droplet, and the liquid droplet, respectively. Y α , l is the liquid equilibrium vapor mass fraction, Y α , g represents the local gas phase vapor mass fraction, T p stands for the droplet temperature, T g is the local gas temperature, m p displays the droplet mass, c p stands for the specific heat of the liquid, A p , s is the surface area of the liquid droplet, h m shows the mass transfer coefficient, q ˙ r is the droplet radiative heating rate, ρ g represents the gas density, h α , g is the vapor-specific enthalpy, c g shows the gas-specific heat, h g is the heat transfer coefficient between the droplet and the gas, Y α , g is the vapor mass fraction of the gas, m g  is the mass of the local gas, ρ f denotes the density of the particle film, m w ,   h w , and c w represent the mass of the first node of the solid, the heat transfer coefficient between the droplet and the solid, and the solid specific heat, respectively. It should be noted that Equation (8) is employed when the droplets hit a wall surface.
After demonstrating the mathematical and physical explanations of the model, the geometry and computational domain of the model are defined. The details about the simulation process are presented in the next section.

2.2. Simulation Model

The dimensions and the properties of the compartment, and the fuel and material characteristics are chosen according to the data presented by Jenft et al. [32]. The size of the room is 4.20 × 4.30 × 3.05 m3, and the material properties are given in Table 1. The diesel pool fire is defined by introducing a steel pan in the middle of the compartment with the size of 30 × 30 × 10 cm3. The properties of the diesel are mentioned in Table 2. The pyrolysis is introduced to the model by defining a specific heat release rate per unit area (HRRPUA—kW/m2) and a peak HRR value of 75 kW. The HRR evolution is also extracted from [32], and it is implemented into the model using a time ramp via the ‘RAMP_Q’ function in FDS. The geometry of the FDS model representing the walls, the nozzle, the pool fire, and the obstacle is displayed in Figure 3a, and the cross-section of the model showing the grid can be seen in Figure 3b.
Three single-orifice water mist systems with different nozzle characteristics, including the operating pressure, the droplet size distribution, and the cone angle, were used in this study. In order to analyze the effectiveness of water mist systems to control and extinguish the shielded diesel fire, a variety of input and output parameters were considered. The variables include the size of the obstacle, the vertical distance between the obstacle and the nozzle, and the characteristics of the nozzle. The characteristics of the nozzles can be seen in Table 3. In this paper, a total number of 23 different cases have been defined, as shown in Table 4. It is worth mentioning that a useful way to predict the movement of liquid droplets on horizontal surfaces, like shielded fire cases, is to employ the ‘ALLOW_UNDERSIDE_PARTICLES=T’ function in FDS [28]. The obstacle sizes include 25 cm × 25 cm (Obstacle 1), 50 cm × 50 cm (Obstacle 2), and 1 m × 1 m (Obstacle 3) at two heights: 800 mm (H1) and 1500 mm (H2) above the floor. In Table 4, different categories are defined with respect to the nozzle and height numbers; for instance, N1H1 refers to cases in which nozzle 1 is used, and the obstacles are located at a height of 800 mm above the floor. It should be noted that the HRR value of all cases is 75 kW.

3. Results and Discussion

3.1. Grid Sensitivity Analysis

The aim of the grid resolution study is to find out a trade-off between the accuracy of the model and the computational cost in which the cell size does not affect the results significantly. The characteristic fire diameter is calculated as the following equation, suggested by the FDS user’s guide [28]:
D * = ( Q ˙ ρ c p T g ) 2 / 5
where Q ˙ is HRR, and ρ ,   c p ,   a n d   T are the density, the specific heat, and the temperature of the ambient, respectively. The nondimensional quantity D * δ x is then applied to define the proper grid size for buoyant plume simulations, where δ x is the nominal size of a mesh cell. In the current study, the sensitivity analysis was carried out considering three cases with the same characteristics but different mesh sizes, including coarse, moderate, and fine, with the total number of grid cells varying from about 300,000 to almost 1,700,000. The average temperature distribution along a vertical line that is lateral to the fire (from the floor to the ceiling) between 50 s and 150 s after ignition is illustrated in Figure 4. It should be noted that all three sets of meshes are selected based on an acceptable range of cell numbers for this study.
The temperature deviation between the moderate and the fine meshes, which follow the same trend, does not go beyond 7%. However, this percentage for the coarse mesh is 13% compared to the fine mesh. The deviation of the quantities between the moderate mesh and the fine mesh is not significant. Therefore, the moderate mesh was selected for further studies, which has reasonable accuracy and an acceptable computational time. The selected model has a single mesh with a total number of approximately 500,000 cells.

3.2. Model Validation

3.2.1. Dry Test Validation

The simulation results of the basic case (case I—no water mist application) were compared with the experimental data of Reference [32] for the diesel pool fire dry test validation with a peak HRR value of 75 kW. The comparison of the results for O2 concentration near the exhaust fan is displayed in Figure 5a. The average difference between the results is below 1%, and the simulation outputs are perfectly matched with the experimental data for this quantity. Moreover, the temperature was recorded at the heights of 50 cm, 150 cm, 250 cm, and 290 cm on a thermocouple tree with 140 cm offset from the central axis of the room in the corner. From Figure 5b, it can be seen that the simulation results are in good agreement with the data from the experiments; however, the FDS model generally overpredicts the temperature values in the corner axis at the height of 50 cm by a maximum difference of 20%. This percentage decreases at a higher altitude, from 150 cm to 290 cm, by a maximum deviation of 10%. The maximum temperature discrepancy between the results does not exceed 18 °C.

3.2.2. Wet Test Validation

In addition to the dry test validation, the wet test validation (using a water mist system) was also carried out using experimental data. In this regard, the water mist system, with the same characteristics as mentioned in Reference [32] (see Table 3—nozzle 3), was introduced into the model, and the outputs were compared with the experimental data.
For the wet test validation, the simulation time was set to 700 s, and the nozzle activation time was 540 s after ignition (case II). As can be seen in Figure 6, the comparisons can be analyzed in two parts: before and after nozzle activation. Before nozzle activation, the deviation in the results for both temperature and oxygen concentration values is small. However, the difference between the results is higher after nozzle activation. The FDS model showed an immediate increase in O2 concentration after mist activation. However, the maximum deviation does not go beyond 5%, with an average difference of below 3%. This shows a good match between the results. Qualitatively speaking, the temperature decreases for both the experimental and simulation measurements follow the same trend after nozzle activation in the wet test, but this reduction is sharper for FDS modeling. Generally, FDS overestimates the impact of the mist droplets on the reduction in temperature. The same behavior and observation (for both dry and wet validations) were seen in the FDS model of Reference [32], and the complete explanation was also reported in that article. Considering the delay in data logging and experimental bias, the validation results are satisfactory for the wet test. After validation, the current model can be used to further study the performance of water mist systems and the shielded fire suppression process.

3.3. HRR and Temperature Fields

The HRR evolution and the designed fire curve are defined according to [32] in FDS. For the early application of the water mist, the nozzles are activated 75 s after ignition (the HRR at the time of activation is around 50 kW—the fire is not fully developed). For cases with different obstacle scenarios, the HRR and temperature curves are plotted to compare the evolution after nozzle activation. In this study, the criterion for comparing the extinguishing time for any case is the time when HRR becomes zero.
In Figure 7a, the HRR comparison for cases III to VI (nozzle 1) is illustrated. The only case where the water mist system was unable to suppress the pool fire completely is case VI, in which the obstacle is 1 m × 1 m in size and is located 800 mm (H1) above the floor. In this case, the pool fire is completely covered by the obstacle, and the droplets are unable to reach the fire plume or the fuel surface. In case IV, the water mist system was able to extinguish the fire around 7 s after nozzle activation. Cases III and IV represent almost the same behavior, where the burning rate decreases to zero sharply after activation. In case IV, the obstacle is the smallest, and the mist droplets could reach the flame and the fuel surface. The longest extinguishing time among the suppressed cases belongs to case V, in which the mist nozzle extinguished the fire after almost 37 s. In this case, although the fire was blocked by the obstacle, some droplets could bypass the obstacle and reach the flame.
The temperature evolution of different cases is also illustrated. The temperature values were obtained in three thermocouple trees: one in the center axis of the room above the fire, and the other two in the corners, 1 m away from the central axis. Only the temperature evolution in the corners is shown here. The temperatures were measured at different heights, from 50 cm above the floor up to 290 cm. Figure 7b,c show the temperature evolution for cases using the early application of nozzle 1. The temperature first decreased with nozzle activation in case VI (the largest obstacle) but then increased rapidly up to 45 °C. In other cases, the temperature went down sharply and stayed at a constant value until the end of the simulation. The temperature was controlled successfully for the extinguished cases after the activation of nozzle 1. The flame temperature plots are not shown here; however, as the fire was suppressed quickly in cases III to V, the flame temperature at the thermocouple tree above the fire (from 30 cm to 50 cm above the fire) dropped to the ambient temperature after activation. On the other hand, the near flame temperature for case VI (failed suppression case) did not change significantly and kept fluctuating up to 800 °C for the closest thermocouples to the fuel surface.
Figure 8a shows the HRR evolution for four cases using the second nozzle. As can be seen, the water mist system was unsuccessful in suppressing the fire where the obstacle was the largest (case X). However, the mist system could extinguish the shielded fire in other cases. The extinguishing time for cases VII and VIII is below 10 s, but this time increased to around 45 s when the size of the obstacle increased to 50 cm × 50 cm. Figure 8b,c represent the temperature evolution for cases VII to X at 50 cm and 290 cm above the floor in the corner of the compartment. In the failed extinguishment case, the temperature in the corner first decreased after nozzle activation, then increased after a few seconds. The temperature was completely controlled in the other cases.
The same visualizations are illustrated for cases XI to XIV using nozzle 3 in Figure 9. For this nozzle, the HRR and temperature distributions also follow the same trends as nozzles 1 and 2. However, the extinguishing time is almost 5 to 10 times the extinguishing time of those cases using the first nozzle with the same k-factor. Nozzle 3 was capable of controlling far-field temperatures at the corners, which is almost the same as the other two nozzles, thanks to its high cone angle (130°). The nozzle acts as a mist curtain around the fire leading to a temperature drop, although the suppression process is slow compared to nozzles 1 and 2. Although the working pressure and the droplet size of this nozzle are almost the same as nozzle 2, the suppression time is longer due to the lower flow rate.
The results for the HRR values of cases XV to XXIII are shown in Figure 10. In order to avoid repetition, only the HRR evolutions are displayed in this figure. In cases XV to XXIII, the obstacle is placed at a height of 1500 mm (H2) above the floor. The water mist system successfully suppressed the fire almost immediately for cases XV and XVI (Figure 10a). For case XVII, nozzle 1 failed to control the fire. Similar to the previous cases, the simulations were carried out for cases XVIII to XX using the second nozzle. As can be seen, nozzle 2 was also unable to suppress the shielded fire when the obstacle was the largest (case XX—Figure 10b). With the use of nozzle 3 (case XXI–XXIII), the same suppression behavior can be seen (Figure 10c). When the obstacle is placed at a height of 1500 mm, the extinguishing time is generally shorter compared to the H1 cases.
In order to compare the nozzles more clearly in terms of the extinguishing time with different shielding conditions, the suppression time of the successful cases is shown in Figure 11. The extinguishing time in case IX is almost 8 s longer than the time in case IV (considering the time that the HRR becomes almost zero). In this regard, the first nozzle with finer droplets and higher pressure excelled over nozzle 2 in the shielded fire application, with an obstacle size of 50 cm × 50 cm. In cases VII and VIII, the extinguishing time is less than 10 s. Nozzles 1 and 2 performed almost the same for those cases in which there was no obstacle and when the obstacle size was the smallest (25 cm × 25 cm). However, the extinguishing time is almost 3 to 11 times longer than nozzles 1 and 2. When the obstacle is closer to the nozzle (H2), the droplets have a better chance to bypass the obstacle, therefore reaching the flames. It should be noted that if the obstacle is very close to the fuel surface or to the nozzle, the fire can be fully covered, preventing mist droplets from reaching the flames or bypassing the horizontal surface. Even though in such scenarios, water mist droplets, especially finer droplets, can occupy the space around the shielded fire, the spray momentum is not sufficient to overcome the buoyant fire plume momentum and, consequently, there will be no penetration to the fire plume and flames.
As depicted before (Figure 1), there are different fire-extinguishing mechanisms involved in the suppression process facilitated by the water mist systems. In shielded fire suppression, the dominant extinguishing mechanisms can be diverse with respect to the shielding condition. When the fire is fully blocked by an obstacle (obstacle 3 in this study), even large droplets cannot penetrate the fuel surface or flames; therefore, the fire can only be controlled through thermal radiation attenuation or oxygen displacement. As mentioned before, all three nozzles failed to extinguish the fire in the existence of the largest obstacle; however, the temperature in the corners of the enclosure decreased. In the shielded fire suppression regarding obstacles 1 and 2, the fire is not fully covered, and larger droplets have a chance to penetrate the fire plume and extract heat from the flames so that the smaller droplets can bypass the obstacle, leading to endothermic cooling, oxygen displacement, and radiation attenuation.
Figure 12a,b show the velocity contour plots at the plane y = 2.15 m in the middle of the compartment for case V, as an example. For the velocity contours, one plot displays 1 s before water mist activation (Figure 12a), and the other one shows 1 s after activation (Figure 12b) in order to compare the effect of the water droplets on the velocity field. As can be observed clearly, the velocity is the highest in the middle, close to the nozzle after activation. The obstacle above the fire prevents most of the droplets from directly reaching the fuel’s surface, as shown in the velocity contour plot after activation.
For the temperature contours, six different plots at the plane y = 2.15 m are shown for case V at different times, including 1 s before activation (Figure 13a) and 1 s (b), 5 s (c), 10 s (d), 25 s (e), and 100 s (f) after activation. It can be seen that, for this fully extinguished case, the flame almost disappeared 25 s after spray activation (the predicted extinguishing time for this case is around 37 s), and the temperature in the upper layers close to the ceiling was higher after suppression. Additionally, the maximum temperature dropped from above 800 °C to around 70 °C 25 s after nozzle activation.

4. Conclusions

In this study, the performance of three single-orifice water mist systems with different characteristics on extinguishing shielded fires in an enclosure was investigated using FDS simulations. The impact of the shielding condition, including three obstacle sizes and two vertical distances from the nozzle, on the shielded fire suppression behavior was thoroughly assessed. A 4.20 m × 4.30 m × 3.05 m enclosure was modeled in FDS, and 23 different cases were defined for comparisons. The diesel pool fire with an HRR peak value of 75 kW was placed in the middle of the compartment. The following conclusions can be drawn:
  • The maximum deviation in O2 concentration between the FDS predictions and the experimental measurements was 1% for the dry test and less than 5% for the wet test. Moreover, the discrepancy in the temperature values did not exceed about 18 °C in both cases;
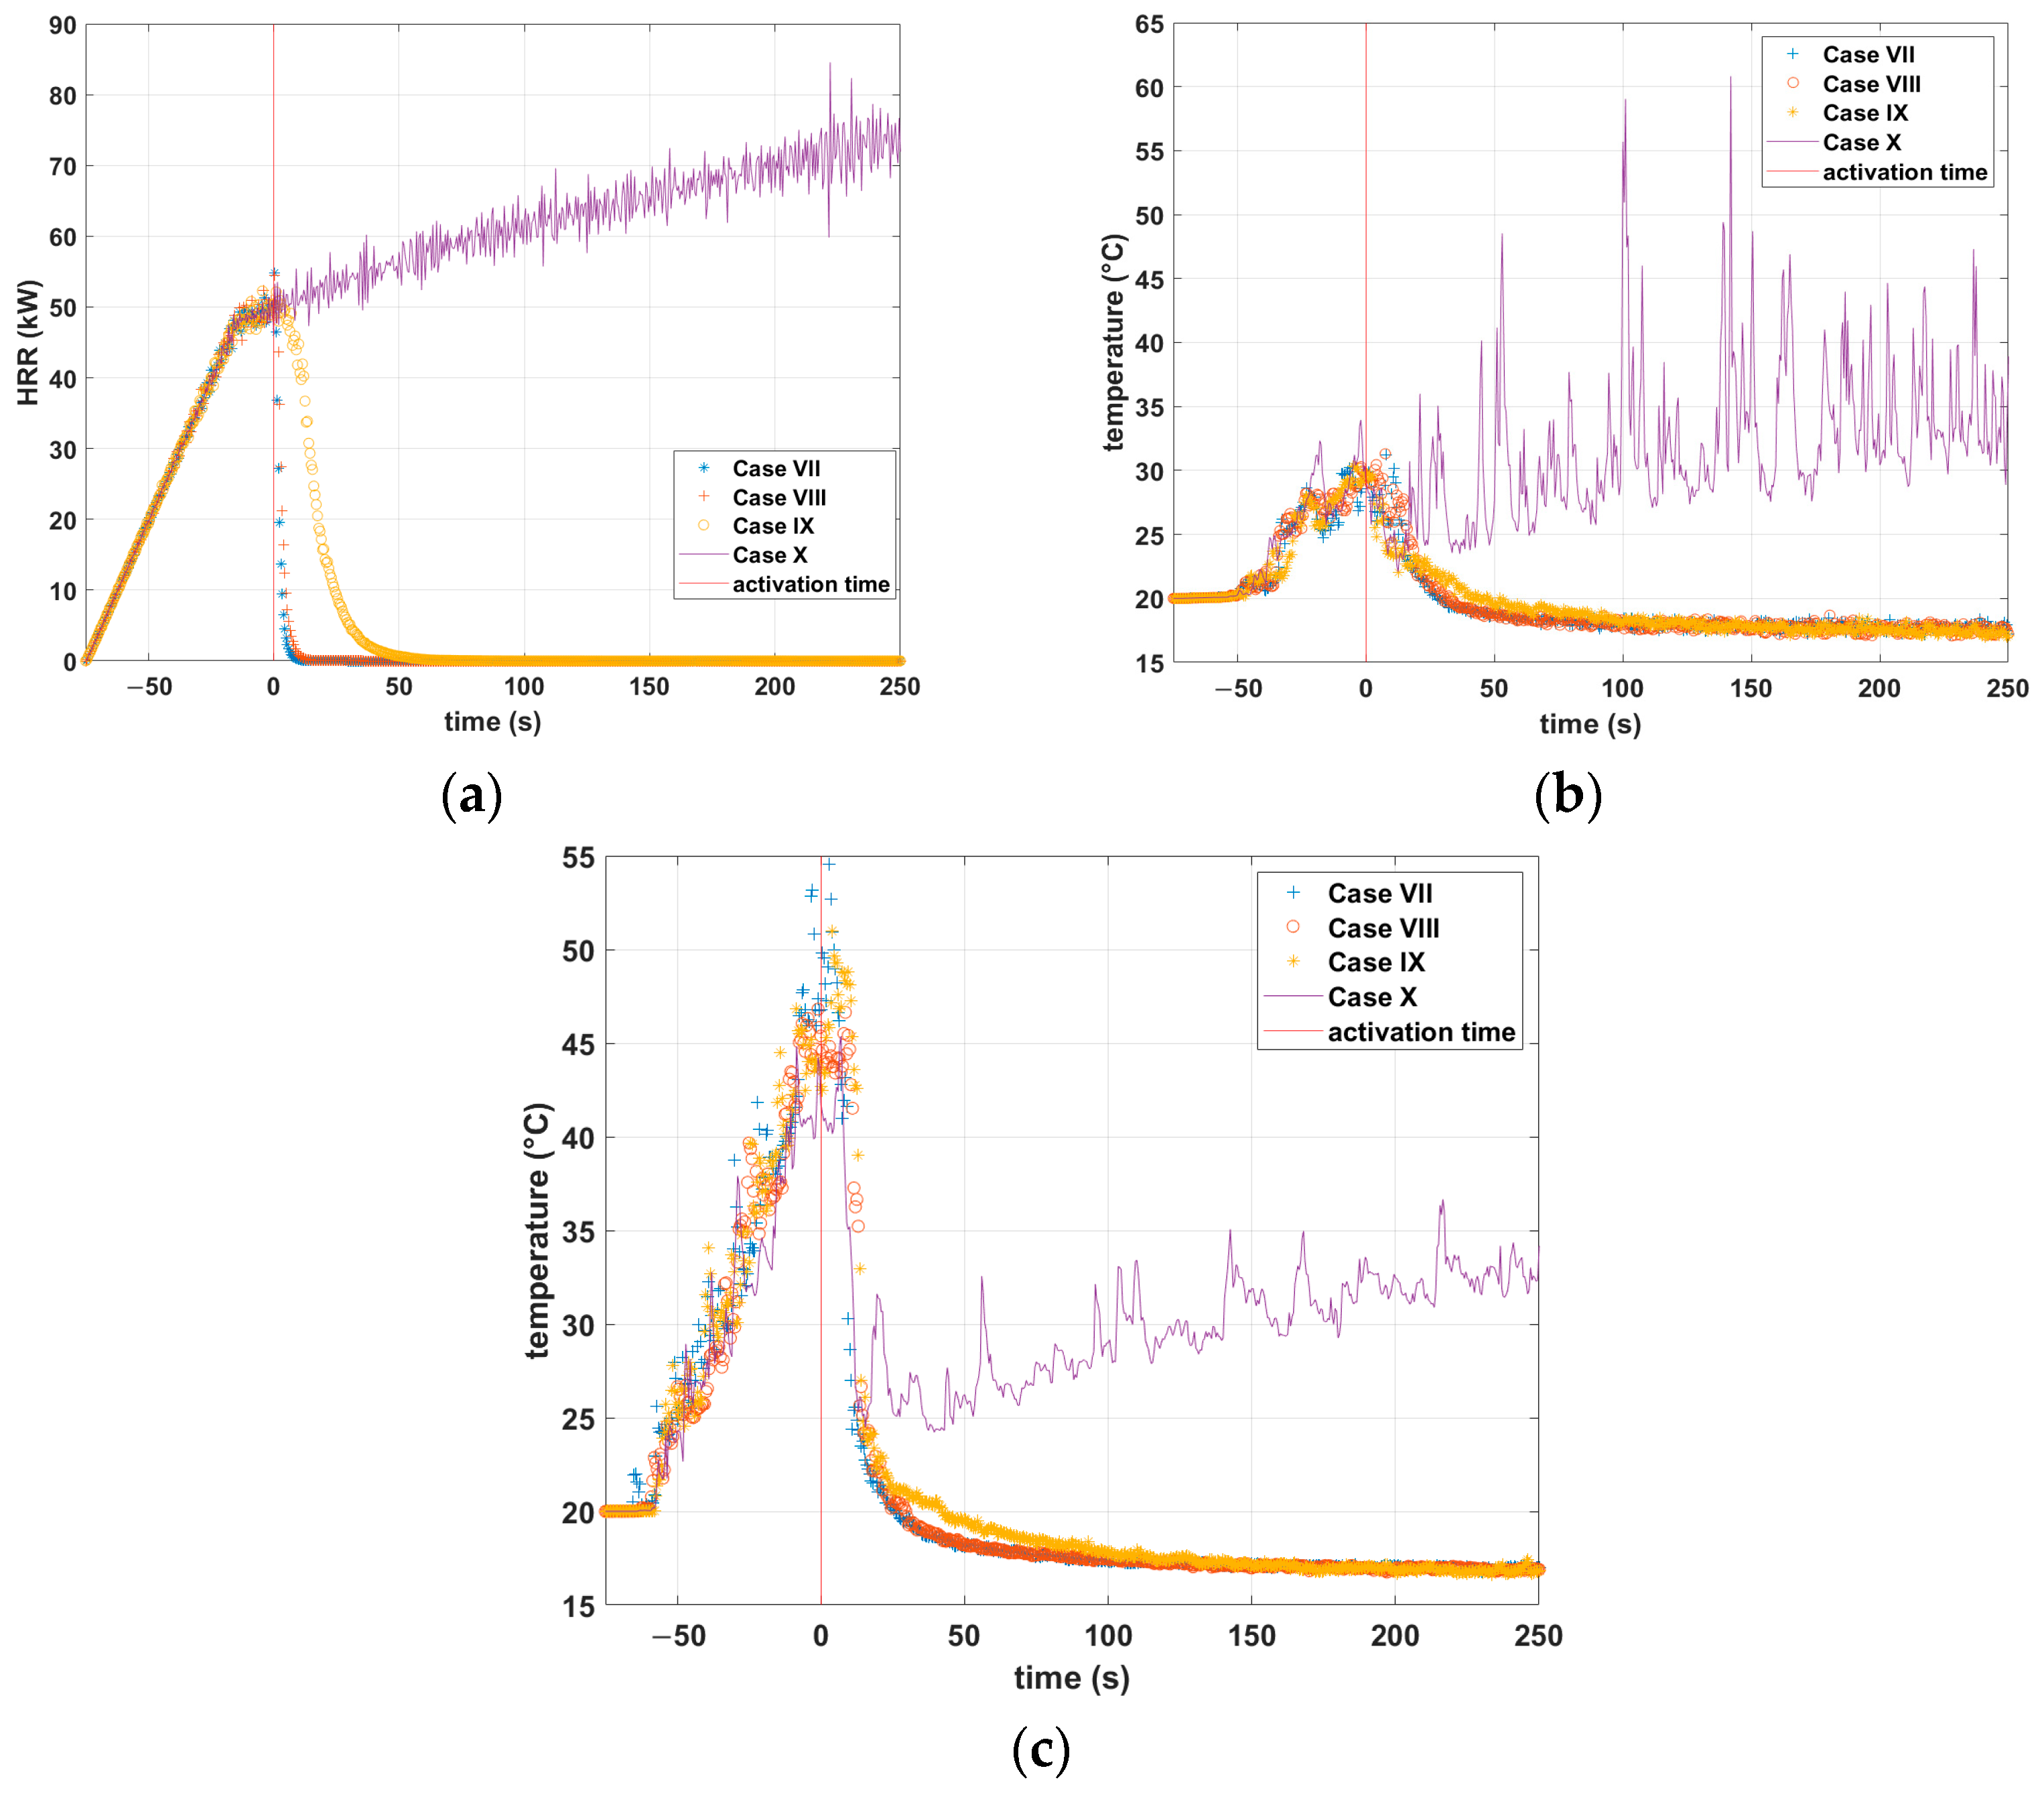
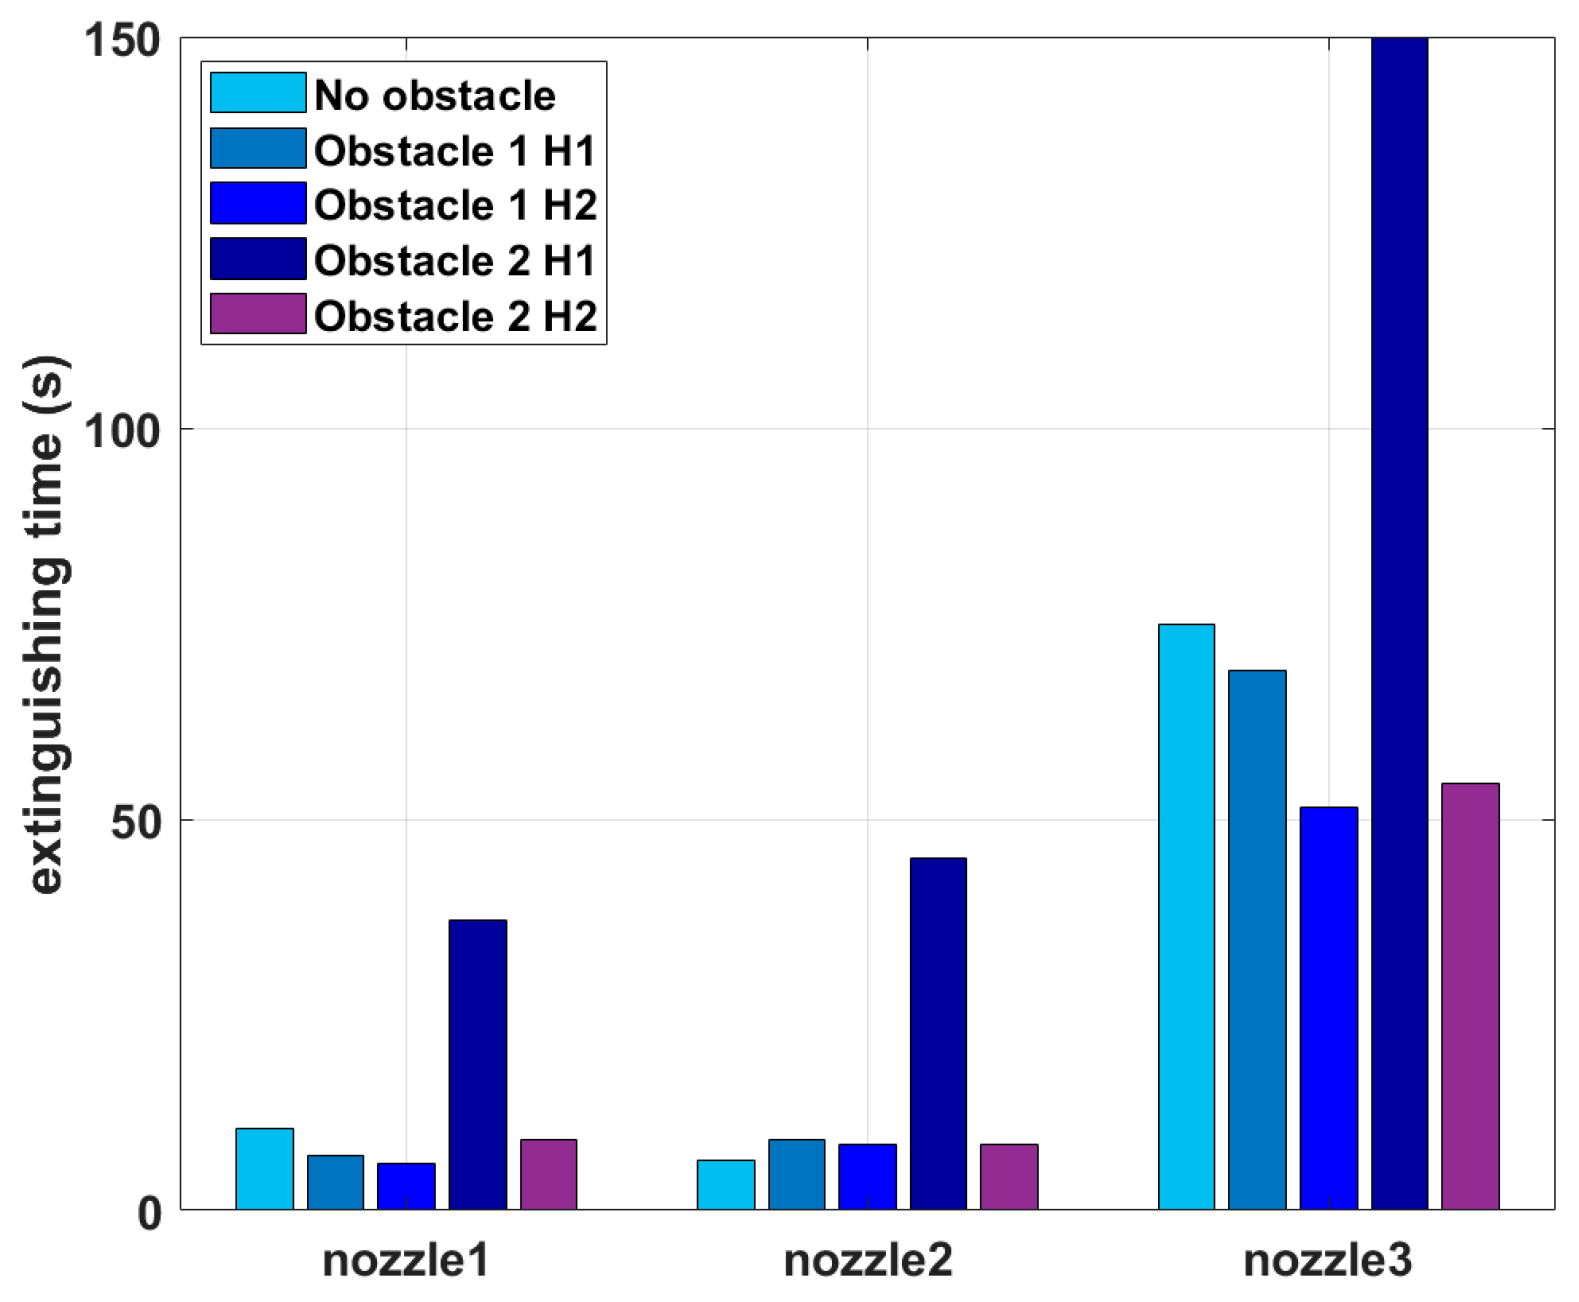
  • The first two nozzles (nozzles 1 and 2) were able to suppress the fire completely in the absence of obstacles in a very short time. However, all three nozzles failed to suppress the shielded fire where the obstacle size was 1 m × 1 m, located at any distance from the nozzle;
  • The high-pressure spray system performed better in terms of the extinguishing time of the shielded fire compared to nozzles 2 and 3, where the obstacle sizes were 25 cm × 25 cm and 50 cm × 50 cm. However, the suppression time using nozzle 2 (low-pressure) was close to nozzle 1 (high-pressure) due to the higher flow rate;
  • Although nozzles 2 and 3 had the same pressure (10 bar) and almost the same droplet size, nozzle 3 had a longer extinguishing time due to a lower flow rate;
  • In the successful cases of extinguishment, the temperature inside the enclosure decreased sharply after nozzle activation;
  • The obstacle size, its distance from the nozzle, and the nozzle characteristics are critical parameters in the study of shielded fire suppression;
  • When the fire is not fully covered by the obstacle, a portion of droplets can penetrate the flame by overcoming the plume thrust and bypassing the obstacle.
The authors recommend that researchers perform more experimental tests and simulations to investigate different water mist systems in the case of shielded fires and to analyze the fire extinguishing mechanisms. Moreover, the nozzle application time (early or late application) as an effective parameter can be taken into consideration.
Our future work will focus on experimental shielded fire suppression tests with different shielding conditions to further develop the FDS models.

Author Contributions

Conceptualization, V.V. and R.B.; methodology, A.H. and V.V.; software, A.H.; validation, A.H.; formal analysis, A.H.; writing—original draft preparation, A.H.; writing—review and editing, V.V. and R.B.; visualization, A.H.; supervision, V.V. and R.B.; project administration, V.V. and R.B.; funding acquisition, V.V. and R.B.; All authors have read and agreed to the published version of the manuscript.

Funding

This research received no external funding.

Institutional Review Board Statement

Not applicable.

Informed Consent Statement

Not applicable.

Data Availability Statement

Not applicable.

Acknowledgments

Computational resources were provided by HPC@POLITO, a project of Academic Computing within the Department of Control and Computer Engineering at Politecnico di Torino (http://www.hpc.polito.it).

Conflicts of Interest

The authors declare no potential conflict of interest.

References

  1. NFPA 750; Standard on Water Mist Fire Protection Systems. National Fire Protection Association: Quincy, MA, USA, 2006.
  2. Li, Q.; Tang, Z.; Fang, Z.; Yuan, J.; Wang, J. Experimental study of the effectiveness of a water mist segment system in blocking fire-induced smoke and heat in mid-scale tunnel tests. Tunn. Undergr. Space Technol. 2019, 88, 237–249. [Google Scholar] [CrossRef]
  3. Gupta, M.; Pasi, A.; Ray, A.; Kale, S.R. An experimental study of the effects of water mist characteristics on pool fire suppression. Exp. Therm. Fluid Sci. 2013, 44, 768–778. [Google Scholar] [CrossRef]
  4. Tian, G.; Li, H.; Xu, H.; Li, Y.; Raj, S.M. Spray characteristics study of DMF using phase doppler particle analyzer. SAE Int. J. Passeng. Cars Mech. Syst. 2010, 3, 948–958. [Google Scholar] [CrossRef]
  5. Wang, Z.; Wang, X.; Huang, Y.; Tao, C.; Zhang, H. Experimental study on fire smoke control using water mist curtain in channel. J. Hazard. Mater. 2018, 342, 231–241. [Google Scholar] [CrossRef]
  6. Jeong, C.S.; Lee, C.Y. Experimental investigation on spray characteristics of twin-fluid nozzle for water mist and its heptane pool fire extinguishing performance. Process Saf. Environ. Prot. 2021, 148, 724–736. [Google Scholar] [CrossRef]
  7. Husted, B.P.; Petersson, P.; Lund, I.; Holmstedt, G. Comparison of PIV and PDA droplet velocity measurement techniques on two high-pressure water mist nozzles. Fire Saf. J. 2009, 44, 1030–1045. [Google Scholar] [CrossRef]
  8. Ditch, B.; Yu, H.-Z. Characterization of Water Mist Sprays Using a Phase-Doppler-Particle-Analyzer and an Iso-Kinetic Sampling Probe. In Proceedings of the ASME 2004 Heat Transfer/Fluids Engineering Summer Conference, Charlotte, NC, USA, 11–15 July 2004; pp. 221–230. [Google Scholar] [CrossRef]
  9. Qin, J.; Chow, W.K. Experimental Data on Water Mist Suppression. Procedia Eng. 2013, 62, 868–877. [Google Scholar] [CrossRef] [Green Version]
  10. Santangelo, P.E.; Tarozzi, L.; Tartarini, P. Full-Scale Experiments of Water-Mist Systems for Control and Suppression of Sauna Fires. Fire 2022, 5, 214. [Google Scholar] [CrossRef]
  11. Yang, P.; Liu, T.; Qin, X. Experimental and numerical study on water mist suppression system on room fire. Build. Environ. 2010, 45, 2309–2316. [Google Scholar] [CrossRef]
  12. Zhou, Y.; Bu, R.; Zhang, X.; Fan, C.; Gong, J. Performance evaluation of water mist fire suppression: A clean and sustainable fire-fighting technique in mechanically-ventilated place. J. Clean. Prod. 2019, 209, 1319–1331. [Google Scholar] [CrossRef]
  13. Yinshui, L.; Zhuo, J.; Dan, W.; Xiaohui, L. Experimental research on the water mist fire suppression performance in an enclosed space by changing the characteristics of nozzles. Exp. Therm. Fluid Sci. 2014, 52, 174–181. [Google Scholar] [CrossRef]
  14. Fan, C.; Bu, R.; Xie, X.; Zhou, Y. Full-scale experimental study on water mist fire suppression in a railway tunnel rescue station: Temperature distribution characteristics. Process Saf. Environ. Prot. 2021, 146, 396–411. [Google Scholar] [CrossRef]
  15. Ferng, Y.-M.; Liu, C.-H. Numerically investigating fire suppression mechanisms for the water mist with various droplet sizes through FDS code. Nucl. Eng. Des. 2011, 241, 3142–3148. [Google Scholar] [CrossRef]
  16. Wang, Z.; Wang, W.; Wang, Q. Optimization of water mist droplet size by using CFD modeling for fire suppressions. J. Loss Prev. Process Ind. 2016, 44, 626–632. [Google Scholar] [CrossRef]
  17. Sikanen, T.; Vaari, J.; Hostikka, S.; Paajanen, A. Modeling and Simulation of High Pressure Water Mist Systems. Fire Technol. 2014, 50, 483–504. [Google Scholar] [CrossRef]
  18. Liang, Q.; Li, Y.; Li, J.; Xu, H.; Li, K. Numerical studies on the smoke control by water mist screens with transverse ventilation in tunnel fires. Tunn. Undergr. Space Technol. 2017, 64, 177–183. [Google Scholar] [CrossRef]
  19. Wang, J.; Nie, Q.; Fang, Z.; Tang, Z. CFD Simulations of the Interaction of the Water Mist Zone and Tunnel Fire Smoke in Reduced-scale Experiments. Procedia Eng. 2018, 211, 726–735. [Google Scholar] [CrossRef]
  20. Magdolenová, P. CFD Modelling of High-Pressure Water Mist System in Road Tunnels. Transp. Res. Procedia 2021, 55, 1163–1170. [Google Scholar] [CrossRef]
  21. De Cachinho Cordeiro, I.M.; Liu, H.; Yuen, A.C.; Chen, T.B.; Li, A.; Wang, C.; Cao, R.; Yeoh, G.H. On the Large Eddy Simulation Modelling of Water Suppression Systems Droplet Impact and Coverage Area. Fire 2022, 5, 165. [Google Scholar] [CrossRef]
  22. Kim, S.C.; Ryou, H.S. An experimental and numerical study on fire suppression using a water mist in an enclosure. Build. Environ. 2003, 38, 1309–1316. [Google Scholar] [CrossRef]
  23. Mawhinney, J.R.; Back, G.G. Water mist fire suppression systems. In SFPE Handbook of Fire Protection Engineering; Springer: Berlin/Heidelberg, Germany, 2016; pp. 1587–1645. [Google Scholar]
  24. Liu, Y.; Wang, X.; Liu, T.; Ma, J.; Li, G.; Zhao, Z. Preliminary study on extinguishing shielded fire with water mist. Process Saf. Environ. Prot. 2020, 141, 344–354. [Google Scholar] [CrossRef]
  25. Liu, Y.; Fang, Z.; Tang, Z.; Beji, T.; Merci, B. The combined effect of a water mist system and longitudinal ventilation on the fire and smoke dynamics in a tunnel. Fire Saf. J. 2021, 122, 103351. [Google Scholar] [CrossRef]
  26. Beihua, C.; Guangxuan, L.; Zhen, H. Extinction Limit of Diesel Pool Fires Suppressed by Water Mist. J. Fire Sci. 2009, 27, 5–26. [Google Scholar] [CrossRef]
  27. Alpert, R.L. Numerical modeling of the interaction between automatic sprinkler sprays and fire plumes. Fire Saf. J. 1985, 9, 157–163. [Google Scholar] [CrossRef]
  28. McGrattan, K.; Hostikka, S.; McDermott, R.; Floyd, J.; Weinschenk, C.; Overhold, K. Fire Dynamics Simulator User ’s Guide (FDS), 6th ed.; National Institute of Standards and Technology: Gaithersburg, MD, USA, 2020.
  29. Forney, G.P. Smokeview, A Tool for Visualizing Fire Dynamics Simulation Data, Volume I: User’s Guide; National Institute of Standards and Technology: Gaithersburg, MD, USA, 2015; pp. 1011–1017.
  30. McGrattan, K.; Hostikka, S.; Floyd, J.; McDermott, R.; Vanella, M. Fire dynamics simulator technical reference guide volume 1: Mathematical model. NIST Spec. Publ. 2020, 1018, 175. [Google Scholar]
  31. Cheremisinoff, N.P. Encyclopedia of Fluid Mechanics. Vol. 3: Gas-Liquid Flows; Gulf Publishing Company: Houston, TX, USA, 1986. [Google Scholar]
  32. Jenft, A.; Collin, A.; Boulet, P.; Pianet, G.; Breton, A.; Muller, A. Experimental and numerical study of pool fire suppression using water mist. Fire Saf. J. 2014, 67, 1–12. [Google Scholar] [CrossRef]
Figure 1. General fire-extinguishing mechanisms in the presence of water mist spray.
Fire 06 00129 g001
Figure 2. Flow chart of the numerical procedure in FDS for the present study.
Fire 06 00129 g002
Figure 3. (a) Snapshot of the model geometry in FDS and the (b) XZ plane of the grid.
Fire 06 00129 g003
Figure 4. Temperature comparison between three cases for sensitivity study.
Fire 06 00129 g004
Figure 5. Comparison of (a) O2 concentration and (b) temperature evolution between FDS and experimental data [32] (dry test).
Fire 06 00129 g005
Figure 6. Comparison of (a) O2 concentration and (b) temperature between FDS and experimental data [32] (wet test).
Fire 06 00129 g006
Figure 7. (a) HRR evolution for cases III to VI; (b) temperature evolution in the corner at the height of 50 cm for cases III to VI; (c) temperature evolution in the corner at the height of 290 cm for cases III to VI.
Fire 06 00129 g007
Figure 8. (a) HRR evolution for cases VII to X; (b) temperature evolution on the corner at the height of 50 cm for cases VII to X; (c) temperature evolution on the corner at the height of 290 cm for cases VII to X.
Fire 06 00129 g008
Figure 9. (a) HRR evolution for cases XI to XIV; (b) temperature evolution on the corner at the height of 50 cm for cases XI to XIV; (c) temperature evolution on the corner at the height of 290 cm for cases XI to XIV.
Fire 06 00129 g009
Figure 10. (a) HRR evolution for cases XV to XVII; (b) HRR evolution for cases XVIII to XX; (c) HRR evolution for cases XXI to XXIII.
Fire 06 00129 g010
Figure 11. Comparison of extinguishing times in the successfully suppressed cases.
Fire 06 00129 g011
Figure 12. Velocity contour plots for case V (a) at t = 75 s, just before activation, and (b) at t = 76 s, 1 s after activation.
Fire 06 00129 g012
Figure 13. Temperature contour plots for case V (a) at t = 75 s, just before activation, (b) at t = 76 s, just after activation, (c) at t = 80 s, 5 s after activation, (d) at t = 85 s, 10 s after activation, (e) at t = 100 s, 25 s after activation, and (f) at t = 175 s, 100 s after activation.
Fire 06 00129 g013
Table 1. Material properties.
MaterialConductivity (k) W/mkSpecific Heat (cp) j/kgkDensity (ρ) kg/m3
Concrete1.57510002100
glass17502500
steel504507800
wood0.131600500
Table 2. Fuel properties.
Common FormulaHeat of Combustion (ΔHc) kj/kgSoot Yield kg/kg
DieselC12H2342,2000.059
Table 3. Nozzle characteristics of water mist systems.
Nozzle 1Nozzle 2Nozzle 3
D = 46 µmD = 124.6 µmD = 112 µm
Operating pressure = 100 barOperating pressure = 10 barOperating pressure: 10 bar
Flow rate = 11.9 L/minFlow rate = 22.8 L/minFlow rate: 6.3 L/min
Velocity = 10 m/sVelocity = 42.5 m/sNozzle exit diameter: 0.0008 m
Cone angle = 0–48°Cone angle = 0–90°half injection angle: 65°
K factor = 1.9 L/min/bar1/2K factor = 7.2 L/min/bar1/2K factor: 1.9 L/min/bar1/2
Table 4. Defined simulation cases.
CategoryCase No.Obstacle No.Distance between Obstacle and FloorNozzle NumberActivation Time
ValidationI—dry validation----
II—wet validation--3540 s
III--175 s
N1H1IV1H1175 s
V2H1175 s
VI3H1175 s
VII--275 s
N2H1VIII1H1275 s
IX2H1275 s
X3H1275 s
XI--375 s
N3H1XII1H1375 s
XIII2H1375 s
XIV3H1375 s
N1H2XV1H2175 s
XVI2H2175 s
XVII3H2175 s
N2H2XVIII1H2275 s
XIX2H2275 s
XX3H2275 s
N3H2XXI1H2375 s
XXII2H2375 s
XXIII3H2375 s
Disclaimer/Publisher’s Note: The statements, opinions and data contained in all publications are solely those of the individual author(s) and contributor(s) and not of MDPI and/or the editor(s). MDPI and/or the editor(s) disclaim responsibility for any injury to people or property resulting from any ideas, methods, instructions or products referred to in the content.

