Article

Evaluating Urban Fire Risk Based on Entropy-Cloud Model Method Considering Urban Safety Resilience

School of Resource and Safety Engineering, Central South University, Changsha 410083, China
*
Author to whom correspondence should be addressed.
Submission received: 18 January 2023 / Revised: 6 February 2023 / Accepted: 7 February 2023 / Published: 8 February 2023

Abstract

:
Creating a safe and resilient urban environment is a crucial part of sustainable urban development. Therefore, it is imperative that a city’s safety resilience is evaluated from various perspectives. To evaluate and improve the resilience of urban fire safety more scientifically, this study proposes a theoretical framework for evaluating urban safety resilience based on the triangle model and an index system including fire hazard, regional characteristics, and fire resilience is established. The entropy weight method and cloud model are used for quantitative evaluation, and the weights and risk level ratings are analyzed and discussed. The results demonstrate that the method considering urban safety resilience plays a significant role in promoting the development of urban fire safety and can provide a reference for policymakers in improving fire services.

1. Introduction

Promoting urbanization is a significant part of each country’s modernization and economic development, and the city problem gradually becomes a composite grand subject. The reason is that cities carry more functions such as housing, traveling, industrial production, commercial activities, medical care, and education. In addition, the planning and construction of cities have become increasingly focused on ensuring safety and stability. In China, fire is a main threat to urban safety, and rapid urbanization has simultaneously led to an increase in fire risk [1]. With the increase in building height, it is more difficult to evacuate and rescue when a fire occurs, and fire accidents occur more frequently. According to the data from the China Fire Service Bureau, a total of 636,800 fires were reported in the first three quarters of 2022. The number and direct losses of fires show an overall increasing trend, indicating that the fire situation is still serious, especially electrical fires which are still one of the most important causes of fire. In addition, some new energy or industries constantly bring about new risks of fire. The probability of death in crowded places is relatively high, and the consequences of fire on vulnerable groups are very serious.
But compared to forest fires, little attention is paid to urban fires. From the perspective of urban fires, Turner studied the social and organizational factors associated with unintentional fire events, Jennings reviewed studies on fire risk and incidence from the perspective of socioeconomic parameters and geographic planning, and Hu continued to study typical socioeconomic factors on urban fire risk about developing countries [2,3,4]; Liu et al. analyzed the effects of governmental data governance on urban fire risk, based on data for 105 Chinese cities [5]. In addition, there are also studies combining artificial intelligence algorithms and IoT technologies to identify key points of urban fires, formulate urban fire station planning, and establish fire spread models [6,7,8].
Due to the specificity of the spatial scale, the study of urban fires, unlike single-building fires, will put more emphasis on the association with the whole city. Urban resilience makes cities resilient to disasters with buffering and carrying capacity. However, considering that fire risk and vulnerability of disaster carriers in different areas are dynamically changing, we hope to maintain the level of urban fire safety within an acceptable range. Therefore, urban fire risk evaluation is inextricably linked to urban safety resilience. Many researchers have revealed the relationship between city disaster reduction and construction plans for a safety-resilient city. For example, Burby et al. proposed a conceptual model for urban land use planning oriented to disaster reduction [9]. Anelli et al. established an index method to measure urban natural risk, therefore enhancing the resilience to natural hazards in urban planning [10]. Xu and Xue emphasized the importance of improving the resilience of urban public spaces and explored key indicators, which provided management decision-makers with suggestions for planning and construction [11].
However, there is an absence of comprehensive research about safety resilience and urban fire risk. On this basis, the research structure of this paper is as follows: Section 2 reviews the concept and evolution of urban safety resilience to explore the application scenarios of the triangular theoretical model. Section 3 establishes an index system for urban fire risk based on the triangular safety resilience model and presents the methods used in evaluating risk level—the entropy weighting method and the cloud model. Section 4 obtains the weight of each index through the statistical data of a selected Chinese city and analyzes its situation of fire risk to improve safety resilience and fire safety management. Section 5 summarizes the core idea and expands on the future use of the proposed model.

2. Urban Safety Resilience

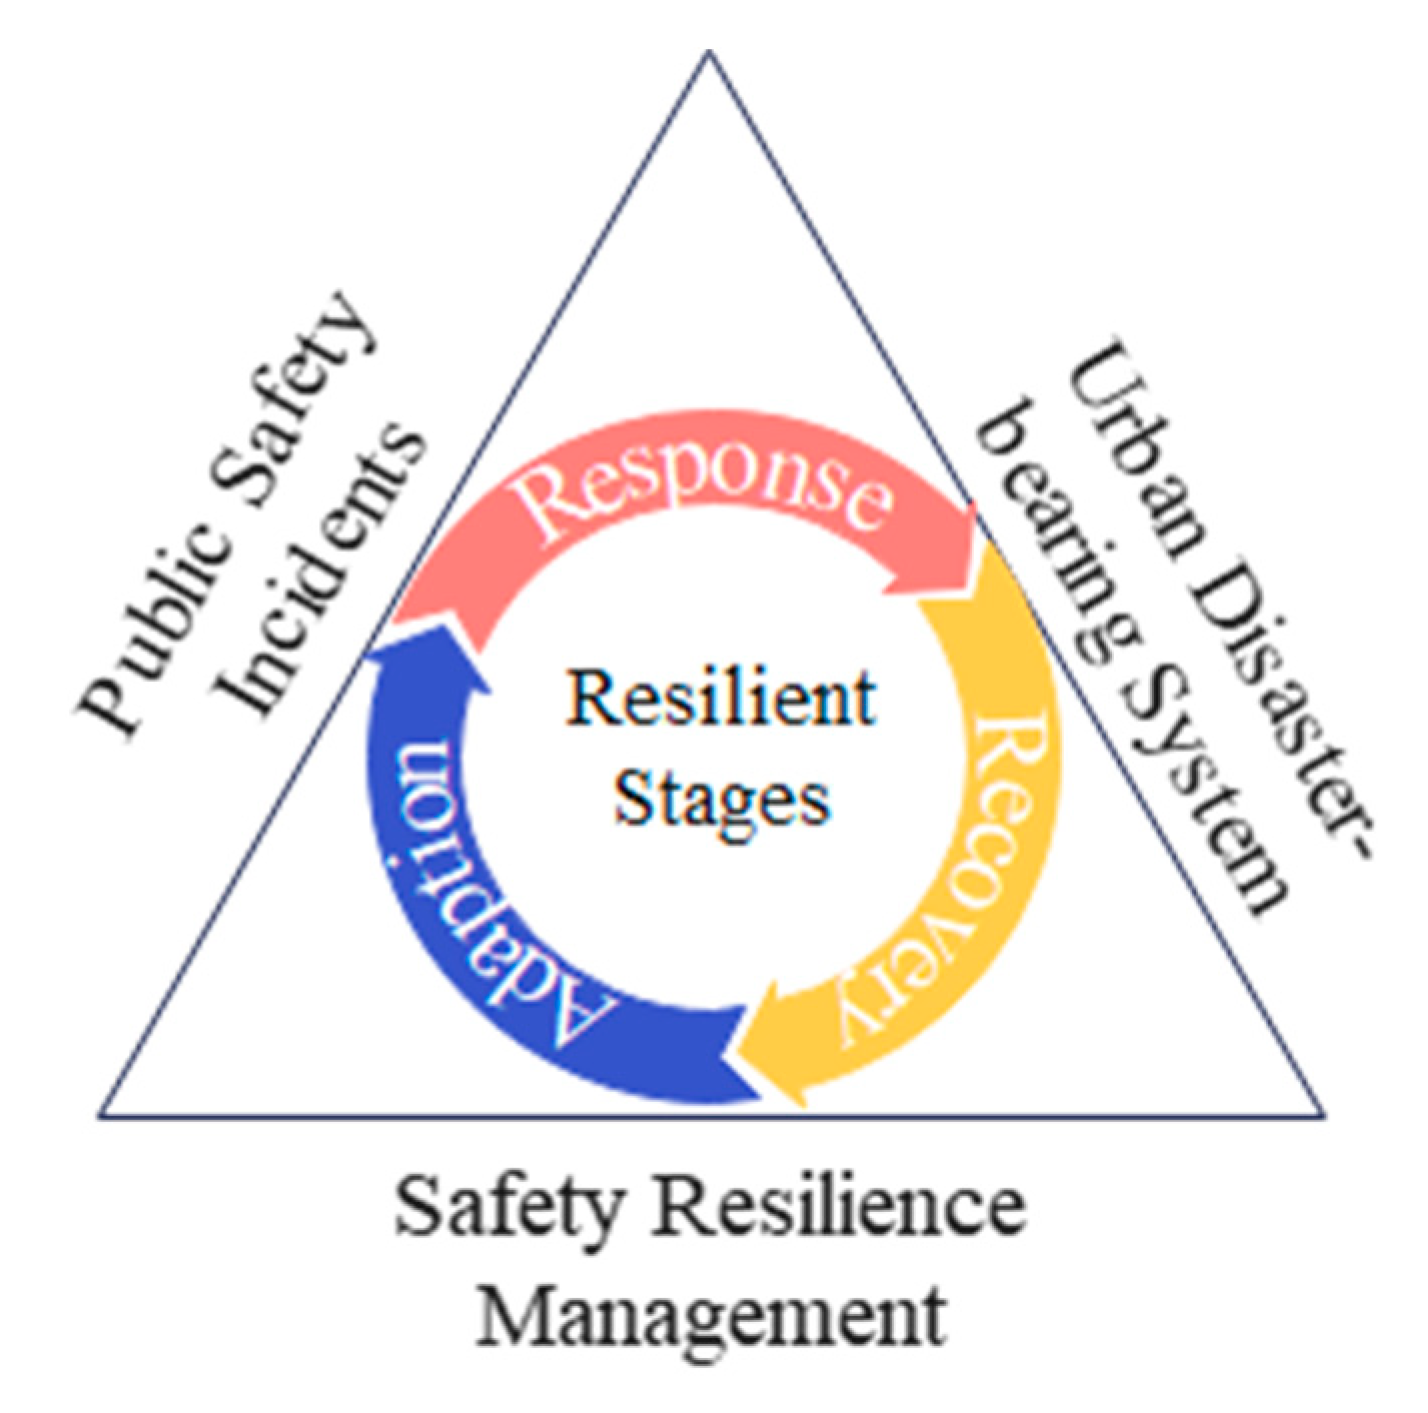
2.1. Concept of Urban Safety Resilience

The concept of resilience originally came from physics and mechanics when referring to the ability of an object to recover its deformation after being deformed by external forces. Later, Holling, a scholar in the field of ecology, introduced it as an indicator to measure the ability of ecosystems to restore their balance [12]. Since then, the theory of resilience has been widely used and promoted from simplified abstract ecosystems and traditional engineering systems to complex multi-stable systems. Cities are not just complex social-ecological systems, they are also disaster-bearing systems with flexible safety functions and primary targets for safety management. From the perspective of enhancing resilience to ensure safety, resilience and safety are closely related, so promoting urban safety resilience has received wide attention as a new topic. Desouza pointed out that safety resilience refers to the ability of urban systems to absorb, adapt, and cope with external changes [13]. Meerow states that urban security resilience is the ability of urban systems and their socio-ecological and socio-technical networks to maintain their state and recover quickly in the face of perturbations to adapt to current or future changes [14]; Marana studies urban security resilience from the perspective of public-private relations and defines it as the ability of cities to resist, absorb, adapt to, and recover from acute shocks and chronic stresses. Additionally, this study argues that urban resilience can be improved through public-private relationships [15]. Chinese researcher Fan proposes, based on the national safety governance system, to strengthen the construction of urban resilience in terms of science and technology, management, and culture, focusing on the ability to resist and adapt to risks during the response to unexpected public safety events and to advance the level of urban safety governance [16].
The Chinese government has decided to improve urban resilience, an important part of national planning, and the Fourteenth Five-Year Plan and Vision 2035 outline explicitly calls for building “livable, innovative, intelligent, green, humanistic, and resilient cities”. The main initiatives include reducing the dangers of urban disaster sources, such as avoiding the construction of parks with major hazards in densely populated areas; reducing the vulnerability of urban disasters, such as improving the construction quality of urban pipeline projects and enhancing their adaptability to catastrophic weather; improving the resilience of cities, such as stocking emergency relief materials, preparing redundant water and power supply facilities, and building shelters. By enhancing urban safety resilience, a series of processes can be realized in which the complex city system reacts to dangerous perturbations, absorbs them, maintains resilience, and restores safety, meaning that the city can return to the expected level of safety function in a shorter period after an impact.

2.2. Urban Safety Resilience Models

There are many different definitions of safety resilience, but few systematic models of urban security resilience are discussed. Fan et al. proposed a public safety triangle theoretical model, which formed a public safety theoretical framework on urban safety resilience from three aspects: emergencies, disaster carriers, and emergency management [16]; Chen et al. assessed urban resilience from three aspects: adaptability, resistance, and recovery, and demonstrated that the proposed model could be used to simulate the resilience of cities under different disaster scenarios [17]; Bruneau and Liu, respectively, aimed at urban resilience in earthquake disaster scenarios and the spatial-temporal evolution of resilience in Chinese provincial capitals, but both judged and constructed a system of safety resilience in four dimensions: economic, social, organizational (or environmental), and technological [18,19].
To use urban safety resilience as the basic logic for evaluating risk, an urban safety resilience model needs to be established to clarify the basic framework of safety resilience management and construction so that it can reflect the relationship between disaster elements, resilience recovery capacity, and response subjects. Applying the public safety triangle theory model to urban safety resilience has theoretical rationality and operational feasibility. Huang et al. practiced the model in the field of safety-resilient city research, adapting it to the study of public safety events, urban safety systems, and urban resilience [20]. The model, as shown in Figure 1, constructs public safety events, urban disaster-bearing systems, and safety-resilient management as the three sides of a triangle theory model, with their corresponding key features for response, recovery, and adaptation as the resilience phases.
Based on the basic model, a more specific urban safety events’ framework of safety resilience can be extended, which contains resilience processes that reflect the resilience of the city’s continuous adaptation and safety stability. They can reflect the city’s ability to cope with the risk of uncertainty and can be used to continuously improve and enhance strategies and programs for urban adaptation and resilience.

3. Model and Methods

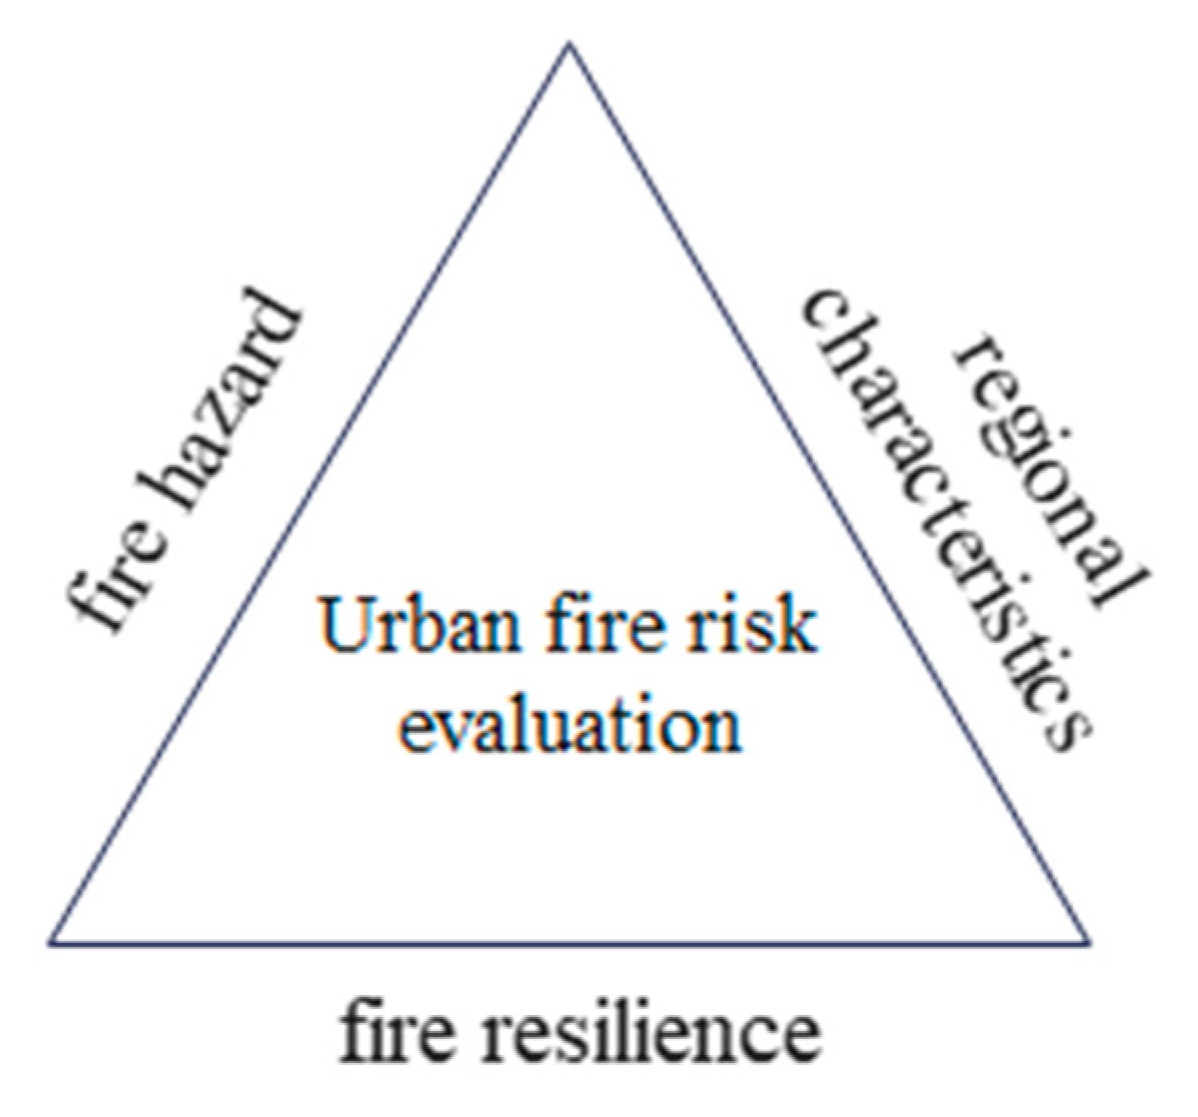
3.1. Fire Risk Evaluation Model Based on Safety Resilience

When conducting research in the practical field of fire safety, it is essential to consider China’s urban safety construction, fire protection planning, and emergency planning. Based on Fan and Huang’s model, this study takes fire hazard, regional characteristics, and fire resilience as the three edges of the triangle model, which correspond to the disaster elements, response subject, and recovery capacity in the resilience model, as shown in Figure 2 [16,20].
As a disaster element itself, a fire hazard is an external disturbance acting on the safety state of the city, which can be quantified by hazard source distribution, key firefighting units, historical accident damage, etc. Especially for the areas where the elderly and children are concentrated, there are fewer discussions in past studies on the fire hazard they endure.
According to the urban safety resilience triangle model, urban areas as disaster-bearing carriers are the objects of production accident fires and living fires, so people and the environment in the city absorb and bear the main impacts brought by emergencies. The personnel injuries, economic losses, building destruction, and environmental damages caused by fire events will increase the fire risk level. From the perspective of urban safety resilience construction, the greater the resilience, the higher the bearing capacity of the urban carrier will be, and the impact and loss on the carrier will be smaller.
Fire resilience is a part of emergency and safety management in response to sudden fire accidents and is a series of policies and measures taken by the government and other public organizations to prevent, manage, and mitigate the effects of fire. Improving urban safety resilience to protect public life, health, and property, and to maintain social stability, is an important manifestation of urban safety management during the recovery period.

3.2. Fire Risk Evaluation Index System

3.2.1. Index System Establishment

Based on the established fire risk evaluation model, an urban fire risk evaluation index system adapted to Chinese cities is proposed. Considering the accessibility and authority of data, 12 indicators are selected under the three perspectives of fire risk, regional characteristics, and fire resilience. Each indicator is expressed quantitatively by specific numbers, which can be divided into positive and negative indicators according to their effects on fire risk. Among them, the positive indicators reveal a promoting effect on the risk level, whereas the negative indicators are the opposite, and each indicator is presented in Table 1.
Taking C7 Urbanization level as an example to explain the direction dividing foundation. According to the comparison of the occurrence of fires in recent years, rural fires are still a difficult point for fire prevention and control, and promoting urbanization can reduce the risk of fire. Typically, from the data released by the Ministry of Emergency Management on urban and rural fires nationwide in 2020, fires in rural areas accounted for 49.3% of the total number of fires, which is 6.1% higher than in cities and towns, causing 48.1% of the total losses, which is 12.2% higher than in cities and towns [21]. Not only there are more rural fires, but larger fires in rural places also account for more than 60% and more casualties. Due to the poor escape awareness of rural residents, low fire resistance rating of buildings, and weak firefighting infrastructure, 84.7% of the total number of people killed on the spot at the scene of a fire in rural areas, the proportion is 7.3% higher than in cities. Based on these data trends, it can be found that as the C7 Urbanization level grows, the risk of fire will be decreased, denoted by a negative indicator.
The main sources of data selected for each indicator are:
(1) Fire accident yearbook released by China Fire and Rescue Bureau: C3 historical fire severity is expressed by the average loss of fire accidents, C4 historical fire casualties are expressed by using the million casualty rate due to fires in the previous year, C8 seasonal influence is expressed by the proportion of fires in winter and spring, C9 fire stations construction, and C10 firefighting capacity are expressed by the number of fire stations per 10,000 people and the number of hydrants per 10,000 people, respectively.
(2) Socio-economic indicators from regional statistical bureaus: resident population density, disposable income of urban residents, and overall urbanization rate of the region are used as indicator data for C5 regional population, C6 economic status, and C7 urbanization level.
(3) Emergency Management department statistical information disclosure: C11 safety supervision, C12 danger management use the annual report of regional firefighting work, website of inspection public listing information, etc. They are expressed by the number of fire hazards in key units inspected per 10,000 square kilometers and the number of major hidden dangers which were listed for supervision and rectification.
(4) POI (point of interest) obtained from Baidu Map: based on the geographical distribution, the unit density of buildings such as factories, industrial parks, gas stations, etc., is used as the indicator of C1 fire hazard places, and the unit density of buildings such as social welfare institutions, nursing homes, colleges, and secondary, primary, and kindergarten schools is used as the indicator of C2 important populations distribution.

3.2.2. Criteria of Risk Level

The quantified fire risk indicators in the above system have different units and meanings. To derive the final comprehensive fire risk evaluation results, the risk level corresponding to each indicator needs to be divided. The data of each indicator is nondimensionalized and divided into five levels according to the relevant standards, norms, safety planning, management objectives, etc. Levels are divided from I to V, which indicates low risk (I), general risk (II), high risk (III), higher risk (IV), and extremely high risk (V), and then the fuzzy operation method of weight and membership is used to derive the comprehensive fire risk level.

3.3. Entropy-Cloud Model Risk Evaluation Method

3.3.1. Entropy Weight Method

The concept of entropy originates from thermodynamics. According to the second law of thermodynamics, entropy is a matter’s state parameter that reflects the irreversibility of spontaneous processes, indicating that the thermal change process is directional and irreversible. In general, the larger the entropy value, the greater the disorder of the thermal motion of molecules, so the magnitude of entropy reflects the violent degree of molecular motion. In 1948, Shannon introduced it to information theory, proposed to quantify disordered, abstract information by entropy, and digitize it to describe the degree of disorder of a system [22]. Until now, information entropy has been widely used in the fields of computers, engineering risk evaluation, and economic management, and it is reasonable and feasible to use it in the fire risk evaluation of cities [23,24].
According to the principle of the entropy weight method, the weight is determined by the scale of information contained in the index, which can eliminate the interference of human subjective factors and is an objective way of assigning weights. When the index data are also objective data, the influence of subjective factors is completely excluded during the calculation of index weights. In other words, it enables the researcher to decide on indicators with more effective information from the statistics. The steps are as follows.
  • Raw data processing
To eliminate the differences in weights caused by different scales in the process of risk assessment, the relevant indicators need to be nondimensionalized and turned into positive indicators. The common calculation methods include Min-Max normalization, Z-score standardization, regularization, and mean valuation. Min-Max normalization is used to map the data to a specified range to better fit the relevant risk indicator data. The greater positive indicators manifest higher fire risk, and the greater negative indicator reflects the lower fire risk, and the normalization is calculated according to the following formula.
For positive indicators:
x i j = x x min x max x min
For negative indicators:
x i j = x max x x max x min
2.
Standardization of data matrix
Supposing there are n evaluation objects and m evaluation indicators, the original data corresponding to each indicator can form the judgment matrix A = a i j n × m , and after the standardization the matrix is X = x i j n × m .
3.
Calculation of the indicators’ entropy
The information entropy of the jth indicator can be expressed as
H j = 1 ln n i = 1 n p i j ln p i j
p i j is the weight of the jth indicator in the ith case, which indicates the variation of the indicator.
p i j = x i j i = 1 n x i j
4.
Calculation of the indicators’ entropy weight
ω j = 1 H j j = 1 m 1 H j

3.3.2. Cloud Model Method

The cloud model was proposed by Deyi Li, a member of the Chinese Academy of Engineering [25]. Based on stochastic mathematics and the fuzzy theory, the cloud model realizes the interconversion between qualitative and quantitative. It is an uncertainty transformation model between a qualitative concept and its quantitative representation expressed in natural language values [25]. Suppose that U is a quantitative universe represented by exact values, C is a qualitative concept on U . Let x U is a random instantiation of the qualitative concept, and μ x 0 , 1 is the certainty degree of x belonging to C . Then the distribution of x over the domain is called a cloud and each x is called a cloud drop. The properties of the cloud model are described by three numerical characteristics: expectation E x , entropy E n , and hyperentropy H e , which construct the mapping relationship between qualitative and quantitative. The main algorithms of the cloud model include the normal cloud generator and the backward cloud generator, where the normal cloud generator represents the process of moving from qualitative concepts to quantitative representations and is a concrete implementation of generating cloud drops from the numerical characteristics of clouds, and the backward cloud generator is the opposite.
The use of cloud models as an aid for various types of assessments in the safety field has been widely used and has proven the superiority of the models [26,27,28]. Under the urban fire risk assessment scenario, to apply the normal cloud generator to generate the standard cloud map of each evaluation indicator, first of all, the three numerical characteristics of the evaluation indicator should be determined.
Taking the actual distribution into account, in addition to the intervals with exact values at both ends, there exists the evaluation interval of 0 , C min k and C max k , + , where the indicator variables no longer obey the traditional cloud model distribution. So, the finite interval cloud model is improved on the basis of the traditional cloud model. Therefore, the infinite interval normal distribution transforms into a finite-interval normal distribution, and the marginal fuzzy interval transforms into a uniform distribution with a certainty of 1, which can better adapt to the indicators under the fire risk assessment scenario. The corresponding characteristic parameters are calculated as follows.
E x k = C max k + C min k 2
E n k = C max k C min k 2 γ + 3
H e k = λ E n k
where: E x k , E n k , and H e k are the expectation, entropy, and hyperentropy of the evaluation level interval k , respectively; C max k and C min k are the upper and lower bound values of the interval k ; γ is the order of the normal density function in the finite interval, taking the largest integer of γ ; λ is the empirical value, referring to the relevant literature, generally taken as 0.01.
After obtaining the cloud model characteristic parameters of each indicator, the normal finite interval cloud generator is used to create the standard cloud map of each indicator belonging to each risk level, and the specific algorithm is implemented as follows.
  • Generate a normal random number E n with expectation E n and variance H e 2 .
  • Generate a random number x i with expectation E x and variance E n 2 .
  • Calculate the membership of x i to the qualitative concept, in the traditional cloud model, when obeying the normal distribution:
    μ x i = e x i E x 2 2 E n 2
According to the improved normal cloud generator, when the indicator is far from the expectation E x , x i obeys a uniform distribution with a membership of 1, i.e.,
μ x i = 1 x 0 , E x k min E x k max , C max k max μ x i = e x i E x 2 2 E n 2 x E x k min , E x k max
4.
Repeat the above steps N times to obtain a cloud consisting of N cloud droplets of x i , μ i .

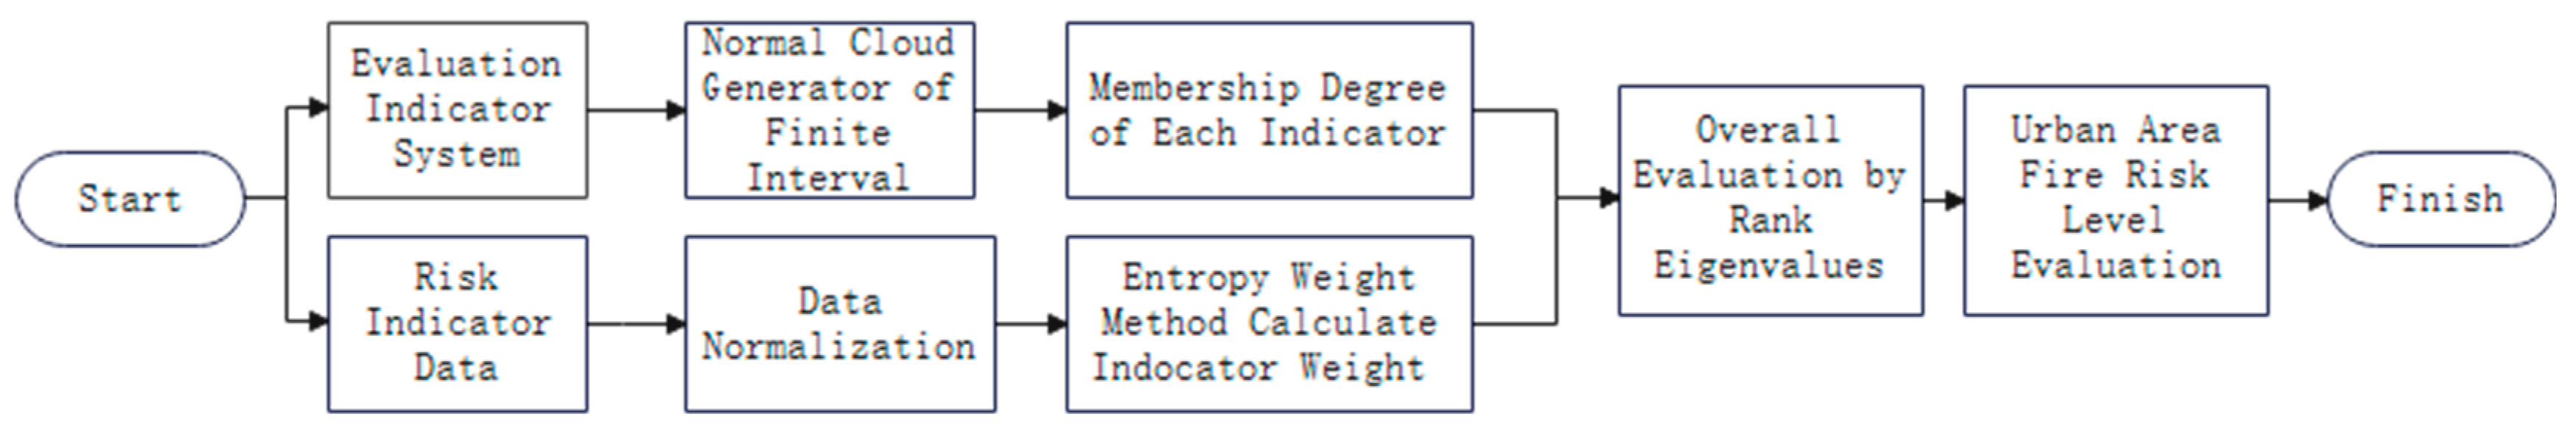
3.3.3. Risk Evaluation Steps

Integrating the principles of the above methods, the entropy weight-cloud model approach is used to evaluate urban fire risk. First, a reasonable evaluation index system and the corresponding evaluation criteria are established, and the weight of each index is determined by the entropy weight method. Then the membership degree of each evaluation index is calculated by the improved normal cloud generator of the finite interval cloud model and generates the corresponding cloud drops [26]. Finally, the fire risk evaluation of the area is given according to the comprehensive determination results, as shown in Figure 3.
The method takes into account the fuzzy nature of the relevant indicators, which is in line with the concept of resisting uncertainty and randomness emphasized in the construction of safety resilience, and the specific steps are as follows.
Step 1: Based on the assessment index system C = C 1 , C 2 , , C 12 and the corresponding index data, the weight of each index is calculated using the entropy weight method, and the weight vector is expressed as ω = ω 1 , ω 2 , ω 12 .
Step 2: According to the risk grading criteria of the evaluation index system, the cloud characteristic value E x , E n , H e corresponding to each grade is calculated, and the standard cloud map is generated by using the normal cloud generator of finite intervals according to the cloud characteristic value on each grade of every index.
Step 3: Input the data to be evaluated into the X-conditional cloud generator to get the membership degree μ i j of each indicator of the region to be evaluated on each grade, through the fuzzy operation of the weight vector and the membership matrix, the comprehensive membership degree of the evaluation region for each risk grade is obtained as K j = i = 1 n ω i μ i j , where j is the jth risk grade (j = 1, 2, ..., 5);
Step 4: Considering the limitations of the maximum membership principle in risk evaluation scenarios, the rank eigenvalues K are used to quantify the final overall evaluation rank, i.e., K = j = 1 5 j K j j = 1 5 K j .

4. Case Study

4.1. Calculation of Weights

Take Changsha city, Hunan Province as the evaluation area. Changsha City is located in the northeast of central Hunan, where there are diverse landscapes and rich vegetation in the city, and it’s near the Xiangjiang River and Mount Yuelu. The resident population and economic development level of Changsha are the first and largest in the province, and there are industrial parks, assembly occupancies, storages, and logistics in the city. With the social-economic development and the expansion of the urban scale, the number of fires has increased, facing more serious fire hazard problems. According to the urban fire risk evaluation index system established in Section 3.2, the index weights are calculated by combining the statistical data of China Fire Yearbook 2013–2019, the data public information released by the Changsha Government, and the map POIs collected based on online maps [29,30].
MATLAB R2016a is used as a statistical analysis tool, and ArcGIS is used as a processing tool for relevant geographical location information. The indicator data for each year from 2013–2019 are shown in Table 2 below, and after normalization, the weights of each indicator, information entropy, redundancy, and weight values are calculated by the entropy weight method, as shown in Table 3.

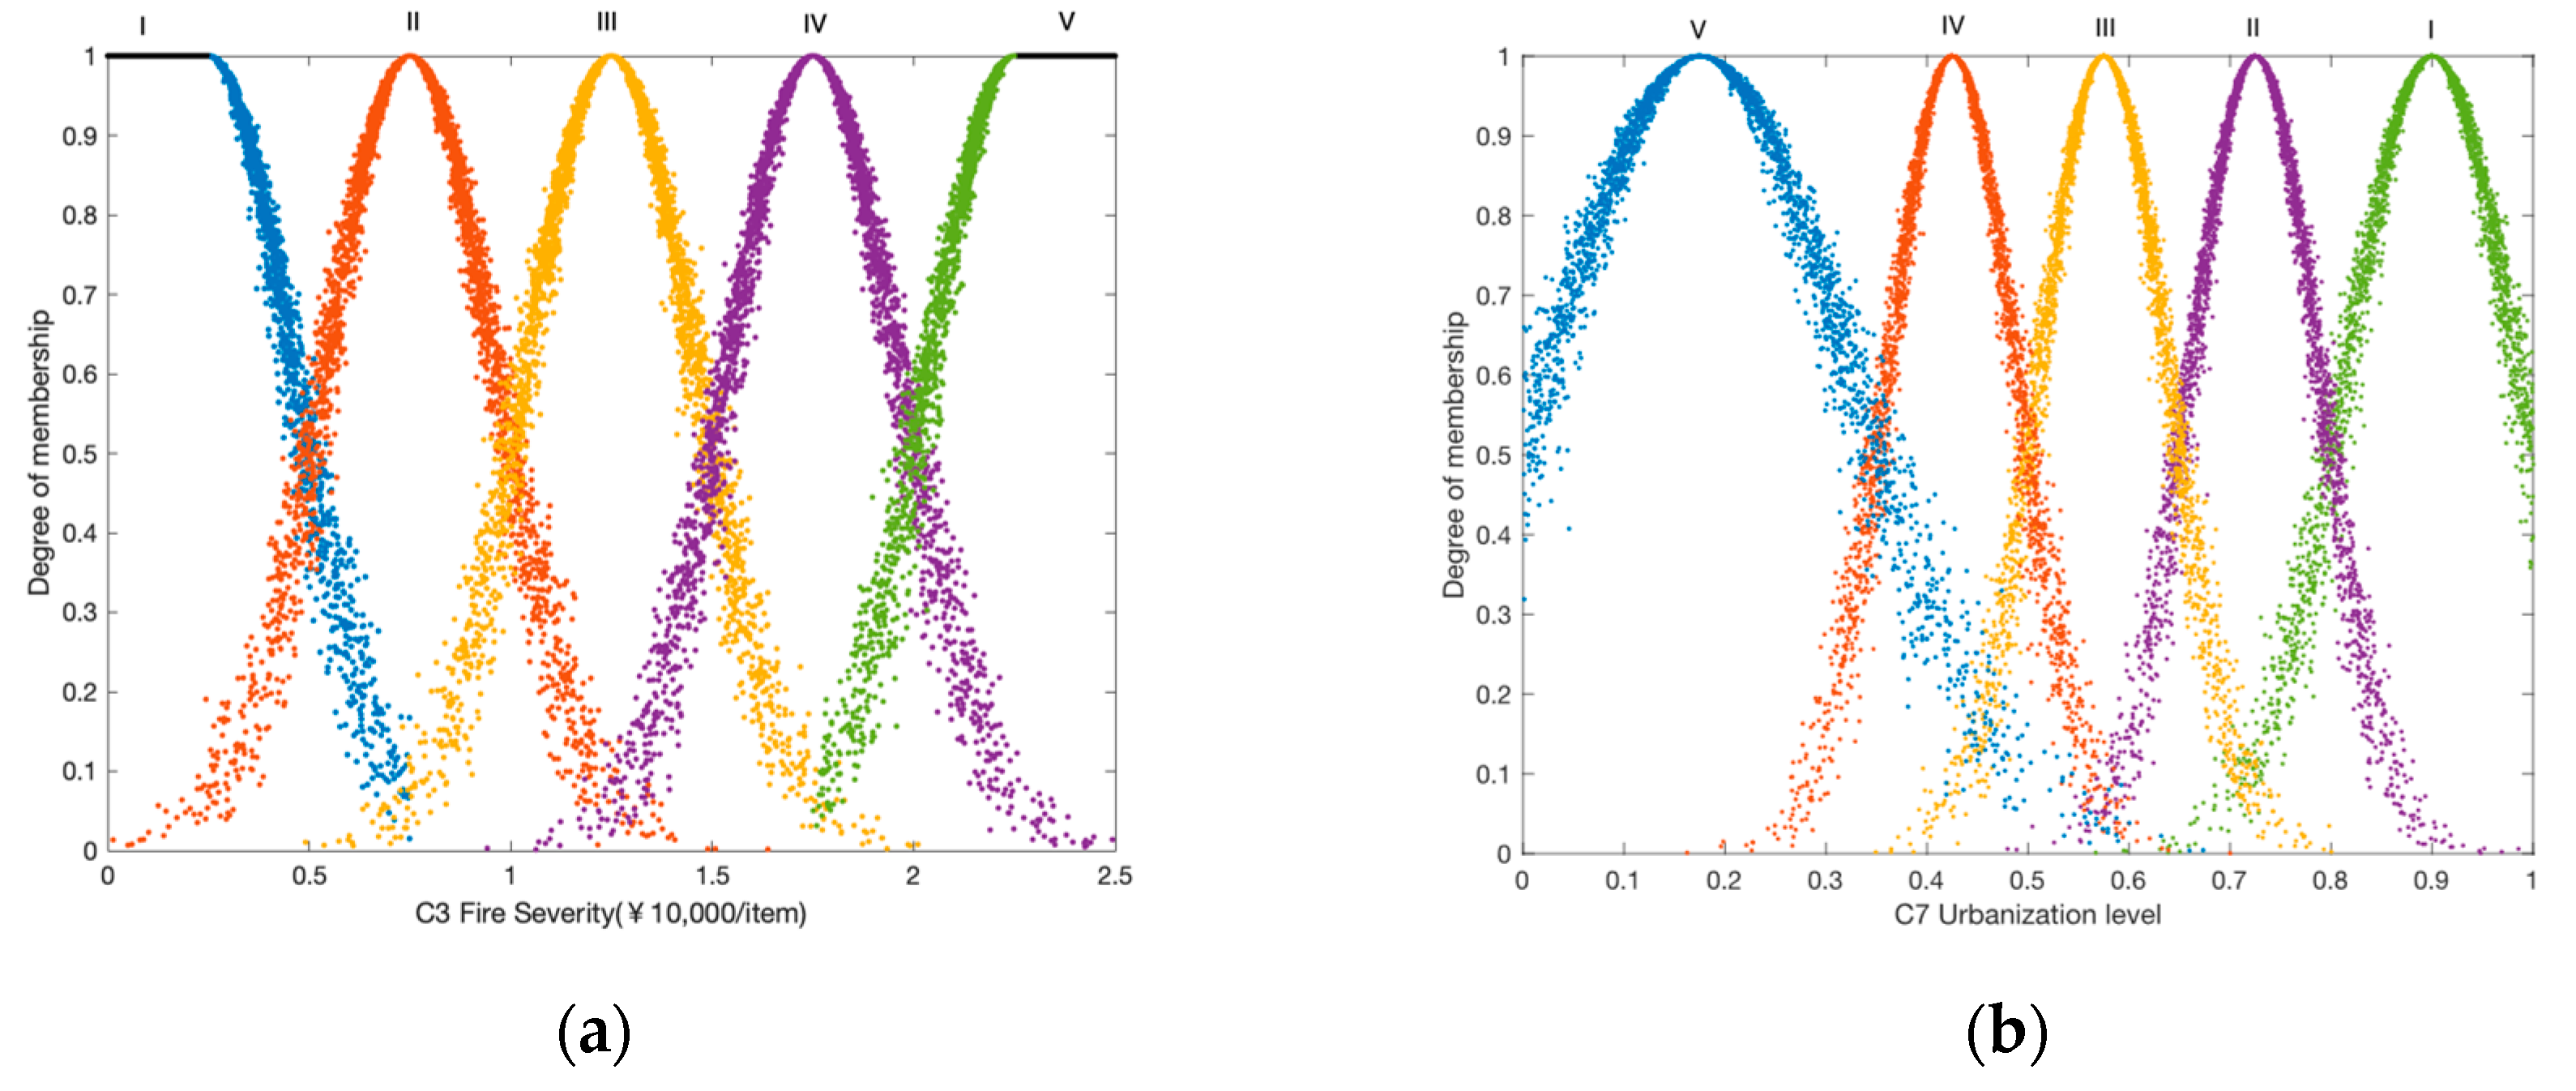
4.2. Determination of the Standard Cloud

Regarding the “14th Five-Year Development Plan” of firefighting and rescue in Hunan Province, “Changsha New Urbanization Development Plan (2021–2025)” and other planning and policy documents, combined with the distribution of major fire hazards and key enterprises in Changsha City, the city’s risk level is divided into five levels [29,31].
In the fire incident response plan of the region, the response to a fire is classified into four levels, i.e., general fire, larger fire, great fire, and extremely great fire, while the above four levels are also characterized for fire incidents in China [32]. Considering the relative safety state of no fire as level one, this study classifies the fire risk into low risk (I), general risk (II), high risk (III), higher risk (IV), and extremely high risk (V) five levels. Since the selected indicators and data are different and there is no unified quantitative standard to determine their risk level, this paper has tried to use objective data to confirm the classification of risk level criteria from two aspects.
First, the government’s five-year plan will make corresponding plans for the number of fire stations and hydrants in the city. The target quantities and the visionary goal of 2035 are taken as the boundary of the low-risk interval, which is reasonable and feasible during a certain period. In addition, expectant values of population density and economic development of 2035 planning are available, and using them as interval boundaries can roughly measure the relative size of risk. As for the indicators that are difficult to obtain the implementation criteria, such as distribution density and safety management, the most value in the statistical data is used as the interval boundary.
On the other hand, after obtaining the interval boundaries, the division of the five levels needs to be determined, and the division of even intervals was mostly used in the relevant studies [33,34]. But considering that indicators such as Urbanization Level and Fire Stations Construction have a weakening effect on the suppression of risk when they are close to saturation, the uneven division was used in the interval division of these indicators, as shown in Table 4.
Based on the improved finite interval cloud model, the numerical characteristics of the standard cloud for each indicator are calculated as shown in the following Table 5.
After obtaining the cloud model parameters for each indicator, the cloud model is generated by the normal cloud generator, taking the indicators C3 Fire severity (limited interval cloud) and C7 Urbanization level (normal cloud) as examples, see Figure 4.
The abscissa of the graph corresponds to the evaluation quantity values of C3 and C7, and the ordinate corresponds to the degree of certainty, or membership, of the cloud drops at a certain risk level. According to the value of each indicator of the evaluating area, its affiliation degree corresponding to different risk levels can be determined in the figure to determine the certainty of the risk of the evaluating area on the indicator. From left to right, Figure 4a represents the risk level from I to V corresponding to the cloud chart. Due to the evaluation criteria of C3 on both sides being an open interval, so the affiliation degrees are 1 at both ends. Additionally, Figure 4b, from left to right, represents the risk level from V to I, this is because C7 is a negative indicator, with the higher value, the risk turns out to be lower. Moreover, C7′s criteria at both ends are closed intervals, so the cloud map generated by the traditional positive cloud generator is used, which presents as a normal distribution.

4.3. Risk Evaluation Results and Analysis

According to the basic data of Changsha city, the index weights, as well as the evaluation criteria cloud, were obtained, and the Yuelu district of Changsha city was selected as the evaluation sample. The data of its indexes were input into the X-conditional cloud generator to work out the membership degree of each indicator corresponding to each level in the sample area and construct the membership matrix.
V = 0 0.022 0.997 0.168 0 0 0 0 0 1 0.003 0.494 0.494 0.003 0 1 0 0 0 0 0 0 0 0 1 0 0 0.026 0.746 0.006 0.865 0.004 0 0 0 0 0 0.001 0.822 0.211 0.001 0.322 0.525 0.002 0 0.005 0.588 0.409 0.002 0 0.090 0.989 0.048 0 0 0.002 0.425 0.568 0.004 0
The weight vector ω and membership matrix V perform a fuzzy operation that can receive the comprehensive membership degree 0.248 , 0.236 , 0.226 , 0.113 , 0.164 . By the principle of rank eigenvalue, the calculated rank eigenvalue is 2.7, so the fire risk level of the evaluation area Changsha City Yuelu District is a level III greater risk. Combined with the actual situation, this area is rich in educational resources and has sufficient medical and healthcare institutions. Important people gathered in these areas, which causes a rise in the fire severity. In addition, there are vegetation and forests distributed in the area, and the possibility of fire in the dry season is higher. But the fire planning and fire hazard remediation management in the area are better, so the fire safety resilience of the area is improved to a certain extent, the evaluation results are reasonable and the method is feasible.

5. Discussion and Conclusions

This study constructed a fire risk evaluation system from the triangular model of urban safety resilience and mainly selected 12 representative indicators in three aspects: fire hazard, regional characteristics, and fire resilience, which correspond to the disaster elements, response subjects, and resilience recovery capacity in the resilience model. To ensure more reliable and reasonable evaluation results, the entropy weighting method was used to calculate the index weights. Based on the ability and characteristics of cloud model theory to solve the transformation of qualitative and quantitative information, this study introduces the finite interval cloud model into the urban fire risk evaluation and uses the membership degree to determine the risk level of the assessment area, which solves the ambiguity and randomness of the risk evaluation indicators under the safety and resilience perspective. Furthermore, the assessment data used in the study are from objective reality and survey reports, etc., which enhances the authenticity and reliability of the results. The evaluation results can accord with the actual situation, and the proposed assessment model has a certain reference value for the control of regional fire risk and the improvement of safety level.
For other datasets, the model is also applicable. Firstly, the triangle theoretical model of urban fire risk evaluation proposed in Section 3.1 and the indicators system established in Section 3.2 construct a basic framework for assessing urban risk. In Section 4, this paper uses statistical data and map data of Changsha Hunan to calculate the indicator weights to assess the level of fire risk in a region over a subsequent period, but the framework is scalable and dynamically adaptable. For example, when applied to the assessment of other cities, it is not necessary to modify the relevant indicators, but only to update the weights according to the statistical data and update the evaluation criteria according to the urban planning or national policy requirements, so that the entropy weighting method and the cloud model can be applied to assess the fire risk level of other regions in other cities. Secondly, it’s the same from a time dimension, when a new statistical yearbook is obtained, we add the data of the new year and update the evaluation weights to be able to evaluate the fire risk for the following period. Moreover, to test the applicability of the model, the weight and membership can be calculated using data from previous years, data from recent years as a test, and actual fire conditions as a control group to compare whether more fires occur in areas with a higher predicted fire risk.
Lastly, the above research results can reflect the shortcomings of urban safety resilience construction in terms of fire safety, which can be used to establish and improve the resilience and firefighting ability of the city. By effectively optimizing the overall safety pattern of the city, this research has provided a direction combining safety resilience and risk evaluation, the scientific and reasonable solutions for urban safety management.

Author Contributions

Conceptualization, M.B.; Methodology, M.B.; Supervision, Q.L.; Writing—original draft, M.B.; Writing—review & editing, Q.L. All authors have read and agreed to the published version of the manuscript.

Funding

This research received no external funding.

Data Availability Statement

Publicly available datasets were analyzed in this study. This data can be found here: http://cnki.nbsti.net/csydmirror (accessed on 18 January 2023).

Conflicts of Interest

The authors declare no conflict of interest.

References

  1. Zhang, X.; Yao, J.; Sila-Nowicka, K. Exploring Spatiotemporal Dynamics of Urban Fires: A Case of Nanjing, China. ISPRS Int. Geo-Inf. 2018, 7, 7. [Google Scholar] [CrossRef]
  2. Turner, S.L.; Johnson, R.D.; Weightman, A.L.; Rodgers, S.E.; Arthur, G.; Bailey, R.; Lyons, R.A. Risk Factors Associated with Unintentional House Fire Incidents, Injuries and Deaths in High-Income Countries: A Systematic Review. Inj. Prev. 2017, 23, 131–137. [Google Scholar] [CrossRef] [PubMed]
  3. Jennings, C.R. Social and Economic Characteristics as Determinants of Residential Fire Risk in Urban Neighborhoods: A Review of the Literature. Fire Saf. J. 2013, 62, 13–19. [Google Scholar] [CrossRef]
  4. Hu, J.; Shu, X.; Xie, S.; Tang, S.; Wu, J.; Deng, B. Socioeconomic Determinants of Urban Fire Risk: A City-Wide Analysis of 283 Chinese Cities from 2013 to 2016. Fire Saf. J. 2019, 110, 102890. [Google Scholar] [CrossRef]
  5. Liu, Z.-G.; Li, X.-Y.; Jomaas, G. Effects of Governmental Data Governance on Urban Fire Risk: A City-Wide Analysis in China. Int. J. Disaster Risk Reduct. 2022, 78, 103138. [Google Scholar] [CrossRef]
  6. Zhang, Y.; Geng, P.; Sivaparthipan, C.B.; Muthu, B.A. Big Data and Artificial Intelligence Based Early Risk Warning System of Fire Hazard for Smart Cities. Sustain. Energy Technol. Assess. 2021, 45, 100986. [Google Scholar] [CrossRef]
  7. Shaham, Y.; Benenson, I. Modeling Fire Spread in Cities with Non-Flammable Construction. Int. J. Disaster Risk Reduct. 2018, 31, 1337–1353. [Google Scholar] [CrossRef]
  8. Wang, J.; Liu, H.; An, S.; Cui, N. A New Partial Coverage Locating Model for Cooperative Fire Services. Inform. Sci. 2016, 373, 527–538. [Google Scholar] [CrossRef]
  9. Burby, R.J.; Deyle, R.E.; Godschalk, D.R.; Olshansky, R.B. Creating Hazard Resilient Communities through Land-Use Planning. Nat. Hazards Rev. 2000, 1, 99–106. [Google Scholar] [CrossRef]
  10. Anelli, D.; Tajani, F.; Ranieri, R. Urban Resilience against Natural Disasters: Mapping the Risk with an Innovative Indicators-Based Assessment Approach. J. Clean. Prod. 2022, 371, 133496. [Google Scholar] [CrossRef]
  11. Xu, H.; Xue, B. Key Indicators for the Resilience of Complex Urban Public Spaces. J. Build. Eng. 2017, 12, 306–313. [Google Scholar] [CrossRef]
  12. Holling, C.S. Resilience and Stability of Ecological Systems. Ann. Rev. Ecol. Syst. 1973, 4, 1–23. [Google Scholar] [CrossRef]
  13. Desouza, K.C.; Flanery, T.H. Designing, Planning, and Managing Resilient Cities: A Conceptual Framework. Cities 2013, 35, 89–99. [Google Scholar] [CrossRef]
  14. Meerow, S.; Newell, J.P.; Stults, M. Defining Urban Resilience: A Review. Landsc. Urban Plan. 2016, 147, 38–49. [Google Scholar] [CrossRef]
  15. Marana, P.; Labaka, L.; Mari Sarriegi, J. A Framework for Public-Private-People Partnerships in the City Resilience-Building Process. Saf. Sci. 2018, 110, 39–50. [Google Scholar] [CrossRef]
  16. Fan, W. Modernizing Public Safety Governance with the Construction of a Safe and Resilient City. Frontiers 2022, z1, 14–24. (In Chinese). [Google Scholar] [CrossRef]
  17. Chen, C.; Xu, L.; Zhao, D.; Xu, T.; Lei, P. A New Model for Describing the Urban Resilience Considering Adaptability, Resistance and Recovery. Saf. Sci. 2020, 128, 104756. [Google Scholar] [CrossRef]
  18. Bruneau, M.; Chang, S.E.; Eguchi, R.T.; Lee, G.C.; O’Rourke, T.D.; Reinhorn, A.M.; Shinozuka, M.; Tierney, K.; Wallace, W.A.; von Winterfeldt, D. A Framework to Quantitatively Assess and Enhance the Seismic Resilience of Communities. Earthq. Spectra 2003, 19, 733–752. [Google Scholar] [CrossRef]
  19. Liu, L.; Lei, Y.; Fath, B.D.; Hubacek, K.; Yao, H.; Liu, W. The Spatio-Temporal Dynamics of Urban Resilience in China’s Capital Cities. J. Clean. Prod. 2022, 379, 134400. [Google Scholar] [CrossRef]
  20. Huang, H.; Li, R.; Wang, W.; Qin, T.; Zhou, R.; Fan, W. Concepts, Models, and Indicator Systems for Urban Safety Resilience: A Literature Review and an Exploration in China. J. Saf. Sci. Resil. 2023, 4, 30–42. [Google Scholar] [CrossRef]
  21. National Fire and Rescue Administration. Available online: https://www.119.gov.cn/gk/sjtj/2022/13721.shtml (accessed on 20 December 2022).
  22. Shannon, C.E. A Mathematical Theory of Communication. Bell Syst. Tech. J. 1948, 27, 379–423. [Google Scholar] [CrossRef]
  23. Wu, D.; Li, Z. Work Safety Success Theory Based on Dynamic Safety Entropy Model. Saf. Sci. 2019, 113, 438–444. [Google Scholar] [CrossRef]
  24. Yang, M. System Safety Assessment Using Safety Entropy. J. Loss Prev. Process Ind. 2020, 66, 104174. [Google Scholar] [CrossRef]
  25. Li, D.; Liu, C.; Gan, W. A New Cognitive Model: Cloud Model. Int. J. Intell. Syst. 2009, 24, 357–375. [Google Scholar] [CrossRef]
  26. Tan, F.; Wang, J.; Jiao, Y.-Y.; Ma, B.; He, L. Suitability Evaluation of Underground Space Based on Finite Interval Cloud Model and Genetic Algorithm Combination Weighting. Tunn. Undergr. Sp. Technol. 2021, 108, 103743. [Google Scholar] [CrossRef]
  27. Zhang, C.; Tian, G.; Fathollahi-Fard, A.M.; Wang, W.; Wu, P.; Li, Z. Interval-Valued Intuitionistic Uncertain Linguistic Cloud Petri Net and Its Application to Risk Assessment for Subway Fire Accident. IEEE Trans. Autom. Sci. Eng. 2022, 19, 163–177. [Google Scholar] [CrossRef]
  28. Zhao, J.; Tian, J.; Meng, F.; Zhang, M.; Wu, Q. Safety Assessment Method for Storage Tank Farm Based on the Combination of Structure Entropy Weight Method and Cloud Model. J. Loss Prev. Process Ind. 2022, 75, 104709. [Google Scholar] [CrossRef]
  29. Changsha Municipal People’s Government. Available online: http://www.changsha.gov.cn/zfxxgk/ (accessed on 20 December 2022).
  30. Ministry of Public Security Fire Service Bureau. China Fire Yearbook; Yunnan Personnel Press: Kunming, China, 2013. (In Chinese). [Google Scholar]
  31. HuNan Fire and Rescue Department. Available online: http://www.hn119.gov.cn/ (accessed on 20 December 2022).
  32. Emergency Plan for Fire Accidents in Hunan Province, HuNan Municipal People’s Government. Available online: http://www.hunan.gov.cn/hnszf/xxgk/wjk/szfbgt//201802/t20180205_4945294.html (accessed on 13 December 2022).
  33. Xiao, H.; Zhou, Y.; Zhang, H. GIS-Based Fire Risk Assessment and Fire Station Site Selection—Taking Dujiangyan City as An Example. In Proceedings of the 2020 International Conference on Urban Construction and Management Engineering, Taiyuan, China, 16–18 October 2020; Volume 608, p. 012008. [Google Scholar] [CrossRef]
  34. Nuthammachot, N.; Stratoulias, D. A GIS- and AHP-Based Approach to Map Fire Risk: A Case Study of Kuan Kreng Peat Swamp Forest, Thailand. Geocarto Int. 2021, 36, 212–225. [Google Scholar] [CrossRef]
Figure 1. Triangle theoretical model of urban safety resilience.
Fire 06 00062 g001
Figure 2. Triangle theoretical model of urban fire risk evaluation.
Fire 06 00062 g002
Figure 3. Procedure of urban fire risk evaluation.
Fire 06 00062 g003
Figure 4. (a) Cloud drops graphs of C3 Fire severity belonging to each level; (b) Cloud drops graphs of C7 Urbanization level belonging to each level.
Fire 06 00062 g004
Table 1. Urban fire risk evaluation index system.
PerspectiveIndicatorsIndicator Direction
Fire riskC1 Fire hazard placesPositive
C2 Important populations distributionPositive
C3 Fire severityPositive
C4 Historical fire casualtiesNegative
Regional characteristicsC5 Regional populationPositive
C6 Economic statusPositive
C7 Urbanization levelNegative
C8 Seasonal influencePositive
Fire resilienceC9 Fire stations constructionNegative
C10 Firefighting capacityNegative
C11 Safety supervisionNegative
C12 Danger managementNegative
Table 2. Urban fire risk evaluation index values.
Indicator CodeIndicators2013201420152016201720182019
C1Fire hazard places0.1540.1710.1720.1930.1940.2060.209
C2Important populations distribution0.1940.2580.3660.4180.3710.3820.397
C3Fire severity1.8131.3751.4651.2533.1862.5592.440
C4Historical fire loss 0.6882.0781.8701.9311.9641.8371.913
C5Regional population609.349616.952627.103645.110668.138688.102708.337
C6Economic status3.3663.6833.9964.3294.6955.0795.521
C7Urbanization level47.96049.28050.89052.75054.62056.02057.220
C8Seasonal influence54.657 63.345 57.952 58.543 59.988 60.064 59.192
C9Fire stations construction0.0230.0290.0300.0310.0320.0380.041
C10Firefighting capability5.2064.9975.7499.31610.35411.41812.509
C11Safety supervision13.751105.681153.324172.969105.100124.22539.171
C12Danger management0.8224.8240.9442.6535.36411.32114.729
Table 3. Weights of indicators.
IndicatorInformation EntropyRedundant DegreeEntropy Weight
C10.8770.1230.062
C20.8960.1040.052
C30.7730.2270.114
C40.6650.3350.169
C50.8010.1990.100
C60.8460.1540.078
C70.8400.1600.081
C80.8960.1040.053
C90.8720.1280.065
C100.8330.1670.084
C110.8320.1680.084
C120.8850.1150.058
Table 4. Grading table of evaluation indexes.
IndicatorRisk Level
IIIIIIIVV
C10–0.10.1–0.40.4–0.70.7–1>1
C20–0.10.1–0.40.4–0.70.7–1>1
C30–0.50.5–11–1.51.5–2>2
C4>2.52.5–22–1.51.5–10–1
C5<500500–10001000–15001500–2000>2000
C6<3.53.5–55–6.56.5–8>8
C70.8–10.8–0.650.65–0.50.5–0.350.35–0
C80.45–0.50.5–0.520.52–0.550.55–0.6>0.6
C9>0.070.07–0.060.06–0.040.04–0.020.02–0
C10>2020–1515–1010–50–5
C11>160160–120120–8080–400–40
C12>1010–77–44–10–1
Table 5. Indicators’ numerical characteristics.
IndicatorCloud Model Numerical Characteristics E x , E n , H e
IIIIIIIVV
C1(0.050, 0.042, 0.004)(0.250, 0.127, 0.013)(0.600, 0.127, 0.013)(0.850, 0.127, 0.013)(1.150, 0.127, 0.013)
C2(0.050, 0.042, 0.004)(0.250, 0.127, 0.013)(0.600, 0.127, 0.013)(0.850, 0.127, 0.013)(1.150, 0.127, 0.013)
C3(0.250, 0.212, 0.021)(0.750, 0.212, 0.021)(1.250, 0.212, 0.021)(1.750, 0.212, 0.021)(2.250, 0.212, 0.021)
C4(2.750, 0212, 0.021)(2.250, 0.212, 0.021)(1.750, 0.212, 0.021)(1.250, 0.212, 0.021)(0.500, 0.425, 0.042)
C5(250.000, 212.314, 21.231)(750.000, 212.314, 21.231)(1250.000, 212.314, 21.231)(1750.000, 212.314, 21.231)(2250.000, 212.314, 21.231)
C6(2.750, 0.637, 0.064)(3.609, 0.637, 0.064)(4.883, 0.637, 0.064)(6.157, 0.637, 0.064)(8.750, 0.637, 0.064)
C7(0.900, 0.085, 0.008)(0.725, 0.064, 0.006)(0.575, 0.064, 0.006)(0.425, 0.064, 0.006)(0.175, 0.149, 0.015)
C8(0.475, 0.021, 0.002)(0.510, 0.008, 0.001)(0.535, 0.013, 0.001)(0.575, 0.021, 0.002)(0.625, 0.021, 0.002)
C9(0.075, 0.004, 0.000)(0.065, 0.004, 0.000)(0.050, 0.008, 0.001)(0.030, 0.008, 0.001)(0.010, 0.008, 0.001)
C10(22.500, 2.123, 0.212)(17.500, 2.123, 0.212)(12.500, 2.123, 0.212)(7.500, 2.123, 0.212)(2.500, 2.123, 0.212)
C11(180.000, 16.985, 1.699)(140.000, 16.985, 1.699)(100.000, 16.985, 1.699)(60.000, 16.985, 1.699)(20.000, 16.985, 1.699)
C12(11.500, 1.274, 0.127)(8.500, 1.274, 0.127)(5.500, 1.274, 0.127)(2.500, 1.274, 0.127)(0.500, 0.425, 0.042)
Disclaimer/Publisher’s Note: The statements, opinions and data contained in all publications are solely those of the individual author(s) and contributor(s) and not of MDPI and/or the editor(s). MDPI and/or the editor(s) disclaim responsibility for any injury to people or property resulting from any ideas, methods, instructions or products referred to in the content.

