Article

The Fire and Fodder Reversal Phenomenon: Vertebrate Herbivore Activity in Burned and Unburned Tasmanian Ecosystems

by
David J. Heaton
*,†,
Melinda T. McHenry
and
Jamie B. Kirkpatrick
School of Geography, Planning and Spatial Sciences, The University of Tasmania, 1 Churchill Avenue, Sandy Bay, TAS 7001, Australia
*
Author to whom correspondence should be addressed.
Present address: Ecology and Heritage Partners, 230 Latrobe Terrace, Geelong, VIC 3218, Australia.
Fire 2022, 5(4), 111; https://doi.org/10.3390/fire5040111
Submission received: 19 May 2022 / Revised: 21 July 2022 / Accepted: 28 July 2022 / Published: 1 August 2022
(This article belongs to the Special Issue Effects of Wildfire on Biodiversity)

Abstract

:
Very few multi-species or ecosystem comparisons of post-fire vertebrate herbivore activity and food preference exist to inform fire management and conservation strategies. We inferred post-fire (1–3 years) native and introduced vertebrate herbivore activity and attraction to six diverse temperate vegetation communities (grassland to rainforest) from scat counts. We hypothesised that where fire reduced herbaceous and grassy vegetation (‘fodder’), vertebrate herbivores would decline, and that post-fire preferences of native versus exotic herbivores would differ significantly. Instead, we found evidence for a ‘fire and fodder reversal phenomenon’ whereby native macropod and exotic deer scats were more abundant after fire in consistently ‘fodder-poor’ vegetation types (e.g., heath) but less abundant after fire in previously fodder-rich vegetation communities (e.g., grassland). Fodder cover predicted native macropod, wombat, and introduced deer activity and bare ground cover was strongly associated with introduced herbivore activity only, with the latter indicating post-fire competition for food sources due to their abundance in high-altitude open ecosystems. We, therefore, found environmental and vegetation predictors for each individual species/group and suggest broadscale multi-environment, multispecies observations to be informative for conservation management in potentially overlapping post-fire niches.

1. Introduction

To adequately conserve the biota of protected areas, fire–environment–herbivore interactions need to be examined in different ecosystems. Fire is a physical consumer, which can exhaust above-ground biomass rapidly, whereas herbivory is a more constant, biological driver of biomass consumption [1,2]. Though fire and herbivory exert significant influences on biophysical parameters in ecosystems, their interaction is less understood than their singular effects. Importantly, interactions within the few years post-fire are likely to be the most critical.
After biomass reduction, one of the most profound impacts that fire has on the environment is on vegetation composition and the recovery trajectory of vegetation communities. For instance, the effects of the recent fire on populations of introduced vertebrate herbivores (henceforth herbivores) were shown to exacerbate conservation problems associated with their grazing and browsing, as in the elimination of drooping she-oak (Allocasuarina verticillata L.A.S. Johnson) by rabbits in South Australia [3,4]. Conversely, grazing pressure in some recently burned vegetation communities can increase conservation significance, such as the creation of ‘lawn’ grasslands, populated by palatable food species, from lower nutrient, floristically simple, tussock grasslands [5,6].
Different herbivore species in the same area also tend to have different dietary preferences, as with the short-grass and generalist grazers of the South African savannas [7], and the marsupial macropod grazers in Australia [8,9]. Fire could therefore be considered but one disturbance in an otherwise complex environmental matrix that can be further preferentially modified by grazing herbivores with different needs.
Counting scats (dung/faeces/faecal pellets) with an understanding of herbivore defecation rates and defecation habits can help investigate herbivore activity and detect meaningful differences between species. Scat counting is a highly effective technique to infer presence and/or abundance for many herbivores, including rabbits [10], macropods [11], deer [12], cattle [13], and elephants [14,15]. The counting of scats has been widely used as a bio-indicator of herbivore activity in Australia, favoured for the ease of use in largely topographically simple landscapes, and is aided by the size, quantity, and persistence of local herbivore scats. Contemporaneous comparisons of the effects of burning on herbivore scat counts in different vegetation types in Australia are restricted to macropods in grasslands, sedgelands and dry eucalypt forests [5], and therefore broader testing in a range of different vegetation communities is important.
The food resources in the post-fire environment can be greater than those available before fire, attracting herbivores from adjacent, unburned vegetation [16,17,18,19,20]. Post-fire regrowth, often rich in nitrogen, can be a critical resource for herbivores, particularly in areas that experience long dry seasons [1,21]. However, post-fire conditions are not always more attractive to herbivores. For instance, two years after a fire there were more macropod scats in unburned grassy vegetation than in burned grassy vegetation in lowland Tasmania. Meanwhile, highland vegetation communities and other vegetation communities dominated by sedges and shrubs had more scats in the burned vegetation [5]. This suggests that fire may reduce food resources where the vegetation is rich in them.
In Tasmania, Australia, ‘rich’ food resources of higher quality forage content are a combination of grass and herb cover herein called ‘fodder’. The relative abundance of fodder before and after a fire event may influence the behaviour of local herbivores (Figure 1) as indicated by previous research in selected communities [5,6].
In the present study, we extended upon the previous investigation of the effects of recent fire on the attractiveness of three Tasmanian vegetation communities to macropods, to the effects on six vegetation types, four vertebrate grazing animal groups, native macropods (Macropodidae), and common wombats (Vombatus hirsutus Perry), and two exotic, the introduced rabbit (Oryctolagus cuniculus Linnaeus) and fallow deer (Dama dama Linnaeus).
We posed the following questions:
  • Do native and exotic herbivores occupy different post-fire environments?
  • Are patterns of herbivore activity consistent across vegetation communities and fire attributes?
  • What are the attributes (biophysical, biological, and climatic) that are associated with herbivore scat deposition after fire?
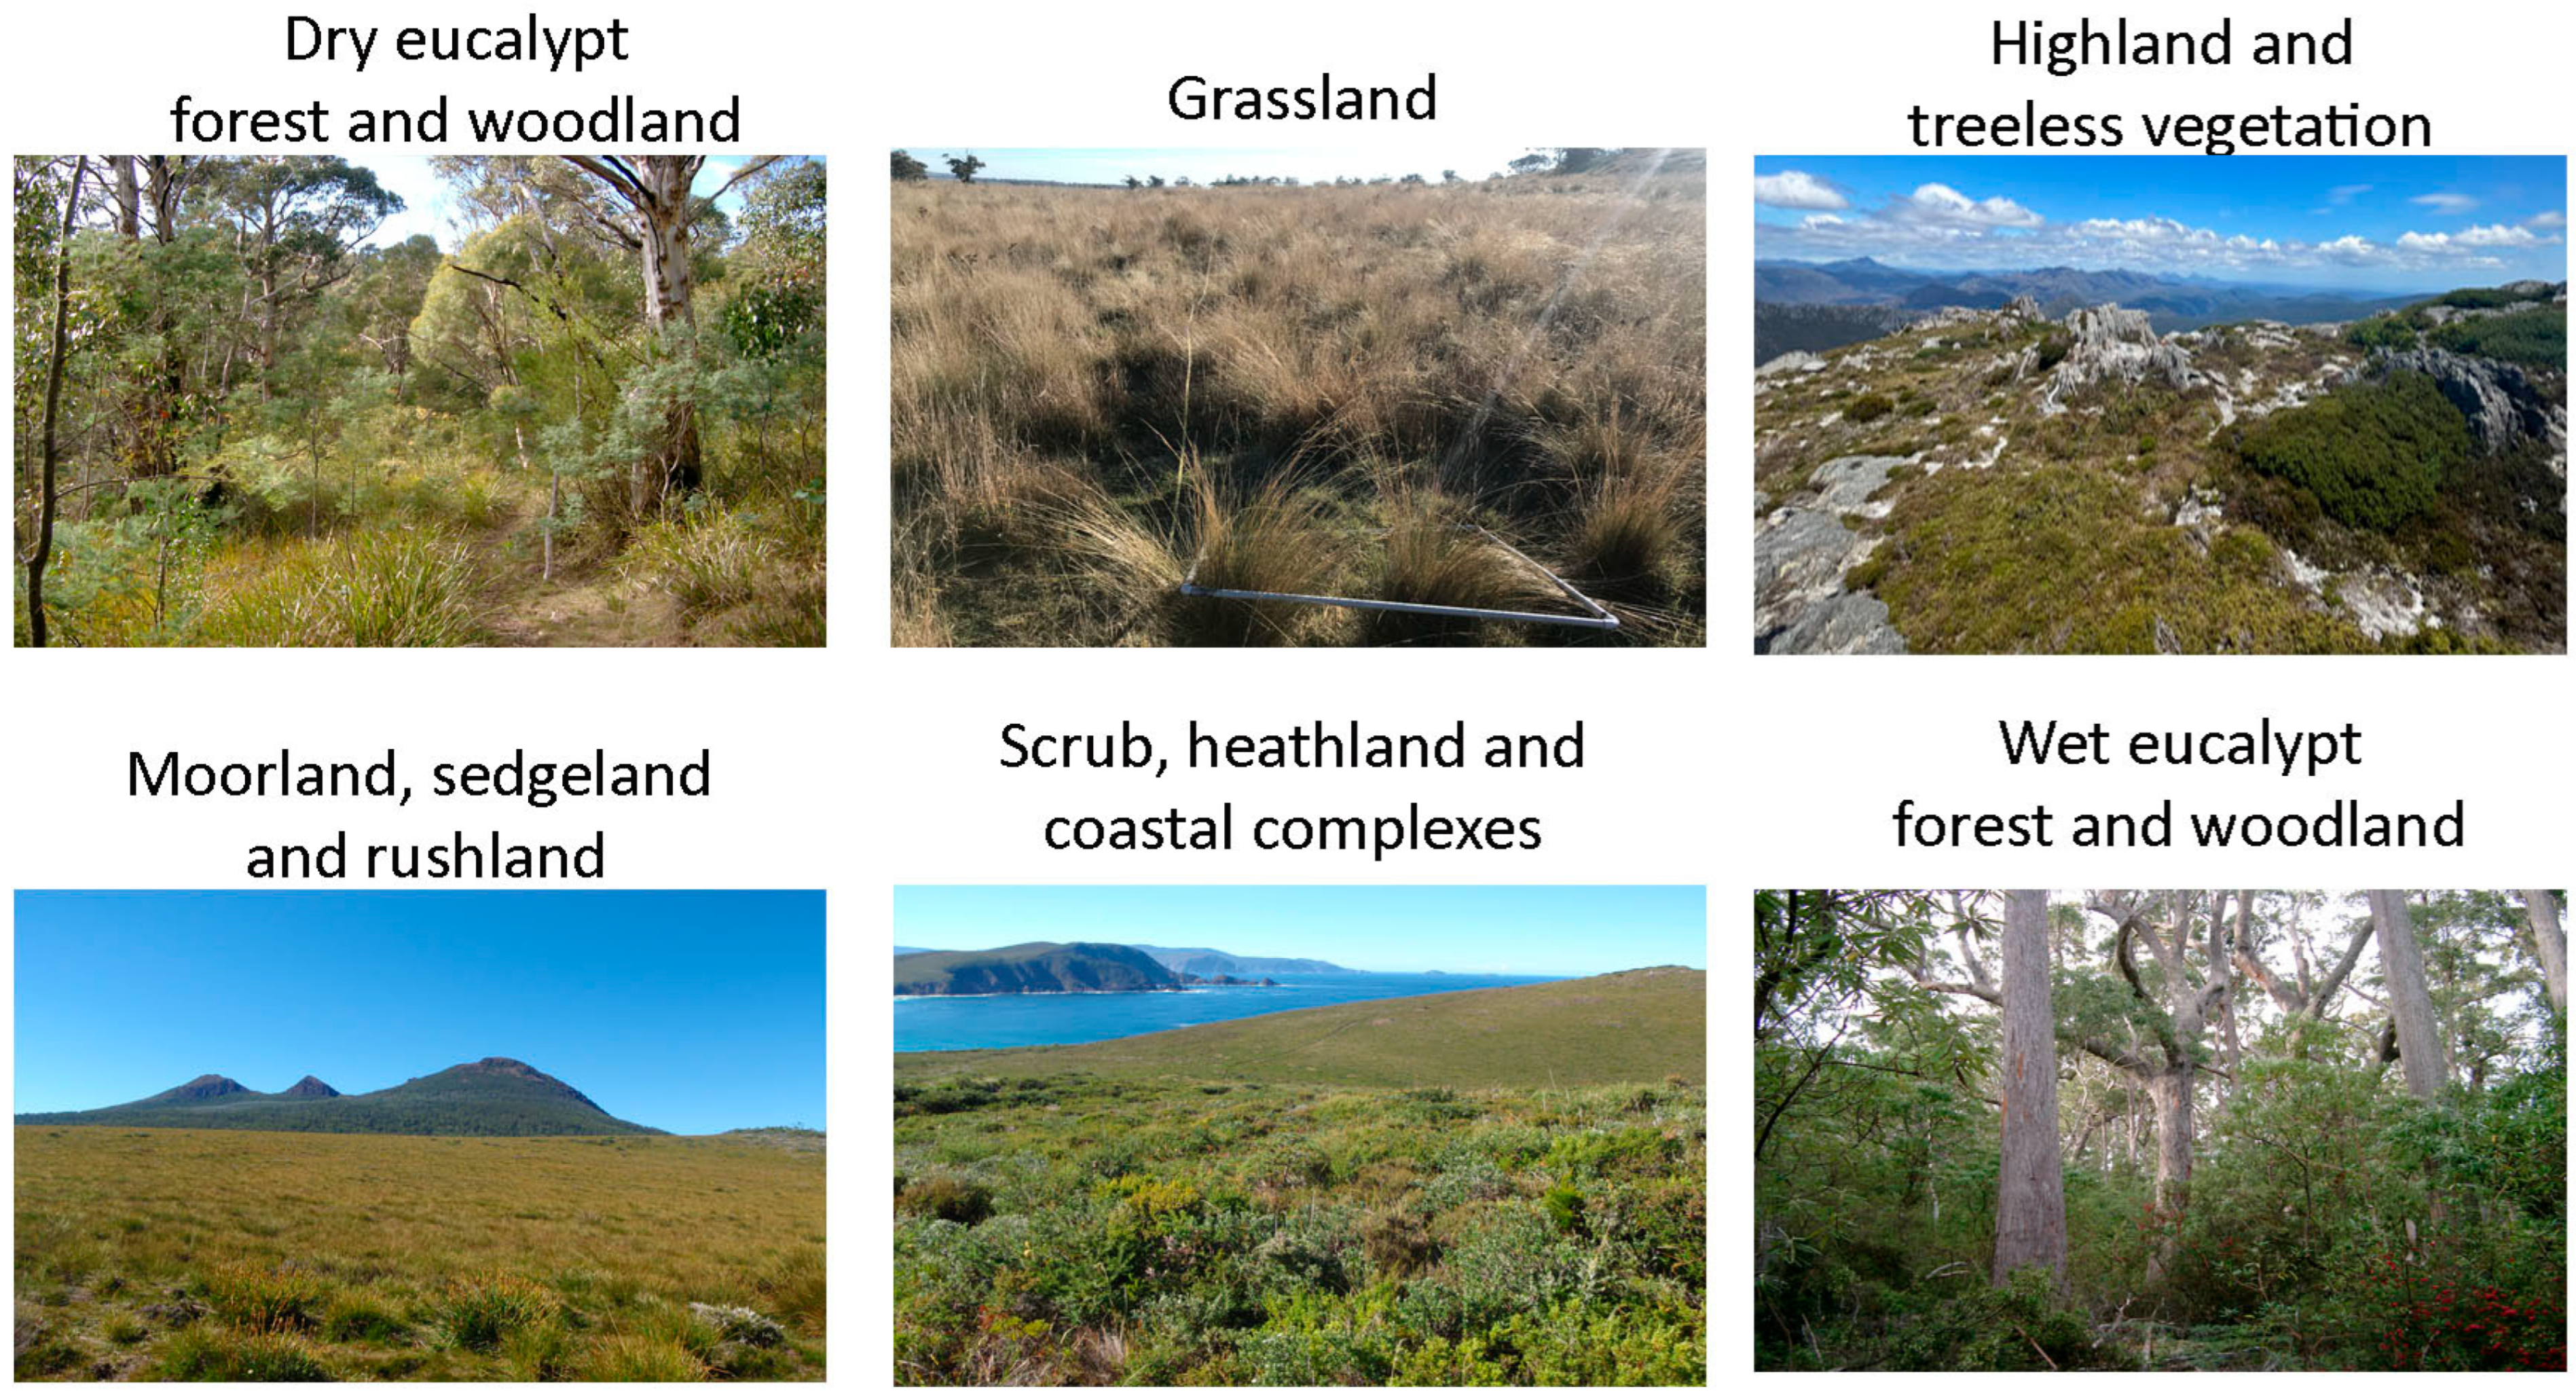
For all research questions, attributes are measured from field and desktop analysis, with herbivore activity based upon observed scat counts. With respect to research questions 2 and 3, we are particularly interested in understanding how fire alters vegetation and landscape characteristics and how this impacts native herbivore food sources (which are typically fodder).

2. Study Area

Tasmania is a mid-latitude, temperate island state of Australia featuring high geodiversity and maritime superhumid to semiarid climates, with no point in Tasmania further than 115 km from the ocean [22]. Overall, 21% of Tasmania is currently protected as World Heritage Area, and another 21% is preserved in National Parks and other protected areas [23].
Vegetation ranges from coastal heathland to alpine fjaeldmark, from tussock grassland to rainforest. Most of the native vegetation of the island is dominated by either trees in the genus Eucalyptus or hummock sedges in the genus Gymnoschoenus. There is negligible top-down pressure from large predators and relative tectonic stability, meaning that most of the native vegetation is shaped by climate, topography, soils, fire, and herbivory. The most widespread plant communities of Tasmania are (Figure 2):
  • Dry eucalypt forests-flora has many scleromorphic plants and an open understorey. Bushfire is critical to the regeneration of scleromorphic plants, such as those in the genus Eucalyptus [24].
  • Highland treeless vegetation–This ecosystem is typically dominated by scleromorphic shrubs that are not well-adapted to fire [25].
  • Grasslands-in Tasmania, grasslands are typically dominated by native tussock grasses and have low forb and shrub cover. Both fire and grazing can be important in preventing invasion of woody plants [26].
  • Moorlands, sedgelands, and rushlands-These ecosystems dominated by sedges, rushes and other hard graminoids predominantly occur in areas with high rainfall and low fertility. Fire can burn in any season after as little as 1–2 rain-free days [27].
  • Scrub, heathland, and coastal complexes occurring near the coast, this vegetation grouping has little else in common, with heath and scrub being scleromorphic vegetation occurring largely on infertile soils, with the latter replacing the former in the absence of fire [28], and the latter being the vegetation within the fertile saltspray zone, variously dominated by large-leaved shrubs and sand-binding grasses [29].
  • Wet eucalypt forests are characterised by understoreys dominated by rainforest trees, broad-leaved small trees or by tree ferns [30]. They occur in areas of high rainfall with reliable summer rain. Ignition is infrequent and undesirable due to accumulation of large fuel loads and the potential for catastrophic loss of biota.

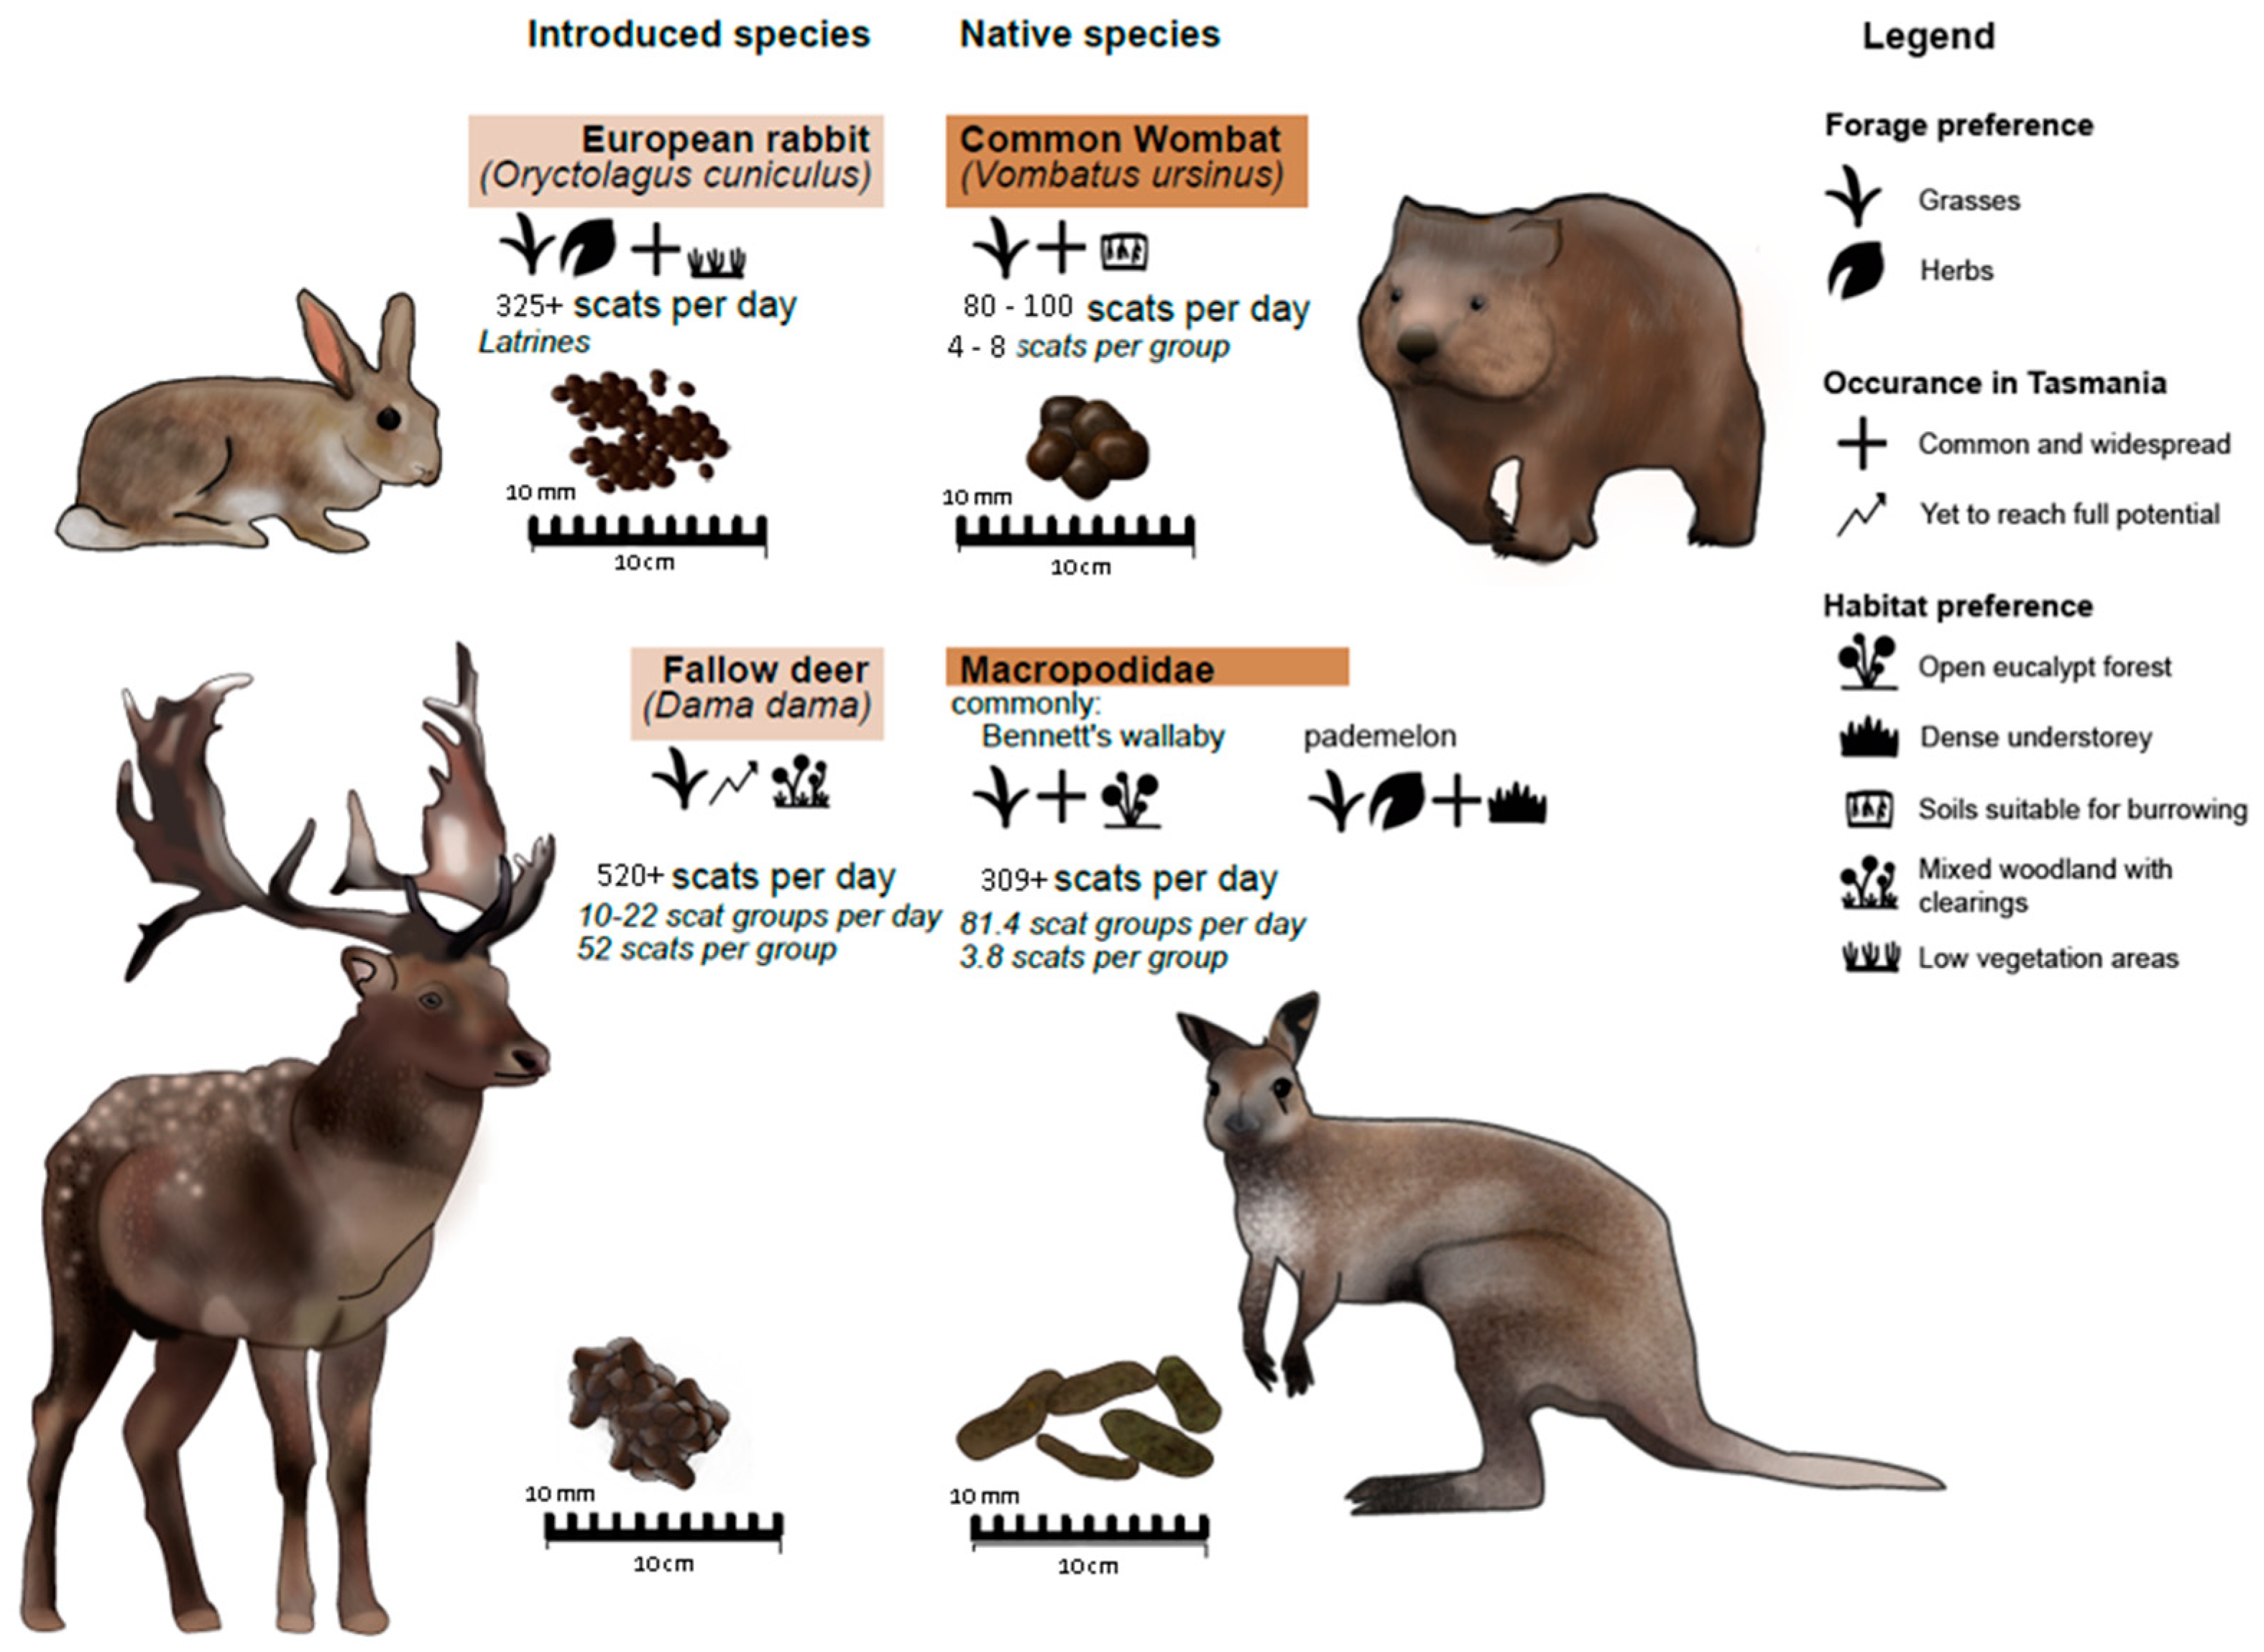
Native and Introduced Vertebrate Herbivores of Tasmania

The most widespread and abundant native macropods in Tasmania are the Tasmanian subspecies of Bennett’s wallaby (Notamacropus rufogriseus Desmarest) and the Tasmanian pademelon (Thylogale billardierii Desmarest). Pademelons select the dense understorey of native forests and plantations for shelter, whereas Bennett’s wallaby has a greater home-range area, often in eucalypt forests with open understoreys [9,31]. Wallabies and pademelons preferentially consume grasses, though pademelons also consume broad-leafed forbs [8] where these are available and shrubs, including many weeds [32]. Both species browse the lower branches of trees [33]. Bennett’s wallabies occur from sea level to the highest peaks in Tasmania, while the pademelon is absent only from the true alpine zone (Figure 3).
Johnson et al. [34] estimated the average defecation rate of Bennett’s wallaby to be 81.4 per 24 h (3.82 pellets per defecation) at Wallaby Creek in northern New South Wales, Australia. Scat deposition typically occurs directly where the individual feeds, with most feeding occurring around dawn and dusk [34]. This means scat location and abundance can provide insight into macropod feeding behaviour. Wiggins & Bowman [31] found 90% of macropod scats persisted undecomposed in the landscape for five months, with greater than 50% persisting over an 11-month period.
Tasmanian native wombats create burrow systems or shelter in caves from sea level to the highest peaks of the state. Wombats have a strong preference for grasses in their diet [35,36,37]. Wombats will also feed on sedges, rushes, and lilies, using adapted upper incisor teeth and hypsodont molars to gnaw through tougher vegetation [36,38]. In a single night, a wombat will commonly produce 80–100 scats. They are usually placed in latrines, away from forage plants [37].
Fallow deer were introduced to Tasmania in 1829 [39], and to mainland Australia in the 1880s. Deer have not yet reached their potential range in Tasmania [40]. Deer are ruminants, predominantly grazing on softer grasses, though they may browse upon soft bark, new shoots, seed heads, leaves and flowers [41,42]. Over-population of deer has caused vegetation degradation across the globe [43,44,45,46].
In the mild climate, mid-latitude, southern Czech Republic, deer pellet production ranged between 10 groups per day in spring to 22 groups per day in summer [46]. These groups typically occur where deer feed, consisting of approximately 50 scats. Scats can be dispersed by trampling, or through aeolian processes, so individual deer scats must be counted. Deer scat groups can persist in the Tasmanian landscape up to 17 months after defecation [42].
Since their introduction to Tasmania, rabbits have become common and widespread, particularly in low vegetation with deep soils suited to building warrens. Rabbits generally prefer grasses and forbs [47]. Groups of rabbits (3–11 individuals) build warrens and may consume the roots and seeds of grasses, which may lead to soil erosion and the loss of native plant species [48]. Such degradation has inspired the common labelling of the species as Australia’s most destructive pest [49].
Like other species of the Leporidae family, rabbits produce both soft and hard scats, ingesting the former which are rich in protein and vitamins [50]. Estimations of total scats per day vary with diet, location, and climate, with groups of rabbits often piling scats at latrine sites [51]. In subalpine New South Wales, Australia, Wood [10] recorded an average of 325 hard scats per rabbit per day, fluctuating between 276 in winter and 448 in spring, with 99.3% persisting over seven weeks, and 95% over a 14-week period.

3. Materials and Methods

3.1. Site Selection

The aim of the site selection was to provide a representative study of the Tasmanian landscape. A state-wide screening of spatial information and datasets available publicly via Land Information Services Tasmania (LISTmap) [52] was conducted in early 2021 (Table S1 in Supplementary Materials). Walsh and Wardlaw [53] find that herbivory is not markedly influenced by season in Tasmania. Therefore, all observed scats, fresh and dried, were good bio-indicators of animal activity.
The Fire History layer [54] was used to identify the most recent fire event between January 2018 and February 2021 (Table 1 and Table S1). The fire-affected areas were intersected with each of the following vegetation layers in TASVEG 4.0 Groups [55]: dry eucalypt forest and woodland (henceforth ‘dry forest’), grassland, highland, and treeless vegetation (henceforth ‘highland’), moorland, sedgeland and rushland (henceforth ‘sedgeland’), scrub, heathland and coastal complexes (henceforth ‘heath’), and wet eucalypt forest and woodland (henceforth ‘wet forest’). The areas thus discriminated were examined on the aerial photograph layer in LISTmap [52] which is a rectified aerial photograph layer using the most recent colour aerial photographs of varying scale and resolution.
Contour lines were superimposed to find sites at which unburned and recently burned vegetation of the same type were adjacent (78% of sites within one kilometre of paired site, and all sites within three kilometres of paired site) in similar topographic situations (<20 metre elevation difference between all paired sites) and which were accessible by vehicle or within a return day walk.
Because of the substantial variation in rainfall and temperature in Tasmania, site selection was intentionally inclusive of climatic variables. We used the Australian Bureau of Meteorology July ‘mean daily minimum temperature’, January ‘mean daily maximum temperature’, and February ‘mean precipitation’, the driest month because these were potentially the most proximal to the survival of herbivores across the state (Table S1, Figure 4).
An attempt was made to select potential sites over the main landmass of the island of Tasmania. Some potential sites were excluded because it was not possible to get permission to access them. Others were excluded because the vegetation classification in the mapping overlay was not accurate upon ground-truthing. Twenty-three sites were selected once ground-truthing was achieved (Table S1, Figure 4).

3.2. Sampling Strategy

Sites were visited once only, with data collection spread over five months, between March and July 2021. At each site, a 50 m linear transect was laid at random within the vegetation type, starting between 5 and 15 m inside the burned area, running orthogonal to the burn edge, where possible, to reduce possible edge effects. Another transect was similarly placed in an adjacent unburned area of the same vegetation type (Figure S1). Aside from guiding the sampling towards the burn centre, the use of a transect served no other purpose and therefore replication of transects within a site would not confer any additional advantage.
At 10 m intervals, including 0 m, a 1 × 1 m quadrat containing a 100-cell grid was placed along the transect, laid on the right-hand side of the tape when facing the burn centre. Each 10 m interval was the centre point of the quadrat edge. This resulted in six quadrats per paired site (burned and unburned), with elevation recorded at each quadrat using the Garmin GPSMAP 64. In addition, local (surrounding 15 m of quadrat) scorch height was recorded to the nearest metre where possible. Slope was also recorded at the local level, categorised into very gentle (<1–3°), gentle (3–10°), medium (10–30°), and steep (>30°), then ranked 1 to 4 respectively.
In all quadrats, percentage cover was estimated to the nearest percent with the aid of a 10 × 10 grid, for each of rock, grass, herb, sedge/rush, shrub, pteridophytes, cryptogams, bare ground, coarse woody debris (greater than 5 cm diameter), ground litter and canopy cover. Bare ground cover was only counted if no other cover attributes were above. Within each quadrat, herbivore scats were individually counted and recorded as macropod, wombat, deer, or rabbit. Bennett’s wallaby, pademelon, and eastern-grey kangaroo (also known as the forester kangaroo) (Macropus giganteus) scats overlap in shape and size, so were merged as ‘macropod’ to reduce observer error and provide the greatest accuracy in overall scat count [56]. No eastern-grey kangaroo sightings were made during fieldwork, nor during any travels between sites, so they may represent little to none of the final macropod scat count.
Soil attributes were collected through in situ measurement with the Fieldscout (TDR 150). Inside each quadrat, the two 7.6 cm rods were pushed downwards into the ground layer (O and/or A horizon) where possible. Rods were fully inserted as the sampling volume comes from the entire length, and any exposed rod reduces sampling accuracy. If resistance was met, the rods were cleaned and inserted into a different section of quadrat. This was repeated until a reading was made. A reading provided soil moisture as volumetric water content (%), soil conductivity as micro siemens per centimetre (µS/cm), and soil temperature in degrees Celsius (°C). A summary workflow of the entire scope of attributes measured has been supplied in Figure S2.

3.3. Statistical Analyses

Statistical analyses were performed using the R statistical language program (Version 1.4.1717) [57] unless otherwise stated. A result was regarded as significant if p ≤ 0.05. A nested two-way Analysis of Variance (ANOVA) was used to determine if scat counts for each species differed between burned and unburned paired sites, or between vegetation types. Where the interaction was not significant, only the main effects are discussed.
The ratio between mean scat numbers per square metre in the recently burned areas and that in the adjacent controls was calculated for each of the four herbivore taxa so as to standardised and normalise data for comparison between each of the six vegetation types. The direction and linear strength of the relationships between the ratios for each taxon and the mean burned and unburned fodder cover was calculated for each of the six vegetation types using the Pearson product moment correlation coefficient.
The preliminary statistical analyses discussed previously revealed distinctly different patterns of scat deposition between the four species. To understand the drivers of animal activity, a series of linear models that incorporated all biophysical, biological, and climatic variables were used. Identified from the correlation coefficients, these models incorporated specific variables shown to be informative for each of the species. Put simply–scat abundance differed between species and locations and was therefore predicted or controlled by different sets of variables from the dataset collected.
For macropod scat abundance, all combinations of theoretically feasible predictor variables were used to create general linear models using the default procedure in Minitab16. In these models, site location was used as a random factor. Significant predictors, which formed the best explanatory model, were explored graphically using the ggplot2 package in R version 1.4.1717 [57]. In order to compare the significant predictor of macropod scat abundance in the present study with a similar legacy dataset [5], percentage fodder cover with site location as a random factor was used to predict macropod scats in the subset of dry forest, sedgeland and grassland quadrats in the present study and the same model applied to fodder dry weight with all quadrats in the earlier study.
For wombat, deer and rabbit, quadrat-level observations of scats were dominated by zero-inflation, which was expected from their defecation habits and latrine use. Quadrats were therefore analysed as scat ‘presence versus absence’, rather than scat abundance used for macropods. All combinations of predictor variables were tried in a logistic regression for best fit. Logistic regression was completed through Minitab 16 Statistical Software [58]. Significant predictors, which formed the best model for each group, were explored graphically using the ggplot2 package and base R version 1.4.1717 [57].

4. Results

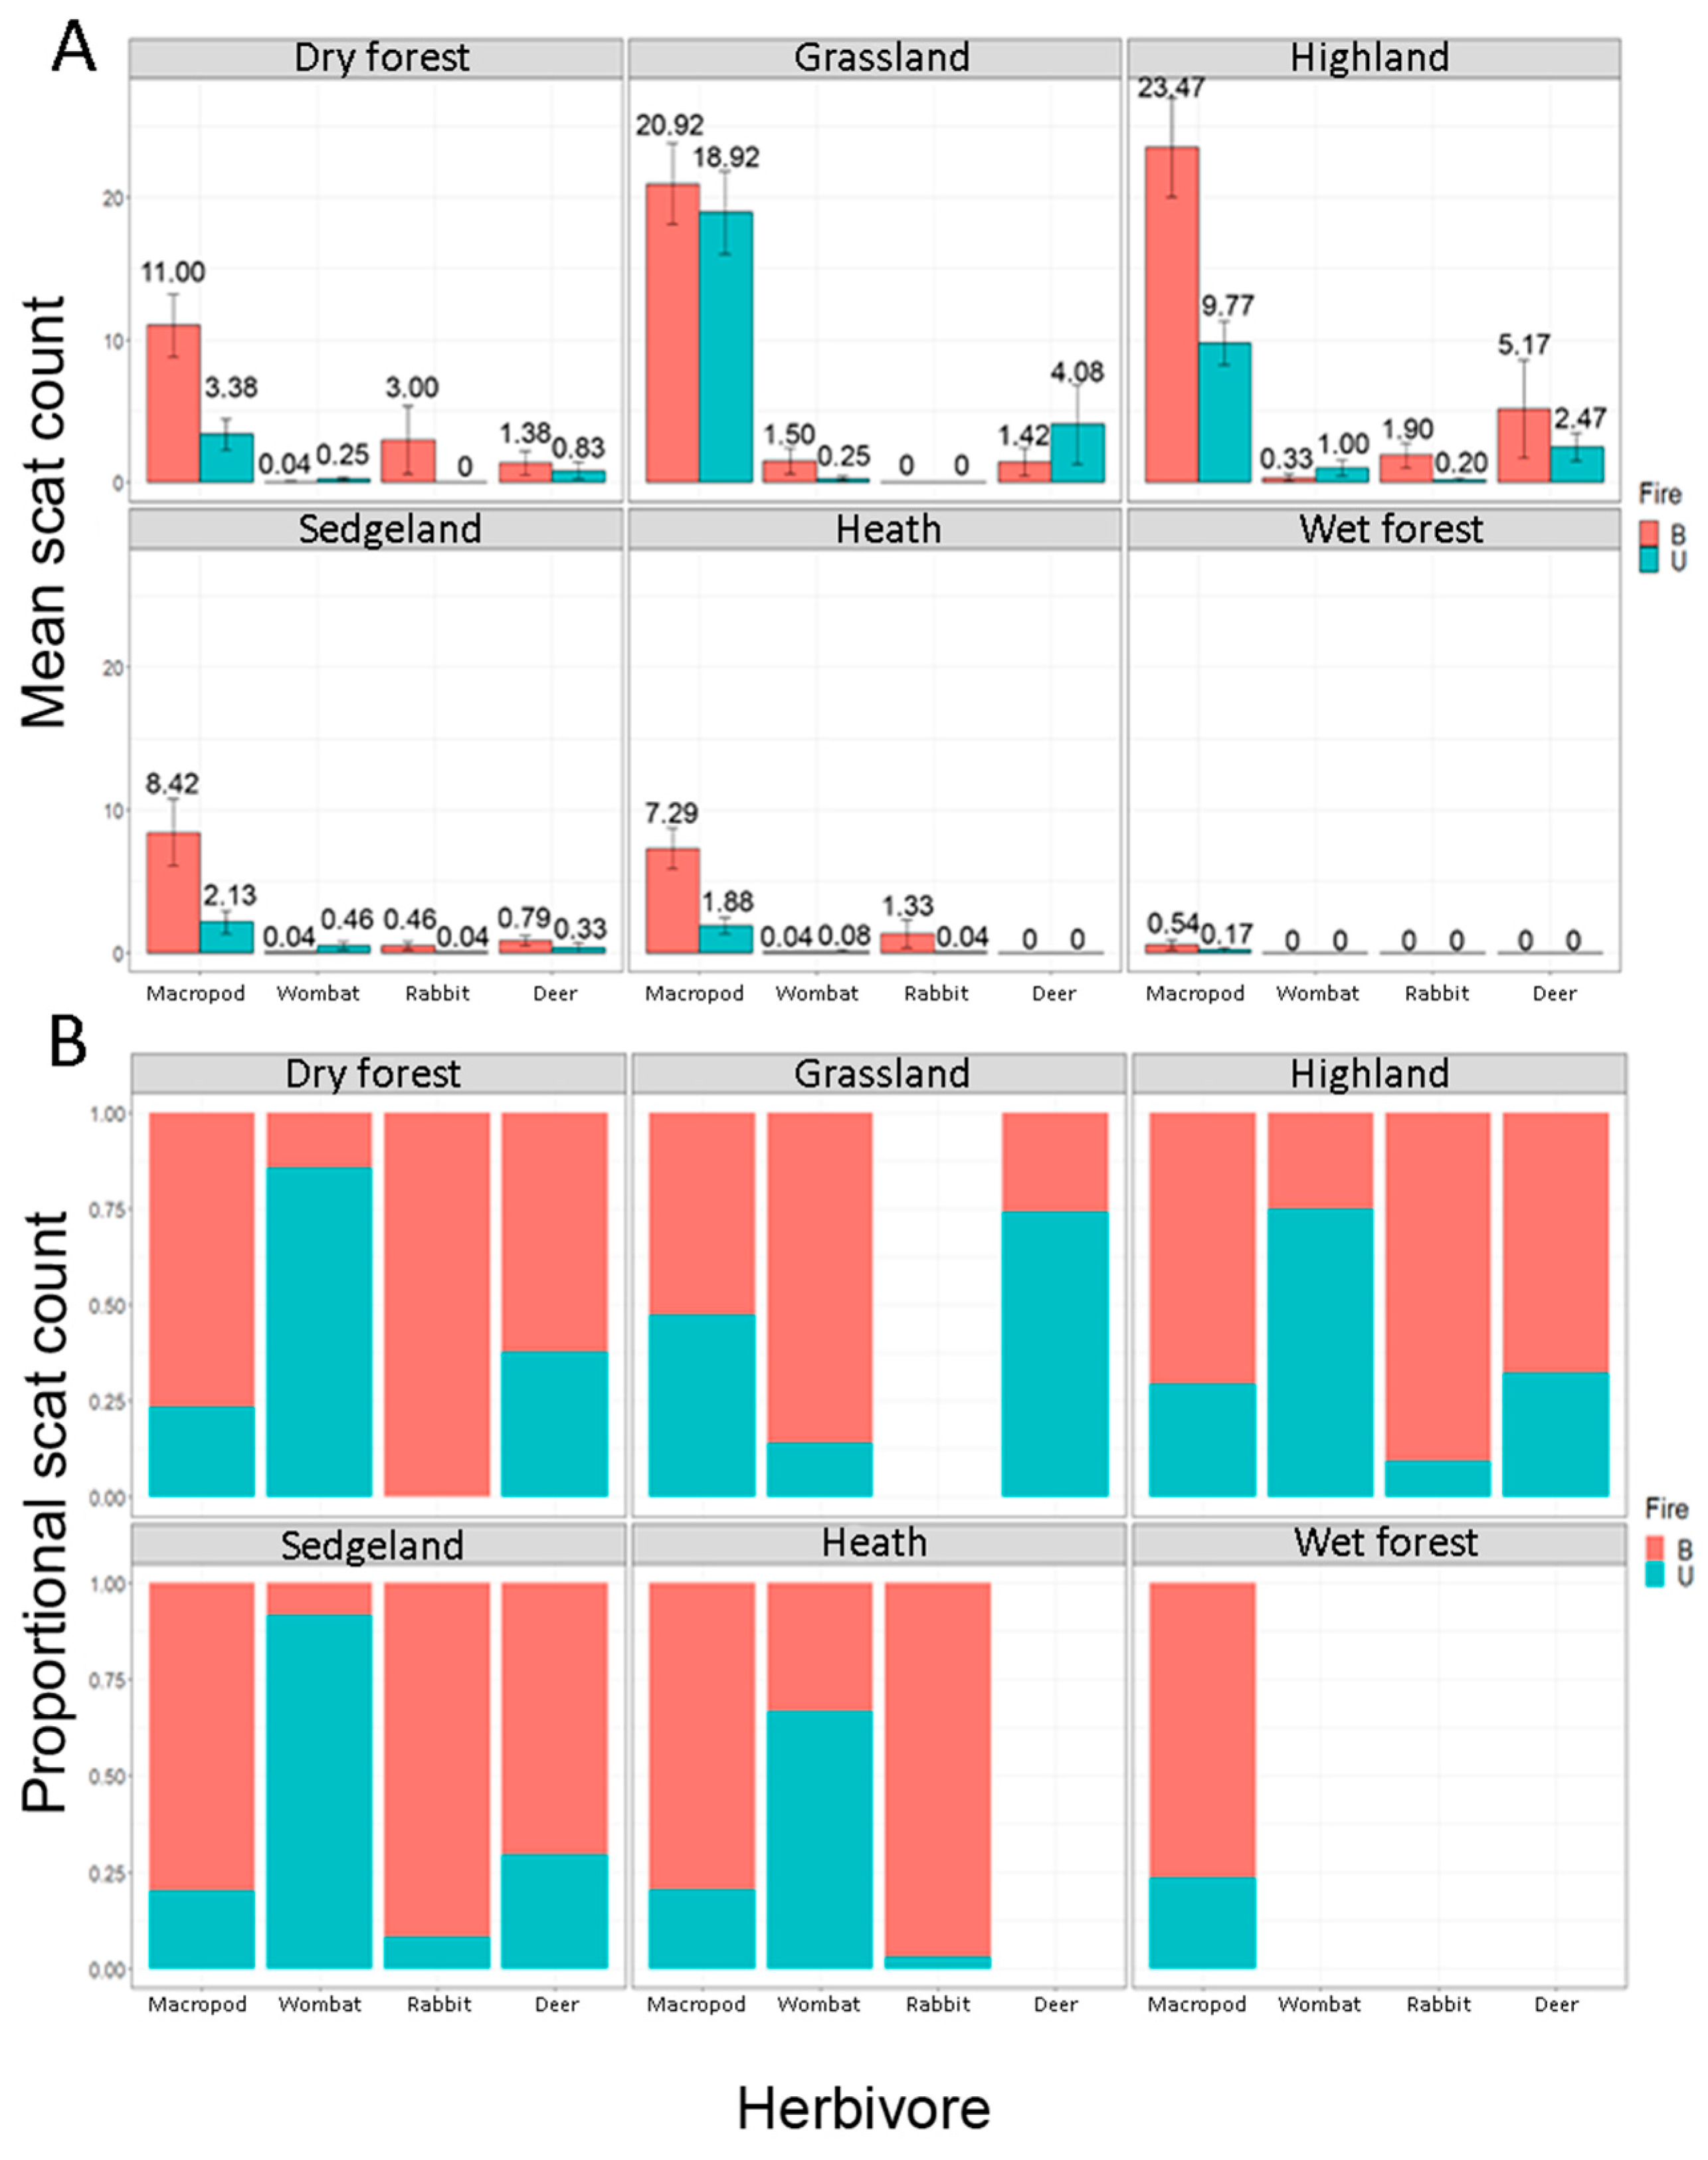
4.1. The Main Effect–Fire, Vegetation and Herbivores

Contrary to our first hypothesis that native and exotic herbivores occupied different post-fire environments, each species instead showed a different relationship between scat deposition, vegetation types, and environmental variables (Figure 5).
The interaction between vegetation type and fire (burned or unburned), was only significant for macropods (Table 2). A significant difference was found between burned and unburned highland vegetation for macropods, with more scats found in burned sites in this vegetation type (Table 3). Macropod scats were also the most abundant of the four herbivore groups.
The main effect of vegetation community type on scat abundance was significant for macropods (p ≤ 0.001), wombats (p ≤ 0.05), and deer (p ≤ 0.05). Macropods scat means were most abundant in highland vegetation. Wombat scat means were most abundant in grasslands and highlands and completely absent in wet forests. Deer scat means were highest in highland vegetation and absent from scrub and wet forests. Rabbit scat means were highest in dry forests and completely absent from grasslands and wet forest sites (Table 3, Figure 5).
The main effect of fire status when nested within vegetation community type was significant for macropods (p ≤ 0.001), and rabbits (p ≤ 0.05) (Table 2). Wombat scats were in greater abundance within the unburned pairs when compared to burned sites of the same vegetation type, albeit, this was not significant. Deer scats were lower in unburned pairs in grasslands, and higher in burned dry forest, highland and sedgeland (although not significant). Rabbit scat means were significantly higher in burned plots when compared with unburned plots (Table 2 and Table 3, and Figure 5).

4.2. Fire Attributes as Predictors for Herbivore Activity

Fire attributes were significant predictors of herbivore activity in dry forests, whereby fire size was significant in linear models for macropod (df (4,43); F = 13.4; p ≤ 0.001) and rabbit (df (4,43); F = 3.253; p ≤ 0.05) scats, with greater scat presence in larger fires. Scorch height in dry forest also significantly influenced macropod (df (7,40); F = 4.44; p ≤ 0.001) and rabbit (df (7,40); F = 2.28; p ≤ 0.05) scats, with greater scat presence in areas of higher scorch height. Measurements of fire size and scorch height resulted in an insignificant relationship with wombat, and deer scat presence.

4.3. Vegetation Attributes as Predictors for Herbivore Activity

The greater the fodder cover in the unburned area the less was the concentration of scats in the recently burned areas (scats burned/scats unburned) for both macropods (r = −0.864, d.f. = 5, p = 0.023) and rabbits (r = −0.989, d.f. = 3, p = 0.020). The relationship was the reverse for wombats (r = 0.928, d.f. = 4, p = 0.023). There was no relationship for deer (r = −0.038, d.f. = 3, p = 0.962).
Fodder cover and the cover of shrubs were the most explanatory predictors with significant slopes for macropod scat abundance (Regression Equation: Macropod = 0.025 + 0.977 Fodder − 0.0113 Shrub; R2 = 98.74%) (df (2,275); F = 8873.08; p ≤ 0.001). This regression equation gave the highest r-squared value, but only by 0.02 when compared to the regression equation of fodder alone (R2 = 98.72%). Shrub cover (F = 3.78) contribution to the model may be largely an artifact of fodder (F = 8371.66) absence, only contributing 1:2214.72 or 0.045% to the model. Therefore, fodder presence appeared to be the most significant control on macropod scat count (Figure 6).
Fodder dry weight was a very strong predictor of macropod scats per site in the legacy data set (Regression equation: macropod scats = 110.6 + 703.4 Fodder; R2 = 83.2%) (df (1,6); F = 24.77; p ≤ 0.005), as in our comparison data set using fodder cover (Regression equation: macropod scats = −0.206 + 0.986 Fodder; R2 = 98.5%; df (1,119); F = 8016.94; p ≤ 0.001). Fodder dry weight was estimated from quadrat ground cover and vegetation height as (t ha−1) [5].
Wombats were attracted by fodder and repelled by shrubs. Wombat scats were present in 16 locations. Percentage shrub cover (z = 3.58; p ≤ 0.001) and percentage fodder cover (z = 2.83; p = 0.005) were the most explanatory predictors in the best wombat scat binary logistic regression model (wombat scats = -3.59639 + 0.0178 Fodder − 0.0290 Shrub) (Test that all slopes are zero: G = 15.309, DF = 2, p-value = 0.000) (Concordant = 74.1%, Discordant = 25.3%).
Deer scats were more abundant with increasing fodder and increasing bare ground. Deer scats were present in 17 locations. Percentage bare ground cover (z = 3.49; p ≤ 0.001) and percentage fodder cover (z = 3.45; p ≤ 0.05) were the most explanatory predictors in the best deer model (deer scats = −2.89593 + 0.0318656 Bare Ground + 0.0169178 Fodder) (Test that all slopes are zero: G = 18.820, DF = 2, p-value = 0.000) (Concordant = 73.8%, Discordant = 25.7%).
Rabbit scats were more abundant as herb cover and bare ground increased. Rabbit scats were present in 12 locations. Percentage bare ground cover (z = 5.45; p ≤ 0.001) and percentage herb cover (z = 3.93; p ≤ 0.001) were the most explanatory predictors of rabbit scat presence/absence in the best model (rabbit scats = −3.37802 + 0.0553503 Bare Ground + 0.0367967 Herb) (Test that all slopes are zero: G = 43.018, DF = 2, p-value = 0.000) (Concordant = 86.1%, Discordant = 12.8%).

4.4. Biophysical Contributions to Observed Vegetation Patterns

Soil moisture content was affected by fire and its interaction with vegetation type, whereby some vegetation types are moister in burned quadrats and others are moister in unburned. Highland vegetation was significantly affected (p ≤ 0.001) where unburned quadrats had 6.3% less soil moisture than burned quadrats (Table S2). The influence of fire on soil temperature was also significant, with burned quadrats in grasslands and heath each having significantly lower mean soil temperature than their unburned pairs (Table S2). Soil conductivity did not significantly respond to fire when averaged across all vegetation communities, but there were significant mean differences between vegetation communities themselves (Table S2).
Climatic variables were not informative in the final models. Dominant vegetation classification was the more significant predictor of herbivore presence and absence, with climate variables likely to be reflected by the vegetation classifications.

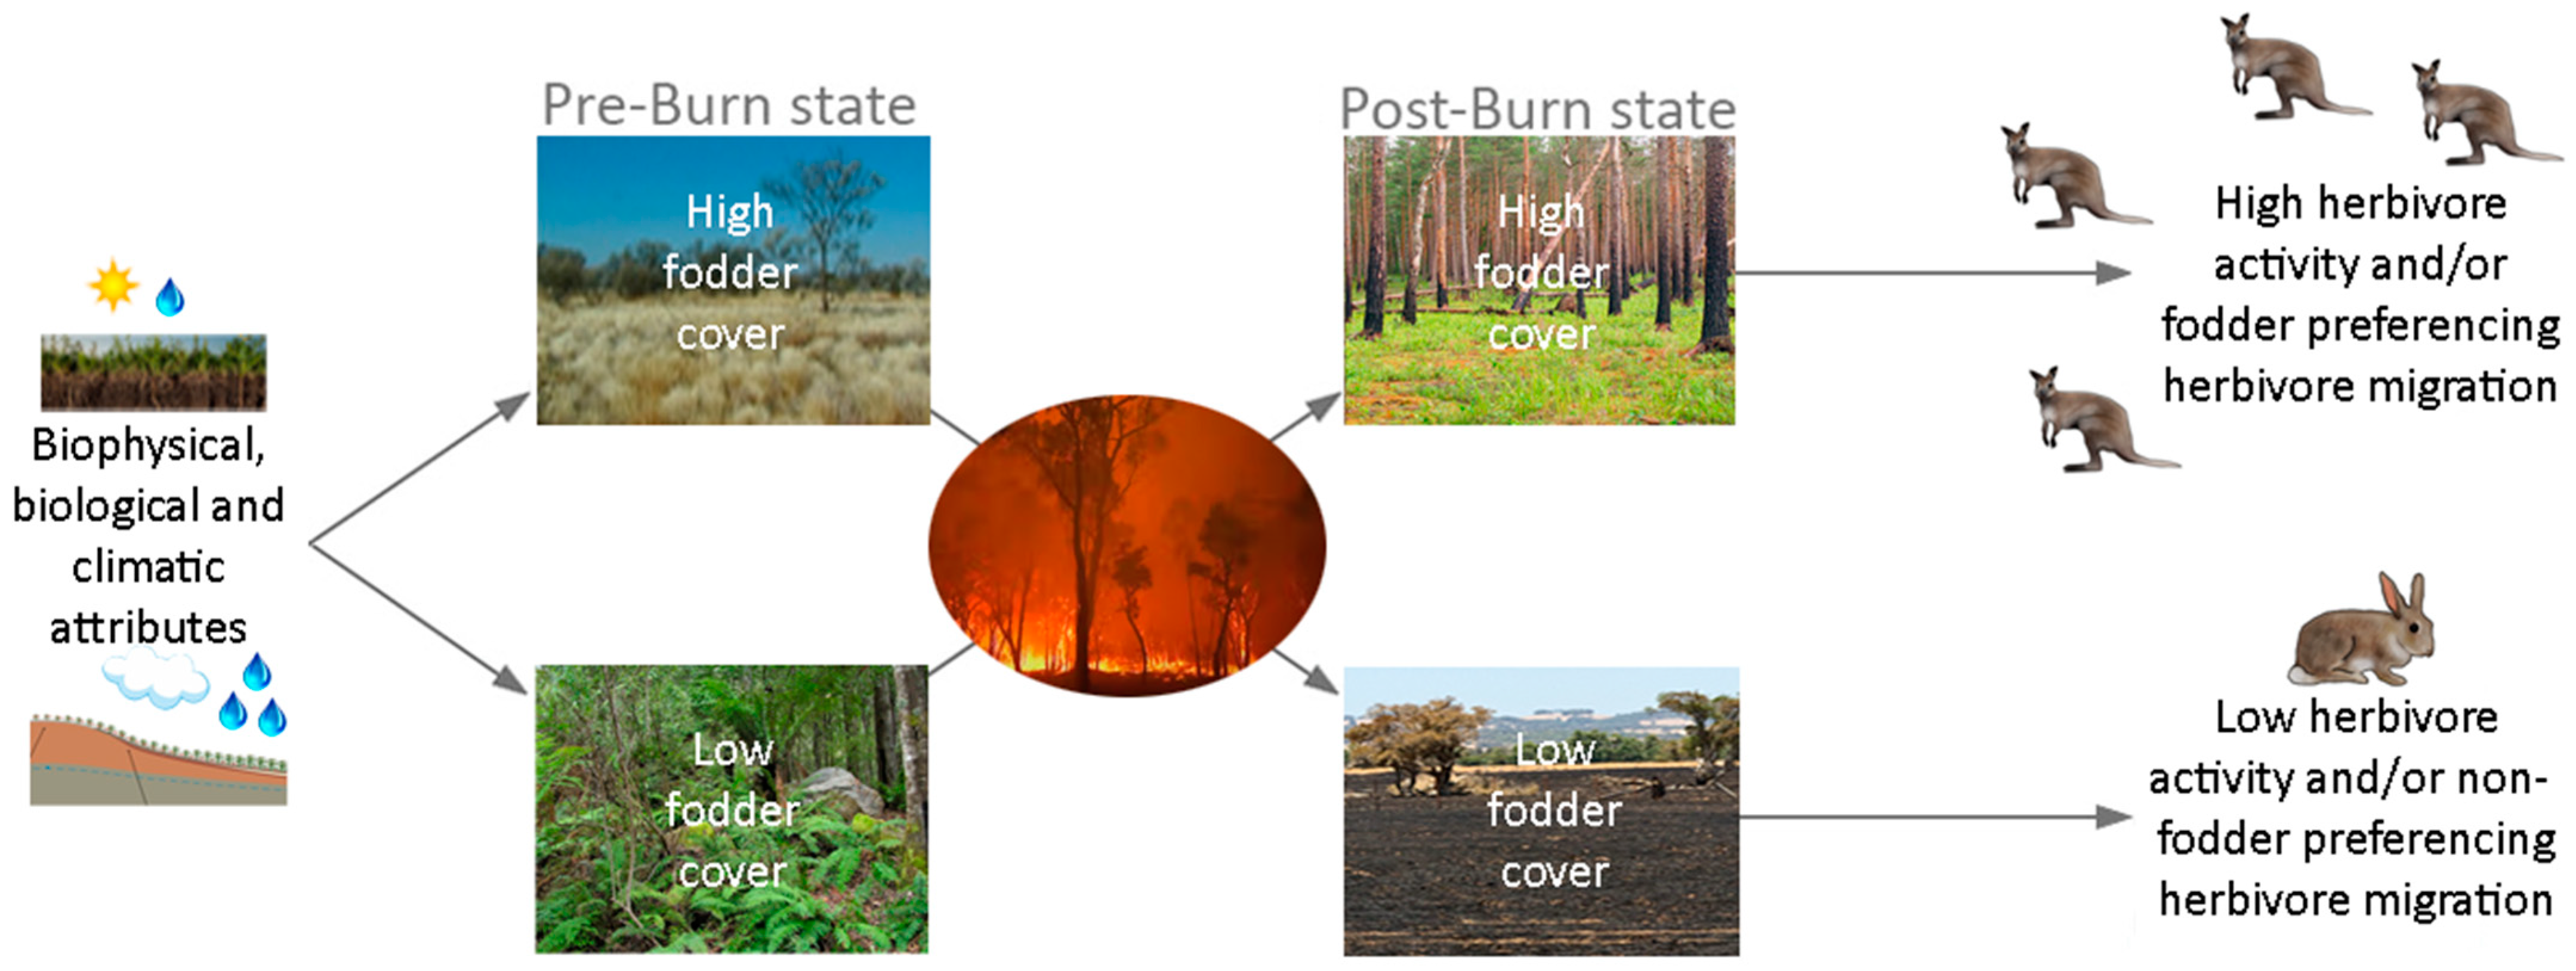
4.5. The Fire and Fodder Reversal Phenomenon

Vegetation communities with low palatability (e.g., low grass and herb cover) in the unburned state (e.g., wet forest) typically became more palatable in the first few years following fire (e.g., dry matter and poorer-nutrient graminoids and herbs replaced post-fire with pioneer nutritious fodder). Vegetation communities with high palatability in the unburned state (e.g., grasslands) typically became less attractive to herbivores after a recent fire. When positioned from low initial palatability to high initial palatability, herbivores (particularly macropods and deer) show an increasing affinity to recently burned sites in vegetation types that were least palatable in the unburned state (Table 4, Figure 7). Wombats did not share this fire–fodder relationship.

5. Discussion

Our first research question, whether the effects of fire would be consistent for native herbivore abundance and distinct from the behaviour of exotic herbivores, was challenged by our findings. The effects of fire differed between species in this investigation, as did the influence of vegetation community type and the interaction of these physical and biological consumers. Our second research question, regarding the consistency of herbivore activity across different vegetation communities and fire attributes, revealed that herbivores have distinctive behavioural and niche preferences that drive vegetation consumption and that not all respond to fire as a primary driver of herbivore activity.
Our results lend support to the more nuanced, third hypothesis (viz. research question 3) that there is a synergistic relationship between fodder and fire and the initial palatability of ground cover vegetation. This is evidenced by a consistent pattern showing that fire influenced initial vegetation quality, and where initial fodder quality and availability are improved post-fire, herbivores will be found. That herbivore activity would increase with decreasing abundance of food plants in the unburned vegetation was consistent with our data for macropods and deer but inconsistent with our data for wombats and rabbits. This potentially represents a ‘fodder reversal phenomenon’ not observed previously in the literature, presumably because our study is one of the first to compare several species over a diverse set of environmental variables and vegetation types (Figure 1).
That wombats appeared beneficially affected by fire in grassland relative to macropods or even rabbits may reflect their known preference for the softer herbs and grasses [36,37] that can be maintained by grazing after fire [59]. Conversely, macropods and rabbits have broader food preferences, extending to trees, shrubs, and coarser grasses, which are available in higher volume in unburned grasslands. The lower wombat abundance in burned heath, highland, dry forest and sedgeland vegetation communities relative to their unburned pairs (Figure 7) may in fact be explained by behaviour, rather than exclusively food preferences. Wombats prefer sites without palatable vegetation to establish latrine sites.It is evident that post-fire sward composition and cover are beneficial for some native herbivores and not others, a fodder reversal phenomenon that occurs across a diverse suite of environmental variables and vegetation communities.
Deer scats were abundant in burned environments in this present study, consistent with the results of fallow deer research in mainland Australia [60], Portugal [61], and the United States [62]. Their absence from the grassland in the present study is not typical, as deer are abundant in the Central Highlands were the grasslands were studied. It is also noted that deer occupation of Tasmanian highland grasslands may be disproportionatly high relative to the full potential range of the species, because much of the low altitude, low-rainfall Tasmanian Midlands grassland country is fenced to exclude them. Thus, the non-significant relationship between the ratio of scats in burned versus unburned and fodder cover may not well represent the true natural range or activities of the species.
We did however find some commonalities between native herbivores, as initially hypothesised, in that the abundances of native herbivore scats were best predicted by fodder and shrub cover. Similarly, we found some commonality between the two exotic species in that the abundances of their scats were both well-predicted by bare ground. However, the suggestion that the native macropods and wombats would respond differently to the environmental effects of fire than the introduced rabbit and fallow deer was not supported by our data, with all species having distinct environmental responses. This unexpected result is critical for Tasmanian land management. Conservation practices should be investigated for their potential influence on individual species, and not in native versus exotic species arguments.
Fallow deer produce patches of bare ground during the rutting season in the United States [63], with the same behaviour seen in sambar deer (Rusa unicolor Robert Kerr) in south-eastern Australia [64]. However, ground disturbance during rutting is often minimal, so their association with bare ground seems more likely to result from the slow rate of recovery of the highland vegetation in which they were abundant than from their direct effects [25].
Rabbit scats were associated with greater herb cover, consistent with work in similar temperate regions, where low, herbaceous cover attracts grazing rabbits [65,66]. Over-grazing of herbs can occur in areas of high-density rabbit populations [67,68], which can increase bare ground exposure [69], usually in Tasmania associated with warrens. Again, there is a possibility that the relationship with bare ground is more a product of the recovery rate of the vegetation types in which they occur than a direct effect of their presence. Revegetation after fire is slow in the high mountain ecosystems [25] in which rabbits and deer were prominent.
The results in the present study may be influenced by animal history traits that interact with or exist outside of the fire–herbivore relationship in Tasmania. Synergistic relationships between herbivore species and the plants they graze require further investigation in the Tasmanian context, particularly due to the recent expansion of exotic flora and fauna. Ongoing data collection is central to determining the degree to which fire influences herbivore behaviour as separate from sward composition, which is of particular importance to environment managers in Tasmania in the control of deer range expansion across the state.
Similarly, the influence of fire intensity between sites of the same vegetation type is largely outside of the scope of the current investigation. We have provided some insight to fire intensity by means of scorch height (within dry forest vegetation), however greater sampling size, or a study scope that documents the burning process may provide a deeper understanding of the fire–environment–herbivore dynamics in Tasmania. There was some indication in the present study that fire size may have affected the activity of macropods and rabbits in dry forests, a result not found by Styger et al. [70] six months after a fire in dry forests and sedgeland. This difference may indicate a delayed effect of fire size, a possibility related to mammal population recovery after large intense fires. The present study found increased activity of macropods with increased scorch height, consistent with the conclusion of Kirkpatrick et al. [5] that low-intensity fires suppress understory recovery in dry forests by leaving the tree canopy intact. We also note that not all fires had equal intensity and duration in our study—some were planned burns for wildfire management, as indicated in Table 1. An expanded future study would take in even more sample sites and fire events so that fire intensity and time since the fire could be modelled alongside vegetation recovery trajectories. This could be achieved by exploring a structural equation model (SEM) in future datasets. The SEM methodology may minimise background spatial autocorrelation that may be present in the current dataset [71]. Nonetheless, the notable difference in scat activity before and after fire events in this study indicates that the mere presence of a fire, no matter what its characteristics, have modified post-fire herbivore activity.
Investigating fire attributes to increase knowledge of fire–environment–herbivore interactions is important for future research, as areas of Tasmania may take decades to fully recover from fire when subject to grazing [25]. Indeed, Mason and Lashley [72], argue broader manipulation of fire attributes is required to better understand the influence of fire on animal populations.

6. Conclusions

In a changing climate in which fire is likely to be a more frequent event [73], our data suggest minimal effects on populations of macropods and wombats are likely. Similarly, frequent fires will not be likely to substantially affect populations of rabbits. However, our data do suggest that deer are disproportionately favoured by recent fires.
We have shown that fire can have disproportionate impacts on fodder cover between Tasmanian ecosystems, whereby fire reduced food resources in vegetation rich in them. The present study has demonstrated a complex fire–environment–herbivore matrix, and although currently widespread and abundant, native species are not free from future climate threats, particularly in the post-fire niche. Conservation management in Tasmania must consider multi-species and multi-ecosystem comparisons and the fire and fodder reversal phenomenon in the mitigation of threats to native species to maximise native species’ ability to utilise resources in a changing climate. In particular, burning ecosystems with high fodder cover needs to be avoided unless such burning is a necessary action to repel woody plant invasion, and, in ecosystems with low fodder availability, patch burning may be desirable to create animal-rich glades if it is feasible and does not threaten other values.

Supplementary Materials

The following supporting information can be downloaded at: https://www.mdpi.com/article/10.3390/fire5040111/s1, Table S1. Site selection criteria and data source; Figure S1: Burned and unburned quadrat comparisons for each vegetation community type; Figure S2: Workflow diagram of this present study which considered climate and geographic controls on fire and attributes from six vegetation types that could support common Tasmanian herbivores; Table S2: Environmental parameters of vegetation communities of Tasmania, contrasted between areas that experienced fire in the past three years (‘Burned’) versus adjacent areas that were not burned in this period (‘Unburned’).

Author Contributions

Conceptualization, M.T.M. and J.B.K.; methodology, D.J.H., M.T.M. and J.B.K.; software, D.J.H. and M.T.M.; validation, D.J.H. and M.T.M.; formal analysis, D.J.H., M.T.M. and J.B.K.; investigation, D.J.H.; resources, D.J.H., M.T.M. and J.B.K.; data curation, D.J.H.; writing—original draft preparation, D.J.H.; writing—review and editing, D.J.H., M.T.M. and J.B.K.; visualization, D.J.H.; supervision, M.T.M. and J.B.K.; project administration, M.T.M.; funding acquisition, D.J.H. All authors have read and agreed to the published version of the manuscript.

Funding

We thank the Tasmanian Governor’s Environmental Scholarship and the University of Tasmania Whitehead Family Honours Scholarship awarded to David Heaton for funding this study.

Data Availability Statement

Data are available by request to the corresponding author.

Conflicts of Interest

The authors declare no conflict of interest.

References

  1. Archibald, S.; Hempson, G.P. Competing Consumers: Contrasting the Patterns and Impacts of Fire and Mammalian Herbivory in Africa. Philos. Trans. R. Soc. B 2016, 371, 20150309. [Google Scholar] [CrossRef] [PubMed] [Green Version]
  2. Bond, W.; Keeley, J. Fire as a Global ‘Herbivore’: The Ecology and Evolution of Flammable Ecosystems. Trends Ecol. Evol. 2005, 20, 387–394. [Google Scholar] [CrossRef]
  3. Cooke, B.D. The Effects of Rabbit Grazing on Regeneration of Sheoaks, Allocasuarina Verticilliata and Saltwater Ti-Trees, Melaleuca Halmaturorum, in the Coorong National Park, South Australia. Austral Ecol. 1988, 13, 11–20. [Google Scholar] [CrossRef]
  4. Bird, P.; Mutze, G.; Peacock, D.; Jennings, S. Damage Caused by Low-Density Exotic Herbivore Populations: The Impact of Introduced European Rabbits on Marsupial Herbivores and Allocasuarina and Bursaria Seedling Survival in Australian Coastal Shrubland. Biol. Invasions 2012, 14, 743–755. [Google Scholar] [CrossRef]
  5. Kirkpatrick, J.B.; Marsden-Smedley, J.B.; Leonard, S.W.J. Influence of Grazing and Vegetation Type on Post-Fire Flammability: Grazing, Vegetation, Post-Fire Flammability. J. Appl. Ecol. 2011, 48, 642–649. [Google Scholar] [CrossRef]
  6. Leonard, S.; Kirkpatrick, J.; Marsden-Smedley, J. Variation in the Effects of Vertebrate Grazing on Fire Potential between Grassland Structural Types: Grazing Effects on Fire Potential. J. Appl. Ecol. 2010, 47, 876–883. [Google Scholar] [CrossRef]
  7. Archibald, S.; Bond, W.J. Grazer Movements: Spatial and Temporal Responses to Burning in a Tall-Grass African Savanna. Int. J. Wildland Fire 2004, 13, 377. [Google Scholar] [CrossRef]
  8. Sprent, J.A.; McArthur, C. Diet and diet selection of two species in the macropodid browser–grazer continuum—Do they eat what they ‘should’? Aust. J. Zool. 2002, 50, 183–192. [Google Scholar] [CrossRef]
  9. Le Mar, K.; Mcarthur, C. Comparison of Habitat Selection by Two Sympatric Macropods, Thylogale Billardierii and Macropus Rufogriseus Rufogriseus, in a Patchy Eucalypt-Forestry Environment. Austral Ecol. 2005, 30, 674–683. [Google Scholar] [CrossRef]
  10. Wood, D. Estimating Rabbit Density by Counting Dung Pellets. Wildl. Res. 1988, 15, 665. [Google Scholar] [CrossRef]
  11. Foster, C.N.; Barton, P.S.; Sato, C.F.; MacGregor, C.I.; Lindenmayer, D.B. Synergistic Interactions between Fire and Browsing Drive Plant Diversity in a Forest Understorey. J. Veg. Sci. 2015, 26, 1112–1123. [Google Scholar] [CrossRef]
  12. Neff, D.J. The Pellet-Group Count Technique for Big Game Trend, Census, and Distribution: A Review. J. Wildl. Manag. 1968, 32, 597. [Google Scholar] [CrossRef]
  13. Rhodes, A.C.; St. Clair, S.B. Measures of Browse Damage and Indexes of Ungulate Abundance to Quantify Their Impacts on Aspen Forest Regeneration. Ecol. Indic. 2018, 89, 648–655. [Google Scholar] [CrossRef]
  14. Burkepile, D.E.; Thompson, D.I.; Fynn, R.W.S.; Koerner, S.E.; Eby, S.; Govender, N.; Hagenah, N.; Lemoine, N.P.; Matchett, K.J.; Wilcox, K.R.; et al. Fire Frequency Drives Habitat Selection by a Diverse Herbivore Guild Impacting Top-down Control of Plant Communities in an African Savanna. Oikos 2016, 125, 1636–1646. [Google Scholar] [CrossRef]
  15. Jachmann, H. Evaluation of Four Survey Methods for Estimating Elephant Densities. Afr. J. Ecol. 1991, 29, 188–195. [Google Scholar] [CrossRef]
  16. Archibald, S.; Bond, W.J.; Stock, W.D.; Fairbanks, D.H.K. Shaping the landscape: Fire–grazer interactions in an African Savanna. Ecol. Appl. 2005, 15, 96–109. [Google Scholar] [CrossRef]
  17. Sankaran, M.; Ratnam, J.; Hanan, N. Woody Cover in African Savannas: The Role of Resources, Fire and Herbivory. Glob. Ecol. Biogeogr. 2008, 17, 236–245. [Google Scholar] [CrossRef]
  18. Anderson, T.M.; Ritchie, M.E.; Mayemba, E.; Eby, S.; Grace, J.B.; McNaughton, S.J. Forage Nutritive Quality in the Serengeti Ecosystem: The Roles of Fire and Herbivory. Am. Nat. 2007, 170, 343–357. [Google Scholar] [CrossRef] [PubMed]
  19. Burkepile, D.E.; Burns, C.E.; Tambling, C.J.; Amendola, E.; Buis, G.M.; Govender, N.; Nelson, V.; Thompson, D.I.; Zinn, A.D.; Smith, M.D. Habitat Selection by Large Herbivores in a Southern African Savanna: The Relative Roles of Bottom-up and Top-down Forces. Ecosphere 2013, 4, art139. [Google Scholar] [CrossRef] [Green Version]
  20. Donaldson, J.E.; Archibald, S.; Govender, N.; Pollard, D.; Luhdo, Z.; Parr, C.L. Ecological Engineering through Fire-Herbivory Feedbacks Drives the Formation of Savanna Grazing Lawns. J. Appl. Ecol. 2018, 55, 225–235. [Google Scholar] [CrossRef] [Green Version]
  21. Yoganand, K.; Owen-Smith, N. Restricted habitat use by an African savanna herbivore through the seasonal cycle: Key resources concept expanded. Ecography 2014, 37, 969–982. [Google Scholar] [CrossRef]
  22. Grose, M.R.; Barnes-Keoghan, I.; Corney, S.P.; White, C.J.; Holz, G.K.; Bennett, J.B.; Gaynor, S.M.; Bindoff, N.L. Climate Futures for Tasmania: General Climate Impacts; Antarctic Climate and Ecosystems Cooperative Research Centre: Hobart, Australia, 2010; ISBN 978-1-921197-05-5. [Google Scholar]
  23. Complete National Parks and Reserves Listings. Parks and Wildlife Service. Available online: https://parks.tas.gov.au/about-us/managing-our-parks-and-reserves/reserve-listing (accessed on 11 January 2021).
  24. Jackson, W.D. Fire, air, water and earth—An elemental ecology of Tasmania. Proc. Ecol. Soc. Aust. 1968, 3, 9–16. [Google Scholar]
  25. Kirkpatrick, J.B.; Bridle, K.L. Natural and cultural histories of fire differ between Tasmanian and mainland alpine vegetation. Aust. J. Bot. 2013, 65, 465–474. [Google Scholar] [CrossRef]
  26. Kirkpatrick, J.B.; Jenkinson, I. Effects of Increasing Fire Frequency on Conservation Values in Eucalyptus Grassy Woodland in the Process of Invasion by Allocasuarina Verticillata. Fire 2022, 5, 31. [Google Scholar] [CrossRef]
  27. Balmer, J. Buttongrass moorland vegetation. In Tasmanian Native Bush; A Management Handbook; Kirkpatrick, J.B., Ed.; Tasmanian Environment Centre Inc.: Hobart, Australia, 1991. [Google Scholar]
  28. Bergman, T.; Kirkpatrick, J.B. Transition from heathland to scrub in south-eastern Tasmania—Extent of change since the 1970s, floristic depletion and management implications. Biodivers. Conserv. 2015, 24, 213–228. [Google Scholar] [CrossRef] [Green Version]
  29. Kirkpatrick, J.B.; Harris, S. The Conservation of Tasmanian Dry Coastal Vascular Plant Communities; National Parks and Wildlife Service: Hobart, Australia, 1995; p. 129. [Google Scholar]
  30. Kirkpatrick, J.B. Conservation of rainforest in Tasmania. In Anon (ed.) Tasmania Rainforests: What Future? Wilderness Society: Hobart, Australia, 1988; pp. 47–56. [Google Scholar]
  31. Wiggins, N.L.; Bowman, D.M.J.S. Macropod Habitat Use and Response to Management Interventions in an Agricultural—Forest Mosaic in North-Eastern Tasmania as Inferred by Scat Surveys. Wildl. Res. 2011, 38, 103. [Google Scholar] [CrossRef]
  32. Scurr, G.; Kirkpatrick, J.B.; Daniels, G.D.; Mcquillan, P.B. Biotic Resistance to Chrysanthemoides Monilifera ssp. Monilifera in Tasmania: HERBIVORES AND BONESEED. Austral Ecol. 2008, 33, 941–950. [Google Scholar] [CrossRef]
  33. Hazeldine, A.; Kirkpatrick, J.B. Practical and Theoretical Implications of a Browsing Cascade in Tasmanian Forest and Woodland. Aust. J. Bot. 2015, 63, 435. [Google Scholar] [CrossRef]
  34. Johnson, C.; Jarman, P.; Southwell, C.J. Macropod Studies at Wallaby Creek. 5. Patterns of Defecation by Eastern Gray Kangaroos and Red-Necked Wallabies. Wildl. Res. 1987, 14, 133–138. [Google Scholar] [CrossRef]
  35. Hume, I.D. Marsupial Nutrition; Cambridge University Press: Cambridge, UK, 1999. [Google Scholar]
  36. Evans, M.; Green, B.; Newgrain, K. The Field Energetics and Water Fluxes of Free-Living Wombats (Marsupialia: Vombatidae). Oecologia 2003, 137, 171–180. [Google Scholar] [CrossRef] [PubMed]
  37. Guy, T.R.; Kirkpatrick, J.B. Environmental Associations and Effects of Disturbances by Common Wombats in Alpine Tasmania. Austral Ecol. 2021, 46, 1392–1403. [Google Scholar] [CrossRef]
  38. Sharp, A.C. Comparative Finite Element Analysis of the Cranial Performance of Four Herbivorous Marsupials: Cranial Performance in Marsupial Herbivores. J. Morphol. 2015, 276, 1230–1243. [Google Scholar] [CrossRef]
  39. Chapman, N.G.; Chapman, D.I. The distribution of fallow deer: A worldwide review. Mammal Rev. 1980, 10, 61–138. [Google Scholar] [CrossRef]
  40. Cunningham, C.X.; Perry, G.L.W.; Bowman, D.M.J.S.; Forsyth, D.M.; Driessen, M.M.; Appleby, M.; Brook, B.W.; Hocking, G.; Buettel, J.C.; French, B.J.; et al. Dynamics and predicted distribution of an irrupting ‘sleeper’ population: Fallow deer in Tasmania. Biol. Invasions 2022, 24, 1131–1147. [Google Scholar] [CrossRef]
  41. Chapman, N.G.; Chapman, D.I. Fallow Deer: Their History, Distribution and Biology. In Coch-y-Bonddu Books; Dalton: Machynlleth, UK, 1997. [Google Scholar]
  42. Locke, S. The Distribution and Abundance of Fallow Deer in the Central Plateau Conservation Area and Adjacent Areas in Tasmania. In Nature Conservation Report 07/02; Department of Primary Industries and Water: Hobart, Australia, 2007. [Google Scholar]
  43. Kay, S. Factors Affecting Severity of Deer Browsing Damage within Coppiced Woodlands in the South of England. Biol. Conserv. 1993, 63, 217–222. [Google Scholar] [CrossRef]
  44. Mouissie, A.M.; Van Der Veen, C.E.J.; Ciska Veen, G.F.; Van Diggelen, R. Ecological Correlates of Seed Survival after Ingestion by Fallow Deer. Funct Ecol. 2005, 19, 284–290. [Google Scholar] [CrossRef]
  45. Gill, R.M.A. The Impact of Deer on Woodlands: The Effects of Browsing and Seed Dispersal on Vegetation Structure and Composition. Forestry 2001, 74, 209–218. [Google Scholar] [CrossRef] [Green Version]
  46. Košnář, A.; Rajnyšová, R. Assessment of a daily defecation rate of fallow deer upon a closed population study. Acta Univ. Agric. Silvic. Mendel. Brun. 2012, 60, 173–180. [Google Scholar] [CrossRef] [Green Version]
  47. Davis, N.E.; Coulson, G.; Forsyth, D.M. Diets of Native and Introduced Mammalian Herbivores in Shrub-Encroached Grassy Woodland, South-Eastern Australia. Wildl. Res. 2008, 35, 684. [Google Scholar] [CrossRef]
  48. Eldridge, D.J.; Myers, C.A. The Impact of Warrens of the European Rabbit (Oryctolagus cuniculus L.) on Soil and Ecological Processes in a Semi-Arid Australian Woodland. J. Arid Environ. 2001, 47, 325–337. [Google Scholar] [CrossRef] [Green Version]
  49. Williams, C.K.; Parer, I.; Coman, B.J.; Burley, J.; Braysher, M.L. Managing Vertebrate Pests: Rabbits. In Bureau of Resource Sciences/CSIRO Division of Wildlife and Ecology; Australian Government Publishing Service: Canberra, Australia, 1995. [Google Scholar]
  50. Hirakawa, H. Coprophagy in Leporids and Other Mammalian Herbivores. Mammal Rev. 2001, 31, 61–80. [Google Scholar] [CrossRef] [Green Version]
  51. Guerrero-Casado, J.; Ström, H.; Hilström, L.; Prada, L.M.; Carpio, A.J.; Tortosa, F.S. Assessment of the Suitability of Latrine Counts as an Indirect Method by Which to Estimate the Abundance of European Rabbit Populations at High and Low Abundance. Eur. J. Wildl. Res. 2020, 66, 10. [Google Scholar] [CrossRef]
  52. Land Information System Tasmania (LIST). Available online: https://maps.thelist.tas.gov.au/listmap/app/list/map (accessed on 11 January 2021).
  53. Walsh, A.M.; Wardlaw, T.J. Variation in mammal browsing damage between eucalypt plantations in Tasmania, and attempts to associate the variation with environmental features. Aust. For. 2011, 74, 197–204. [Google Scholar] [CrossRef]
  54. Land Tasmania. Available online: https://www.thelist.tas.gov.au/app/content/data/geo-meta-datarecord?detailRecordUID=b94d4388-995d-416a-9844-a39de2798bed (accessed on 11 January 2021).
  55. Department of Primary Industries, Parks, Water and Environment (DPIPWE). Available online: https://www.thelist.tas.gov.au/app/content/data/geo-meta-data-record?detailRecordUID=b5c7a079-14bc-4b3caf73-db7585d34cdd (accessed on 11 January 2021).
  56. Bulinski, J.; McArthur, C. Observer Error in Counts of Macropod Scats. Wildl. Res. 2000, 27, 277. [Google Scholar] [CrossRef]
  57. R Core Team (R). R: A Language and Environment for Statistical Computing; R Foundation for Statistical Computing: Vienna, Austria, 2020; Available online: https://www.R-project.org/ (accessed on 13 March 2021).
  58. Minitab 16 Statistical Software (2010). Computer Software; Minitab, Inc.: State College, PA, USA. Available online: www.minitab.com (accessed on 24 September 2021).
  59. Kirkpatrick, J.B.; Marsden-Smedley, J.B.; Di Folco, M.-B.; Leonard, S.W.J. Influence of Grazing and Vegetation Type on Post-Fire Floristic and Lifeform Composition in Tasmania, Australia. Plant Ecol. 2016, 217, 57–69. [Google Scholar] [CrossRef]
  60. Jesser, P.; Queensland Land Protection. Deer (Family Cervidae) in Queensland; Land Protection, Department of Natural Resources and Mines: Brisbane, Australia, 2005. [Google Scholar]
  61. Silva, J.S.; Catry, F.X.; Moreira, F.; Lopes, T.; Forte, T.; Bugalho, M.N. Effects of Deer on the Post-Fire Recovery of a Mediterranean Plant Community in Central Portugal. J. For. Res. 2014, 19, 276–284. [Google Scholar] [CrossRef]
  62. Kie, J.G. Deer habitat use after prescribed burning in northern California. In Pacific Southwest Forest and Range Experiment Station, Forest Service; U.S. Department of Agriculture: Berkeley, CA, USA, 1984; Volume 3. [Google Scholar]
  63. Fellers, G.M. Abundance and impacts of fallow deer leks at point reyes national seashore. Calif. Fish Game 2007, 93, 149. [Google Scholar]
  64. Bennett, A. Sambar presence at Lake Mountain Yarra Ranges National Park and Mount Bullfight Nature Conservation Reserve alpine bogs. In A Report Prepared for Parks Victoria; The University of Melbourne: Melbourne, Australia, 2012. [Google Scholar]
  65. Ferreira, C.; Alves, P.C. Influence of Habitat Management on the Abundance and Diet of Wild Rabbit (Oryctolagus Cuniculus Algirus) Populations in Mediterranean Ecosystems. Eur. J. Wildl. Res. 2009, 55, 487–496. [Google Scholar] [CrossRef]
  66. Rollan, À.; Real, J. Effect of Wildfires and Post-Fire Forest Treatments on Rabbit Abundance. Eur. J. Wildl. Res. 2011, 57, 201–209. [Google Scholar] [CrossRef] [Green Version]
  67. Leigh, J.H.; Wimbush, D.J.; Wood, D.H.; Holgate, M.D.; Slee, A.V.; Stanger, M.G.; Forrester, R.I. Effects of Rabbit Grazing and Fire on a Sub-Alpine Environment.I. Herbaceous and Shrubby Vegetation. Aust. J. Bot. 1987, 35, 433–464. [Google Scholar] [CrossRef]
  68. Green, K.; Davis, N.; Robinson, W. Diet of two fossorial herbivores in a seasonally snow-covered environment. Aust. Mammal. 2016, 39, 169–177. [Google Scholar] [CrossRef]
  69. Croft, J.D.; Fleming, P.J.S.; van de Ven, R. The impact of rabbits on a grazing system in eastern New South Wales. Aust. J. Exp. Agric. 2002, 42, 909–916. [Google Scholar] [CrossRef]
  70. Styger, J.K.; Kirkpatrick, J.B.; Marsden-Smedley, J.; Leonard, S.W.J. Fire incidence, but not fire size, affects macropod densities: Fire incidence affects macropod densities. Austral Ecol. 2010, 36, 679–686. [Google Scholar] [CrossRef]
  71. Grace, J.B.; Anderson, T.M.; Olff, H.; Scheiner, S.M. On the specification of structural equation models for ecological systems. Ecol. Monogr. 2010, 80, 67–87. [Google Scholar] [CrossRef] [Green Version]
  72. Mason, D.S.; Lashley, M.A. Spatial scale in prescribed fire regimes: An understudied aspect in conservation with examples from the southeastern United States. Fire Ecol. 2021, 17, 3. [Google Scholar] [CrossRef]
  73. Fox-Hughes, P.; Harris, R.; Lee, G.; Grose, M.; Bindoff, N. Future Fire Danger Climatology for Tasmania, Australia, Using a Dynamically Downscaled Regional Climate Model. Int. J. Wildland Fire 2014, 23, 309. [Google Scholar] [CrossRef]
Figure 1. In each ecosystem, the relative abundance of fodder before and after a fire event are hypothesised to have different effects on local vertebrate herbivore activity in association with different herbivore preferences. This means that both the pre- and post-burn predictors of fodder cover are just as important to the final post-burn outcome for herbivores as the food preferences of the herbivores themselves.
Fire 05 00111 g001
Figure 2. Images of the six dominant vegetation types in Tasmania. Photographs: top left—Jamie Kirkpatrick, top middle—David Heaton, top right—Melinda McHenry, bottom row—Jamie Kirkpatrick.
Fire 05 00111 g002
Figure 3. Approximate defecation rate and habits for the four herbivore groups in this study. Included here are forage preferences, population occurrence, and habitat preference in Tasmania. These results are taken from previous papers as discussed in the following sections.
Fire 05 00111 g003
Figure 4. Location of study sites in Tasmania (main), dots indicate a paired (burned and unburned) transect, with colours indicating vegetation type. Inserts are (A) mean daily minimum temperature for July (°C), (B) mean daily maximum temperature for January (°C), and (C) mean precipitation for February, the driest month [52]. Modified and adapted using a creative commons licence 4.0 from [52].
Fire 05 00111 g004
Figure 5. ((A)-top) Mean scat count with standard error bars for recently burned (B, red) and unburned (U, blue) sites, by vegetation community type and ((B)-bottom) scat count presented as a proportion of abundance within recently burned (red) and unburned (blue) environments. Dry forest, Grassland, Highland, Sedgeland, Heath, and Wet Forest.
Fire 05 00111 g005
Figure 6. Total scat count (log10) recorded for macropods by percentage fodder cover. Regression line in red, with 95% confidence intervals in blue. Correlation coefficient: R = 0.61, p ≤ 0.001.
Fire 05 00111 g006
Figure 7. Proportional scat count recorded for each herbivore species ordered from least palatable vegetation cover (wet forest), to most palatable vegetation cover (grassland). Proportional abundance of scat count for burned sites in red, and unburned sites in blue.
Fire 05 00111 g007
Table 1. Fire attributes in the selected vegetation community types.
Fire AttributesDry ForestGrassland HighlandSedgelandHeathWet Forest
Number of burned sites/Number of different fire events4/42/25/14/44/44/2
Average burn size (ha)14,881.1
± 4427.4
(2–51,185.3)
2.9 ± 0.8
(0.4–5.4)
51,185.3 ± 0
(NA)
14,807.5
± 4406.3
(736.1–51,185.3)
1689.5
± 578.2
(67.0–6492.0)
49,870.3
± 5001.7
(8322.8–63,719.4)
Fire type/Time since fire (years)Planned/1
Wildfire/1
Wildfire/2
Wildfire/2
Planned/1
Planned/1
Wildfire/2Planned/2
Planned/1
Wildfire/2
Wildfire/2
Planned/1
Planned/3
Planned/3
Wildfire/2
Planned/1
Wildfire/2
Average scorch height (m)6.4
(0–14)
NA2.0
(0–2)
NA4.0
(0–4)
8.9
(0–13)
Table 2. Results of two-way nested hierarchical analysis of variance (ANOVA) for each of four species (native species indicated by *) in Tasmania assessing the impact of fire nested within vegetation communities. Greyed results are not significant.
HerbivoreVegetation CommunityFire StatusVegetation Community * Fire Status
Macropod *df(5,264); F = 26.558; p ≤ 0.001df(1,264); F = 34.253; p ≤ 0.001df(5,264); F = 3.162; p = 0.00864
Wombat *df(5,264); F = 2.471; p = 0.0329df (1,264); F = 0.813; p = 0.3682df (5,264); F = 1.736; p = 0.1266
Deerdf(5,264); F = 2.536; p = 0.0291df (1,264); F = 0.395; p = 0.5302df (5,264); F = 0.568; p = 0.7247
Rabbitdf (5,264); F = 0.990; p = 0.4242df(1,264); F = 5.851; p = 0.0162df (5,264); F = 0.913; p = 0.4732
Table 3. Herbivore scat counts in vegetation communities of Tasmania, contrasted between areas that experienced fire in the past three years (‘Burned’) versus adjacent areas that did not (‘Unburned’). Significant differences (p-value < 0.05) between burned and unburned areas of the same vegetation community are highlighted in grey (e.g., the main effect of burning, blank indicates no scats).
BurnedUnburned
Dry ForestGrasslandHighlandSedgelandHeathWet ForestDry ForestGrasslandHighlandSedgelandHeathWet Forest
Macropod11.0 ± 2.20
(0–31)
20.9 ± 2.84
(0–37)
23.5 ± 3.49
(0–75)
8.42 ± 2.34
(0–46)
7.29 ± 1.46
(0–24)
0.54 ± 0.33
(0–7)
3.38 ± 1.09
(0–19)
18.9 ± 2.93
(0–37)
9.77 ± 1.56
(0–30)
2.12 ± 0.82
(0–12)
1.88 ± 0.55
(0–8)
0.17 ± 0.17
(0–4)
Wombat0.04 ± 0.04
(0–1)
1.50 ± 0.93
(0–11)
0.33 ± 0.25
(0–7)
0.04 ± 0.04
(0–1)
0.04 ± 0.04
(0–1)
0.25 ± 0.15
(0–3)
0.25 ± 0.18
(0–2)
1.00 ± 0.57
(0–15)
0.05 ± 0.30
(0–6)
0.08 ± 0.08
(0–2)
Deer1.38 ± 0.82
(0–15)
1.42 ± 0.97
(0–10)
5.17 ± 3.43
(0–101)
0.79 ± 0.35
(0–5)
0.83 ± 0.59
(0–12)
4.08 ± 2.77
(0–27)
2.47 ± 0.98
(0–26)
0.33 ± 0.33
(0–8)
Rabbit3.0 ± 2.39
(0–56)
1.9 ± 0.874
(0–26)
0.46 ± 0.27
(0–6)
1.33 ± 0.97
(0–23)
0.2 ± 0.14
(0–2)
0.04 ± 0.04
(0–1)
0.04 ± 0.04
(0–1)
Table 4. Ratio of scats in burned quadrats to those in unburned quadrats by vegetation type and herbivore taxa. Fodder cover (%) by vegetation type is also shown. * = herbivore not present.
Vegetation TypeMacropodWombatDeerRabbitFodder (%)
Dry eucalypt3.250.1650.001.6634.0
Grassland1.116.00*0.3595.0
Highland2.400.339.502.0930.0
Sedgeland3.950.0911.502.3922.0
Heath3.880.5033.25*4.5
Wet forest3.18***1.0
Publisher’s Note: MDPI stays neutral with regard to jurisdictional claims in published maps and institutional affiliations.

