Article

Fire Behaviour of Insulation Panels Commonly Used in High-Rise Buildings

1
School of Engineering, Design and Built Environment, Western Sydney University, Penrith, NSW 2751, Australia
2
Warringtonfire, Dandenong South, Melbourne, VIC 3175, Australia
*
Author to whom correspondence should be addressed.
Submission received: 24 May 2022 / Revised: 11 June 2022 / Accepted: 12 June 2022 / Published: 14 June 2022

Abstract

:
The energy efficiency of buildings drives the replacement of traditional construction materials with lightweight insulating materials. However, energy-efficient but combustible insulation might contribute to the building’s fire load. Therefore, it is necessary to analyse the reaction-to-fire properties of various insulating materials to provide a better understanding of designing a fire-safe structure. In this study, reaction-to-fire tests were carried out to assess the fire behaviour of lightweight polystyrene insulating panels commonly employed in high-rise buildings. The flammability characteristics of expanded polystyrene (EPS) and extruded polystyrene (XPS) were determined using a cone calorimeter under two distinct external irradiance regimes, 35 kW/m2 and 50 kW/m2, to approximate small to medium fire exposure situations. To investigate the effect of a fire-rated (FR) foil layer on a sandwich panel, three distinct test configurations were used: (i) sample without FR layer (standard sample), (ii) sample with FR layer (FR foil), and (iii) damaged layer (foil and vent) for EPS. Except for the smoke toxicity index (STI), the overall fire performance of EPS is superior to that of XPS. The findings of this study are useful in analysing fire performance and fire safety design for lightweight insulation panels.

1. Introduction

Flammable and combustible building insulation materials have arisen as a potential new fire hazard [1]. Research on the reaction-to-fire properties of these materials is necessary to evaluate these insulation materials in relation to their fire load. Furthermore, this study provides insight into the combustion properties of insulation materials, and may assist to avoid fires when used in buildings. Additionally, it could also provide important data for assessing the combustion characteristics of insulation systems. The present thermal equilibrium of our cities and suburbs is significantly impacted by rapid urbanisation, and there has been an increase in energy demand, with thermal comfort energy consumption in buildings accounting for more than 30% of total world energy use [2]. As a result, initiatives for energy conservation and CO2 emission reductions are essential to ensuring long-term, sustainable urban development. Improved building thermal insulation is one of the most important, and increasingly popular, solutions for energy savings and thermal balancing. As a result, commercial building insulation materials such as organic polystyrenes, including expanded polystyrene (EPS) and extruded polystyrene (XPS), are receiving greater attention for use in buildings [3]. These insulation materials gained increased attention as efficient insulating materials in the building sector because of their attractive qualities, such as lightweight, effective thermal insulation, strong chemical resistance, and lower cost [4].
Organic polystyrenes are most typically employed in prefabricated composite or sandwich panels, with flammable cores shielded by metal sheets or fire rated (FR) coatings [5]. However, without any fire protection layers or during the failure of the protection layer, these polystyrene foams can be extremely flammable. When organic polystyrenes-based insulation materials ignite, they melt and produce flame drips, and then the flames can quickly spread and become challenging to extinguish [6,7]. Over recent decades, several fire events were reported regarding flammable external walls associated with sandwich structures used in the building facades [1,8]. For example, the Television Culture Center, China, which was wrapped in lightweight polystyrene extruded (XPS) cladding, caught fire at night in 2009, and the fire was spread by polyurethane insulation. In 2017, rapid-fire spread in Grenfell Tower, London, due to flammable insulation materials, resulted in major loss of life [1,9]. The reaction to fire propagation of these insulation materials should be thoroughly understood, and appropriate fire safety precautions should be developed. The essential reaction-to-fire properties of building materials that should be addressed are heat release rate (HRR), total heat release (THR), effective heat of combustion (EHC), and smoke production. These characteristics are critical in determining the performance of insulation materials in building fire safety.
Some studies use small-scale and full-scale test methodologies to evaluate the fire performance of EPS and XPS insulations [10,11,12,13]. The full-scale tests are costly, and few academics or code authorities have access to them. As a result, testing on a small scale, such as using a cone calorimeter, is considerably more accessible and innovative [14]. However, all effective characteristics of these materials must be identified and measured; otherwise, inappropriate interpretations may result [15]. Previous studies usually focused on the effect of thickness, density, and fire barriers on the performance of these materials in fire, but not on the protective layers themselves and their failure in the fire performance, as described in real fire scenarios [10,11,12,13,16]. In addition, the current cone calorimeter test standards only allow for the testing of single-layer materials, and there is a dearth of literature on the testing of multilayer composites [17]. Cone calorimetry might be useful to model specific fire situations and predict certain characteristics in small-scale, large-scale, and real-world fire behaviour [18]. The findings of cone calorimetry investigations may, therefore, be used to simulate real-life fire behaviour and other fire testing regimes [14,18].
To address the above research gaps, the present study utilised a bench-scale cone calorimeter to analyse the performance of EPS and XPS, and extract data on the reaction-to-fire properties for better assessment and design of fire-safe buildings. Further, this study also considered three different EPS insulation panel configurations: (a) insulation panel without FR foil or protective layers; (b) insulation panel with FR foil; and (c) the effect of damage on insulation panel faces (foil and vent).

2. Material and Methods

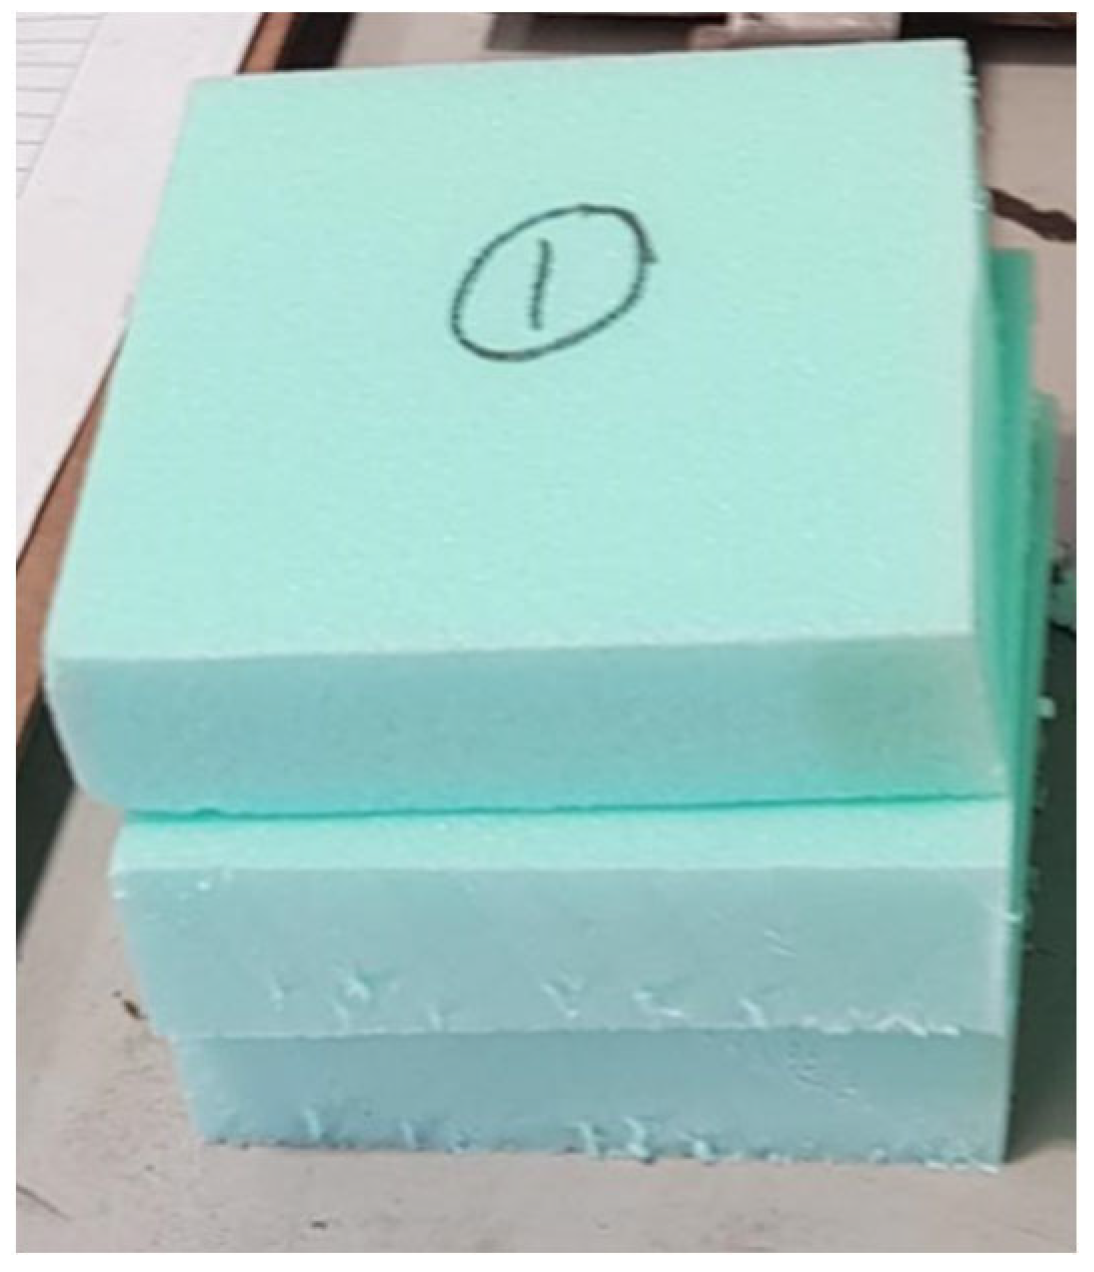
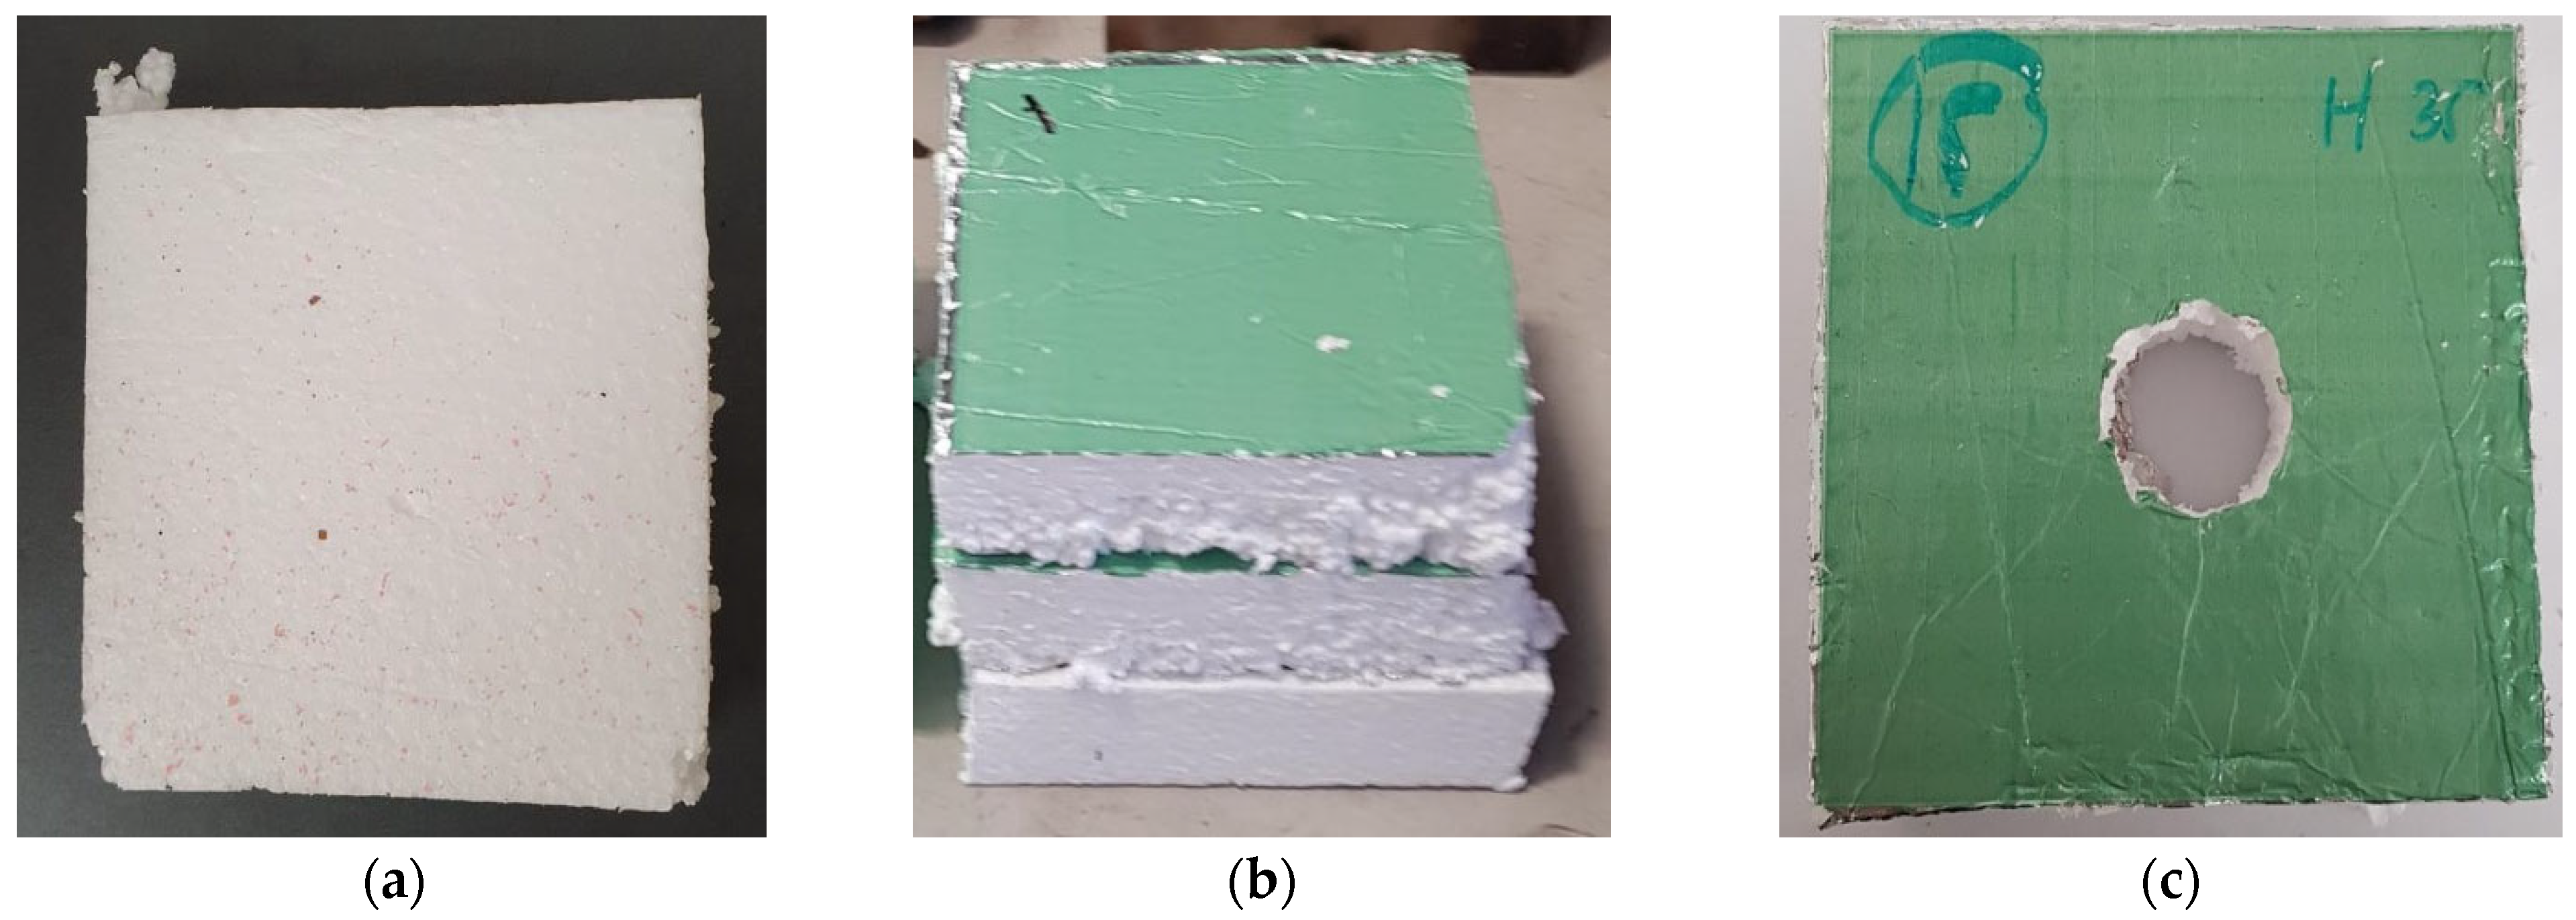
2.1. Materials and Test Specimens

The current study used commercially available polystyrene-based building insulation materials (XPS and EPS) to investigate their fire performance. It is worth noting that commercially available EPS foam insulation materials are laminated by a 0.3 mm thick layer of FR aluminium on both sides. According to supplier specifications, none of the materials has any fire-retardant treatment. The total thickness of XPS and EPS specimens is 30 mm. The density of XPS and EPS is measured as 28 and 18 kg/m3, respectively, as well as other properties, which are summarised in Table 1. A total of 20 samples were tested for XPS and EPS insulation panels. The main parameters investigated in this study were (i) insulation material types (XPS and EPS), (ii) heat flux exposures (35 kW/m2 and 50 kW/m2), (iii) sample configurations (with or without aluminium foil layer and vent), and (iv) sample test orientation (horizontal and vertical). For XPS, four samples were tested by changing the heat flux to simulate the impact of low (35 kW/m2) to medium (50 kW/m2) fire load. For EPS, 16 samples were tested by changing heat flux (35 kW/m2 and 50 kW/m2) and three distinct test configurations, such as (i) sample without FR layer (standard sample), (ii) sample with FR layer (FR foil), and (iii) damaged layer (foil and vent). The rationale for these distinct test configurations was to identify the influence of the protective sandwich layers in the testing procedure and test results. The inclusion of a vent in some samples represented the accidental damage of the insulation panels during installation or daily end-use, and their potential effects during fire events. The XPS and EPS specimen samples are shown in Figure 1 and Figure 2. All the samples were cut to a size of 100 mm × 100 mm × 30 mm. The details of XPS and EPS sample specimens and test protocols can be found in Table 2.

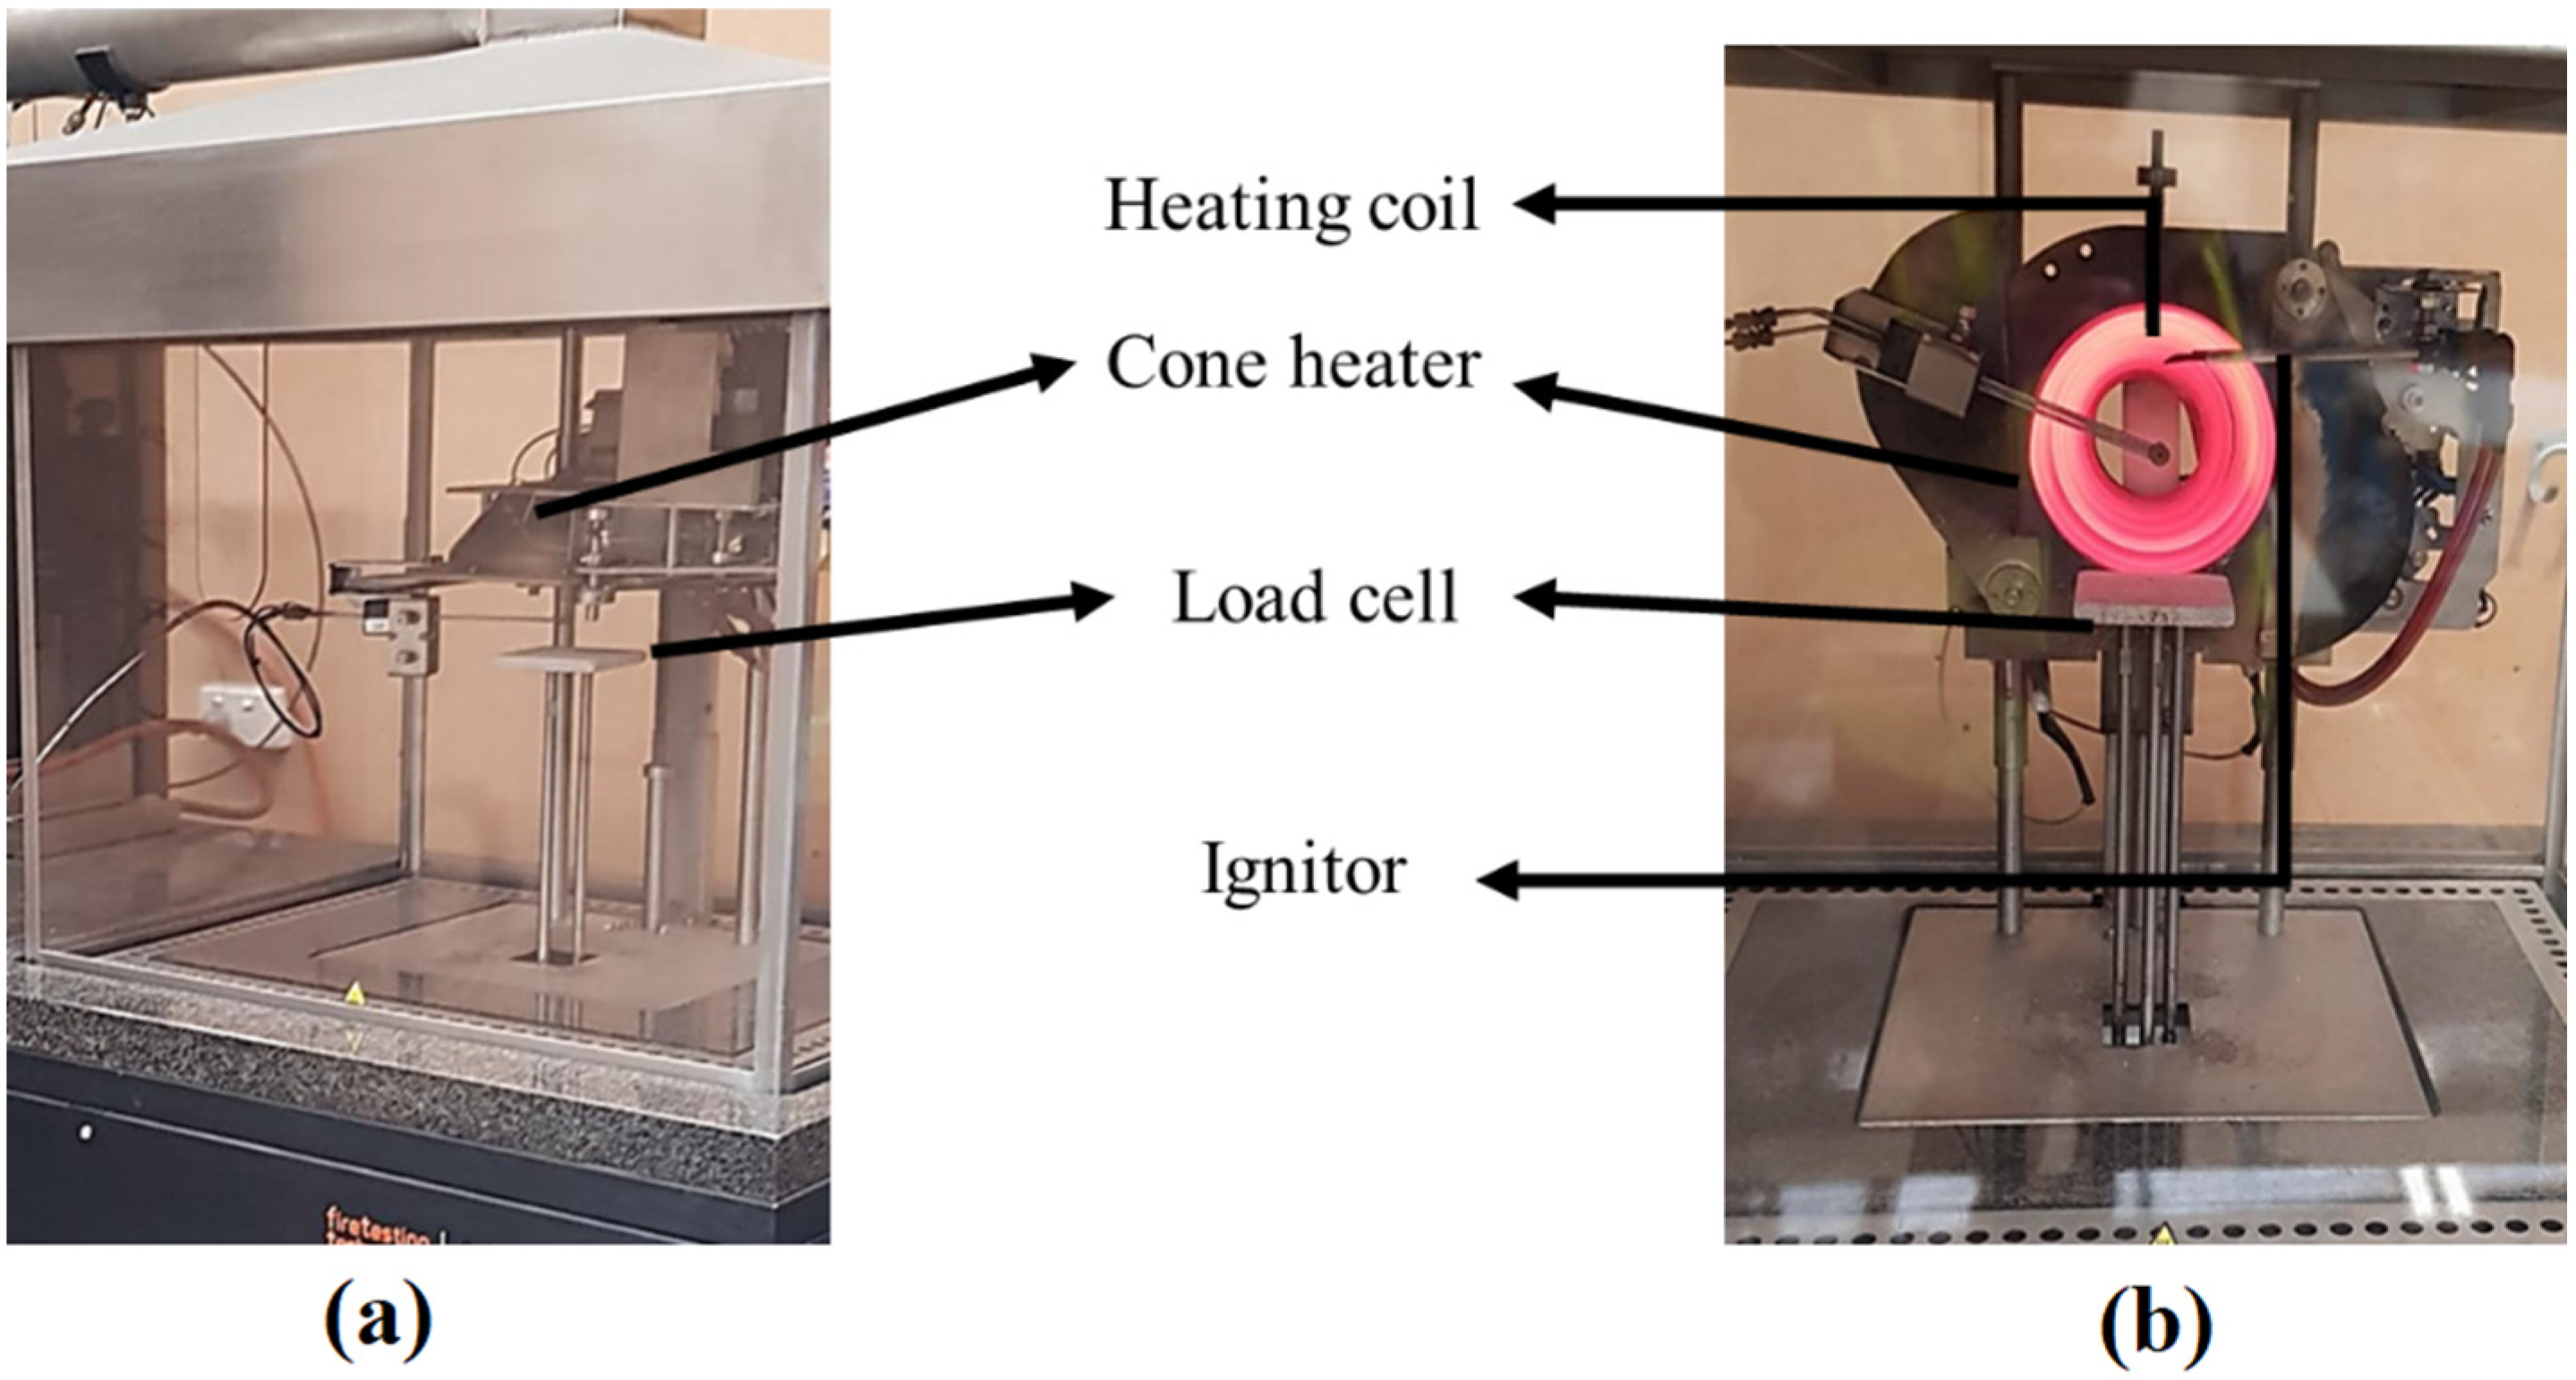
2.2. Test Procedure Using Cone Calorimeter

A cone calorimeter was used to analyse the flammability properties of the test samples. All tests were carried out using the ISO 5660-1 standard for cone calorimetry (supplied by Fire testing technology Ltd., East Grinstead, UK). All specimens were evaluated with two typical exposure heat fluxes of 35 and 50 kW/m2, typically used by various fire risk rating and modelling applications [13,19,20]. XPS and EPS are both commonly used for insulation in ceilings and walls of buildings. Samples were mounted horizontally and vertically to analyse the orientation effects during a fire, as shown in Figure 3. The samples were mounted on an aluminium foil with the glossy side facing the specimen and the corner folded (aluminium boot or tray). The prepared samples were then put on a ceramic fibre backing pad and were ready for analysis. The distance between the cone heater and the sample was 25 mm. A spark igniter was located 13 mm above the centre of the specimen. For repeatability, samples were tested two times for each sample configuration, and average values were used for calculation [21].

3. Results and Discussion

The products of combustion and the rapid ignition of building materials are two of the most prevalent causes of serious casualties in fire accidents. The heat release rate (HRR), or heat release rate per unit area (HRRPUA), is a key measure in determining the fire risk and associated fire hazards, such as fire spread rate and structural collapse of insulating materials. The comparative fire performance of the EPS and XPS samples is discussed in Section 3.1. The influence of heat flux, test orientation, and different configurations of EPS materials under the fire scenario is discussed in Section 3.2.

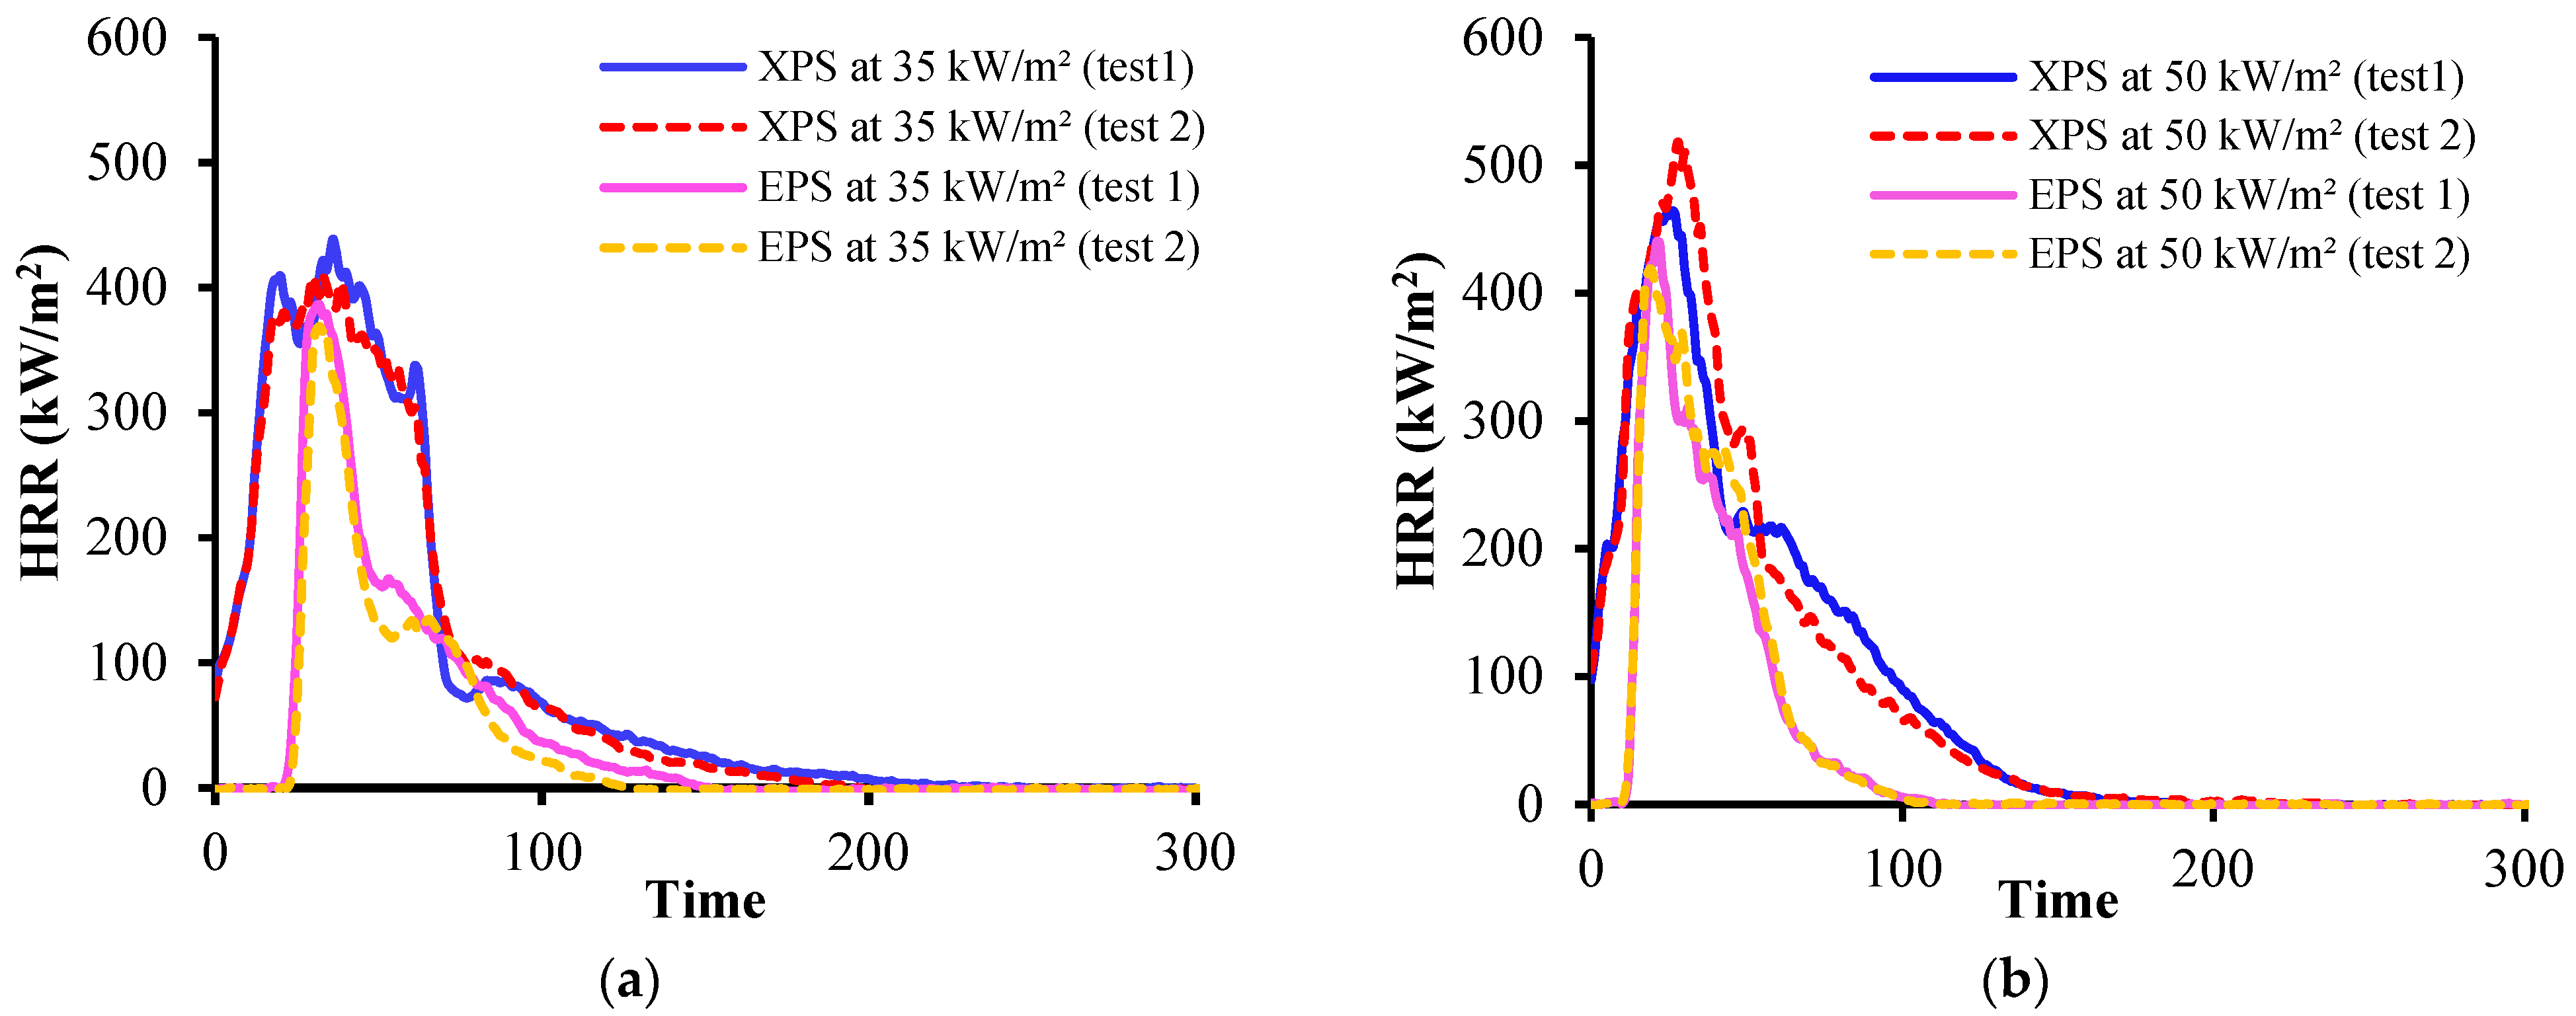
3.1. Fire Performance of EPS and XPS

The fire performance of XPS and EPS is evaluated based on three typical factors: reaction-to-fire properties, fire hazard, and smoke hazard. The measured reaction-to-fire properties, fire hazard, and smoke hazard of XPS and EPS are listed with averaged calculated values in Table 3. The details of these factors are discussed in the below sub-sections.

3.1.1. Reaction-to-Fire Properties

The “reaction to fire” can be defined as a “response of product contributed by its own decomposition to a fire which is exposed under specified conditions…” [22]. As discussed previously, the essential reaction-to-fire properties of a material are heat release rate (HRR), total heat release (THR), effective heat of combustion (EHC), smoke production, and average specific extinction area. Fire hazard increases with increased HRR [9]. Based on the principle of oxygen calorimetry, the peak heat release rate per unit area (pHRRPUA) ( Q ˙ p ) can be calculated using the heat of oxidation [23]. These characteristics are critical in determining the fire performance of materials for the fire safety design of buildings. The value of pHRRPUA ( Q ˙ p ) is determined using Equation (1).
Q ˙ p = ( 0.21 X O 2 , m i n ) V a ρ O 2 Δ H O x A
where V a is the volumetric flow rate of air (m3·s−1),   ρ O 2 is the density of oxygen (kg·m−3),   X O 2 , m i n is the minimum mole fraction of oxygen during combustion,   Δ H O x is the heat of combustion of oxygen, commonly 13.1 MJ/kg, and A is the cross-section area of the sample. It can be seen from Table 3 that the ignition time of XPS at 35 and 50 kW/m2 is 5 s and 3 s, respectively. On the other hand, EPS shows comparatively higher ignition times of 29 s and 17 s at 35 kW/m2 and 50 kW/m2, respectively. The lower ignition time demonstrates the ignition risk of XPS is higher than the EPS.
The igniting characteristics of materials are influenced by density and heat conductivity. Both XPS and EPS melt during external heat exposure, and the densities convert almost identically. However, XPS ignites faster than EPS, due to its lower thermal conductivity [24]. The ignition time of EPS is approximately six times higher than that of XPS. Ignition time shows a negative correlation with the external heat flux in the present experiment. The time to pHRR shows greater sensitivity on the external heat flux of 50 kW/m2 than for 35 kW/m2 for both XPS and EPS. The time to pHRR for an external heat flux of 50 kW/m2 for XPS is 28s, whereas for EPS it is 20 s. Table 3 shows that the total burning time and the pHRR are both comparatively higher for XPS when compared to EPS. It is observed that, at the early stage of XPS combustion, the residue adheres to the surface of the unburned sample, restricting heat and mass transfer. The HRR of XPS decreases over time as the residue gradually breaks down; a second peak with a higher value than the pHRR of EPS generated, as shown in Figure 4a,b. The same trends are also found for EHC, average HRR, and specific mass-loss rate, as shown in Figure 5a,b, as well as THR, as shown in Table 3.

3.1.2. Fire Hazard Assessment

To assess the fire hazard of EPS and XPS, some common performance properties are obtained from the cone calorimeter test, such as fire growth rate (FIGRA), fire performance index (FPI), and the maximum average rate of heat emission (MARHE). FIGRA is derived by calculating the pHRR by the time-to-peak heat release rate (tpHRR) using Equation (2). A low FIGRA rating indicates superior flame resistance in fire performance studies [25,26].
FIGRA = pHRR t pHRR
The FIGRA value is directly correlated with pHRR, and inversely related to the time-to-peak heat release rate, as shown in Equation (2). According to the FIGRA value reported in Table 3, the fire risk rating of the samples can be ranked as XPS > EPS.
FPI is also calculated by time to ignition ( t ign ) and peak heat release rate (pHRR) from Equation (3). A higher FPI value denotes better flame resistance [25,26].
FPI = t ign pHRR
It is observed from test data reported in Table 3 that the EPS samples show a higher FPI value than the XPS samples. This is due to the less time to ignition value and higher pHRR of the XPS sample. According to Table 3, the fire risk of the samples can be ordered XPS>EPS. It means that the fire risk of XPS is higher compared to EPS.
MARHE is used to determine the average heat generated during each combustion period in which the HRR value is measured according to Equation (4). This parameter is defined as a maximum value of the cumulative heat release over time (highest average rate of heat release). It can be regarded as an excellent indicator of fire development in controlled circumstances [27].
MARHE = max | n t n + 1 q ˙ ¯ ( t ) d t t n + 1 t n |
where q ˙ ¯   ( t ) is the mean heat release rate at time, t.
The trends of MARHE ranking seem similar to FIGRA ranking, as shown in Table 3. The FIGRA value is more than two times higher for XPS at 35 kW/m2. The maximum MARHE value for XPS and EPS is 321.81 and 137.51 kW/m2, respectively.

3.1.3. Smoke Hazard

In assessing the potential smoke production under well-ventilated fire conditions of burning materials, total smoke production (TSP) and specific extinction area are two commonly measured parameters using a cone calorimeter. The specific extinction area (SEA) measures the quantity of smoke generated per unit mass of burned material at any given time. Throughout the test period, SEA varies as a function of time. As the peak values of SEA are sensitive to the rapid changes in specimen mass loss, the longer time-averaged value is more representative of assessing a material’s overall smoking tendency and, hence, fire performance. The present study uses an averaged value of SEA for smoke hazard analysis. The lower the average value of SEA, depending on fire development and smoke generation rates, the time required to escape during the fire is expected to be higher, and the better the performance of the materials.
In addition, the generation of smoke from polymers plays a crucial role during fire hazards by causing respiratory discomfort, sensory discomfort, and obscuring escape routes from the building [28]. Common asphyxiant gases are carbon monoxide (CO), carbon dioxide (CO2), and hydrogen cyanide (HCN). CO is a major toxin in fire science, resulting from almost all hydrocarbon combustion processes. Around two-thirds of all structural fire-related fatalities result from carbon monoxide poisoning [28]. CO inhibits oxygen transfer in the blood by forming carboxyhaemoglobin (COHb). This can cause death when COHb exceeds 34%. On the other hand, the presence of CO2 in the body can increase the rate of respiration by stimulating hyperventilation. Depletion of oxygen limits oxygen supplies in the body (hypoxia), resulting in lethal impact at concentrations below 14% [28]. The smoke toxicity index (STI) can be calculated from the ratio of CO and CO2 gas yield (see Equation (5)). Smoke production has an inverse correlation with the amount of oxygen present in the combustion reaction [29]. Smoke production per unit area ( R ˙ s ) can be expressed by Equation (6) [30].
STI = CO CO 2
R ˙ s = Y s × m ˙
where m ˙ is the mass loss rate and Y s (g/g) is the smoke yield.
From Table 3, the TSP and SEA values of XPS are double compared to EPS for both external heat flux levels. The peak value of smoke production rate (SPR) is observed below 0.2 m2/s at the heat flux of 35 kW/m2 for both materials (Figure 6a), but shows a value of 0.21 m2/s for XPS at the heat flux of 50 kW/m2, compared to a value of 0.18 m2/s for EPS with the same heat flux of 50 kW/m2 (Figure 6b). As the residue adheres to the surface of the unburned sample during the early stages of XPS combustion, it provides a slow heat and mass transfer. As a result of the process inhibiting the subsequent combustion process, more smoke is produced. However, when comparing EPS to XPS for STI, a value of nearly 10–20% higher is found.

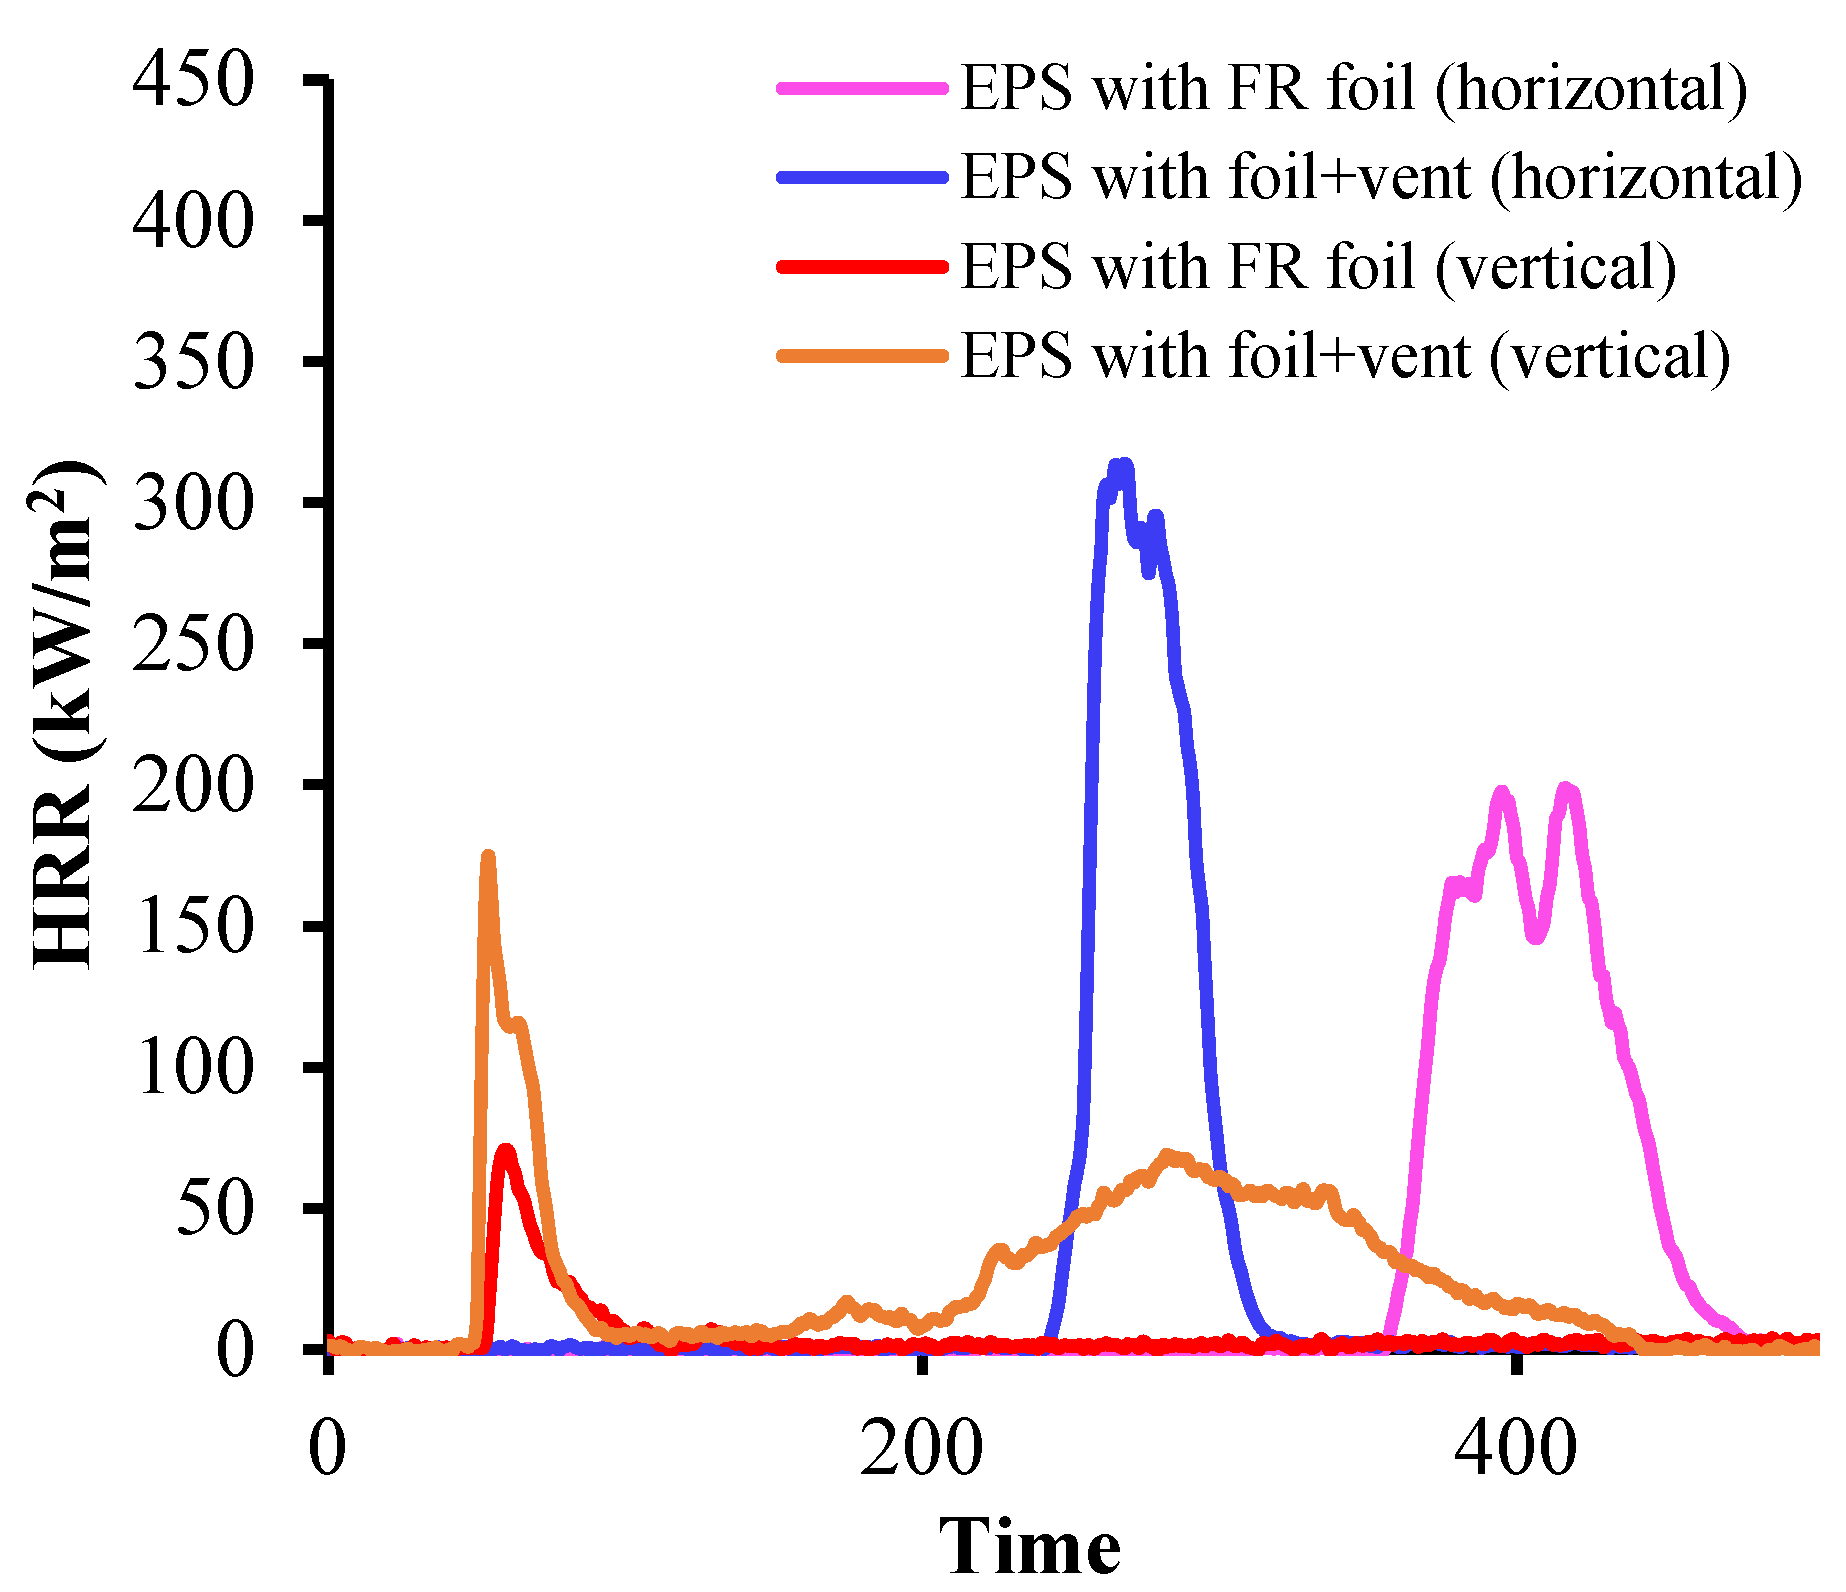
3.2. Influencing Fire Testing Parameters of EPS

3.2.1. Effect of Sample Configuration and Heat Flux

The current study assumes three different fire exposure scenarios for the test specimen (Figure 7): (a) direct fire exposure on combustible core materials, (b) fire exposure of sandwich panel with FR outer layer, and (c) damaged or espoused components of sandwich panel. The outer layer of the sandwich panel could separate during an actual fire, exposing the core materials to the flames [31]. In some cases, the sandwich panels with combustible cores can be exposed to fire while being protected by the outside FR layers. The panel can also be damaged as a result of everyday use, such as installation damage of some exposed areas, such as plumbing pipe connections [5]. These exposed areas or weak channels might act as a vent for fire propagation [32]. As a result, three different test configurations are used in this study such as (i) standard, (ii) with FR foil, and (iii) foil and vent.
The standard samples have a pHRR value of 377 kW/m2 at 32 s, with an external heat flux of 35 kW/m2, as shown in Figure 8a. However, no heat release rate is detected in the other two configurations (FR foil, and foil and vent). In the instance of 50 kW/m2, however, the pHRR values for the standard, FR foil, and foil and vent samples are 442 kW/m2, 313 kW/m2, and 198 kW/m2, respectively (see Figure 8b). The heat release rate depends on the successive ignition process. On the other hand, sustaining combustion flame in the materials is required for further successive ignition. A mass-loss rate of 0.4–0.6 g/s is required to generate a sustaining combustion flame [33]. In the case of 35 kW/m2 heat flux, the value of mass-loss rate, as shown in Figure 9a, is below this critical value. As a result, no visible ignition process is observed for the foil or foil and vent samples exposed with the heat flux of 35 kW/m2. The HRR is found to be nearly zero for the FR foil and foil and vent samples. However, with an external heat flux of 50 kW/m2, the mass-loss rate for all samples is higher than this critical value (Figure 9b). Hence, subsequent HRR values are preserved. The time to reach the pHRR changes dramatically due to the different sample configurations. The time to pHRR for the standard sample is 20 s, whereas it is 393 s and 264 s for the foil and foil and vent samples, respectively. It implies that sample configuration and external heat flux considerably impact test results.
For the standard sample configuration, when the cone heater is used to heat the foam at a heat flux of 50 kW/m2, the EPS cell shrinks into a smaller ball, loses its original spherical shape, melts, and dense pyrolysis gases are involved. Molten EPS ignites at 17 s, and after testing, no mass residue is observed (Figure 10a). Other than the ‘with FR foil’ sample, the structure starts to collapse within 3 s after heat exposure. However, the FR foil layer hinders the generation of pyrolysis gases necessary to ignite the foam, taking approximately 6 min to ignite the test sample. After completing the test, some unburnt mass residue is observed for the EPS FR foil sample within the foil layer, indicating the limiting combustion rate compared to standard samples (Figure 10b).

3.2.2. Effect of Test Orientation

The influence of test orientation, such as horizontal and vertical, is investigated using a heat flux of 50 kW/m2 (Figure 11). Due to the sample structure collapsing during testing, and the unburnt fuel pool at the sample holder during testing, there is a distinction between the vertical and horizontal test findings. Ignition occurs faster in the vertical test orientation than in the horizontal test orientation. This was found to be around 50 s for both the FR foil and foil and vent configurations. Due to melting and dripping behaviour, the vertical orientation test for the standard sample arrangement was avoided in this study. In comparison to vertical sample orientation, the pHRR value for the horizontal samples is consistently greater for EPS samples (see Table 4). For the EPS FR foil and the foil and vent horizontal samples, the pHRR values are 199 and 311 kW/m2, respectively. In the vertical test samples with collapse, pyrolysis gas evolves significantly faster. As a consequence, these materials ignite much faster than the horizontal samples. However, during the vertical test, an unburned fuel pool is observed in the bottom of the sample holder after the examination, which is not present in the horizontal testing. This phenomenon indicates that the entire fuel present in the sample burns more successively in horizontal orientation compared to vertical orientation. As a result, the horizontal samples show a higher HRR than the vertical sample.

4. Conclusions

This study investigated the performance of lightweight polystyrene insulating panel (XPS and EPS) samples to fire exposure by employing a bench-scale cone calorimeter. Specimens were tested under two different heat flux regimes, representing small to medium fire scenarios. The ‘reaction to fire properties’, fire hazard, and smoke hazard were analysed and compared. The effect of test sample configuration and orientation was examined for the FR EPS samples. The following conclusions can be drawn based on the scope of this research:
(i)
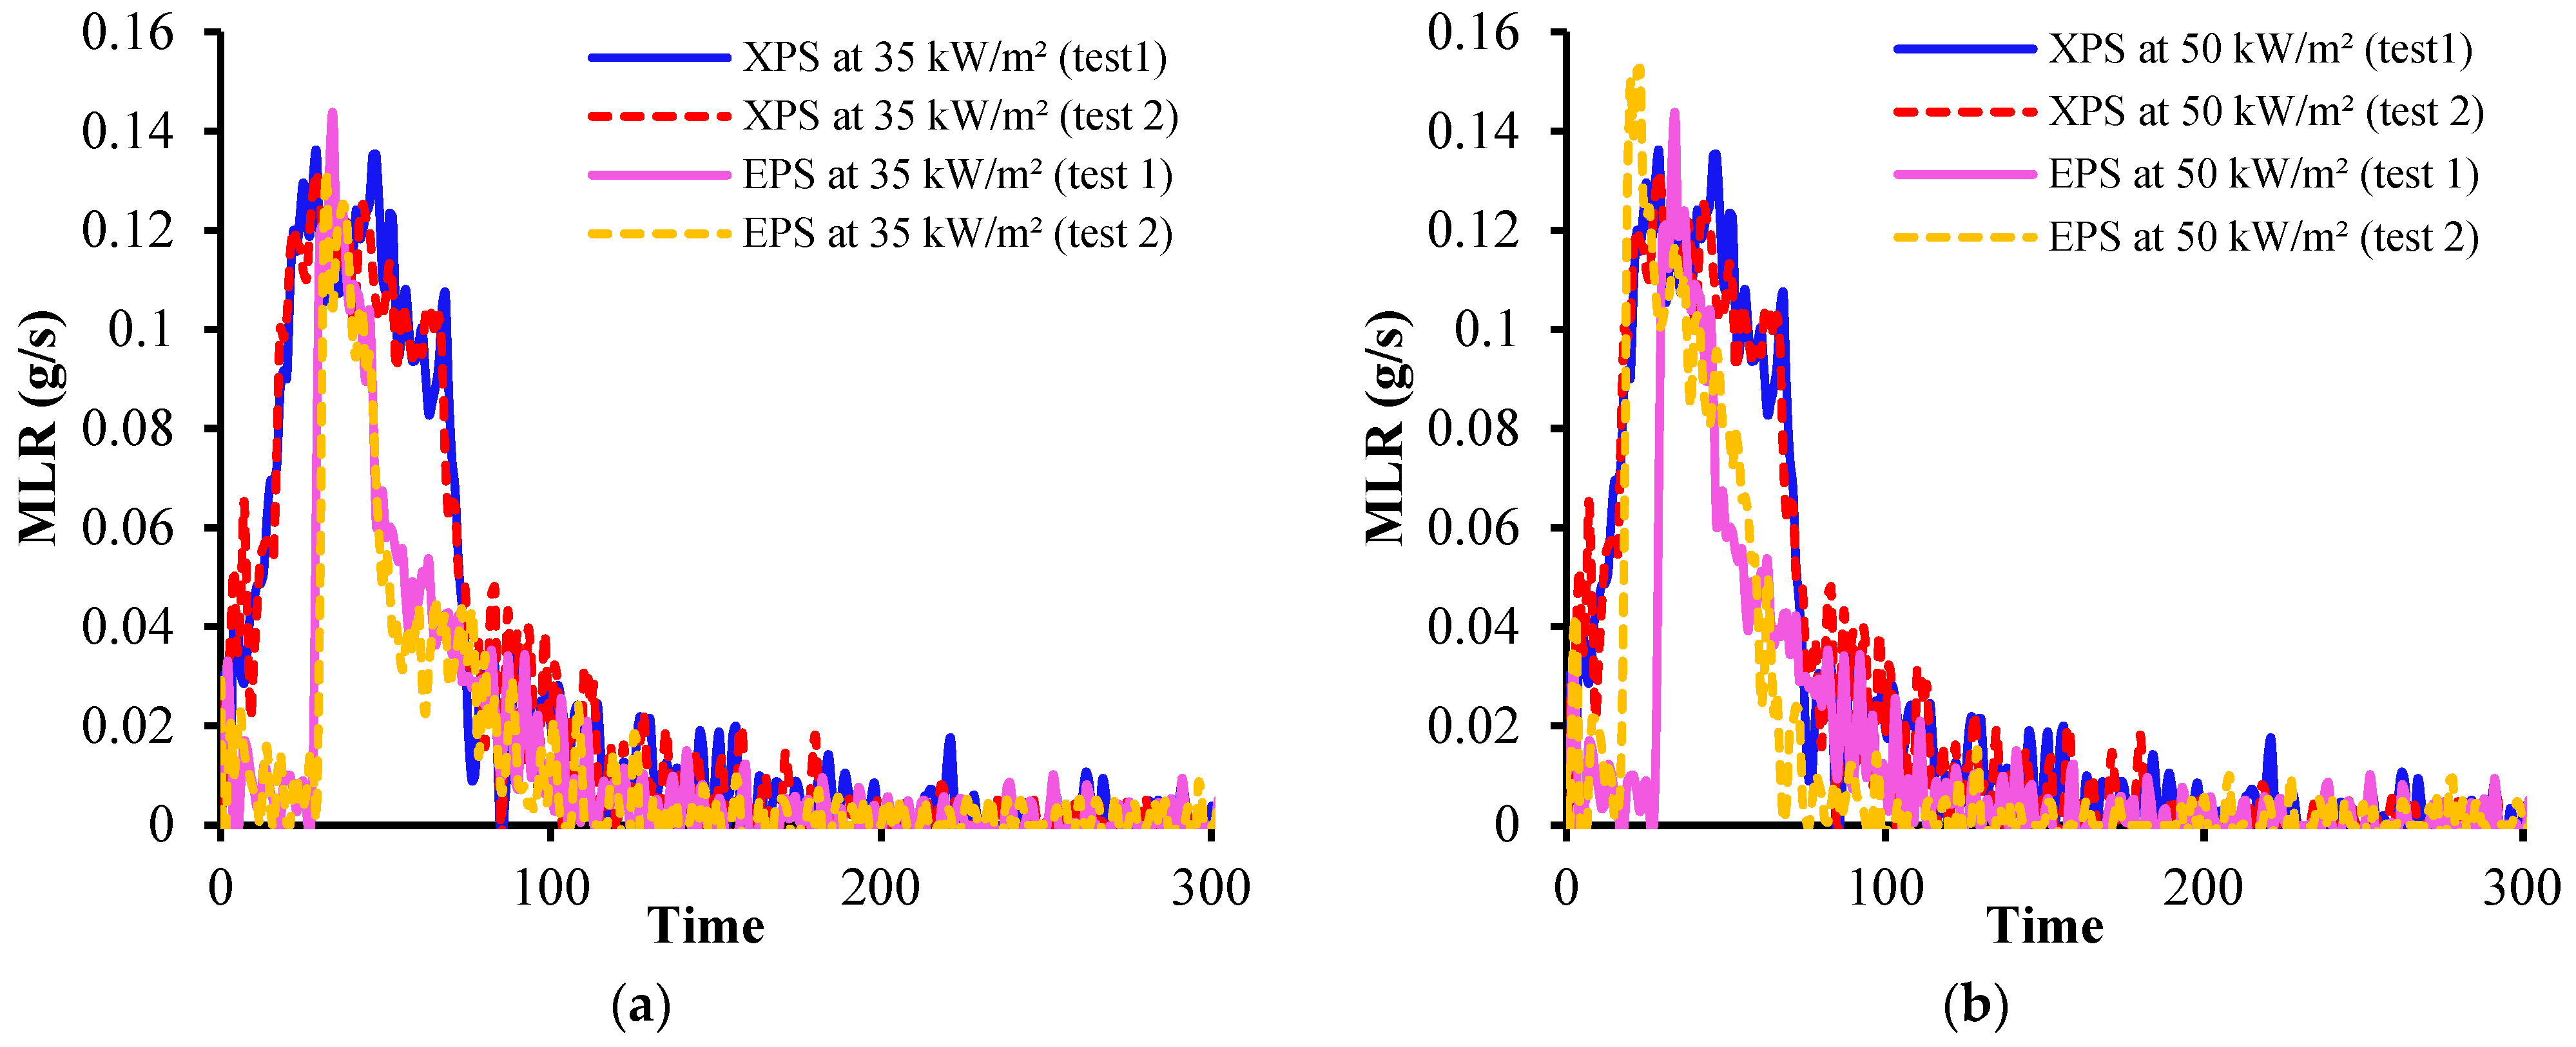
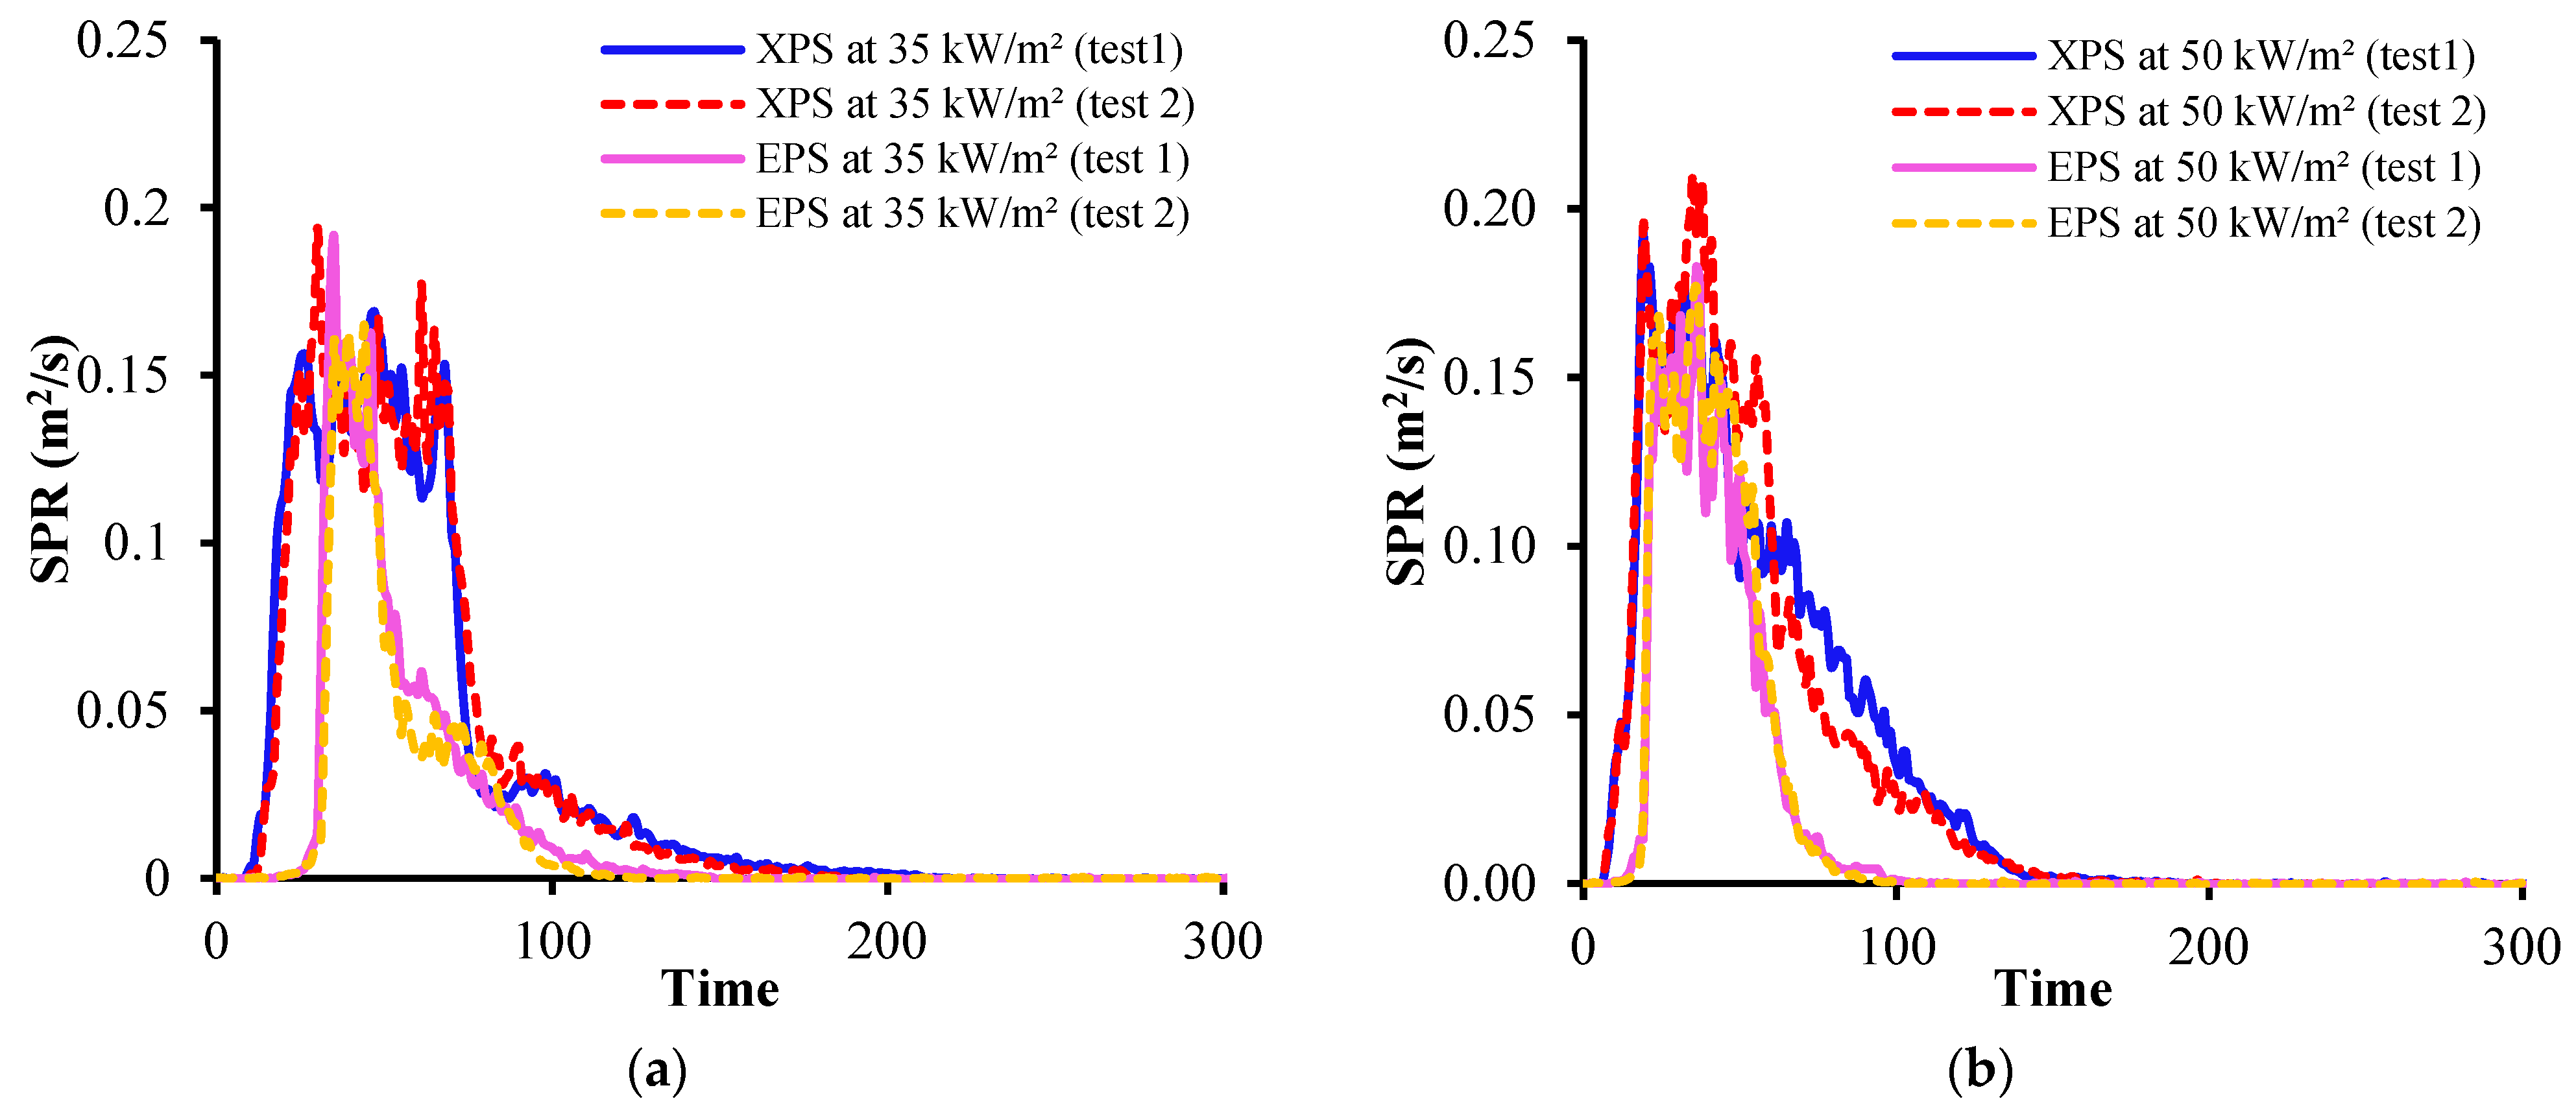
EPS takes six times as long to ignite (TTI) than XPS. In the current experiment, ignition time is shown to have a negative relationship with external heat flow. The time to pHRR for XPS and EPS samples is more sensitive for the heat flux of 35 kW/m2 than that of 50 kW/m2. In comparison to EPS, however, XPS has a longer overall burning duration and a greater pHRR, but the same patterns are observed for EHC, average HRR, specific mass-loss rate, and THR;
(ii)
The EPS samples show a higher FPI value than the XPS samples. According to the FIGRA value, the fire risk of XPS samples is higher compared to the EPS samples. The trends of MARHE ranking seem similar to FIGRA ranking. The FIGRA value is more than two times higher for XPS at 35 kW/m2. The values for XPS and EPS are 321.81 and 137.51 kW/m2, respectively. The analyses indicate that the fire hazard for XPS could be higher than for EPS;
(iii)
TSP and SEA values of EPS samples are two times higher compared to XPS samples for both test heat fluxes. However, in the case of smoke hazards, the STI index of EPS is 10 to 20% higher compared to XPS;
(iv)
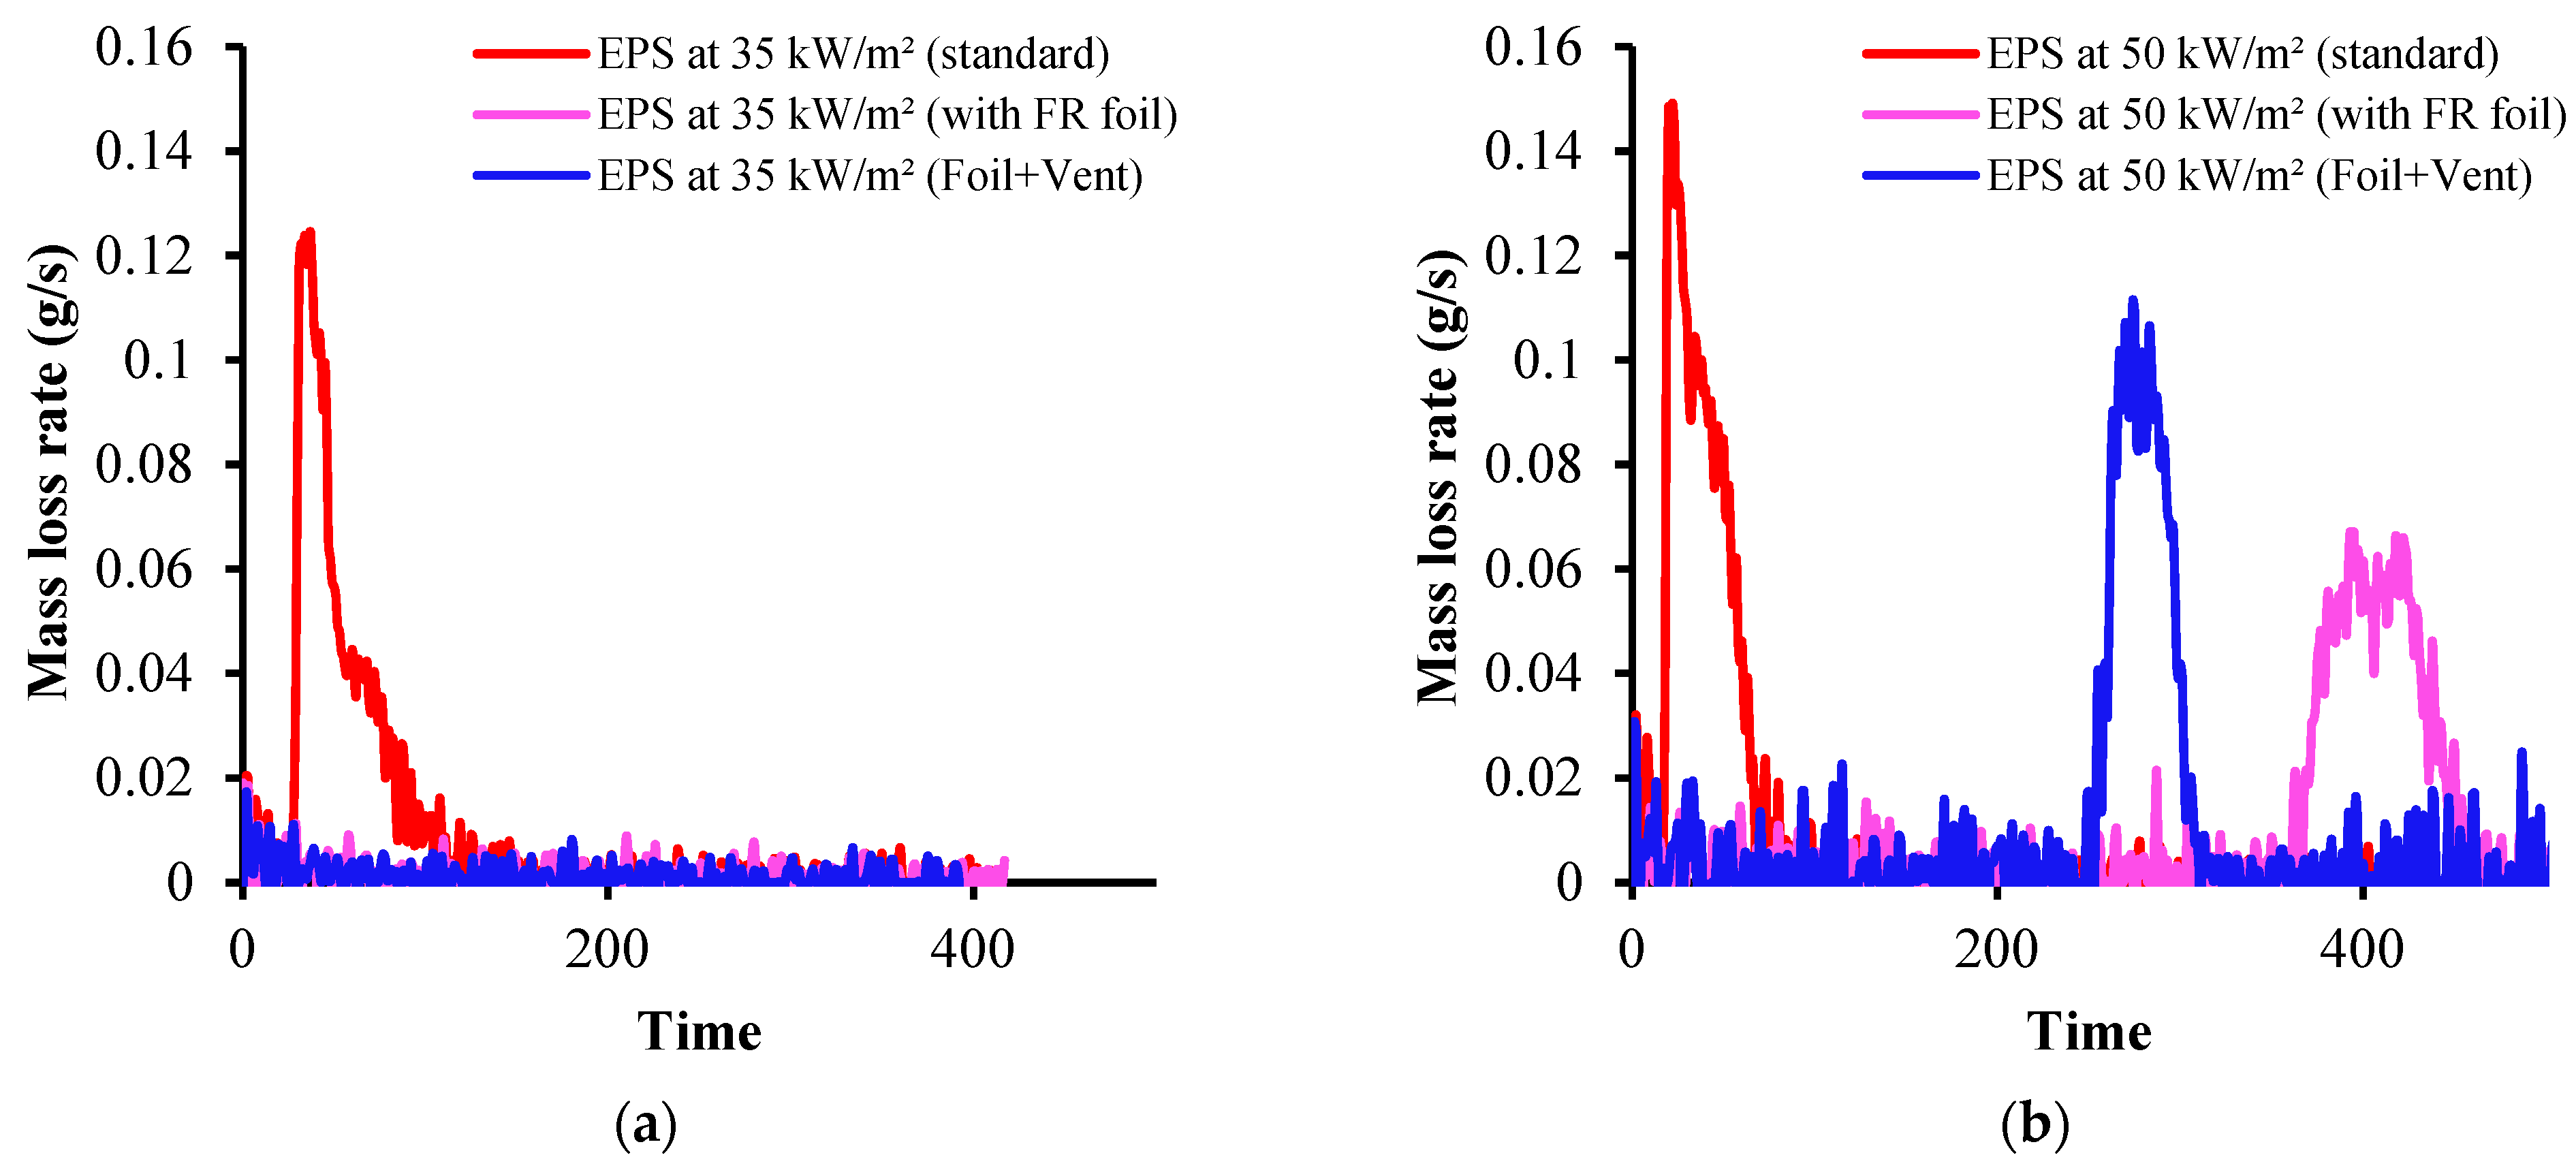
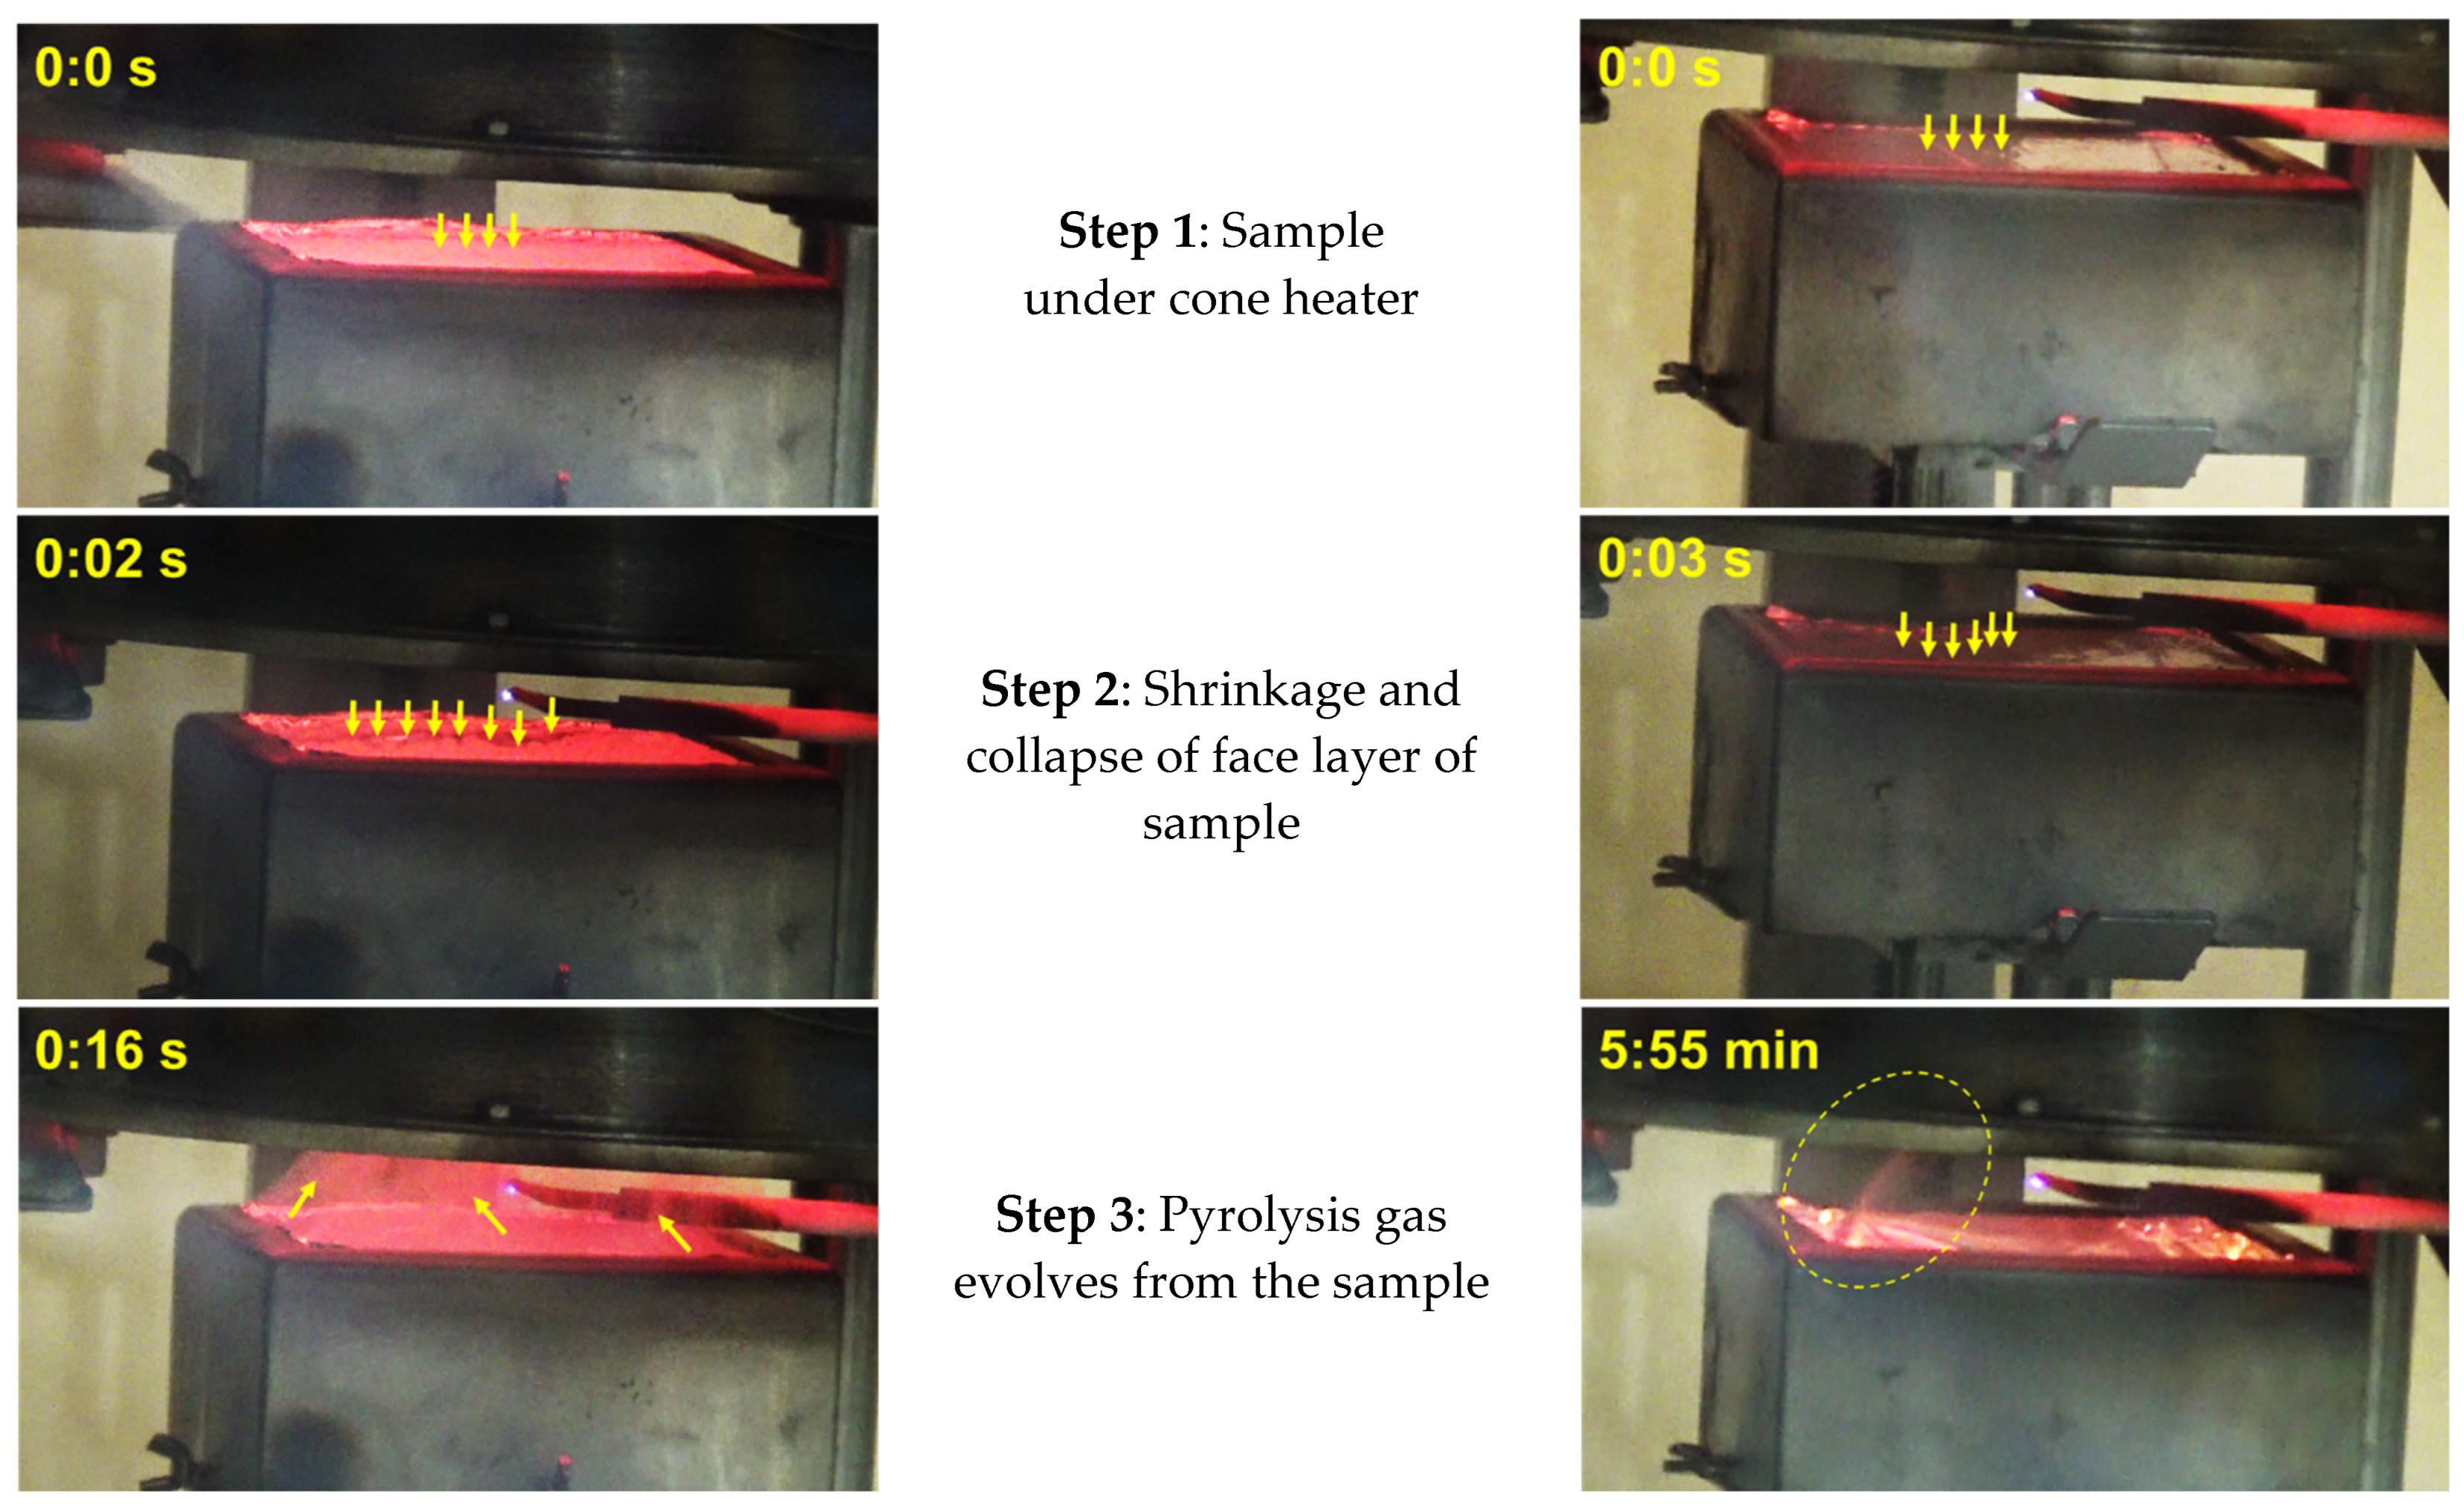
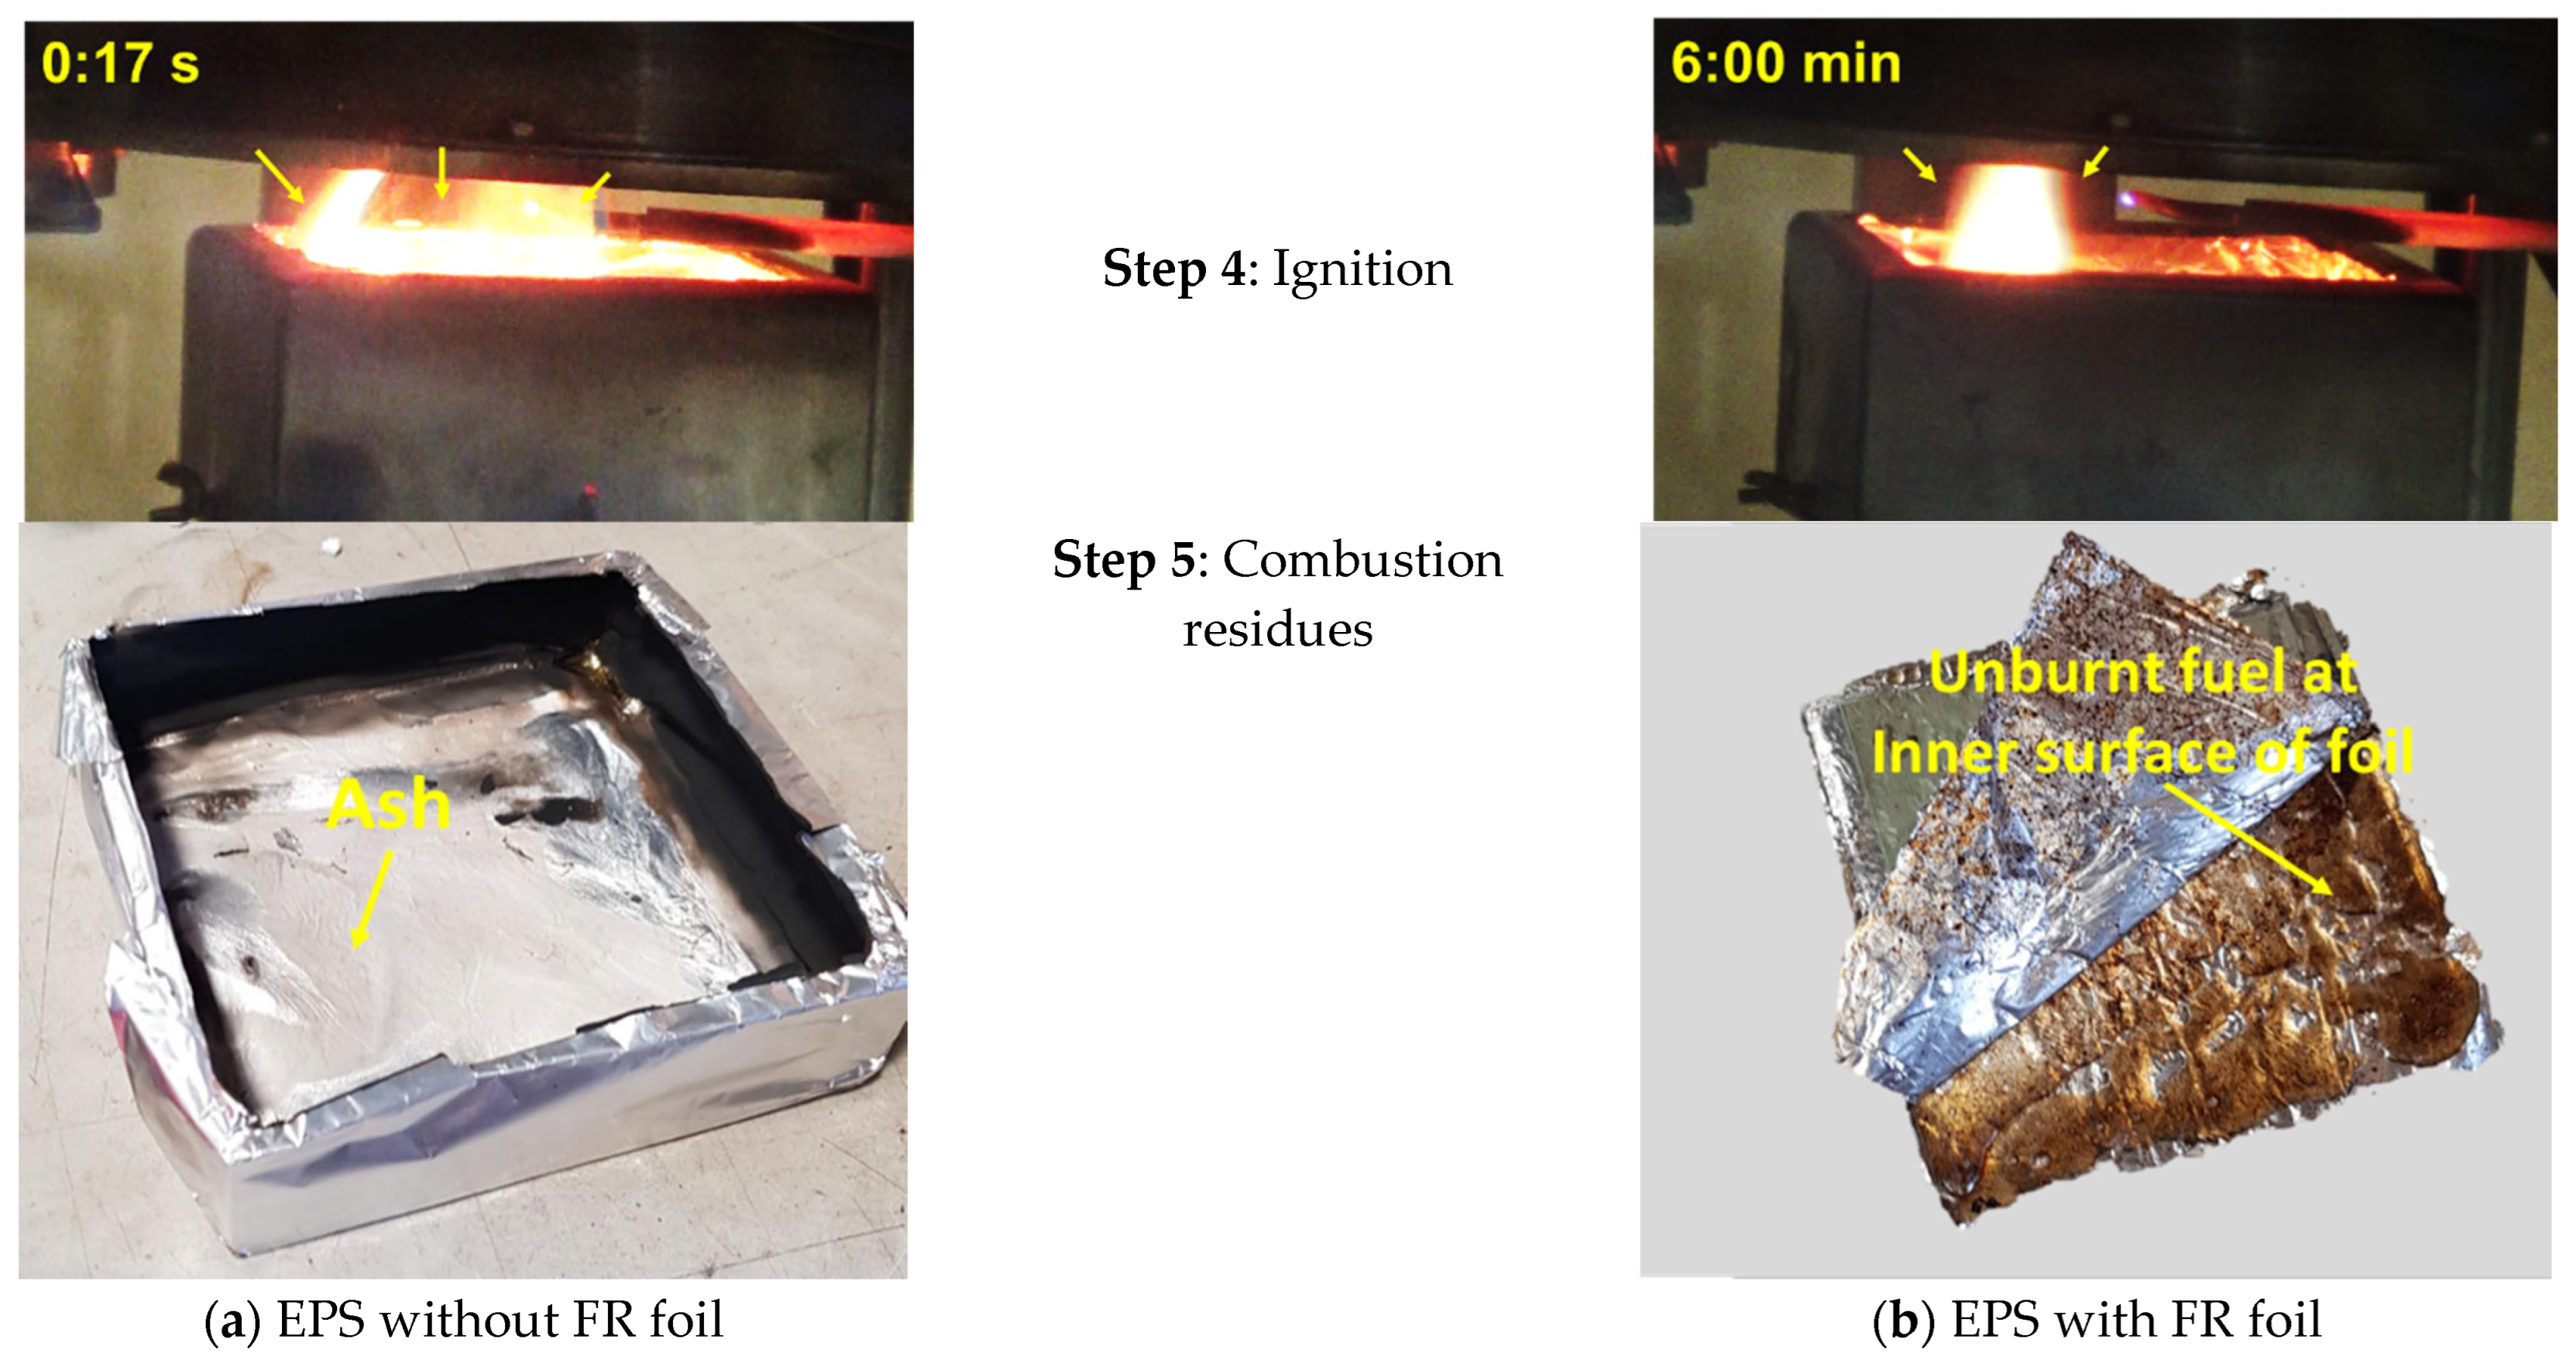
For the sample panels with an FR foil layer, it is observed that a 35 kW/m2 irradiance heat flux is ineffectual in generating the subsequent combustion process. However, at 50 kW/m2, a successive combustion process is observed;
(v)
Although the FR foil layer performs better in small to medium fires, the fire can spread more quickly if the foil collapses and exposes the combustible core. Even a damaged section of a panel might operate as a fire carrier, allowing the fire to spread quickly. During testing, the foil collapse is more visible in the vertical orientation. As a consequence, shorter ignition times are noticed for the specimens.

Author Contributions

Conceptualization, M.K.H. and M.D.H.; methodology, M.K.H. and M.D.H.; formal analysis, M.A. and M.D.H.; experimentation, M.A.; resources, M.K.H.; data curation, M.D.H. and M.A.; writing—original draft preparation, M.D.H. and M.K.H.; writing—review and editing, M.A., S.P., P.R., G.D., T.B. and S.S.; supervision, M.K.H. and S.S.; project administration, S.S.; funding acquisition, S.S. All authors have read and agreed to the published version of the manuscript.

Funding

This work is funded by the Australian Research Council (ARC) Industrial Transformation Training Centre (IC170100032) and Western Sydney University (P00024103). The second author is also grateful for the financial support from the Australian Research Council Grant (No. IH150100006).

Institutional Review Board Statement

Not applicable.

Informed Consent Statement

Not applicable.

Data Availability Statement

Not applicable.

Acknowledgments

The authors would like to acknowledge the support provided by the fire testing lab of Warringtonfire to perform all tests. The authors sincerely appreciate all financial and technical support.

Conflicts of Interest

The authors declare no conflict of interest.

References

  1. Hossain, M.D.; Hassan, M.K.; Yuen, A.C.Y.; He, Y.; Saha, S.; Hittini, W. Flame behaviour, fire hazard and fire testing approach for lightweight composite claddings—A review. J. Struct. Fire Eng. 2021, 12, 257–292. [Google Scholar] [CrossRef]
  2. Di Foggia, G. Energy efficiency measures in buildings for achieving sustainable development goals. Heliyon 2018, 4, e00953. [Google Scholar] [CrossRef] [PubMed] [Green Version]
  3. Asdrubali, F.; D’Alessandro, F.; Schiavoni, S. A review of unconventional sustainable building insulation materials. Sustain. Mater. Technol. 2015, 4, 1–17. [Google Scholar] [CrossRef]
  4. Wang, L.; Wang, C.; Liu, P.; Jing, Z.; Ge, X.; Jiang, Y. The flame resistance properties of expandable polystyrene foams coated with a cheap and effective barrier layer. Constr. Build. Mater. 2018, 176, 403–414. [Google Scholar] [CrossRef]
  5. Crewe, R.J.; Hidalgo, J.P.; Sørensen, M.X.; McLaggan, M.; Molyneux, S.; Welch, S.; Jomaas, G.; Torero, J.L.; Stec, A.A.; Hull, T.R. Fire performance of sandwich panels in a modified ISO 13784-1 small room test: The influence of increased fire load for different insulation materials. Fire Technol. 2018, 54, 819–852. [Google Scholar] [CrossRef] [Green Version]
  6. Zhang, Y.; Huang, X.; Wang, Q.; Ji, J.; Sun, J.; Yin, Y. Experimental study on the characteristics of horizontal flame spread over XPS surface on plateau. J. Hazard. Mater. 2011, 189, 34–39. [Google Scholar] [CrossRef]
  7. Jiang, L.; Xiao, H.; Zhou, Y.; An, W.; Yan, W.; He, J.; Sun, J. Theoretical and experimental study of width effects on horizontal flame spread over extruded and expanded polystyrene foam surfaces. J. Fire Sci. 2014, 32, 193–209. [Google Scholar] [CrossRef]
  8. Bonner, M.; Wegrzynski, W.; Papis, B.K.; Rein, G. KRESNIK: A top-down, statistical approach to understand the fire performance of building facades using standard test data. Build. Environ. 2020, 169, 1–10. [Google Scholar] [CrossRef]
  9. Babrauskas, V. Heat Release Rates, SFPE Handbook of Fire Protection Engineering; Springer: New York, NY, USA, 2016; pp. 799–904. [Google Scholar]
  10. An, W.; Sun, J.; Liew, K.; Zhu, G. Effects of building concave structure on flame spread over extruded polystyrene thermal insulation material. Appl. Therm. Eng. 2017, 121, 802–809. [Google Scholar] [CrossRef]
  11. Hajduković, M.; Knez, N.; Knez, F.; Kolšek, J. Fire performance of external thermal insulation composite system (ETICS) facades with expanded polystyrene (EPS) insulation and thin rendering. Fire Technol. 2017, 53, 173–209. [Google Scholar] [CrossRef]
  12. Zhou, B.; Yoshioka, H.; Noguchi, T.; Ando, T. Experimental study of expanded polystyrene (EPS) External Thermal Insulation Composite Systems (ETICS) masonery façade reaction-to-fire performance. Therm. Sci. Eng. Prog. 2018, 8, 83–92. [Google Scholar] [CrossRef]
  13. Mensah, R.A.; Xu, Q.; Asante-Okyere, S.; Jin, C.; Bentum-Micah, G. Correlation analysis of cone calorimetry and microscale combustion calorimetry experiments. J. Therm. Anal. Calorim. 2019, 136, 589–599. [Google Scholar] [CrossRef]
  14. Hossain, M.D.; Saha, S.; Hassan, M.K.; Yuen, A.C.Y.; Wang, C.; Hittini, W.; George, L.; Wuhrer, R. Testing of aluminium composite panels in a cone calorimeter: A new specimen preparation method. Polym. Test. 2022, 106, 107454. [Google Scholar] [CrossRef]
  15. Hossain, D.; Hassan, K.; Yuen, A.C.Y.; Wang, C.; Hittini, W. Influencing factors in small-scale fire testing of aluminium composite panels. In Proceedings of the 12th Asia-Oceania Symposium on Fire Science and Technology (AOSFST 2021), Virtual, 7–9 December 2021; The University of Queensland: Brisbane, Australia, 2021. [Google Scholar]
  16. Bakhtiyari, S.; Taghi, A.L.; Barikani, M. The effective parameters for reaction-to-fire properties of expanded polystyrene foamsin bench scale. Iran. Polym. J. 2010, 19, 27–37. [Google Scholar]
  17. ISO 5660-1:2015; Reaction-to-Fire Tests—Heat Release, Smoke Production and Mass Loss Rate—Part 1: Heat Release Rate (Cone Calorimeter Method) and Smoke Production Rate (Dynamic Measurement). International Standards Organization: Geneva, Switzerland, 2015.
  18. Schartel, B.; Hull, T.R. Development of fire-retarded materials—interpretation of cone calorimeter data. Fire Mater. Int. J. 2007, 31, 327–354. [Google Scholar] [CrossRef]
  19. Hansen, A.S.; Hovde, P.J. Prediction of time to flashover in the ISO 9705 room corner test based on cone calorimeter test results. Fire Mater. 2002, 26, 77–86. [Google Scholar] [CrossRef]
  20. Chow, W. Fire hazard assessment on polyurethane sandwich panels for temporary accommodation units. Polym. Test. 2004, 23, 973–977. [Google Scholar] [CrossRef]
  21. Morrisset, D.; Thorncroft, G.; Hadden, R.; Law, A.; Emberley, R. Statistical uncertainty in bench-scale flammability tests. Fire Saf. J. 2021, 122, 103335. [Google Scholar] [CrossRef]
  22. EN 13501; Fire Classification of Construction Products and Building Elements-Part 1: Classification Using Data from Reaction to Fire Tests. British Standard Institute: London, UK, 2002.
  23. Quintiere, J.G. Fundamentals of Fire Phenomena; Wiley: New York, NY, USA, 2006. [Google Scholar]
  24. An, W.; Jiang, L.; Sun, J.; Liew, K. Correlation analysis of sample thickness, heat flux, and cone calorimetry test data of polystyrene foam. J. Therm. Anal. Calorim. 2015, 119, 229–238. [Google Scholar] [CrossRef]
  25. Xu, Q.; Jin, C.; Jiang, Y. Compare the flammability of two extruded polystyrene foams with micro-scale combustion calorimeter and cone calorimeter tests. J. Therm. Anal. Calorim. 2017, 127, 2359–2366. [Google Scholar] [CrossRef]
  26. Hirschler, M.M. Flame retardants and heat release: Review of data on individual polymers. Fire Mater. 2015, 39, 232–258. [Google Scholar] [CrossRef] [Green Version]
  27. Sacristán, M.; Hull, T.R.; Stec, A.A.; Ronda, J.C.; Galià, M.; Cádiz, V. Cone calorimetry studies of fire retardant soybean-oil-based copolymers containing silicon or boron: Comparison of additive and reactive approaches. Polym. Degrad. Stab. 2010, 95, 1269–1274. [Google Scholar] [CrossRef] [Green Version]
  28. Stec, A.A.; Hull, T.R. (Eds.) Introduction to Fire Toxicity. In Fire Toxicity; Woodhead Publishing Limited: Cambridge, UK, 2010; pp. 1–25. [Google Scholar]
  29. Mulholland, G.; Janssens, M.; Yusa, S.; Twilley, W.; Babrauskas, V. The effect of oxygen concentration on CO and smoke produced by flames. Fire Saf. Sci. 1991, 3, 585–594. [Google Scholar] [CrossRef] [Green Version]
  30. Drysdale, D. Smoke: Its Formation, Composition and Movement, An introduction to Fire Dynamics. In An Introduction to Fire Dynamics, 3rd ed.; 2011; pp. 441–474. Available online: https://onlinelibrary.wiley.com/doi/10.1002/9781119975465.ch11 (accessed on 20 April 2022).
  31. Khan, A.A.; Lin, S.; Huang, X.; Usmani, A. Facade Fire Hazards of Bench-Scale Aluminum Composite Panel with Flame-Retardant Core. Fire Technol. 2021; 1–19, pre-print. Available online: https://www.grenfelltowerinquiry.org.uk/evidence/professor-luke-bisbys-expert-report(accessed on 20 May 2022). [CrossRef]
  32. Bisby, L.A. Grenfell Tower Inquiry: Phase 1-Final Expert Report; Grenfell Tower Enquiry: London, UK, 2018. [Google Scholar]
  33. Deepak, D.; Drysdale, D. Flammability of solids: An apparatus to measure the critical mass flux at the firepoint. Fire Saf. J. 1983, 5, 167–169. [Google Scholar] [CrossRef]
Figure 1. Building insulation material-extruded polystyrene (XPS).
Fire 05 00081 g001
Figure 2. Building insulation material-expanded polystyrene (EPS); (a) standard (no foil); (b) with foil; and (c) with vent.
Fire 05 00081 g002
Figure 3. Test setup of cone calorimeter (a) horizontal orientation; (b) vertical orientation.
Fire 05 00081 g003
Figure 4. HRR curves of XPS and EPS at (a) 35 kW/m2; (b) 50 kW/m2.
Fire 05 00081 g004
Figure 5. Mass-loss rate curves of XPS and EPS at (a) 35 kW/m2; (b) 50 kW/m2.
Fire 05 00081 g005
Figure 6. Smoke production rate at (a) 35 kW/m2 and (b) 50 kW/m2.
Fire 05 00081 g006
Figure 7. Different fire exposure scenarios (a) exposed panel without metal skin [31]; (b) panel with metal skin [31]; (c) damaged and plumbing area [5].
Fire 05 00081 g007
Figure 8. HRR curves of EPS at (a) 35 kW/m2 and (b) 50 kW/m2.
Fire 05 00081 g008
Figure 9. Mass-loss rate (MLR) curves of EPS at (a) 35 kW/m2 and (b) 50 kW/m2.
Fire 05 00081 g009
Figure 10. Effect of sample configuration with different steps at 50 kW/m2.
Fire 05 00081 g010aFire 05 00081 g010b
Figure 11. Effect of test orientation of EPS on HRR at 50 kW/m2.
Fire 05 00081 g011
Table 1. Test material properties.
Types of MaterialsDensity (kg/m3)Mass (g)Size (mm)Thickness (mm)
Extruded polystyrene (XPS)28.08.0100 × 10030
Expanded polystyrene (EPS)18.05.4100 × 10030 *
* EPS sandwiched between 0.03 mm aluminium foils on each side.
Table 2. Details of test specimens.
Sl. NoSample LabelSample TypeSize (mm × mm)OrientationHeat-Flux
(kW/m2)
Configuration
1XPS-H-S-35XPS100 × 100Horizontal35Standard
2XPS-H-S-50100 × 100Horizontal50Standard
3EPS-H-F-35EPS100 × 100Horizontal35With FR foil
4EPS-H-S-35100 × 100Horizontal35Standard (No foil)
5EPS-H-H-35100 × 100Horizontal35Foil and vent
6EPS-H-F-50100 × 100Horizontal50With FR foil
7EPS-H-S-50100 × 100Horizontal50Standard (No foil)
8EPS-H-H-50100 × 100Horizontal50Foil and vent
9EPS-V-F-50100 × 100Vertical50With FR foil
10EPS-V-H-35100 × 100Vertical50Foil and Vent
Table 3. Test results of XPS and EPS samples.
ParametersXPSEPS *
Heat-flux (kW/m2)35 5035 50
Reaction-to-fire properties:
Time to ignition (s)532917
Time to flameout (s)17414313598
Total burning time (s)16914010681
pHRR (kW/m2)423492377442
Time to pHRR (s)33283220
Avg. EHC (MJ/kg)28.3927.8824.8124.44
Avg. specific mass loss rate (g/s·m2)8.739.115.979.09
Avg. HRR (kW/m2)73.2465.5029.3133.37
THR (MJ/m2)26.2126.6011.2312.90
Fire hazard:
FIGRA12.9018.1911.8022.09
FPI0.01060.00520.07560.0385
MARHE (kW/m2)321.81357.50137.51224.35
Smoke hazard:
TSP (m2)9.3510.094.385.585
Avg. SEA (m2/kg)1147.501207.881120.261202.08
CO yield (kg/kg)0.180.170.190.21
CO2 Yield (kg/kg)2.062.001.951.90
Smoke toxicity index (STI) 0.08740.08500.09740.1105
* = without FR foil layer on both sides.
Table 4. Effect of different orientations on reaction-to-fire properties of EPS.
ParametersHorizontalVertical
FR FoilFR Foil and VentFR FoilFR Foil and Vent
TTI (s)3602475050
Time to pHRR (s)4152676254
pHRR (kW/m2)19931170.94128.40
Avg. HRR (kW/m2)53.7057.884.0222.09
THR (MJ/m2)12.8011.862.4111.36
Publisher’s Note: MDPI stays neutral with regard to jurisdictional claims in published maps and institutional affiliations.

