Article

Parcel-Level Risk Affects Wildfire Outcomes: Insights from Pre-Fire Rapid Assessment Data for Homes Destroyed in 2020 East Troublesome Fire

1
U.S. Geological Survey, Fort Collins Science Center, Fort Collins, CO 80526, USA
2
U.S. Bureau of Land Management—Montana/Dakotas, Fire and Aviation Management, Billings, MT 59105, USA
3
Grand County Wildfire Council and Grand Fire Protection District No. 1, Granby, CO 80446, USA
4
Institute of Behavioral Science, University of Colorado-Boulder, Boulder, CO 80309, USA
5
U.S. Department of Agriculture, Forest Service, Rocky Mountain Research Station, Fort Collins, CO 80526, USA
6
West Region Wildfire Council, Montrose, CO 81401, USA
*
Author to whom correspondence should be addressed.
Submission received: 22 November 2021 / Revised: 27 January 2022 / Accepted: 10 February 2022 / Published: 12 February 2022
(This article belongs to the Special Issue Wildfire Hazard and Risk Assessment)

Abstract

:
Parcel-level risk (PLR) describes how wildfire risk varies from home to home based on characteristics that relate to likely fire behavior, the susceptibility of homes to fire, and the ability of firefighters to safely access properties. Here, we describe the WiRē Rapid Assessment (RA), a parcel-level rapid wildfire risk assessment tool designed to evaluate PLR with a small set of measures for all homes in a community. We investigate the relationship between 2019 WiRē RA data collected in the Columbine Lake community in Grand County, Colorado, and whether assessed homes were destroyed in the 2020 East Troublesome Fire. We find that the overall parcel-level risk scores, as well as many individual attributes, relate to the chance that a home was destroyed. We also find strong evidence of risk spillovers across neighboring properties. The results demonstrate that even coarsely measured RA data capture meaningful differences in wildfire risk across a community. The findings also demonstrate the importance of accounting for multiple aspects of PLR, including both hazards and susceptibility, when assessing the risk of wildfire to homes and communities. Finally, the results underscore that relatively small actions by residents before a fire can influence wildfire outcomes.

1. Introduction

In October 2020, Grand County, Colorado, was severely affected by the 193,812-acre East Troublesome Fire. Fueled by drought, beetle-killed trees, and red flag weather conditions (i.e., high winds, dry fuels, and low relative humidity), the fire grew rapidly, including a spread of 87,093 acres in the 24 h starting on the afternoon of October 21. The fire resulted in two deaths and destroyed 366 homes. This paper investigates whether parcel-level rapid wildfire risk assessment data collected before the fire can help to explain why these homes were destroyed while others in the fire’s path were not. In so doing, it more broadly investigates the relevance of parcel-level characteristics in determining wildfire risk to homes and people.
The East Troublesome Fire was one of many devastating wildfires in 2020. The general risk that wildfire presents to society is well-recognized, e.g., [1,2,3], as are the roles of development patterns [4,5,6] and climate change [7,8] in contributing to increasing risk. Reflecting broad concern, many organizations with interests in reducing wildfire risk conduct some version of wildfire risk assessment. The U.S. federal government supports two databases with national coverage that seek to describe wildfire risk at either the census tract (Federal Emergency Management Agency’s National Risk Index, https://hazards.fema.gov/nri/, accessed on 11 February 2022) or municipality scale (United States Department of Agriculture’s Wildfire Risk to Communities, https://wildfirerisk.org/, accessed on 11 February 2022). State-wide assessments include the Oregon Wildfire Risk Explorer (https://oregonexplorer.info/topics/wildfire-risk?ptopic=62, accessed on 11 February 2022), and the Colorado Forest Atlas (https://coloradoforestatlas.org/, accessed on 11 February 2022). These assessments tend to follow the risk framework laid out by Finney [9], Thompson and Calkin [10], and Scott et al. [11] and packaged for a public audience at https://wildfirerisk.org. This framework, which is generally consistent with other established risk reduction frameworks [12,13], recognizes wildfire risk as the intersection of wildfire hazard and vulnerability to fire. Wildfire hazard encompasses the likelihood of a fire at a given location and the intensity of that fire if it occurs. Vulnerability encompasses both the exposure and susceptibility of people or assets to expected fire behavior. For example, people are exposed to hazards if they live in homes that are at risk, while their susceptibility depends in part on whether they would be able to safely evacuate during a wildfire. As another example, two homes might be similarly exposed to wildfire hazards but differ widely in susceptibility, and thus overall risk, if one is a wooden cabin and the other is a concrete bunker.
Here, we refine this general wildfire risk framework to focus on parcel-level wildfire risk to homes and residents. Specifically, we define parcel-level risk (PLR) as the combination of the local wildfire hazard posed to a residential parcel and the vulnerabilities of people and property to that hazard (gold boxes in Figure 1). PLR emphasizes intra-community heterogeneity in risk and is embedded within broader-scale contexts that also might influence risk to homes and residents, such as general social vulnerability or determinants of landscape-level hazards such as proximity to wildland vegetation (light green with dashed lines in Figure 1).
As described in the subsections below, four categories of action (blue in Figure 1) can address these aspects of risk at the parcel level. To summarize, fuel reduction near the structure and support for safe and effective fire suppression can reduce both the likelihood and intensity of wildfire on and near the property; planning and preparation before a wildfire can reduce the exposure of people and property as well as the susceptibility of exposed people and property; and structural hardening can reduce the vulnerability of homes and the people living in them. Thus, in the PLR conceptual model, risk varies at the level of individual parcels as a function not only of conditions associated with the possibility of wildfire and conditional fire behavior at that parcel, but also of conditions related to structural vulnerability and the potential for safe and effective response by fire suppression resources.
As such, PLR provides a framework for describing wildfire risk to homes and residents, built on a foundation of fire science that combines theoretical modeling, laboratory experiments, and post-fire investigations. Although embedded within the general framework of risk described above, PLR is motivated by the recognition that large scale wildfire risk assessments tend to have limited coverage of conditions that vary at the scale of individual properties and treat entire classes of assets, such as residential property, as responding uniformly to a hazard. In contrast, PLR offers an explicit focus on the heterogeneity of risk among the residential parcels that comprise a geographic community, consistent with fire science establishing differences in wildfire vulnerability [14] and recent studies emphasizing the influence of factors at multiple scales on the effectiveness of fire risk reduction strategies [15]. By design, PLR focuses on property conditions that can be influenced by residents or property owners.
The concept of PLR can be implemented by the parcel-level wildfire risk assessment of a relatively small set of attributes on residential properties. Specifically, four categories of observable attributes (green in Figure 1)—parcel-level hazard, defensible space, access, and structure—succinctly describe the status of the parcel as it relates to PLR. In practice, parcel-level wildfire risk assessments tend to take one of two forms, each filling a separate dimension of programmatic need: in-depth evaluations conducted on-site, or rapid assessments conducted from the road or sidewalk. An in-depth property evaluation is intended to provide detailed guidance (e.g., remove four tagged trees) for mitigating risk on a property and typically entails on-site engagement between a wildfire practitioner and a property owner. A rapid assessment, when conducted as a census of all properties within a community, can serve numerous purposes, including: identifying risk reduction priorities; generating material for outreach and education; tracking changes in vegetation and mitigation over time; informing suppression strategies; exploring gaps between perceived and assessed risk; and conducting post-fire analyses such as this paper. To these ends, some organizations with interests in wildfire risk mitigation, such as fire departments, state agencies, and non-governmental organizations, conduct parcel-level rapid wildfire risk assessments [16]. Although past research supports the relevance of detailed property characteristics assessed in an in-depth assessment [17], such as whether windows are double-paned and whether roofing includes a non-combustible fiberglass underlayment [18], such attributes are considered beyond the scope of parcel-level rapid wildfire risk assessment. Instead, rapid assessments typically measure relatively few attributes within each category, prioritizing those that can be evaluated rapidly and at a distance (i.e., from the road or sidewalk), and with only a small set of possible responses for each attribute.
Using a quick, systematic approach facilitates the assessment of PLR for all residential properties within a given community. However, one might question whether a small set of coarsely measured attributes, often measured imperfectly due to privacy and resource constraints, can be useful for representing a property’s risk. This paper addresses that question. Specifically, we test whether parcel-level rapid wildfire risk assessment data, collected before the fire, explain the destruction of structures from a wildfire. To do so, we make the most of an unfortunate opportunity arising from the East Troublesome Fire. A year before that fire, member organizations of Grand County Wildfire Council (GCWC) conducted a parcel-level rapid wildfire risk assessment for a select set of communities in Grand County, Colorado. They employed the WiRē RA, a parcel-level rapid wildfire risk assessment approach that has been developed into a standardized tool by the authors and partners. The WiRē RA was developed over more than 15 years of collaboration by a team of researchers and practitioners, referred to as the Wildfire Research (WiRē) Team, as part of a systematic data collection and integration approach (the WiRē Approach) intended to inform local wildfire risk education efforts and allow for the monitoring of community adaptation over time [19]. For all residential homes within the selected communities, the WiRē RA recorded data on parcel-level attributes pertaining to defensible space, structural hardening, property access and identification, and parcel-level hazard. One of the selected communities, Columbine Lake, lay in the path of the East Troublesome Fire’s rapid spread. On the night of 21 October 2020, the fire destroyed 30 structures. (Note that thirty structures in the Columbine Lake community were reported destroyed in the East Troublesome Fire. Of these, 26 of these were included in the rapid assessment data from 2019. Of these 26 assessed but destroyed structures, three have at least one attribute marked as unobservable in the rapid assessment data, resulting in 23 completely assessed structures destroyed by the fire. None of these numbers include the many structures that sustained damage during the fire (e.g., burns, smoke damage) but were not considered complete losses) in that community).
Few studies investigate the relationship between pre-fire parcel-level attributes and the likelihood of a structure being destroyed in a fire [17]. However, such analysis can be valuable. While some parcel-level attributes are impossible to determine after the fact if structures are destroyed in a fire [20], post-fire analysis is uniquely positioned to capture the dynamics of an event, which include the complexity of fire behavior as well as decisions and constraints regarding fire suppression and response. Post-fire analyses using pre-fire parcel attributes are rare for at least three reasons. First, the probability of a wildfire spreading into any community in any given year is quite low, suggesting a small pool of potential study locations. Second, the data must be recent, because many fire-relevant attributes (e.g., vegetation around the home) change over time. Third, sample sizes (i.e., the number of homes exposed to the fire) tend to be low, a constraint we seek to overcome by estimating the effect of overall risk scores, or individual assessed attributes, on whether a structure was destroyed in a series of individual models, each of which accounts for spatial correlations in both dependent and independent variables.
Our results demonstrate that assessing PLR using a parcel-level rapid wildfire risk assessment helps to explain the outcomes for individual residential properties within the Columbine Lake community. These results underscore the importance of evaluating both wildfire hazard and vulnerability when considering the risk of wildfire to people, homes, and communities. They also demonstrate the utility of a parcel-level rapid wildfire risk assessment, such as the WiRē RA, in representing PLR and its heterogeneity across parcels. Furthermore, the results suggest risk interdependencies across parcels but also that relatively small actions taken by residents can affect home survivability during a wildfire event.

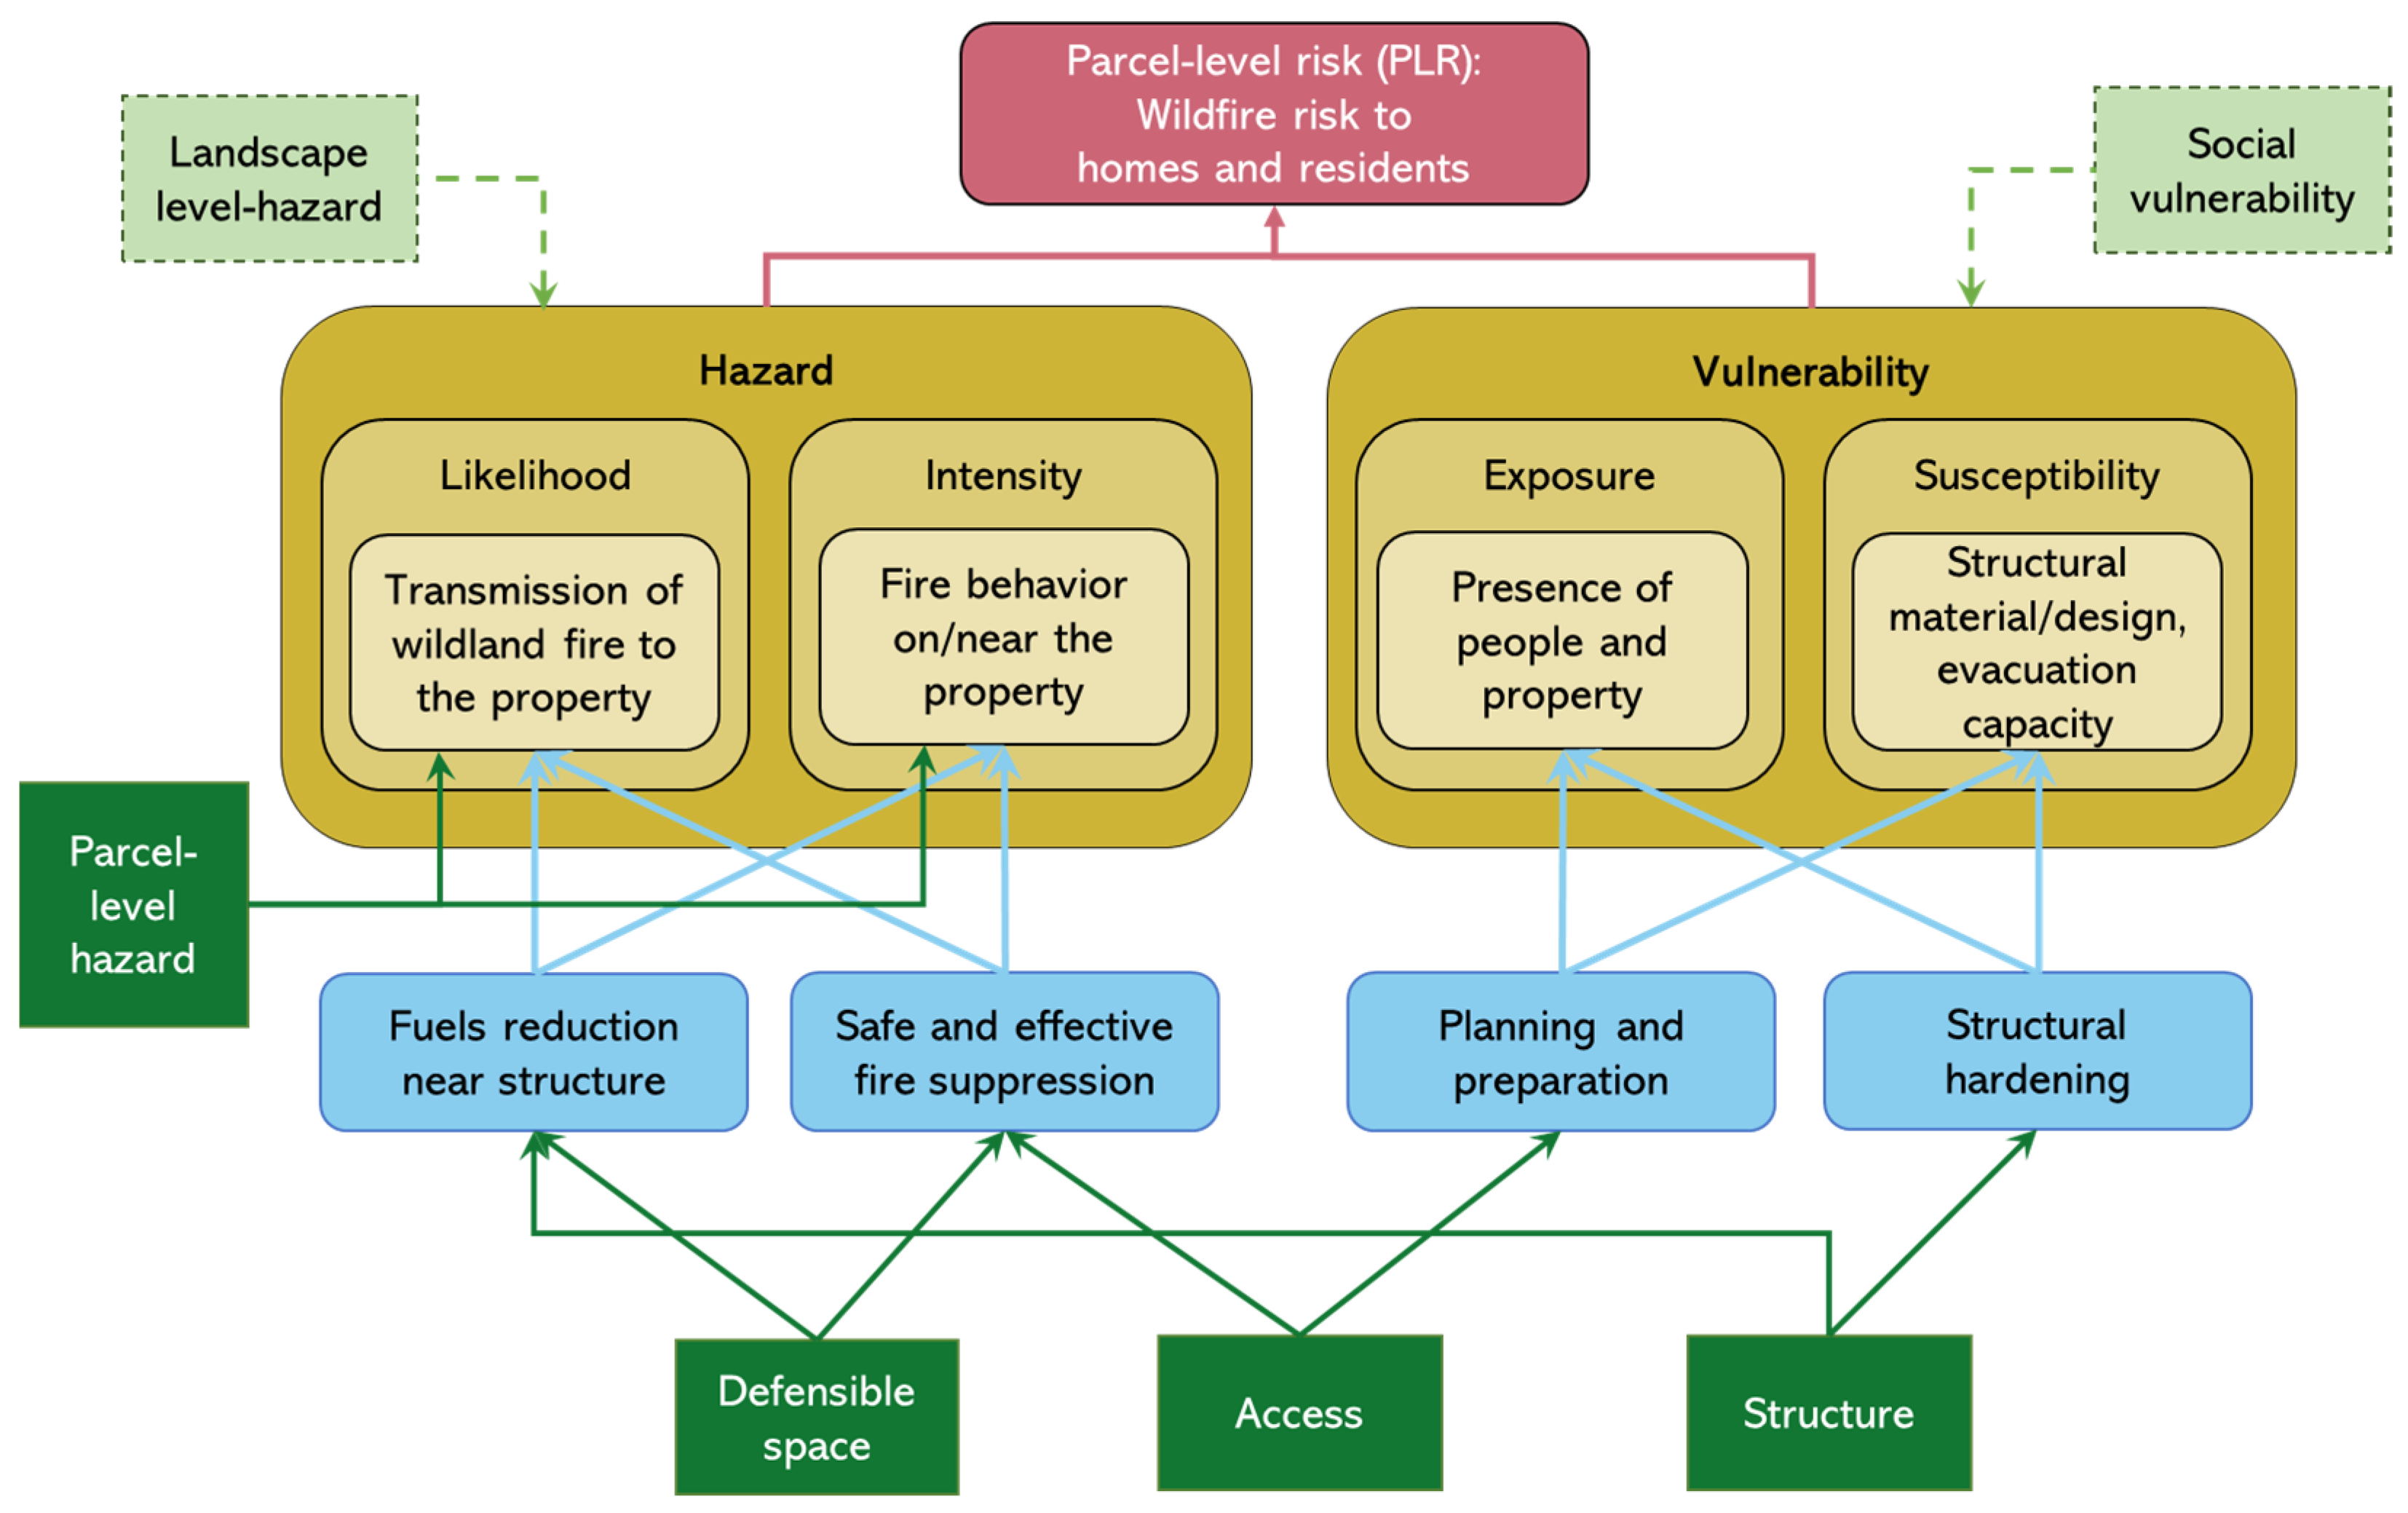
2. Parcel-Level Wildfire Risk Assessment

This section summarizes wildland fire science relating to the four categories of observable attributes and describes their implementation in our parcel-level rapid wildfire risk assessment, the WiRē RA. This section also notes which of these attributes can be directly influenced by the residents or owners of individual properties.

2.1. Parcel-Level Hazard

In the general model of wildfire risk, likelihood refers to the probability of wildfire at a location, and intensity refers to fire behavior conditional on wildfire. Three main factors generally influence wildfire behavior: weather, fuel type, and topography [9]. In the PLR conceptual model, likelihood refers to the probability of a wildfire in the vicinity being transmitted to the property, and intensity refers to fire behavior on and near the property, if that were to occur. So defined, both likelihood and intensity are influenced by variation in fuels and topography at the parcel level. For example, post-fire simulations have found different fuel types to predict home destruction [21]. Grasses typically support fast-moving, low-intensity fires, whereas denser fuels support higher-intensity flames; both can pose high hazards in specific conditions [22]. Post-fire simulation has found slope, relative to the direction of a spreading fire, to predict home destruction [21]. A steep topography can increase the rate of wildfire spread or cause erratic behavior [23,24,25], and rough terrain can impede firefighter access [26]. Thus, a steep topography places nearby homes at risk [27], especially during rapid, wind-driven fires when suppression is particularly challenging [20,28].
Furthermore, nearby structures can themselves become ignition sources. Post-fire studies have found that the spatial arrangement of buildings, including building density [26] and distance to nearby buildings [29,30], predicted housing damage and that close home proximity allowed wildfire to spread quickly between homes [31]. Fuels and structure proximity can also interact; one post-fire study found that low-density, rural developments were at higher risk from wildfire than high-density developments, with possible explanations including the associated increased exposure to flammable vegetation, limited road access, and complex terrain [27].
Thus, local geographic characteristics affect PLR by influencing both the likelihood and intensity of wildfire on a property. The WiRē RA operationalizes parcel-level hazard with field-identified attributes measuring the distance to hazardous topography (e.g., valleys, cliffs, chimneys), the slope of the ground near the structure, and the general type and density of fuels on and around the property (i.e., attributes 1 through 3 on Table 1). Although not assessed during the initial Grand County project, distance to the closest home has since been integrated into the WiRē RA, and it was calculated retroactively for Grand County properties using spatial data (i.e., attribute 4 on Table 1). Furthermore, although weather conditions can vary systematically at the parcel level, they are not separately assessed during the WiRē RA.

2.2. Defensible Space

Wildfire likelihood and intensity are also affected by the presence and quality of defensible space around the structure. The phrase ‘defensible space’ originates from the reference to this zone as supporting safe and effective fire suppression activities around a structure. Indeed, defensible space has been found to reduce entrapment risk for firefighters, ostensibly increasing their effectiveness [32]. Given that fuels in the defensible space zone can pass flame to a structure through direct point of contact, radiative heat, or firebrands (airborne embers) [14], defensible space also provides passive protection in terms of reducing fuels available near the structure.
While firefighters’ experience can confirm the value of a zone that supports safe fire suppression activities (i.e., the active mechanism), laboratory experiments support the value of reducing fuels that could transmit fire to the home (i.e., the passive mechanism). In experiments, structures burned upon direct contact with flames [33], but mock home structures survived radiant heat from an active crown fire that was at least 10 m away [34]. Empirical post-fire case studies also indicate the role of defensible space in reducing fire transmission from nearby vegetation. Analysis of vegetative conditions derived from pre-fire aerial imagery in southern Australia demonstrated a significant impact of 40 m defensible space on home survival, because it distanced the home from the higher radiative heat and ember density near burning vegetation; increased distance from upwind shrubs and trees up to 100 m away had a lesser but still significant effect on home survival [35]. Two other post-fire studies found that pre-fire vegetation conditions near the home, measured with aerial and satellite imagery, helped to determine structure damage during fires in eastern Australia [36] and northern California [30]. Aerial imagery after fires in San Diego County, CA, suggested that up to 30 m of defensible space increased home survival, with little added benefit beyond that [22]. The same study suggested that only 30 to 40 percent of vegetation must be removed to achieve defensible space protection, provided the remaining vegetation is properly spaced and does not overhang the structure [22,27]. However, effectiveness can depend on specific fire conditions, as some studies found vegetation measures, including defensible space, to be relevant but less important predictors of home destruction than other factors such as topography in two wildfires in San Diego, CA and Boulder, CO [26].
Although these empirical studies tend to focus on the passive value of fuels reduction when interpretating their findings, the passive effectiveness of fuel reduction is confounded by active effectiveness in terms of how it affects decisions about suppression made dynamically during an event. Indeed, defensive actions have also strongly predicted structure damages [36]. Thus, results regarding defensible space in one incident may have limited transferability to other contexts, particularly if fire behavior and response differ.
To represent these dual mechanisms of risk reduction, the PLR conceptual model (Figure 1) links defensible space to fuels reduction near the structure and support for safe and effective fire suppression. The WiRē RA operationalizes defensible space in two attributes. The first, vegetative defensible space, measures the closest distance from the residence to overgrown, dense, or unmaintained vegetation (i.e., attribute 5 on Table 1). The second, other combustible materials, measures the closest distance from the residence to other combustible materials, such as wood piles, wicker furniture, propane tanks (i.e., attribute 6 on Table 1). The defensible space category is differentiated from parcel-level hazard not only because of the relationship with supporting safe and effective fire suppression near the structure but also because, in contrast to the parcel-level hazard category, the two attributes measuring defensible space reflect the outcomes of actions taken (or not) by the residents of a property. Thus, attributes in the defensible space category offer opportunities for residents to intervene in the wildfire risk to their homes or themselves.

2.3. Access

Access considerations make up the third category of the PLR conceptual model (Figure 1). Access considerations relate to two interventions in wildfire risk to a home and its residents: the ability of suppression resources to safely access the home during a wildfire, which can reduce the hazard, and the ability of residents to evacuate safely, which can reduce their exposure to the hazard.
Ingress/egress refers to available routes for connecting a property to a reasonably distant, safe location. Many fire-prone communities, including in Colorado, have just one path of ingress/egress [37], making firefighter access and resident evacuation difficult [38]. A study of various southern California wildfires found distance to major roads to be an important predictor of home destruction in low-density communities, perhaps due to firefighter response times [27]. Similarly, safe ingress/egress achieved via preparatory fuel clearing allowed firefighters to access burning properties in a southern Californian fire [32].
Driveway clearance, including width, length, and the presence of a turnaround, affects the ability for fire engines to enter a property—and rapidly exit if necessary. Ideally, the driveway or cleared space around it are wide enough for two vehicles to pass each other and for an emergency vehicle to turn around [39,40]. Driveway width requirements were found to increase firefighter safety in southern California, allowing personnel to return to burning houses behind the fire front [32].
Address visibility can also support safe and effective fire response. At night or in smoky conditions, visible addressing, GPS address data [41], and paper maps [32] can all help firefighters to orient themselves and reach the correct destination. During a fire, personnel may need to call in additional resources to specific locations; visible addressing allows firefighters to quickly locate homes and respond to an active fire. This can be particularly important during large fires when personnel come from other locations and are not familiar with the area. Accordingly, community wildfire preparedness plans or codes often include standards pertaining to address visibility, such as reflectivity, font size, posting location, and combustibility. Despite this perceived importance, we know of no study that assesses the efficacy of address visibility in influencing the risk to homes during a wildfire.
The WiRē RA operationalizes access considerations into three attributes: ingress/egress, driveway clearance, and address visibility (i.e., attributes 7 through 9 in Table 1). In some cases, ingress/egress is determined at the community level; however, individual homes within communities with otherwise good ingress/egress options might have only one feasible route to the property due to, for example, cul-de-sacs or dead-end roads. Unless enforced by local codes and zoning, driveway clearance and address visibility will vary at the parcel level and are often only observable by visual observation of the property. These latter two attributes are also within the control of residents and/or property owners.

2.4. Structure

Structural characteristics make up the fourth category of the PLR conceptual model (Figure 1). Depending on materials, design, and condition, roofing, siding, and items attached to a home (e.g., decks, fences), all can be vulnerable to firebrands and can ignite the rest of a home [18]. However, some studies have found siding to be less important to wildfire mitigation than other home characteristics, because most siding materials can resist ignition, given adequate distance from vegetation or other combustibles [18,27]. Decks and fences can pass flames to the home or to other combustibles [18,42], even with “non-combustible” materials; debris accumulated in cracks or underneath a deck are more common sources of deck ignition than the flammability of the deck itself [43]. Post-fire analysis of two fast-moving southern California wildfires found attached wooden fencing to significantly predict home destruction, regardless of whether homes were in a high- or low-exposure environment [20]. Although analysis was constrained by a lack of pre-fire data, that study also suggested that risk is reduced by clearing debris from gutters, eaves, and roofs and by using fire-resistant or non-combustible materials wherever possible [20].
The WiRē RA operationalizes structural considerations with three attributes: roofing material, most vulnerable siding material, and the presence and combustibility of attachments (i.e., attribute 10 through 12 on Table 1). These attributes primarily relate to structural hardening and associated reductions in vulnerability to wildfire, but the interface between fuels and attachments also affects the localized hazard. As with access considerations, these attributes typically vary at the parcel level. In some cases, existing databases (e.g., county assessor records) include relevant information, but these attributes are often only discernable by visual observation of the property. Structural attributes can be changed by residents and/or property owners through renovation or replacing materials, although initially building with less combustible materials tends to be significantly less costly [44].

2.5. Overall Risk

Notwithstanding its emphasis on understanding and communicating the individual attributes, the WiRē RA enables calculating an overall parcel-level wildfire risk score. Each possible response for the thirteen attributes is assigned a point value based on subjective expert judgment following the fire science described above, with the weighted sum providing an overall wildfire risk score (see Table 1 and Table 2). For example, out of 1000 possible points, a wood shake-shingle roof is worth 300, whereas insufficient driveway clearance is worth 10, reflecting the general understanding that a shake-shingle roof influences risk much more than driveway clearance does. This weighting system can be adjusted to specific programmatic needs and local contexts, and indeed, the authors have worked with numerous programs to adjust attributes and their weights accordingly. The “Assessor Reference Guide” (ARG) presented in Figure S1 in the Supplementary Materials provides rationale and additional considerations for attributes and response categories as collaboratively determined for the WiRē RA project in Grand County Colorado.
Similarly, weighted sums can be calculated for each of the four categories contributing to PLR shown on Figure 1 (i.e., parcel-level hazard, defensible space, access, and hazard) by summing the point values for included attributes. Attributes and point values have been developed iteratively through more than 15 years of collaborative partnerships between the WiRē Team and wildfire practitioners throughout the western United States. Although the WiRē RA aggregates individual attributes into overall risk using a simple weighted sum, the literature suggests that some attributes may interact. For example, flammable siding has been found to pose less risk with proper defensible space [18], and homes on steep slopes have been found to benefit from greater defensible space distances than homes on shallower slopes [22]. While the linear sum can be modified to represent such interactions, we believe that doing so in any rigorous way, including generalized across different fuel and fire behavior contexts, would require a substantially more nuanced understanding of the interactions than currently exists.
The WiRē RA is focused on identifying parcel-level heterogeneity within a community. Thus, it typically does not explicitly include information from broader-scale assessments, such as wildfire behavior modeling that relates to hazards at the landscape scale or social vulnerability assessments that relate to vulnerability at the community scale. However, we acknowledge that comprehensive assessment of the wildfire risk to homes and residents entails consideration of the broader-scale contexts in which the community, and thus the PLR, is embedded (see Figure 1, light green boxes with dashed borders). Depending on purposes, the assessment of risk might also benefit from additional considerations not addressed here, such as the potential for parcel-level variation in typical weather conditions or in weather conditions expected during extreme events.
Finally, we note that the concept of PLR expands upon the related concept of the home ignition zone (HIZ), which emphasizes that reducing the susceptibility of homes to wildfire, by appropriately managing the materials, design, and maintenance of the home in relation to the immediate surroundings, is key to reducing the risk of home loss [33,46]. While the HIZ concept focuses on susceptibility, PLR further encompasses localized wildfire hazard and exposure to provide a more comprehensive assessment of risk at the parcel level. This accommodates the inclusion of not only structural conditions and defensible space but also other localized influences on the wildfire’s likelihood and intensity (i.e., parcel-level hazard) and conditions that interface with suppression and preparation (i.e., access). PLR also recognizes the role of defensible space in supporting safe and effective fire suppression, which relates more to the localized wildfire hazard than to the susceptibility of a home. Most importantly, these modifications recognize that the interventions possible for one actor, at one scale, can interact with the interventions possible for other actors and at other scales; for example, a resident’s decision to widen their driveway can improve a fire department’s ability to safely protect that resident’s home.

3. Materials and Methods
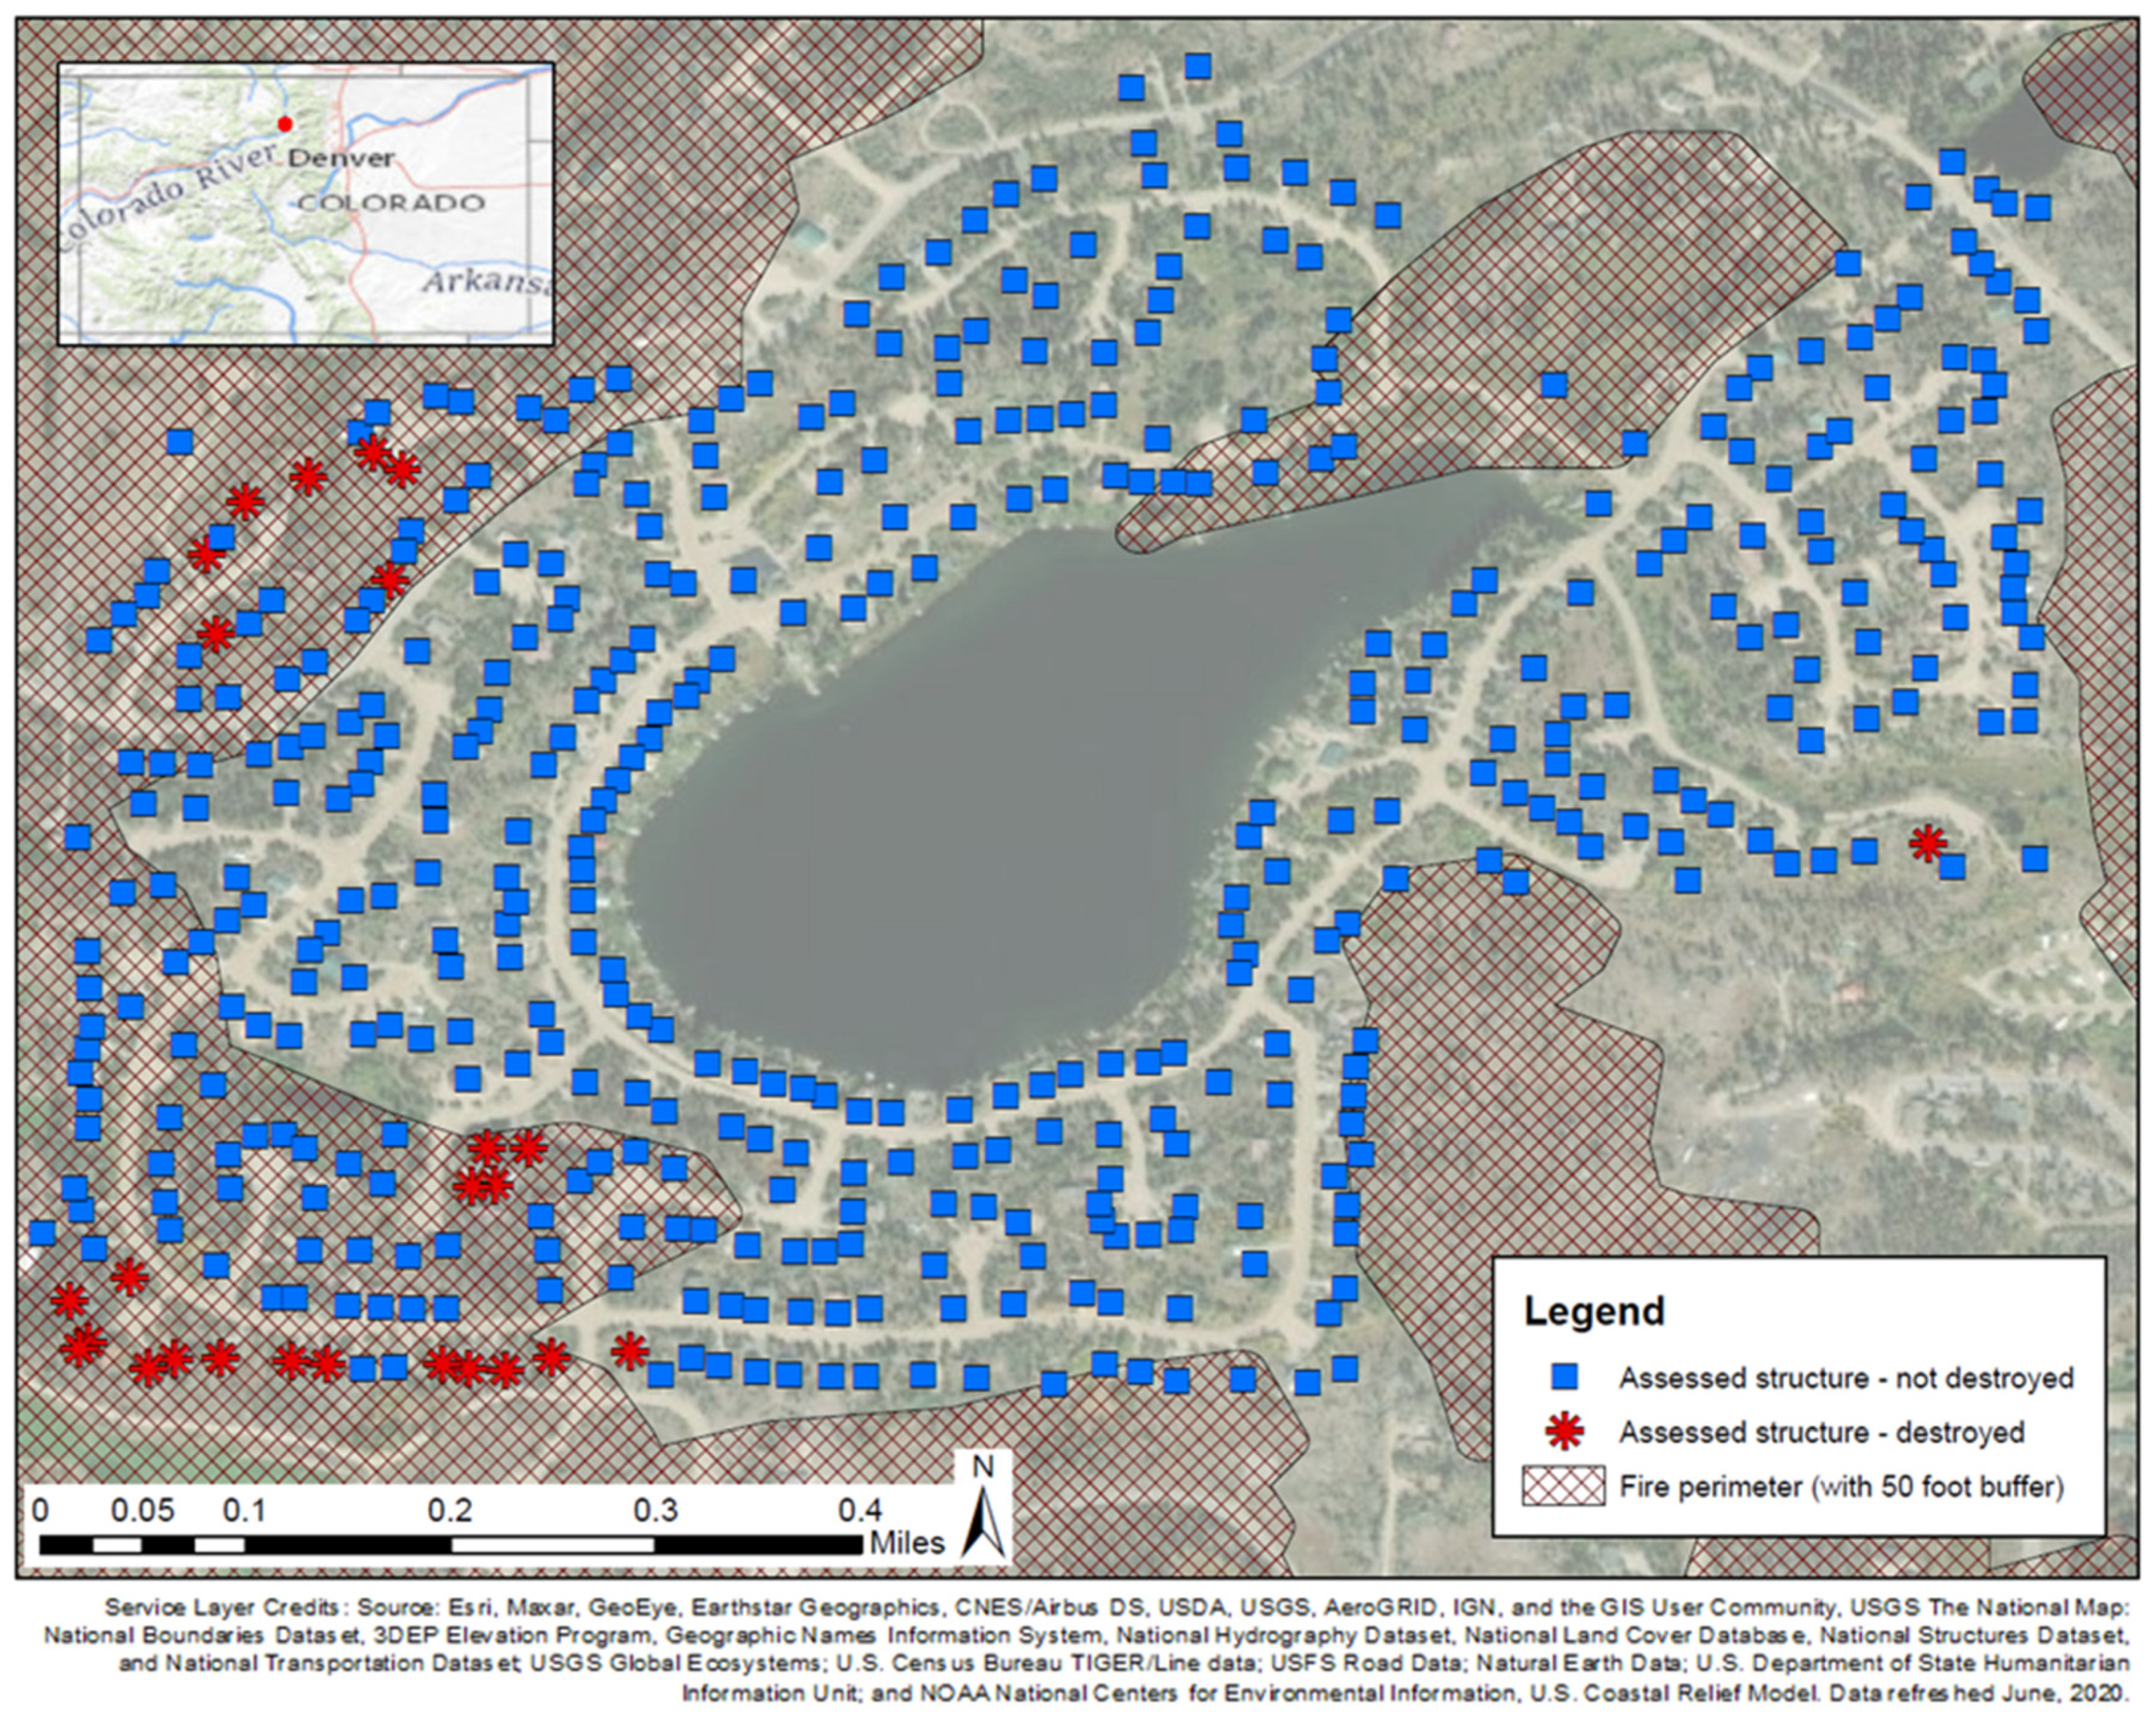
3.1. Study Context

Columbine Lake is a small community approximately two miles away from downtown Grand Lake, CO, a gateway town on the western side of the Rocky Mountain National Park (see Figure 2). In October of 2020, this community was one of many in Grand County, CO, affected by the East Troublesome Fire. The fire was reported in the Arapaho National Forest on 14 October and spread to over 10,000 acres in the first three days. The fire then grew rapidly, covering 187,964 acres by the end of 23 October. The fire destroyed an estimated 366 residences and 214 outbuildings and commercial structures [47] and damaged many more. Despite the destruction of 26 out of 461 assessed structures in the community of Columbine Lake, the community received somewhat of a glancing blow from the fire, in comparison to other communities in the area that received the full brunt of the extreme fire conditions and consequently faced near total destruction of their structures. Note that the number of destroyed structures reported throughout this paper pertains to complete losses among structures with complete rapid assessment data from 2019; this number does not include numerous structures that sustained damage (e.g., burns, smoke damage) but were not considered complete losses, nor does it include structures destroyed by the fire but not covered by the 2019 rapid assessment. This total does include 3 structures with only partially complete assessments, as described in more detail below.

3.2. Data

Previously, GCWC had selected Columbine Lake as one of six communities to be the site of a detailed data collection effort in collaboration with the Wildfire Research (WiRē) Center. (The Wildfire Research (WiRē) Center (https://wildfireresearchcenter.org, accessed on 11 February 2022) is a non-profit organization that works with wildfire practitioners to seek locally tailored pathways to create fire-adapted communities through the WiRē Approach described above and by ref. [19].) As part of this effort, GCWC used the WiRē RA tool to assess 461 homes in the community of Columbine Lake in the summer of 2019. Data collection was conducted by individuals from each of the five fire protection districts who had been trained to conduct the WiRē RA. The assessment was conducted from the roadside and supplemented using online imagery where necessary. As is common in roadside assessments, numerous attributes could not be clearly observed for all parcels and were marked as unobservable in the WiRē RA dataset. While no more than three parcels were marked as unobservable for 10 out of the 12 attributes, two attributes (“other combustibles” and “attachments”) were frequently unobservable (see Table S1 for details). Omitting parcels with unobservable attributes truncates the dataset by 24 percent, down to a total of 352 fully assessed structures, 23 of which were destroyed in the fire. To avoid introducing unnecessary measurement error bias, we used this set of 352 structures with complete assessment data for our main analysis. However, because the large proportion of incomplete assessments also introduced gaps in the spatially lagged measures, Table S2 replicates our primary results for the full dataset with unobservable attributes coded as having the riskiest rating for that attribute. Because proportionally fewer destroyed structures had incomplete data versus structures not destroyed (12% vs. 24%), this coding was conservative with respect to identifying meaningful attributes for explaining structures destroyed in the East Troublesome Fire. The results shown in Table S2 are generally consistent with the main results presented below.
GCWC assessed twelve attributes in 2019: the eleven represented by attributes 1–3 and 5–12 in Table 1, plus an additional attribute describing the length of the driveway that was omitted from the analysis here due to a lack of variation. However, the WiRē Team continues to revise the assessment tool as necessary based on new understandings. Based on revisions to the standard WiRē RA implemented in March 2020 (i.e., before the East Troublesome Fire), we supplemented the WiRē RA data collected by GCWC with an estimate of the distance between structures (attribute 4 in Table 1). We calculated the distance to the nearest home using point data for the locations of assessed structures. To adjust for point versus polygon data, 40 feet were subtracted from all calculated values (based on an assumed 20 feet from centroid to exterior wall for each of two homes) before converting to categorical ratings for inclusion in the overall risk score. We then calculated the overall risk score using the relative point values agreed upon by wildfire mitigation experts on the WiRē Team on March 2020, shown in Table 1.
Table 1 provides descriptive statistics for data pertaining to structures with complete assessment data destroyed and not destroyed within the Columbine Lake community. After the East Troublesome Fire, GCWC identified which structures within the WiRē RA dataset for Columbine Lake had been destroyed, as shown on the map in Figure 2. For reference, we overlaid spatial data on the fire perimeter [48], along with a 50-foot buffer to accommodate imprecision in spatial data, upon a point layer representing the locations of all assessed structures. Although 21 out of 23 structures with complete assessments were identified as within the burn perimeter, we note that all structures in the community were within a quarter mile or less from this active burn perimeter and that the entire community was exposed to wind-driven ember showers and active suppression activity during the events of 21 October 2020. Further, we note that although the fire perimeter is influenced by fire behavior at broader, landscape-level scales, the location of the perimeter within the community is not exogenous, but rather is at least partially simultaneously determined by structure destruction, due to parcel-level conditions, suppression activity, and because structures themselves can act as a source of fuel for the fire. Accordingly, we considered the entire community as being exposed to the fire and estimate our main models using the full dataset. To test the robustness of this decision, we replicated our main models with a subset of the data, constrained to the 116 structures within the burn perimeter; the results (shown in Table S3) are similar in direction to those from the preferred models but generally greater in magnitude while being considerably less precise.

3.3. Empirical Analysis

We focused our primary analysis on all structures within the community with complete WiRē RA data, modeling the influence of assessed variables and summary scores on whether a structure was lost in the East Troublesome Fire. Although, ideally, we would model the likelihood of a structure being destroyed as a function of all assessed attributes jointly, the small number of observations limited the degrees of freedom to do so. Instead, we estimated a series of separate models, each with one assessed attribute or summary score as the main independent variable.
Past research [49], practitioner experience, and the spatial patterns apparent in Figure 2 all suggested the possibility of spatial clustering of not only fire outcomes but also many of the assessed attributes. We tested and found strong evidence for spatial dependence in whether structures were destroyed (Moran test χ2 = 187.96, p < 0.001) and in data for seven of the 12 assessed attributes (last column of Table 1). Thus, we estimated relationships using a series of spatial Durbin models [50], given by:
y = α + β X + W X γ + ρ W y + ϵ ϵ ~ N ( 0 , σ 2 I n )  
In all models, the dependent variable was defined as y = 1 if the assessed structure was destroyed and y = 0 otherwise (although the binary outcome variable suggests that a logit or probit specification would be more appropriate, the theory and implementation of a spatial Durbin logit/probit model is not well established. Regarding the main limitation of the linear probability model approach, Woodridge [51], (p. 455) notes, “…If the main purpose is to estimate the partial effect of [the independent variable] on the response probability, averaged across the distribution of [the independent variable], then the fact that some predicted values are outside the unit interval may not be very important.” See Table S4 for a comparison of an ordinary versus logistic regression for all attributes in the dataset, without controlling for spatial effects). Each model included: a constant for the intercept ( α ); a slope ( β ) multiplied by a sole independent variable ( X ) (corresponding to the numerical score for one of the twelve assessed attributes shown in Table 1 or the five summary scores shown in Table 2); a spatial weights matrix ( W ), calculated as the inverse-distances among the centroids of all assessed structures; a spatial lag ( γ ) for the weighted independent variable W X ; a spatial lag ( ρ ) for the weighted dependent variable ( W y ); and an error term ( ϵ ) consisting of a normally distributed mean-zero disturbance with constant variance ( σ 2 ) multiplied by the n -dimensional identity matrix ( I n ), where n is equal to the number of observations.
We estimated models in Stata/SE 16.0 (any use of trade, firm, or product names is for descriptive purposes only and does not imply endorsement by the U.S. Government) using the spregress command, employing the generalized spatial two-stage least-squares estimator and treating errors as heteroskedastic. Because of the spatial relationships, parameter estimates for the spatial Durbin model do not have straightforward interpretations and only make intuitive sense in terms of combined effects. Accordingly, we reported and focused on the estimated impacts, as defined by LeSage and Pace [52], which summarize the average marginal effects of the independent variable on the reduced form mean and are calculated with the estat impacts command in Stata. The reported impacts included direct impacts, which report the average of the own-marginal effects of the independent variable; indirect impacts, which report the average of the spillover effects of the independent variable, and total impacts, which are the sum of the other two and thus of primary interest. That is, direct impacts reflect the average of the effects of each property’s attributes directly on whether that property’s own structure was destroyed, ignoring any spillover effects across properties. Indirect impacts can be interpreted as reflecting the average of either the spillover from one property’s attribute upon the outcomes for all its neighbors or the spillover from all of a property’s neighbors’ attributes upon the outcome for that property. As the sum of direct and indirect impacts, total impacts thus reflect the average overall effect of a property’s attributes on whether that property’s structure was destroyed, accounting for the interactions amongst neighbors.

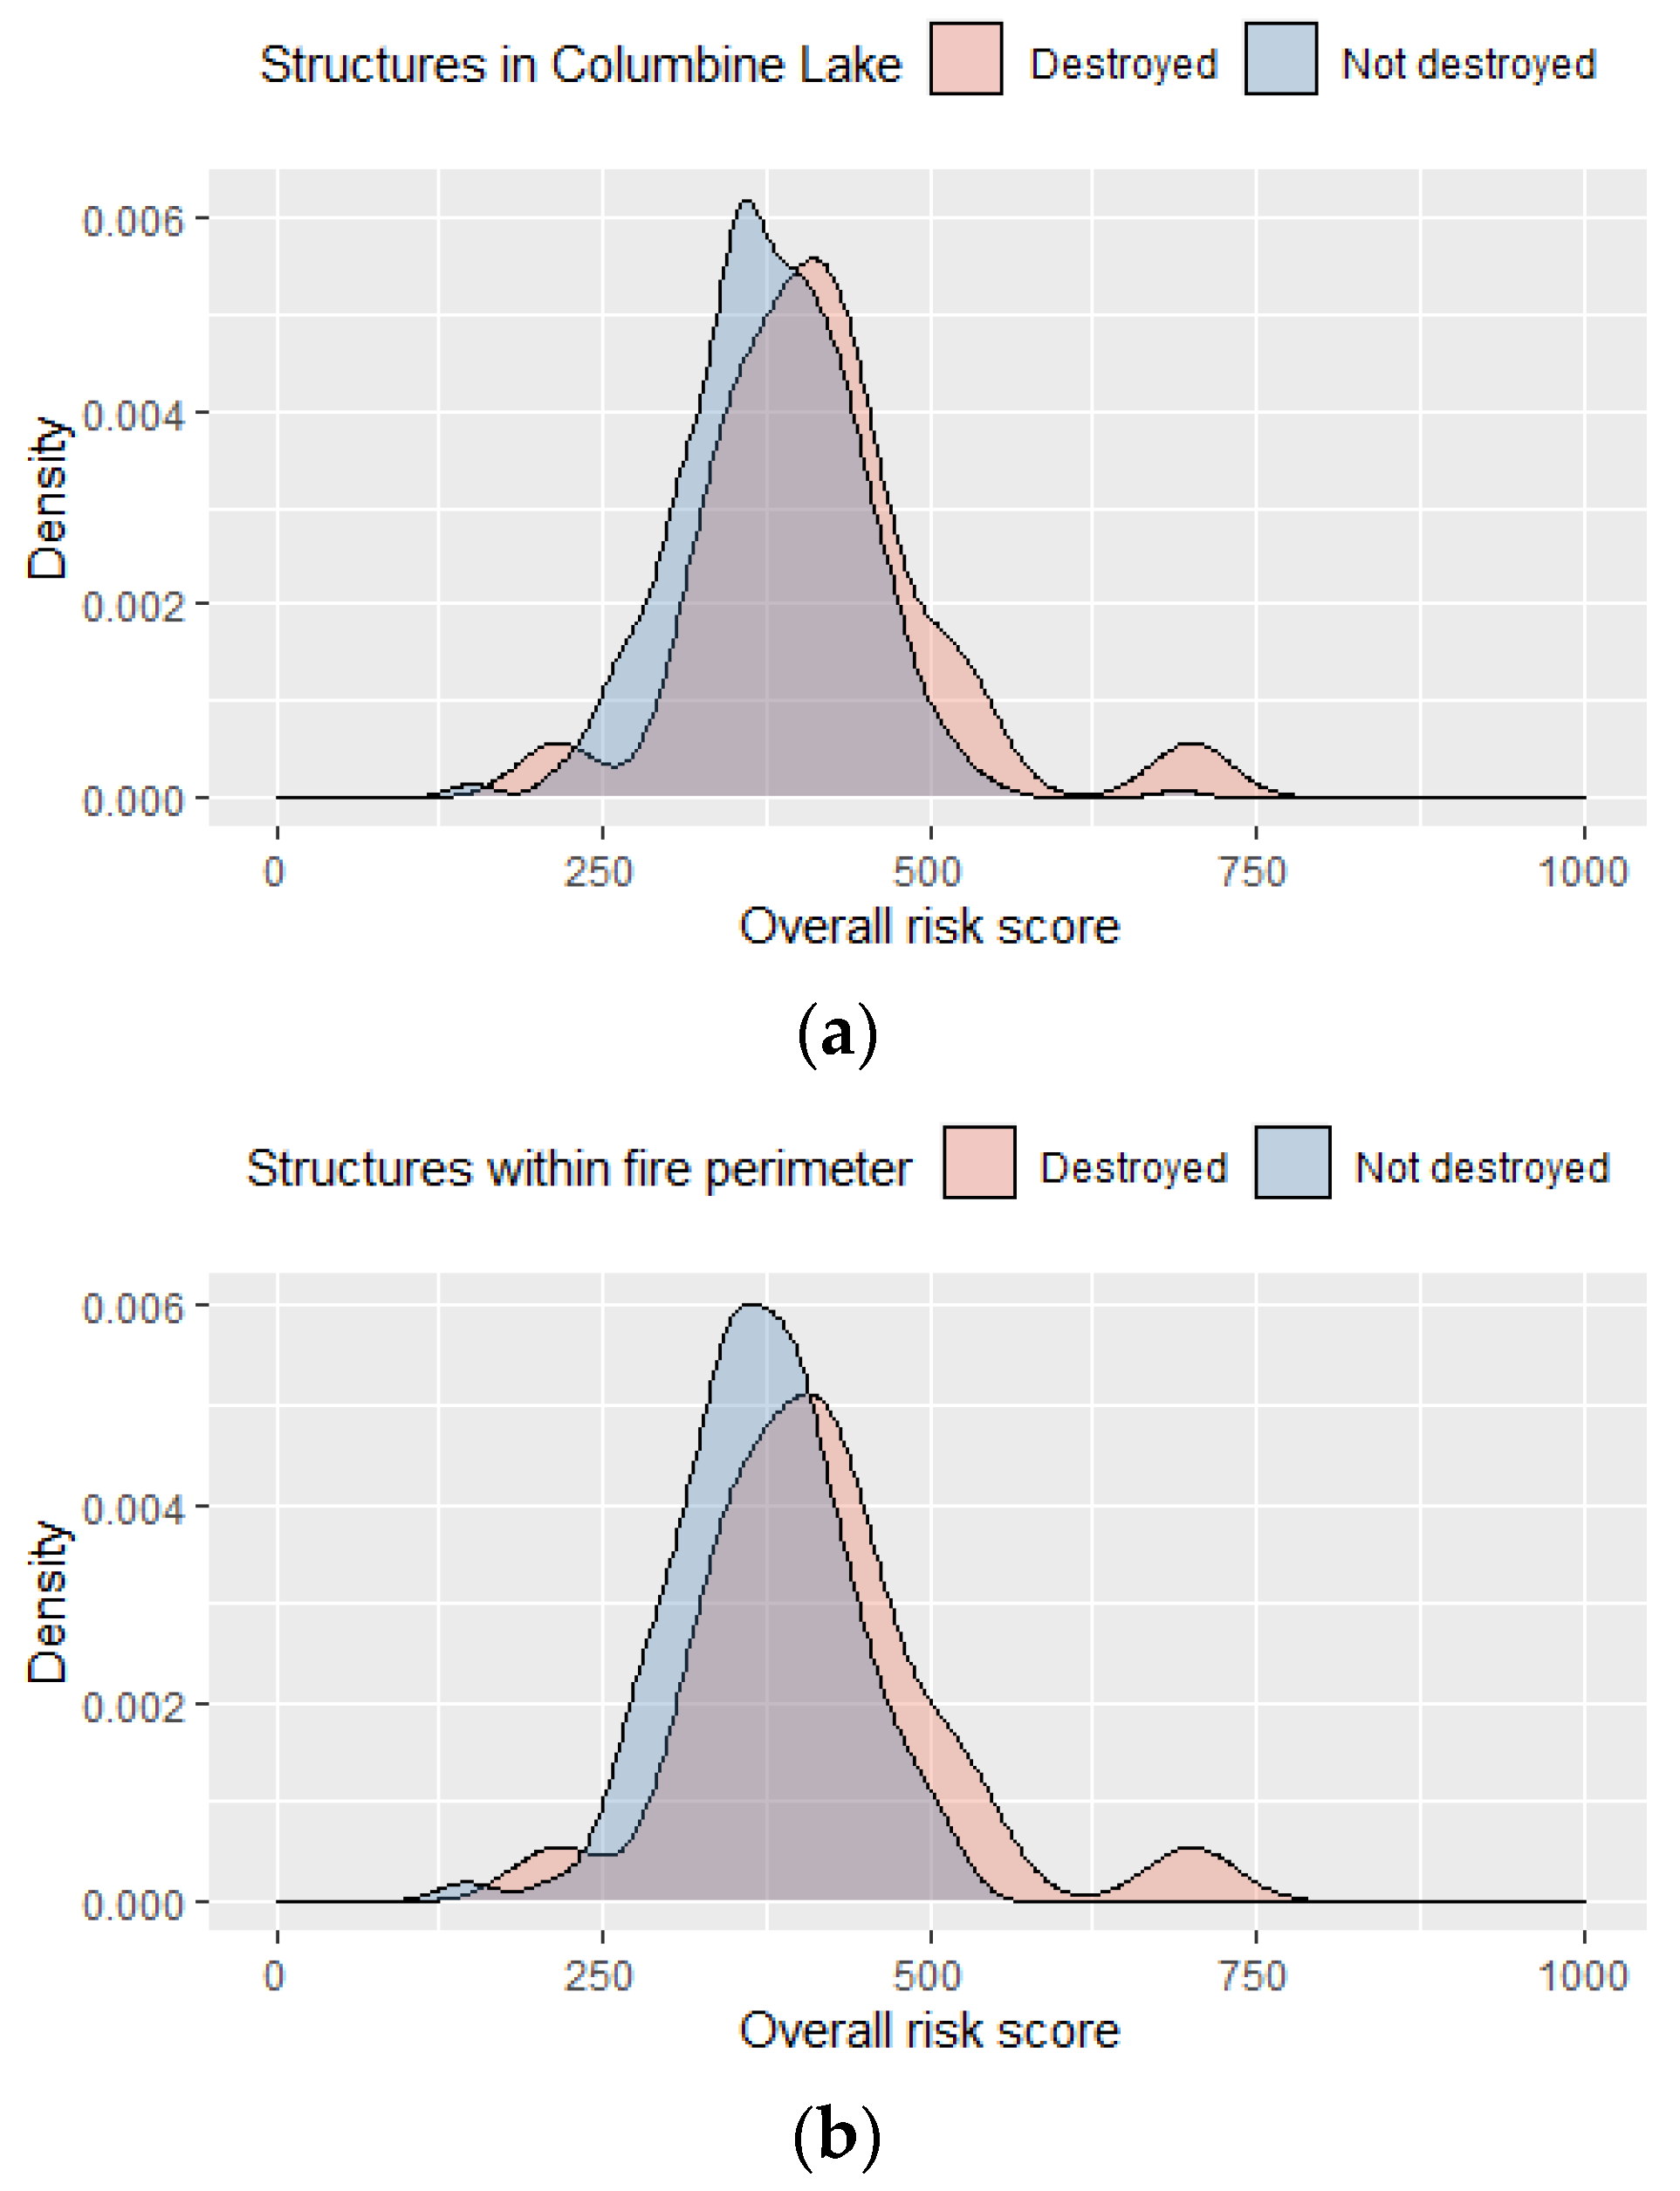
4. Results: Risk Assessment Data Help Explain Destroyed Structures

In this section, we investigate the relationships between WiRē RA data and whether homes in the Columbine Lake community were destroyed by the East Troublesome Fire using the modeling approach described above. Table 3 and Table 4 show the results for seventeen separate spatial Durbin models for structures in the Columbine Lake community with complete assessments.
Table 3 reports estimated parameters for each model. In all models, the coefficient on the spatial lag on the dependent variable ( W y ) is large, positive, and strongly significant, consistent with the spatial clustering of structures that were lost and with the possible effect of structures acting as a source of fuel and increasing the hazard to their neighbors during the event. The strong significance of the spatial lag on the independent variable ( W X ) in nearly all models provides further support for estimating spatial effects with the spatial Durbin model.
That said, as described above, coefficients on the independent variable ( X ) and its spatial lag ( W X ) cannot be separately interpreted in an intuitive way. Thus, we focus on the average impacts shown in Table 4 as our main results. Each row reports the average total impact, the average direct impact, and the average indirect impact, with the average estimated impact, standard error, and p-value shown for each measure. Impacts pertain to marginal effects, meaning that they describe the average change in the probability of the structure being destroyed for a 1-point change in the independent variable, calculated at the reduced form mean. As shown in Table 1, attribute ratings are scored anywhere from 5 to 300 points, depending on the attribute, such that higher points always pertain to higher expected risk.
Table 4 shows that eight of the twelve individual attributes measured by the WiRē RA are estimated as having positive and significant total impacts on the likelihood of a structure being destroyed. Strikingly, none of these variables are estimated as having significant direct impacts upon a given structure, whereas all of the assessed attributes with significant total estimates are estimated as having significant indirect impacts. Indirect impacts can be interpreted in two ways: the perspective from an observation, which relates to how a change in a single parcel influences the risk to all other structures, or the perspective to an observation, which relates to how changes in all other parcels influence a single parcel [52]. From either perspective, the results imply strong spillovers in risk across properties, in which the hazardous conditions on individual parcels play a large role in determining the risk to their neighbors as well as to themselves through the interactions of fire risk between structures.
Given the small sample size, the linear probability model specification, and the role of expert-assigned weights in determining parameter magnitudes, we focus primarily on the direction and significance of the estimated average total impacts for interpretation. Among the four variables for the parcel-level hazard (1–4), adjacent fuels and the distance to nearest home are estimated as positive and significant. Both defensible space attributes, pertaining to vegetation (5) or other combustibles near the home (6), have positive total effects on risk. Driveway clearance (8) and address visibility (9), two out of three attributes related to access, are positive and significant, as are both siding (11) and attachments (12) for the structure category. In addition, all five summary measures (13–17), including the overall risk score (variable 17), are also found to have a positive and significant total impact. The mean estimated impact of 0.0512 from the (scaled) overall risk score variable suggests an approximate 5% increase in the likelihood of a structure being lost for every 100-point increase in risk, with the result coming from the combined direct and indirect impacts. For further intuition, Figure 3 depicts the distributions of overall wildfire risk scores for structures destroyed versus not destroyed within the entire community (a) as well as within the fire perimeter (b). The figure suggests a meaningful relationship in both cases, with destroyed structures on average having higher overall risk scores.
Finally, Tables S5 and S6 replicate the main results of Table 4 for all available indicators or for binary indicators equal to 0 for attributes rated at the lowest risk level and equal to 1 otherwise, respectively. These results do not rely on the relative weights assigned for calculating the summary risk scores. Although nuanced differences exist, these replications demonstrate the general robustness of the implied linear response to the expert-judgment score values assigned to attribute levels. In particular, the results for the binary measures for the measured attributes, shown in Table S6, are quite strong and generally analogous to the main results of Table 4.

5. Discussion

The results suggest that the WiRē RA provides strong explanatory power for whether structures in the Columbine Lake community were destroyed in the East Troublesome Fire. The overall wildfire risk score from the WiRē RA strongly relates to whether a structure was destroyed. Because the summary risk score from the WiRē RA is explicitly constructed to represent overall PLR, this suggests that PLR meaningfully describes variation in wildfire risk across homes within a community. However, it is also notable that the distributions for overall risk scores overlap substantially for structures destroyed versus not destroyed, demonstrating that although the WiRē RA data provide insights for whether structures were destroyed by the fire or not, the results are far from deterministic. Some structures with relatively very low risk scores were destroyed in the fire, while other structures with relatively high risk scores were spared, and this is true both within the fire perimeter and across the entire community.
Given the additional attribute- or category-specific results discussed above, and the fact that results pertaining to the overall risk score rely on the subjective expert judgment of relative attribute weights, we maintain that a single summary measure of overall risk does not tell the entire story, but rather, it can mask important—and actionable—information. All four category-specific summaries have significant total impacts on the likelihood that a structure was destroyed in the East Troublesome Fire, suggesting that each of these four categories represents a relevant component of PLR. This suggests numerous points of entry for reducing PLR, including common recommendations related to defensible space and structural hardening as well as access considerations. Most of the individual attributes measured in the WiRē RA relate to whether structures were destroyed or not, offering nuanced insights. For example, one of the most common recommendations for reducing wildfire risk to a home is the maintenance of a defensible space around the home; however, details of recommendations vary. Recent guidance, e.g., [53], often emphasizes the importance of the nearest zone, within approximately 5 feet of the structure. Past research from other contexts found no measurable differences in risk reduction beyond about 100 feet [22] or 130 feet [35] from the home. Here, although our main results generally find increasing risk as the distance to dense or unmaintained vegetation decreases, the results estimated with separate indicator variables suggest similar increases in risk for any measured amount of defensible space less than the maximum observation of 150 feet. In other words, our results suggest that effective defensible space possibly extends to at least 150 feet from the structure. Our results also suggest the importance of removing other combustible items, including but not limited to flammable furniture, woodpiles, and propane tanks, from the vicinity of the home. Indeed, our binary-indicator model suggests a similar increase in the likelihood of a home being destroyed due to having less than 30 feet of distance between any such items and the structure as compared to having less than 150 feet of distance from maintained vegetation.
We also find strong evidence of the interdependence of risk among structures, in which the decisions made by one’s neighbors can affect the risk to one’s own property [49,54]. Evidence includes the significant impact of the proximity to the nearest home attribute, which is consistent with other research that found the distance between structures to be an important component of wildfire risk to homes, e.g., [29,31]. Evidence also comes from the spatial correlations in whether structures were destroyed, demonstrated robustly across all estimated models, which suggests that burned structures tend to be clustered. Further evidence for risk interdependencies comes from the significantly estimated average indirect impacts for many attributes, which signify risk spillovers in terms of the attributes’ influence on properties. This all underscores the importance of considering homes and other structures as not only recipients of fire, but also as drivers of wildfire behavior. These results also suggest important limitations for the applicability of landscape-level hazard models to a populated built environment, due in part to the practice of masking “urban” or “developed” pixels as “unburnable” terrain in the fuel models that underly such modeling [55,56].
In addition to missing heterogeneity in parcel-level hazard or the local fuel characteristics represented by the defensible space category, landscape-level models that treat all residential property the same neglect the heterogeneity in vulnerability that is driven by differences in access or structure characteristics. Our results are consistent with the expectations set by the literature reviewed above in demonstrating the value of structural hardening for reducing risk, such as having less vulnerable siding materials and avoiding combustible attachments such as decks, fences, or porches. We also find that two of the access-related attributes, driveway clearance and address visibility, have significant impacts on the likelihood that a structure was destroyed.
Because it cannot be assessed with post-fire data, the role of address visibility is worth considering further. Our models suggest that whether an address was visibly posted or not is significantly related to the likelihood that a structure was destroyed in the fire. As discussed above, it is quite plausible that address visibility supports a safe and effective response to a given property, and the strength of this result suggests value from further investigation. However, operational memory suggests that address visibility was not particularly important in the conditions of this fire, and thus this attribute might serve as a proxy for variation in risk reduction effort not otherwise reflected in the coarse measurements of the rapid assessment. For example, residents who increase their address visibility might also be more likely to remove debris from porches and gutters. Either way, this result suggests that small actions taken by residents can make a real difference in their wildfire risk. Further, these results reflect the potential importance of the complex dynamics of a wildfire event, such as the interactions between parcel-level characteristics and suppression decisions, in determining the realized wildfire risk.
Finally, decisions about wildfire risk mitigation actions are influenced by many factors that often interact in complex ways, including but not limited to risk perceptions, costs, and perceived effectiveness, e.g., [44,57,58,59,60]. Because rapid assessments represent parcel-level heterogeneity in risk within a community, rapid assessments can inform the development and implementation of programs that encourage or support these decisions. For example, an organization might decide to use rapid assessment data to prioritize properties for more time-intensive detailed site assessments or for more costly cost-share incentive programs. Of course, comprehensive parcel-scale assessments may face challenges for any given community in terms of practicality, cost-effectiveness, and coverage. Practitioners who are interested in utilizing such approaches must consider the tradeoffs involved in implementing such assessments and whether the benefits provided, in terms of the potential uses, warrant the financial and time costs to their organizations.

6. Conclusions

The WiRē RA conducted by GCWC in the summer of 2019 captured elements of the risk of a home being destroyed during the East Troublesome Fire of October 2020. Despite small sample sizes and the coarse measurements underlying the WiRē RA, the overall risk score constructed from the weighted sum of assessed attributes meaningfully depicts heterogeneity in the risk that the East Troublesome Fire presented to homes in the Columbine Lake community. Furthermore, seven out of the twelve attributes assessed in the original WiRē RA, including attributes from each of the four categories (i.e., parcel-level hazard, defensible space, access, and structure), help to explain which homes were destroyed. The results also support incorporating proximity to the nearest home into parcel-level wildfire risk assessment, as that attribute is also strongly related to the likelihood of whether a home was destroyed.
Thus, the parcel-level conditions described by the PLR conceptual model are important for understanding and communicating about wildfire risk to homes. These results are consistent with other recent works, e.g., [14,33,46], in arguing for the importance of conditions within the home ignition zone for understanding wildfire risk to homes. That said, this paper reports on an empirical analysis of a unique event; we do not claim that the attributes found to be meaningful here are the most important for reducing risks, nor that these results should supersede those found from other contexts, whether in terms of geographic, social, or fire conditions. In terms of generalization, the details of which specific attributes mattered in this case study are less important than the basic fact that some property-level attributes were found important. Since parcel-level characteristics as measured by the WiRē RA tool matter here, there is reason to believe they might matter in the next fire. These findings suggest that having this type of data for all parcels in a community could help community programs to identify where to start, or how best to prioritize resources, for reducing wildfire risk to homes and their residents.
Our results underscore that parcel-level variation is an important consideration for understanding risk to homes for homeowners, communities, fire managers, and policy makers. Indeed, our results suggest that parcel-level WiRē RA data offer insights not available from landscape-level hazard modeling outputs. In other words, landscape-level hazard information cannot replace detailed parcel-level information in terms of understanding wildfire risk to a home. This suggests the importance of working toward the greater integration of parcel-level variation in risk-related characteristics (i.e., about PLR) into existing landscape-level wildfire risk assessments. Given the robustness of the results on the distance between structures here and in the past literature, a promising first step could be more consistently including such a measure—assessed at the level of individual parcels, rather than simply as an average housing density measure—into broader-scale assessments.
The results also demonstrate the usefulness of rapidly collected, coarse data in representing a property’s wildfire risk. Measurement for the WiRē RA is imperfect, based on professional judgment with at most four levels for a given attribute, and conducted from the roadside to accommodate privacy concerns and resource constraints. The overall risk score is based on subjective expert judgment pertaining to the relative weights of different attributes. It is reasonable to ask whether such imperfect data are useful for planning or prioritization; our results suggest that they can be. As our results are robust to the use of binary versus expanded indicator variables for each attribute, future research might explore the potential for efficiency gains through further simplifying current approaches to parcel-level rapid wildfire risk assessment, such as employing binary rather than three- or four-leveled indicators.
That said, the lack of relationship found here of course does not imply that a variable might not be critically important in a different context. For example, numerous studies support the importance of noncombustible roofing materials for reducing risk despite the lack of observed importance in our case study—but only two assessed structures in our dataset had wooden roofs; one of them burned down and the other did not. Our estimation approach cannot overcome the limited support for many of the possible measurement levels in the rapid assessment. Most of our estimated average effect sizes are relatively low, reflecting the fact that numerous other considerations not represented by the data here also contribute to whether a home may be destroyed. As parcel-level rapid assessment data become more widely collected, there will likely be more opportunities to investigate the effectiveness of this type of data in representing wildfire risk to homes; we hope such unfortunate intersections of past data collection and hazardous events can be seized upon to reduce the social costs of wildfires.
Overall, this study finds that resident or homeowner actions matter for reducing wildfire risk to the home. While the resident of a property might have limited capacity to change conditions underlying a hazardous burn probability or conditional flame length rating, that same resident likely can influence many of the attributes measured by the WiRē RA. One of the many influential attributes in our model—address visibility—is also an easy, low-cost attribute to change. Furthermore, action at the parcel and community scales constitutes a critical piece of the story for assessing the full wildfire risk to homes, even though landscape-level wildfire hazard assessments might not be able to capture these efforts. As such, assessed risk levels should not be taken as given at the scale of an individual property; rather, residents can reduce their own risk, and that of their neighbors, by focusing on aspects of PLR over which they have some control. We hope such information empowers wildfire risk practitioners, and the residents they serve, to take meaningful actions to reduce the wildfire risk to homes and communities.

Supplementary Materials

The following supporting information can be downloaded at: https://www.mdpi.com/article/10.3390/fire5010024/s1, Table S1: Number of structures for which attributes were marked as “unobservable” in the Wildfire Research Risk Assessment (WiRē RA); Table S2: Replication of Table 4 using full dataset with unobservable attributes for structures coded as having the riskiest rating for that attribute instead of being coded as missing and dropped from subsequent analysis; Table S3: Replication of Table 4 constrained to structures within the burn perimeter; Table S4: Comparison of ordinary versus logistic regression for all assessed attributes (jointly modeled), without considering spatial effects; Table S5: Replication of Table 4 with full indicators for the levels of each attribute of a structure, rather than using the numerical score as an implied linear measure; Table S6: Replication of Table 4 with binary indicators for each attribute of a structure, coded to 0 for the lowest-risk level and 1 for all others, rather than using the numerical score as an implied linear measure; Figure S1: Assessor Reference Guide (ARG) developed for Grand County WiRē RA.

Author Contributions

Conceptualization, analysis, visualization: J.R.M.; methodology: J.R.M., C.M.B., S.K.O., A.C.G., H.B.-S., P.A.C., J.G.; writing—original draft preparation: J.R.M., J.B.G.; writing—review and editing: all. All authors have read and agreed to the published version of the manuscript. The findings and conclusions in this article are those of the authors; they do not necessarily represent the views of the USDA and should not be construed to represent USDA agency determination or policy.

Funding

This research was funded, in part, by USDA Forest Service, State and Private Forestry. Rapid assessment data and data on destroyed structures were funded by Grand County Wildfire Council with the support of the Fire Districts of Grand County.

Data Availability Statement

Rapid assessment data and data on destroyed structures are owned by Grand County Wildfire Council (https://bewildfireready.org/, accessed on 11 February 2022) with the support of the Fire Districts of Grand County and are available upon request; other data are available from NIFC [47] as described in the text.

Conflicts of Interest

The authors declare no conflict of interest. The funders had no role in the design of the study; in the collection, analyses, or interpretation of data; in the writing of the manuscript, or in the decision to publish the results. The Wildfire Research (WiRē) Center (https://wildfireresearchcenter.org, accessed on 11 February 2022) is a nonprofit organization that works with wildfire practitioners and collaborated with Grand County Wildfire Council for data collection; the author Brenkert-Smith is a member of the Wildfire Research (WiRē) Center Board, and the authors Meldrum, Champ, and Barth are on the Wildfire Research (WiRē) Advisory Committee.

References

  1. Gill, A.M.; Stephens, S.L. Scientific and social challenges for the management of fire-prone wildland–urban interfaces. Environ. Res. Lett. 2009, 4, 034014. [Google Scholar] [CrossRef]
  2. Schoennagel, T.; Balch, J.K.; Brenkert-Smith, H.; Dennison, P.E.; Harvey, B.J.; Krawchuk, M.A.; Mietkiewicz, N.; Morgan, P.; Moritz, M.A.; Rasker, R.; et al. Adapt to more wildfire in western North American forests as climate changes. Proc. Natl. Acad. Sci. USA 2017, 114, 4582–4590. [Google Scholar] [CrossRef] [PubMed] [Green Version]
  3. Moritz, M.A.; Batllori, E.; Bradstock, R.A.; Gill, A.M.; Handmer, J.; Hessburg, P.F.; Leonard, J.; McCaffrey, S.; Odion, D.C.; Schoennagel, T.; et al. Learning to coexist with wildfire. Nature 2014, 515, 58–66. [Google Scholar] [CrossRef]
  4. Radeloff, V.C.; Helmers, D.P.; Kramer, H.A.; Mockrin, M.H.; Alexandre, P.M.; Bar-Massada, A.; Butsic, V.; Hawbaker, T.J.; Martinuzzi, S.; Syphard, A.D.; et al. Rapid growth of the US wildland-urban interface raises wildfire risk. Proc. Natl. Acad. Sci. USA 2018, 115, 3314–3319. [Google Scholar] [CrossRef] [PubMed] [Green Version]
  5. Caggiano, M.D.; Hawbaker, T.J.; Gannon, B.M.; Hoffman, C.M. Building Loss in WUI Disasters: Evaluating the Core Components of the Wildland–Urban Interface Definition. Fire 2020, 3, 73. [Google Scholar] [CrossRef]
  6. Syphard, A.D.; Bar Massada, A.; Butsic, V.; Keeley, J.E. Land use planning and wildfire: Development policies influence future probability of housing loss. PLoS ONE 2013, 8, e71708. [Google Scholar] [CrossRef] [Green Version]
  7. Westerling, A.L.; Hidalgo, H.G.; Cayan, D.R.; Swetnam, T.W. Warming and earlier spring increase western U.S. forest wildfire activity. Science 2006, 313, 940–943. [Google Scholar] [CrossRef] [Green Version]
  8. Abatzoglou, J.T.; Williams, A.P. Impact of anthropogenic climate change on wildfire across western US forests. Proc. Natl. Acad. Sci. USA 2016, 113, 11770–11775. [Google Scholar] [CrossRef] [Green Version]
  9. Finney, M.A. The challenge of quantitative risk analysis for wildland fire. For. Ecol. Manag. 2005, 211, 97–108. [Google Scholar] [CrossRef]
  10. Thompson, M.P.; Calkin, D.E. Uncertainty and risk in wildland fire management: A review. J. Environ. Manag. 2011, 92, 1895–1909. [Google Scholar] [CrossRef]
  11. Scott, J.H.; Thompson, M.P.; Calkin, D.E. A Wildfire Risk Assessment Framework for Land and Resource Management; U.S. Department of Agriculture, Forest Service, Rocky Mountain Research Station: Fort Collins, CO, USA, 2013; p. 83.
  12. Sendai Framework for Disaster Risk Reduction 2015–2030; United Nations Office for Disaster Risk Reduction: Sendai, Japan, 2015; p. 32.
  13. Ludwig, K.A.; Ramsey, D.W.; Wood, N.J.; Pennaz, A.B.; Godt, J.W.; Plant, N.G.; Luco, N.; Koenig, T.A.; Hudnut, K.W.; Davis, D.K.; et al. Science for a Risky World—A U.S. Geological Survey Plan for Risk Research and Applications; U.S. Geological Survey: Reston, VA, USA, 2018; p. 57.
  14. Caton, S.E.; Hakes, R.S.P.; Gorham, D.J.; Zhou, A.; Gollner, M.J. Review of Pathways for Building Fire Spread in the Wildland Urban Interface Part I: Exposure Conditions. Fire Technol. 2016, 53, 429–473. [Google Scholar] [CrossRef]
  15. Syphard, A.D.; Rustigian-Romsos, H.; Keeley, J.E. Multiple-Scale Relationships between Vegetation, the Wildland–Urban Interface, and Structure Loss to Wildfire in California. Fire 2021, 4, 12. [Google Scholar] [CrossRef]
  16. FAC-LN. Promoting Fire Adapted Communities through Property Assessments: Data & Tools. Fire Adapted Community Learning Network: A Quick Guide for Community Leaders, Number 2.1. 2015, p. 2. Available online: https://fireadaptednetwork.org/wp-content/uploads/2015/12/FACQuickGuide2.1.pdf (accessed on 11 February 2022).
  17. Hakes, R.S.P.; Caton, S.E.; Gorham, D.J.; Gollner, M.J. A Review of Pathways for Building Fire Spread in the Wildland Urban Interface Part II: Response of Components and Systems and Mitigation Strategies in the United States. Fire Technol. 2016, 53, 475–515. [Google Scholar] [CrossRef]
  18. Quarles, S.L.; Valachovic, Y.; Nakamura, G.M.; Nader, G.A.; De Lasaux, M.J. Home Survival in Wildfire-Prone Areas: Building Materials and Design Considerations; Publication 8393; University of California Agriculture and Natural Resources: St. Davis, CA, USA, 2010; 22p. [Google Scholar] [CrossRef]
  19. Champ, P.; Barth, C.; Brenkert-Smith, H.; Falk, L.; Gomez, J.; Meldrum, J. Putting people first: Using social science to reduce risk. Wildfire Magazine. International Association of Wildland Fire, Missoula, MT, USA. 2021, pp. 30–34. Available online: https://www.iawfonline.org/article/putting-people-first-using-social-science-to-reduce-risk/ (accessed on 11 February 2022).
  20. Maranghides, A.; McNamara, D.; Mell, W.; Trook, J.; Toman, B. A Case Study of a Community Affected by the Witch and Guejito Fires: Report# 2: Evaluating the Effects of Hazard Mitigation Actions on Structure Ignitions; National Institute of Standards and Technology, US Department of Commerce and US Forest Service: Gaithersburg, MD, USA, 2013.
  21. Duff, T.J.; Penman, T.D. Determining the likelihood of asset destruction during wildfires: Modelling house destruction with fire simulator outputs and local-scale landscape properties. Saf. Sci. 2021, 139, 105196. [Google Scholar] [CrossRef]
  22. Syphard, A.D.; Brennan, T.J.; Keeley, J.E. The role of defensible space for residential structure protection during wildfires. Int. J. Wildland Fire 2014, 23, 1165–1175. [Google Scholar] [CrossRef]
  23. Dupuy, J. Slope and Fuel Load Effects on Fire Behavior: Laboratory Experiments in Pine Needles Fuel Beds. Int. J. Wildland Fire 1995, 5, 153–164. [Google Scholar] [CrossRef]
  24. Rodrigues, A.; Ribeiro, C.; Raposo, J.; Viegas, D.X.; André, J. Effect of Canyons on a Fire Propagating Laterally Over Slopes. Front. Mech. Eng. 2019, 5, 41. [Google Scholar] [CrossRef] [Green Version]
  25. Viegas, D.X.; Simeoni, A. Eruptive Behaviour of Forest Fires. Fire Technol. 2011, 47, 303–320. [Google Scholar] [CrossRef] [Green Version]
  26. Alexandre, P.M.; Stewart, S.I.; Keuler, N.S.; Clayton, M.K.; Mockrin, M.H.; Bar-Massada, A.; Syphard, A.D.; Radeloff, V.C. Factors related to building loss due to wildfires in the conterminous United States. Ecol. Appl. 2016, 26, 2323–2338. [Google Scholar] [CrossRef]
  27. Syphard, A.D.; Brennan, T.J.; Keeley, J.E. The importance of building construction materials relative to other factors affecting structure survival during wildfire. Int. J. Disaster Risk Reduct. 2017, 21, 140–147. [Google Scholar] [CrossRef]
  28. Graham, R.T. Hayman Fire Case Study; US Department of Agriculture, Forest Service, Rocky Mountain Research Station: Fort Collins, CO, USA, 2003.
  29. Penman, S.H.; Price, O.F.; Penman, T.D.; Bradstock, R.A. The role of defensible space on the likelihood of house impact from wildfires in forested landscapes of south eastern Australia. Int. J. Wildland Fire 2019, 28, 4–14. [Google Scholar] [CrossRef]
  30. Knapp, E.E.; Valachovic, Y.S.; Quarles, S.L.; Johnson, N.G. Housing arrangement and vegetation factors associated with single-family home survival in the 2018 Camp Fire, California. Fire Ecol. 2021, 17, 25. [Google Scholar] [CrossRef]
  31. Cohen, J.D.; Stratton, R.D. Home Destruction Examination: Grass Valley Fire, Lake Arrowhead, California; Technol Paper R5-TP-026b; US Department of Agriculture, Forest Service, Pacific Southwest Region (Region 5): Vallejo, CA, USA, 2008; 26p.
  32. Kolden, C.A.; Henson, C. A socio-ecological approach to mitigating wildfire vulnerability in the wildland urban interface: A case study from the 2017 Thomas fire. Fire 2019, 2, 9. [Google Scholar] [CrossRef] [Green Version]
  33. Cohen, J.D. Preventing disaster: Home ignitability in the wildland-urban interface. J. For. 2000, 98, 15–21. [Google Scholar]
  34. Alexander, M.E.; Stocks, B.J.; Wotton, B.M.; Flannigan, M.D.; Todd, J.B. The international crown fire modelling experiment: An overview and progress report. In Proceedings of the Second Symposium on Fire and Forest Meteorology, Phoenix, AZ, USA, 11–16 January 1998; pp. 20–23. [Google Scholar]
  35. Gibbons, P.; Van Bommel, L.; Gill, A.M.; Cary, G.J.; Driscoll, D.A.; Bradstock, R.A.; Knight, E.; Moritz, M.A.; Stephens, S.L.; Lindenmayer, D.B. Land management practices associated with house loss in wildfires. PLoS ONE 2012, 7, e29212. [Google Scholar] [CrossRef] [PubMed]
  36. Price, O.F.; Whittaker, J.; Gibbons, P.; Bradstock, R. Comprehensive Examination of the Determinants of Damage to Houses in Two Wildfires in Eastern Australia in 2013. Fire 2021, 4, 44. [Google Scholar] [CrossRef]
  37. Cova, T.J.; Theobald, D.M.; Norman, J.B.; Siebeneck, L.K. Mapping wildfire evacuation vulnerability in the western US: The limits of infrastructure. GeoJournal 2013, 78, 273–285. [Google Scholar] [CrossRef]
  38. Cova, T.J. Public safety in the urban–wildland interface: Should fire-prone communities have a maximum occupancy? Nat. Hazards Rev. 2005, 6, 99–108. [Google Scholar] [CrossRef]
  39. McGee, T.K.; McFarlane, B.L.; Varghese, J. An examination of the influence of hazard experience on wildfire risk perceptions and adoption of mitigation measures. Soc. Nat. Resour. 2009, 22, 308–323. [Google Scholar] [CrossRef]
  40. Nelson, K.C.; Monroe, M.C.; Johnson, J.F. The Look of the Land: Homeowner Landscape Management and Wildfire Preparedness in Minnesota and Florida. Soc. Nat. Resour. 2005, 18, 321–336. [Google Scholar] [CrossRef]
  41. Li, D.; Cova, T.J.; Dennison, P.E.; Wan, N.; Nguyen, Q.C.; Siebeneck, L.K. Why do we need a national address point database to improve wildfire public safety in the U.S.? Int. J. Disaster Risk Reduct. 2019, 39, 101237. [Google Scholar] [CrossRef]
  42. Westhaver, A. Why Some Homes Survived: Learning from the Fort Mcmurray Wildland/Urban Interface Fire Disaster; Institute for Catastrophic Loss Reduction: Toronto, ON, Canada, 2017. [Google Scholar]
  43. Quarles, S.L.; Standoher-Alfano, C.D. Wildfire Research: Ignition Potential of Decks Subjected to an Ember Exposure; Insurance Institute for Business & Home Safety: Richburg, SC, USA, 2018; p. 39. [Google Scholar]
  44. Quarles, S.; Pohl, K. Costs of WUI Codes and Standards for New Construction. In Encyclopedia of Wildfires and Wildland-Urban Interface (WUI) Fires; Manzello, S.L., Ed.; Springer International Publishing: Cham, Switzerland, 2020; pp. 1–11. [Google Scholar]
  45. Benjamini, Y.; Hochberg, Y. Controlling the False Discovery Rate: A Practical and Powerful Approach to Multiple Testing. J. R. Stat. Soc. Ser. B 1995, 57, 289–300. [Google Scholar] [CrossRef]
  46. Calkin, D.E.; Cohen, J.D.; Finney, M.A.; Thompson, M.P. How risk management can prevent future wildfire disasters in the wildland-urban interface. Proc. Natl. Acad. Sci. USA 2014, 111, 746–751. [Google Scholar] [CrossRef] [PubMed] [Green Version]
  47. InciWeb. East Troublesome Fire Information. Available online: https://inciweb.nwcg.gov/incient/7242 (accessed on 12 October 2020).
  48. NIFC. Interagency Fire Perimeter History—All Years. National Interagency Fire Center (NIFC). 2021. Available online: https://data-nifc.opendata.arcgis.com/datasets/nifc::interagency-fire-perimeter-history-all-years/about (accessed on 11 February 2022).
  49. Warziniack, T.; Champ, P.; Meldrum, J.; Brenkert-Smith, H.; Barth, C.M.; Falk, L.C. Responding to Risky Neighbors: Testing for Spatial Spillover Effects for Defensible Space in a Fire-Prone WUI Community. Environ. Resour. Econ. 2018, 73, 1023–1047. [Google Scholar] [CrossRef]
  50. Anselin, L. Spatial Econometrics: Methods and Models; Kluwer Academic Publishers: Boston, MA, USA, 1988; p. 284. [Google Scholar]
  51. Wooldridge, J.M. Econometric Analysis of Cross Section and Panel Data; MIT Press: Cambridge, MA, USA, 2002. [Google Scholar]
  52. LeSage, J.; Pace, R.K. Introduction to Spatial Econometrics; CRC Press: New York, NY, USA, 2009. [Google Scholar]
  53. CSFS. The Home Ignition Zone: A Guide to Preparing Your Home for Wildfire and Creating Defensible Space; Colorado State University: Fort Collins, CO, USA, 2021; p. 15. [Google Scholar]
  54. Butry, D.; Donovan, G.H. Protect thy neighbor: Investigating the spatial externalities of community wildfire hazard mitigation. For. Sci. 2008, 54, 417–428. [Google Scholar]
  55. Scott, J.H.; Burgan, R.E. Standard Fire Behavior Fuel Models: A Comprehensive Set for Use with Rothermel’s Surface Fire Spread Model; U.S. Department of Agriculture, Forest Service, Rocky Mountain Research Station: Fort Collins, CO, USA, 2005; p. 72.
  56. LANDFIRE. LANDFIRE 1.4.0 Scott and Burgan Fire Behavior Fuel Models (FBMF40) and Existing Vegetation Type (EVT) layers. 2017. Available online: https://landfire.gov/ (accessed on 11 February 2022).
  57. Sisante, A.M.; Taylor, M.H.; Rollins, K.S. Understanding homeowners’ decisions to mitigate wildfire risk and create defensible space. Int. J. Wildland Fire 2019, 28, 901. [Google Scholar] [CrossRef]
  58. Meldrum, J.R.; Brenkert-Smith, H.; Champ, P.; Gomez, J.; Falk, L.; Barth, C. Interactions between resident risk perceptions and wildfire risk mitigation: Evidence from simultaneous equations modeling. Fire 2019, 2, 46. [Google Scholar] [CrossRef] [Green Version]
  59. Paveglio, T.B.; Stasiewicz, A.M.; Edgeley, C.M. Understanding support for regulatory approaches to wildfire management and performance of property mitigations on private lands. Land Use Policy 2021, 100, 104893. [Google Scholar] [CrossRef]
  60. Ghasemi, B.; Kyle, G.T.; Absher, J.D. An examination of the social-psychological drivers of homeowner wildfire mitigation. J. Environ. Psychol. 2020, 70, 101442. [Google Scholar] [CrossRef]
Figure 1. Conceptual model of parcel-level risk (PLR) that shows wildfire risk to homes and residents parsed into hazard and vulnerability (gold); actions that can reduce risk by addressing its components (light blue); and categories useful for a parcel-level wildfire risk assessment such as the WiRē RA (green). PLR is embedded within broader-scale contexts (light green with dashed lines) that influence risk to homes and residents but are typically not measured at scales sufficiently refined for capturing relevant parcel-level variation.
Fire 05 00024 g001
Figure 2. Map of East Troublesome Fire perimeter [48] and structures in the community of Columbine Lake, Grand Lake, CO that were assessed by Grand County Wildfire Council in 2019 and either destroyed (red) or not (blue) in the East Troublesome Fire. Inset shows the location within Colorado. Basemap image is the intellectual property of Esri and is used herein under license. Copyright © 2022 Esri and its licensors. All rights reserved.
Fire 05 00024 g002
Figure 3. Comparison of the distribution of overall risk score for structures with complete assessments that were destroyed (orange) versus not destroyed (blue) in the East Troublesome Fire, for the entire community of Columbine Lake, Grand Lake, CO (a) and within the fire perimeter (b).
Fire 05 00024 g003
Table 1. Description of attributes collected in the Wildfire Research (WiRē) Rapid Assessment and descriptive statistics for structures in the Columbine Lake community, Grand Lake, CO, with complete assessments, by whether structures were destroyed in the East Troublesome Fire or not. Shading depicts grouping of attributes into categories (i.e., 1–4: parcel-level hazard; 5–6: defensible space; 7–9: access; 10–12: structure).
Attribute Name and DescriptionAttribute LevelsPointsNot
Destroyed
(n = 329)
Destroyed (n = 23)Moran Test
p-Value
1: Distance to hazardous topography
Distance from residence to ridge, steep drainage, or narrow canyon
More than 150 feet087.8%91.3%<0.001
Between 50 and 150 feet258.2%8.7%
Less than 50 feet504.0%0.0%
2: Slope
Overall slope of the property near the residence
Gentle—Less than 20%081.8%100.0%<0.001
Moderate—Between 20% and 45%1017.3%0.0%
Steep—Greater than 45%200.9%0.0%
3: Adjacent fuels
Dominant vegetation on the property and those properties immediately surrounding it
Light—Grasses100.6%0.0%<0.001
Medium—Light brush and/or isolated trees2075.7%87.0%
Dense—Dense brush and/or dense trees4023.7%13.0%
4: Distance to nearest home
Closest distance to a neighboring residence
More than 100 feet01.8%0.0%<0.001
Between 30 and 100 feet5059.3%47.8%
Between 10 and 30 feet10035.6%39.1%
Less than 10 feet2003.3%13.0%
5: Defensible space (vegetation)
Distance to overgrown, dense, or unmaintained vegetation
More than 150 feet010.3%8.7%<0.001
Between 31 and 150 feet5043.5%52.2%
Between 10 and 30 feet7533.4%13.0%
Less than 10 feet10012.8%26.1%
6: Defensible space (other combustibles) Distance to other combustible items (e.g., lumber, firewood, propane tank, hay bales)More than 30 feet030.4%13.0%0.694
Between 10 and 30 feet4045.3%43.5%
Less than 10 feet8024.3%43.5%
7: Ingress/egress
Roads available in case one is blocked
Two or more roads in/out062.9%60.9%<0.001
One road in/out1037.1%39.1%
8: Driveway clearance
Width of the driveway at the narrowest point
More than 26 feet wide09.4%4.4%0.881
Between 20 and 26 feet wide531.6%34.8%
Less than 20 feet wide1059.0%60.9%
9: Address visibility
Visibility of house number at the end of the driveway
House number is visible and reflective08.5%4.4%<0.001
House number is visible but not reflective536.8%34.8%
House number is not visible1054.7%60.9%
10: Roof material
Most vulnerable roofing material
Tile, metal, or asphalt shingles099.7%95.7%0.436
Wood (shake shingles)3000.3%4.4%
11: Siding material
Most vulnerable siding material
Noncombustible (e.g., stucco, brick, stone)02.7%0.0%0.223
Log or heavy timbers3513.4%21.7%
Wood or vinyl siding7083.9%78.3%
12: Attachments
Combustible items attached to structure
No balcony, deck, porch, or fence05.8%8.7%0.444
Combustible balcony, deck, porch, or fence10094.2%91.3%
Table 2. Description of summary scores calculated from the Wildfire Research (WiRē) Rapid Assessment and statistics (mean, Moran Test p-value) for structures in the Columbine Lake community, Grand Lake, CO with complete assessments, by whether structures were destroyed in the East Troublesome Fire or not. A Benjamini–Hochberg procedure [45] suggests that only p-values of p < 0.001 on this table (bolded) are significant after adjusting for multiple comparisons with an assumed 10% false discovery rate.
Attribute Name and DescriptionAttribute LevelsNot
Destroyed (n = 329)
Destroyed (n = 23)Moran Test
p-Value
13: Category score: Parcel-level hazardSum of points for attributes 1 through 4102.5113.90.166
14: Category score: Defensible spaceSum of points for attributes 5 and 697.1114.10.064
15: Category score: AccessSum of points for attributes 7 through 918.919.60.672
16: Category score: StructureSum of points for attributes 10 through 12158.5166.70.644
17: Overall risk scoreSum of points for attributes 1 through 12277.1414.3<0.001
Table 3. Coefficients estimated for 17 separate spatial Durbin models, one for each independent variable listed, of whether a structure was destroyed (y) as a function of the independent variable from the Wildfire Research (WiRē) risk assessment (RA) for structures with a complete assessment (n = 352; y   ¯ = 0.07). Shading depicts grouping of attributes into categories (i.e., 1–4: parcel-level hazard; 5–6: defensible space; 7–9: access; 10–12: structure). A Benjamini–Hochberg procedure [45] suggests that all p-values of p = 0.077 or less on this table (bolded) are significant after adjusting for multiple comparisons with an assumed 10% false discovery rate.
y = 1 If Structure Destroyed;
y = 0 Otherwise
n = 352
Constant (α)Independent
Variable (X)
Spatial Lag on
Independent
Variable (WX)
Spatial Lag on
Dependent
Variable (Wy)
coef.std.err.p > |z|coef.std.err.p > |z|coef.std.err.p > |z|coef.std.err.p > |z|
1: Distance to hazardous topography−0.1490.0530.005−0.00150.00080.0770.01780.01100.1042.4730.470<0.001
2: Slope0.0000.0310.998−0.00240.00170.155−0.02010.01670.2291.6540.337<0.001
3: Adjacent fuels0.5060.112<0.001−0.00050.00110.635−0.02610.0054<0.0013.0360.448<0.001
4: Distance to nearest home0.2530.065<0.0010.00040.00040.273−0.00620.0013<0.0013.6700.584<0.001
5: Defensible space (vegetation)0.3480.1240.0050.00070.00050.138−0.00830.0023<0.0012.3920.410<0.001
6: Defensible space (other combustibles)0.3040.085<0.0010.00060.00040.101−0.01290.0028<0.0013.5500.575<0.001
7: Ingress/egress0.1420.0620.0210.00860.00260.001−0.05800.01770.0011.5450.334<0.001
8: Driveway clearance0.4030.095<0.0010.00140.00280.607−0.07490.0150<0.0013.1250.471<0.001
9: Address visibility0.3030.0930.0010.00690.00330.038−0.06470.0147<0.0012.7380.465<0.001
10: Roof material−0.0330.0130.0110.00130.00110.239−0.01420.00680.0361.9420.443<0.001
11: Siding material0.4390.116<0.001−0.00010.00080.922−0.00910.0018<0.0013.0360.491<0.001
12: Attachments0.4190.105<0.001−0.00030.00060.584−0.00580.0012<0.0013.2090.484<0.001
13: Category score: Parcel-level hazard0.3370.082<0.0010.00020.00030.572−0.00510.0011<0.0013.5470.546<0.001
14: Category score: Defensible space0.3370.1120.0030.00060.00030.071−0.00540.0013<0.0012.9690.466<0.001
15: Category score: Access0.3560.1050.0010.00340.00150.019−0.02850.0060<0.0012.6110.411<0.001
16: Category score: Structure0.3350.1260.0080.00050.00060.425−0.00350.0007<0.0013.1690.479<0.001
17: Overall risk score (100 points)0.2840.1200.0180.03660.02160.090−0.15250.0311<0.0013.2600.502<0.001
Table 4. Impacts estimated from 17 separate spatial Durbin models, one for each independent variable listed, of whether a structure was destroyed (y) as a function of the independent variable from the Wildfire Research (WiRē) risk assessment (RA) for structures with a complete assessment (n = 352; y ¯ = 0.07). Shading depicts grouping of attributes into categories (i.e., 1–4: parcel-level hazard; 5–6: defensible space; 7–9: access; 10–12: structure). A Benjamini–Hochberg procedure [45] suggests that all p-values of p = 0.021 or less on this table (bolded) are significant after adjusting for multiple comparisons with an assumed 10% false discovery rate.
y = 1 If Structure Destroyed; y = 0 Otherwise
n = 352
Total ImpactDirect ImpactIndirect Impact
dy/dxstd.err.p > |z|dy/dxstd.err.p > |z|dy/dxstd.err.p > |z|
1: Distance to hazardous topography−0.01150.00600.053−0.00030.01610.987−0.01130.01700.508
2: Slope0.02860.03070.352−0.00270.00180.1310.03130.02940.287
3: Adjacent fuels0.01320.0023<0.0010.00030.00520.9590.01290.00420.002
4: Distance to nearest home0.00220.0003<0.0010.00040.00060.4960.00180.0004<0.001
5: Defensible space (vegetation)0.00570.00180.0020.00050.00080.5240.00520.00180.004
6: Defensible space (other combustibles)0.00490.0011<0.0010.00090.00210.6900.00410.00150.005
7: Ingress/egress0.08130.05870.1660.00830.0024<0.0010.07300.05920.218
8: Driveway clearance0.03470.0060<0.0010.00200.00530.7060.03270.0063<0.001
9: Address visibility0.03400.0075<0.0010.00670.00410.1040.02730.00870.002
10: Roof material0.02860.22000.8970.00230.01530.8790.02620.20470.898
11: Siding material0.00460.0010<0.0010.00020.00210.9260.00440.00190.021
12: Attachments0.00270.0005<0.001−0.00030.00070.6490.00310.0009<0.001
13: Category score: Parcel-level hazard0.00200.0005<0.0010.00030.00100.7690.00170.00060.007
14: Category score: Defensible space0.00250.0007<0.0010.00110.01400.9360.00140.01350.919
15: Category score: Access0.01600.0040<0.0010.00380.00250.1280.01220.00410.003
16: Category score: Structure0.00140.0004<0.0010.00050.00060.4190.00090.00090.305
17: Overall risk score (100 points)0.05120.0120<0.0010.03630.02220.1010.01490.03210.643
Publisher’s Note: MDPI stays neutral with regard to jurisdictional claims in published maps and institutional affiliations.

