
Assessing Wildfire Exposure to Communities and Protected Areas in Portugal
by
 ,
,
Fermin Alcasena
1,* ,
,
Alan Ager
2, 
Yannick Le Page
3,
Paulo Bessa
3,
Carlos Loureiro
3 and
Tiago Oliveira
3 1
USDA Forest Service, International Visitor Program, College of Forestry, Oregon State University, 321 Richardson Hall, Corvallis, OR 97331, USA
2
USDA Forest Service, Rocky Mountain Research Station, Missoula Fire Sciences Laboratory, 5775 US Highway 10W, Missoula, MT 59808, USA
3
AGIF, Agência de Gestão Integrada de Fogos Rurais, Rua Professor Gomes Teixeira 2, 1350-249 Lisboa, Portugal
*
Author to whom correspondence should be addressed.
Fire 2021, 4(4), 82; https://doi.org/10.3390/fire4040082
Submission received: 24 September 2021
/
Revised: 29 October 2021
/
Accepted: 31 October 2021
/
Published: 2 November 2021
(This article belongs to the Special Issue Wildfire Management in Increasing Complex Socio-Ecological Environments: Needs and Challenges)
Abstract
:During the 2017 wildfire season in Portugal, unprecedented episodes burned 6% of the country’s area and underscored the need for a long-term comprehensive solution to mitigate future wildfire disasters. In this study, we built and calibrated a national-scale fire simulation system including the underlying fuels and weather data and used the system to quantify wildfire exposure to communities and natural areas. We simulated 10,000 fire season replicates under extreme weather to generate 1.6 million large wildfire perimeters and estimate annual burn probability and fire intensity at 100 m pixel resolution. These outputs were used to estimate wildfire exposure to buildings and natural areas. The results showed a fire exposure of 10,394 structures per year and that 30% of communities accounted for 82% of the total. The predicted burned area in natural sites was 18,257 ha yr−1, of which 9.8% was protected land where fuel management is not permitted. The main burn probability hotspots were in central and northern regions. We highlighted vital priorities to safeguard the most vulnerable communities and promote landscape management programs at the national level. The results can be useful to inform Portugal’s new national plan under implementation, where decision-making is based on a probabilistic methodology. The core strategies include protecting people and infrastructure and wildfire management. Finally, we discuss the next steps necessary to improve and operationalize the framework developed here. The wildfire simulation modeling approach presented in this study is extensible to other fire-prone Mediterranean regions where predicting catastrophic fires can help anticipate future disasters.
1. Introduction
Extreme wildfires pose an increasing threat to people, property, and natural resources in Mediterranean areas [1,2,3,4]. Most European countries are now developing comprehensive fire management strategies, with a particular focus on increasing suppression capacity and installing strategic fuel treatments [5,6]. In Portugal, the 2017 wildfire season motivated the government to develop a cohesive strategy after a record-breaking area burned (557,4000 ha), thousands of destroyed structures, over €1456.3 million in economic losses to human assets, and more than 120 fatalities [7,8,9]. The fire weather index (FWI) values exceeded 75 in much of mainland Portugal and sustained wind speed over 25 km h−1 plus extreme 1-h fuel moisture content values between 3 and 6 for several hours [8]. These weather conditions triggered spread rates reaching 4000 ha h−1 during the fire growth peak in the most catastrophic Pedrógão Grande fire [10]. Many of the large fire events occurred around rural communities where an aging population has limited capacity to respond and adapt to extreme wildfire events [11].
Besides the recent extreme weather events, the rapid fuels buildup since the 1960s is also a primary driver behind catastrophic wildfires in Portugal and the European Mediterranean areas. The highly fragmented cultural landscapes evolved into a dense forest continuum that resulted from rural population exodus, extensive afforestation efforts to grow commercial softwood, farmland abandonment, and livestock confinement [12,13,14,15,16]. The suburban sprawl around city centers expanded into the surrounding agricultural plains [17,18], and rapid-growing conifer species and shrublands invaded abandoned olive groves, vineyards, small arable land parcels, and grasslands [19]. Likewise, large areas of human-shaped open woodlands known as montados or dehesas evolved into a mixture of scrubland and dense coppice forests [20,21]. Meanwhile, fire suppression policies removed fire from these fire-adapted landscapes, allowing fuels to accumulate. Historically, fire growth was limited by previous burned patches created by low-intensity lightning and pastoral fires [22]. These combined factors created urban development areas that closely intermingle with hazardous vegetation [23,24].
The policy response to the growing threat of wildfires in Portugal is the National Integrated Fire Management Plan developed by the Agency for Integrated Rural Fire Management (AGIF) and passed by the Portuguese congress [25]. The plan is a blueprint for implementing a 2020 to 2030 fuel management program to reduce wildfire exposure [6]. Information and decision support systems are a crucial component of the plan, including risk assessment and landscape scenario planning for fuel management. The budget was established at M€7000, and currently more than 97 projects are being planned with the extensive engagement of public and private entities. These include five Regional and 23 Sub-Regional projects, primarily fuel treatment mosaics or linear fuel break networks designed with local stakeholders. However, the national program mandates that after 2023 more than 70% of decision-making about further investments will be technically supported by probabilistic risk modeling and scenario planning.
To support the implementation of the Portuguese national plan with specific respect to risk assessment and scenario analyses, we built and tested a fire simulation system and demonstrated its use to assess wildfire exposure to communities and natural sites in mainland Portugal. The project evolved from prior collaborative work among US and Portuguese coauthors that demonstrated the utility of fire simulation in designing fuel break networks [26]. Related work in Portugal has analyzed empirical data to identify risk causative factors, characterized the weather conditions associated with extreme events, assess the human-caused wildfire occurrence, predict the fire effects in burned forest ecosystems, and assess susceptibility at the national level [27,28,29,30,31]. However, none of this descriptive research provides an analytical framework to test the effect of fuel treatment on risk and exposure and conduct tradeoff analyses to compare different investment strategies. First, we used stochastic fire modeling methods to simulate large numbers of fires and generate a 100 m resolution annual burn probability and flame length maps to assess exposure across mainland Portugal. Then, we used the outputs to predict the incidence of future catastrophic events’ location, magnitude, and potential short-term fire effects. Finally, the simulated fires were intersected with rural communities and natural sites to map fine-scale exposure to developed areas. We discuss how the modeling system provides a core decision support tool to advance risk assessment and scenario analysis as part of the fire management plan implementation in Portugal.
2. Materials and Methods
2.1. Study Area
Continental Portugal extends over 88,889 km2 and is located on the western side of the Iberian Peninsula. Most of the population is in the northwestern coastal belt of the country, and the metropolitan areas of Lisbon, Coimbra, Braga, and Porto concentrate more than half the country’s population (~5.27 million). The northern mountainous orography with closed and deep valleys contrasts with the south’s smooth terrain and extensive open plains. This topographic division is traced by the Tagus River, which also delineates the primary climatic separation between the warm-summer Mediterranean north (Köppen class Csb) and the hot-summer Mediterranean south (Köppen class Csa). Likewise, the coastal area presents milder winter and higher moisture levels than the colder and dryer inner lands due to the proximity and influence of the Atlantic Sea. Forest (39.1%) and shrublands (12.4%) are the dominant land cover types in the northern portions and cover more than half of the country [32]. The conifer forests (Pinus pinaster Aiton. and Pinus pinea L.) and Eucalyptus globulus Labill. plantations are the main forest types in coastal sites and northern areas. Inner mountainous areas present a mosaic of grasslands and shrublands with deciduous forests of Quercus pyrenaica Willd. and Castanea sativa Mill. The complex agricultural patterns of olive groves and vineyards cover about 8% of the country and concentrate in some valleys such as the Douro and Mondego. Agricultural areas cover 26.1% of Portugal, locate in open landscapes, and occasionally intermix with Quercus suber L. and Quercus ilex L. open woodlands.
Portugal has the highest wildfire activity in Europe, along with the neighboring area of Galicia in Spain [33,34,35,36]. On average, some 18,345 fires in Portugal annually burned about 138,841 ha during 2009 to 2018 years [37], 0.2–6% of the area per year. Still, the bulk of the fire is concentrated in a relatively small portion (~10%) located in the central and northern regions, where 905,932 ha have been burned at least twice in the last 30 years (i.e., average fire recurrence interval < 15 years) [28,38].
2.2. Human Communities and Built-Up Areas
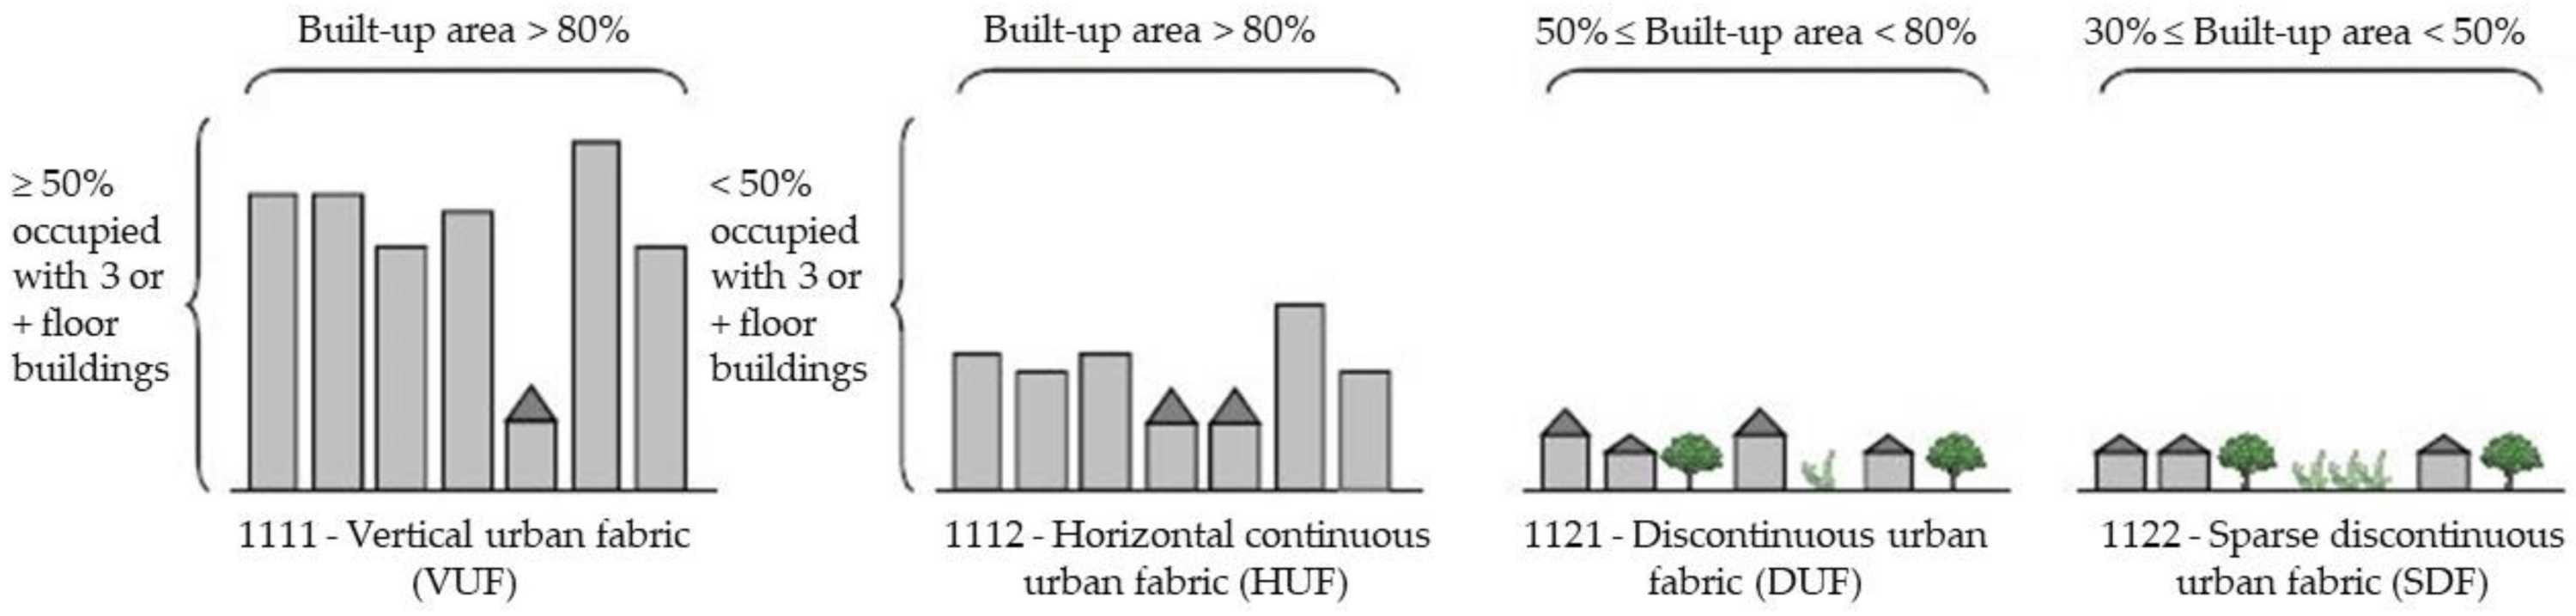
Mainland Portugal is administratively divided into 278 municipalities or concelhos, ranging between 794 and 171,922 ha, and 32,031 ha on average. These are 2 to 6 times smaller in the northern areas where the valleys are enclosed within mountain ridges. The concelho is the minimum administrative division for the community protection plan implementation in Portugal. In addition, these communities are then internally subdivided into neighborhoods or freguesias (n = 2883). We gathered the community core areas that concentrated on the bulk of structures from Portugal’s 2018 land cover map [32]. The main built-up classes include: (i) predominantly vertical continuous urban fabric (VUF) where buildings with a height of three or more floors occupy at least 50% of the plot (985 structures km−2); (ii) predominantly horizontal continuous urban fabric (HUF) where buildings with a height of fewer than three floors occupy at least the 50% of the area of the plot (1329 structures km−2); (iii) discontinuous urban fabric (DUF) where residential housing buildings are predominant and occupy between the 50, and 80% of the plot and the rest includes cultivated land (759 structures km−2); and (iv) sparse discontinuous urban fabric (SDF) where developed area covers 30–50% of the area (441 structures km−2) (Appendix A). Other developed classes were industrial (IND; 170 structures km−2), commercial (COM; 110 structures km−2), and agricultural infrastructure (AGR; 141 structures km−2) facilities. While we gathered the structure density data in residential areas from the national residential building dataset [39], we populated the non-residential buildup units with the average density data sampled from large areas in each of the 18 districts of Portugal. Finally, we compared these density values with the empiric exposure for the 2017 Pedrógão Grande as a validation test, which resulted in 1,043 structures and a very close estimate to the sum of the 1045 damaged and destroyed structures [7].
2.3. Protected Natural Sites
We used the 2021 version of nationally designated protected areas in Portugal to identify the natural sites of particular interest [40]. Decree-Law 142/2008 and the EU Habitats and Birds Directives regulate these protected areas, establishing the Natura 2000 network of nature protection areas (92/43/EEC). Natura 2000 is the core of EU nature and biodiversity policy created to assure the long-term survival of Europe’s most valuable and threatened species and habitats. The different designation classes in protected sites included national parks, nature reserves, protected landscapes, and natural monuments. Moreover, we also included private protected areas. In total, we have 109 protected sites covering 12,197 km2, about 14% of mainland Portugal. The potential management constraints were determined based on IUCN classes [41], where classes I and II are non-manageable lands, III and IV classes are manageable for habitat conservation and restoration purposes, and V and VI are considered manageable for risk reduction treatments as long as the forest cover is preserved. We selected the most restrictive class in the protected sites with multiple protected area designations. The protected sites with IUCN classes in different areas were deemed to be separate units in this study.
2.4. Wildfire Simulation Modeling
We used the minimum travel time algorithm (MTT) [42] as implemented in the FConstMTT command line version to model fire growth in Portugal. The MTT algorithm calculates a two-dimensional fire growth by searching for the set of pathways with minimum fire spread times from the cell corners at an arbitrary resolution set by the user. Then, the fire spread is predicted using Rothermel’s surface fire spread model [43], and fire intensity (kW m−1) is converted to flame length (FL) using Byram’s equation [44]. The FConstMTT program has been extensively described and widely used in several fire-prone areas worldwide to model wildfire spread and behavior in large landscapes and assess wildfire exposure, transmission, and risk to valued resources and assets [26,45,46,47,48].
The landscape (LCP) input file was generated at 100 m resolution using a topography, surface fuel model and canopy metric raster grids [49]. The topography data included elevation, aspect, and slope grids derived from Portugal’s 25 m digital elevation model. We assigned standard fuel models to the 2018 land-cover map to generate the fuel model grid [50] (see Appendix B). The fuel model assignation was based on the dominant vegetation types (grass, low shrubs, high shrubs, and forest types), tree species (conifer, broadleaved, and evergreen oaks), and recent disturbances such as the 2017 wildfires. We gathered the canopy cover grid from the 2018 Copernicus tree cover map [51]. The canopy base height and bulk density values were derived from the latest National Forest Inventory data and corresponded to the average conditions observed for the dominant forest types [52]. The fire modeling domain LCP was extended 15 km over the Spanish border to consider the transboundary fire exchange between the neighboring areas in Spain.
We assumed extreme-fire weather conditions to model fire spread (99th percentile), such as those conditions described during Portugal’s 2017 catastrophic wildfire season [8]. The study area was divided into different macro-areas (n = 14 pyro regions; Figure 1A) to capture the changing weather conditions in terms of the most frequent winds (i.e., wind direction and speed scenarios) observed in the fire season accounting for the bulk of the burned area (Table 1). The fire-weather wind conditions were derived from ERA5-Land reanalysis grids of Portugal for the 2001 to 2019 period (Table 2) [53]. This way, modeled fire-growth patterns developed from the weather conditions associated with the fire ignition location macro-area. The fire ignitions were distributed within the modeling domain based on the large fire (>100 ha) annual ignition density grid. We implemented the Moran’s I test to determine the spatial autocorrelation by distance [54] and selected the bandwidth distance within the modeling domain where the fire ignition clustering is most pronounced (p-value < 0.01; 99% confidence level). The grid was smoothed at 100 m from 2001 to 2015 ignition locations in Portugal and Spain [55,56] using a 20 km fixed bandwidth [57].
First, we calibrated the fire spread model to replicate the observed large fire size distributions across Portugal (Figure 1B–D) by adjusting the fire spread duration and combining multiple fire sets with different duration (see Appendix C). The long-duration observed wildfires were decomposed in daily blow-up events (i.e., the most significant fire runs) for the calibration because weather conditions are constant during fire modeling in FConstMTT. Suppression efforts were not considered due to their limited containment capabilities during extreme fire events. Consecutive days with the same weather conditions were counted as a single event. The required number of fire ignitions was determined from the annually burned area in the different macro-areas (Table 2). Then, we saturated the fire modeling domain with thousands of fires that burned more than 97% of the pixels at least once and more than 150 times on average. The intrinsic uncertainty of results caused by the input randomness, such as a fire ignition location, was minimized by modeling a burned area equivalent to more than 10,000 years at 100 m resolution.
The modeling outputs included the fire perimeters attributed with the fire size (FS) and fire ignition coordinates, and wildfire likelihood and intensity grids derived from the overlap of the modeled burned areas. We calculated the annual burn probability as [58]:
where the aBP is the annual burn probability grid, nxy is the number of times the xy-th pixel gets burned from surface fire or landing embers, and Y is the number of modeled years (n = 10,000). The aBP is a wildfire likelihood estimate with values ranging between 0 and 1. This represents the probability of getting burned in the next year from fires ignited within the modeling domain under extreme weather conditions. Given the current fire exclusion policy, only a few extreme fires escape the initial attack and pose the highest threat to natural protected sites and human communities.
On the other hand, we calculated the probability-weighted fire intensity as [49]:
where CFL is the conditional flame length (m), FLPi is the flame length probability of a fire at the i-th flame length category, and FLi is the flame length (m) midpoint of a 0.5 m flame length 20-bin i-th category FIL fire intensity level. The CFL computes all the fire front spreading directions and the respective probabilities at a given pixel (i.e., heading, flanking, and backing) and proxy of wildfire hazard. It describes the potential for loss given a fire burns a valued resource or asset and allows for assessment of the fire suppression capabilities under the extreme weather conditions assumed to model wildfire behavior in this study [1,59].
2.5. Wildfire Exposure Analysis
The wildfire exposure assessment is essential for prioritizing fuel treatment projects and comparing different wildfire management scenarios in vast areas [59]. First, we intersected the outputs with protected natural sites and human communities to calculate the average aBP, CFL, FS, and FS by natural area or individual community. We also determined the average large fire (>100 ha) size from ignition location coordinates. Then, we estimated the burned area per year for each natural site and the number of exposed structures in each community. These results were used to generate cumulative exposure charts and summarize urban fabric built-up land-cover classes in communities and IUCN classes in protected natural sites. We considered polygon-level structure density values and a homogeneous distribution within units to assess exposure in developed areas. Next, we calculated the exposure ratio as:
where the Er is the exposure ratio in each community, with values ranging between 0 to 1, aBP is the annual burn probability for the i-th pixel, ni is the number of structures in the i-th pixel, and nT is the total number of structures located in areas with 50% or more burnable fuels cover within the community. In the natural sites, the Er is relative to the size or extent, and the value determines the annually burned area, i.e., how much is burned on average as a percentage. The Er provides a normalized exposure value relative to the number of structures within each community or the extent of the protected site and allows for comparison of the magnitude of potential fire impacts between distant communities with a variable number of structures [45]. We did not compute house-to-house transmission and wildfire exposure from showering embers due to the exceedingly high computing requirements and lack of individual structure location data for the whole nation.
Moreover, we used three indicators to provide a broad vision of the different communities’ social vulnerability and adaptation capacity, including population census, socioeconomic data, and civil protection resources [11]. The vulnerability indicators were then assembled with exposure ratios to detect the communities in Portugal requiring special risk mitigation efforts. First, we considered the percentage of the population over 65 as the primary census indicator due to the growing problem of the rural exodus (INE, 2011). Second, we used the average purchasing power per capita as the socioeconomic indicator of each municipality referred to the country’s total, while the proportion of purchasing power takes the value 100% (INE, 2017). Third, we considered the number of firefighters integrated into a fire department, professionals or volunteers, whose primary duty is to prevent and suppress wildfires and protect human lives and property (INE, 2019).
Finally, we described the average fire intensity and fire recurrence interval burning in the natural sites by IUCN class. These two metrics explain the fire-regime conditions and help better understand the potential long-term benefits of reintroducing unplanned fires in landscape management plans. Likewise, this analysis provides a preliminary assessment of the restoration needs for generating fire-resilient natural ecosystems. High hazard areas with a fire deficit may present the highest intervention needs with fuel treatments such as prescribed fires. See the methodological flowchart of exposure assessment in Appendix D for further details.
3. Results
3.1. Wildfire Likelihood and Intensity
The output maps for CFL and annual BP maps presented complex patterns across Portugal (Figure 2). While the fire intensity values are essentially the result of the interaction between spread direction, the slope of the terrain, fuel types, and weather conditions, the annual burn probability map represents the fire frequency of burned pixels. The finely grained and intricated fire intensity patterns indeed contrasted with the smooth and clumpy annual burn probabilities. Remarkably, the high aBP values clustered on high overall CFL areas, but large portions with high CFL values presented shallow aBP values. Moreover, the difference between the lowest and highest value areas was more significant in the annual burn probability than in the conditional flame length. The maximum values peaking over 0.2 in high fire frequency areas were up to 40 times higher than vast areas presenting the lowest values. The highest fire intensity values (>3 m) corresponded to high fuel load shrublands and forest types predominantly located in southern-southwestern facing steep slopes, which present the same orientation as the dominant wind directions (Table 1). These are the areas where we might expect higher severities and the most substantial losses. On the other hand, we obtained the lowest fire intensity values (<1 m) in grassland and low shrublands that intermixed with agricultural complex patterns in central Portugal’s coastal areas and valley bottoms showed. Conversely, the forest types burned by flanking and backing fires located in the highest fuel moisture intricate areas showed the lowest fire intensity values in the northern portions.
Not surprisingly, the annual burn probability values presented the highest values (>0.15) in north and central Portugal (Figure 2B). While the high aBP values showed broad extended patterns in central areas, these values concentrated as scattered hot spots in the north. Conversely, the lowest aBP values were in the southwestern inner parts, where the highest local values barely surpassed 0.02. The cultivated land patterns of non-burnable agricultural areas and large rivers explain these low aBP values despite dry and severe weather conditions. Interestingly, a high wildfire occurrence did not necessarily correlate with a high wildfire likelihood, as found in previous studies conducted in other fire-prone Mediterranean areas [60]. See, for instance, the many places in central Portugal where the historic ignition density was not necessarily high compared to most northern areas, but where the aBP is the highest in the country (Figure 1 vs. Figure 2B). Finally, we compared the burned areas by macro-area and community to validate the predicted burn probability grid (Figure 2B). The empiric burned areas were determined with the fire perimeters of the last 35 years. While the modeled results by macro-area replicated the actual values (Figure 3A), we found some community-level outliers (Figure 3B). These local differences in communities were mainly associated with the self-limiting effect of recently burned lands during the recent episodes (Figure 3C).
The average CFL and aBP values in communities and natural sites emphasized the vast existing differences between and among the northern, central, and southern areas (Figure 4A,B). Again, these results highlighted that a high wildfire likelihood does not necessarily connote a high hazard. Likewise, the variability between the different sites and communities regarding the average aBP was many times higher than in CFL. While the central areas presented the highest overall exposure (i.e., high CFL and high aBP), northern areas presented a higher aBP than southern areas, and southern regions showed a higher CFL than the areas of the north (Figure 4A,B). Overall, the variability between community-level average values (Figure 4A) showed a lower variability than in natural sites (Figure 4B). This difference is especially evident in CFL, where the highest values surpassed 2.5 m in multiple protected sites. Not surprisingly, the limited or nonexistent management in many protected areas resulted in very high fire intensity values (CFL > 3.5 m).
Concerning the FS, we found that modeled frequent fires (>0.001 ignitions yr−1 km−2) of less than 1000 ha resulted in the main wildfire likelihood causative factors in the north, which differed from the central regions where rare and much larger fires account for most of the burned area (Figure 4C,D). This contrast evidence how the wildfire exposure profiles can help inform the most suitable risk reduction strategies. While the fire ignition prevention or the cultural fire use regulation (e.g., pastoral burns) in the northern mountainous areas would be likely to reduce overall wildfire likelihood, the central areas emphasize the need for implementing broad-scale fuel reduction programs. Curiously, the highest average fire size values were located in the south due to better accessibility in open plains and highly efficient suppression of small fires (e.g., rapid initial attack), plus a lower frequency (<0.001 ignitions yr−1 km−2) of fires larger than 1000 ha.
3.2. Wildfire Exposure to Communities
The average predicted wildfire exposure in Portugal was 10,394 structures per year and varied widely within and among the different communities (Figure 5). Overall, northern and central inner areas clustered the highest predicted exposure levels, with values ten times higher than in most southern communities (Figure 5A). These communities are located in regions with aBP values over 0.02 (Figure 2B). While 44% of communities showed a low exposure (<10 str. yr−1), the top 20% of communities concentrated 70% of the total (Figure 6A). Interestingly, the densely populated coastal areas did not present high exposure values except for specific locations in southern Portugal. The main reason is that cultivated agricultural patterns in the northern coastal regions offer substantial discontinuity and restrict the large fire spread. On the other hand, the exposure ratios showed smoother patterns except for a few rural communities located in remote central and northern mountainous areas with exposure ratio values over 10%, the highest values in the country (Figure 5B). Curiously, spatial patterns for wildfire likelihood (Figure 2B) were similar to community exposure ratios (Figure 5B). This similarity is because most rural communities’ buildup areas locate in open lands surrounded by grassland and pastures.
The dispersed urban development (DUF) was the land cover concentrating the highest exposure in Portugal (52%; Figure 6B). Other development types with substantial exposure levels included the predominantly horizontal continuous urban fabric (HUF) and sparse discontinuous urban fabric (SDF), with 33% and 11% annual exposure. The remaining land-use developed classes such as industrial (IND), agricultural (AGR), and commercial (COM) types showed a total yearly exposure of less than 5%. These results agreed with previous studies conducted in fire-prone areas since most wildfire exposure concentrated in areas with large numbers of scattered structures intermingle with wildland or forest lands [45,61,62,63].
Social vulnerability charts showed that many communities would present a limited capacity to prepare, adapt, and respond to extreme wildfire events (Figure 6C,D). The most vulnerable communities were predominantly located in rural areas where more than 30% of the population’s age is over 65, and purchasing power is between 58% and 82% of the national average. These communities generally have less than 1000 structures and limited firefighting resources. Overall, a lower purchasing power was associated with a higher percentage of the population over 65 and a higher exposure ratio. Surprisingly, most communities with a purchasing power higher than the national average presented much more meager exposure ratios (<0.01; Figure 6C). On the other hand, although the number of firefighters was lower in communities with fewer structures, this did not correlate with exposure ratios, which varied significantly between communities with similar structure numbers and firefighters (Figure 6D).
3.3. Wildfire Exposure in Protected Areas
Predicted wildfires burned 18,257 ha per year of natural protected sites in Portugal. As expected, central and northern protected areas showed the highest exposure, where the largest units showed exposure values over 500 ha per year (Figure 7A). The annually burned area in these high exposure sites was between 2 and 10% (Figure 7B). Nonetheless, some protected areas in southeastern Portugal also presented exposure values with annually burned areas of about 2%. On the other hand, the lowest values corresponded to the southern-inner and northeastern natural sites, with a 0.5% or even lower annually burned area representing less than 30 ha per year on each unit. Thus, except for some small units, total exposure and exposure ratios presented similar geospatial gradients. These results may provide a valuable assessment to assess the wildfire deficit (or surplus) based on the different forest ecosystems in the protected natural sites [64].
The most highly protected natural sites representing 30% of the area contained 75% of the total exposure (Figure 8A). Conversely, the less exposed 25% of the natural sites barely accounted for 1% of annually burned area. As with the wildfire exposure in communities (Figure 6A), cumulative exposure charts highlighted the high concentration of most exposure in a reduced portion of the landscape. Previous works conducted in other fire-prone Mediterranean areas also found that most exposure was concentrated in a reduced part of the landscape [48,65]. Interestingly, most exposed areas were manageable land classes, while less than 10% corresponded to non-manageable protected land (Figure 8B). From this result, we can extrapolate that some 16,066 ha per year burned in manageable lands where thinning and prescribed fire treatments would likely play a key role in reducing expected losses. Only a minor portion of exposure of about 2% is in sites where the management is restricted to habitat restoration and conservation efforts.
Fire intensity and frequency presented variable results between the different IUCN classes (Figure 8C,D). Between 60–70% of the burned area corresponded to high and very high-intensity values (>1.5 m). These results agreed with recent fires occurring in Portugal, where most sites burned with high and very high severities during the most recent catastrophic fires [13]. Remarkably, the non-manageable IUCN class II presented the highest burned area for medium and low fire severities (<1.5 m), where fires may not pose a threat to fire-dependent forest ecosystems. On the other hand, the highest severity fires (flame length > 3 m) burned the larges areas in class III (26%), where restricted restoration treatments may not be sufficient to reverse the potential adverse fire effects. Regarding the average fire recurrence interval for the modeled burned area, the fire frequency varied notably between the various classes (Figure 8D). Class VI presented the most frequent fire recurrence interval, where 94% burned at most every 30 years. In contrast, class III showed the most extended average intervals between fires (i.e., the class with a frequency over 60 years on average burned 90%).
4. Discussion and Conclusions
Landscape managers and policymakers are increasingly advocating for a paradigm shift towards coexisting with fire [12,66,67] by creating resilient landscapes, fire-adapted communities, and safe and efficient fire suppression [66,67,68]. Consistent with these goals, the European Union approved the Green Deal strategy for building a changing climate-resilient society and natural ecosystems while preventing the adverse effects of weather-driven unprecedented fires is a core concern in the Mediterranean areas [69]. Furthermore, the EU Biodiversity Strategy for 2030 encourages habitat and natural ecosystem restoration, which, along with a biobased economy promoted in the EU Forest strategy for 2030, can assist in adapting Mediterranean areas to more severe and frequent wildfires [70]. However, a coherent risk assessment methodology and tools to map probabilistic exposure and risk to support these plans do not exist except for a few fire-prone Mediterranean areas [44,45,48]. To address this gap, we built and tested a wildfire modeling framework to assess exposure in Portugal as a tool to inform the national wildfire management plan in order to reduce risk and adapt to future wildfires. The results illustrated how simulation modeling could be used as a decision support tool as in other fire prone regions and countries [47].
Wildfires have been coevolving with human-altered landscapes in the Mediterranean for millennia. Still, the recent rapid fuels buildup combined with changing climate has catalyzed a new fire regime with an extended long-tail distribution that includes extreme events not observed in the historical record [62,71]. Given that the main drivers of extreme fire events are only going to accelerate in the future, a paradigm shift to a proactive response will be needed to help predict future fire disasters and design a sustainable wildfire risk reduction plan [12,66]. This study provides the foundation for risk planning and designing mitigation strategies that include fuel management, suppression strategies, and additional long-term land management policies to reverse recent trends in fuels. Specifically, the predicted results included wildfire likelihood and hazard maps, plus exposure profiles for community and protected natural sites. These can guide investment efforts in Portugal over a range of scales from national to individual parishes, where site-specific fuel management strategies are designed and implemented. Nonetheless, bringing these results to an operational level would require integrating the maps in a user-friendly system so local- to national-scale wildfire managers can easily explore various management options.
In addition, we complemented this analysis with socioeconomic vulnerability data to detect most at-risk rural areas for implementing plans aimed at creating fire-adapted communities. Likewise, we associated burning fire intensity and frequency levels with the management restrictions in the natural protected areas, which may help elaborate a national transition from hazardous landscapes to fire-resilient natural sites. We found that about 75% of annual exposure concentrated on a reduced portion of less than 30% of Portugal’s area. Targeting these areas with fuel management and other community protection investments can help optimize risk reduction efforts. However, ignoring these clear spatial priorities could potentially dilute available resources in vast landscapes where reduced management intensities (i.e., randomly scattered fuel treatments) may likely result in ineffective solutions to prevent extreme fire losses.
Simulation modeling studies have proved helpful for predicting the catastrophic events causing the most extensive threat and losses to property and natural values [62]. In the absence of simulation methods, previous studies have used fire occurrence models to predict wildfire likelihood in Mediterranean areas [28]. Still, the large fires spread for very long distances, and footprint patterns, and the potential risks do not always correlate with ignition probabilities [60]. Modeling burned areas for thousands of years using historically based ignition patterns under wildfire season weather scenarios allows prediction of the magnitude and likelihood of a fire burning on a given location [72,73]. Historic fires might provide valid overall burn probability value, but the number of available years is insufficient to map burn probability at the scale needed to inform management. Moreover, extreme fires are rarer, and simulation modeling is the only way to replicate the fire footprints resulting from the combination of ignition locations and all the potential fire-weather scenarios [46]. Most importantly, wildfire simulation modeling allows for assessing and comparing fuel reduction effects for different wildfire management scenarios that integrate competing objectives plus different treatment designs and intensities [48].
Despite the substantial efforts conducted in the EU for building a changing-climate resilient society and landscapes, the most prominent efforts to date have been reactive and focus on providing fast emergency response and post-fire recovery [74]. As a result, most mitigation funding is directed to fire-weather index forecasting and remote sensing fire monitoring during the wildfire season, and the primary root cause of extreme fires in Mediterranean areas is often dismissed (i.e., rural exodus and rapid fuels buildup on cultural landscapes) [75,76]. The new EU green deal and Common Agricultural Policies (CAPs) offer a unique opportunity to develop a long-term solution where active landscape management efforts present the core fundamental strategy. For instance, the EU Forests Strategy promotes a biobased economy that may effectively manage the forest overgrowth in Mediterranean areas [70]. In this sense, Portugal has a high biomass stock, and using chipped biomass as an alternative to fossil fuels in community heating systems can present a high potential for reducing landscape fuels [77]. The new CAP can also help reduce wildfire risk by preserving the remaining mosaic of small agricultural smallholdings in rural areas that are located on the frontline for fire protection [78]. These agricultural lands produce value-added products branded as protected designations of origin, such as locally produced olive oil and wines, which present strong positive externalities often dismissed outside the agricultural production context [70]. Other management solutions in line with the EU long-term strategies include promoting local livestock breeds adapted to extensive sustainable systems, which are essential for preserving existing grasslands and human-made open woodlands [79,80,81].
Heretofore, community risk has been assessed using many different proxies, including structure and population density maps coupled with a hazard proxy in surrounding lands [23,24,82,83,84,85]. Nonetheless, we proved that structure density plus a hazard does not necessarily correlate with the number of exposed structures per year. Other studies have integrated historical fire ignition and burned area to measure wildfire likelihood [61,86,87,88]. Still, recently exposed communities would not present a higher short-term likelihood as the self-limiting effect of recently burned areas would restrict fire growth. Our exposure assessment could inform future fuel management plans for communities in terms of (i) timing and treatment revisiting preference based on burn probability, and (ii) preferential treatment locations within home ignition zone areas (i.e., 30 to 60 m buffer) according to fire intensity results [89]. Fire intensity outputs from the model can be used to delineate safe zones for firefighter safety areas and determine defensible space requirements in community-confinement locations during extreme events [90,91]. The creation of safety confinement areas may result in particular interest for rural communities with a high percentage of elderly where rapid evacuation is not feasible during extreme fire episodes. Planning the evacuation of a catastrophic fire requires complex analysis and training plus substantial communication efforts since most civilian fatalities often occur in entrapment episodes while escaping fires [92]. On the other hand, the purchasing power data provides a valuable insight into allocation of financial incentives at the national level for implementing fuel treatment programs in the most vulnerable areas.
The creation of large, protected areas accelerated the rewilding process in cultural landscapes because the essential human intervention required to prevent woody encroachment and preserve mosaic patterned land covers were usually misunderstood or neglected in their conception. Managing these sites now poses a significant challenge in fire-prone Mediterranean areas due to the existing environmental restrictions for reducing wildland fuels. Non-manageable protected lands (i.e., IUCN class II) represent a reduced portion of the landscape, and wildfire managers can often find alternative collocation opportunities with large-scale restoration plans [81]. For instance, extensive breeding systems have proved to be a sustainable way of preventing encroachment and preserving open grasslands and fuel breaks [93,94]. Other options for reducing fuels in non-manageable lands include the use of unplanned fires [95,96], although careful analysis and robust decision support systems are needed to determine appropriate weather conditions and the suitable areas where escape probabilities may pose a minimal threat to property and natural values [46,97]. Moreover, landscape restoration works, where possible (i.e., IUCN class IV), may be essential to preserve shrub-grassland mosaics and reduce hazardous fuels [98].
There are numerous limitations to the current study, although model validation showed good overall correspondence of the predicted and observed burned area at the community scale (Figure 3B). Although it was possible to translate standard fuel models associated with existing land cover maps [50], future work could refine the fuel models using local information. For instance, LiDAR-derived canopy metrics could be used to improve the estimation and mapping of canopy fuels which are key for predicting crown fires [99]. More accurate mapping of grassland types and their grazing regimes in northern rural communities would improve the assignment of the non-forest fuel models. For instance, northern areas had many of these fires (Figure 1B) that essentially burned the same slopes in mountainous regions several times. At the same time, the firefighting resources effectively protected the developed areas located in valley bottoms. Thus, our results may have overestimated the exposure data on the northern portions where the empiric exposure was lower. Moreover, using individual structure locations would provide a better exposure estimate than the polygon-level density data, where we assumed the uniform distribution of buildings within the developed units. The following steps include landscape management scenario planning and cost-efficiency analysis [48,100].
Author Contributions
Conceptualization, F.A. and A.A.; methodology, F.A.; software, A.A.; validation, F.A. and Y.L.P.; formal analysis, F.A. and Y.L.P.; investigation, F.A.; resources, A.A.; data curation, Y.L.P., P.B. and C.L.; writing—original draft preparation, F.A.; writing—review and editing, A.A., Y.L.P. and T.O.; visualization, F.A.; supervision, F.A.; project administration, A.A. and T.O.; funding acquisition, A.A. and T.O. All authors have read and agreed to the published version of the manuscript.
Funding
This research received no external funding.
Acknowledgments
We thank Stuart Brittain of Alturas Solutions for modifications to the fire behavior library for adaption to Portugal.
Conflicts of Interest
The authors declare no conflict of interest.
Appendix A. Urban Development Built-Up Classes and Structure Density
Figure A1.
Main urban development built-up classes. Source: [32].
Figure A1.
Main urban development built-up classes. Source: [32].

Table A1.
Developed land use land cover (LULC) classes and average structure density values in Portugal [32]. The density values were calculated for each polygon based on the national residential building dataset (1), derived from a sample of 18 sites (one per district) (2); or attributed as industrial (3) or isolated buildings (4).
| LULC (Code) | LULC (Name) | LULC (Abbreviation) | Area (km2) | Density (# str. km−2) | Density Estimation Data Source |
|---|---|---|---|---|---|
| 1121 | Discontinuous urban fabric | DUF | 1659.1 | 759 | 1 |
| 1112 | Predominantly horizontal continuous urban fabric | HUF | 795.0 | 1,329 | 1 |
| 1122 | Sparse discontinuous urban fabric | SDF | 398.7 | 441 | 1 |
| 1211 | Industrial | IND | 373.6 | 170 | 2 |
| 1512 | Mining sites | MIN | 157.1 | 170 | 3 |
| 1531 | Areas under construction | AUC | 87.0 | 170 | 3 |
| 1111 | Predominantly vertical urban fabric | VUF | 205.7 | 985 | 1 |
| 1231 | Agricultural facilities | AGR | 90.8 | 141 | 4 |
| 1612 | Sport facilities | SPR | 63.0 | 170 | 3 |
| 1651 | Tourism facilities | TUR | 132.2 | 170 | 3 |
| 1312 | Energy infrastructure | ENE | 11.5 | 170 | 3 |
| 1321 | Water depuration sites | WAT | 2.6 | 170 | 3 |
| 1522 | Dumpsters | DUM | 6.4 | 170 | 3 |
| 1431 | Airports | AIR | 27.0 | 170 | 3 |
| 1221 | Commertial sites | COM | 40.0 | 110 | 2 |
| 1622 | Recreation areas | REC | 7.5 | 141 | 4 |
| 1631 | Cultural sites | CUS | 11.2 | 170 | 3 |
| 1641 | Cemeteries | CEM | 9.5 | 170 | 3 |
| 1311 | Infrastructure for renewable energy production | IRE | 17.5 | 170 | 3 |
| 1131 | Parking areas and public areas | PAR | 11.1 | 18 | 1 |
| 1132 | Empty spaces under development | UDE | 35.7 | 26 | 1 |
| 1322 | Waste treatment and wastewater infrastructures | WTR | 15.9 | 170 | 3 |
| 1421 | Sea ports | POR | 8.9 | 170 | 3 |
| 1422 | Shipyards | SYR | 2.2 | 170 | 3 |
| 1423 | Marinas and fishing docks | MFD | 4.5 | 170 | 3 |
| 1432 | Airfields | AFI | 15.8 | 170 | 3 |
| 1511 | Open-pit mines | OMI | 8.0 | 170 | 3 |
| 1521 | Landfill sites | LSI | 10.9 | 170 | 3 |
| 1711 | Parks and gardens | PGA | 41.1 | 141 | 4 |
| 1611 | Golf courses | GCO | 43.8 | 141 | 4 |
| 1621 | Camp sites | CSI | 10.8 | 141 | 4 |
Appendix B. Standard Fuel Model Assignation to Land-Cover Classes
Table A2.
Standard fuel model assignation to 2018 land-use land cover classes [32,50]. We used these fuel model designations to generate the 100 m pixel resolution fuel model grid as required to assemble the LCP file.
| LULC (Description) | LULC (Code) | Standard Fuel Model (Code) |
|---|---|---|
| Predominantly vertical urban fabric | 1111 | 91 |
| Predominantly horizontal continuous urban fabric | 1112 | 91 |
| Discontinuous urban fabric | 1121 | 91 |
| Sparse discontinuous urban fabric | 1122 | 91 |
| Parking areas and public areas | 1131 | 91 |
| Empty spaces under development | 1132 | 91 |
| Industrial | 1211 | 91 |
| Commercial areas | 1221 | 91 |
| Agricultural facilities | 1231 | 91 |
| Infrastructure for renewable energy production | 1311 | 91 |
| Energy infrastructure | 1312 | 91 |
| Water depuration sites | 1321 | 91 |
| Waste treatment and wastewater infrastructures | 1322 | 91 |
| Road network and associated lands | 1411 | 91 |
| Rail network and associated lands | 1412 | 91 |
| Port areas | 1421 | 91 |
| Shipyards | 1422 | 91 |
| Marinas and fishing docks | 1423 | 91 |
| Airports | 1431 | 91 |
| Airfields | 1432 | 91 |
| Open-pit mines | 1511 | 99 |
| Mining sites | 1512 | 99 |
| Landfill sites | 1521 | 99 |
| Dumpsters | 1522 | 99 |
| Areas under construction | 1531 | 99 |
| Golf courses | 1611 | 93 |
| Sport facilities | 1612 | 93 |
| Camp sites | 1621 | 91 |
| Recreation areas | 1622 | 91 |
| Cultural sites | 1631 | 91 |
| Cemeteries | 1641 | 91 |
| Tourism facilities | 1651 | 91 |
| Parks and gardens | 1711 | 93 |
| Non-irrigated arable land | 2111 | 104 |
| Irrigated arable land | 2111 | 93 |
| Rice fields | 2112 | 93 |
| Vineyards | 2211 | 93 |
| Fruit trees plantations | 2221 | 93 |
| Olive groves | 2231 | 93 |
| Annual crops or pastures associated to vineyards | 2311 | 102 |
| Annual crops or pastures associated to fruit trees plantations | 2312 | 163 |
| Annual crops or pastures associated to olive groves | 2313 | 163 |
| Complex cultivation patterns | 2321 | 104 |
| Land occupied by agriculture, with significant areas of natural vegetation | 2331 | 123 |
| Protected agriculture and nurseries | 2411 | 93 |
| Managed pastures | 3111 | 104 |
| Espontaneous pastures | 3121 | 123 |
| Agro-forestry areas with Quercus suber (cork tree) | 4111 | 163 |
| Agro-forestry areas with Quercus ilex (evergreen oak) | 4112 | 163 |
| Agro-forestry areas with other oaks | 4113 | 163 |
| Agro-forestry areas with Pinus pinea (stone pine) | 4114 | 163 |
| Agro-forestry areas with other species | 4115 | 163 |
| Agro-forestry areas with Quercus suber and Quercus ilex | 4116 | 163 |
| Agro-forestry areas with other mix of species | 4117 | 163 |
| Quercus suber forest (cork tree) | 5111 | 165 |
| Quercus ilex forest (evergreen oak) | 5112 | 165 |
| Other oak forests | 5113 | 165 |
| Castanea forests (chestnut tree) | 5114 | 186 |
| Eucalyptus forest | 5115 | 189 |
| Forests of invasive species | 5116 | 143 |
| Other broad-leaved forests | 5117 | 186 |
| Pinus pinaster forest (maritime pine) | 5121 | 149 |
| Pinus pinea forest (stone pine) | 5122 | 188 |
| Other coniferous forests | 5123 | 144 |
| Scrubs—Northern Portugal < 3 years since last fire | 6118 | 146 |
| Other Scrubs | 6111 | 148 |
| Scrubs—Northern Portugal > 5 years since last fire | 6111 | 149 |
| Scrubs—Southern Portugal > 5 years since last fire | 6117 | 145 |
| Other Scrubs < 3 years since last fire | 6115 | 143 |
| Scrubs—Southern Portugal < 3 years since last fire | 6116 | 143 |
| Interior beaches, dunes, sand | 7111 | 99 |
| Coastal beaches, dunes, sand | 7112 | 99 |
| Bare rocks | 7121 | 99 |
| Sparsely vegetated areas | 7131 | 121 |
| Inland marshes | 8111 | 98 |
| Salt marshes | 8121 | 98 |
| Intertidal flats | 8122 | 98 |
| Natural water courses | 9111 | 98 |
| Modified or artifical water courses | 9112 | 98 |
| Artificial inland water bodies | 9121 | 98 |
| Natural inland water bodies | 9122 | 98 |
| Dams reservoirs | 9123 | 98 |
| Weirs and other reservoirs | 9124 | 98 |
| Ponds | 9125 | 98 |
| Aquaculture sites | 9211 | 98 |
| Salines | 9311 | 98 |
| Coastal lagoons | 9321 | 98 |
| Estuaries | 9331 | 98 |
| Sea and ocean | 9341 | 98 |
Appendix C. Fire Spread Duration Probabilistic Distribution by Macro-Area
Table A3.
The fire spread modeling duration probabilities by macro-area replicating historic large fire size (>100 ha) distributions (Figure 1) assuming extreme (99th percentile) fire-weather conditions (Table 1).
| Macroarea (Code) | Fire Spread Duration (min) and Probability (%) | ||||||||||||
|---|---|---|---|---|---|---|---|---|---|---|---|---|---|
| 60 | 75 | 150 | 200 | 300 | 450 | 600 | 750 | 900 | 1050 | 1200 | 1500 | 1800 | |
| ALE (1) | 0.62 | - | 0.33 | - | 0.05 | - | - | - | - | - | - | - | - |
| ALG (2) | 0.73 | - | - | - | - | 0.07 | 0.05 | - | - | 0.15 | - | - | - |
| APO (3) | - | 0.05 | 0.6 | - | 0.2 | 0.1 | - | 0.05 | - | - | - | - | - |
| BAL (4) | - | - | 0.59 | - | 0.11 | 0.21 | - | - | 0.06 | 0.03 | - | - | - |
| BBA (5) | - | 0.26 | - | - | 0.35 | 0.29 | 0.07 | - | - | 0.03 | - | - | - |
| BDO (6) | - | - | 0.63 | - | 0.27 | - | 0.06 | 0.02 | - | 0.02 | - | - | - |
| BLI (7) | - | - | 0.6 | - | 0.15 | - | - | 0.15 | - | 0.1 | - | - | - |
| EBS (8) | - | - | 0.79 | - | 0.04 | - | 0.17 | - | - | - | - | - | |
| WBS (9) | - | - | - | 0.35 | 0.1 | 0.2 | 0.1 | - | 0.05 | - | - | 0.2 | |
| EST (10) | - | 0.44 | 0.42 | - | 0.14 | - | - | - | - | - | - | - | |
| EIN (11) | - | - | 0.4 | - | 0.05 | 0.25 | - | 0.2 | - | - | - | 0.1 | - |
| NTR (12) | - | - | - | - | 0.9 | - | - | 0.05 | - | 0.05 | - | - | - |
| NCI (13) | - | - | - | 0.7 | 0.17 | 0.1 | - | - | 0.03 | - | - | ||
| SER (14) | 0.84 | 0.13 | - | - | - | 0.03 | - | - | - | - | - | ||
Appendix D. Methodological Flowchart of Exposure Assessment
Figure A2.
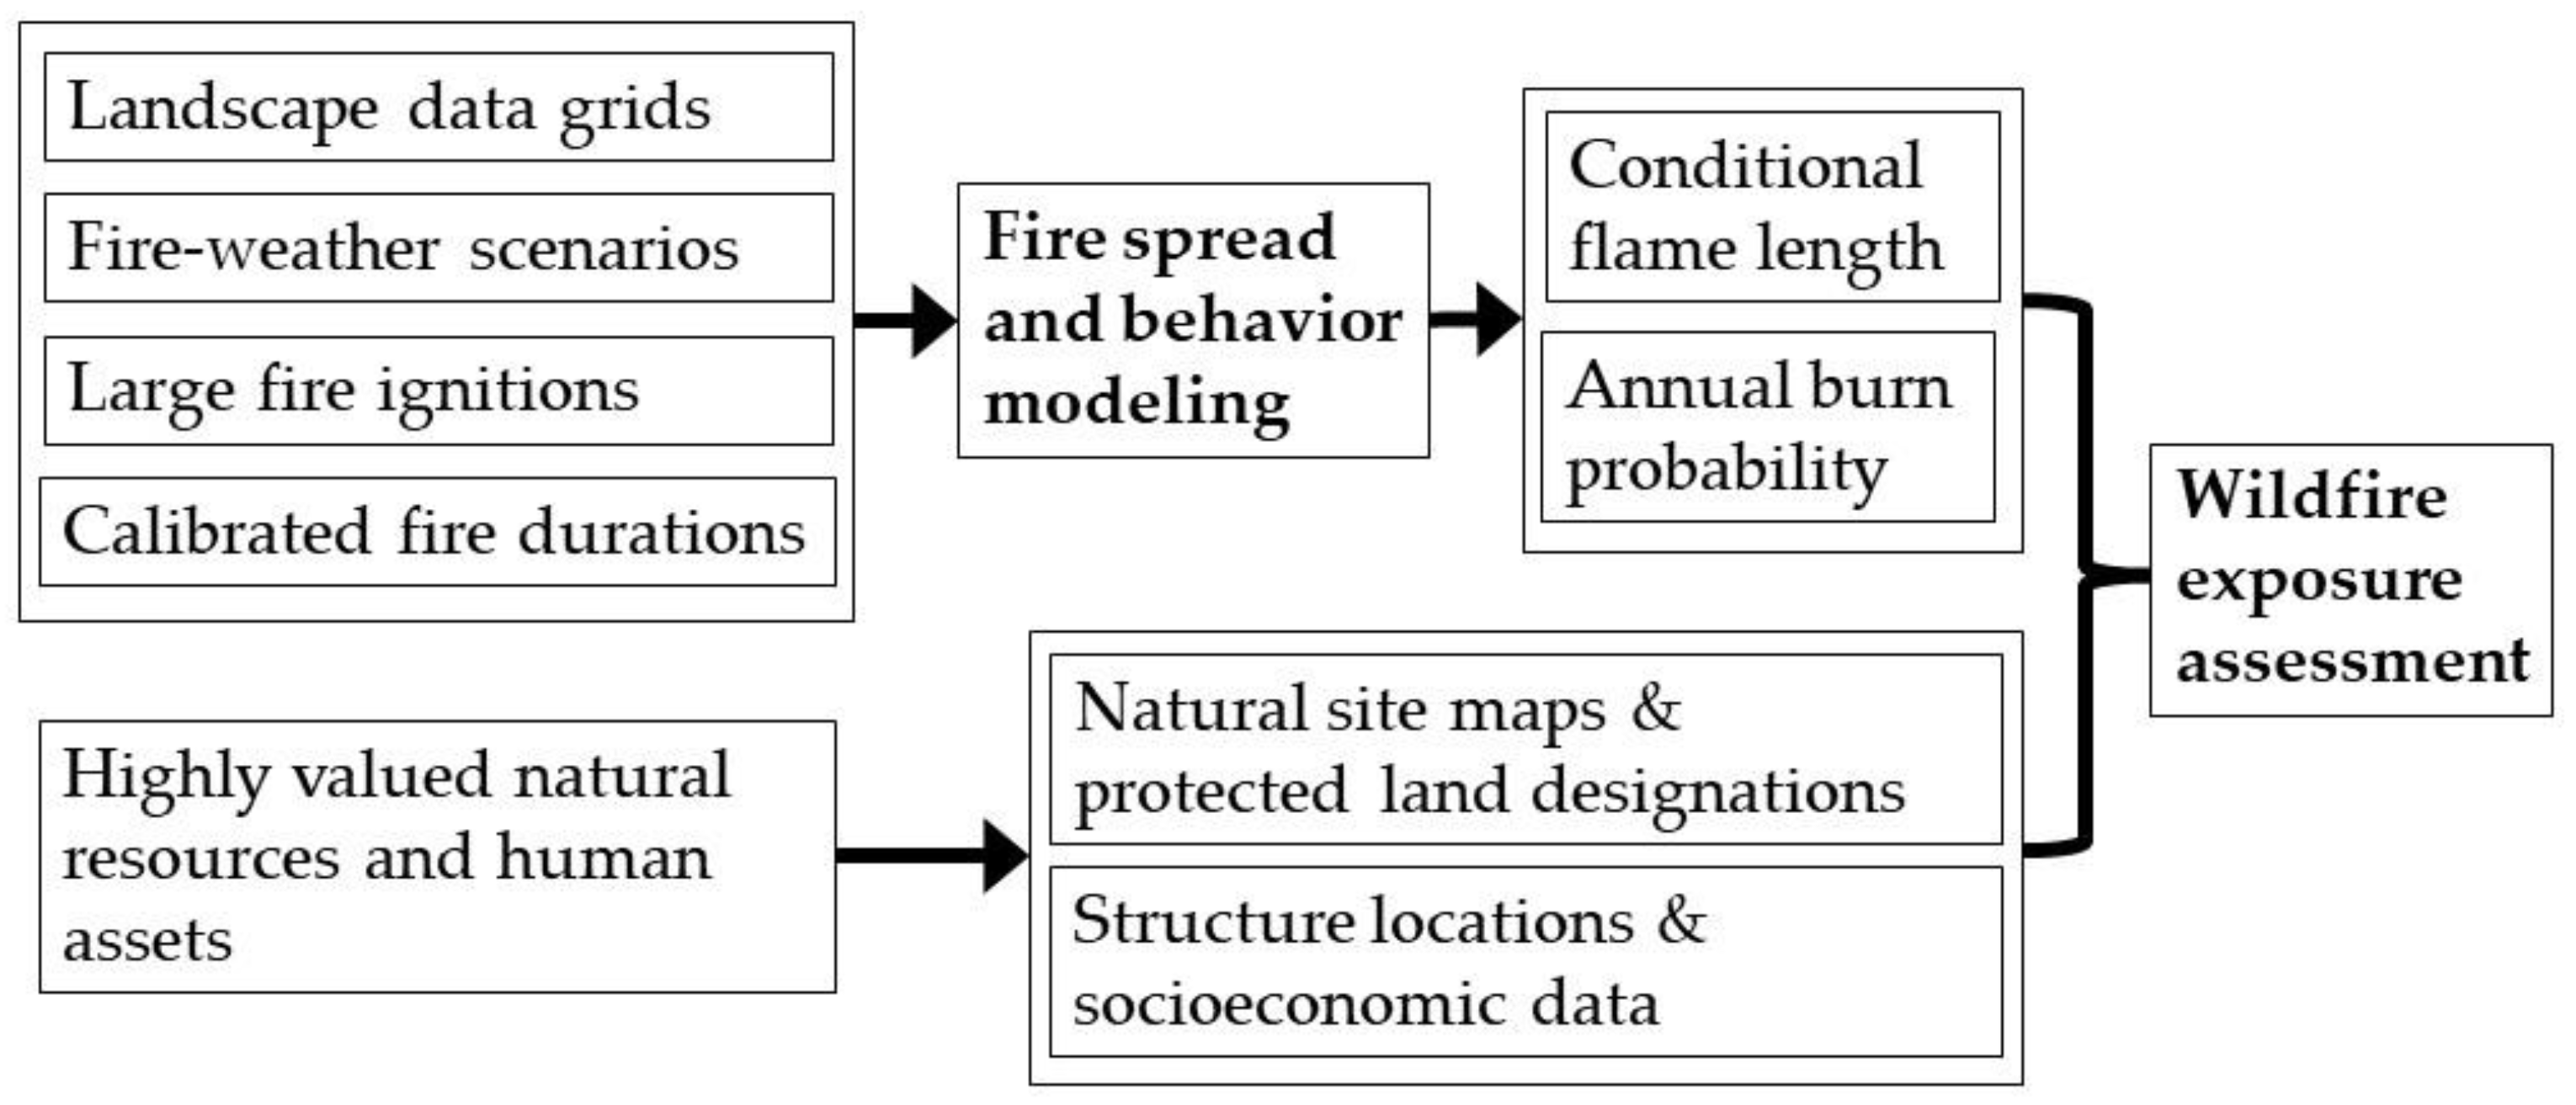
Methodological flowchart of the wildfire risk assessment process implemented in this study. We intersected the fire modeling and spread modeling outputs, including conditional flame length (CFL) and annual burn probability (aBP), with highly valued natural resources and human assets to assess exposure in mainland Portugal. The wildfire exposure results were summarized in communities using socioeconomic data, and we described the burning recurrence and intensity by IUCN land designation class in the natural sites.
Figure A2.
Methodological flowchart of the wildfire risk assessment process implemented in this study. We intersected the fire modeling and spread modeling outputs, including conditional flame length (CFL) and annual burn probability (aBP), with highly valued natural resources and human assets to assess exposure in mainland Portugal. The wildfire exposure results were summarized in communities using socioeconomic data, and we described the burning recurrence and intensity by IUCN land designation class in the natural sites.
References
- Tedim, F.; Leone, V.; Amraoui, M.; Bouillon, C.; Coughlan, M.R.; Delogu, G.M.; Fernandes, P.; Ferreira, C.; McCaffrey, S.; McGee, T.K.; et al. Defining extreme wildfire events: Difficulties, challenges, and impacts. Fire 2018, 1, 9. [Google Scholar] [CrossRef] [Green Version]
- Molina-Terrén, D.M.; Xanthopoulos, G.; Diakakis, M.; Ribeiro, L.; Caballero, D.; Delogu, G.M.; Viegas, D.X.; Silva, C.A.; Cardil, A. Analysis of forest fire fatalities in Southern Europe: Spain, Portugal, Greece and Sardinia (Italy). Int. J. Wildland Fire 2019, 28, 85–98. [Google Scholar] [CrossRef] [Green Version]
- Salis, M.; Arca, B.; Alcasena-Urdiroz, F.; Massaiu, A.; Bacciu, V.; Bosseur, F.; Caramelle, P.; Dettori, S.; Fernandes de Oliveira, A.S.; Molina-Terren, D.; et al. Analyzing the recent dynamics of wildland fires in Quercus suber L. woodlands in Sardinia (Italy), Corsica (France) and Catalonia (Spain). Eur. J. For. Res. 2019, 138, 415–431. [Google Scholar] [CrossRef] [Green Version]
- Vacca, P.; Caballero, D.; Pastor, E.; Planas, E. WUI fire risk mitigation in Europe: A performance-based design approach at home-owner level. J. Saf. Sci. Resil. 2020, 1, 97–105. [Google Scholar] [CrossRef]
- Curt, T.; Frejaville, T. Wildfire Policy in Mediterranean France: How Far is it Efficient and Sustainable? Risk Anal. 2017, 38, 472–488. [Google Scholar] [CrossRef] [Green Version]
- AGIF. National Plan for Integrated Wildfire Management 2020–2030; Agency for Integrated Rural Fire Management: Lisbon, Portugal, 2020; p. 166. [Google Scholar]
- Ribeiro, L.M.; Rodrigues, A.; Lucas, D.; Viegas, D.X. The impact on structures of the Pedrógão Grande Fire Complex in June 2017 (Portugal). Fire 2020, 3, 57. [Google Scholar] [CrossRef]
- Guerreiro, J.; Fonseca, C.; Salgueiro, A.; Fernandes, P.; Lopez-Iglésias, E.; de Neufville, R.; Mateus, F.; Castellnou, M.; Sande-Silva, J.; Moura, J.M.; et al. Avaliação dos Incêndios Ocorridos Entre 14 e 16 de Outubro de 2017 em Portugal Continental. Relatório Final; Comissão Técnica Independente: Lisboa, Portugal, 2018; p. 274. [Google Scholar]
- San-Miguel-Ayanz, J.; Oom, D.; Artes, T.; Viegas, D.X.; Fernandes, P.; Faivre, N.; Freire, S.; Moore, P.; Rego, F.; Castellnou, M. Forest fires in Portugal in 2017. In Science for Disaster Risk Management 2020: Acting Today, Protecting Tomorrow; Casajus Valles, A., Marin Ferrer, M., Poljanšek, K., Clark, I., Eds.; Publications Office of the European Union: Luxemburg, 2020; pp. 414–430. [Google Scholar]
- Viegas, D.X. Wildfires in Portugal. Fire Res. 2018, 2. [Google Scholar] [CrossRef]
- Oliveira, S.; Rocha, J.; Sá, A. Wildfire risk modeling. Curr. Opin. Environ. Sci. Health 2021, 23, 100274. [Google Scholar] [CrossRef]
- Moreira, F.; Ascoli, D.; Safford, H.; Adams, M.A.; Moreno, J.M.; Pereira, J.M.C.; Catry, F.X.; Armesto, J.; Bond, W.; González, M.E.; et al. Wildfire management in Mediterranean-type regions: Paradigm change needed. Environ. Res. Lett. 2020, 15, 011001. [Google Scholar] [CrossRef]
- Fernandes, P.M.; Guiomar, N.; Rossa, C.G. Analysing eucalypt expansion in Portugal as a fire-regime modifier. Sci. Total Env. 2019, 666, 79–88. [Google Scholar] [CrossRef] [PubMed]
- Sil, Â.; Fernandes, P.M.; Rodrigues, A.P.; Alonso, J.M.; Honrado, J.P.; Perera, A.; Azevedo, J.C. Farmland abandonment decreases the fire regulation capacity and the fire protection ecosystem service in mountain landscapes. Ecosyst. Serv. 2019, 36, 100908. [Google Scholar] [CrossRef] [Green Version]
- Palmero-Iniesta, M.; Espelta, J.M.; Padial-Iglesias, M.; Gonzàlez-Guerrero, Ò.; Pesquer, L.; Domingo-Marimon, C.; Ninyerola, M.; Pons, X.; Pino, J. The Role of Recent (1985–2014) Patterns of Land Abandonment and Environmental Factors in the Establishment and Growth of Secondary Forests in the Iberian Peninsula. Land 2021, 10, 817. [Google Scholar] [CrossRef]
- Espunyes, J.; Lurgi, M.; Buntgen, U.; Bartolome, J.; Calleja, J.A.; Galvez-Ceron, A.; Penuelas, J.; Claramunt-Lopez, B.; Serrano, E. Different effects of alpine woody plant expansion on domestic and wild ungulates. Glob. Chang Biol. 2019, 25, 1808–1819. [Google Scholar] [CrossRef] [PubMed]
- Tavares, A.O.; Monteiro, M.; Barros, J.L.; Santos, P.P. Long-term land-use changes in small/medium-sized cities. Enhancing the general trends and local characteristics. Eur. Plan. Stud. 2019, 27, 1432–1459. [Google Scholar] [CrossRef] [Green Version]
- Bento-Gonçalves, A.; Vieira, A.; da Vinha, L.; Hamada, S. Changes in mainland Portuguese forest areas since the last decade of the XXth century. Mediterranee 2018, 130. [Google Scholar] [CrossRef]
- Meneses, B.; Reis, E.; Pereira, S.; Vale, M.; Reis, R. Understanding Driving Forces and Implications Associated with the Land Use and Land Cover Changes in Portugal. Sustainability 2017, 9, 351. [Google Scholar] [CrossRef] [Green Version]
- Guiomar, N.; Godinho, S.; Fernandes, P.M.; Machado, R.; Neves, N.; Fernandes, J.P. Wildfire patterns and landscape changes in Mediterranean oak woodlands. Sci. Total Env. 2015, 536, 338–352. [Google Scholar] [CrossRef] [PubMed] [Green Version]
- Oliveira, T.M.; Guiomar, N.; Baptista, F.O.; Pereira, J.M.C.; Claro, J. Is Portugal’s forest transition going up in smoke? Land Use Policy 2017, 66, 214–226. [Google Scholar] [CrossRef]
- Fernandes, P.M.; Davies, G.M.; Ascoli, D.; Fernández, C.; Moreira, F.; Rigolot, E.; Stoof, C.R.; Vega, J.A.; Molina, D. Prescribed burning in southern Europe: Developing fire management in a dynamic landscape. Front. Ecol. Environ. 2013, 11, e4–e14. [Google Scholar] [CrossRef] [Green Version]
- Alcasena, F.J.; Evers, C.; Vega-Garcia, C. The Wildland-Urban Interface raster dataset of Catalonia. Data Brief 2018, 17, 124–128. [Google Scholar] [CrossRef]
- Bento-Goncalves, A.; Vieira, A. Wildfires in the wildland-urban interface: Key concepts and evaluation methodologies. Sci. Total Environ. 2020, 707, 135592. [Google Scholar] [CrossRef]
- Resolução do Conselho de Ministros n.º 71-A/2021. Aprova o Programa Nacional de Ação do Plano Nacional de Gestão Integrada de Fogos Rurais. 2021. Available online: https://dre.pt/dre/detalhe/resolucao-conselho-ministros/71-a-2021-164798802 (accessed on 20 May 2021).
- Oliveira, T.M.; Barros, A.M.G.; Ager, A.A.; Fernandes, P.M. Assessing the effect of a fuel break network to reduce burnt area and wildfire risk transmission. Int. J. Wildland Fire 2016, 25, 619–632. [Google Scholar] [CrossRef]
- Calheiros, T.; Pereira, M.G.; Nunes, J.P. Assessing impacts of future climate change on extreme fire weather and pyro-regions in Iberian Peninsula. Sci. Total Env. 2021, 754, 142233. [Google Scholar] [CrossRef] [PubMed]
- Oliveira, S.; Gonçalves, A.; Zêzere, J.L. Reassessing wildfire susceptibility and hazard for mainland Portugal. Sci. Total Environ. 2020, 762, 143121. [Google Scholar] [CrossRef]
- Meira Castro, A.C.; Nunes, A.; Sousa, A.; Lourenço, L. Mapping the Causes of Forest Fires in Portugal by Clustering Analysis. Geosciences 2020, 10, 53. [Google Scholar] [CrossRef] [Green Version]
- Nunes, L.; Álvarez-González, J.; Alberdi, I.; Silva, V.; Rocha, M.; Rego, F.C. Analysis of the occurrence of wildfires in the Iberian Peninsula based on harmonised data from national forest inventories. Ann. For. Sci. 2019, 76. [Google Scholar] [CrossRef] [Green Version]
- Fernandes, P.M. Variation in the Canadian fire weather index thresholds for increasingly larger fires in Portugal. Forests 2019, 10, 838. [Google Scholar] [CrossRef] [Green Version]
- Direção-Geral do Território. Especificações técnicas da Carta de uso e Ocupação do Solo de Portugal Continental para 1995, 2007, 2010 e 2015. Relatório Técnico; Direção-Geral do Território: Lisbon, Portugal, 2018.
- Galizia, L.F.; Curt, T.; Barbero, R.; Rodrigues, M. Assessing the accuracy of remotely sensed fire datasets across the southwestern Mediterranean Basin. Nat. Hazards Earth Syst. Sci. 2021, 21, 73–86. [Google Scholar] [CrossRef]
- Turco, M.; Herrera, S.; Tourigny, E.; Chuvieco, E.; Provenzale, A. A comparison of remotely-sensed and inventory datasets for burned area in Mediterranean Europe. Int. J. Appl. Earth Obs. Geoinf. 2019, 82, 101887. [Google Scholar] [CrossRef] [Green Version]
- Rodrigues, M.; Trigo, R.M.; Vega-García, C.; Cardil, A. Identifying large fire weather typologies in the Iberian Peninsula. Agric. For. Meteorol. 2020, 280, 107789. [Google Scholar] [CrossRef]
- Fernandez-Anez, N.; Krasovskiy, A.; Müller, M.K.; Vacik, H.; Baetens, J.; Hukić, E.; Solomun, M.K.; Atanassova, I.; Glushkova, M.; Bogunović, I.; et al. Current Wildland Fire Patterns and Challenges in Europe: A Synthesis of National Perspectives. Air Soil Water Res. 2021, 14, 1–19. [Google Scholar] [CrossRef]
- San-Miguel-Ayanz, J.; Durrant, T.; Boca, R.; Maianti, P.; Libertà, G.; Vivancos, T.A.; Oom, D.; Branco, A.; De Rigo, D.; Ferrari, D.; et al. Forest Fires in Europe, Middle East and North Africa 2019; Joint Research Centre, European Comission: Luxenburg, 2019; p. 120. [Google Scholar]
- Bergonse, R.; Oliveira, S.; Gonçalves, A.; Nunes, S.; da Câmara, C.; Zêzere, J.L. A combined structural and seasonal approach to assess wildfire susceptibility and hazard in summertime. Nat. Hazards 2021, 106, 2545–2573. [Google Scholar] [CrossRef]
- INE. Instituto Nacional de Estatística: Censos 2011. XV Recenseamento Geral da População: V Recenseamento Geral da Habitação. Resultados Definitivos. Portugal; INE: Lisboa, Portugal, 2012; Available online: https://censos.ine.pt/xportal/xmain?xpid=CENSOS&xpgid=ine_censos_publicacao_det&contexto=pu&PUBLICACOESpub_boui=73212469&PUBLICACOESmodo=2&selTab=tab1&pcensos=61969554 (accessed on 22 May 2021).
- EEA. Nationally Designated Protected Areas (CDDA). Available online: https://www.eea.europa.eu/data-and-maps/data/nationally-designated-areas-national-cdda-15 (accessed on 24 May 2021).
- Dudley, N. Guidelines for Applying Protected Area Management Categories; International Union for Conservation of Nature: Gland, Switzerland, 2008; p. 86. [Google Scholar]
- Finney, M.A. Fire growth using minimum travel time methods. Can. J. For. Res. 2002, 32, 1420–1424. [Google Scholar] [CrossRef]
- Rothermel, R.C. A Mathematical Model for Predicting Fire Spread in Wildland Fuels; INT-115; USDA Forest Service, Intermountain Forest and Range Experiment Station: Ogden, UT, USA, 1972; p. 40.
- Byram, G.M. Forest fire behaviour. In Forest Fire Control and Use; Davis, K., Ed.; McGraw-Hill: New York, NY, USA, 1959; pp. 90–123. [Google Scholar]
- Salis, M.; Arca, B.; Del Giudice, L.; Palaiologou, P.; Alcasena-Urdiroz, F.; Ager, A.; Fiori, M.; Pellizzaro, G.; Scarpa, C.; Schirru, M.; et al. Application of simulation modeling for wildfire exposure and transmission assessment in Sardinia, Italy. Int. J. Disaster Risk Reduct. 2021, 58, 102189. [Google Scholar] [CrossRef]
- Alcasena, F.J.; Ager, A.A.; Bailey, J.D.; Pineda, N.; Vega-Garcia, C. Towards a comprehensive wildfire management strategy for Mediterranean areas: Framework development and implementation in Catalonia, Spain. J. Environ. Manag. 2019, 231, 303–320. [Google Scholar] [CrossRef] [PubMed]
- Ager, A.A.; Lasko, R.; Myroniuk, V.; Zibtsev, S.; Day, M.A.; Usenia, U.; Bogomolov, V.; Kovalets, I.; Evers, C.R. The wildfire problem in areas contaminated by the Chernobyl disaster. Sci. Total. Environ. 2019, 696, 133954. [Google Scholar] [CrossRef]
- Palaiologou, P.; Kalabokidis, K.; Ager, A.A.; Galatsidas, S.; Papalampros, L.; Day, M.A. Spatial optimization and tradeoffs of alternative forest management scenarios in Macedonia, Greece. Forests 2021, 12, 697. [Google Scholar] [CrossRef]
- Ager, A.A.; Vaillant, N.M.; Finney, M.A. Integrating fire behavior models and geospatial analysis for wildland fire risk assessment and fuel management planning. J. Combust. 2011, 572452, 19. [Google Scholar] [CrossRef] [Green Version]
- Scott, J.H.; Burgan, R.E. Standard Fire Behavior Fuel Models: A Comprehensive Set for Use with Rothermel’s Surface Fire Spread Model; RMRS-GTR-153; USDA Forest Service, Rocky Mountain Research Station: Fort Collins, CO, USA, 2005; p. 72.
- EC. Tree Cover Density; Copernicus Emergency Management Service. JRC: E.C.J.R.C.E., Ed. 2018. Available online: https://land.copernicus.eu/pan-european/high-resolution-layers/forests/tree-cover-density/status-maps/tree-cover-density-2018 (accessed on 5 June 2021).
- ICNF. 6.º Inventário Florestal Nacional. 2015 Relatório Final; Instituto da Conservação da Natureza e das Florestas. 2015. Available online: http://www2.icnf.pt/portal/florestas/ifn/resource/doc/ifn/ifn6/IFN6_Relatorio_completo-2019-11-28.pdf (accessed on 25 May 2021). (In Portuguese).
- Muñoz-Sabater, J.; Dutra, E.; Agustí-Panareda, A.; Albergel, C.; Arduini, G.; Balsamo, G.; Boussetta, S.; Choulga, M.; Harrigan, S.; Hersbach, H.; et al. ERA5-Land: A state-of-the-art global reanalysis dataset for land applications. Earth Syst. Sci. Data 2021, 13, 4349–4383. [Google Scholar] [CrossRef]
- Ord, J.K.; Getis, A. Testing for local spatial autocorrelation in the presence of global autocorrelation. J. Reg. Sci. 2001, 41, 411–432. [Google Scholar] [CrossRef]
- ICNF. Fire Database; Institute for Nature Conservation and Forests: Lisbon, Portugal, 2021. [Google Scholar]
- MAPA. Los Incendios Forestales en España. Decenio 2006–2015; Ministerio de Agricultura, Pesca y Alimentación: Madrid, Spain, 2016.
- Tonini, M.; Pereira, M.G.; Parente, J.; Vega Orozco, C. Evolution of forest fires in Portugal: From spatio-temporal point events to smoothed density maps. Nat. Hazards 2016, 85, 1489–1510. [Google Scholar] [CrossRef]
- Finney, M.A.; McHugh, C.W.; Grenfell, I.C.; Riley, K.L.; Short, K.C. A simulation of probabilistic wildfire risk components for the continental United States. Stoch. Environ. Res. Risk Assess. 2011, 25, 973–1000. [Google Scholar] [CrossRef] [Green Version]
- Miller, C.; Ager, A.A. A review of recent advances in risk analysis for wildfire management. Int. J. Wildland Fire 2013, 22, 1–14. [Google Scholar] [CrossRef] [Green Version]
- Alcasena, F.J.; Salis, M.; Ager, A.A.; Castell, R.; Vega-Garcia, C. Assessing wildland fire risk transmission to communities in northern Spain. Forests 2017, 8, 27. [Google Scholar] [CrossRef] [Green Version]
- Lampin-Maillet, C.; Long-Fournel, M.; Ganteaume, A.; Jappiot, M.; Ferrier, J.P. Land cover analysis in wildland–urban interfaces according to wildfire risk: A case study in the South of France. For. Ecol. Manag. 2011, 261, 2200–2213. [Google Scholar] [CrossRef] [Green Version]
- Ager, A.A.; Day, M.A.; Alcasena, F.J.; Evers, C.R.; Short, K.C.; Grenfell, I. Predicting Paradise: Modeling future wildfire disasters in the western US. Sci. Total Environ. 2021, 784, 147057. [Google Scholar] [CrossRef]
- Kramer, H.A.; Mockrin, M.H.; Alexandre, P.M.; Radeloff, V.C. High wildfire damage in interface communities in California. Int. J. Wildland Fire 2019, 28, 641–650. [Google Scholar] [CrossRef] [Green Version]
- Parisien, M.A.; Barber, Q.E.; Hirsch, K.G.; Stockdale, C.A.; Erni, S.; Wang, X.; Arseneault, D.; Parks, S.A. Fire deficit increases wildfire risk for many communities in the Canadian boreal forest. Nat. Commun. 2020, 11, 2121. [Google Scholar] [CrossRef] [PubMed]
- Alcasena, F.J.; Ager, A.A.; Salis, M.; Day, M.A.; Vega-Garcia, C. Optimizing prescribed fire allocation for managing fire risk in central Catalonia. Sci. Total Environ. 2018, 4, 872–885. [Google Scholar] [CrossRef] [PubMed] [Green Version]
- Wunder, S.; Calkin, D.E.; Charlton, V.; Feder, S.; Martínez de Arano, I.; Moore, P.; Rodríguez y Silva, F.; Tacconi, L.; Vega-García, C. Resilient landscapes to prevent catastrophic forest fires: Socioeconomic insights towards a new paradigm. For. Policy Econ. 2021, 128, 102458. [Google Scholar] [CrossRef]
- Ganteaume, A.; Barbero, R.; Jappiot, M.; Maillé, E. Understanding future changes to fires in southern Europe and their impacts on the wildland-urban interface. J. Saf. Sci. Resil. 2021, 2, 20–29. [Google Scholar] [CrossRef]
- USDA Forest Service. The National Strategy: The Final Phase in the Development of the National Cohesive Wildland Fire Management Strategy. 2014. Available online: https://www.forestsandrangelands.gov/strategy/thestrategy.shtml (accessed on 28 May 2021).
- EC. The European Green Deal; European Commission: Brussels, Belgium, 2019; p. 24. [Google Scholar]
- Verkerk, P.J.; Martinez de Arano, I.; Palahí, M. The bio-economy as an opportunity to tackle wildfires in Mediterranean forest ecosystems. For. Policy Econ. 2018, 86, 1–3. [Google Scholar] [CrossRef]
- Turco, M.; Jerez, S.; Augusto, S.; Tarín-Carrasco, P.; Ratola, N.; Jiménez-Guerrero, P.; Trigo, R.M. Climate drivers of the 2017 devastating fires in Portugal. Sci. Rep. 2019, 9, 13886. [Google Scholar] [CrossRef]
- Parisien, M.-A.; Dawe, D.A.; Miller, C.; Stockdale, C.A.; Armitage, O.B. Applications of simulation-based burn probability modelling: A review. Int. J. Wildland Fire 2020, 28, 913–926. [Google Scholar] [CrossRef] [Green Version]
- Salis, M.; Ager, A.A.; Alcasena, F.J.; Arca, B.; Finney, M.A.; Pellizzaro, G.; Spano, D. Analyzing seasonal patterns of wildfire exposure factors in Sardinia, Italy. Environ. Monit. Assess. 2015, 187, 4175. [Google Scholar] [CrossRef] [PubMed] [Green Version]
- San Miguel-Ayanz, J.; Costa, H.; De Rigo, D.; Liberta, G.; Artés, T.; Durrant, T.; Nuijten, D.; Löffler, P.; Moore, P. Basic Criteria to Assess Wildfire Risk at the Pan-European Level; EUR 29500 EN.; European Comission: Ispra, Italy, 2019; p. 23. [Google Scholar]
- Tedim, F.; Leone, V.; Xanthopoulos, G. A wildfire risk management concept based on a social-ecological approach in the European Union: Fire Smart Territory. Int. J. Disaster Risk Reduct. 2016, 18, 138–153. [Google Scholar] [CrossRef]
- Moreira, F.; Viedma, O.; Arianoutsou, M.; Curt, T.; Koutsias, N.; Rigolot, E.; Barbati, A.; Corona, P.; Vaz, P.; Xanthopoulous, G.; et al. Landscape—Wildfire interactions in southern Europe: Implications for landscape management. J. Environ. Manag. 2011, 92, 2389–2402. [Google Scholar] [CrossRef] [PubMed] [Green Version]
- Pra, A.; Masiero, M.; Barreiro, S.; Tomé, M.; Martinez De Arano, I.; Orradre, G.; Onaindia, A.; Brotto, L.; Pettenella, D. Forest plantations in Southwestern Europe: A comparative trend analysis on investment returns, markets and policies. For. Policy Econ. 2019, 109, 102000. [Google Scholar] [CrossRef]
- Moreira, F.; Pe’er, G. Agricultural policy can reduce wildfires. Science 2018, 359, 1001. [Google Scholar] [CrossRef]
- Varela, E.; Górriz-Mifsud, E.; Ruiz-Mirazo, J.; López-i-Gelats, F. Payment for Targeted Grazing: Integrating Local Shepherds into Wildfire Prevention. Forests 2018, 9, 464. [Google Scholar] [CrossRef] [Green Version]
- Canals, R.M. Landscape in motion: Revisiting the role of key disturbances in the preservation of mountain ecosystems. Cuad. Investig. Geográfica 2019, 45, 515. [Google Scholar] [CrossRef] [Green Version]
- García-Ruiz, J.M.; Lasanta, T.; Nadal-Romero, E.; Lana-Renault, N.; Álvarez-Farizo, B. Rewilding and restoring cultural landscapes in Mediterranean mountains: Opportunities and challenges. Land Use Policy 2020, 99, 104850. [Google Scholar] [CrossRef]
- Navarro-Carrión, J.T.; León-Cadena, P.; Ramon-Morte, A. Open data repositories and Geo Small Data for mapping the wildfire risk exposure in wildland urban interface (WUI) in Spain: A case study in the Valencian Region. Remote Sens. Appl. Soc. Environ. 2021, 22, 100500. [Google Scholar] [CrossRef]
- Pereira, J.M.C.; Alexandre, P.M.; Campagnolo, M.L.; Bar-Massada, A.; Radeloff, V.C.; Silva, P.C. Defining and Mapping the Wildland-Urban Interface in Portugal; Imprensa da Universidade de Coimbra: Coimbra, Portugal, 2018. [Google Scholar] [CrossRef] [Green Version]
- Sirca, C.; Casula, F.; Bouillon, C.; García, B.F.; Fernández Ramiro, M.M.; Molina, B.V.; Spano, D. A wildfire risk oriented GIS tool for mapping Rural-Urban Interfaces. Environ. Model. Softw. 2017, 94, 36–47. [Google Scholar] [CrossRef]
- Del Giudice, L.; Arca, B.; Scarpa, C.; Pellizzaro, G.; Duce, P.; Salis, M. The wildland-anthropic interface raster data of the Italy–France maritime cooperation area (Sardinia, Corsica, Tuscany, Liguria, and Provence-Alpes-Côte d’Azur). Data Brief. 2021, 38, 107355. [Google Scholar] [CrossRef] [PubMed]
- Mitsopoulos, I.; Mallinis, G.; Dimitrakopoulos, A.; Xanthopoulos, G.; Eftychidis, G.; Goldammer, J.G. Vulnerability of periurban and residential areas to landscape fires in Greece: Evidence by wildland-urban interface data. Data Brief. 2020, 31, 106025. [Google Scholar] [CrossRef]
- Badia, A.; Pallares-Barbera, M.; Valldeperas, N.; Gisbert, M. Wildfires in the wildland-urban interface in Catalonia: Vulnerability analysis based on land use and land cover change. Sci. Total Environ. 2019, 673, 184–196. [Google Scholar] [CrossRef]
- Madrigal, J.; Ruiz, J.A.; Planelles, R.; Hernando, C. Characterization of wildland-urban interfaces for fire prevention in the province of Valencia (Spain). For. Syst. 2013, 22, 249. [Google Scholar] [CrossRef] [Green Version]
- Calkin, D.E.; Cohen, J.D.; Finney, M.A.; Thompson, M.P. How risk management can prevent future wildfire disasters in the wildland-urban interface. Proc. Natl. Acad. Sci. USA 2014, 111, 746–751. [Google Scholar] [CrossRef] [Green Version]
- Page, W.G.; Butler, B.W. An empirically based approach to defining wildland firefighter safety and survival zone separation distances. Int. J. Wildland Fire 2017, 26, 655. [Google Scholar] [CrossRef]
- Syphard, A.; Keeley, J.E. Factors associated with structure loss in the 2013–2018 California wildfires. Fire 2019, 2, 49. [Google Scholar] [CrossRef] [Green Version]
- Oliveira, S.; Gonçalves, A.; Benali, A.; Sá, A.; Zêzere, J.L.; Pereira, J.M. Assessing risk and prioritizing safety interventions in human settlements affected by large wildfires. Forests 2020, 11, 859. [Google Scholar] [CrossRef]
- Insausti, K.; Beldarrain, L.R.; Lavin, M.P.; Aldai, N.; Mantecon, A.R.; Saez, J.L.; Canals, R.M. Horse meat production in northern Spain: Ecosystem services and sustainability in High Nature Value farmland. Anim. Front. 2021, 11, 47–54. [Google Scholar] [CrossRef]
- Mena, Y.; Ruiz-Mirazo, J.; Ruiz, F.A.; Castel, J.M. Characterization and typification of small ruminant farms providing fuelbreak grazing services for wildfire prevention in Andalusia (Spain). Sci. Total Environ. 2016, 544, 211–219. [Google Scholar] [CrossRef] [PubMed]
- Regos, A.; Aquilue, N.; Retana, J.; De Caceres, M.; Brotons, L. Using unplanned fires to help suppressing future large fires in Mediterranean forests. PLoS ONE 2014, 9, e94906. [Google Scholar] [CrossRef] [Green Version]
- Campos, J.C.; Bernhardt, J.; Aquilue, N.; Brotons, L.; Dominguez, J.; Lomba, A.; Marcos, B.; Martinez-Freiria, F.; Moreira, F.; Pais, S.; et al. Using fire to enhance rewilding when agricultural policies fail. Sci. Total Env. 2021, 755, 142897. [Google Scholar] [CrossRef]
- Riley, K.L.; Thompson, M.P.; Scott, J.H.; Gilbertson-Day, J.W. A model-based framework to evaluate alternative wildfire suppression strategies. Resources 2018, 7, 4. [Google Scholar] [CrossRef] [Green Version]
- Silva, V.; Catry, F.X.; Fernandes, P.M.; Rego, F.C.; Bugalho, M.N.; Marrs, R. Trade-offs between fire hazard reduction and conservation in a Natura 2000 shrub–grassland mosaic. Appl. Veg. Sci. 2019, 23, 39–52. [Google Scholar] [CrossRef]
- Alcasena, F.J.; Salis, M.; Vega-García, C. A fire modeling approach to assess wildfire exposure of valued resources in central Navarra, Spain. Eur. J. For. Res. 2016, 135, 87–107. [Google Scholar] [CrossRef] [Green Version]
- Ager, A.A.; Evers, C.R.; Day, M.A.; Alcasena, F.J.; Houtman, R. Planning for future fire: Scenario analysis of an accelerated fuel reduction plan for the western United States. Landsc. Urban Plan. 2021, 215, 104212. [Google Scholar] [CrossRef]
Figure 1.
Wildfire simulation modeling macro-areas (n = 14) in Portugal and large historic fire (>100 ha) occurrence (A). The wildfire ignitions were distributed based on the historic ignition density grid. In addition, we considered the local extreme fire-weather conditions within each macro-area to model fire spread and behavior (Table 2). Modeled fires replicated historic fire size distributions observed in the northern ((B); macro-areas 13, 3,12, and 6) central ((C); macro-areas 7, 4, 8, 9, 5, 11, 5, and 10), and southern ((D); macro=areas 14, 1, and 2) Portugal. See the probabilistic distribution of modeled fire durations by macro-area in Appendix C.
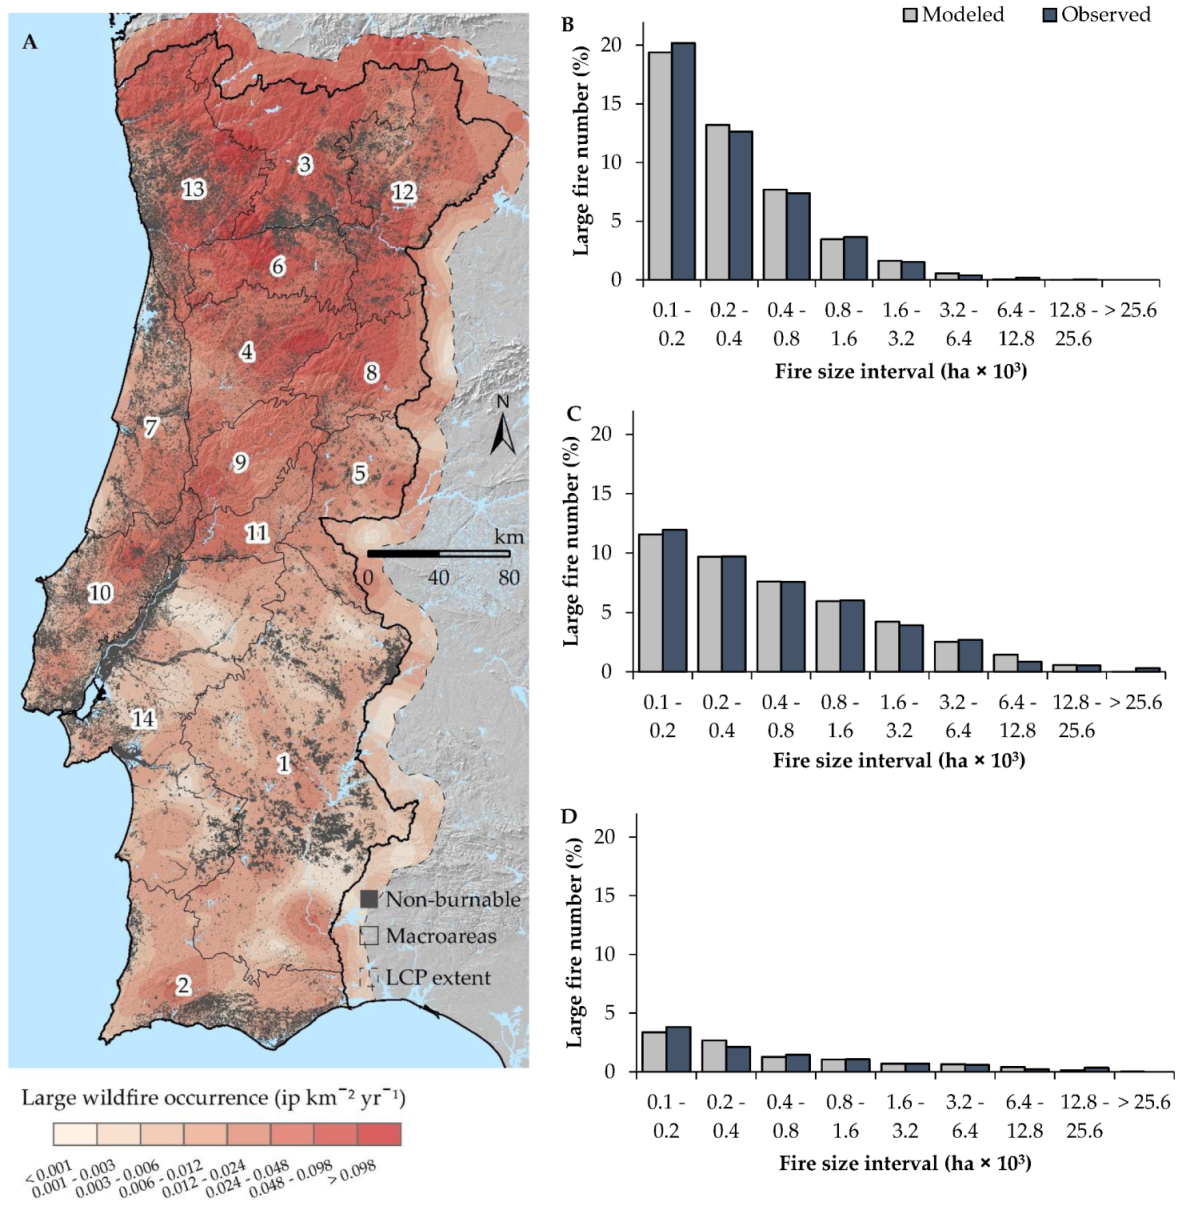
Figure 2.
Modeled wildfire intensity (A) and likelihood (B) in Portugal. We modeled a burned area equivalent to 10,000 years at 100 m resolution with the MTT algorithm as implemented in the FConstMTT command line fire spread and behavior modeling program. The fire ignitions were distributed based on large fire ignition density (Figure 1A). We assumed extreme weather conditions to model fire spread and behavior (Table 1).
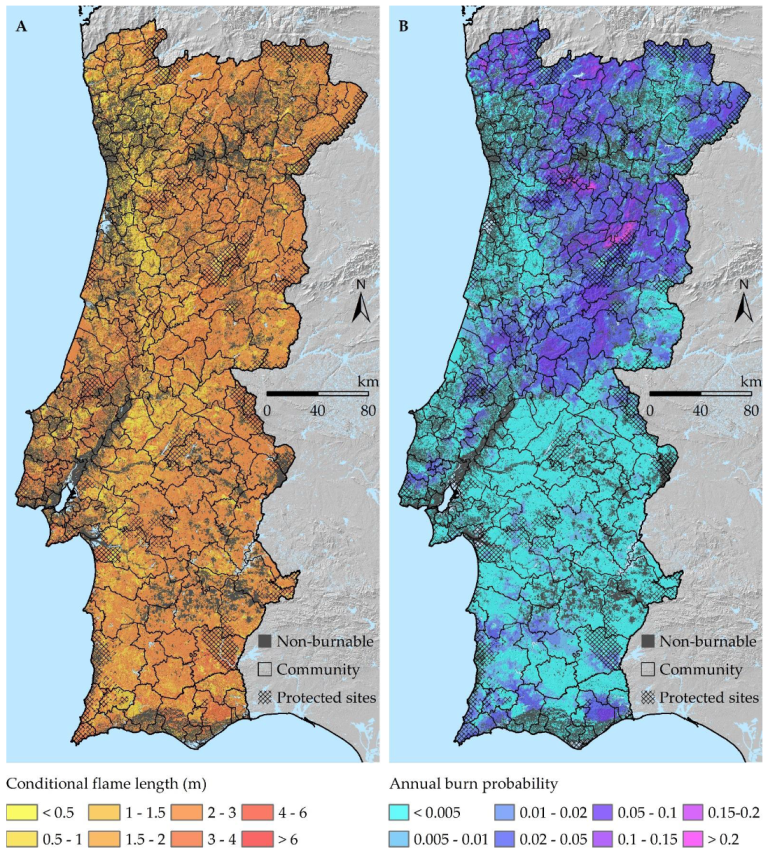
Figure 3.
Actual and modeled burned area (ha yr−1) by macro-area (A) and community (B), and community-level percentage area burned in the last five years vs. the absolute difference between the modeled and actual burned area (C). The burned areas were calculated using modeled annual burn probability (Figure 2B) and empiric burn probability grids.

Figure 4.
Wildfire exposure scatter plots of the human communities (left) and natural protected sites (right). Each dot represents the average annual burn probability vs. conditional flame length (m) (A,B), and the average large (>100 ha) fire size (ha) and wildfire occurrence (# ignitions yr−1 km−2) (C,D).

Figure 5.
Modeled wildfire exposure to communities in terms of the number of exposed structures per year (A) and exposure ratio (B) relative to the total number of structures within the community in Portugal. The total number of structures exposed to wildfires, including residential housing, industrial, agricultural, and other facilities, is 10,394 per year. The maps are colored by freguesia neighborhoods within communities or concelhos.
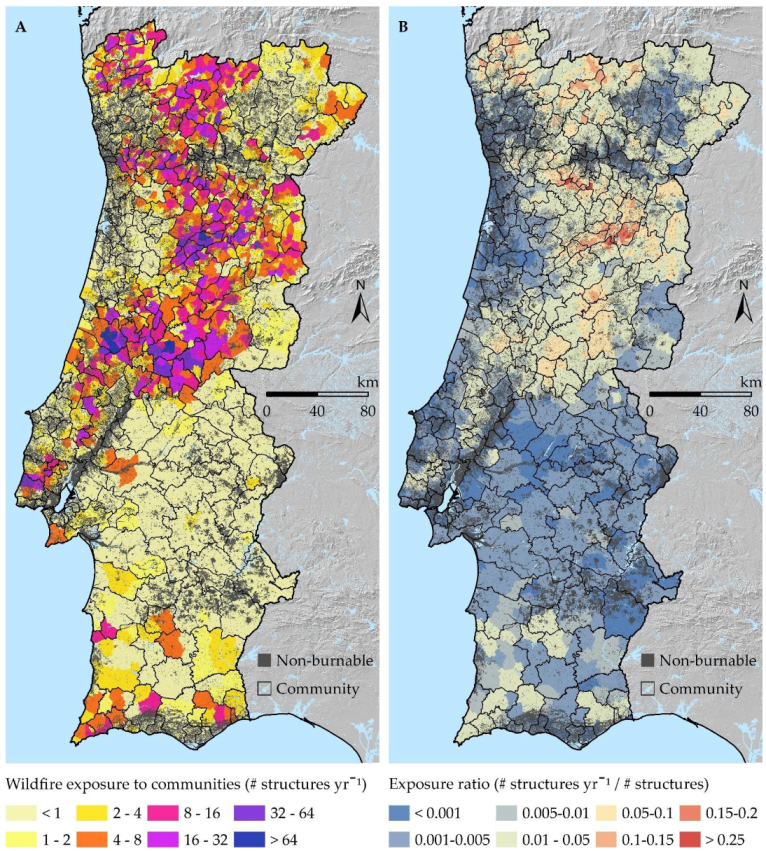
Figure 6.
Cumulative wildfire exposure (A), exposure by urban fabric buildup class (B), social vulnerability (C), and response capacity (D) in communities. The bubble size (C,D) represents the community-level exposure ratios (Figure 4B). The maximum bubble size is a 0.15 exposure ratio. Abbreviations: discontinuous urban fabric (DUF), predominantly horizontal continuous urban fabric (HUF), sparse discontinuous urban fabric (SDF), industrial (IND), mostly vertical urban fabric (VUF), agricultural facilities (AGR), and other (OTH).
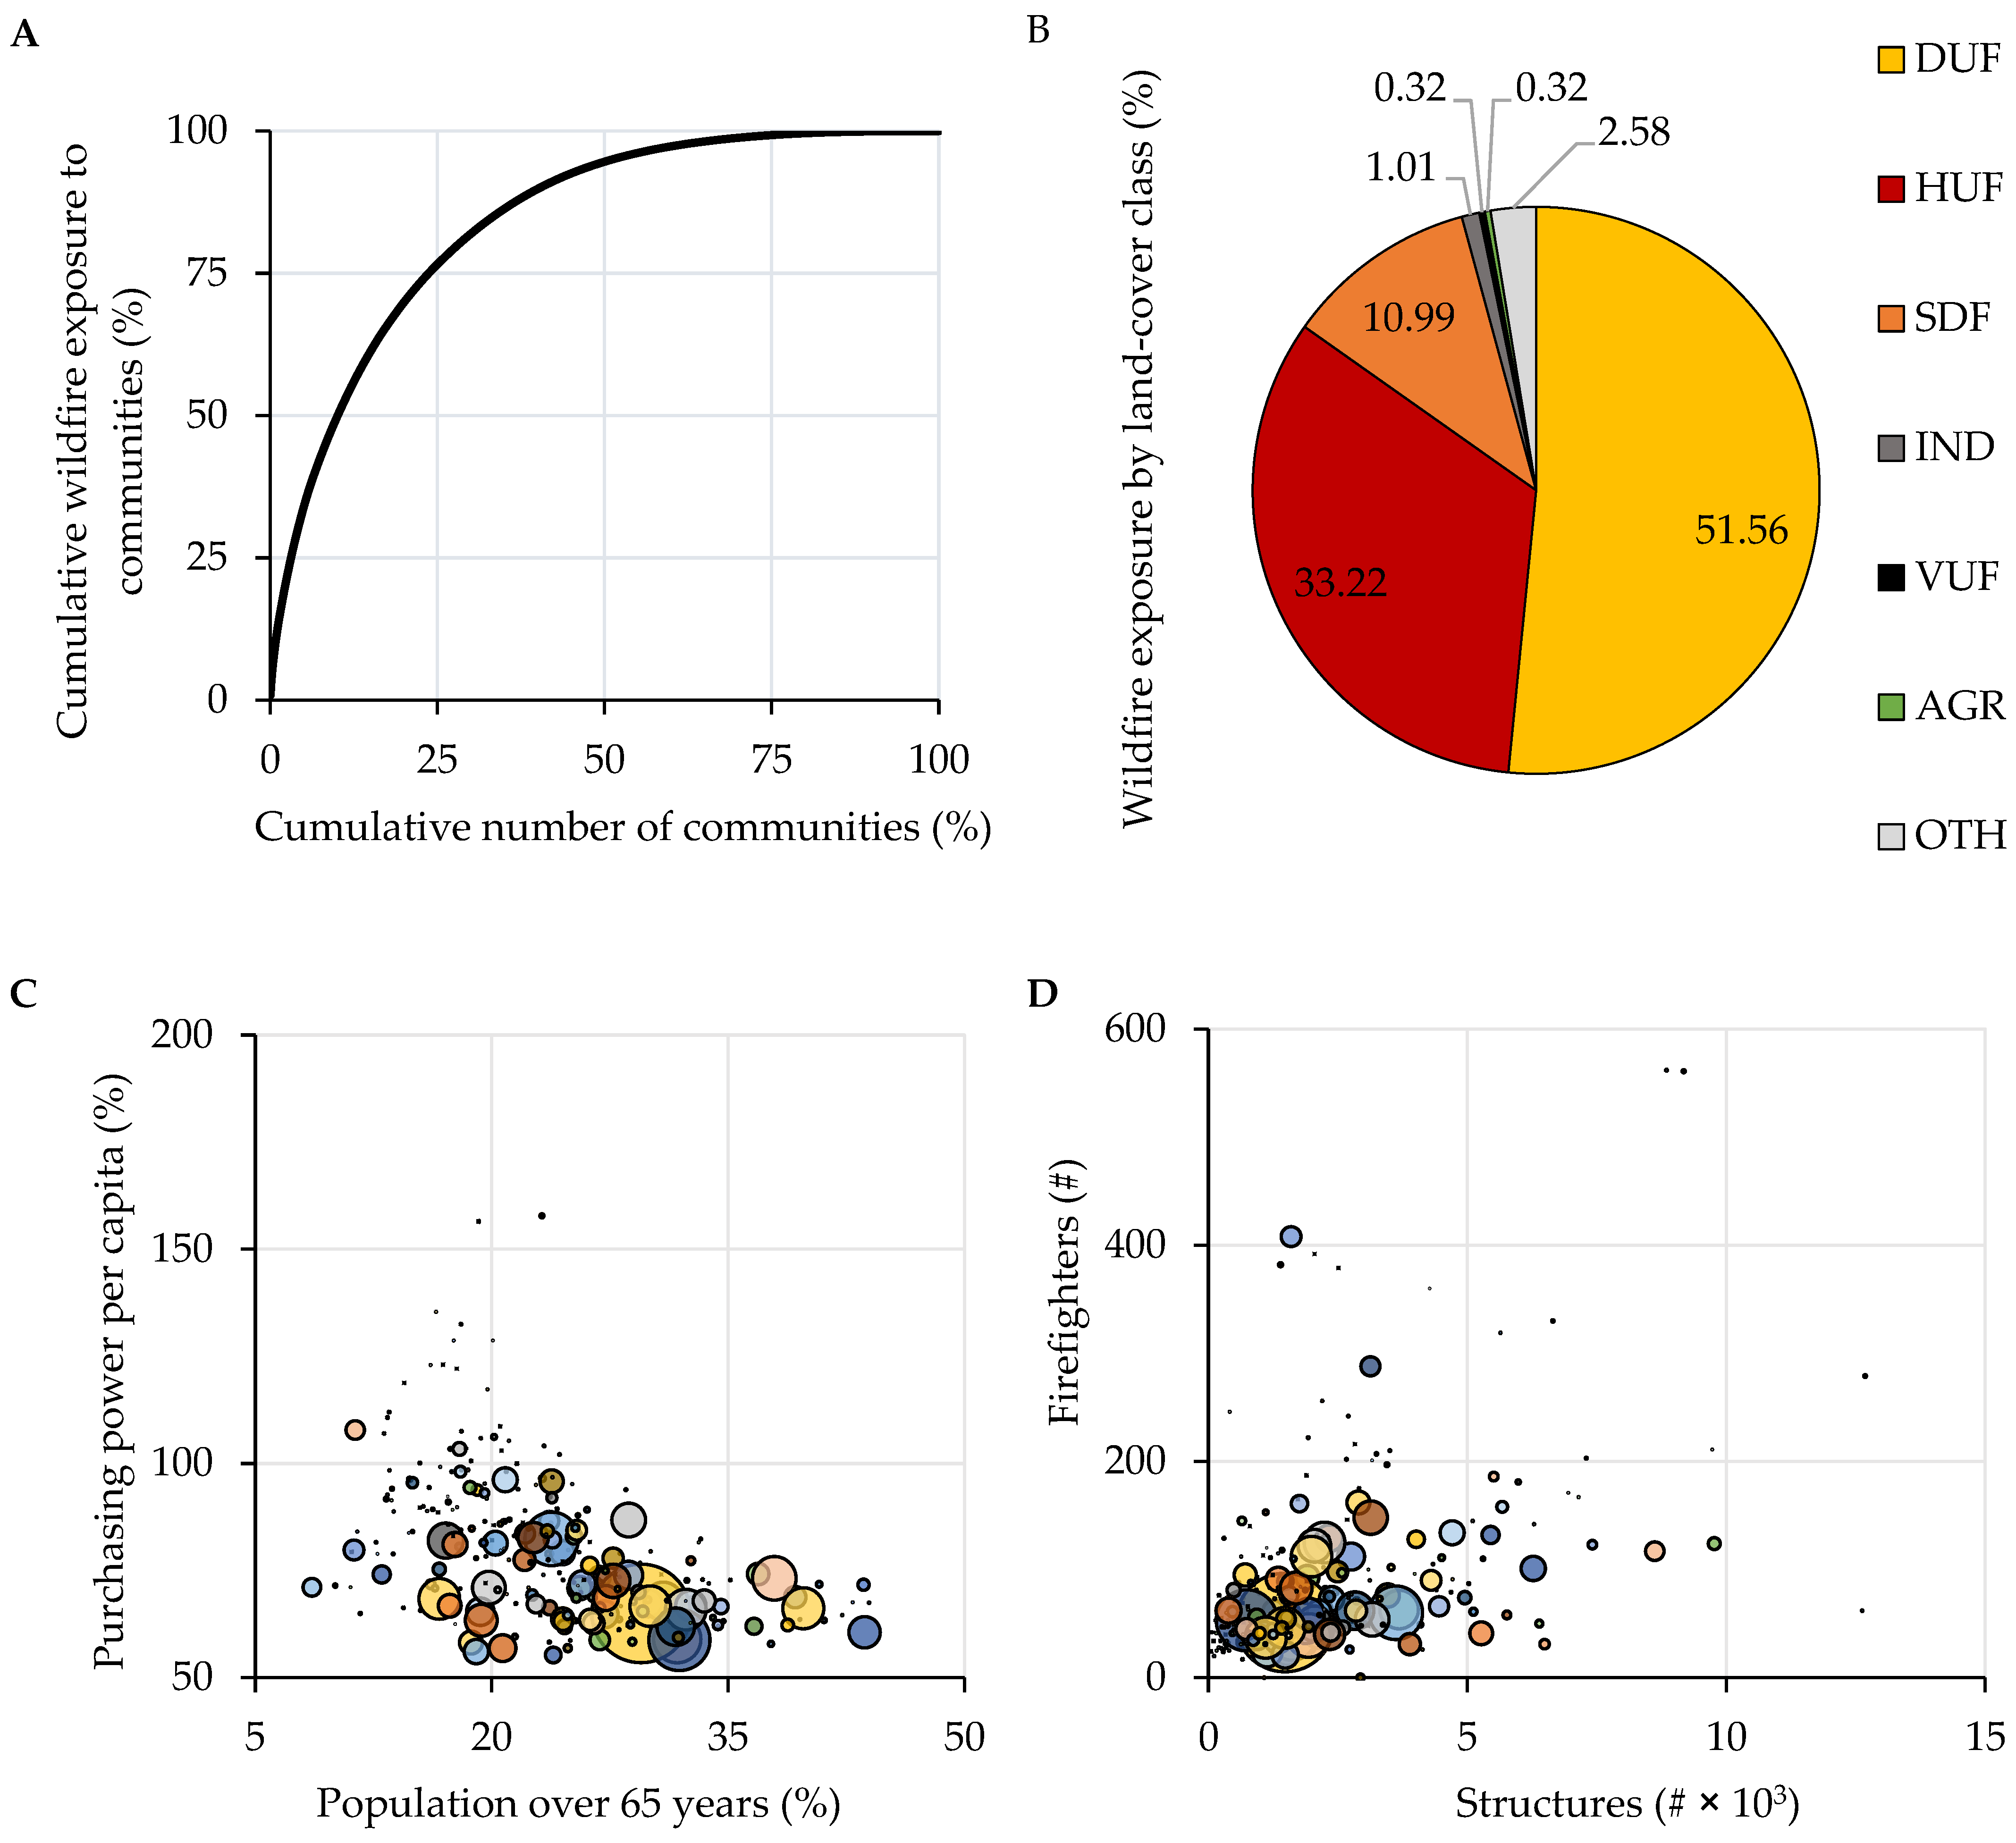
Figure 7.
Modeled wildfire exposure to natural sites regarding the burned area (A) and the percentage burned area (B) per year in Portugal. The total burned area in protected natural sites is 18,257 ha per year. The protected natural sites included national parks, nature reserves, protected landscapes, and natural monuments described in the Decree-Law 142/2008 and Natura 2000 network (92/43/EEC).
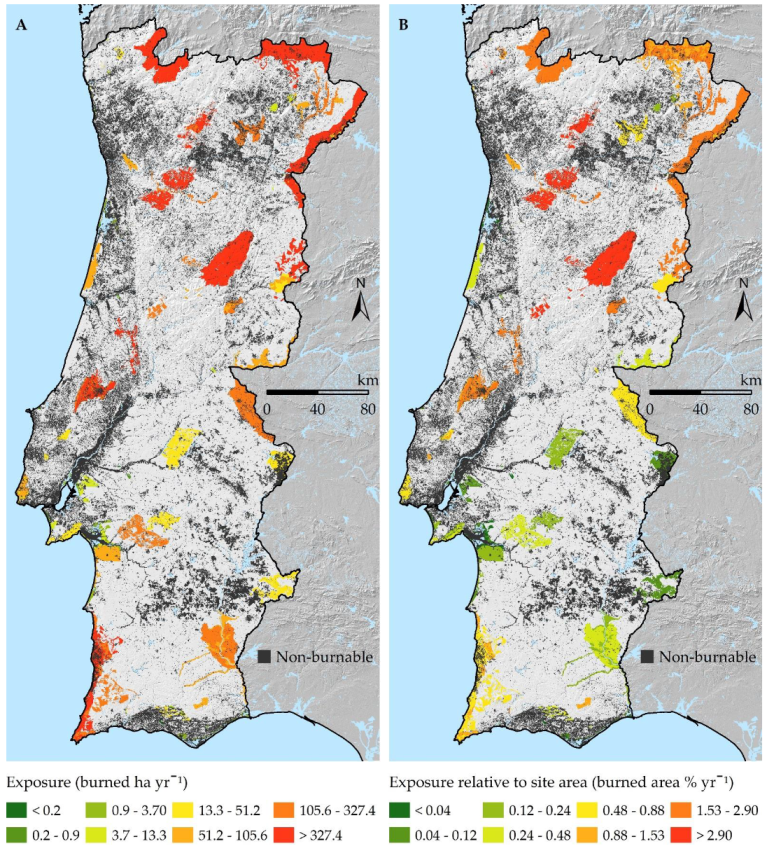
Figure 8.
Cumulative wildfire exposure (A) and wildfire exposure by IUCN codes in terms of the annually burned area (B), fire intensity intervals (C), and fire recurrence intervals (D) in protected natural sites of Portugal. Only 20% of the area concentrates 50% of exposure in terms of annually burned area. The IUCN codes determine the existing environmental restrictions in the protected natural sites conditioning the landscape management efforts.
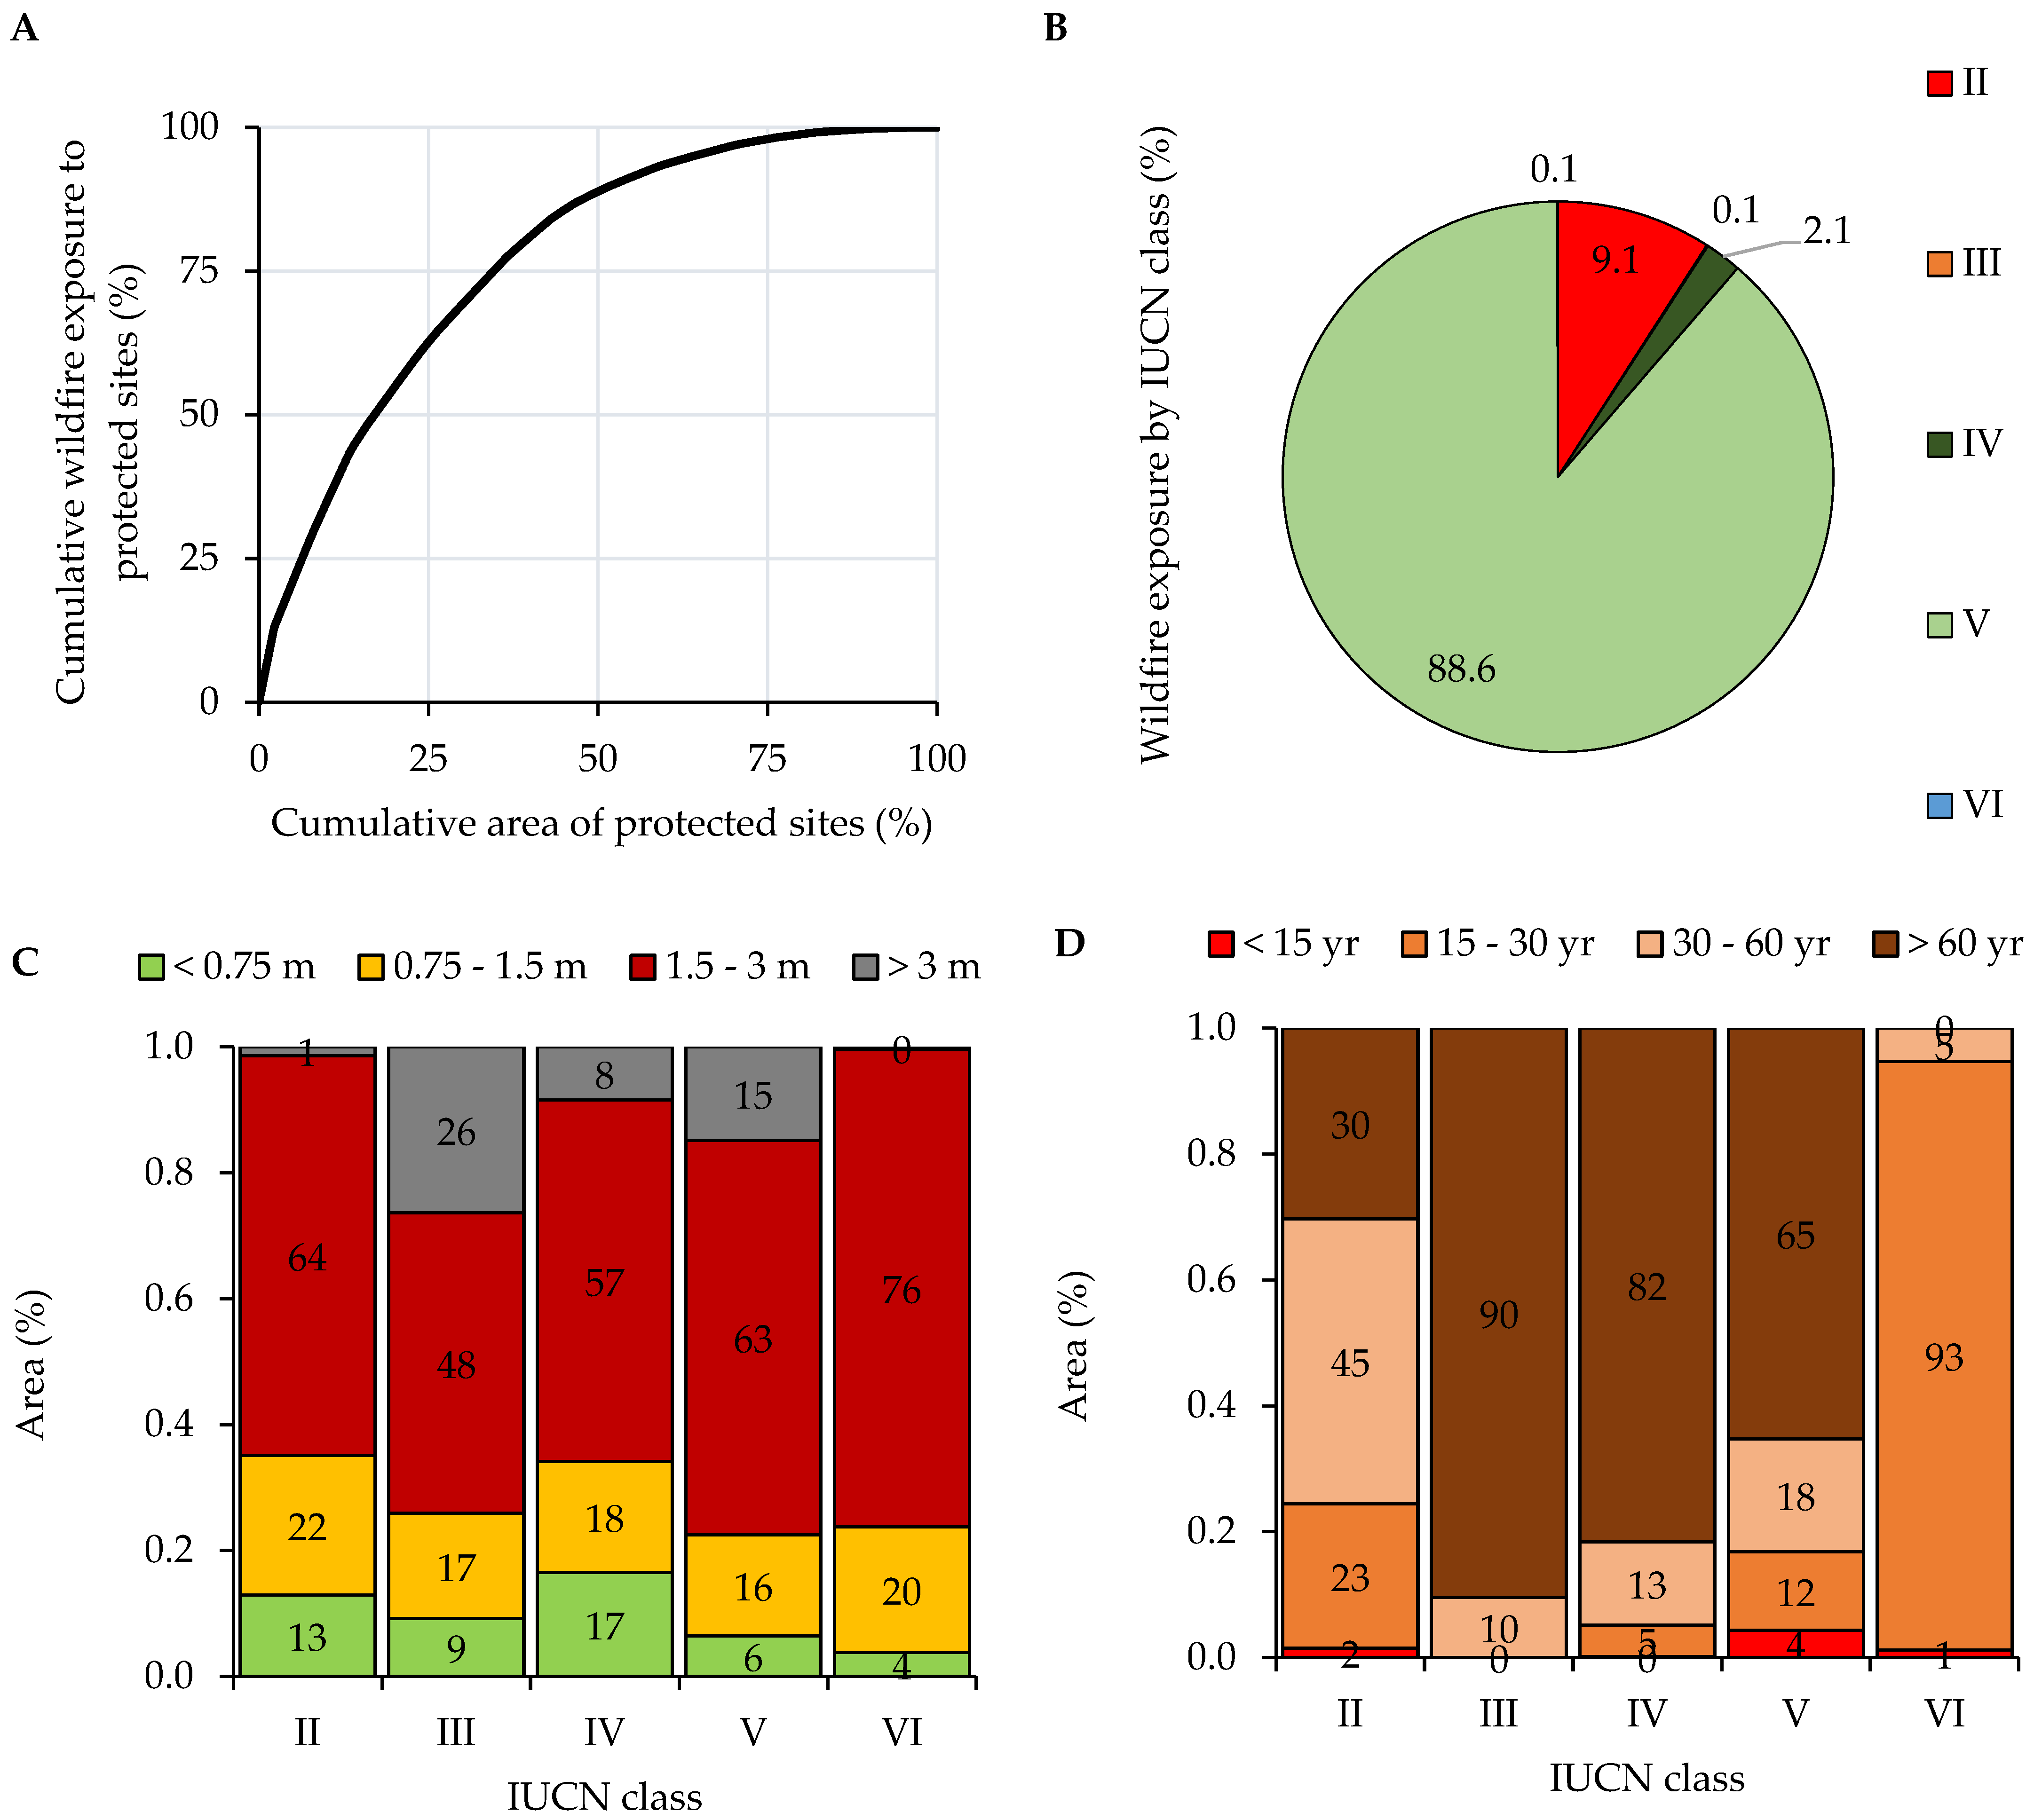
Table 1.
Extreme fire weather conditions (99th percentile) for Portugal’s different macro-areas or pyro regions (Figure 1A). We determined the wildfire season winds (speed and direction), frequency scenarios, and fuel moisture content for each macro-area. Abbreviations: Alentejo (ALE), Algarve (ALG), Alto Portugal (APO), Beira Alta (BAL), Beira Baixa (BBA), Beira Douro (BDU), Beira Littorals (BLI), Eastern Beira Serra (EBS), Western Beira Serra (WBS), Estremadura (EST), Estremadura interior (EIN), Northeast Transmontane (NTR), Northeast Cismontane (NCI), and Sado e Ribajejo (SER).
| Macroarea (Code) | Wind Speed (km h−1) and Frequency (%) by Wind Direction Scenario | Fuel Moisture Content (%) | |||||||||||
|---|---|---|---|---|---|---|---|---|---|---|---|---|---|
| 45° | 90° | 135° | 180° | 225° | 270° | 315° | 360° | 1 h | 10 h | 100 h | LH | LW | |
| ALE (1) | - | - | - | 16 (6) | 18 (10) | 18 (20) | 18 (50) | 16 (14) | 4 | 4 | 5 | 29 | 52 |
| ALG (2) | - | - | 24 (6) | 19 (6) | 21 (8) | 21 (12) | 26 (36) | 24 (32) | 6 | 7 | 8 | 32 | 56 |
| APO (3) | 13 (12) | 14 (14) | 14 (6) | 18 (6) | 19 (11) | 16 (22) | 14 (16) | 14 (13) | 7 | 9 | 13 | 38 | 67 |
| BAL (4) | 18 (20) | 18 (12) | - | 23 (6) | 24 (10) | 16 (21) | 18 (22) | 14 (9) | 4 | 7 | 9 | 35 | 62 |
| BBA (5) | 18 (12) | - | - | - | 19 (12) | 18 (30) | 18 (30) | 14 (16) | 5 | 6 | 8 | 34 | 60 |
| BDO (6) | 14 (18) | 16 (15) | - | 21 (6) | 21 (10) | 16 (23) | 16 (18) | 14 (10) | 4 | 9 | 11 | 36 | 64 |
| BLI (7) | 16 (7) | 21 (8) | 26 (5) | 31 (6) | 29 (7) | 21 (8) | 24 (32) | 24 (27) | 4 | 7 | 9 | 39 | 68 |
| EBS (8) | 19 (8) | - | - | 23 (10) | 23 (10) | 18 (14) | 18 (25) | 18 (23) | 6 | 8 | 10 | 37 | 66 |
| WBS (9) | 16 (10) | 18 (8) | - | - | 21 (6) | 19 (12) | 19 (48) | 16 (16) | 3 | 7 | 9 | 37 | 66 |
| EST (10) | - | - | - | - | - | 23 (10) | 26 (45) | 31 (45) | 5 | 6 | 9 | 35 | 62 |
| EIN (11) | 18 (8) | 19 (6) | - | - | 24 (8) | 19 (15) | 21 (51) | 18 (12) | 6 | 7 | 10 | 36 | 64 |
| NTR (12) | 14 (22) | 16 (9) | - | 21 (8) | 21 (13) | 18 (24) | 16 (15) | 13 (9) | 7 | 8 | 10 | 32 | 57 |
| NCI (13) | 14 (12) | 16 (14) | 16 (5) | 24 (8) | 24 (9) | 16 (15) | 19 (22) | 18 (15) | 9 | 12 | 15 | 45 | 70 |
| SER (14) | - | - | - | - | 24 (8) | 19 (16) | 23 (52) | 23 (24) | 5 | 7 | 9 | 34 | 60 |
Table 2.
Historic wildfire activity within the different macro-areas of Portugal (Figure 1) from 1985 to 2019. We considered a 100-ha large fire threshold to describe the fire activity in the different macro-areas. See macro-area abbreviations in Table 1. We used the annually burned area to determine the number of fire ignitions required to replicate a burned area equivalent to 10,000 years per macro-area.
| Macroarea (Code) | Area (ha) | Burned Area (ha yr−1) | Burned Area (% yr−1) | Avg. Number of Large Fire Ignitions (# yr−1) | Avg. Large Fire Size (ha) |
|---|---|---|---|---|---|
| ALE (1) | 1,857,550 | 3806 | 0.20 | 8.7 | 456 |
| ALG (2) | 611,754 | 6000 | 0.98 | 4.0 | 2615 |
| APO (3) | 647,300 | 17,473 | 2.70 | 2.7 | 457 |
| BAL (4) | 507,460 | 14,719 | 2.90 | 16.6 | 973 |
| BBA (5) | 501,825 | 2867 | 0.57 | 4.0 | 1464 |
| BDO (6) | 338,182 | 12,868 | 3.80 | 15.0 | 530 |
| BLI (7) | 516,748 | 4160 | 0.81 | 5.5 | 1108 |
| EBS (8) | 666,240 | 9821 | 1.47 | 10.9 | 807 |
| WBS (9) | 666,240 | 12,986 | 1.95 | 7.8 | 2538 |
| EST (10) | 658,780 | 2930 | 0.44 | 5.7 | 422 |
| EIN (11) | 658,780 | 6819 | 1.04 | 4.3 | 1598 |
| NTR (12) | 702,152 | 11,195 | 1.59 | 19.1 | 491 |
| NCI (13) | 687,862 | 15,690 | 2.28 | 32.9 | 376 |
| SER (14) | 1,208,855 | 3023 | 0.25 | 3.9 | 1009 |
Publisher’s Note: MDPI stays neutral with regard to jurisdictional claims in published maps and institutional affiliations. |
© 2021 by the authors. Licensee MDPI, Basel, Switzerland. This article is an open access article distributed under the terms and conditions of the Creative Commons Attribution (CC BY) license (https://creativecommons.org/licenses/by/4.0/).
Share and Cite
MDPI and ACS Style
Alcasena, F.; Ager, A.; Le Page, Y.; Bessa, P.; Loureiro, C.; Oliveira, T. Assessing Wildfire Exposure to Communities and Protected Areas in Portugal. Fire 2021, 4, 82. https://doi.org/10.3390/fire4040082
AMA Style
Alcasena F, Ager A, Le Page Y, Bessa P, Loureiro C, Oliveira T. Assessing Wildfire Exposure to Communities and Protected Areas in Portugal. Fire. 2021; 4(4):82. https://doi.org/10.3390/fire4040082
Chicago/Turabian StyleAlcasena, Fermin, Alan Ager, Yannick Le Page, Paulo Bessa, Carlos Loureiro, and Tiago Oliveira. 2021. "Assessing Wildfire Exposure to Communities and Protected Areas in Portugal" Fire 4, no. 4: 82. https://doi.org/10.3390/fire4040082