Skip to Content
FireFire
  • Article
  • Open Access

23 July 2021

Towards Understanding Fire Causes in Informal Settlements Based on Inhabitant Risk Perception

,
and
Department of Civil Engineering, Stellenbosch University, Stellenbosch 7602, South Africa
*
Author to whom correspondence should be addressed.
This article belongs to the Special Issue Fire in Human Landscapes

Abstract

Informal settlements (ISs) are a high-risk environment in which fires are often seen. In 2019 alone, 5544 IS fires were reported in South Africa. One of the main problems, when investigating an IS fire, is determining the fire cause. In the last 15 years, approximately 40% of the fire causes were classified as ‘undetermined’ in South Africa. Furthermore, the cases where the fire causes have been determined, do not provide the necessary information to comprehend why the fire started. This paper seeks to gain better insight with respect to fire causes by analysing the fire risk perception of IS inhabitants. To this end, a survey that was conducted in 2017, consisting of data from 2178 IS households, that were affected by a large-scale fire, was analysed. The survey consisted of questions relating to the fire risk perception with regards to the settlement in general, to the inhabitants’ own household, and about measures that could reduce fire risk. The analysis suggests that (a) the survey’s risk target had a strong influence on risk perception, (b) the inhabitants’ fire risk perception of their settlement is similar to that of firefighters in previous research, (c) the risk mitigation demands are more focused on decreasing the consequences of the fire than on the occurrence of a fire event, (d) the national fire statistics are not capturing the causes of real fire incidents, and (e) improvements to the documentation process after a fire event could provide critical information for the implementation of prevention measures.

1. Introduction

Informal settlements (ISs) (also known by more derogatory names such as slums, shantytowns, ghettos, etc.), are typically characterised by poverty, poor infrastructure, and high dwelling density [1]. These factors create a high-risk environment in which fires, flooding, and other hazards are often seen [2,3]. Focusing on fire risk, the following socio-economic conditions enhance the probability of having a fire event: hazardous lighting, cooking and heating methods; informal electric supply; and alcohol abuse [2]. Furthermore, there are factors such as poor construction materials, close proximity between the dwellings, poor accessibility (that hinder firefighters’ operations), and lack of water supply, that influence the fire spread rates.
In 2019 alone, 5544 IS fires were reported in South Africa [4]. Fire departments attended to these fires and completed a Fire & Rescue Service Incident Report (FRSIR) for each incident. Even though the fire cause should be stated in the FRSIR, its determination is a complex endeavour, considering the lack of physical evidence left at the scene [5]. Hence, it is not a surprise that in the last 15 years an average of 37% of fire causes were classified as ‘undetermined’ [6]. The remaining 63% of fires, where the fire causes have been determined, generally do not provide the necessary information to comprehend why the fire started.
According to the NFPA 921 [7], fire cause can be defined as “the circumstances, conditions, or agencies that bring together a fuel, ignition source, and oxidizer (such as air or oxygen) resulting in a fire or a combustion explosion”. NFPA 921 [7] also indicates that to determine the fire cause it is necessary to identify the factors (ignition source, first fuel ignited, circumstances) that allow the fire to have occurred. The official fire causes used in the FRSIR, with the data compiled by the Fire Protection Association of Southern Africa (FPASA), are smoking, electrical fault, open flames, cooking, heating, lighting, arson, undetermined, unrest, welding and cutting, or others. It is unknown if the definitions of the official fire causes are only focussed on the ignition source or if it considers the other two factors mentioned in [7], namely the first fuel ignited and circumstances. As an example, consider a fire that starts with a cardboard lining being ignited by flames coming from a paraffin stove that was unattended. The use of unsafe cooking methods, leaving the stove unattended, and placing the stove too close to combustible materials would be the factors that led to the fire. Would this fire cause be categorized as cooking or open flames according to FPASA guidelines? It is likely that this will depend on the person completing the report.
Cicione et al. [8] listed the main fire causes associated with IS fires in South Africa according to (a) fire brigades, (b) IS residents and (c) the statistics provided by the FPASA. The results exhibit a high level of discrepancy from one source to the other. Firefighters perceive the misuse of alcohol, the use of open flames, and arson as the most probable causes of fire. On the other hand, the inhabitants perceive cooking techniques and equipment, children left home alone, and the use of candles as the most probable causes of fire in ISs. These results can be interpreted as different groups of people having different risk perceptions. Risk perception can be defined as the “subjective assessment of the probability of a specified type of accident happening and how concerned we are with the consequences” [9]. Additionally, it is interesting to note that inhabitants’ answers include fire cause factors such as ignition sources (open flames, candles), and circumstances (irresponsible behaviour).
With the above-mentioned in mind, it is clear that there is a real need to gain a better understanding with respect to fire causes in an informal settlement. The authors postulate that this can be done by understanding the fire risk perception of IS inhabitants. Risk can be defined as the product of the probability of an event occurring and the consequence of the event [10]. Hence, fire risk considers conditions, situations, or/and behaviour that could affect the probability, and the consequences of the fire event. It is also important to note here that not all individuals will have the same risk perception of a specific risk. There are several factors that can influence individuals’ risk perception such as the individual’s exposure to the risk [11,12,13], demographics of the individual, and the risk target [11,12,14,15]. In [14] it is stated that risk target refers “to whom the risk is supposed to pertain”. According to Sjöberg [12], risk perception depends not only on the properties of the hazards as social context also plays a significant role.
Pharoah [2] described, in-depth, the fire risk of an IS in Cape Town. The author worked with the Monitoring, Mapping and Analysis of Disaster Incidents in Southern Africa (MANDISA) database that allowed her to develop a better understanding of the fire risk profile. The database compiled data from the disaster management unit and the fire services [2]. Zweig et al. [15] conducted a survey consisting of 852 IS households in the Wallacedene settlement which is located in Cape Town, South Africa. Their aim was to obtain insights with respect to the fire risk in the settlement, taking into consideration the fact that this settlement had just gone through an electrification programme. The impact of experience on the risk perception of wildland fires has been studied by McGee et al. [16]. The authors conducted surveys and 40 people that had experienced a wildfire were interviewed. They concluded that, in general, their risk perception remained the same and for some even decreased after the incident. Vandeventer [11] noted that these types of fire research findings have been inconsistent. Arvai et al. [13] investigated the contribution of several factors to the risk perception of wildland fires. The authors noted that people emphasize the influence of uncontrollable factors such as extreme temperatures and wind. Another important finding in [13] was the fact that wildland fires were perceived as “unpredictable, not foreseeable, and hence not controllable”, thus, it was perceived that the implementation of prevention measures could not make a difference to the outcome.
This paper seeks to gain a better understanding of the fire causes in ISs, by studying the fire risk perception of IS inhabitants. To this end, the authors analysed the data collected after the Imizamo Yethu (IY) fire that affected approximately 2200 dwellings in 2017 [17]. Thula Thula Hout Bay, a non-profit organisation that actively supports and partners with the local community, especially providing post-disaster relief, conducted surveys of households in the area to determine the level of fire awareness of the inhabitants after the IY incident. The survey considered three questions related to fire risk perception, two directed at the greatest fire risk in IY, and one focused on the measures that could reduce the fire risk. The remainder of this work presents (a) a background to the IY complex, (b) details about the survey, (c) the results, and (d) the discussion of the findings.

2. Imizamo Yethu Informal Settlement

As mentioned above, ISs present certain characteristics that make them extremely vulnerable to large conflagrations. These conditions vary from settlement to settlement; therefore, it is important to have a better understanding of the IY informal settlement in particular. In the subsections that follow, the location and demographics, the living conditions, and a summary of some of the fires that had occurred in IY are presented.

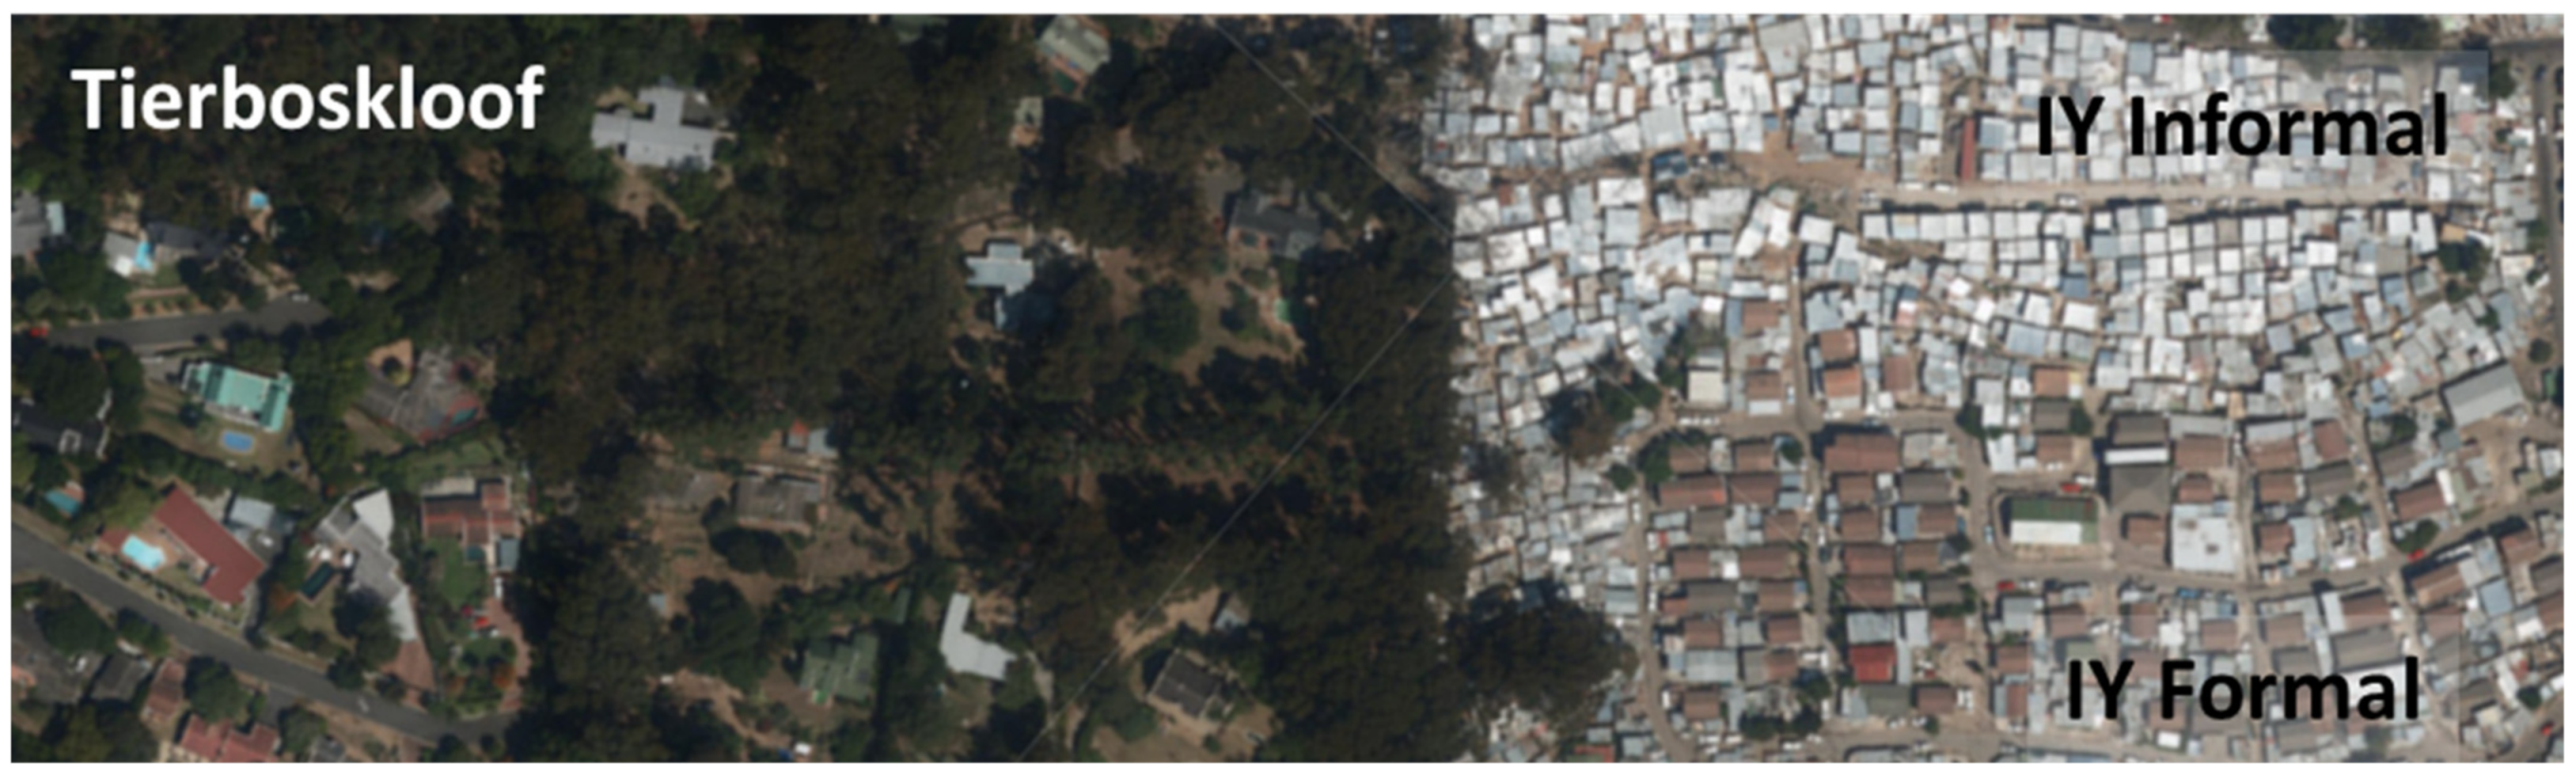
2.1. Location and Demographics

The Imizamo Yethu informal settlement is located on a mountain slope in the Hout Bay Valley in Cape Town South Africa. The last Census in South Africa was conducted in 2011, which showed that the IY settlement had a population of 15,538 people in an area of 0.571 km2, meaning that the settlement density is approximately 27,227 people/km2 [18]. This is more than 43 times the population density of the rest of Hout Bay and almost three times higher than the city centre of Cape Town. Figure 1 visually illustrates this situation, where on the left is Tierboskloof (an upper-income suburban area) and on the right is IY formal and informal housing [19]. According to [18], in 2011, IY’s population consisted of 55% males and 45% females, of which 91.6% of residents were Black Africans. A large variety of languages could be found in the settlement including English, Zulu, Afrikaans, and Xhosa (the latter being the predominant first language in 60% of the households).
Figure 1. Contrast between the density in Tierboskloof (left side) and the formal and informal housing in IY (right side) [20].

2.2. Living Conditions

The data used in this section uses information provided by Thula Thula’s survey that is discussed in the section below. The data collected by the organisation made it possible to characterize the living conditions of the households that were surveyed in IY as presented in Table 1.
Table 1. Living conditions in the surveyed households (n = 2178).
The household conditions match with the IY informal housing showed in Figure 1 (top-right). Most of the dwellings were constructed with corrugated iron and wood (98%) and had a floor area less than 30 m2 (94%), while only 14% had a separation of more than 1 m to the closest adjacent dwelling. Access to running water is limited, as 76% of the households stated that they fetched water from a communal tap, which in some cases (16%) was located more than 25 m away from the dwelling. Furthermore, 41% of the households had access to formal electricity, while a concerning 31% had informal electricity (i.e., electricity obtained from neighbours or directly from nearby infrastructure). The access to electricity, formal and informal, in the settlement is reflected in the preferred source of energy, as over 40% of the households used electricity for cooking and lighting purposes. 55% of the households stated that they do not use any source of energy for heating purposes, followed by 22% that use paraffin. This makes sense considering that heaters consume much more electricity than other electric devices. However, the residents mentioned that when the electrical supplies are interrupted (power cuts), people had to use more dangerous sources of energy, such as candles and paraffin. It is unknown if the interruptions in the electrical supply were due to (a) running out of allocated free units, (b) running out of paid for units, (c) load shedding, or (d) problems with the electrical infrastructure. Finally, with respect to household habits, 53% indicated that at least one member of the household drank, 34% stated that at least one of the family members smoked, and 67% of the households never cooked after 22:00 h. Table 1 provides an overview of this data.

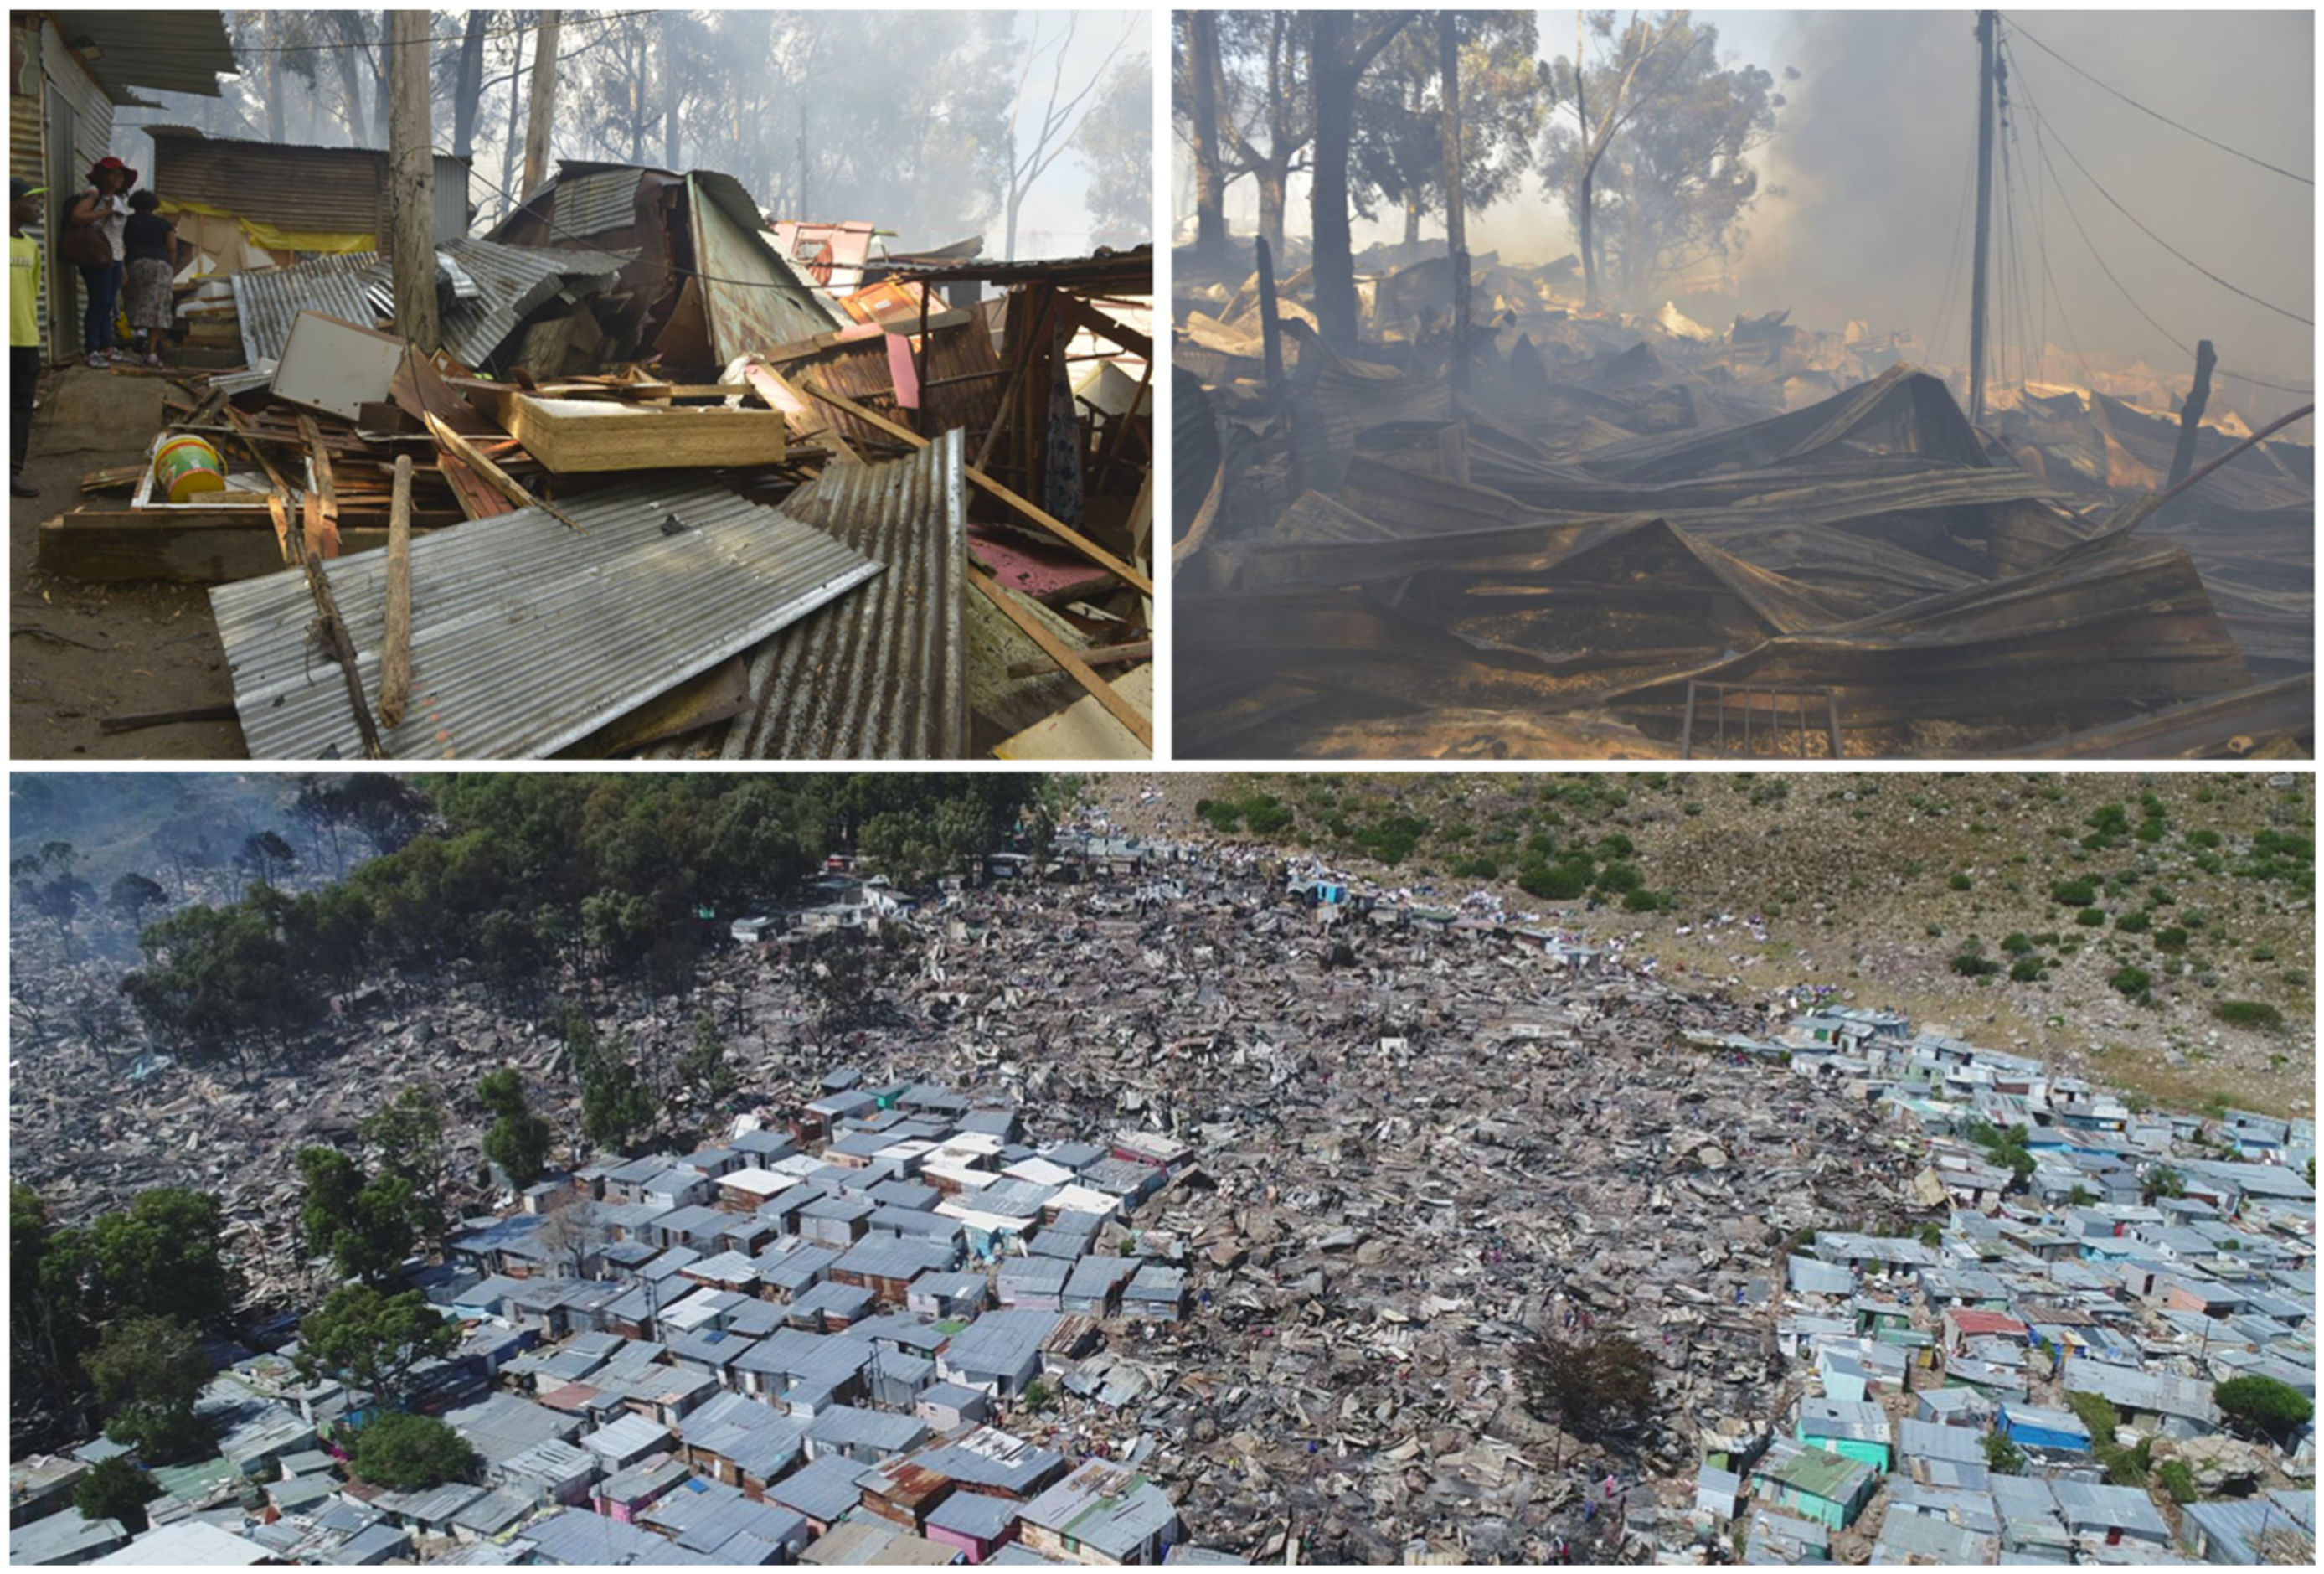
2.3. Imizamo Yethu Fires

The fire that took place in March 2017, lasted 13 h, destroyed 2194 dwellings, and left approximately 9700 people homeless. This large-scale fire event was analysed in depth by Kahanji, et al. [17], and although it was possible to reconstruct the event by estimating fire lines at different times and fire spread rates, the fire cause could not be established. This is something that usually happens in IS fires due to the rapid fire spread, the lack of physical evidence [5], and inhabitants being hesitant to give information [8,17]. Additionally, in [17] some recommendations were made to reduce the fire risk of the IY settlement. However, three years later (on 6 September 2020), another large fire took place, destroying 263 dwellings and affecting around 1500 inhabitants [21]. Fortunately, there were no fatalities in this fire; however, according to the chairperson of the South African National Civic Organisation (SANCO) in Hout Bay, eight people have died in IY due to fire events since 2017 [21]. One of the affected residents stated that this is the third time that his household has been burnt in a fire (2014, 2017, and 2020). “Every three years, is this bad luck?” he wonders [21]. However, considering the number of fires that take place every year specifically in ISs all over the world, such situations could be expected. According to the Thula Thula survey, when asked ‘Has your household experienced a fire before?’ only 23% of the households replied ‘never’ while 49% said ‘one time’, 18% ‘two times’, 7% ‘three times’ and 3% ‘four or more times’.
For wildland fires, it is expected that after a fire has occurred, it would take at least a number of years before another fire occurs in the same area again (since most of the combustible material has been burnt). This is not applicable in IS fires, where there is a rapid rebuild rate after a fire [5,22]. Table 2 presents some of the fires that have occurred in IY since March 2017. These fires were large enough to appear in newspapers, but it is likely that there are many more that were not covered by the media. It can be seen that only a month after the large fire in March 2017, another fire occurred, affecting families that just finished building their new dwellings [23]. One of the victims stated, “It is difficult to change one’s behaviour, but we always advise members to prepare food before going to shebeens” [23], drawing attention to the fact that cooking while drunk is possibly one of the riskiest actions in ISs. A ‘shebeen’ refers to a local tavern or informal restaurant where alcohol is often consumed.
Table 2. Fires in IY since 2017 as reported in the media.
Figure 2 depicts the aftermath of the first fire mentioned in Table 2. It is possible to observe the high level of destruction, as all the combustible materials have been burnt and only metal sheets are left.
Figure 2. Fire aftermath IY March 2017 (Images used courtesy of Bruce Sutherland, City of Cape Town).

3. Survey

This section describes the survey conducted by Thula Thula Hout Bay, which consisted of 2178 households located in the Imizamo Yethu IS. The survey was carried out in 2017, over a period of five months (August to December). The survey’s structure, the data processing, and the data’s limitations are presented in the sections that follow.

3.1. Survey Structure

The survey consisted of 24 questions, as shown in Table 3. It collected information about (a) the demographics of each household, (b) dwelling characteristics (construction materials, floor area, etc.), (c) fire protection equipment in the household, (d) lifestyle (smoking and drinking habits), (e) fire risk factors in the settlement and in the particular household, (e) measures to reduce the fire risk, and (f) access to basic services (water, electricity). While most of these questions allow for the characterisation of the settlement, and were used in the previous section, only Q6, Q7, and Q8 provide information about risk perception. It is important to note that the responses from the community to risk perception questions were not prompted/structured, which led to people giving feedback that does fit within traditional categories. However, this also highlights people’s understanding of fire risk. Open questions were used in that case allowing the interviewee to name one or more potential fire risk activities, conditions, behaviours, and preventive measures.
Table 3. Questions included in Thula Thula survey.

3.2. Data Processing

The answers provided for Q6, Q7, and Q8 (Table 3) were so diverse that they had to be categorized. Table 4 presents the 25 categories that were considered for the fire risk related questions. The categories include unsafe conditions, sources of energy and/or devices, irresponsible and deliberate behaviour. It is possible to see that ‘open flames’ appears more than once in Table 4. This is because some households indicated the specific use of open flames (e.g., open flames while cooking, heating, and/or lighting).
Table 4. Categories for the inhabitants’ risk perception answers.
Table 5 presents the 21 categories that were considered for the suggested preventive measures (question 8 in Table 3), in this work. The categories include safer living conditions, safer sources of energy and/or devices, responsible behaviour, education, and training.
Table 5. Categories for the inhabitants’ suggested preventive measures.

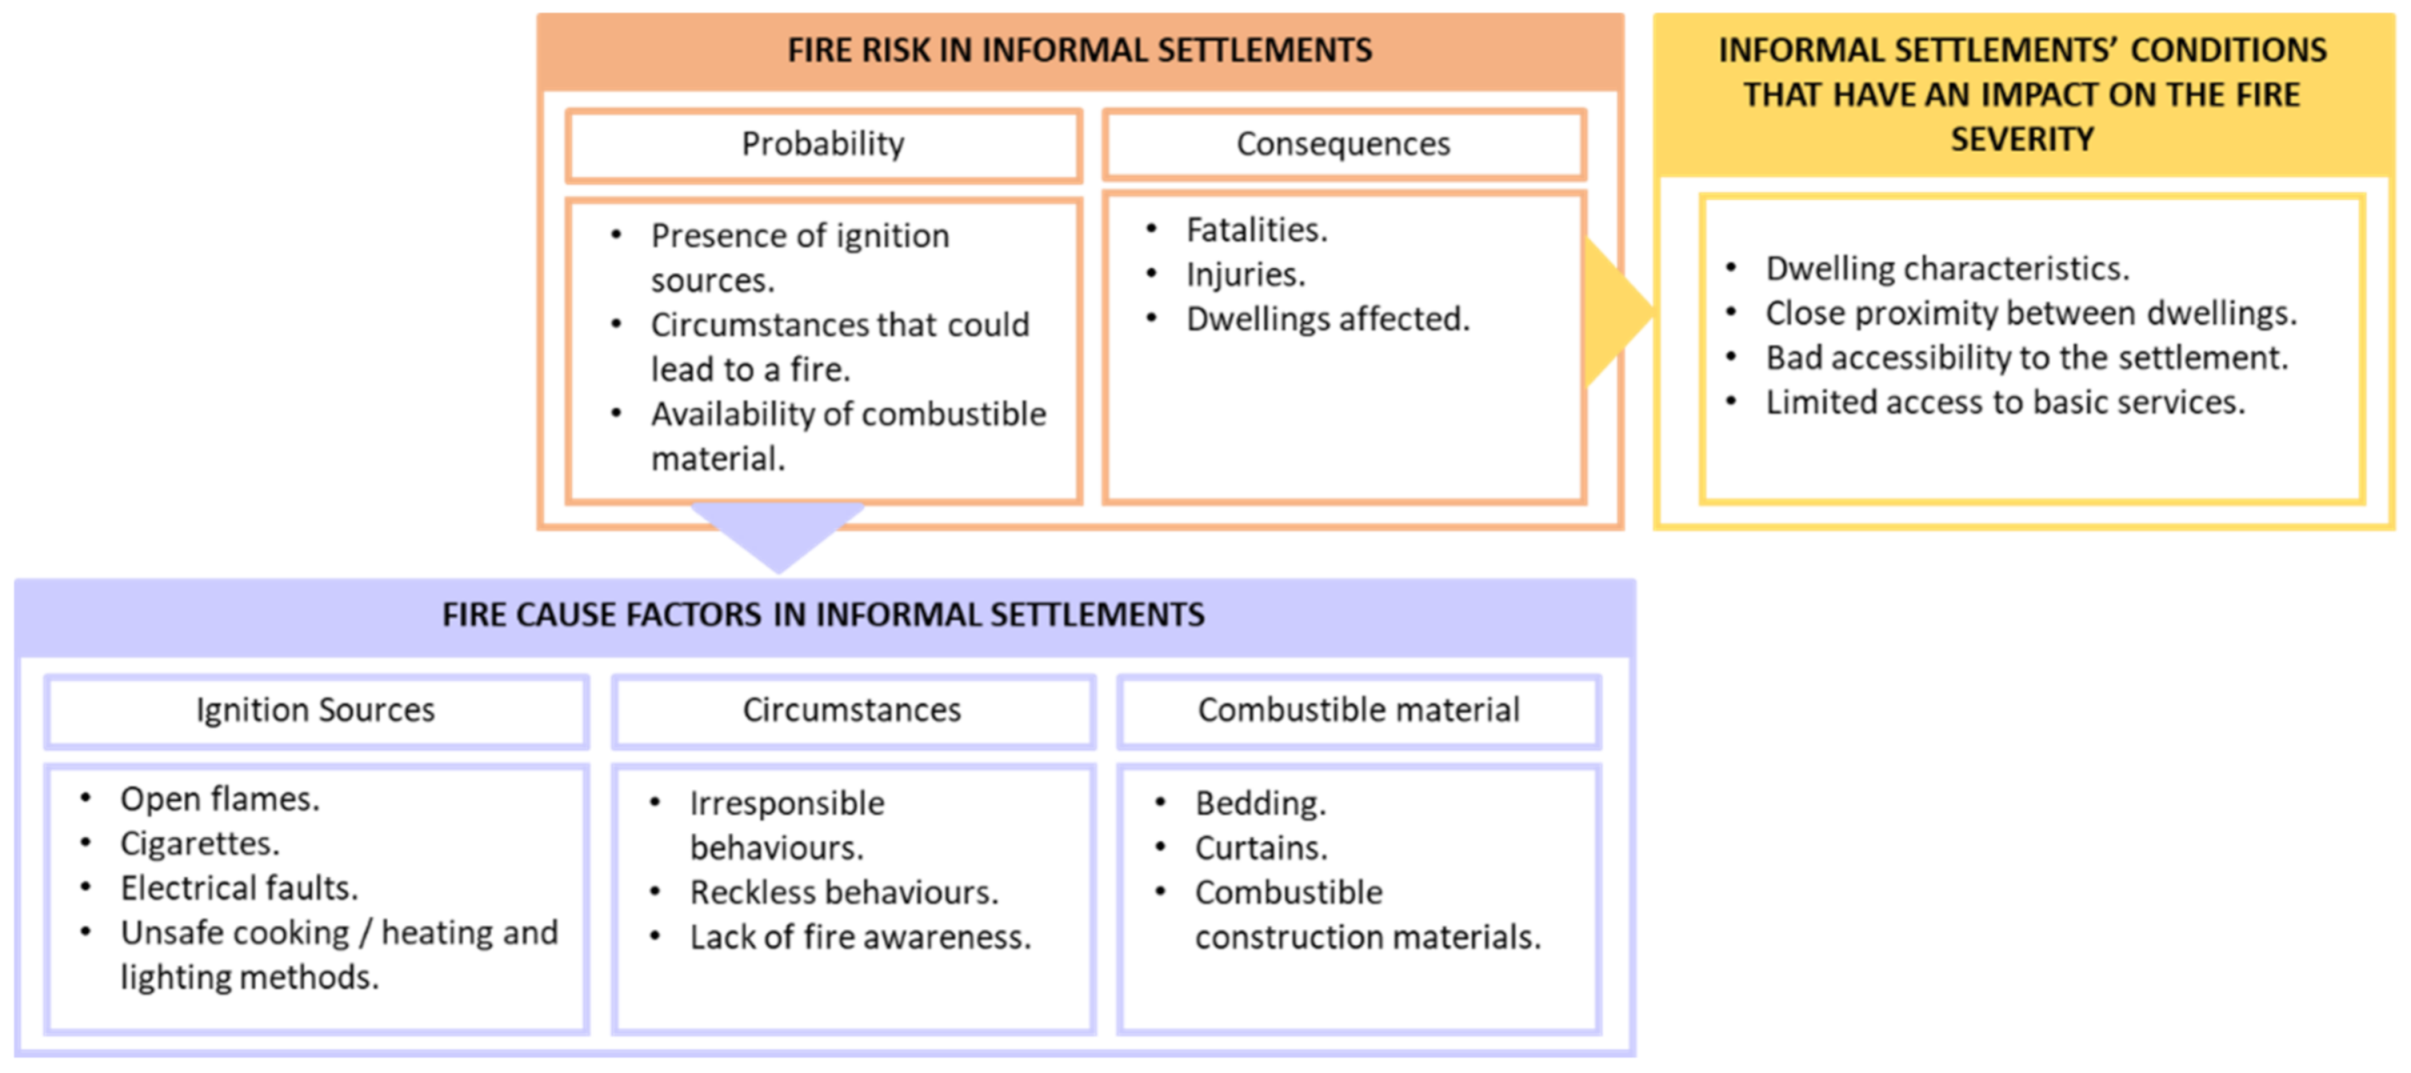
3.3. How to Go from Risk Perceptions to Fire Causes?

The survey data, presented above, focusses on the fire risk perception of the inhabitants of IY. However, this work aims to gain more knowledge about the fire cause factors. Figure 3 depicts how the information obtained from the survey can be linked to fire cause factors. The elements that will increase the probability of a fire occurring are essentially the fire cause factors previously described. The consequences will depend on the fire severity. The IS’s conditions that affect the fire severity will either allow a fast-spreading fire or affect the firefighting and evacuation activities.
Figure 3. Relation between fire risk perception and fire causes.
The answers provided by the residents, Table 4 and Table 5, reflect their concern in three main areas (a) possible ignition sources (smoking, cooking), (b) circumstances that can lead to the fire or that increase the probability of one occurring (irresponsible drinking behaviour, lack of parental control) and (c) factors that will have an impact on fire spread (houses that are closely built to each other, informal houses). It is possible to associate the first and second areas to the official fire causes specified in the FRSIR (‘unrest’ and ‘welding and cutting’ were excluded because they were not mentioned by the residents). Table 6 presents the official fire cause associated with the ones obtained from the risk perception of the IY residents (Table 4). Table 6 shows that the possible fire causes observed by the residents provide much more detail. Additionally, the data illustrates that due to the lack of detail, there could be a problem with accurately fitting the fire cause in one of the nine categories. A clear example of this are the categories ‘open flames’, ‘cooking’, ‘heating’, and ‘lighting’, since open flames are used for cooking, heating, or lighting purposes. The lack of detailed information is one of the main obstacles to developing preventive measures in ISs. Finally, even though the third area is related to the consequences of a fire, it still offers interesting insights on problematics that are often seen in ISs.
Table 6. Official fire cause vs. Fire cause observed by the residents.

3.4. Limitations

The major limitation of this study is the fact that the survey was not conducted with the aim of gaining information about the fire causes in IS fires. Additionally, factors that could influence the inhabitants’ risk perception were not accounted for. For example, it is not only important to ask how many fires a household had previously experienced. It is also necessary to collect additional information. Were they intimately related with the fire? When did the fire occur? Were they at home when the fire took place? Over what period did the fires occur? Understanding the different experiences within the affected settlement could be useful to understand the risk perception of the residents. Finally, the data collection process only considered the IY IS, which makes the findings of this work less robust compared to a scenario where the survey included a variety of settlements with different weather and living conditions, locations, access to basic services, demographics, etc.

4. Results

As introduced above, the survey had two questions related to fire risk perception in the IY IS. One was directed at the settlement (general risk) and the other at the household (personal risk). The fact that the survey included two risk targets allow this work to test the “unrealistic optimism” phenomenon [12,33], in which personal risk is underestimated in comparison with the general risk (i.e., people think that the risk that they create is significantly lower than that caused by others in the general community). This section presents (a) the main risks in IY identified by the inhabitants, (b) the main risks in households, and (c) a comparison between the answers for each risk target. An in-depth discussion regarding the inhabitants’ risk perceptions is presented in the section that follows.

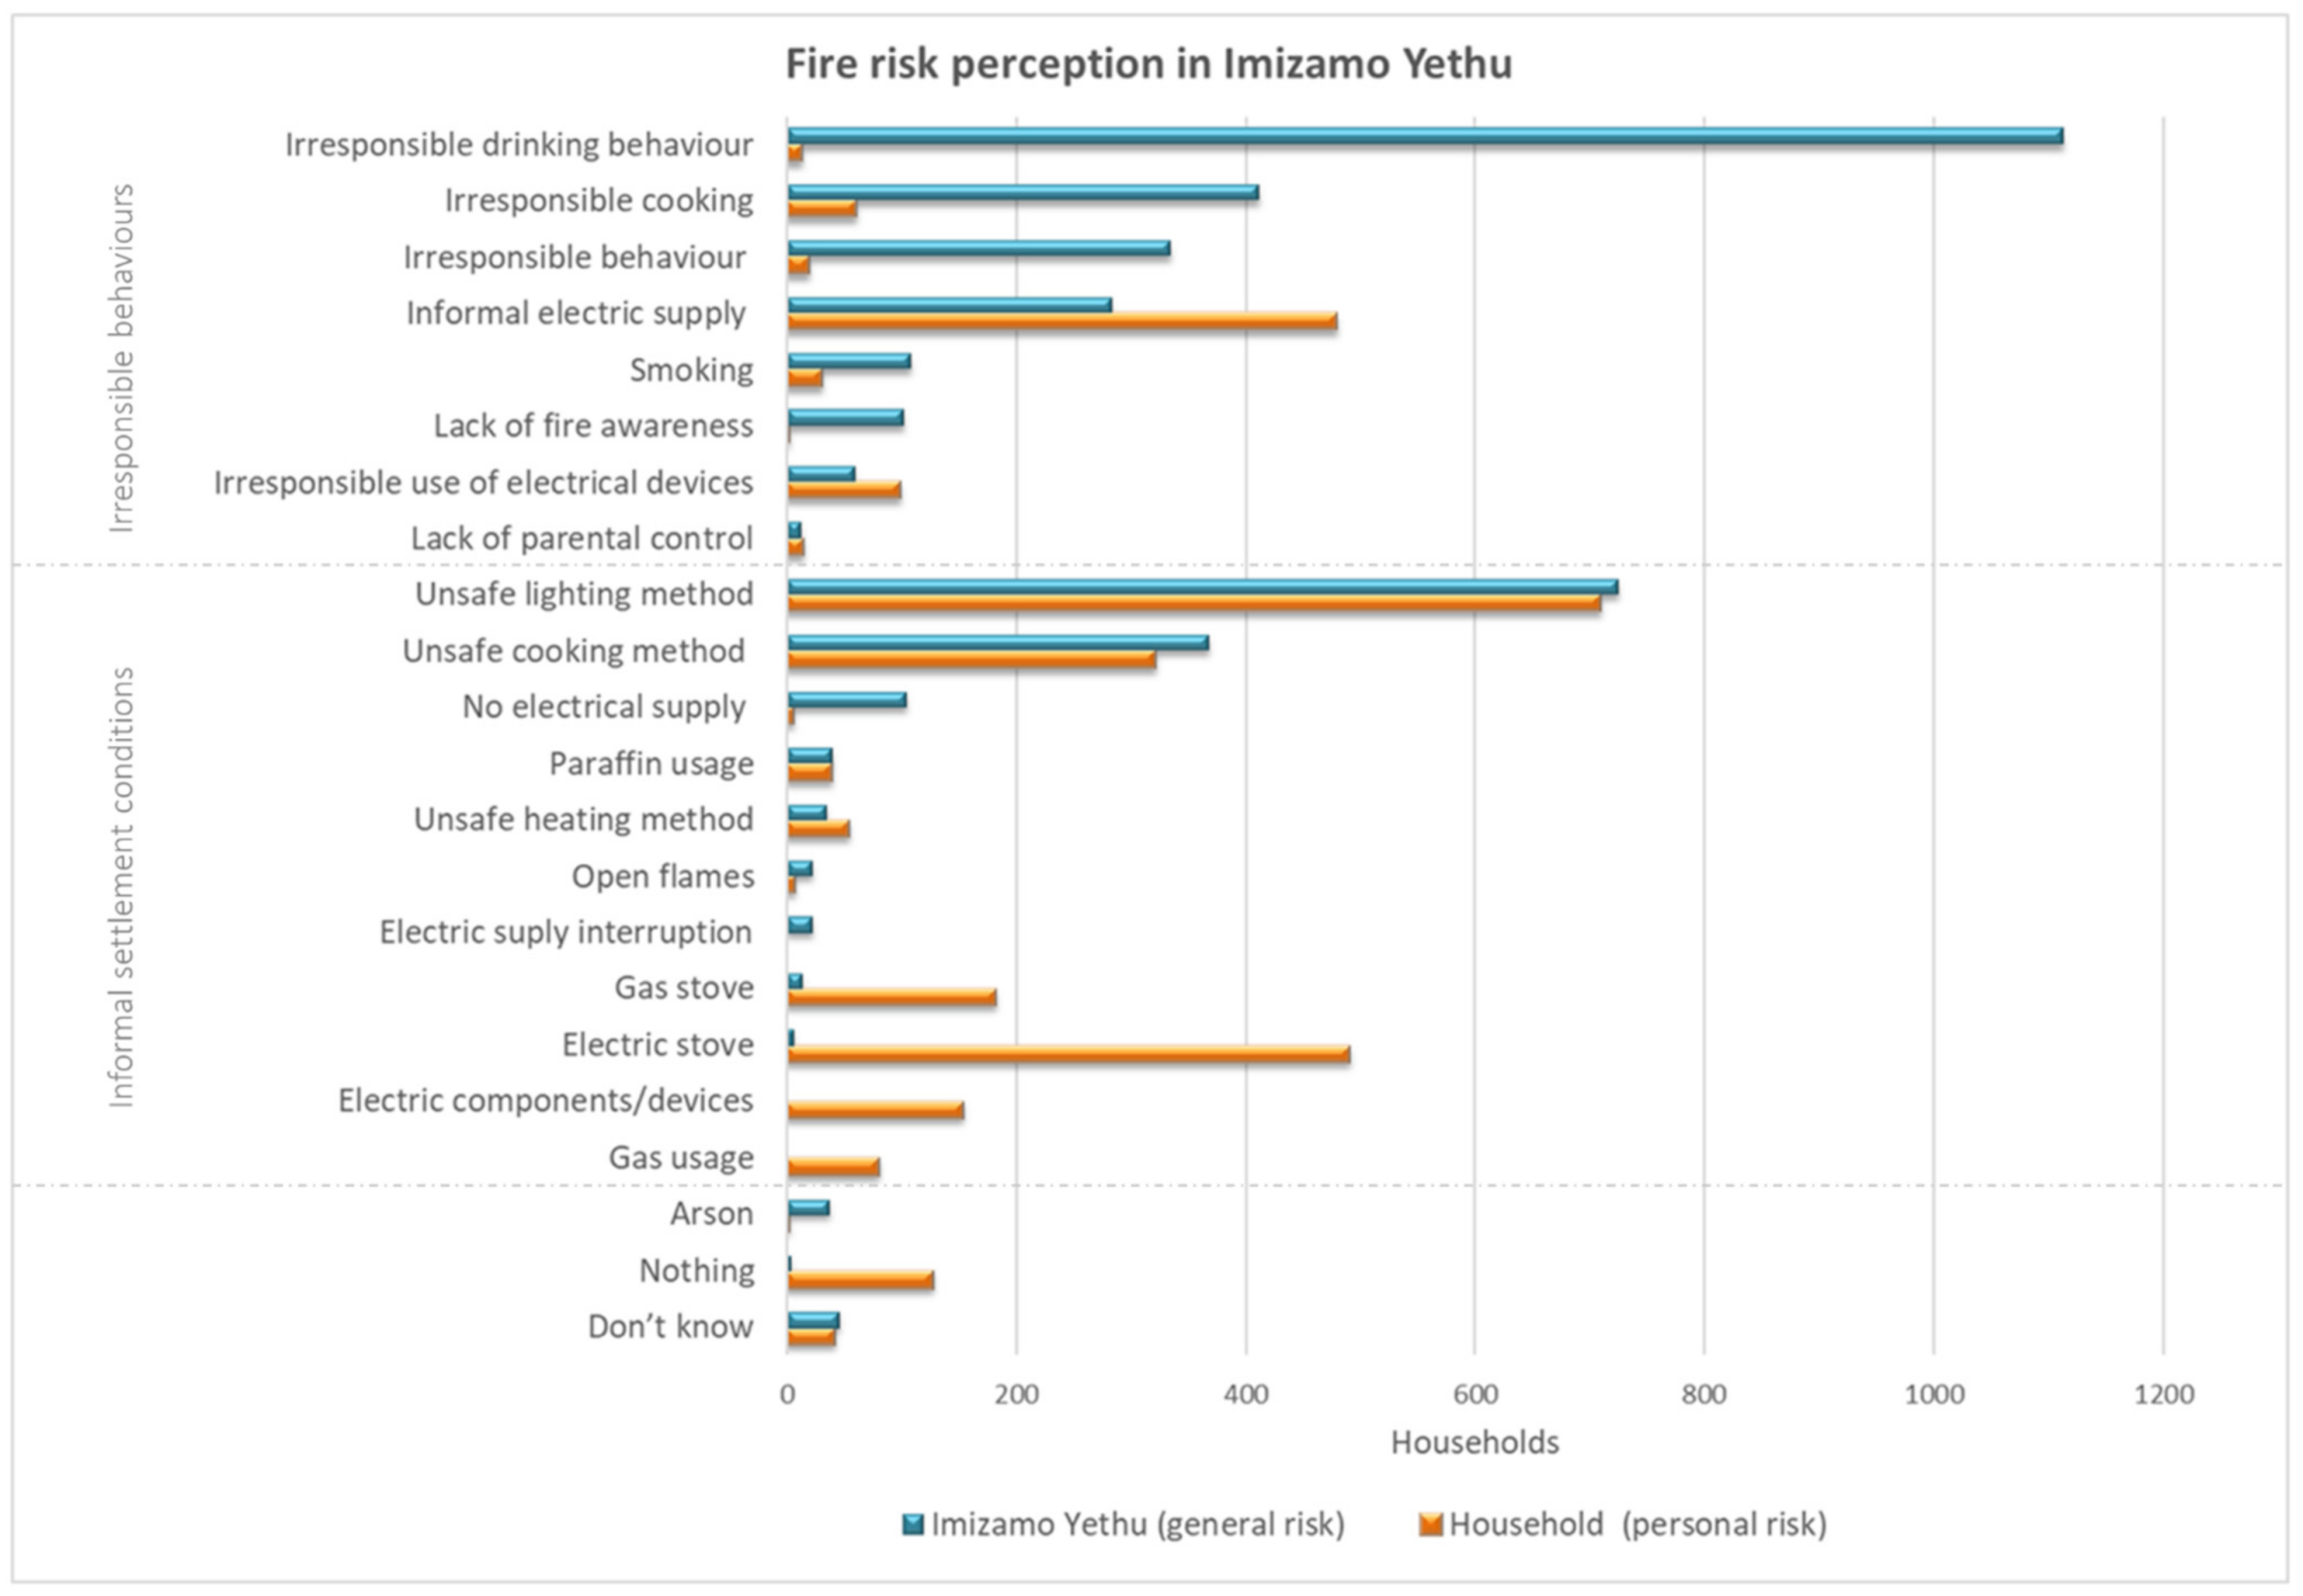
4.1. Fire Risk Perception in Imizamu Yethu

When asked ‘What do you consider to be the greatest risk in Imizamo Yethu?’ 51% of the households considered that it is ‘Irresponsible drinking behaviour’, followed by ‘Unsafe lighting method’ at 33%, ‘Irresponsible cooking’ at 19%, ‘Unsafe cooking method’ at 17%, and ‘Irresponsible behaviour’ at 15%. Table 7 presents in detail the answers given by the residents.
Table 7. Fire risk perception in IY (n = 2178).

4.2. Fire Risk in the Household

When asked ‘What do you consider to be the greatest risk in your household?’ 33% of the households considered it to be ‘Unsafe lighting method’, followed by ‘Electric stove’ with 23%, ‘Informal electric supply’ with 22% and ‘Unsafe cooking method’ with 15%. Table 8 presents in detail the answers given by the residents.
Table 8. Fire risk perception in the household.

4.3. Measures to Reduce Fire Risk

When asked ‘What are the things you would like to do to reduce fire risk?’ 33% of the households considered that it would be ‘Formal Electricity’, followed by ‘Proper houses’ at 26%, ‘Spaces between houses’ at 18% and ‘Educate’ at 10%. Table 9 presents in detail the answers given by the residents.
Table 9. Measures to reduce fire risk in IY.

5. Discussion

The analysis of the survey data provides insights into the fire risk perception of IS inhabitants and how they relate to fire causes in informal settlements. Additionally, it allows for the identification of shortfalls in the current data. These topics will be discussed in detail in this section.

5.1. Risk Perception

This section analyses the risk perception of IY’s inhabitants. The inhabitants’ risk perception of the rest of the settlement (general risk) will be presented first, followed by the risk perception of their own household (personal risk). Then a comparison is made to be able to appreciate the differences between them. Finally, the suggested preventive measures are discussed.

5.1.1. General Risk—Inhabitants’ Risk Perception of Other Residents

The main concerns of the inhabitants are irresponsible behaviour and unsafe sources of energy, with irresponsible drinking behaviour being the leading concern. This matches two of the main fire cause factors (i.e., alcohol related and open flames) mentioned in [8] by firefighters. Although there is no official information about the influence of alcohol consumption on the number of fires, it is known that it has a significant impact on the number of casualties in residential fires [34]. Focusing on Cape Town, South Africa, in 2001 alcohol intoxication was identified in 53% of the adults whose death was caused by burns [35]. Clearly, it would be important to find a way to monitor the influence of alcohol consumption on the number of IS fires.

5.1.2. Personal Risk—Inhabitants’ Risk Perception of Their Own Household

Surprisingly 6% of the households indicated that in their dwelling there was no condition, situation, or behaviour that could lead to a fire. One would then assume that those dwellings probably never experienced a fire (or inhabitants were unwilling to provide detailed answers to the surveyors); however, 70% of them experienced at least one fire incident and 16% three or more fires. It could also be the case that in the previous fire events in which the inhabitants were involved, the fire did not start in their households.
It is interesting that 23% of the households perceived ‘Electric stoves’ as a risky appliance, since electricity is often considered a safe source of energy. A possible explanation for this could be the use of informal electricity, although 64% of the residents that own electric stoves indicated that they had formal electricity supply. Additionally, some residents mentioned that electric appliances were ‘illegal’ or ‘cheap’. In [15], it was mentioned that these appliances, and electrification in general, could create a false sense of security that might generate riskier behaviour, such as unattended cooking.

5.1.3. General Risk versus Personal Risk

When analysing the results of the survey it is interesting to note the effect of the risk target on the perception of the risk. Figure 4 presents a comparison between the answers given for the different risk targets. The graph was divided into sections to group irresponsible behaviour and conditions inherent to ISs. When the target was the IY settlement, the answers tended to show a focus on people’s irresponsible behaviour. In contrast, when the target was the household (of people living within the IY settlement) the concern was directed to unsafe sources of energy and devices. This could be related to the risk denial or unrealistic optimism phenomenon. In this case, factors that are beyond their control, (i.e., unsafe lighting and cooking) are over-emphasised and factors within their control (i.e., behaviour such as irresponsible cooking or irresponsible drinking) are underestimated. It has been acknowledged by Sjöberg that the unrealistic optimism phenomenon is more pronounced in lifestyle risks such as alcohol consumption or smoking [36]. Figure 4 clearly depicts that situation, while there are factors that present a similar level of risk perception such as unsafe lighting or cooking methods, or the usage of paraffin, others such as irresponsible drinking behaviour and irresponsible cooking vary significantly. Additionally, in [36] it is stated that general risk perception is more important for policy attitudes.
Figure 4. IY inhabitants’ risk perception. General risk vs. personal risk.

5.1.4. Measures to Reduce Fire Risk

Sjöberg [37] acknowledged that risk mitigation demands are not always aligned with risk perception. He states that, even though the risk is a combination of probability and consequences, when perceiving a risk, the probability of that event happening is predominant, while for the risk mitigation measures, the consequences play a more significant role. That is shown in the survey where three of the top five measures shown in Table 9 (proper houses, spaces between houses, and better access), were not acknowledged when consulted about the fire risk. Those measures do not have a direct impact on the occurrence of a fire event, but on fire spread. It has been acknowledged that the living conditions in ISs have a great impact on fire spread to adjacent dwellings [1,5,22], which is clearly one of the main consequences that these types of fires produce.

5.2. Fire Cause

5.2.1. Official Fire Causes versus Fire Cause Factors Observed by the Residents

As mentioned above, the fire cause factors identified by the inhabitants are much more detailed than the official fire causes selected by firefighters (see Table 6). However, the FRSIR allows the firefighter to add details about the fire cause. Furthermore, sometimes firefighters have more details that they do not include in reports (e.g., if they suspect that the fire started as a consequence of a person being under the influence of alcohol or drugs the information is often not included). Table 10 illustrates this situation. The details can be entered in an open text field in the FRSIR. This gives more freedom to the user, but at the same time makes the compilation process harder, which might be one of the reasons why this information is not included in the national statistics. As seen in Table 10, the information that the firefighters collect at the fire scene could be relevant to develop evidence-based interventions.
Table 10. Information firefighters collect at the fire scene as recorded in the FRSIR.
Figure 5 compares the official fire causes in informal settlements as compiled by the FPASA [4] with the inhabitants’ risk perception results from this work and with the firefighters’ opinions based on a previous survey [8]. For the comparison, 9 of the 11 official fire causes were considered. Two additional categories, (gang-related and irresponsible drinking behaviour), were included, even though they are not shown in the national statistics. While ‘gang related’ could be considered as ‘arson’ it is interesting to notice that this aspect was not mentioned by any of the surveyed households. It is possible that in IY in particular, gangs are less of a problem, but in other IS this could be an important factor to bear in mind. The influence of alcohol consumption is also relevant, being one of the main concerns for the IY inhabitants and for the firefighters interviewed in [8]. In recent work, Arce et al. [38] interviewed Costa Rican firefighters to understand IS fires in that country. It is interesting to notice that several of the fire causes mentioned match with the ones observed in this work.
Figure 5. Comparison of fire cause in IS perception.

5.2.2. Recommendations for Improving the National Data Collection

It is recommended that for fires in IS more information could be added to the FRSIR that would allow one to better understand the details pertaining to the cause of the fire. Efforts should be directed at those categories in which uncertainties are present. In the case of an electrical fault, it is necessary to know the type of electric supply the household had and what type of device or component failed. For open flames, it is important to know what they were being used for (i.e., cooking, lighting, heating). For cooking, heating, and lighting, it is important to know the source of energy and the type of device that was being used. Additionally, it is important to document if the fire originated due to a device or component failing or due to people’s irresponsible behaviour.
To improve the FRSIR, it is suggested that it would be possible to take, as an example, the National Fire Incident Reporting System (NFIRS) [39]. The reporting modules can provide guidelines to incorporate valuable information to the FRSIR. Among others, the NFIRS requires information about (a) ignition, (b) cause of ignition, (c) human factors contributing to ignition, (d) equipment involved in ignition, and (e) equipment power source (Table 11 provides more details). It might seem that this information is difficult to obtain in an IS fire due to the lack of physical evidence. However, the firefighters, through witnesses’ testimonies, already have access to part of it (see Table 10).
Table 11. Extract of NFIRS’s Chapter 4-Fire Module (NFIRS-2) [39].

6. Conclusions

The work has provided novel insights regarding fire causes by understanding the fire risk perception of the IY IS complex inhabitants. By analysing the residents’ fire risk perception, it was possible to see the influence that the risk target has on the answers. Depending on the risk target, certain factors are over- or under-estimated (e.g., alcohol abuse, irresponsible behaviour). Interestingly, when focusing on general risk, the inhabitants’ perception is similar to that which firefighters had in previous research. However, their perceptions still present high levels of discrepancy with the national statistics. This gives significant reason to believe that the national fire statistics are not capturing the causes of real fire incidents and that the fire cause determination information is severely lacking and potentially highly inaccurate. Some of the factors that could contribute to this situation are (a) the lack of evidence left at the fire scene, (b) the limited time and resources available to the fire department to allow them to conduct a fire investigation, (c) safety concerns in more hostile settlements, and (d) the limited information that is documented after a fire. The latter is the aspect that offers the most opportunities for improvement. It is proposed that additional information be collected during post-fire investigations, including more details about ignition, cause of ignition, human factors contributing to ignition, and equipment involved in the ignition. Additionally, the feedback of inhabitants should not be dismissed as they have intimate knowledge regarding daily happenings in settlements that influence risk and risk drivers. Ultimately, the lack of accurate fire cause data hinders the development of evidence-based interventions. Through improving fire cause knowledge, it is likely that interventions can target the areas that are causing the greatest number of fires and damages due to fires. Fire safety guidelines being developed [40] can be improved as strategies and interventions being proposed can be supported, or negated, by quantitative analyses.

Author Contributions

Conceptualization, N.F.Q. and R.W.; methodology, N.F.Q.; formal analysis, N.F.Q.; investigation, N.F.Q.; data curation, N.F.Q.; writing—original draft preparation, N.F.Q.; writing—review and editing, R.W. and A.C.; visualization, N.F.Q.; supervision, R.W.; project administration, R.W. and N.F.Q.; funding acquisition, R.W. All authors have read and agreed to the published version of the manuscript.

Funding

This research was funded by the Lloyd’s Register Foundation, grant GA 100093, the Royal Academy of Engineering/Lloyd’s Register Foundation grant ESMN 1921\1\141 and the SFPE Educational & Scientific Foundation’s Student Research Grant.

Institutional Review Board Statement

Ethical approval for access to data granted under ING-2018-6450.

Data Availability Statement

The data presented in this study are available on request to the corresponding author.

Acknowledgments

The provision of the survey data by Thula Thula made this work possible, and their excellent work to improve fire safety is gratefully acknowledged.

Conflicts of Interest

The authors declare no conflict of interest.

References

  1. Walls, R.; Olivier, G.; Eksteen, R. Informal settlement fires in South Africa: Fire engineering overview and full-scale tests on “shacks”. Fire Saf. J. 2017, 91, 997–1006. [Google Scholar] [CrossRef]
  2. Pelling, M.; Wisner, B.; Pharoah, R. Disaster Risk Reduction Cases from Urban Africa, 1st ed.; Routledge: London, UK, 2008. [Google Scholar] [CrossRef]
  3. Zweig, P.; Pharoah, R. Unique in their complexity: Conceptualising everyday risk in urban communities in the Western Cape, South Africa. Int. J. Disaster Risk Reduct. 2017, 26, 51–56. [Google Scholar] [CrossRef]
  4. FPASA. 2019 National Fire Statistics; Fire Protection Association of Southern Africa: Bryanston, South Africa, 2020. [Google Scholar]
  5. Flores Quiroz, N.; Walls, R.; Cicione, A. Developing a framework for fire investigations in informal settlements. Fire Saf. J. 2021, 120, 103046. [Google Scholar] [CrossRef]
  6. FPASA, SA National Fire Statistics 2003–2014. 2017. Available online: http://www.fpasa.co.za/journals/sa-national-fire-statistics (accessed on 9 October 2020).
  7. NFPA. NFPA 921-Guide for Fire and Explosion Investigations; National Fire Protection Association: Quincy, MA, USA, 2017. [Google Scholar]
  8. Cicione, A.; Walls, R.S.; Kahanji, C. Experimental study of fire spread between multiple full scale informal settlement dwellings. Fire Saf. J. 2019, 105, 19–27. [Google Scholar] [CrossRef]
  9. Sjöberg, L.; Moen, E.; Rundmo, T. Explaining Risk Perception: An Evaluation of the Psychometric Paradigm in Risk Perception Research; Norwegian University of Science and Technology, Rotunde: Trondheim, Norway, 2004. [Google Scholar]
  10. Watts, J.M.; Hall, J.R. Introduction to Fire Risk Analysis. In SFPE Handbook of Fire Protection Engineering; Springer: New York, NY, USA, 2016; pp. 2817–2826. [Google Scholar] [CrossRef]
  11. Vandeventer, A. Factors Influencing Residential Risk Perception in Fire-Prone Landscapes; Oregon State University: Corvallis, OR, USA, 2012; p. 32. [Google Scholar]
  12. Sjöberg, L. Factors in risk perception. Risk Anal. 2000, 20, 187–211. [Google Scholar] [CrossRef]
  13. Arvai, J.; Gregory, R.; Ohlson, D.; Blackwell, B.; Gray, R. Letdowns, Wake-up Calls, and Constructed Preferences: People’s Responses to Fuel and Wildfire Risks. J. For. 2006, 104, 173–181. [Google Scholar]
  14. Sigve, O.; Bjørg-Elin, M.; Klempe, H.; Torbjørn, R. Explaining risk perception: An empirical evaluation of cultural theory. Rotunde 2004, 85, 127. [Google Scholar] [CrossRef]
  15. Sjöberg, L. The Different Dynamics of Personal and General Risk. Risk Manag. 2003, 5, 19–34. [Google Scholar] [CrossRef]
  16. Zweig, P.; Pharoah, R.; Eksteen, R.; Walls, R. Installation of Smoke Alarms in an Informal Settlement Community in Cape Town, South Africa. Final Rep. 2018. [Google Scholar]
  17. McGee, T.K.; McFarlane, B.L.; Varghese, J. An examination of the influence of hazard experience on wildfire risk perceptions and adoption of mitigation measures. Soc. Nat. Resour. 2009, 22, 308–323. [Google Scholar] [CrossRef]
  18. Kahanji, C.; Walls, R.S.; Cicione, A. Fire spread analysis for the 2017 Imizamo Yethu informal settlement conflagration in South Africa. Int. J. Disaster Risk Reduct. 2019, 39, 101146. [Google Scholar] [CrossRef]
  19. CityPopulation. Imizamo Yethu. Available online: https://www.citypopulation.de/en/southafrica/cityofcapetown/199043__imizamo_yethu/ (accessed on 16 October 2020).
  20. Esri. Map Hout Bay Area. Available online: https://www.arcgis.com/home/webmap/viewer.html?useExisting=1&layers=10df2279f9684e4a9f6a7f08febac2a9. (accessed on 22 July 2021).
  21. DailyMaverick. The Smell of Fire Hangs in the Air in Imizamo Yethu, Dly. Maverick. Available online: https://www.dailymaverick.co.za/article/2020-09-10-the-smell-of-fire-hangs-in-the-air-in-imizamo-yethu/ (accessed on 15 October 2020).
  22. Flores Quiroz, N.; Walls, R.; Cicione, A.; Smith, M. Fire incident analysis of a large-scale informal settlement fire based on video imagery. Int. J. Disaster Risk Reduct. 2021, 55. [Google Scholar] [CrossRef]
  23. SundayTimes. Another Fire in Imizamo Yethu Leaves One Dead and 400 Homeless. 2017. Available online: https://www.timeslive.co.za/news/south-africa/2017-04-17-another-fire-in-imizamo-yethu-leaves-one-dead-and-400-homeless/ (accessed on 16 October 2020).
  24. EyewitnessNews. 60 Left Homeless Following Imizamo Yethu Fire. 2017. Available online: https://ewn.co.za/2017/08/21/60-people-left-homeless-following-imizamo-yethu-fire (accessed on 16 October 2020).
  25. News24. Some Residents Turn on Firefighters Battling Cape Town Blaze. 2017. Available online: https://www.news24.com/news24/southafrica/news/some-residents-turn-on-firefighters-battling-cape-town-blaze-20170829 (accessed on 16 October 2020).
  26. SundayTimes. Cape Town Firefighter Attacked While Battling Blaze That Has Left 350 Homeless. 2018. Available online: https://www.timeslive.co.za/news/south-africa/2018-02-12-cape-town-firefighter-attacked-while-battling-blaze-that-left-350-homeless/ (accessed on 16 October 2020).
  27. News24. Baby’s Tiny Body after Hout Bay Fire Was “as Small as Loaf of Bread”–Witness. 2018. Available online: https://www.news24.com/news24/southafrica/news/babys-tiny-body-after-hout-bay-fire-was-as-small-as-loaf-of-bread-witness-20180703 (accessed on 16 October 2020).
  28. TheCitizen. Forty Shacks Have Been Destroyed in a Fire in Gauteng, While in Cape Town a Woman Has Been Killed in Another Shack Fire. 2018. Available online: https://citizen.co.za/news/south-africa/1968651/shack-fires-devastate-cape-town-and-gauteng/ (accessed on 16 October 2020).
  29. IOL. Scores Displaced after Fires Gut Informal Structures in Imizamo Yethu, Du Noon. 2018. Available online: https://www.iol.co.za/capetimes/scores-displaced-after-fires-gut-informal-structures-in-imizamo-yethu-du-noon-16688146 (accessed on 16 October 2020).
  30. News24. Fire Hits Mandela Park in Imizamo Yethu Again. 2019. Available online: https://www.news24.com/news24/southafrica/local/peoples-post/fire-hits-mandela-park-in-imizamo-yethu-again-20190226 (accessed on 16 October 2020).
  31. News24. Hout Bay Blaze Extinguished, No Injuries Reported. 2019. Available online: https://www.news24.com/news24/southafrica/news/hout-bay-blaze-extinguished-no-injuries-reported-20200106 (accessed on 16 October 2020).
  32. News24. 200 People Left Homeless after Fire Breaks out in Hout Bay’s Mandela Park. 2020. Available online: https://www.news24.com/news24/southafrica/news/200-people-left-homeless-after-fire-breaks-out-in-hout-bays-mandela-park-20200706 (accessed on 16 October 2020).
  33. Cicione, A.; Beshir, M.; Walls, R.S.; Rush, D. Full-Scale Informal Settlement Dwelling Fire Experiments and Development of Numerical Models. Fire Technol. 2020, 56, 639–672. [Google Scholar] [CrossRef] [Green Version]
  34. Ahrens, M. Home Structure Fires; NFPA Research: Quincy, MA, USA, 2019. [Google Scholar]
  35. Van Niekerk, A.; Laubscher, R.; Laflamme, L. Demographic and circumstantial accounts of burn mortality in Cape Town, South Africa, 2001–2004: An observational register based study. BMC Public Health 2009, 9, 374. [Google Scholar] [CrossRef] [PubMed] [Green Version]
  36. Sjöberg, L. Risk perception of alcohol consumption. Alcohol. Clin. Exp. Res. 1998, 22, 277s–284s. [Google Scholar] [CrossRef]
  37. Sjöberg, L. Risk perception: Experts and the public. Eur. Psychol. 1998, 3, 1–12. [Google Scholar] [CrossRef]
  38. Arce, S.G.; Jeanneret, C.; Gales, J.; Antonellis, D.; Vaiciulyte, S. Human behaviour in informal settlement fires in Costa Rica. Saf. Sci. 2021, 142, 105384. [Google Scholar] [CrossRef]
  39. FEMA. National Fire Incident Reporting System; US Fire Administration National Fire Data Center: Charlotte, NC, USA, 2015.
  40. Walls, R.; Cicione, A.; Pharoah, R.; Zweig, P.; Smith, M.; Antonellis, D. Fire Safety Engineering Guideline for Informal Settlements: Towards Practical Solutions for a Complex Problem in South Africa; FireSUN Publications: Stellenbosch, South Africa, 2020. [Google Scholar]
Publisher’s Note: MDPI stays neutral with regard to jurisdictional claims in published maps and institutional affiliations.

Article Metrics

Citations

Article Access Statistics

Multiple requests from the same IP address are counted as one view.