Article

Characterizing Spatial and Temporal Variability of Lightning Activity Associated with Wildfire over Tasmania, Australia

1
School of Geography, Planning, and Spatial Sciences, University of Tasmania, Hobart, Tasmania 7001, Australia
2
Bureau of Meteorology, Hobart, Tasmania 7000, Australia
3
Department of Infrastructure Engineering, Faculty of Engineering and IT, The University of Melbourne, Melbourne, Victoria 3010, Australia
*
Author to whom correspondence should be addressed.
Submission received: 5 February 2021 / Revised: 23 February 2021 / Accepted: 24 February 2021 / Published: 2 March 2021
(This article belongs to the Special Issue Bushfire in Tasmania)

Abstract

:
Lightning strikes are pervasive, however, their distributions vary both spatially and in time, resulting in a complex pattern of lightning-ignited wildfires. Over the last decades, lightning-ignited wildfires have become an increasing threat in south-east Australia. Lightning in combination with drought conditions preceding the fire season can increase probability of sustained ignitions. In this study, we investigate spatial and seasonal patterns in cloud-to-ground lightning strikes in the island state of Tasmania using data from the Global Position and Tracking System (GPATS) for the period January 2011 to June 2019. The annual number of lightning strikes and the ratio of negative to positive lightning (78:22 overall) were considerably different from one year to the next. There was an average of 80 lightning days per year, however, 50% of lightning strikes were concentrated over just four days. Most lightning strikes were observed in the west and north of the state consistent with topography and wind patterns. We searched the whole population of lightning strikes for those most likely to cause wildfires up to 72 h before fire detection and within 10 km of the ignition point derived from in situ fire ignition records. Only 70% of lightning ignitions were matched up with lightning records. The lightning ignition efficiency per stroke/flash was also estimated, showing an annual average efficiency of 0.24% ignition per lightning stroke with a seasonal maximum during summer. The lightning ignition efficiency as a function of different fuel types also highlighted the role of buttongrass moorland (0.39%) in wildfire incidents across Tasmania. Understanding lightning climatology provides vital information about lightning characteristics that influence the probability that an individual stroke causes ignition over a particular landscape. This research provides fire agencies with valuable information to minimize the potential impacts of lightning-induced wildfires through early detection and effective response.

1. Introduction

Lightning is a weather phenomenon that is episodic and highly variable in space and time [1]. It is also a significant contributor to “wildfires” (interchangeable with “bushfire”) in temperate and high latitude areas during summer months [2,3,4,5]. Lightning-ignited fires typically burn larger areas on average than human-caused ignitions because they often occur at upper elevations and in remote locations as well as in large spatial and temporal clusters [6,7,8,9]. Moreover, lightning-induced fires have the potential to smolder undetected over a long period and burst into flames when weather conditions are suitable [10]. Wildfires have already caused extensive damage and concern, and an increase in fire danger or changes in the frequency, intensity, or timing of fires, will have substantial effects on natural systems [11] and human communities [12].
Although individual weather elements directly influence ignition potential, large-scale atmospheric features and processes are also associated with lightning occurrence [13]. Lightning activity is formed due to development of atmospheric instability and to thermodynamic processes which influence its frequency and intensity [14,15]. Lightning activity is projected to increase with higher temperature and continuing climate change [16,17,18,19,20]. It has been predicted, for example, that lightning activity might increase by 10% for every 1 °C temperature rise [21]. Increased CO2 levels have in turn been associated with greater convection and increased lightning strikes [19]. Topography in conjunction with favorable synoptic weather systems may also trigger convection [22] resulting in thunderstorms [23] and lightning [24].
In addition to the lightning characteristics, the probability of a sustained ignition requires other factors to coincide, including fuel availability and fuel moisture content at the time of the strike as determined by vegetation type, antecedent and current rainfall, as well as weather condition [25,26]. Fire weather variables including temperature, lightning, precipitation and wind play significant roles in fuel drying, ignition, spread and extinction of fires [26,27,28]. In the last decades, a wide range of studies over southeast Australia have suggested a potential increase in severe fire weather conditions [29,30,31,32,33,34,35] and this is expected to intensify and extend over greater area with continued global warming [36,37].
However, knowledge concerning the characteristics of a single lightning stroke that might ignite a fire is also important, providing vital information for understanding lightning-ignited wildfires in different spatial and temporal extents. The determination of a likelihood of ignition per lightning stroke would be of great value for fire management by government and fire-fighting agencies.
Lightning-ignited wildfires could be easily described using a reliable lightning–wildfire association, for instance by clarifying ignition source [38], investigating the characteristics of lightning-ignited fires [39], estimating the holdover duration [40], and modelling lightning fire occurrence [6]. Unfortunately, none of the available datasets explicitly link lightning strikes to the corresponding ignition. Identifying with absolute certainty the lightning stroke-ignited fire by simply searching within the lightning dataset thus remains a challenge. However, continuous improvements to Lightning Location Systems (LLSs) in association with fire-history datasets could produce valuable information and assist in the identification of ignition candidates that resulted in an active ignition [41,42,43]. Over the past decades, this technology has inspired numerous scientists from broad geoscience and atmospheric disciplines to investigate lightning characteristics and/or their relationship with natural fires in the United States [44,45,46,47,48], Canada [41,49,50,51], Europe [42,52,53,54,55,56,57,58,59,60] and the eastern Mediterranean [61,62,63,64,65]. Despite the interest in long-term characteristics of lightning strikes that ignite bushfires in Australia, there have only been a few studies in the Northern Territory [66] and Victoria [8].
The chance of ignition per lightning flash, referred to as “lightning ignition efficiency” (LIE) [67], has also been studied in different parts of the world, such as the USA [68,69], Canada [6,41,67], Europe [39,42] and Australia [8]. According to Fuquay [70] from 1% to less than 0.1% of all cloud-to-ground (CG) lightning strikes start a fire that ends up being detected and requires suppression. LIE values found in the literature range, for instance, between 1% and 4% in much of North America [71], 0.07% in Alberta and 2% in British Columbia, Canada [41], 0.07% in Catalonia, Spain [39] and 0.015% per stroke in Finland [42]. In Australia, LIE per stroke was estimated as 0.42% in Victoria [8]. However, the different regional probabilities should be compared with caution, because each data source has different detection efficiencies.
The probability of lightning ignitions could potentially be influenced by frequency [72], polarity (positive or negative), multiplicity (the number of strokes per lightning flash) and the existence of a long continuing current (LCC) in the CG lightning stroke [73,74]. It is generally accepted that lightning with LCC is an important factor as it generates sufficient heat to ignite a fire [39,74,75,76,77]. Given consistent results in the literature finding that positive flashes are typically associated with longer LCC, there is speculation that positive flashes may more often ignite wildfires compared to negative flashes due to increased temperature generated [71,78,79,80]. The number of return strokes (multiplicity) is another factor that may increase the likelihood of ignition due to persistent contact of lightning strokes with fuel [74]. An LLS has been operated in Australia by Global Position and Tracking System Pty. Ltd. (GPATS, manufactured by TOA Systems, Inc, Melbourne, Florida, USA) covering the whole continent [81] for several decades, and through time the number of sensors and data processing methods has been increased and upgraded. However, note the LCC for a specific strike cannot be detected by GPATS, as it would require video observation.
This study aims to identify whether there is a specific geographical and temporal pattern in CG lightning strikes characteristics that can impact wildfire in Tasmania. We address this question using data obtained from 1 January 2011 to 30 June 2019 spanning the state of Tasmania. In addition to characterizing the spatial and temporal characteristics of CG lightning, a set of 315 lightning-ignited bushfires is analyzed to set a probability of ignition to each stroke. The outcome of this research provides useful insights into the role of lightning activity in Tasmania and aids in the prediction of lightning-ignited wildfire, important for early detection and rapid attack to minimize fire spread and damage.

2. Data and Methods

2.1. Study Area

Tasmania is separated from the Australian mainland by Bass Strait, approximately 250 km wide. It is bounded by the Southern Ocean to the south and west and by the Tasman Sea on the east [82,83,84]. Western Tasmania is dominated by a rugged mountain range that extends from the southwest coast inland and northward. The Tasmanian Wilderness World Heritage Area (TWWHA) is in the south-west of the state in a topographically complex landscape containing several extremely fire-sensitive endemic vegetation communities of high conservation value [85,86]. The east of the state is generally lower in altitude and has lower relief, although there are several notable mountain ranges. In general, much of eastern Tasmania is dominated by dry eucalypt forest, whereas in parts of the west, north and far south, wet eucalypt forest is common. Agricultural grasslands are common in the inland east [2]. In the west, buttongrass moorlands are extensive, occupying ~10% of the island’s land area [87] (Figure 1).
Tasmania shares with continental southeastern Australia a history of frequent fire weather and fire events, including occasional fire disasters [82,83]. Tasmania experiences fewer thunderstorms compared to the rest of southeastern Australia [88], however, recent large lightning-ignited bushfires demonstrate that there is no less a concern in Tasmania than on mainland Australia [89]. The frequency of lightning-ignited wildfires in fire agency records has significantly increased since the year 2000 as reported in a study for Tasmania [90]. Large areas in western Tasmania including World Heritage areas with high conservation value were burnt as a result of lightning strikes in 2008, 2010, 2013, 2016 and 2019. In 2016 and 2019, lightning-ignited wildfires burnt over 120,000 and 210,000 hectares respectively, including nearly 20,000 and 100,000 hectares in the World Heritage area [91]. Most of these ignitions occurred in remote and rugged areas with fire-sensitive vegetation communities, which significantly impacted fire-suppression activities.

2.2. Data

To investigate spatial and temporal patterns in lightning activity across Tasmania, we calculated a lightning proximity index from recent fire history and the location of lightning strikes associated with the ignition. Elevation, topographic position index (TPI) and aspect were used to correlate the spatial distribution of lightning strikes and topographical features. The relationship between ignition efficiency and vegetation type was also tested. In the following sections, we will explain details of the data including fire history, lightning strikes, topographical features and vegetation types.

2.2.1. Lightning-Ignited Fire History

Lightning-caused fire data were sourced from Tasmania Fire Service (TFS), and Parks and Wildlife Service (PWS), and contains details on the cause, date, time, and location of the estimated point of ignition. Ignition causes were classified into five categories: accidental (25%), deliberate (11%), planned burn (22%), undetermined (36%), and lightning induced (7%) (Figure 1). Although lightning was least common compared to the other ignition sources, 53% of total burnt area across the state during the study period was ignited by lightning. In this study, bushfires identified as being lightning-caused were chosen, resulting in 315 ignitions for the period between January 2011 and June 2019.

2.2.2. Lightning Data

Lightning observations in the GPATS data were recorded based on the time of arrival of the electromagnetic disturbance propagating away from the lightning discharge at a network of ground-based radio receivers [92]. Total lightning records for the period of study were collected by the LLS operated by GPATS. The measurements of lightning impulses at each sensor’s location were transferred to a central processing system to produce estimates for the type, location (latitude and longitude with accuracy < 250 m), time (to milliseconds as close as 0.5 apart), peak current (kA), and polarity (negative or positive) of each stroke [81]. The detection efficiency of the GPATS system varies temporally (e.g., due to ongoing changes in the hardware and software used by the commercial provider of these data), spatially (e.g., due to proximity to receivers), and between different types of lightning (e.g., for cloud-to-ground strikes or cloud-to-cloud strikes) [81,93].
Kuleshov et al. [81] suggested that the polarity of GPATS stroke data before January 2007 was not accurate, due to factors such as (i) changes in the processing of raw GPATS sensor data, implemented in January 2007, (ii) upgrades to sensor firmware, and (iii) the installation of more GPATS sensors. The number of sensors has remained stable in Tasmania since 2011, thus this study used GPATS data between 2011 and 2019.
Lightning flash consists of either one or multiple return strokes, referred to as a single or multiple stroke flash, respectively. In other words, a flash represents the entire discharge, and a stroke represents an individual discharge within the flash [94]. The multiplicity of lightning data and the percentage of single-stroke flashes was determined by grouping strokes together for consideration as a single flash if they occurred within 0.5 s in time and 7 km in both latitude and longitude of the earliest stroke in a potential grouping [95,96].

2.2.3. Topographical Characteristics

Thunderstorm development and lightning discharge are significantly influenced by topographic features [97]. Recent research on global lightning hotspots found that lightning maxima are located near major mountain ranges, revealing the importance of local topography resulting in an increase in instability and convection due to orographic lifting [98]. An approximately 25 m digital elevation model (DEM) product was used to identify the relationship of lightning strikes location related to topographic relief (http://listdata.thelist.tas.gov.au/opendata/index.html, accessed on 31 December 2013). In this study, elevation, topographic position index (TPI) and aspect were used to reveal the correlation between spatial distribution of lightning strikes and topographical features.
The “raster” package in R was used to calculate and classify elevation and aspect. TPI was also computed by comparing the elevation of each central cell against the average elevation of its neighbors following the approach in [99]. TPI determines whether a cell is more likely to be located along a ridge (positive TPI values) or in a valley (negative TPI values), and values near zero represent flat areas or areas of constant slope. In this study after a preliminary comparison of explanatory power across systematically varying neighborhood sizes, we calculated TPI using a 3 × 3 moving window as much of the study area consists of topography which is highly variable over short spatial scales.
The correlation between each topographic factor and lightning strikes was computed based on the ratio between lightning strikes in the class as a percentage of total lightning strikes and the area of each topographical factor’s range as a percentage of the entire area. The calculation process follows the principle of conditional probability [100] where the greater the ratio is, the stronger the association between lightning activity and each topographical factor and vice versa.

2.2.4. Vegetation

Tasmanian Vegetation Map (TASVEG) dataset version 3.0, published in 2013, was used to provide information about the existing vegetation groups across Tasmania [101]. TASVEG 3.0 revealed that approximately 24% of lands in Tasmania are agricultural, urban and exotic vegetation, followed by dry and wet eucalypt with 23% and 16% of total area. The remainder consists of approximately 10% rainforest, 9% buttongrass moorland and 18% scrubland, together with non-eucalypt forest, native grassland, wetland and other natural environments (Figure 1).

2.3. Spatial and Temporal Variation of Lightning Strikes

In order to visualize the seasonal variation of lightning activity from the beginning of January 2011 to end of June 2019, lightning data were transferred to a grid of about 5 km × 5 km (0.05° × 0.05° in latitude and longitude) raster format by counting the strokes within one spatial cell and per day. This procedure yielded 8740 cells with 133,742 strokes over 723 individual days. Two temporal characteristics of cloud-to-ground (CG) lightning strikes were presented as the square root of the strokes’ rate per square kilometer as well as the logarithmic form of the ratio of positive strokes (+CG) of the total number of strokes over the period 2011–2019 for the whole of the state (following Hernandez-Magallanes and Genton [102]).
The average lightning ignition efficiency (LIE) per stroke was calculated to assess temporal and spatial variability for the time period and region used for this study. The average annual chance of ignition per stroke was calculated by dividing the total number of lightning-induced fires (per month) in the dataset by the number of lightning strikes (per month). Spatially, the ignition and lightning data were aggregated into 20 km × 20 km grid cells and LIE computed per grid cell. LIE as a function of fuel type was also estimated by dividing the total number of ignitions and lightning strikes within each vegetation type.

2.4. Lightning Proximity Index Analysis

Following Pineda et al. [39], the “proximity index (A)” was applied to identify the lightning strikes that are ignition candidates. This method considers the “time delay (T)” between the ignition (time of the lightning strikes recorded by the LLS) and the bushfire notification (time recorded by TFS), as well as the “spatial distance (S)” between the two observations. The proximity index (A) for each stroke can be estimated as follows:
A = (1− T/Tmax) × (1− S/Smax)
where Tmax and Smax define the maximum holdover time and maximum buffer radius around the ignition point, respectively. To obtain a positive value for A, the delay should be below Tmax and the distance should be lesser than Smax, as well. The closer in time and space the two observations are, the closer the proximity index is to 1. The maximum holdover and buffer radius differ between study areas depending on the accuracy of the available data and environmental conditions. In this study, we considered 10 km for maximum buffer distance and 72 h for maximum holdover time in order to ensure sufficient inclusivity of ignition candidates where there is uncertainty in ignition and lightning data [103]. We tested the sensitivity of the analysis using 24-, 48-, and 120-h maximum holdover times and found that 72 h was a suitable choice for a consistent analysis over the diverse Tasmanian landscape. For each reported lightning ignited fire, all of the lightning strikes within the maximum holdover and buffer radius were considered to be “potential ignition candidates” (PIC, “potential candidate lightning” in [103]). We then selected the potential ignition candidate with the maximum value of A as the most likely ignition source, referred to hereafter as “actual ignition candidate” (AIC, “candidate lightning” in [103]).

3. Results

The specific spatial and temporal distribution of cloud-to-ground (CG) lightning strikes as well as their characteristics may have specific effects on ignition. In the next sections, the spatial and temporal variations of CG lightning strikes characteristics and their association with topographical conditions are presented, concluding with our determination of ignition efficiency as a function of time, space and vegetation.

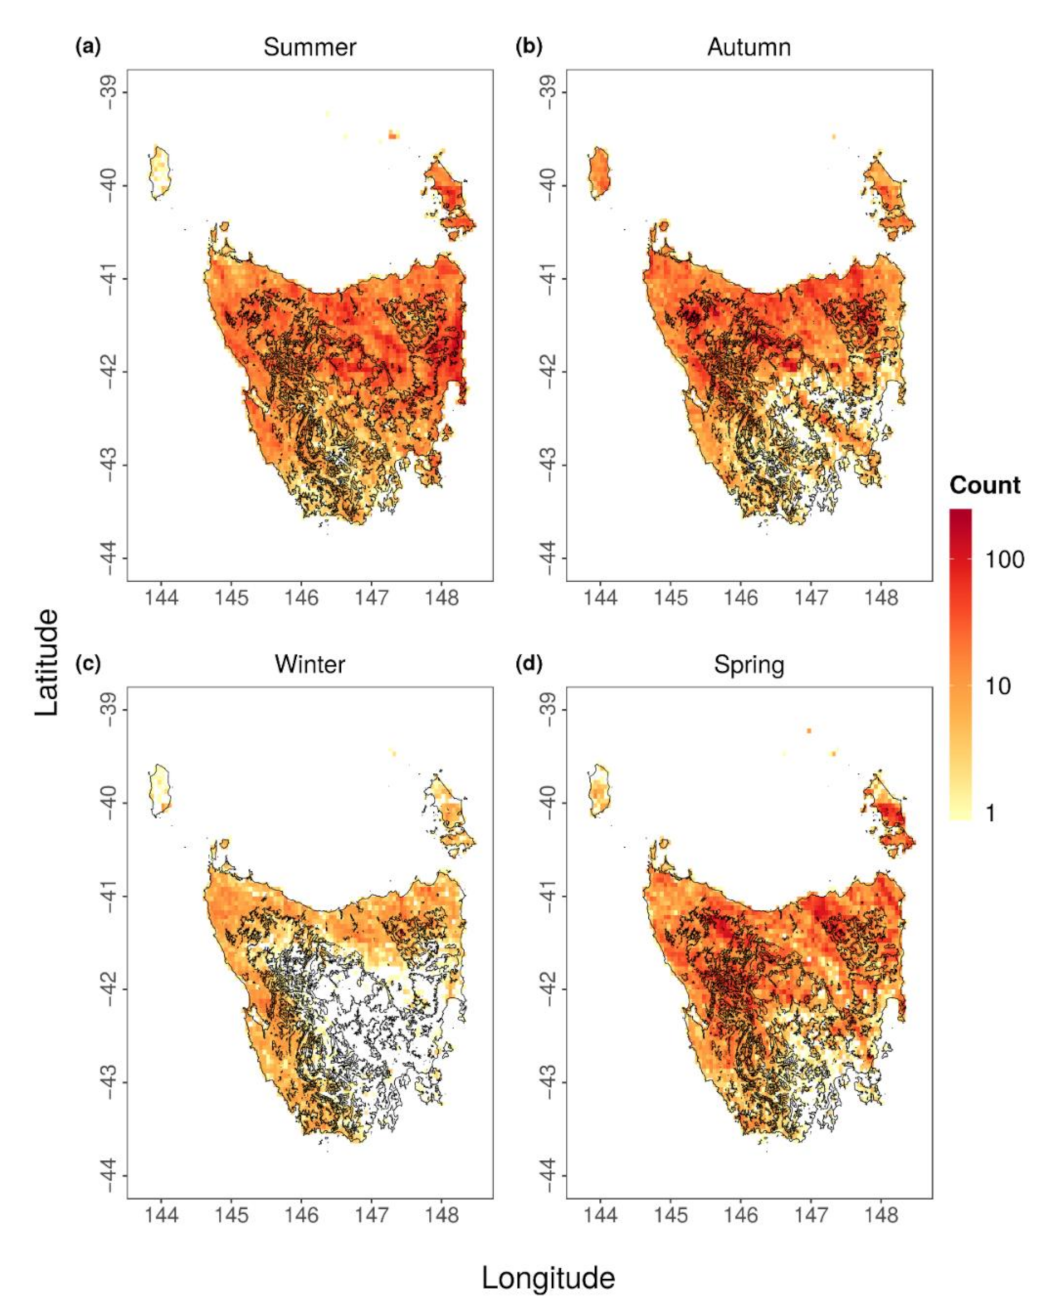
3.1. Spatial Distribution

The northern half of Tasmania experiences a larger number of CG lightning strikes compared to the southern part (Figure 2). Lightning occurred across all of Tasmania during summer (December–February), although the south/south-eastern region had less frequent strikes overall (Figure 2a). During winter fewer strokes were detected in comparison with other seasons, mostly occurring along the west and north coasts, with very few or no strokes at all in the eastern and southern regions (Figure 2c). There is a similar spatial pattern of CG strokes during autumn (March–May) and spring (September–November), respectively (Figure 2b,d). Figure 2b also shows a line of strikes extending from the north-west to south-east which is due to a single intense storm in March 2016. Across Tasmania, on average there are 7, 4, 3 and 1 strokes per 5 km × 5 km grid cell in summer, autumn, spring and winter, respectively.

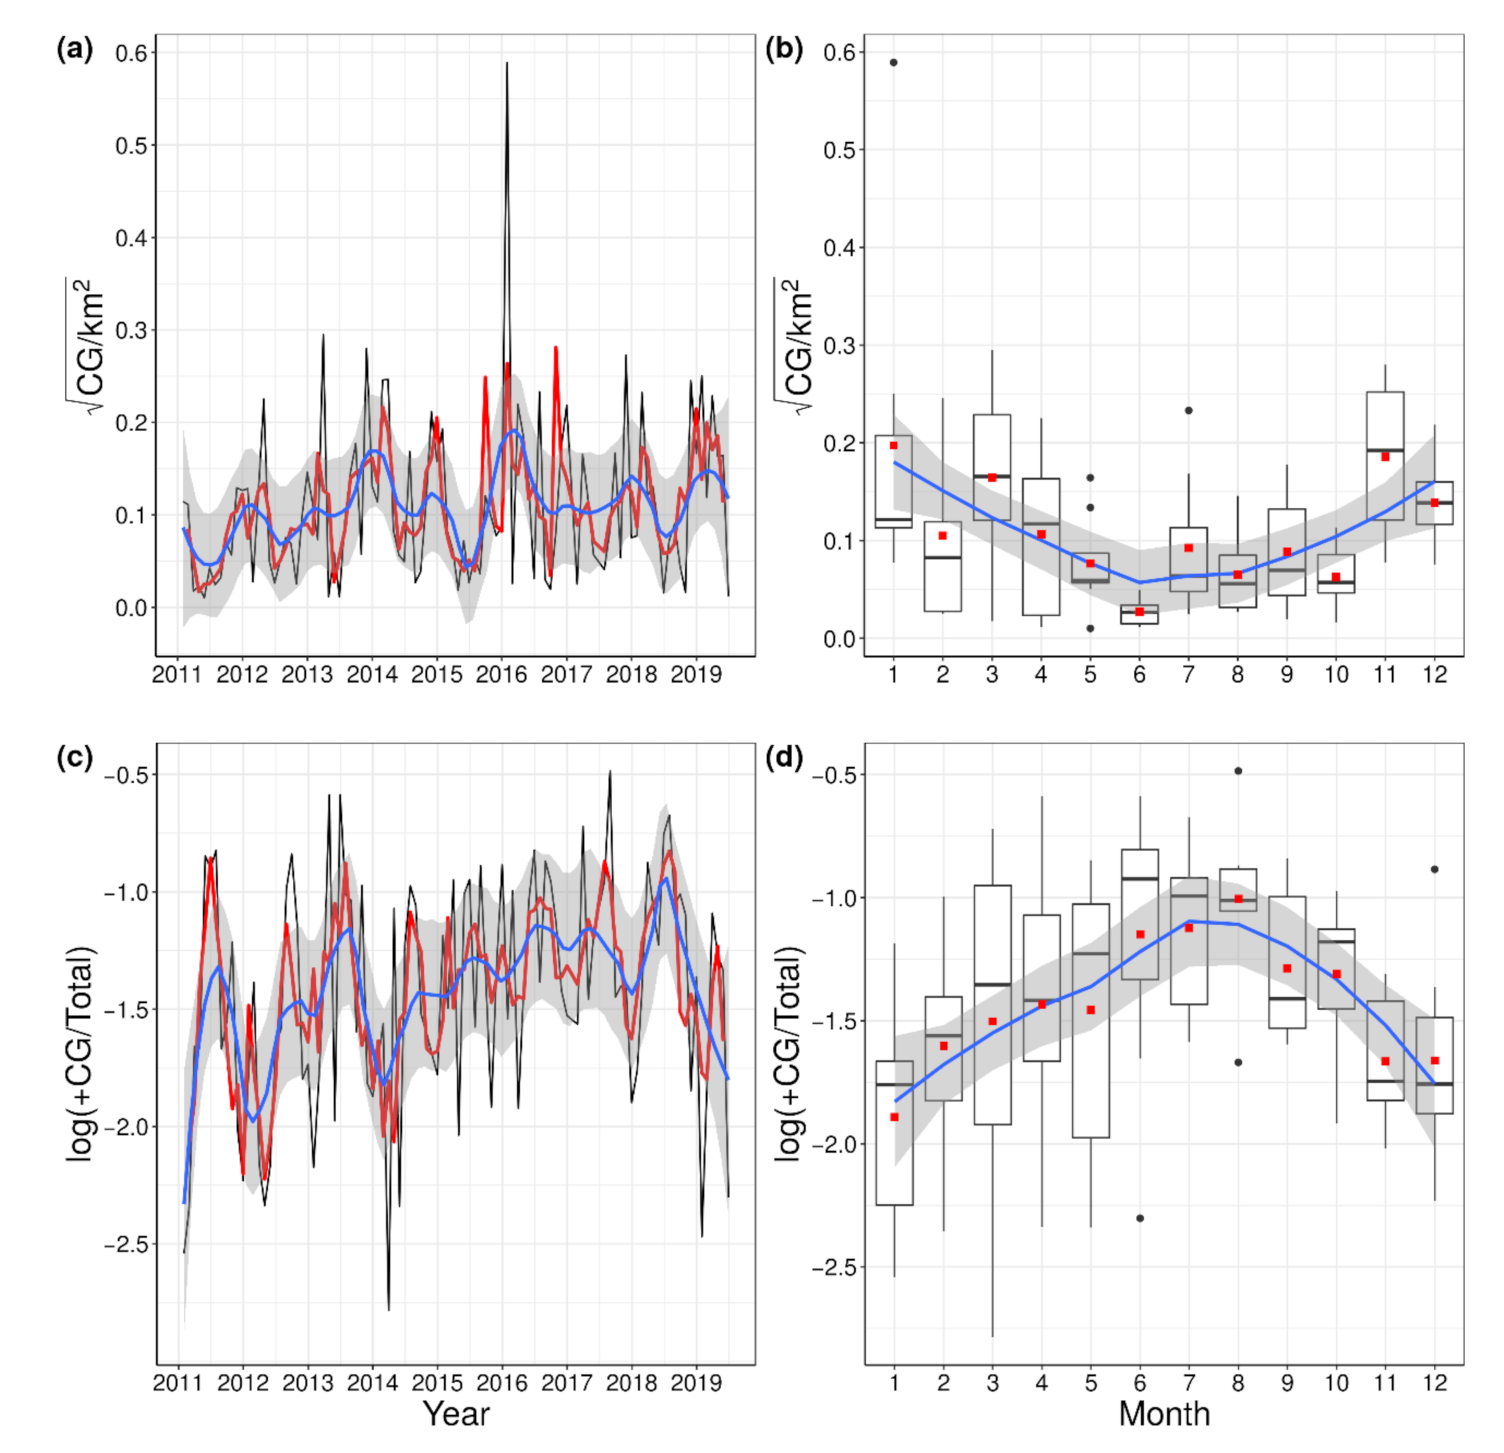
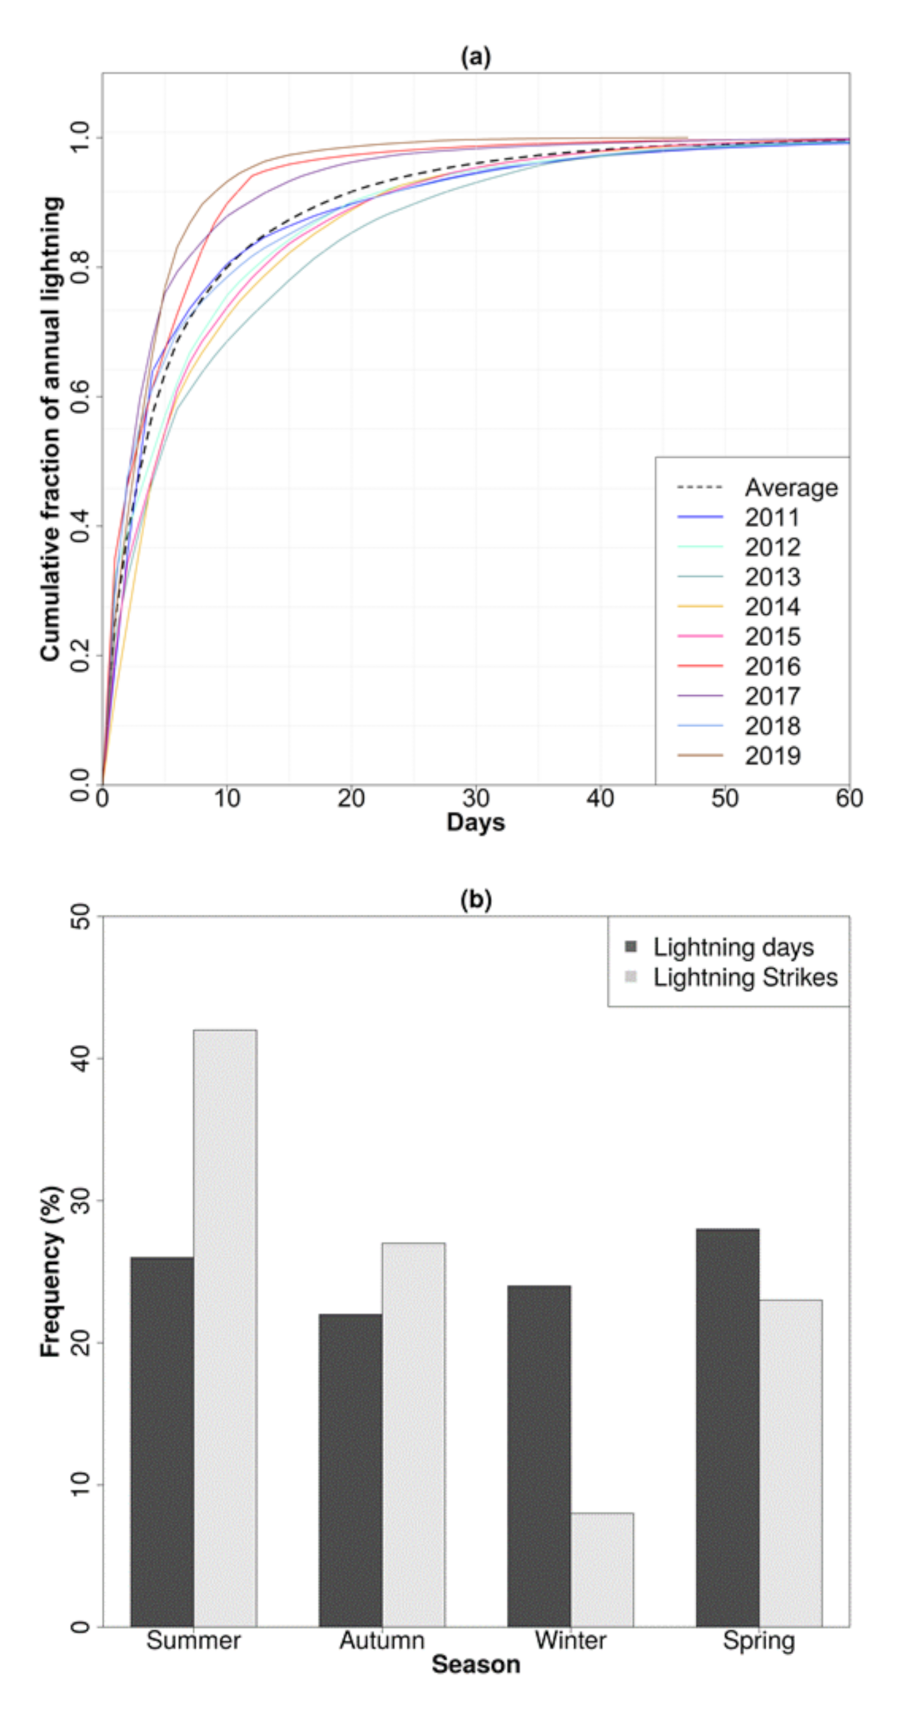
3.2. Temporal Distribution

The number of lightning strikes over time was seasonally variable (Figure 3a), with warmer months (November, December, January and February) having the highest rate of lightning strikes and winter experiencing the least. The outliers (black dots) are associated with storms resulting from infrequent weather phenomena experienced in those months. For example, the highest rate was an atypical storm event in January 2016 which caused fires that burnt a large area of the TWWHA. The ratio of positive strikes also varies seasonally and is lower during the period when the rate of lightning strikes is higher (Figure 3c). Figure 3d shows monthly statistics as a boxplot which highlights the significant seasonality, with the ratio of +CG reaching its lowest level during summer and its highest towards the end of winter. The antiphase relationship is also evident in plots (b) and (d), showing a decrease in the number of positive strokes during warmer months with the highest rate of CG lightning.
Among the total population of lightning strikes the mean annual frequency was 14,860 per year (Table 1). There is considerable year-to-year variation in the number of lightning strikes, with the number of strikes being an order of magnitude lower in 2011 compared to 2016. The year 2016 was atypical having almost 3 times the mean number of strikes. Of the total population of lightning strikes, 78% had negative polarity, with the lowest of 70% in 2015 and the highest of 87% in 2011. There was also an average of 80 days with lightning activity per year, with minimum and maximum values of 73 and 93 days in 2015 and 2013, respectively. On average, each year 50% of the total population of lightning strikes are distributed over just 4 days, 75% over 9 days, and 90% over 18 days between 2011 and 2019 (Figure 4a).
The mean seasonal variability of lighting days appeared to be equally distributed during spring (28%) and summer (28%), followed by the winter (24%) and autumn (22%). In contrast to the low variability of seasonal lightning days, the mean seasonal lightning strikes revealed summer as the most favorable season for lightning activity, as more than 42% of annual lightning strikes were recorded within that period followed by autumn (27%) and spring (23%). Winter showed the lowest percentage of approximately 8% (Figure 4b).
Trends in the diurnal cycle of lightning activity were found within each season (Figure 5). Lightning strikes are normally distributed in summer, with the highest number occurring during the three hours after solar noon (from 1200 to 1500 local time (LT)). In contrast, the distribution of total lightning strikes during autumn showed an inverse distribution, with a notable decrease between 0600 to 1500 LT. The daily pattern of lightning strikes during spring was similar to autumn but with fewer strokes. The lowest lightning activity occurred during winter, with little diurnal variation, suggesting that lightning occurrence is largely driven by the passage of synoptic systems rather than diurnal cycles.

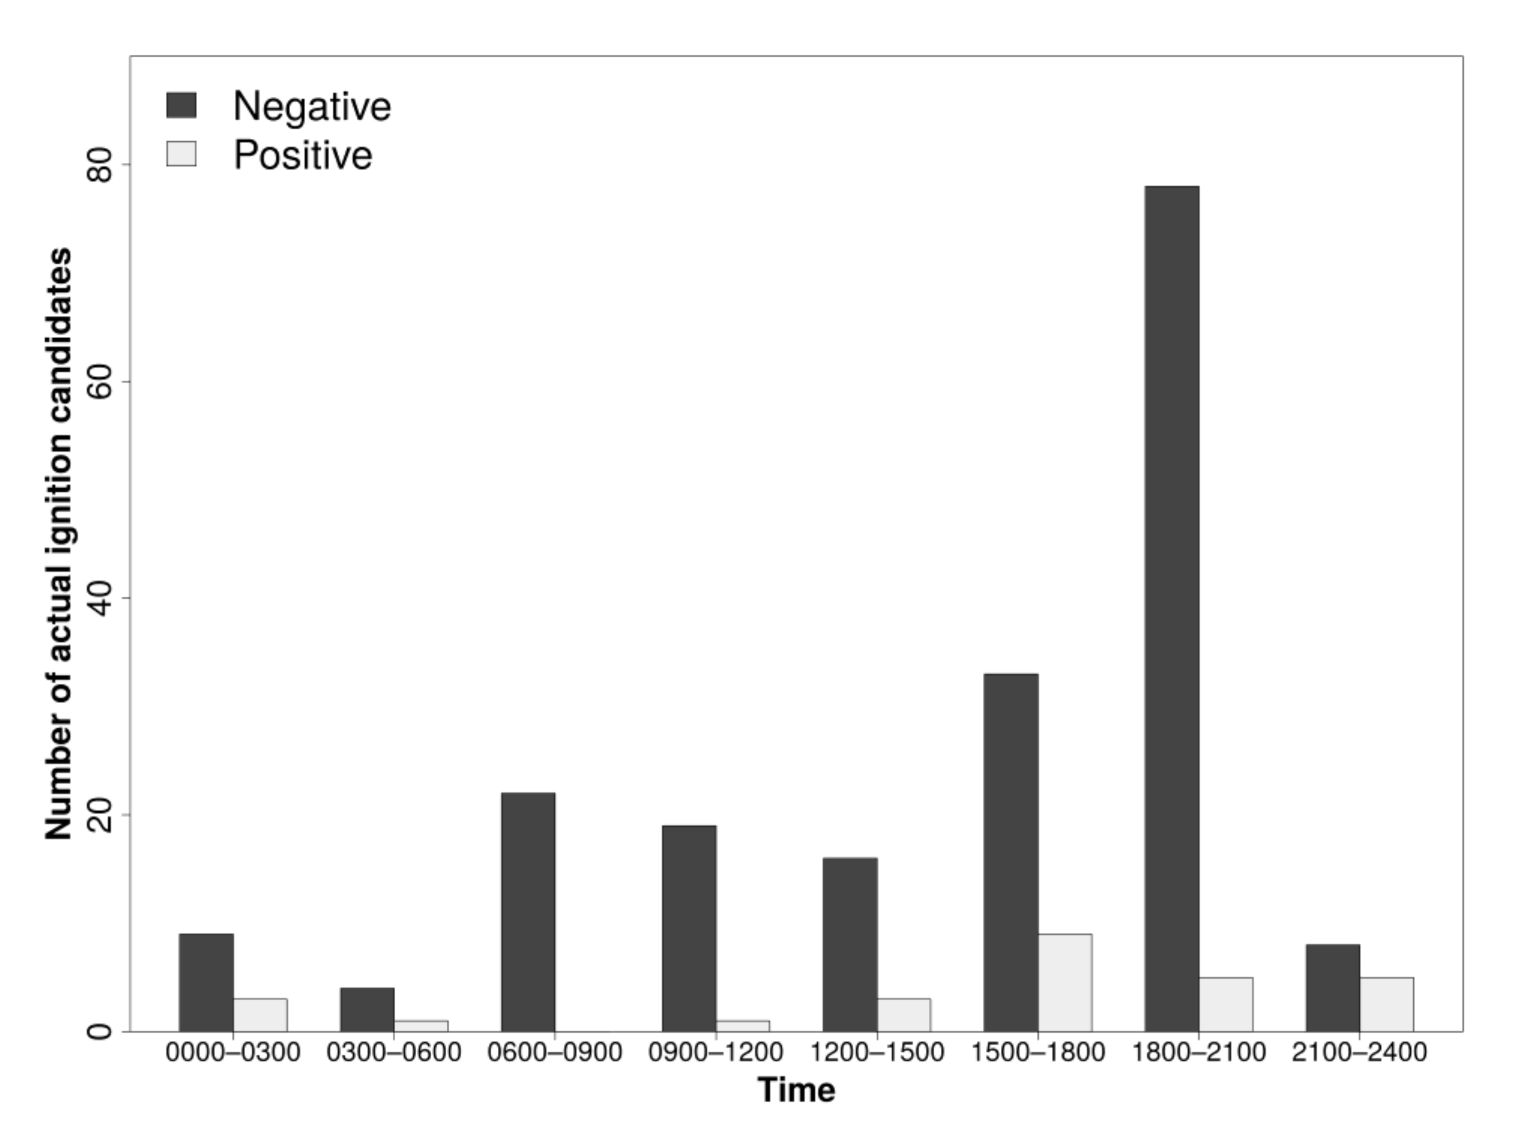
3.3. Lightning Flash Polarity and Multiplicity

The characteristics of total and PIC flashes for both negative and positive flashes are presented in Table 2. Of all CG flashes, 73% had negative polarity. The average multiplicity of total negative flashes was 1.58, with 44% of them single-stroke. The median (average) peak current of the first stroke of negative flashes was 21 (27.3) kA. The average multiplicity of total positive CG flashes (27%) was 1.22. Sixty-seven percent of the positive flashes had only one return stroke. The median (average) peak current of positive flashes was 16.4 (24) kA.

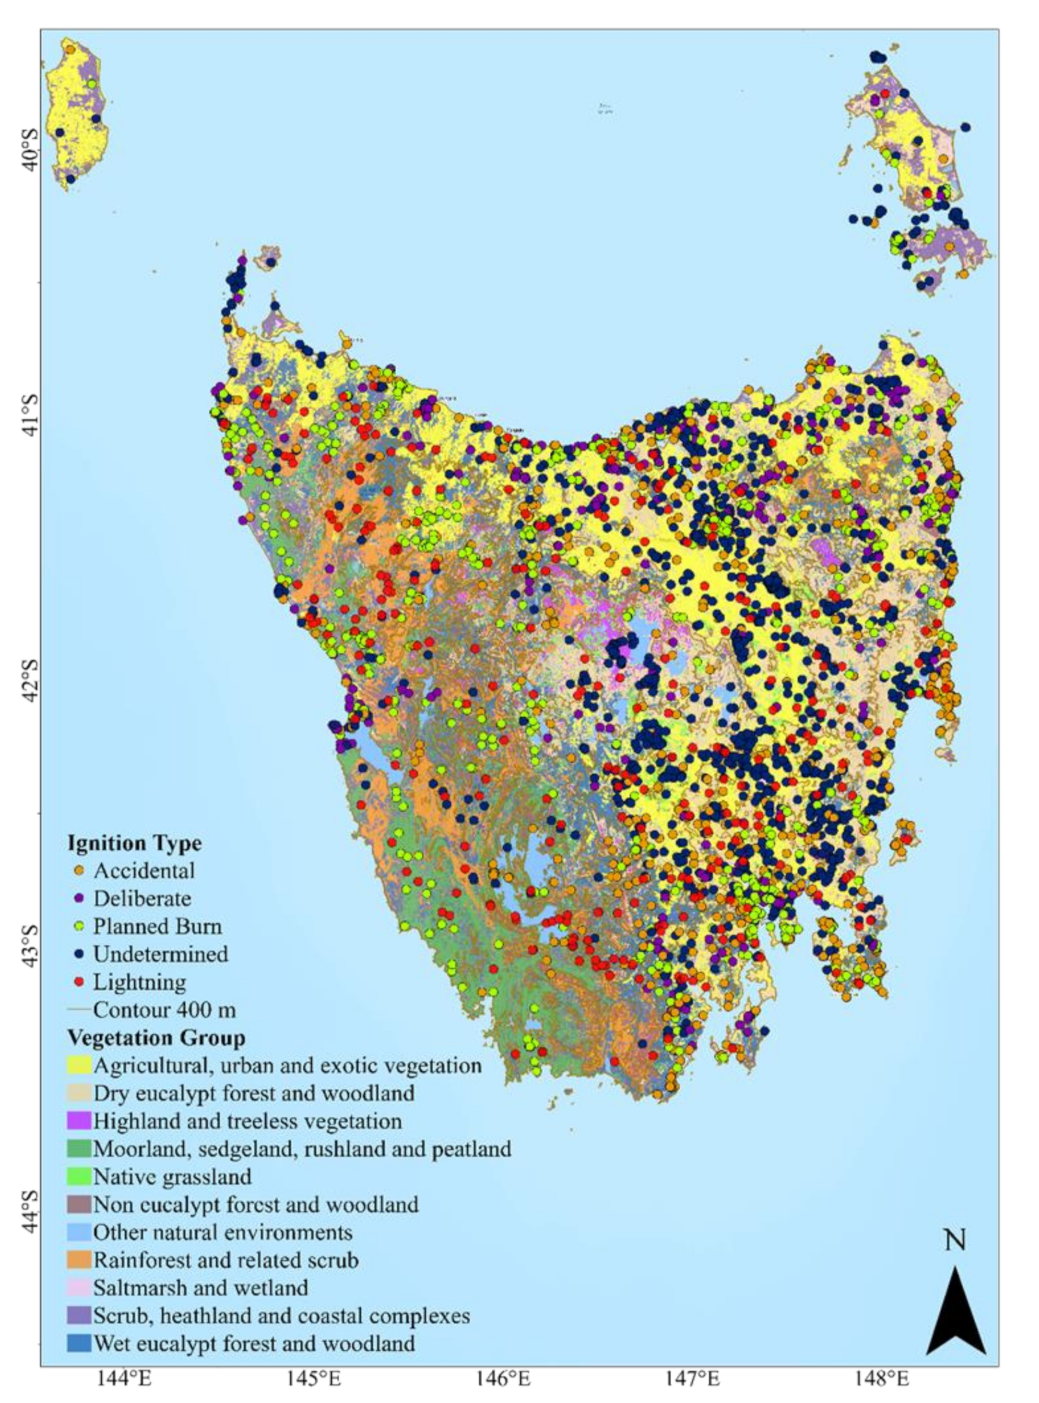
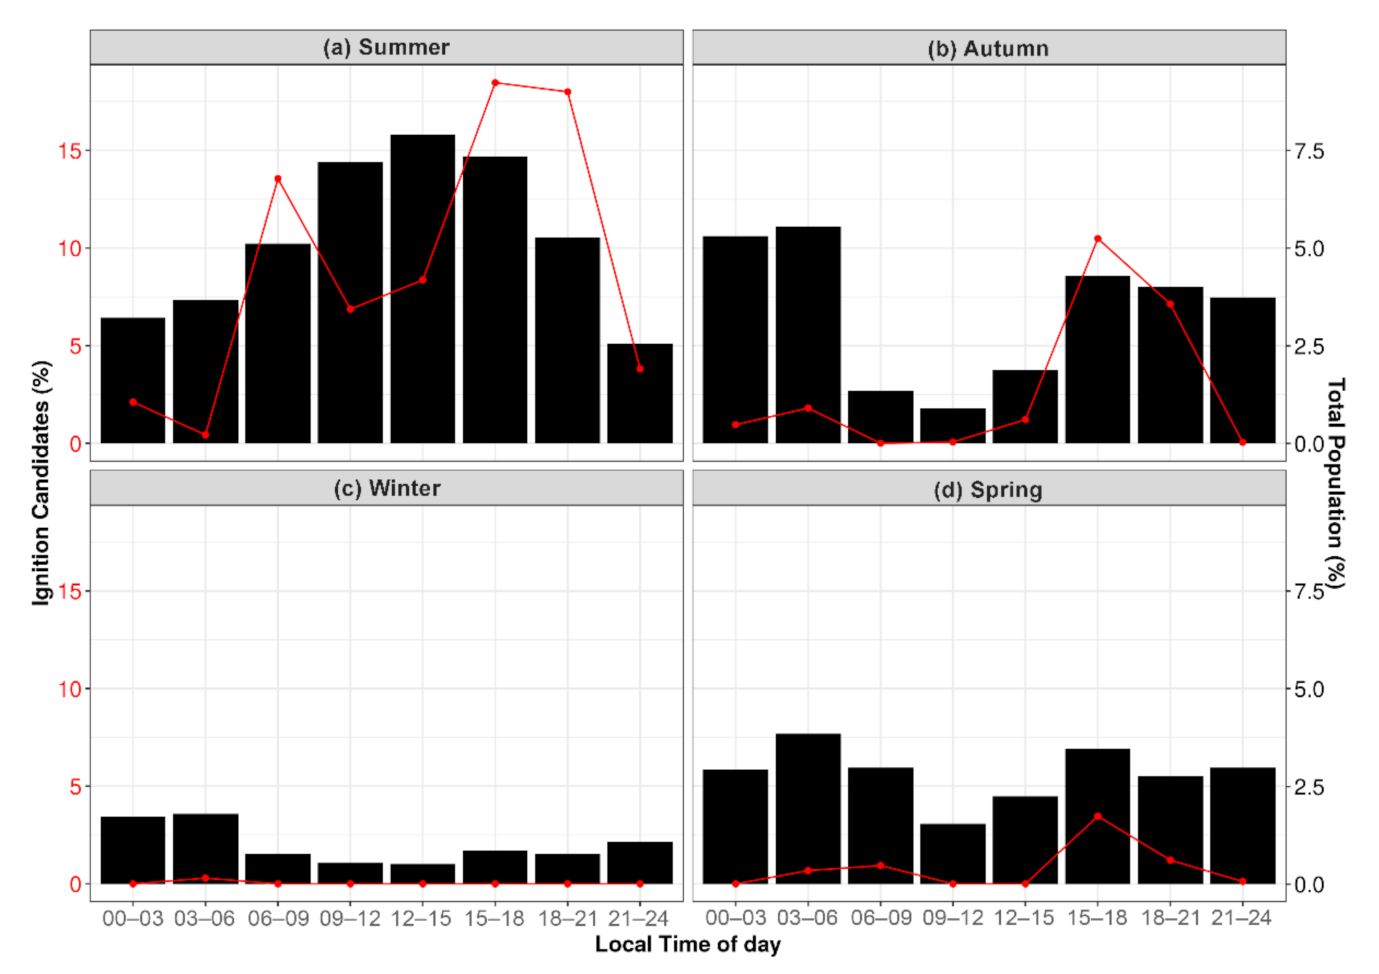
3.4. Lightning Ignition Candidates

The population of PIC extracted by proximity index analysis successfully matched 217 ignitions (~70%) reported as “lightning-induced”. Among the PIC population, years 2016 and 2019 had higher number of PIC (Table 1). The annual polarity ratio (negative: positive) of PIC varied annually. Of the PIC population, an average of 83% had negative polarity, with the maximum of 96% occurring in 2019 and the minimum of 56% in 2017. The number of days with at least one positive stroke was lower on average than the number of days with at least one negative stroke.
The diurnal distribution of the PIC population did not follow the same diurnal pattern as the total population (Figure 5, red line). During summer, autumn and spring, the greatest number of PIC strokes (approximately 58%) were observed between 1500–2100 LT. There was a secondary peak (13.5%) between 0600–0900 LT in summer. 2100–0600 LT had the lowest number of PIC.
The average negative and positive multiplicity of PIC was 1.85 and 1.25, respectively (Table 2). Results also showed that 76% of PIC were negative flashes and 32% of them were single-stroke flashes. The median (average) peak current of negative PIC flashes was 19.75 (23.8) kA. The polarity of 24% of PIC were positive, with 63% single-stroke flashes, a similar percentage to that of total positive flashes. The median (average) peak current of the first stroke of the positive flashes was 8.5 (12.15) kA.
Finally, the diurnal distribution of AIC (217 ignitions) illustrated that 1800–2100 LT was the time of the day that lightning flashes caused the most ignitions (Figure 6). The negative to positive polarity ratio of AIC was 85:15 (%) with average multiplicity of 1.5 and 1.2, respectively. The median peak current of AIC (−) was 27.85 (33.5) kA, which was greater than other negative population groups. Similarly, the median (average) peak current of AIC (+) was considerably greater than from positive climatological and PIC population 33 (37) kA. The percentage of negative and positive single-stroke flashes was 46 and 70, respectively (Table 2).

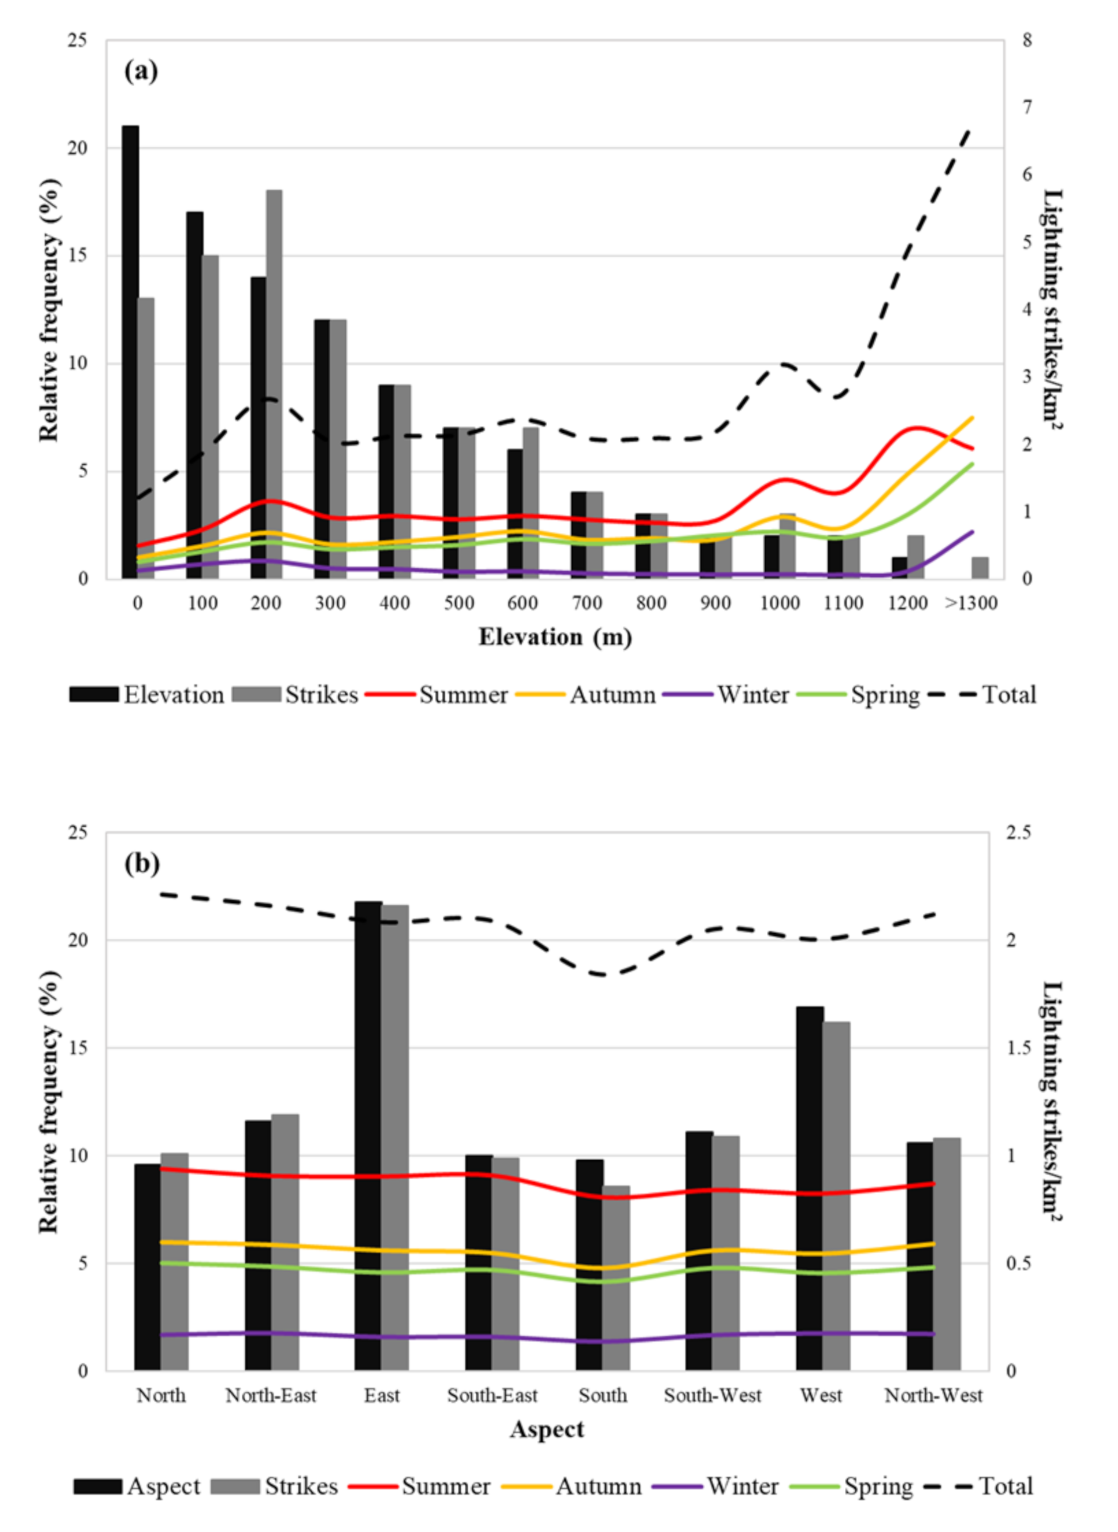
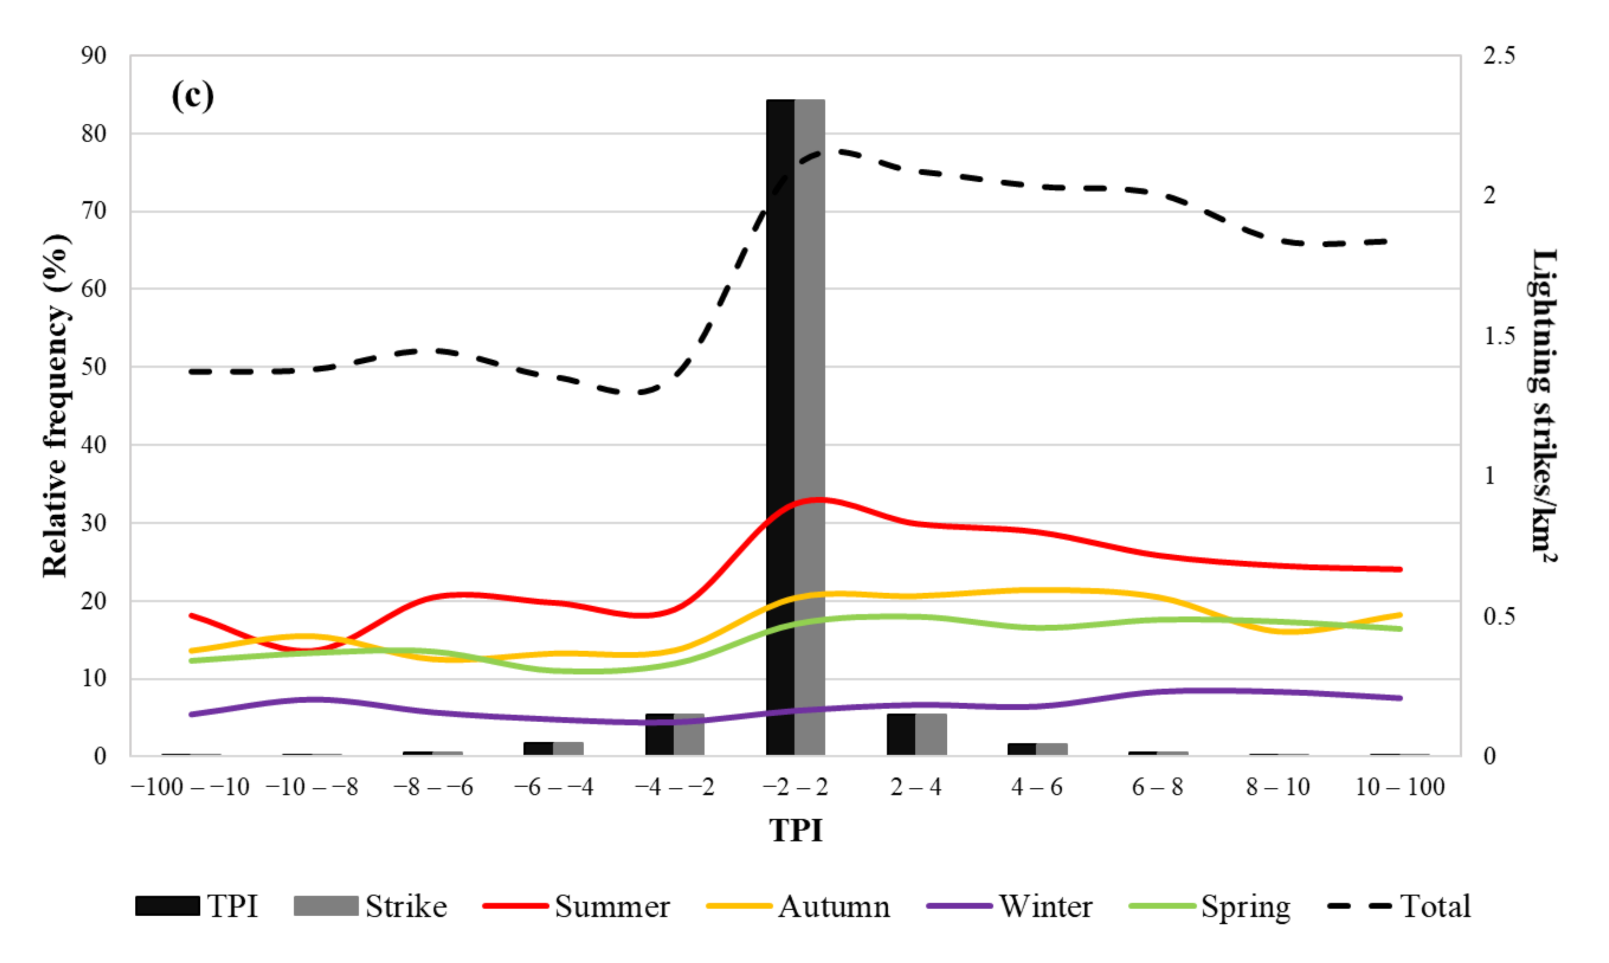
3.5. Lightning Strikes and Land Surface

Sixty-four percent of Tasmania lies at elevations less than 400 m, and the relative frequency of strikes in these areas was 58%. The density of lightning strikes was positively associated with elevation. Below a threshold elevation of 900 m, the density of strokes was consistently low, then the density increased almost linearly with elevation. However, a seasonal influence was evident. There was a positive correlation between elevation and lightning density during summer and to a lesser extent autumn (Figure 7a). In contrast, the relationship was not significant during winter, the time of year when the lowest lightning activity was observed over lower elevations. (Figure 7a). The histogram of land–surface aspect and lightning strikes at each slope direction (Figure 7b) showed an approximately equal distribution with respect to the land area within each classification. Most strikes occurred on easterly and westerly facing slopes (22% and 17% of strikes, respectively), matching the underlying bias towards these aspects. The density of strikes was slightly higher on north-facing slopes in every season, but lower on south-facing slopes (Figure 7b). TPI values ranged from approximately −100 to 100 with the standard deviation value of 1.85. The highest frequency of lightning strikes was in a range of −2 to 2, corresponding to the largest total land area. A strong association is evident between lightning strike density and TPI with positive values (Figure 7c).

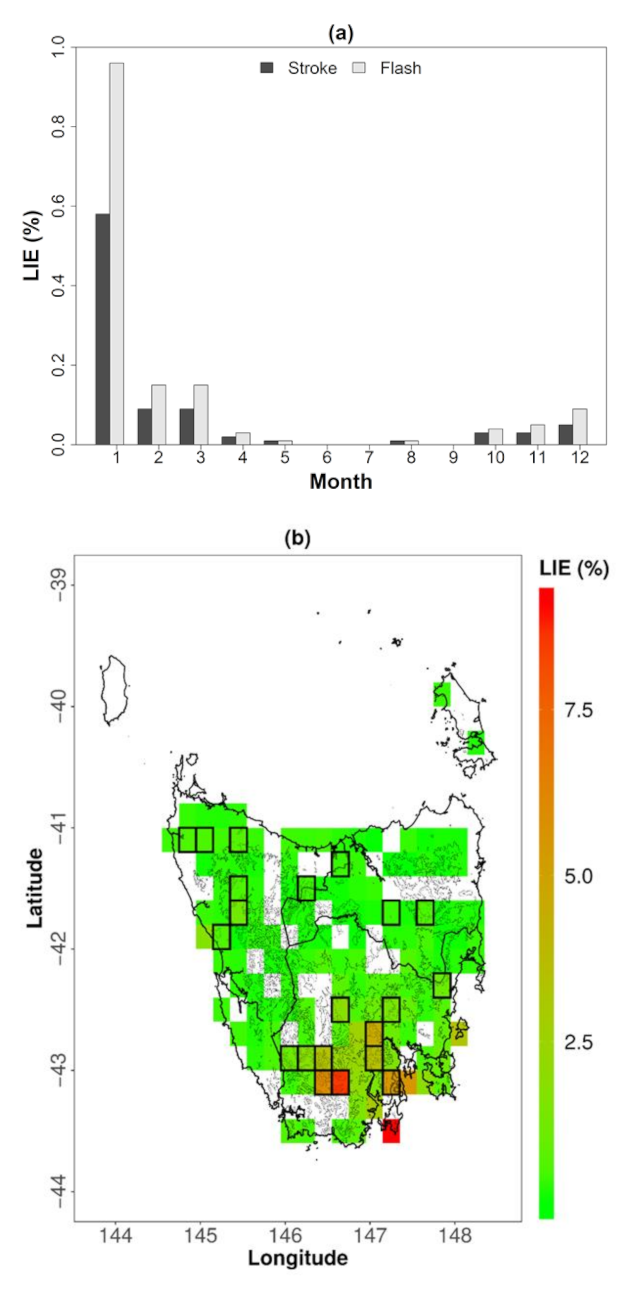
3.6. Lightning Ignition Efficiency

The average chance of fire per lightning stroke was estimated at 0.24%. There were on average 1.48 strokes per lightning flash. Therefore, LIE per lightning flash is 0.35% (i.e., 0.24% × 1.48). A strong annual variation in the chance of fire per lightning stroke is apparent, with the maximum likelihood during January (0.48%) (Figure 8a). The ignition efficiency was highest in the southern parts of the state (LIE > 5% compared to most of the remainder of the state LIE < 2.5%). Some areas in the southeast and southwest during the study period experienced more than four ignitions, as well as isolated parts of northwest with LIE values > 2.5% (Figure 8b). Buttongrass moorland and native grassland had the highest chance of being ignited by lightning flashes, followed by rainforest and wet eucalypt forest (Table 3).

4. Discussion

Lightning is the main cause of damaging fires in remote parts of south-east Australia, including Tasmania, where early detection is difficult and access for suppression is limited [104]. Understanding the characteristics of lightning strikes such as spatial and temporal variability, polarity, multiplicity and ignition efficiency, as well as their association with topography and vegetation, is critical to improve fire response strategies.
Geographical and seasonal variability of lightning activity over Tasmania is dominated by activity over the Western and Northern areas where the typical north-westerly to south-westerly airflow, combined with topographic influences [23] resulted in a clear seasonal signal reaching a maximum in the summer months (Figure 2). This is closely related to the synoptic weather characteristics of each season and, particularly, the orography. Weather patterns associated with lightning include strengthened frontal systems over western Tasmania that deploy moist monsoon-like air masses and promote ascent, especially over mountain features. Conversely, air descends on the lee side of mountain ranges and convection is suppressed, leading to very few storms occurring in the east and south. Increasingly in the warmer months, however, occasional unstable frontal systems, local airmass instability and an increase in the probability of broadly unstable easterly troughs can support thunderstorm development in the east.
Annual variation in the frequency of lightning strikes from 2011 through 2019 was pronounced, with an order of magnitude difference between the years with maximum (40,071 in 2016) and minimum number (4089 in 2011) of strikes (Table 1). There is also a distinct seasonal pattern of lightning strikes, with warmer months receiving the most lightning (82% of lightning strikes were recorded from November through April) and winter months the least. This was broadly consistent with previous studies investigating seasonality and temporal variations in lightning activity in the Australian region and globally [102,105,106,107]. The occurrence of lightning strikes is dominated by a large number of strikes occurring during a small number of intense events (50% of the total number of strikes occurred over just four days). This is further illustrated with 90% of strikes in 2016 occurring over only 11 days.
The seasonal variation of lightning activity is affected by the summertime occurrence of higher surface temperatures and greater potential near-surface atmospheric moisture content leading to enhanced instability [108]. The seasonal variability of lightning strikes was also evident in the polarity ratio, with a tendency for positive lightning to occur during the colder season (Figure 3d), consistent with previous studies [52,55,109]. Possible reasons for the winter maximum may be increased vertical wind shear and lower cloud tops in this season [110,111].
Lightning activity was greatest during the afternoon (1200–1500 LT) in summer, consistent with the greater amount of atmospheric instability at that time of day. However, storms do occur at other times, indicating that the passage of synoptic systems and their interaction with the orography is still an important driver for lightning generated in summer. The weak diurnal maximum in winter occurs during the late evening and early morning when solar heating is negligible or absent. The diurnal cycle is likely to be highly influenced by both local and synoptically forced convections, each of which are linked to strong topographic modulation.
Only 70% of reported “lightning-induced” ignitions matched with lightning records, which could be due to limitations in the spatial accuracy of the fire-reporting system, unreported or misreported ignitions or limitation in GPATS detection efficiency (noted to be around 90% for Australia and surrounding waters [112]). In some cases, the holdover time set in our research may be insufficient to capture some events where lightning fires smoulder for more than 72 h. The PIC showed a tendency to occur late in the afternoon in summer, differing from the diurnal variation expressed in the lightning climatology over the study area (Figure 5) and possibly relating to the time of minimum vegetation moisture content. The AIC followed a similar pattern with the most likely occurrence between 1800–2100 LT (Figure 6). The ratio of negative to positive flashes was similar across PIC and total lightning strikes (Table 2). Negative PIC did not differ substantially from the climatological occurrence, as also reported in other studies [39,103,113]. However, the median peak current of positive PIC was 50% lower compared to the climatological median (Table 2).
Lightning activity occurs through a trigger mechanism associated with convection processes [114]. Orographic lifting caused by topography can intensify the instability of an area’s airmass with stronger updraft in a thunderstorm causing lightning discharges. A positive relationship was found to exist between lightning density and elevation, as has been found in other studies [66,97,115]. The minimum lightning density occurred at the lowest elevations below 100 m, which is also the largest land area (Figure 7a). Other terrain features such as aspect (slope direction) and TPI were found to influence lightning density. Lightning density was slightly higher on north facing slopes (Figure 7b), potentially associated with greater surface heating and greater thermal instability [116], but also generally warmer incident airmasses. Previous studies have only investigated the effects of meso-scale elevation (here referred as TPI) on lightning ignition density in Australia, due to the lack of access to lightning location data [117,118]. The lightning ignition probability was positively associated with the mesoscale elevation, primarily reflecting the orographic effects of mountain ranges on storm occurrence. These findings, which are in conflict with the findings of McRae [104], are consistent with the positive relationship between lightning activity and higher TPI in our study (Figure 7c).
Due to instability of GPATS prior to 2011, the data used in this study were limited to the 2011–2019 period to ensure a temporally consistent dataset. The spatial and temporal distribution of lightning activity highlighted in this study is therefore representative only for the study period. The conclusions drawn are unlikely to be affected by the sensor accuracy. The geographic and temporal patterns we identify across Tasmania are consistent with known physical and meteorological processes (e.g., seasonality and summer afternoon peaks of lightning activity) with other studies in other parts of the world. As more data become available in the future, a longer period will improve the robustness of average climatological characteristics and enable trends in lightning occurrence and LIE to be assessed.
In this study, lightning ignition efficiency was estimated in space and time. During the period of study, GPATS recorded exceeding 130,000 CG strikes. Assuming that every lightning-ignited bushfire has been recorded by the TFS during these years (315 ignitions), the LIE was 0.24% per CG stroke per stroke (0.3% per flash). As expected, LIE during the warmer season, in particular January, was the greatest. The spatial variability in LIE (%) highlighted regional differences in the chance of ignition. Despite fewer lightning strikes in the southern half of Tasmania, the LIE geographically was higher (LIE > 5%) compared to the other areas over the state. LIE also differed across vegetation types. Unsurprisingly, ignition efficiency associated with highly flammable buttongrass moorlands was the highest. However, contrary to expectations, ignition efficiency in wet eucalyptus and rainforests was slightly higher than dry eucalypt forests. It is quite likely that this is a consequence of the period for which data are available. For example, the six months ending February 2016 was the driest such period in the available rainfall record (stretching back to 1900) for the western third of Tasmania, preconditioning typically wet vegetation types in that region, and the associated organic soils, to burn with the intense period of lightning activity that occurred through January 2016.
In this study, we have presented an exploratory analysis that spans lightning climatology, PIC and AIC. Ignition candidates did not follow the same diurnal pattern as the total population, increasing towards the evening. The median peak current of AIC (+) was also much greater than average lightning climatology and PIC. The PIC in some other cases such as polarity and multiplicity did not present any characteristics differentiating them from the total lightning strikes; however, there is still scope for further work. In particular, other factors involved with the potential for ignition, such as fuel moisture and fuel availability, are important to be assessed in relation to lightning climatology.

5. Conclusions

This study presented the spatial and temporal characteristics of lightning activity in Tasmania during 2011–2019. This region, as with south-east Australia generally, is prone to wildfires. This research contributes to better understanding of the diurnal, seasonal and spatial distribution of lightning activity associated with ignitions, which will improve the ability of local fire managers to deploy scarce resources and prepare the operational response to fire threat. Identifying the igniting strokes is necessary for understanding lightning-induced fires, particularly for predicting the probability of lightning-induced fire and assessing daily fire danger.
Geographical distribution of lightning strikes showed higher lightning activity in the north and west of Tasmania. It also confirmed strong seasonality, which was evident in the data with maxima during summer and decreasing in colder months. Diurnal variation during summer indicated peak lightning activity occurring between 1200 and 1500 LT, decreasing towards the evening.
Ignition candidates selected by proximity index did not present any feature that differentiates them from the total population, other than the diurnal distribution. Polarity percentages, multiplicity, peak current, and single-stroke percentage in the fire-initiating lightning occurrences were similar to climatological values. However, the median peak current of positive AIC was much greater than lightning climatology and PIC. We also found a high chance of ignition in buttongrass moorland and LIE exceeded 5% in parts of southern Tasmania. Results derived from this study will be useful for further investigation into the relationships between lightning activity and fire weather variables.

Supplementary Materials

The following is available online at https://www.mdpi.com/2571-6255/4/1/10/s1, Figure S1: Monthly count of cloud-to-ground (CG) lightning strikes (January 2011–June 2019), visualized by 5 km × 5 km rectangular binning.

Author Contributions

H.N. conceived the study and led the writing, with input from all authors. P.L. and P.F.-H. contributed meteorological background and interpretation. Conceptualization, H.N., P.L., C.W., P.F.-H., J.A., and R.M.B.H.; Formal analysis, H.N. and P.L.; Investigation, H.N., P.L., C.W., P.F.-H., J.A., and R.M.B.H.; Resources, P.F.-H.; Software, H.N. and P.L.; Supervision, P.L., C.W., P.F.-H., J.A., and R.M.B.H.; Visualization, H.N.; Writing—original draft, H.N.; Writing—review & editing, P.L., C.W., P.F.-H., J.A., and R.M.B.H. All authors have read and agreed to the published version of the manuscript.

Funding

H.N. was the recipient of an Australian Postgraduate Award.

Institutional Review Board Statement

Not applicable.

Informed Consent Statement

Not applicable.

Data Availability Statement

Data sharing not applicable.

Acknowledgments

Bureau of Meteorology for providing data and support. In particular, the authors had very useful early discussions with Andrew Dowdy. Lightning data were made available from GPATS. Tasmania Fire Service, and Parks and Wildlife Service provided access to the fire history.

Conflicts of Interest

The authors declare no conflict of interest.

References

  1. Bates, B.C.; Chandler, R.E.; Dowdy, A.J. Estimating trends and seasonality in Australian monthly lightning flash counts. J. Geophys. Res. Atmos. 2015, 120, 3973–3983. [Google Scholar] [CrossRef] [Green Version]
  2. Russell-Smith, J.; Yates, C.P.; Whitehead, P.J.; Smith, R.; Craig, R.; Allan, G.E.; Thackway, R.; Frakes, I.; Cridland, S.; Meyer, M.C. Bushfires ‘down under’: Patterns and implications of contemporary Australian landscape burning. Int. J. Wildland Fire 2007, 16, 361–377. [Google Scholar] [CrossRef]
  3. Bradstock, R.; Cohn, J.; Gill, A.M.; Bedward, M.; Lucas, C. Prediction of the probability of large fires in the Sydney region of south-eastern Australia using fire weather. Int. J. Wildland Fire 2010, 18, 932–943. [Google Scholar] [CrossRef]
  4. Sullivan, A.L.; McCaw, W.L.; Cruz, M.G.; Matthews, S.; Ellis, P.F. Fuel, fire weather and fire behaviour in Australian ecosystems. In Flammable Australia: Fire Regimes, Biodiversity and Ecosystems in a Changing World; CSIRO Publishing: Melbourne, Australia, 2012; pp. 51–77. [Google Scholar]
  5. Dowdy, A.J.; Mills, G.A. Atmospheric States Associated with the Ignition of Lightning-Attributed Fires; Centre for Australian Weather and Climate Research: Melbourne, Australia, 2009. [Google Scholar]
  6. Wotton, B.; Martell, D.L. A lightning fire occurrence model for Ontario. Can. J. For. Res. 2005, 35, 1389–1401. [Google Scholar] [CrossRef]
  7. Conedera, M.; Cesti, G.; Pezzatti, G.B.; Zumbrunnen, T.; Spinedi, F. Lightning-induced fires in the Alpine region: An increasing problem. For. Ecol. Manag. 2006, 234, S68. [Google Scholar] [CrossRef]
  8. Dowdy, A.J.; Mills, G.A. Characteristics of lightning-attributed wildland fires in south-east Australia. Int. J. Wildland Fire 2012, 21, 521–524. [Google Scholar] [CrossRef]
  9. Vázquez, A.; Moreno, J.M. Patterns of lightning-, and people-caused fires in peninsular Spain. Int. J. Wildland Fire 1998, 8, 103–115. [Google Scholar] [CrossRef]
  10. Wendler, G.; Conner, J.; Moore, B.; Shulski, M.; Stuefer, M. Climatology of Alaskan wildfires with special emphasis on the extreme year of 2004. Theor. Appl. Climatol. 2011, 104, 459–472. [Google Scholar] [CrossRef]
  11. Bowman, D.M.; Balch, J.K.; Artaxo, P.; Bond, W.J.; Carlson, J.M.; Cochrane, M.A.; D’Antonio, C.M.; DeFries, R.S.; Doyle, J.C.; Harrison, S.P. Fire in the Earth system. Science 2009, 324, 481–484. [Google Scholar] [CrossRef]
  12. Taylor, S.W.; Woolford, D.G.; Dean, C.; Martell, D.L. Wildfire prediction to inform management: Statistical science challenges. Stat. Sci. 2013, 586–615. [Google Scholar] [CrossRef] [Green Version]
  13. Blouin, K.D.; Flannigan, M.D.; Wang, X.; Kochtubajda, B. Ensemble lightning prediction models for the province of Alberta, Canada. Int. J. Wildland Fire 2016, 25, 421–432. [Google Scholar] [CrossRef]
  14. Price, C. Thunderstorms lightning and climate change. In Lightning Principles, Instruments and Applications: Review of Modern Lightning Research; Betz, H.D., Schumann, U., Laroche, P., Eds.; Springer: Dordrecht, The Netherlands, 2009. [Google Scholar]
  15. Rakov, V.A.; Uman, M.A. Lightning: Physics and Effects; Cambridge University Press: Cambridge, UK, 2003. [Google Scholar]
  16. Price, C.; Rind, D. The impact of a 2× CO2 climate on lightning-caused fires. J. Clim. 1994, 7, 1484–1494. [Google Scholar] [CrossRef] [Green Version]
  17. Price, C. Possible implications of global climate change on global lightning distributions and frequencies. J. Geophys. Res. Atmos. 1994, 99, 10823–10831. [Google Scholar] [CrossRef]
  18. Krause, A. The sensitivity of global wildfires to simulated past, present, and future lightning frequency. J Geophys. Res. Biogeosci. 2014, 119, 312–322. [Google Scholar] [CrossRef] [Green Version]
  19. Williams, E. Lightning and climate: A review. Atmos. Res. 2005, 76, 272–287. [Google Scholar] [CrossRef]
  20. Romps, D.M.; Seeley, J.T.; Vollaro, D.; Molinari, J. Projected increase in lightning strikes in the United States due to global warming. Science 2014, 346, 851–854. [Google Scholar] [CrossRef] [PubMed]
  21. Price, C. Thunderstorms, lightning and climate change. In Lightning: Principles, Instruments and Applications; Springer: Berlin/Heidelberg, Germany, 2009; pp. 521–535. [Google Scholar]
  22. Romatschke, U.; Houze Jr, R.A. Characteristics of precipitating convective systems in the South Asian monsoon. J. Hydrometeorol. 2011, 12, 3–26. [Google Scholar] [CrossRef]
  23. Barros, A.P.; Chiao, S.; Lang, T.J.; Burbank, D.; Putkonen, J. From weather to climate-seasonal and interannual variability of storms and implications for erosion processes in the Himalaya. Spec. Pap. Geol. Soc. Am. 2006, 398, 17. [Google Scholar]
  24. Kodama, Y.M.; Ohta, A.; Katsumata, M.; Mori, S.; Satoh, S.; Ueda, H. Seasonal transition of predominant precipitation type and lightning activity over tropical monsoon areas derived from TRMM observations. Geophys. Res. Lett. 2005, 32. [Google Scholar] [CrossRef] [Green Version]
  25. Krawchuk, M.A. Burning issues: Statistical analyses of global fire data to inform assessments of environmental change. Environmetrics 2014, 25, 472–481. [Google Scholar] [CrossRef]
  26. Fauria, M.M. Predicting climate change effects on wildfires requires linking processes across scales. Wiley Interdiscip. Rev. Clim. 2011, 2, 99–112. [Google Scholar] [CrossRef]
  27. Potter, B.E. Atmospheric interactions with wildland fire behaviour—I. Basic surface interactions, vertical profiles and synoptic structures. Int. J. Wildland Fire 2012, 21, 779–801. [Google Scholar] [CrossRef]
  28. Potter, B.E. Atmospheric interactions with wildland fire behaviour—II. Plume and vortex dynamics. Int. J. Wildland Fire 2012, 21, 802–817. [Google Scholar] [CrossRef]
  29. Fox-Hughes, P.; Harris, R.; Lee, G.; Grose, M.; Bindoff, N. Future fire danger climatology for Tasmania, Australia, using a dynamically downscaled regional climate model. Int. J. Wildland Fire 2014, 23, 309–321. [Google Scholar] [CrossRef]
  30. Clarke, H.; Gibson, R.; Cirulis, B.; Bradstock, R.A.; Penman, T.D. Developing and testing models of the drivers of anthropogenic and lightning-caused wildfire ignitions in south-eastern Australia. J. Environ. Manag. 2019, 235, 34–41. [Google Scholar] [CrossRef]
  31. Cai, W.; Sullivan, A.; Cowan, T. Climate change contributes to more frequent consecutive positive Indian Ocean Dipole events. Geophys. Res. Lett. 2009, 36. [Google Scholar] [CrossRef]
  32. Clarke, H.; Evans, J.P. Exploring the future change space for fire weather in southeast Australia. Theor. Appl. Climatol. 2019, 136, 513–527. [Google Scholar] [CrossRef] [Green Version]
  33. Clarke, H.; Lucas, C.; Smith, P. Changes in Australian fire weather between 1973 and 2010. Int. J. Climatol. 2013, 33, 931–944. [Google Scholar] [CrossRef]
  34. Abatzoglou, J.; Williams, A. Climate change has added to western US forest fire. Proc. Natl. Acad. Sci. USA 2016, 113, 11770–11775. [Google Scholar] [CrossRef] [Green Version]
  35. Dowdy, A.J. Climatological Variability of Fire Weather in Australia. J. Appl. Meteorol. Climatol. 2018, 57, 221–234. [Google Scholar] [CrossRef]
  36. Pitman, A.J.; Narisma, G.T.; McAneney, J. The impact of climate change on the risk of forest and grassland fires in Australia. Clim. Chang. 2007, 84, 383–401. [Google Scholar] [CrossRef]
  37. Dowdy, A.J.; Ye, H.; Pepler, A.; Thatcher, M.; Osbrough, S.L.; Evans, J.P.; Di Virgilio, G.; McCarthy, N. Future changes in extreme weather and pyroconvection risk factors for Australian wildfires. Sci. Rep. 2019, 9, 10073. [Google Scholar] [CrossRef]
  38. Müller, M.M.; Vacik, H.; Diendorfer, G.; Arpaci, A.; Formayer, H.; Gossow, H. Analysis of lightning-induced forest fires in Austria. Theor. Appl. Climatol. 2013, 111, 183–193. [Google Scholar] [CrossRef] [Green Version]
  39. Pineda, N.; Montanyà, J.; van der Velde, O.A. Characteristics of lightning related to wildfire ignitions in Catalonia. Atmos. Res. 2014, 135–136, 380–387. [Google Scholar] [CrossRef]
  40. Pineda, N.; Rigo, T. The rainfall factor in lightning-ignited wildfires in Catalonia. Agric. For. Meteorol. 2017, 239, 249–263. [Google Scholar] [CrossRef]
  41. Wierzchowski, J.; Heathcott, M.; Flannigan, M.D. Lightning and lightning fire, central cordillera, Canada. Int. J. Wildland Fire 2002, 11, 41–51. [Google Scholar] [CrossRef]
  42. Larjavaara, M.; Kuuluvainen, T.; Rita, H. Spatial distribution of lightning-ignited forest fires in Finland. For. Ecol. Manag. 2005, 208, 177–188. [Google Scholar] [CrossRef]
  43. Schulz, W.; Diendorfer, G.; Pedeboy, S.; Poelman, D.R. The European lightning location system EUCLID—Part 1: Performance analysis and validation. Nat. Hazards Earth Syst. Sci. 2016, 16, 595–605. [Google Scholar] [CrossRef] [Green Version]
  44. Bentley, M.L.; Stallins, J. Climatology of cloud-to-ground lightning in Georgia, USA, 1992–2003. Int. J. Climatol. 2005, 25, 1979–1996. [Google Scholar] [CrossRef]
  45. Peterson, D.; Wang, J.; Ichoku, C.; Remer, L. Effects of lightning and other meteorological factors on fire activity in the North American boreal forest: Implications for fire weather forecasting. Atmos. Chem. Phys. 2010, 10, 6873–6888. [Google Scholar] [CrossRef] [Green Version]
  46. Lang, T.J.; Rutledge, S.A. Cloud-to-ground lightning downwind of the 2002 Hayman forest fire in Colorado. Geophys. Res. Lett. 2006, 33. [Google Scholar] [CrossRef] [Green Version]
  47. Arabas, K.B.; Hadley, K.S.; Larson, E.R. Fire history of a naturally fragmented landscape in central Oregon. Can. J. For. Res. 2006, 36, 1108–1120. [Google Scholar] [CrossRef]
  48. Van Wagtendonk, J.W.; Cayan, D.R. Temporal and spatial distribution of lightning strikes in California in relation to large-scale weather patterns. Fire Ecol. 2008, 4, 34–56. [Google Scholar] [CrossRef]
  49. Morissette, J.; Gauthier, S. Study of cloud-to-ground lightning in Quebec: 1996–2005. Atmosphere-Ocean 2008, 46, 443–454. [Google Scholar] [CrossRef]
  50. Kochtubajda, B.; Burrows, W.R. A decade of cloud-to-ground lightning in Canada: 1999–2008. Part 2: Polarity, multiplicity and first-stroke peak current. Atmosphere-Ocean 2010, 48, 195–209. [Google Scholar] [CrossRef]
  51. Burrows, W.R.; Kochtubajda, B. A decade of cloud-to-ground lightning in Canada: 1999–2008. Part 1: Flash density and occurrence. Atmosphere-Ocean 2010, 48, 177–194. [Google Scholar] [CrossRef] [Green Version]
  52. Soriano, L.R.; De Pablo, F.; Tomas, C. Ten-year study of cloud-to-ground lightning activity in the Iberian Peninsula. J. Atmos. Sol.-Terr. Phys. 2005, 67, 1632–1639. [Google Scholar] [CrossRef]
  53. Antonescu, B.; Burcea, S. A cloud-to-ground lightning climatology for Romania. Mon. Weather Rev. 2010, 138, 579–591. [Google Scholar] [CrossRef] [Green Version]
  54. Schulz, W.; Cummins, K.; Diendorfer, G.; Dorninger, M. Cloud-to-ground lightning in Austria: A 10-year study using data from a lightning location system. J. Geophys. Res. Atmos. 2005, 110. [Google Scholar] [CrossRef]
  55. Sonnadara, U.; Cooray, V.; Götschl, T. Characteristics of cloud-to-ground lightning flashes over Sweden. Phys. Scr. 2006, 74, 541–548. [Google Scholar] [CrossRef]
  56. Mäkelä, J.S.; Porjo, N.; Mäkelä, A.; Tuomi, T.; Cooray, V. Properties of preliminary breakdown processes in Scandinavian lightning. J. Atmos. Sol.-Terr. Phys. 2008, 70, 2041–2052. [Google Scholar] [CrossRef]
  57. Novák, P.; Kyznarová, H. Climatology of lightning in the Czech Republic. Atmos. Res. 2011, 100, 318–333. [Google Scholar] [CrossRef]
  58. Santos, J.; Reis, M.; Sousa, J.; Leite, S.; Correia, S.; Janeira, M.; Fragoso, M. Cloud-to-ground lightning in Portugal: Patterns and dynamical forcing. Nat. Hazards Earth Syst. Sci. 2012, 12, 639–649. [Google Scholar] [CrossRef] [Green Version]
  59. Ramos, A.M.; Ramos, R.; Sousa, P.; Trigo, R.M.; Janeira, M.; Prior, V. Cloud to ground lightning activity over Portugal and its association with circulation weather types. Atmos. Res. 2011, 101, 84–101. [Google Scholar] [CrossRef]
  60. Royé, D.; Lorenzo, N.; Martin-Vide, J. Spatial–temporal patterns of cloud-to-ground lightning over the northwest Iberian Peninsula during the period 2010–2015. Nat. Hazards 2018, 92, 857–884. [Google Scholar] [CrossRef]
  61. Giannaros, T.M.; Kotroni, V.; Lagouvardos, K. Predicting lightning activity in Greece with the Weather Research and Forecasting (WRF) model. Atmos. Res. 2015, 156, 1–13. [Google Scholar] [CrossRef]
  62. Matsangouras, I.; Nastos, P.; Kapsomenakis, J. Cloud-to-ground lightning activity over Greece: Spatio-temporal analysis and impacts. Atmos. Res. 2016, 169, 485–496. [Google Scholar] [CrossRef]
  63. Chronis, T.G. Preliminary lightning observations over Greece. J. Geophys. Res. Atmos. 2012, 117. [Google Scholar] [CrossRef] [Green Version]
  64. Galanaki, E.; Kotroni, V.; Lagouvardos, K.; Argiriou, A. A ten-year analysis of cloud-to-ground lightning activity over the Eastern Mediterranean region. Atmos. Res. 2015, 166, 213–222. [Google Scholar] [CrossRef]
  65. Nastos, P.; Matsangouras, I.; Chronis, T. Spatio-temporal analysis of lightning activity over Greece—Preliminary results derived from the recent state precision lightning network. Atmos. Res. 2014, 144, 207–217. [Google Scholar] [CrossRef]
  66. Kilinc, M.; Beringer, J. The spatial and temporal distribution of lightning strikes and their relationship with vegetation type, elevation, and fire scars in the Northern Territory. J. Clim. 2007, 20, 1161–1173. [Google Scholar] [CrossRef] [Green Version]
  67. Podur, J.; Martell, D.L.; Csillag, F. Spatial patterns of lightning-caused forest fires in Ontario, 1976–1998. Ecol. Model. 2003, 164, 1–20. [Google Scholar] [CrossRef]
  68. Abatzoglou, J.T.; Kolden, C.A.; Balch, J.K.; Bradley, B.A. Controls on interannual variability in lightning-caused fire activity in the western US. Environ. Res. Lett 2016, 11, 045005. [Google Scholar] [CrossRef]
  69. Hall, B.L. Precipitation associated with lightning-ignited wildfires in Arizona and New Mexico. Int. J. Wildland Fire 2007, 16, 242–254. [Google Scholar] [CrossRef]
  70. Fuquay, D.M. Mountain thunderstorms and forest fires. Weatherwise 1962, 15, 149–152. [Google Scholar] [CrossRef]
  71. Latham, D.; Williams, E. Lightning and forest fires. In Forest Fires; Elsevier: Amsterdam, The Netherlands, 2001; pp. 375–418. [Google Scholar]
  72. Price, C.; Rind, D. What determines the cloud-to-ground lightning fraction in thunderstorms? Geophys. Res. Lett. 1993, 20, 463–466. [Google Scholar] [CrossRef]
  73. Hall, B.L.; Brown, T.J. Climatology of positive polarity flashes and multiplicity and their relation to natural wildfire ignitions. In Proceedings of the 19th International lightning DETECTION Conference, Tucson, AZ, USA, 24–25 April 2006. [Google Scholar]
  74. Flannigan, M.; Wotton, B. Lightning-ignited forest fires in northwestern Ontario. Can. J. For. Res. 1991, 21, 277–287. [Google Scholar] [CrossRef]
  75. Anderson, K. A model to predict lightning-caused fire occurrences. Int. J. Wildland Fire 2002, 11, 163–172. [Google Scholar] [CrossRef]
  76. Schumann, C.; Saba, M.M.F.; Da Silva, R.B.G.; Schulz, W. Electric fields changes produced by positives cloud-to-ground lightning flashes. J. Atmos. Sol.-Terr. Phys. 2013, 92, 37–42. [Google Scholar] [CrossRef]
  77. Saba, M.M.; Schulz, W.; Warner, T.A.; Campos, L.Z.; Schumann, C.; Krider, E.P.; Cummins, K.L.; Orville, R.E. High-speed video observations of positive lightning flashes to ground. J. Geophys. Res. Atmos. 2010, 115. [Google Scholar] [CrossRef] [Green Version]
  78. Fuquay, D.M.; Taylor, A.R.; Hawe, R.G.; Schmid Jr., C.W. Lightning discharges that caused forest fires. J. Geophys. Res. 1972, 77, 2156–2158. [Google Scholar] [CrossRef]
  79. Saba, M.; Pinto, O., Jr.; Ballarotti, M. Relation between lightning return stroke peak current and following continuing current. Geophys. Res. Lett. 2006, 33. [Google Scholar] [CrossRef] [Green Version]
  80. Fuquay, D.M. Positive cloud-to-ground lightning in summer thunderstorms. J. Geophys. Res. Oceans. 1982, 87, 7131–7140. [Google Scholar] [CrossRef]
  81. Kuleshov, Y.; Hettrick, P.; Mackerras, D.; Darveniza, M.; Jayaratne, E. Occurrence of positive and negative polarity cloud-to-ground lightning flashes: Case study of CGR4 and GPATS data for Brisbane, Australia. Aust. Meteorol. Oceanogr. J. 2011, 61, 107. [Google Scholar] [CrossRef]
  82. Mills, G.A. A re-examination of the synoptic and mesoscale meteorology of Ash Wednesday 1983. Aust. Meteorol. Mag. 2005, 54, 35–55. [Google Scholar]
  83. Mills, G.A. On the sub-synoptic scale meteorology of two extreme fire weather days during the Eastern Australian fires of January 2003. Aust. Met. Mag 2005, 54, 265–290. [Google Scholar]
  84. Bond, H.G. Report on the Meteorological Aspects of the Catastrophic Bushfires in South-Eastern Tasmania; Bond, H.G., Mackinnon, K., Noar, P.F., Eds.; Bureau of Meteorology: Melbourne, Australia, 1967. [Google Scholar]
  85. Fletcher, M.S.; Wolfe, B.B.; Whitlock, C.; Pompeani, D.P.; Heijnis, H.; Haberle, S.G.; Gadd, P.S.; Bowman, D.M. The legacy of mid-Holocene fire on a Tasmanian montane landscape. J. Biogeogr. 2014, 41, 476–488. [Google Scholar] [CrossRef]
  86. Holz, A.; Wood, S.W.; Veblen, T.T.; Bowman, D.M. Effects of high-severity fire drove the population collapse of the subalpine Tasmanian endemic conifer Athrotaxis cupressoides. Glob. Chang. Biol. 2015, 21, 445–458. [Google Scholar] [CrossRef]
  87. Marsden-Smedley, J.B.; Kirkpatrick, J.B. Fire management in Tasmania’s wilderness world heritage area: Ecosystem restoration using indigenous-style fire regimes? Ecol. Manag. Restor. 2000, 1, 195–203. [Google Scholar] [CrossRef]
  88. Kuleshov, Y.; De Hoedt, G.; Wright, W.; Brewster, A. Thunderstorm distribution and frequency in Australia. Aust. Meteorol. Mag. 2002, 51, 145. [Google Scholar]
  89. Australasian Fire and Emergency Service Authorities Council. AFAC Independent Operational Review: A Review of the Management of the Tasmanian Fires of December 2018–March 2019. Available online: http://www.fire.tas.gov.au/userfiles/AFAC/AFAC_Review.pdf (accessed on 1 March 2020).
  90. Styger, J.; Marsden-Smedley, J.; Kirkpatrick, J. Changes in lightning fire incidence in the Tasmanian wilderness world heritage area, 1980–2016. Fire 2018, 1, 38. [Google Scholar] [CrossRef] [Green Version]
  91. Earl, N.; Love, P.; Harris, R.; Remenyi, T. Dry Lightning Has Set Tasmania Ablaze and Climate Change Make It More Likely to Happen Again. Available online: https://theconversation.com/dry-lightning-has-set-tasmania-ablaze-and-climate-changemakes-itmore-likely-to-happen-again-111264 (accessed on 7 February 2019).
  92. Cummins, K.L.; Murphy, M.J. An overview of lightning locating systems: History, techniques, and data uses, with an in-depth look at the US NLDN. IEEE Trans. Electromagn. Compat. 2009, 51, 499–518. [Google Scholar] [CrossRef]
  93. Dowdy, A.J.; Fromm, M.D.; McCarthy, N. Pyrocumulonimbus lightning and fire ignition on Black Saturday in southeast Australia. J. Geophys. Res. Atmos. 2017, 122, 7342–7354. [Google Scholar] [CrossRef]
  94. MacNamara, B.R.; Schultz, C.J.; Fuelberg, H.E. Flash Characteristics and Precipitation Metrics of Western US Lightning-Initiated Wildfires from 2017. Fire 2020, 3, 5. [Google Scholar] [CrossRef] [Green Version]
  95. Richard, P.; Lojou, J. Assessment of application of storm cell electrical activity monitoring to intense precipitation forecast. In Proceedings of the 10th Conference on Atmospheric Electricity, Osaka, Japan, 10–14 June 1996; pp. 10–14. [Google Scholar]
  96. Dowdy, A.J.; Mills, G.A. Atmospheric and fuel moisture characteristics associated with lightning-attributed fires. J. Appl. Meteorol. Clim. 2012, 51, 2025–2037. [Google Scholar] [CrossRef]
  97. Dissing, D.; Verbyla, D.L. Spatial patterns of lightning strikes in interior Alaska and their relations to elevation and vegetation. Can. J. For. Res. 2003, 33, 770–782. [Google Scholar] [CrossRef]
  98. Albrecht, R.I.; Goodman, S.J.; Buechler, D.E.; Blakeslee, R.J.; Christian, H.J. Where are the lightning hotspots on Earth? Bull. Am. Meteorol. Soc. 2016, 97, 2051–2068. [Google Scholar] [CrossRef]
  99. Weiss, A. Topographic position and landforms analysis. In Proceedings of Poster presentation. In Proceedings of the ESRI User Conference, San Diego, CA, USA, 9–13 July 2001. [Google Scholar]
  100. Zhou, S.; Chen, G.; Fang, L.; Nie, Y. GIS-based integration of subjective and objective weighting methods for regional landslides susceptibility mapping. Sustainability 2016, 8, 334. [Google Scholar] [CrossRef] [Green Version]
  101. Tasmanian Department of Primary Industries, Parks, Water and Environment. Tasmanian Vegetation Monitoring and Mapping Program; TASVEG 3.0; Resource Management and Conservation Division, Department of Primary Industries, Parks, Water and Environment: Hobart, Australia, 2013. [Google Scholar]
  102. Hernandez-Magallanes, I.; Genton, M.G. A point process analysis of cloud-to-ground lightning strikes in urban and rural Oklahoma areas. Environmetrics 2019, 30, e2535. [Google Scholar] [CrossRef]
  103. Moris, J.V.; Conedera, M.; Nisi, L.; Bernardi, M.; Cesti, G.; Pezzatti, G.B. Lightning-caused fires in the Alps: Identifying the igniting strokes. Agric. For. Meteorol. 2020, 290, 107990. [Google Scholar] [CrossRef]
  104. McRae, R.H. Prediction of areas prone to lightning ignition. Int. J. Wildland Fire 1992, 2, 123–130. [Google Scholar] [CrossRef]
  105. Kuleshov, Y.; Jayaratne, E. Estimates of lightning ground flash density in Australia and its relationship to thunder-days. Aust. Meteorol. Mag. 2004, 53, 189–196. [Google Scholar]
  106. Blakeslee, R.J.; Mach, D.M.; Bateman, M.G.; Bailey, J.C. Seasonal variations in the lightning diurnal cycle and implications for the global electric circuit. Atmos. Res. 2014, 135, 228–243. [Google Scholar] [CrossRef]
  107. Dowdy, A.J.; Kuleshov, Y. Climatology of lightning activity in Australia: Spatial and seasonal variability. Aust. Meteorol. Oceanogr. J. 2014, 6, 9–14. [Google Scholar] [CrossRef]
  108. Williams, E.R. Global circuit response to seasonal variations in global surface air temperature. Mon. Weather Rev. 1994, 122, 1917–1929. [Google Scholar] [CrossRef]
  109. Orville, R.E.; Huffines, G.R. Cloud-to-ground lightning in the United States: NLDN results in the first decade, 1989–1998. Mon. Weather Rev. 2001, 129, 1179–1193. [Google Scholar] [CrossRef]
  110. Brook, M.; Nakano, M.; Krehbiel, P.; Takeuti, T. The electrical structure of the Hokuriku winter thunderstorms. J. Geophys. Res. Oceans. 1982, 87, 1207–1215. [Google Scholar] [CrossRef]
  111. Engholm, C.D.; Williams, E.R.; Dole, R.M. Meteorological and electrical conditions associated with positive cloud-to-ground lightning. Mon. Weather Rev. 1990, 118, 470–487. [Google Scholar] [CrossRef] [Green Version]
  112. Boulay, S.O.; Batt, L. Marine weather forecasting and monitoring at the Port of Sydney and Botany Bay, NSW, Australia. In Proceedings of the Australasian Coasts & Ports Conference 2015: 22nd Australasian Coastal and Ocean Engineering Conference and the 15th Australasian Port and Harbour Conference, Auckland, New Zealand, 1 January 2015; p. 102. [Google Scholar]
  113. Müller, M.M.; Vacik, H. Characteristics of lightnings igniting forest fires in Austria. Agric. For. Meteorol. 2017, 240, 26–34. [Google Scholar] [CrossRef]
  114. Sturman, A.P.; Tapper, N.J. The Weather and Climate of Australia and New Zealand; Oxford University Press: Melbourne, Australia, 1996. [Google Scholar]
  115. Bourscheidt, V.; Junior, O.P.; Naccarato, K.; Pinto, I. The influence of topography on the cloud-to-ground lightning density in South Brazil. Atmos. Res. 2009, 91, 508–513. [Google Scholar] [CrossRef]
  116. Bhavika, B. The Influence of Terrain Elevation on Lightning Density in South Africa. Master’s Thesis, University of Johannesburg, Johannesburg, South Africa, 2007. [Google Scholar]
  117. King, K.J. Simulating the Effects of Anthropogenic Burning on Patterns of Biodiversity. Ph.D. Thesis, Australian National University, Canberra, Australia, 2004. [Google Scholar]
  118. Cary, G.J. Predicting Fire Regimes and Their Ecological Effects in Spatially Complex Landscapes. Ph.D. Thesis, Australian National University, Canberra, Australia, 1998. [Google Scholar]
Figure 1. Topographic map of Tasmania (400-m contour lines) showing ignition types (accidental, deliberate, planned burn, undetermined and lightning-induced) and locations between 2011 and 2019. The major vegetation groups distributed over the study area are shown.
Fire 04 00010 g001
Figure 2. Seasonal count of cloud-to-ground (CG) lightning strikes (January 2011–June 2019), visualized by 5 km × 5 km rectangular binning: (a) summer, (b) autumn, (c) winter, (d) spring. The most critical fire season in Tasmania aligns with the summer months (December, January, February), although different vegetation types are subject to different seasonality in fire danger. Counts of lightning strikes per month are presented in the Supplementary Materials (Figure S1).
Fire 04 00010 g002
Figure 3. Plots (a) monthly time series and (b) monthly boxplot show square root of the rate of cloud-to-ground (CG) lightning strikes per square kilometer. Plots (c) monthly time series and (d) monthly boxplot show logarithmic function of the ratio of positive strokes from the total number of lightning strikes. Each plot also includes a smoother loess (blue line) and the respective confidence intervals (grey area). A three-month moving average (red line) in plots (a) and (c) compares the periodic seasonal component. The outliers (black dots) are associated with storms resulting from infrequent weather phenomena. The mean value (red points) of each boxplot shown.
Fire 04 00010 g003
Figure 4. (a) Cumulative fraction of total annual cloud-to-ground (CG) lightning strikes for the days with the highest number of lightning strikes for 2011 to 2019. The dashed line displays the mean, and the solid lines display the nine individual years. (b) Comparison of mean seasonal variability between frequency of lightning days and lightning strikes.
Fire 04 00010 g004
Figure 5. Diurnal distribution of total population of lightning strikes (%) (black histograms, right axis) compared to ignition candidate strikes (%) (red lines, left axis) across different seasons. Potential ignition candidates were selected by proximity index analysis as explained in Section 2.4.
Fire 04 00010 g005
Figure 6. Diurnal pattern of actual ignition candidates classified with negative and positive polarity.
Fire 04 00010 g006
Figure 7. Density of total and seasonal cloud-to-ground (CG) lightning strikes as colored lines (right axis) divided into (a) elevation, (b) aspect, and (c) TPI. Relative frequency (%) of lightning strikes (left axis) and land–surface as a function of elevation, aspect and TPI (horizontal axis). Black bars indicate the proportion of the total land area that falls within each classification. Grey bars indicate the relative frequency of lightning strikes within each classification.
Fire 04 00010 g007aFire 04 00010 g007b
Figure 8. (a) Lightning Ignition Efficiency (LIE) per lightning stroke and per lightning flash categorized by month. (b) Spatial variability of LIE (per stroke); Pixels with more than 4 lightning-induced fires over the study period are highlighted with a black square around the grid cells. The boundaries show the Natural Resource Management (NRM) regions North, North-West, and South Tasmania.
Fire 04 00010 g008
Table 1. Annual total population and potential ignition candidate population of negative and positive of cloud-to-ground (CG) lightning strikes and lightning days for the study period across Tasmania.
Total PopulationPotential Ignition Candidate Population
Lightning DaysLightning StrikesLightning DaysLightning Strikes
Year+Total+Total(−:+)+Total+Total(−:+)
20118260894160649480987:132121782568:32
201282668975341384891884:1643495610194:6
201388759314,271402618,29778:226461102375147775:25
201474667814,369329817,66781:191171173215288483:17
201570557346761880655671:291231992868:32
201678758931,190888140,07178:226662176387256385:15
20176660747868331411,18270:3043446736082756:44
201883789110,295350413,79975:257681872120890:10
20194040479741270212,44378:22756183976191596:4
Sum663575723104,10429,638133,742 483749663413948028
Avg74648011,567329314,86078:2254573715589283:17
STD141114772822319894 323763161868
Table 2. Details of estimated lightning flash polarity and multiplicity in Tasmania detected by GPATS (January 2011–June 2019). Multiplicity is the average number of strokes per cloud-to-ground (CG) flash. The polarity and median peak current (kA) refer to the first stroke in each multiple stroke flash.
Population(%) Single Stroke(%) PolaritykA Median
(Average)
Average
Multiplicity
Total (−)447321 (27.3)1.58
Total (+)672716.4 (24)1.22
PIC (−)327619.75 (23.8)1.85
PIC (+)63248.5 (12.15)1.25
AIC (−)468527.85 (33.5)1.5
AIC (+)701533 (37)1.2
Table 3. Ignition efficiency by cloud-to-ground (CG) lightning strikes as a function of different vegetation types across Tasmania [101].
Vegetation TypeArea (km2)Lightning StrikesIgnitionsLIE (%)
Moorland, sedgeland, rushland and peatland13659539370.39
Native grassland2145249570.28
Rainforest and related scrub599314,549390.27
Wet eucalypt forest and woodland108418,107470.26
Non-eucalypt forest and woodland71584304110.26
Dry eucalypt forest and woodland513332,739800.24
Agricultural, urban and exotic vegetation10,93434,300710.21
Scrub, heathland and coastal complexes15,89410,509200.19
Highland and treeless vegetation16,240298320.07
Other natural environments2447371510.03
Saltmarsh and wetland23746100.00
Publisher’s Note: MDPI stays neutral with regard to jurisdictional claims in published maps and institutional affiliations.

