Article

Changing Climate Suitability for Dominant Eucalyptus Species May Affect Future Fuel Loads and Flammability in Tasmania

by
Jessica Lucas
* and
Rebecca M. B. Harris
Discipline of Geography & Spatial Science, University of Tasmania, Sandy Bay 7001, Australia
*
Author to whom correspondence should be addressed.
Submission received: 28 November 2020 / Revised: 22 December 2020 / Accepted: 26 December 2020 / Published: 7 January 2021
(This article belongs to the Special Issue Bushfire in Tasmania)

Abstract

:
Fire management is becoming increasingly relevant in our changing climate as fire frequency and intensity increases both on a global scale and locally in Tasmania. The distribution of fuel across the landscape has significant impacts on fire regimes, influencing connectivity and flammability of fuel load. Remote sensing techniques are often used to assess current fuel loads, but projections of future fuel distributions are necessary for longer term planning of fire management. Eucalyptus species are an important, dominant component of many Tasmanian forests, influencing fuel load and flammability. We modelled the current and future climate suitability for two Eucalyptus species (E. delegatensis and E. obliqua), using a suite of species distribution models (SDMs) and global climate models (GCMs) for mid (2041–2060) and end of century (2061–2080) time periods. The implications these changes may have for the distribution of these important fuel species in the future are discussed. All GCMs projected notable changes in potential distribution, with both species contracting substantially in some areas and E. obliqua also exhibiting considerable expansions in the west of Tasmania. On average, suitability for E. delegatensis expanded by 5% ± 1.8% (1658 km2), contracted by 67% ± 22.7% (24,591 km2) and remained unchanged in 26% ± 7.8% (8783 km2) by the end of the century. For E. obliqua suitability expanded by a much greater 17% ± 6.3% (24,398 km2), contracted by slightly less at 55% ± 16.8% (81,098 km2) and remained unchanged in 45% ± 16.8% (63,474 km2) by the end of the century. These changes in climate suitability have the potential to cause changes in the composition and structure of Tasmania’s forests, impacting fuel loads. However, the two species exhibited different responses, reflecting their current distributions and suggesting that generalisations regarding species’ responses to changing climates are not appropriate, even where the species are closely related. These results suggest that future fuel loads and flammability at the landscape scale may change, requiring longitudinal, flexible and adaptive future fire management. Assessing the specific effects of distributional changes and the mechanisms driving different responses to climate change are highlighted as further research opportunities.

1. Introduction

Fire management, the planning, prevention and fighting of fires, is becoming increasingly relevant in our changing climate as fire frequency and intensity increases on a global scale [1]. In recent history shifts have been observed in bushfire occurrence [2,3] as illustrated by the two extreme bushfire events in Tasmania in 2016 and 2019. The 2016 Tasmanian bushfires affected 126,800 ha across the state and triggered a bushfire and climate change research project which concluded that the Tasmanian Wilderness World Heritage Area (TWWHA) will face increased bushfire risk due to climate change [4]. In 2019, bushfires in Tasmania again burned vast areas (210,311 hectares) [5]. An increased frequency of fire is expected to continue as climate change accelerates [6], including at a local scale with predictions for broad increases to fire danger in Tasmania from 1961 to 2100 [7]. This highlights the need for well-informed, forward planning fire management.
The earth’s climate is changing and this has a direct impact on fire regimes [8], but it also affects which areas are suitable for species to live in [9,10,11]. Species distributions determine what fuel is available at a site, with fuel type and load having significant impacts on the extent, intensity, frequency and seasonality of fire [12]. This is in line with findings that individual species traits impact fire characteristics [13]. The continuity of fuel is also determined by species distributions, and influences a fire’s extent, intensity, burning pattern, severity and duration [12]. Additionally, vegetation type has been shown to have significant impacts on the response of fire to warming climates in the southeast of Australia, with increases in fire frequency more likely for wetter, coastal temperate forests [3].
Species distributions are commonly studied using species distribution models (SDMs). SDMs are a collection of algorithms designed to analyse species occurrence data alongside environmental variables (e.g., climate and soils) to model the potential distribution of a species based on environmental suitability [14]. SDMs are becoming an increasingly useful tool in environmental research and are commonly and successfully used to define areas of conservation significance [15]. Using data from global climate models (GCMs), species distribution models can model potential future distributions under different emissions scenarios [14]. This allows for the analysis of possible contractions, expansions and shifts in species distribution. Such changes in species distribution affect the location of fuel which is highly relevant to fire regimes, with fuel being one of the three key components affecting fire activity [16].
Assessing the current state of fuel loads and distributions is useful for informing fire management practices [17], and is currently often achieved using remote sensing techniques [18]. While these techniques are highly useful and becoming more advanced [18], they are limited to assessing current fuel loads and distributions. Because climate change is a key driver of increasing fire risk, these static models of fuel loads may not be adequate for informing fire management under future conditions. While they are useful for short term purposes, techniques of assessing fuel loads with capabilities of future projection are required for the formulation of effective long-term fire management plans. Species distribution modelling is one possible method for assessing the state of both current and future fuel load distributions and may be a valuable compliment to preexisting fuel assessment methods.
Eucalyptus species are highly flammable [19,20] and dominant in many Australian forests [21], making them an important determinant of fuel loads and a suitable subject for studying fuel and fire management using SDMs. Eucalyptus species have been shown to shift in their distribution under a suite of projected future climates [22], with significantly less cover in the hottest, driest geographic areas, and significantly more in currently cooler regions. This is in line with evidence that Eucalypts are facing increasing climate stress [23]. In a study of 830 Eucalyptus species across Australia, it was shown that within the next few decades, entire populations of many Eucalypt species may be exposed to climatic conditions outside their range of tolerance [24]. Several studies have noted the importance of considering adaptability and dispersal when analysing projected changes in species distributions [25,26]. This has been reported to be particularly relevant to Eucalyptus species [26].
This study aims to model the environmental suitability of two Tasmanian Eucalyptus species (E. delegatensis and E. obliqua), under current and future climatic conditions, to assess the implications any potential changes to distribution may have on future fire activity. We focus on E. delegatensis and E. obliqua because they are dominant species in both dry and wet forests and their current distributions suggest different limiting factors. The current distribution of E.delegatensis suggests that temperature is an important determinant of this species’ distribution, as it is restricted to cooler, sub-alpine areas in Tasmania and the Australian Alps [21]. In contrast, E. obliqua, with a broad south eastern Australian range, appears not to be limited to areas with lower temperatures, and is more moisture dependent [21]. As a result, they may exhibit contrasting changes to their future distributions, potentially enabling general rules for application to other species to be identified. We test the null hypothesis that there will be no change in climate suitability for E. delegatensis or E. obliqua over the next century in Tasmania.

2. Method

Environmental suitability under current and future climate conditions for two Eucalyptus species (E. delegatensis and E. obliqua), was modelled using an ensemble of Species Distribution Models (SDMs) and Global Climate Models (GCMs). Areas where suitability is projected to increase, decrease or remain unchanged between the time periods are mapped and the extent of suitability for each species across Tasmania quantified.

2.1. Modelling Platform (The BCCVL)

All analyses were completed in the Biodiversity and Climate Change Virtual Laboratory (BCCVL) [27], an online modelling platform which provides integrated tools and datasets for climate change and species distribution analyses, with high powered computational and storage capacities.

2.2. Species Occurrence Data and Preparation

Species occurrence data for E. delegatensis [28] and E. obliqua [29] was imported from the Atlas of Living Australia (ALA) (https://www.ala.org.au/). The ALA is a nationwide database containing 9553 occurrence records for E. delegatensis, and 34,403 for E. obliqua. These records were cleaned to remove potentially low-quality records—those from before 1960, situated outside Australia, listed as preserved specimens or of unrecognised occurrence status and those flagged as an outlier for one or more bioclimatic layers. This data cleaning process is crucial, as it reduces discrepancies in the definition of the climatic conditions under which a species can occur caused by erroneous occurrence data [30,31]. Occurrence points arranged in rows indicative of human planting were retained in the data, as they were unlikely to be receiving maintenance and not flagged as preserved specimens. Species occurrence points nationwide, rather than a restricted Tasmanian subset, were used in the training of the models so that the full range of environmental conditions under which the species can survive and reproduce were best represented. After cleaning, 7639 records for E. delegatensis and 30,788 for E. obliqua remained. The dataset has been published for open access via Mendeley Data [32].
The current distribution of E. obliqua spans the coast of southeast Australia and is widely distributed in Tasmania, particularly along the north and east coasts, while E. delegatensis is restricted to subalpine forests in southeastern Australia and Tasmania.

2.3. Species Distribution Models

The distributions of the two Eucalyptus species under recent climatic conditions, between the years 1960–1990, were modelled using the cleaned data. Three different SDM algorithms were used to model the distributions, chosen to represent a range of algorithm types. The two algorithm types used were machine learning models and statistical models (listed in Table 1, with a description of their strengths and weaknesses). Default configurations (see Supplementary Methods S1) and generation of pseudo absences were used for each of the three models.
The outputs from the three algorithms were combined into an ensemble mean to account for the variability associated with different SDM algorithms [36].

2.4. Climate Variables and Soil Parameters

Bioclimatic variables, derived from spatial interpolation of long-term mean monthly data, are commonly used in ecological studies and species distribution modelling. There are 35 available bioclimatic variables, representing annual trends (e.g., mean annual temperature and precipitation), seasonal trends (e.g., annual range in temperature or precipitation) and extreme or limiting environmental factors (e.g., temperature of the coldest and warmest month, precipitation for wettest or driest quarters) [14,37].
Variable selection can affect the results of SDMs, particularly when projecting into future conditions [38], although this is less of an issue for long-lived sedentary plant species such as Eucalypts [14]. In consultation with ecologists from the Department of Primary Industries, Parks, Water and Environment (DPIPWE), bioclimatic variables were selected that were uncorrelated and expected to influence Eucalyptus distributions in Tasmania. Five variables representing seasonality in rainfall and temperature and the potential impact of extreme heat and dryness were selected: Annual Mean Temperature (B01), Maximum Temperature of Warmest Month (B05), Mean Temperature of Coldest Quarter (B11); Precipitation of the Driest Quarter (B17) and Isothermality (B03) (a measure of temperature consistency, calculated by dividing the average range in monthly temperature (B02) by the range in annual temperature (B07)) [39].
In addition to the bioclimatic variables, the model was trained with substrate data from the dataset ‘Australia, National Soil Grids (2012), 9 arcsec (~250 m) [40]. Substrate is a strong determinant of Eucalyptus distributions [21] and it has been shown that using a combination of climate and landscape predictors results in more robust distribution models [41].

2.5. Climate Data—Current and Future

Environmental suitability for each species was modelled under current climate conditions and a range of projected future climate conditions. Statistically downscaled climate data at a spatial resolution of ~1 km (30 arcsec) from the BCCVL data collection was used (the ‘Australia, current and future climate’ dataset [39]). Data for the period 1976–2005 represents the current period, and two future time periods were chosen to represent mid-century (2041–2060) and end of century (2061–2080). Twenty year means are typically used when modelling future distributions to encompass a range of climatic variations that occur on decadal scale [42].

2.6. Global Climate Models

The Climate Futures Tool [43] was used to select three Global Climate Models (GCMs) with the aim of best representing the spectrum of plausible futures for Tasmania. Forty-eight different climate models were sorted into categories based on changes in temperature and rainfall, with a model from each of the three most common categories chosen, which were: (i) “Very hot, very dry”, which comprised 19% of the Coupled Model Intercomparison Project 5 (CMIP5) model archive (9 of 48 models); (ii) “Hot, little rainfall change”, which made up 21% of the models (10 of 48), and (iii) “Hot and dry”, which represented 12% of the models (6 of 48). We did not consider a “warmer and wetter” scenario, because only 3 of the 48 models fell in this category.
The models selected were ACCESS1.0, to represent a very hot and very dry future (a temperature increase of >3 °C and annual precipitation decline of 15%); MIROC5 to represent a future with relatively low warming and little change in precipitation (a temperature increase of 1.5–3 °C and −5% to 5% change in annual precipitation), and CNRM-CM5, which projects a hot and dry future (a temperature increase of 1.5–3 °C and −15% to −5% change in annual precipitation (Table 2).

2.7. Emissions Scenarios

Future climate suitability was based on the highest of the Intergovernmental Panel on Climate Change’s (IPCC) four emissions scenarios (RCP 8.5), which represents a future in which carbon emissions continue on our current trajectory without mitigation [45]. This is the scenario we are currently tracking [46]. However, if global emissions were reduced, similar patterns in climate trends are projected, but at a lower magnitude [42]. A single emissions scenario is sufficient to describe the next two to three decades, a time period of relevance to operational fire management, as the scenarios do not fully diverge until after 2040–2050 [42].

3. Results

The models reflected the known distributions of both species well (Figure 1), with E. delegatensis currently distributed over areas of mid to high elevation across most of the state, especially inland and to the east and E. obliqua exhibiting a relatively wide distribution across Tasmania, concentrated along a wide section of the north coast and the southeast quadrant.
The three models provided a similar pattern of environmental suitability for both species, but there was some variation in the extent of suitable area. The Maxent model produced the most restricted area for both species (Figure 1).
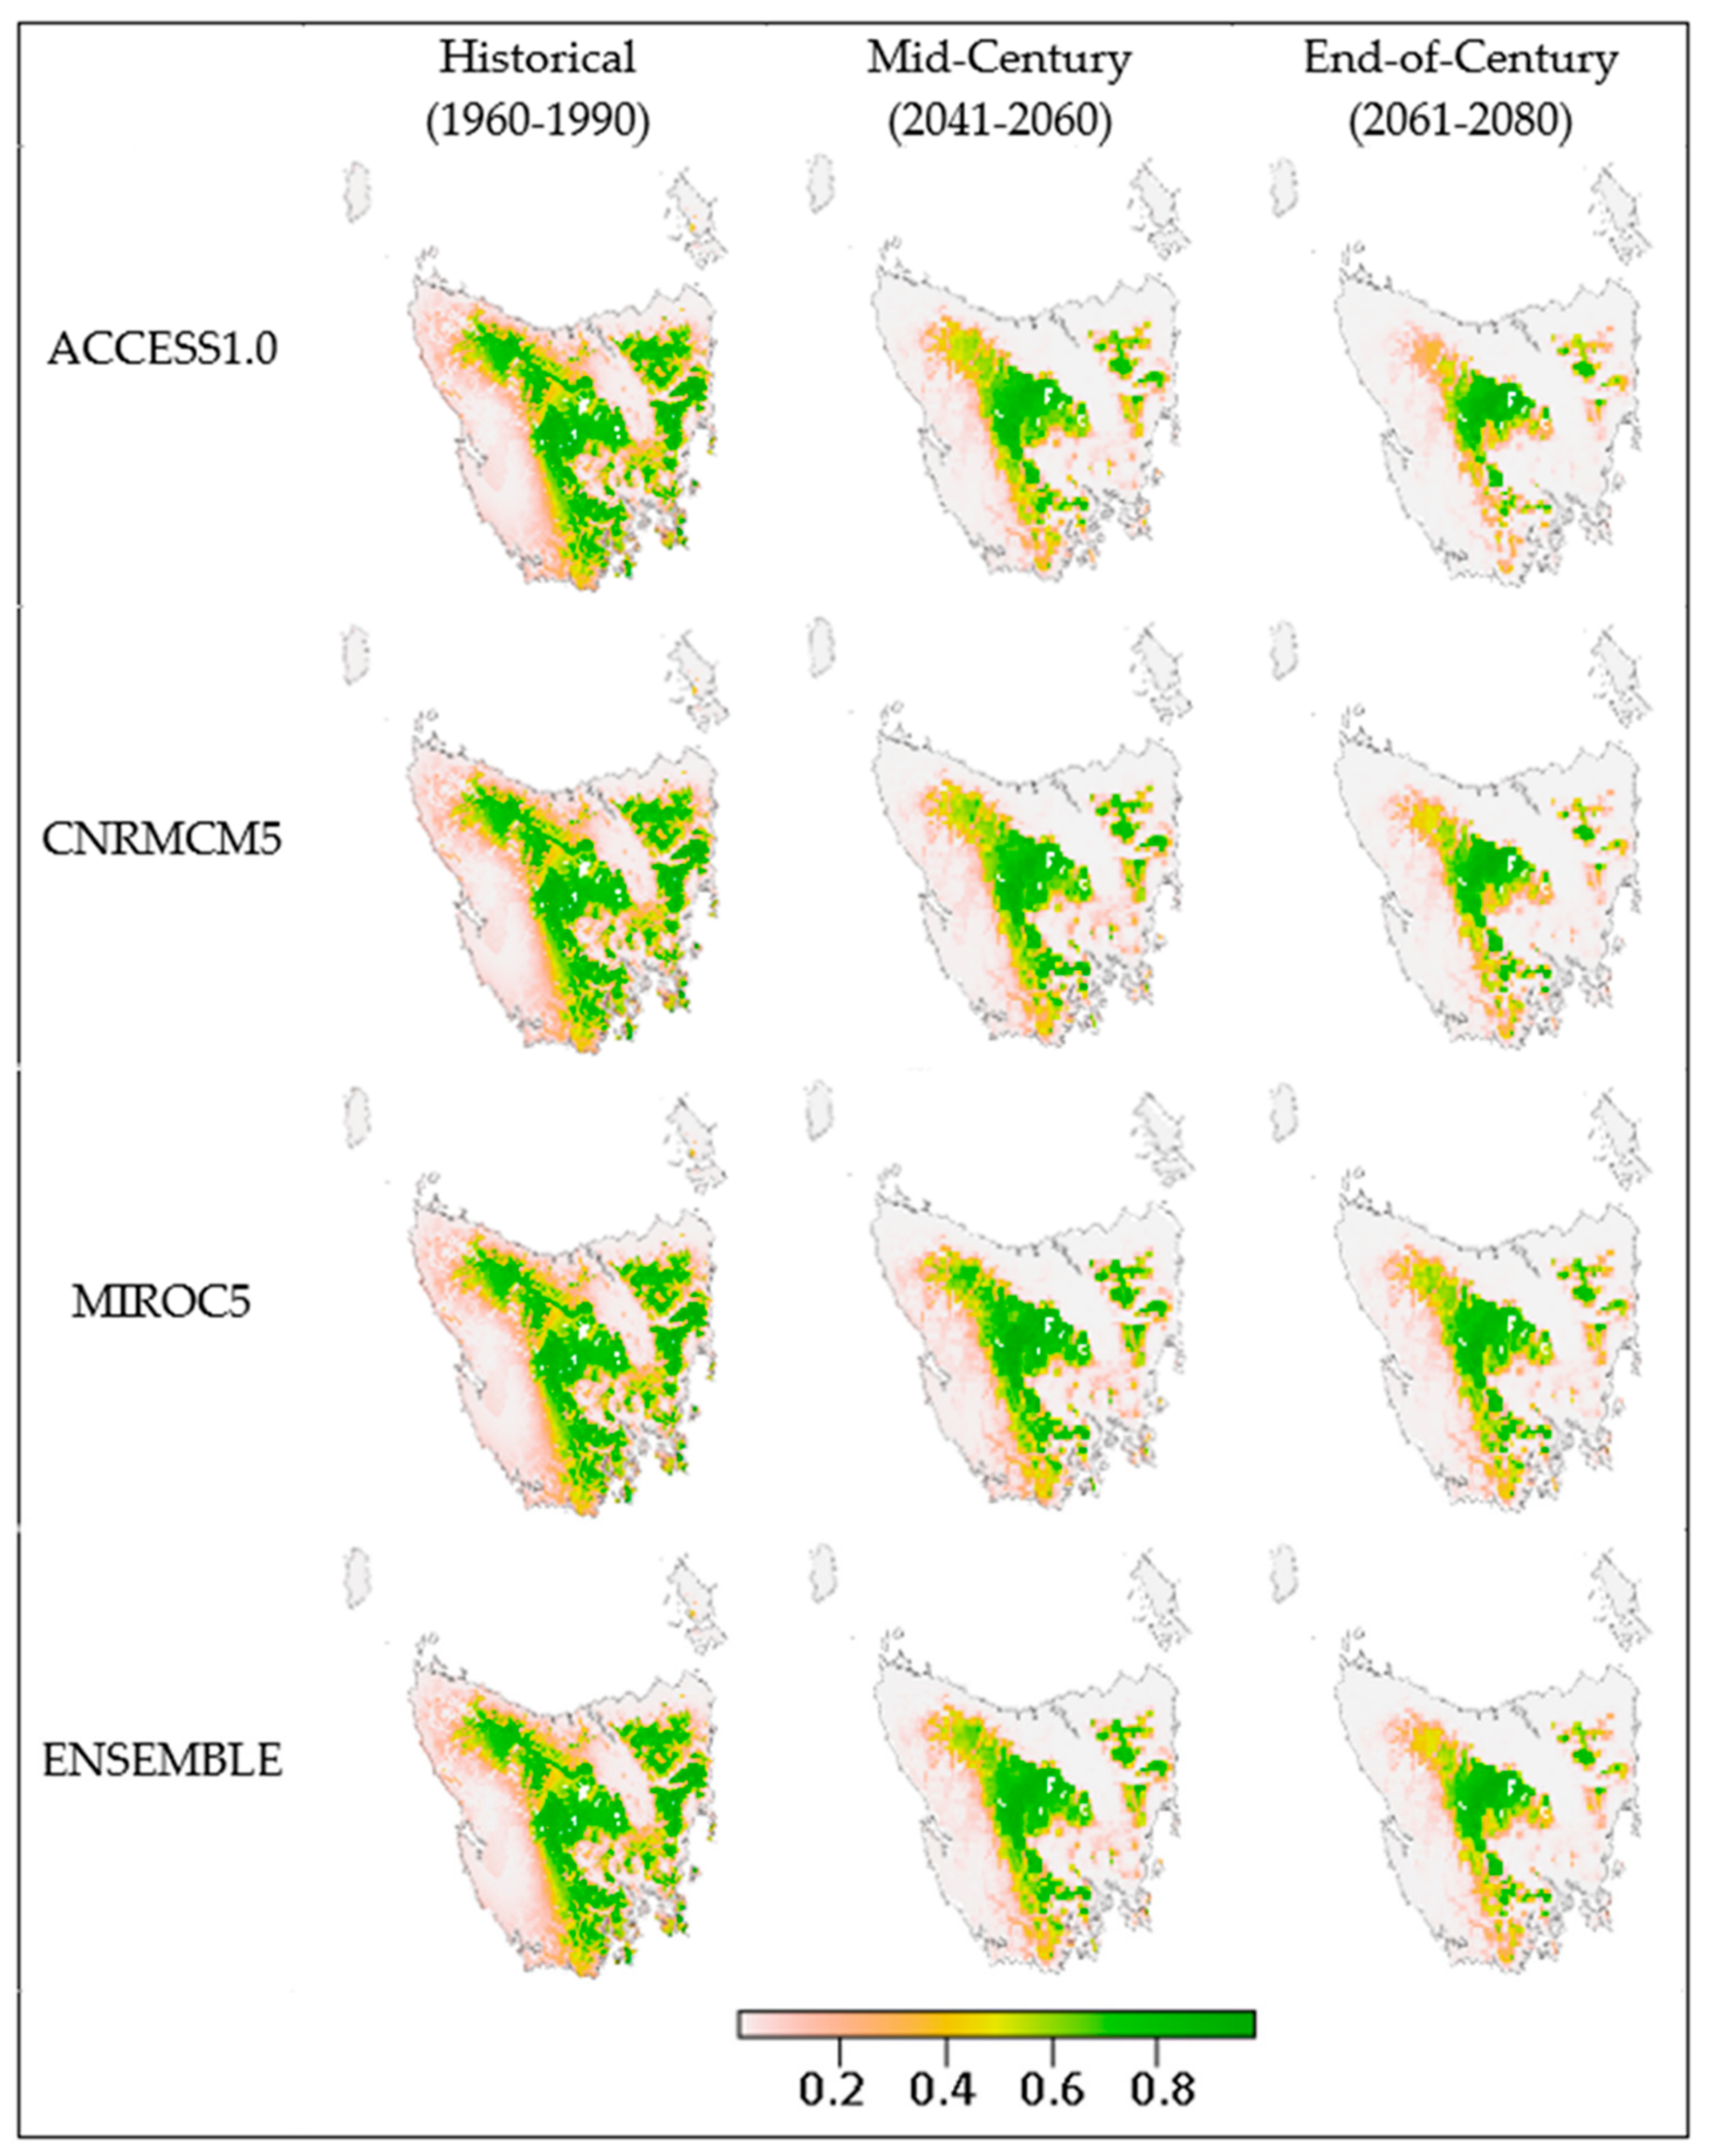
The projections showed that suitability for E. delegatensis may change notably over time, with high consensus between the three GCMs at each time period (Figure 2). The area with conditions suitable for E. delegatensis is projected to contract by 67% ± 22.7% (81,098 km2) on average across the models by the end of the century (Table 3, Supplementary Table S2), contracting to the areas of highest elevation within its original distribution (Figure 2). A comparatively minimal expansion of only 5% ± 1.8% (1658) is expected to occur in the same time period (Figure 2 and Table 3). This contraction was particularly evident in the southern, eastern and northern edges of the original range of environmental suitability, with the western boundary remaining largely unchanged (Figure 2).
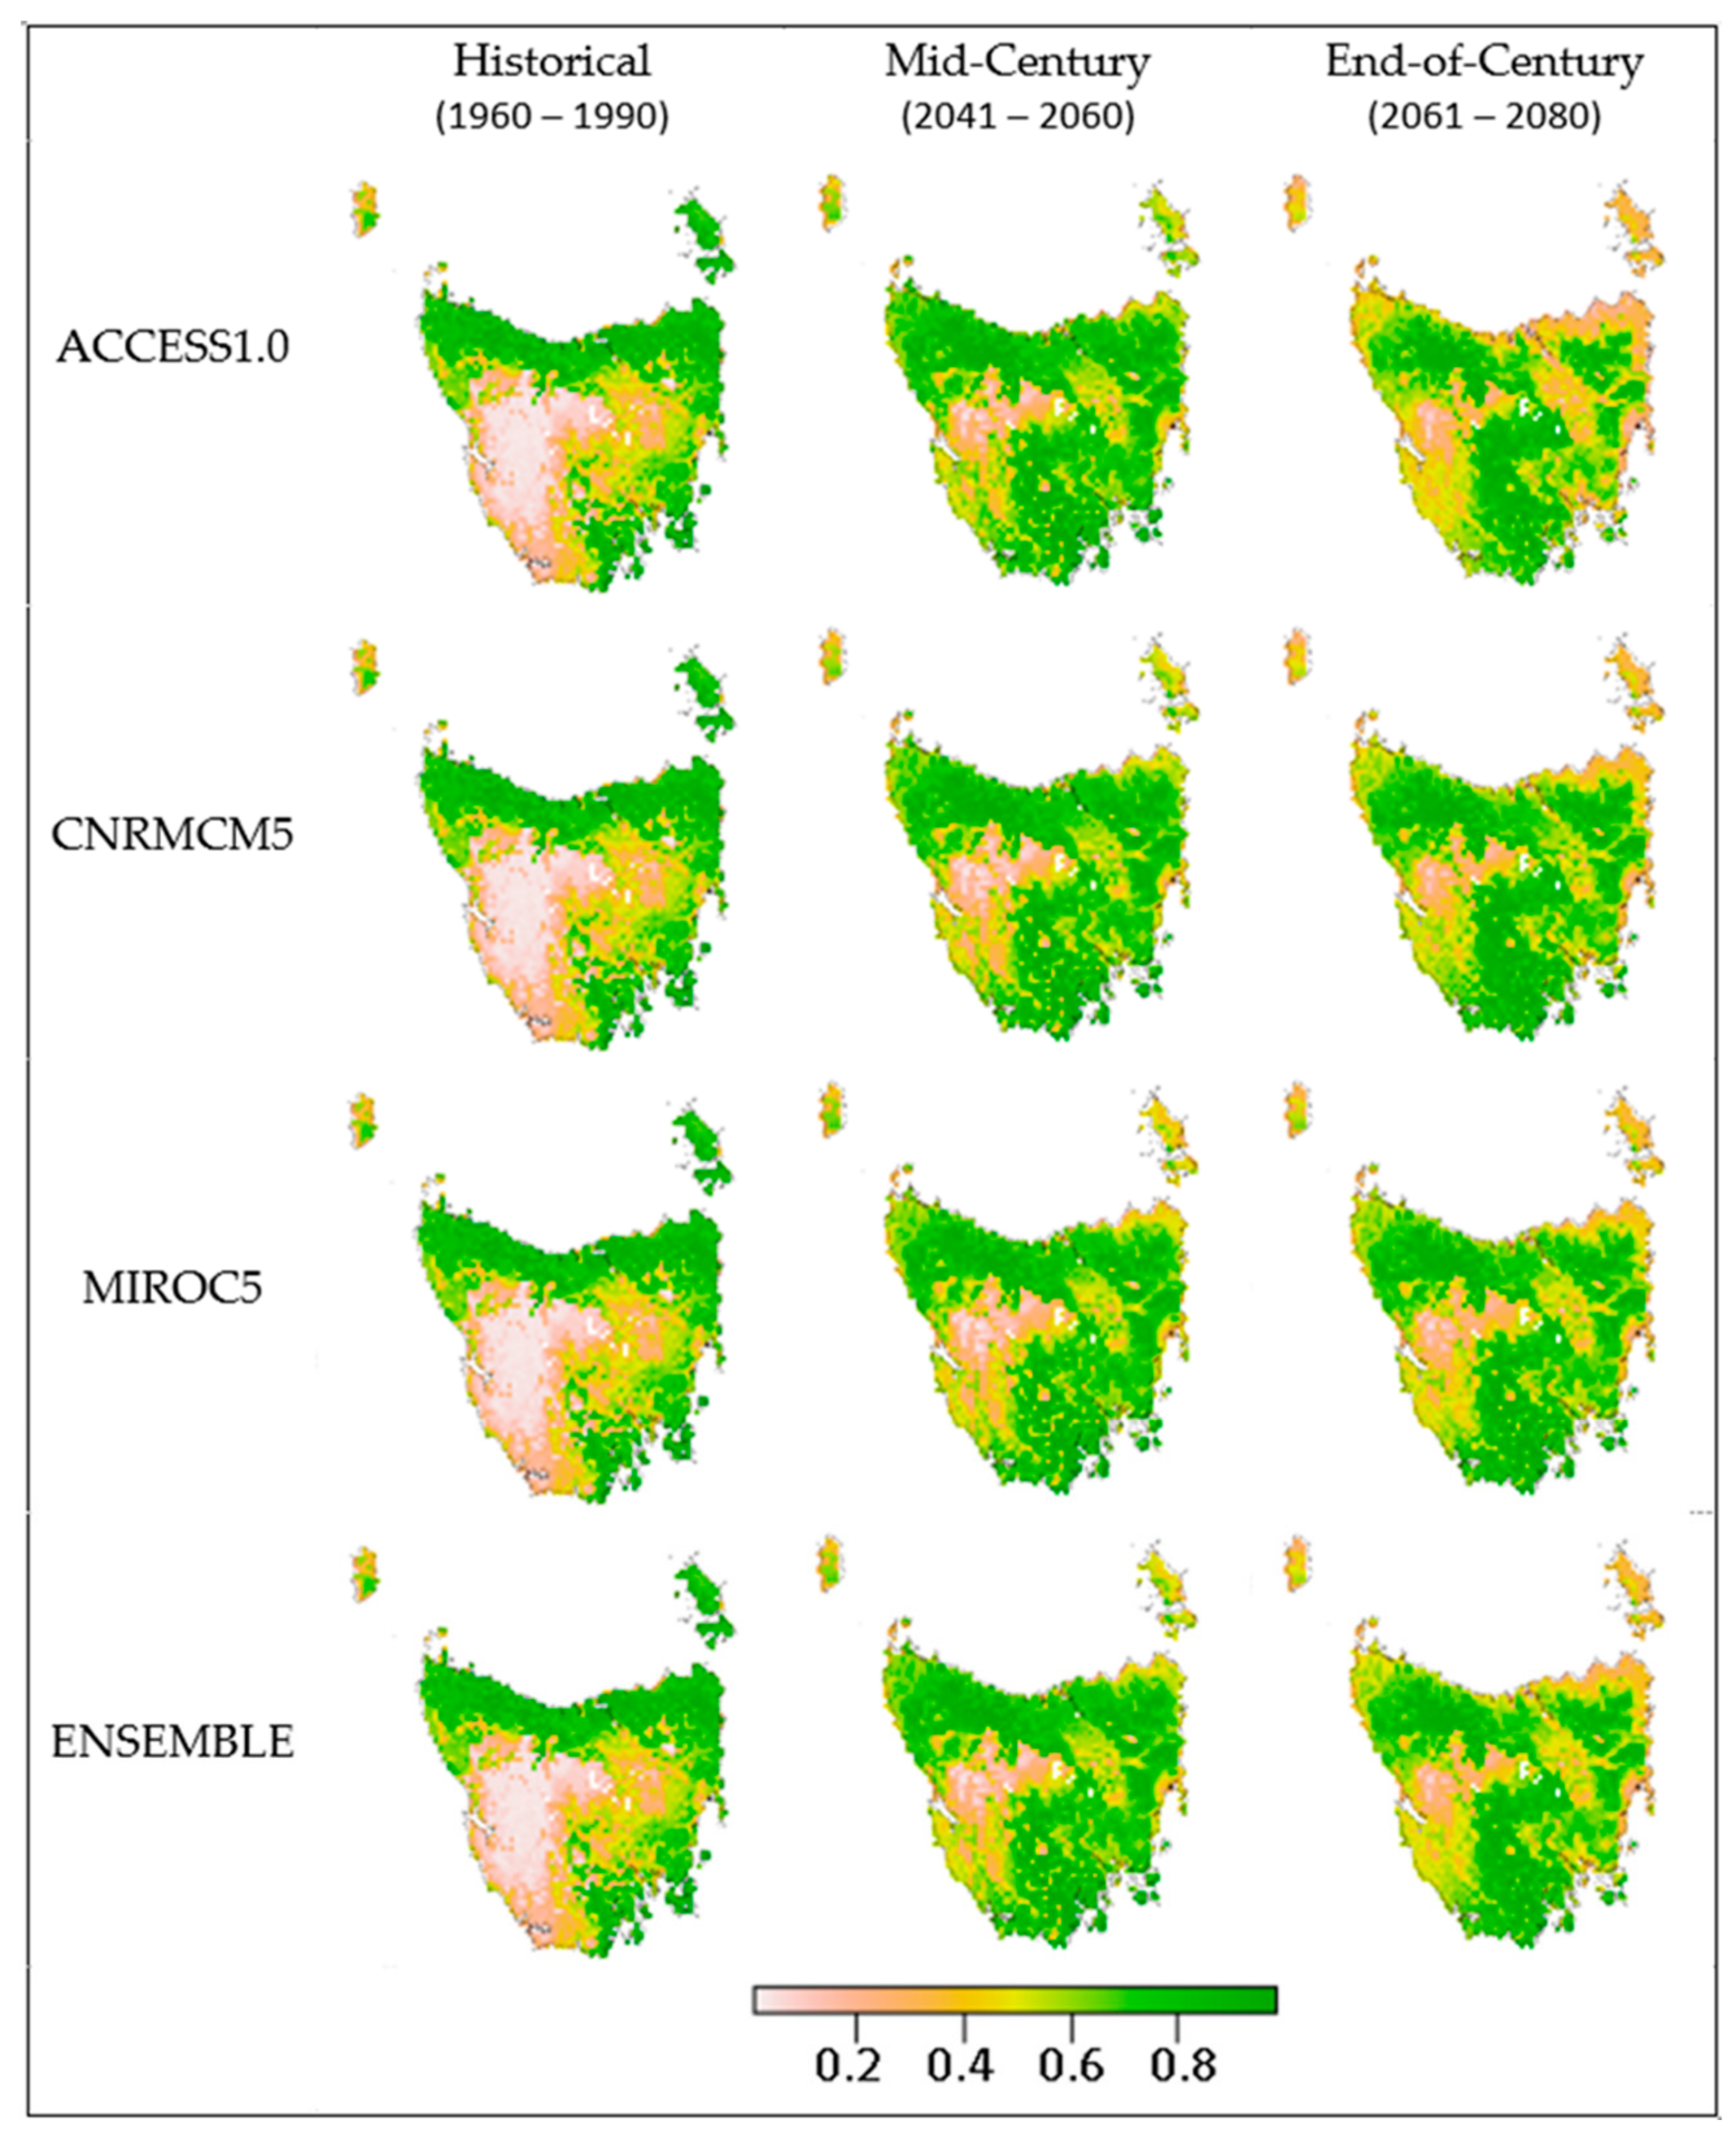
Similarly, the projections of environmental suitability for E. obliqua showed substantial contractions in some regions over time (Figure 3), resulting in an average reduction of 55% ± 16.8% (81,098 km2) across all models by end of century (Table 4, Supplementary Table S3). These contractions were largely limited to narrow areas around the coast, concentrated in the north and northeast (Figure 3). Contrary to the changes observed in E. delegatensis, the areas of environmental suitability for E. obliqua also expanded extensively into the southwest of Tasmania with an average expansion of 17% ± 6.3% by end of century (Table 4), resulting in a shift rather than a simple reduction in the geographic range of the species.
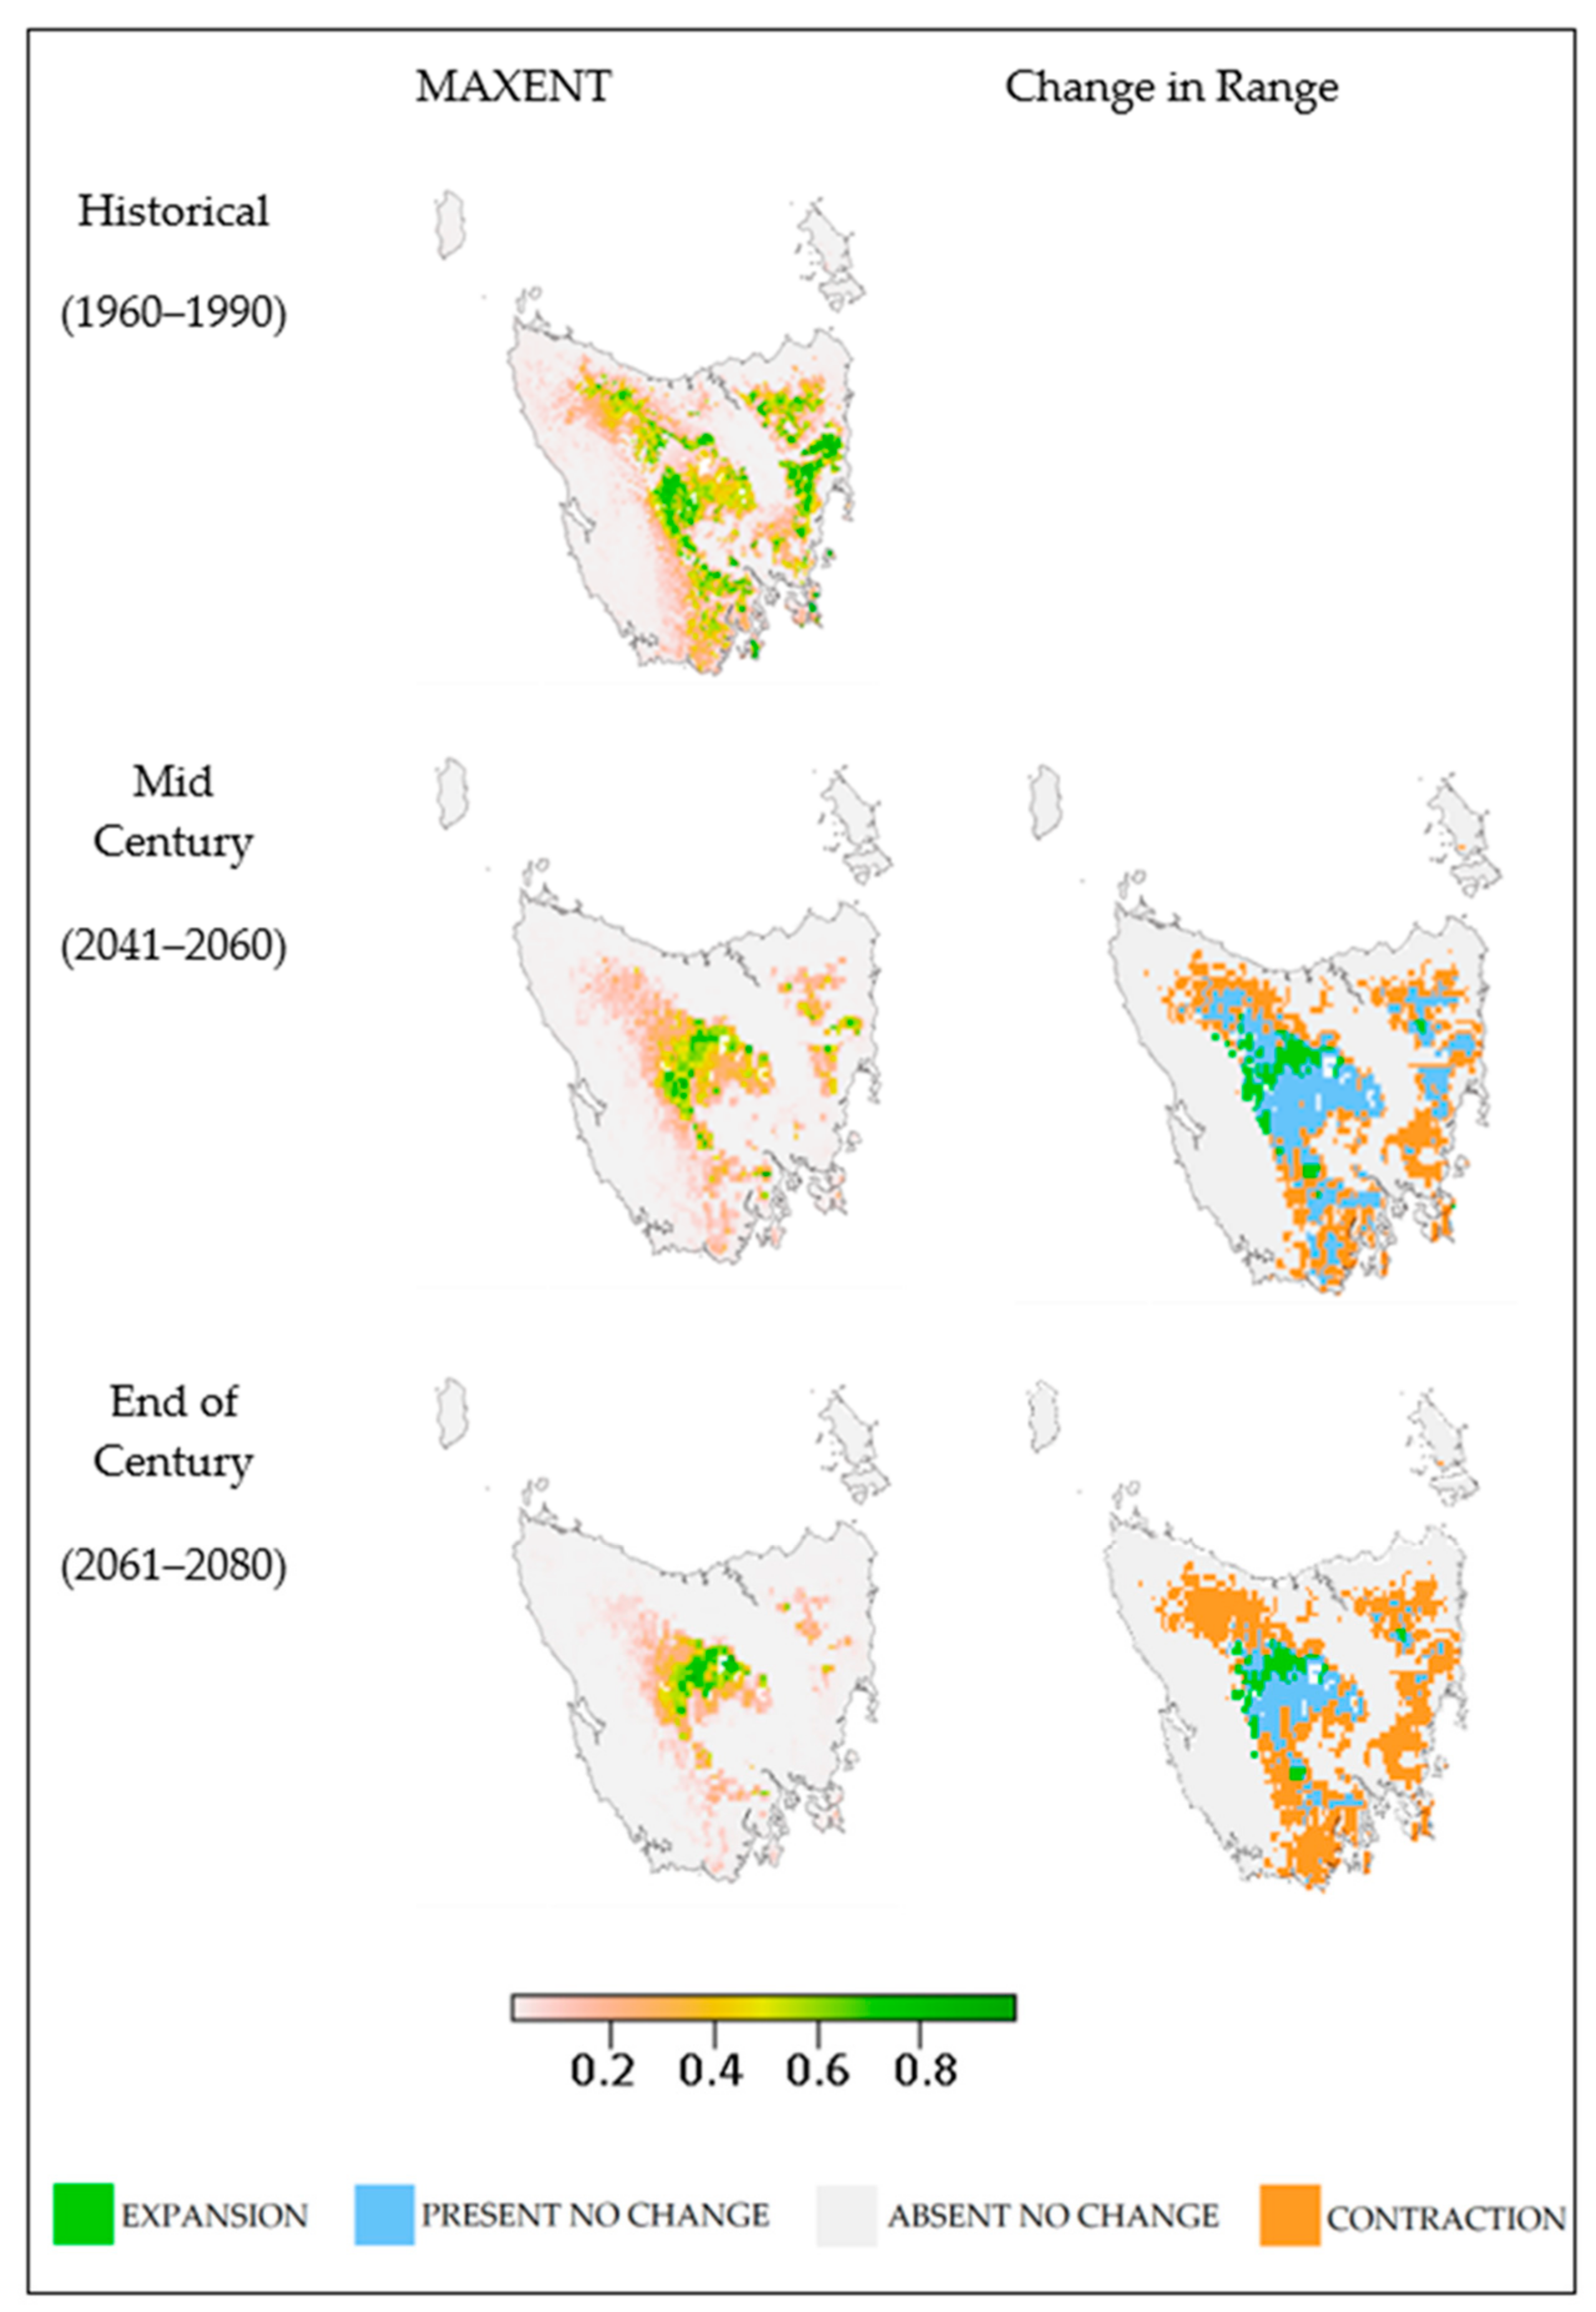
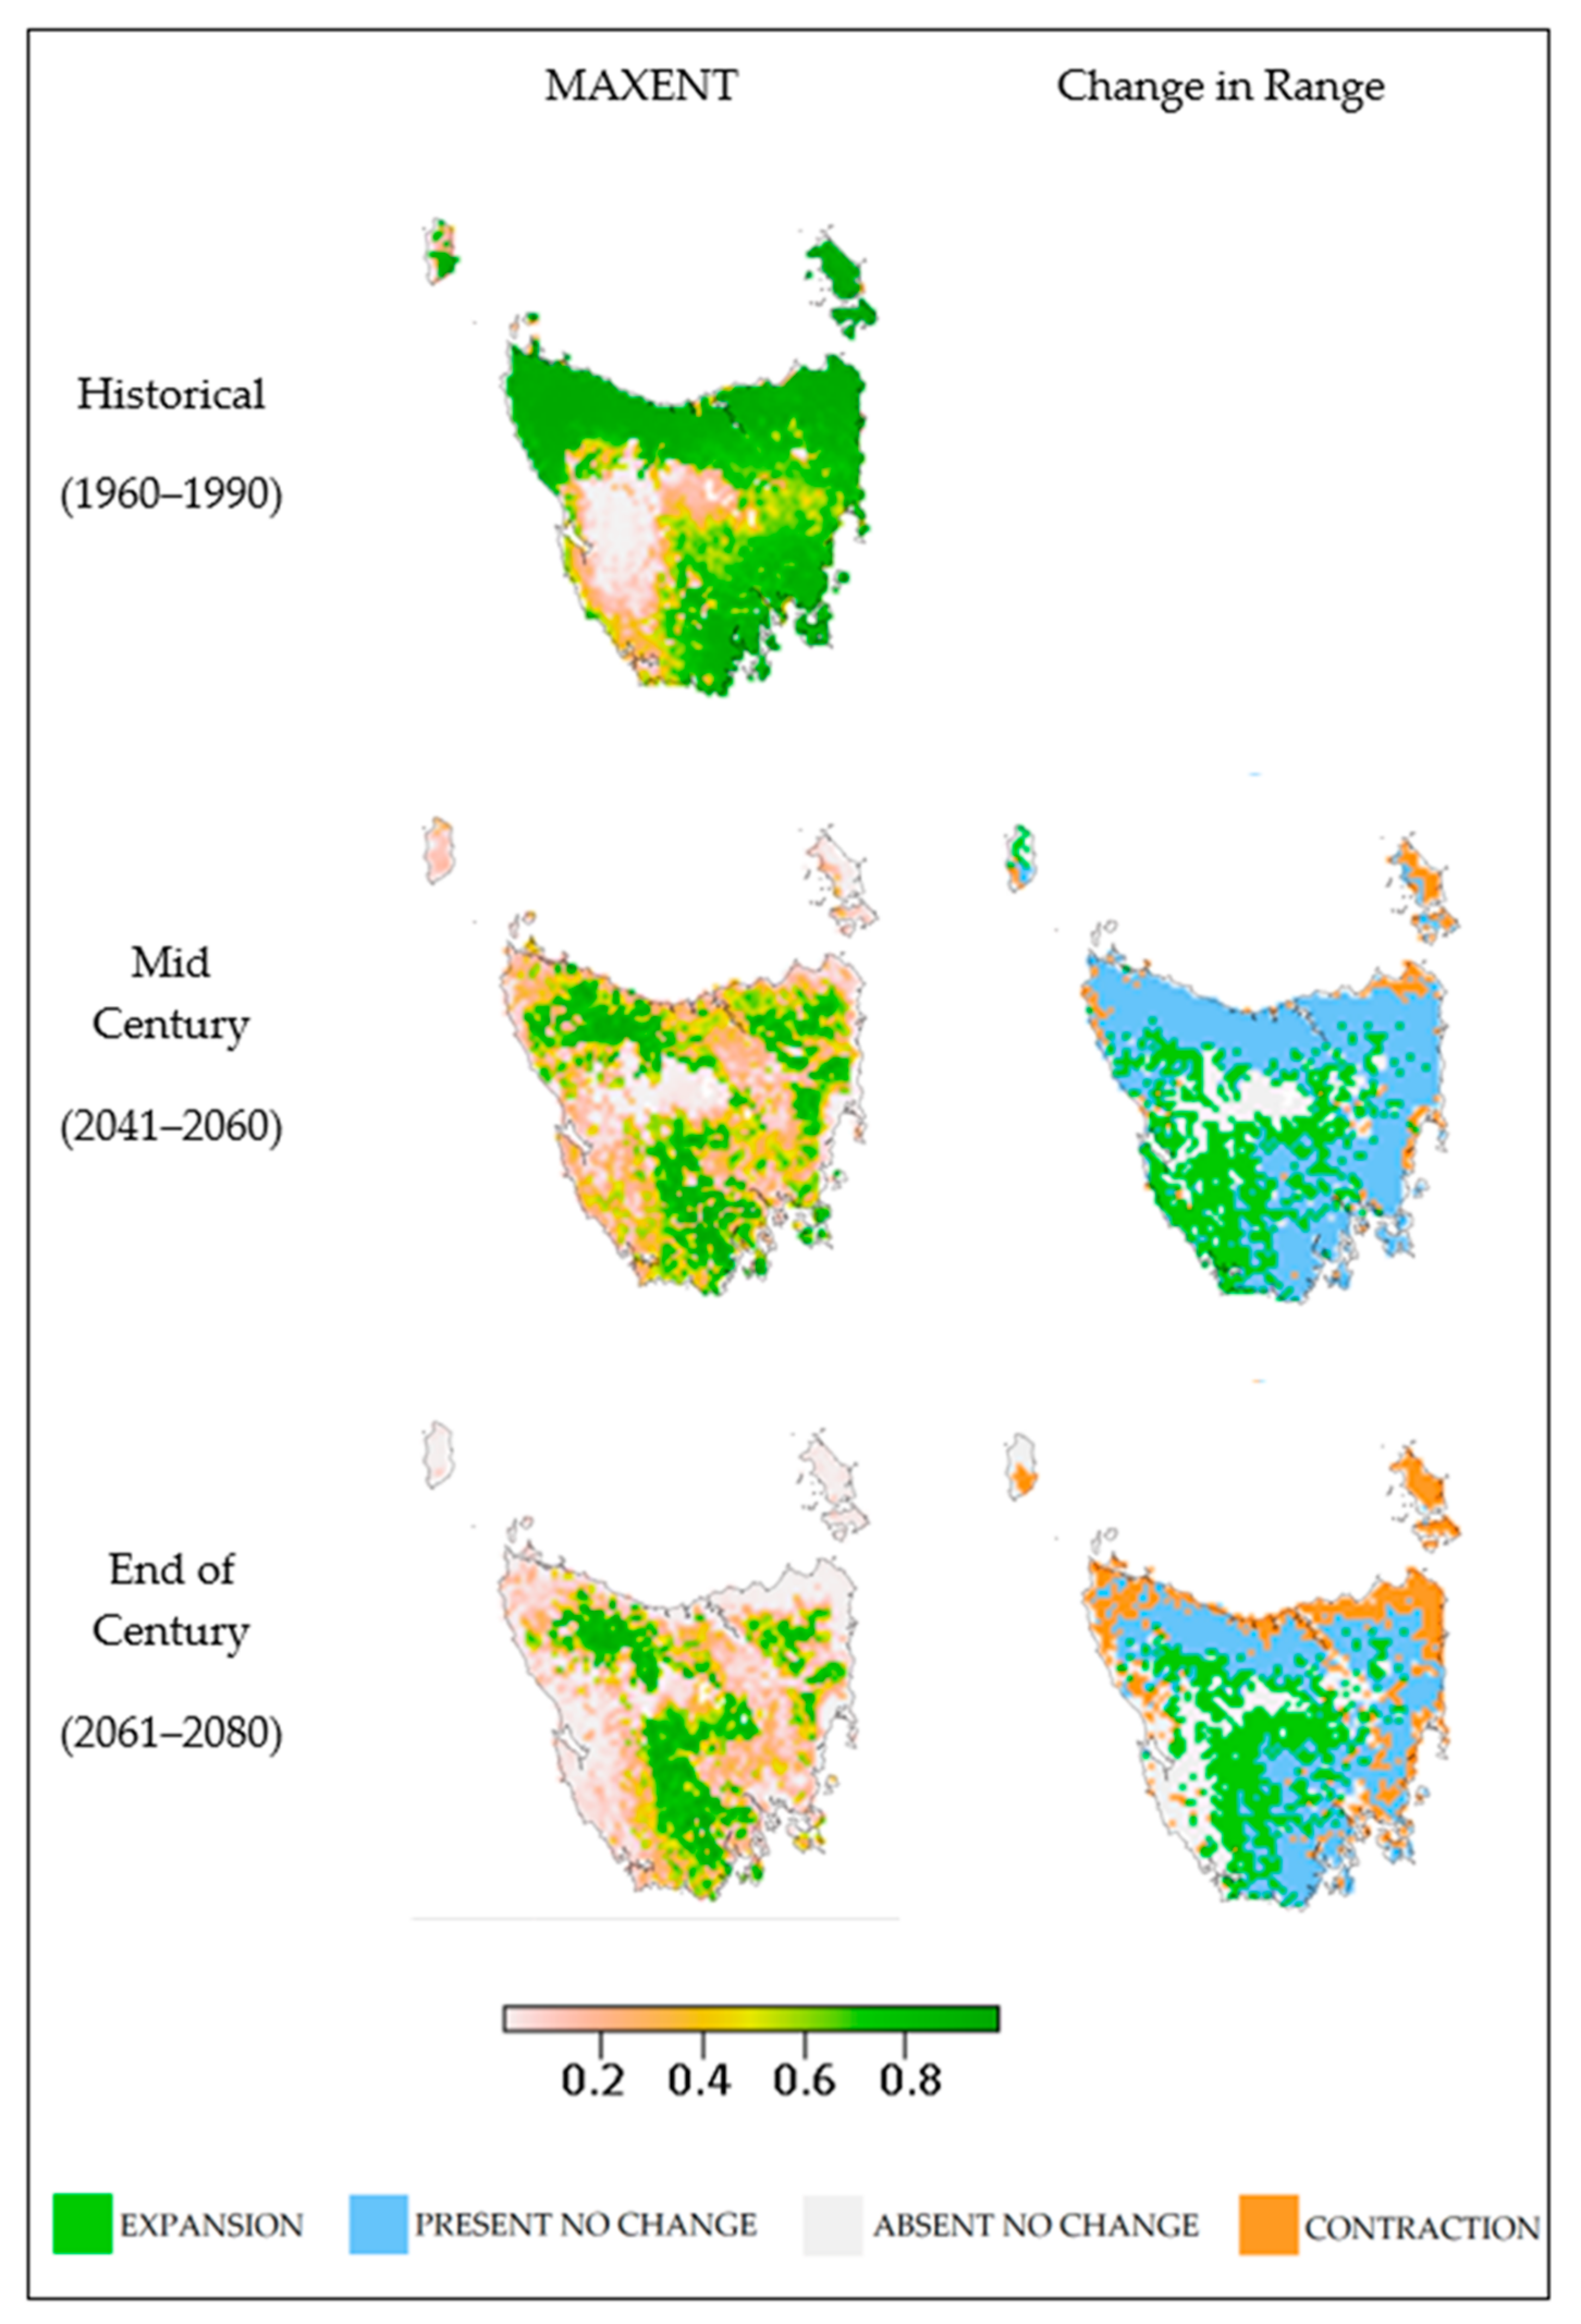
The extent of contraction for E. delegatensis as predicted by SDM Maxent and the hottest driest GCM ACCESS1.0 was projected to be 82% of the original potential distribution by the end of century, with expansions projected for only 6% (Figure 4, Supplementary Table S2). A smaller, yet still substantial, contraction in E. obliqua of 76% was projected as well as, in contrast to E. delegatensis, a substantial expansion of 12% by the end of century (Figure 5, Supplementary Table S3). This expansion in environmental suitability for E. obliqua was greater at mid-century with a projected expansion of 19%, but suitability was then shown to decline under conditions projected for the end of the century.
An SDM response curve illustrates the relationship between an environmental variable and the probability of occurrence of a species calculated by each algorithm, allowing an assessment of the relative importance of each variable in the modelled distribution [47]. The environmental variables shown to be the strongest determinants of species occurrence for E. delegatensis according to the three models were Maximum Temperature of the Warmest month (<25 °C), Precipitation of the Driest Quarter (100–400 mm), pH (>4), Annual Mean Temperature (~8–12 °C) and Mean Temperature of the Coldest Quarter (>8 °C). Soil clay content was shown to have little relationship and the models displayed mixed results for Isothermality, Plant Available Water Capacity and Bulk Density (Supplementary Material Figure S1). For E. obliqua there was more variation between the three models, with MARS indicating no relationship for some variables which ANN and Maxent identified as important (soil bulk density and plant available water capacity). The strongest determinants of species range for E. obliqua were Soil Clay Content (>3%), Precipitation of the Driest Quarter (>300/500 mm), Annual Mean Temperature (<15/12 °C), Mean Temperature of the Coldest Quarter (7–10/15 °C) and Maximum Temperature of Warmest Month (~25–30 °C). Two of the three models (ANN and Maxent) showed a suitability for Soil Bulk Densities above 0.7 Mg/M3 and a Plant Available Water Capacity of >40% for E. obliqua. A minor relationship was observed for pH (Supplementary Material Figure S2).

4. Discussion

This study has demonstrated that climate suitability for Eucalyptus species such as E. delegatensis and E. obliqua may change substantially over time due to anthropogenic climate change. Such changes have important implications for the potential distribution of these species, and because they are widespread, dominant tree species in a range of forest types, these changes are likely to have significant impacts for future fuel load and fire danger across Tasmania.

4.1. Outcomes

All Global Climate Models (GCMs) presented notable changes in future climate suitability for both species. The patterns of contraction and expansion for the two Eucalypt species are most clearly illustrated in projections using the ‘worst-case’ scenario, based on the most restricted SDM (Maxent) and the hot and dry GCM (ACCESS1.0) (Figure 4 and Figure 5), which projected drastic contractions of up to 82% for E delegatensis and 76% for E. obliqua. Suitability for the more widely distributed E. obliqua increased in some areas and decreased in others, contracting in coastal areas and expanding in the west of the state. In contrast, suitability for E. delegatensis contracted to areas of higher elevation with very little expansion. This difference demonstrates that bioclimatic changes may pose a greater risk to narrowly distributed species than their more widely distributed counterparts, which is in line with previous findings that geographic range has a significant positive impact on species survivorship [48].
The three GCMs displayed similar changes in species range over time; however, variation was observed between the models in the extent of suitability, with ACCESS1.0, the hottest and driest of the models (with warming in excess of 2.5 °C by 2100), projecting noticeably larger contractions, and MIROC5, which projects the lowest warming, suggesting smaller contractions. This is in line with previous findings of Eucalyptus’ response to very hot dry climatic conditions [22].

4.2. Potential Ecological Impacts

Changes to climate suitability, such as those projected here for E. delegatensis and E. obliqua, have the potential to lead to shifts in distribution, with ecosystem-wide repercussions, as is already being observed in natural systems globally [49,50]. As dominant species in many forest types [21], changes in the distribution of E. obliqua and E. delegatensis are likely to have substantial and cascading effects in forests across Tasmania. In areas where climate suitability declines and the species may contract, competition will be reduced, resulting in changing dominants, either to species that may already be present or new species that are able to disperse to fill the vacated niche. Contractions may also lead to declines in species where facilitatory relationships with the eucalypts occurred. In areas where changing suitability may result in expansions (as projected for E. obliqua in the southwest of Tasmania), competition with resident species could lead to population declines in species which are unable to compete with the eucalypts. There is also the possibility that the eucalypts will facilitate certain species to become more prominent or expand into the area.
Research has shown that species can have non-additive effects on fire risk [19], which makes these complex changes in vegetation composition even more important to consider when evaluating the implications that shifting eucalypt distributions could have on fire management requirements. Such changes have the potential to substantially alter the structure, litter accumulation and flammability of forests. As shifts in distribution start to occur, historical knowledge of the fire attributes of different forest types will need to be reassessed and management changed accordingly.

4.3. Modelled and Realised Distributions

Species distribution modelling can indicate the potential for future changes in the distribution of species, but how changes are realised will be affected by many factors in addition to climate [26,51]. Reasons that actual distribution may not be the same as environmental suitability include expansions not being realised due to dispersal limitations, lags in response to changing environments and the influence of other species and their associated ecological interactions. Dispersal range can limit plants’ capacity to expand [51,52], especially where suitable habitat is fragmented [53,54]. There can also be physical barriers to dispersal such as mountain ranges, which can substantially shape and limit the distribution of a species [55]. The ability of E. delegatensis and E. obliqua to expand into areas that become suitable in the future will also be limited by competition and interactions with other species [54,56]. From this, it is evident that it is important to consider what species are already at a site when assessing expansions in potential distribution, such as was projected for E. obliqua in the west of Tasmania. Another factor that may cause variations between modelled suitability and actual species distribution is a delayed response to changing bioclimatic conditions. There is expected to be a lag between changes in environmental suitability and changes in observed distribution [57], especially in tree species such as Eucalyptus which have relatively long lifespans [58]. This means that contractions and expansions in actual distribution may occur much later than projected changes in environmental suitability. This is especially relevant for cases such as E. obliqua, where projected expansions were observed to be greater at mid-century than end of century. Due to lag effects and Eucalyptus’ slow rate of expansion, it is unlikely that the larger expansions projected at mid-century would ever be realised in the actual species distribution of E. obliqua.
On the other hand, the magnitude of extreme events can exceed the conditions that are projected to occur by the end of the century under the high emissions scenario (e.g., heat events with daily temperatures more than 10 °C higher than the long-term mean) [59,60], causing abrupt shifts in the composition and structure of forests decades before changes in mean climate conditions start to influence distributions. Changes to the fire regime can also lead to abrupt change, as has been seen in the E. delegatensis forests of the Australian Alps following repeated intense fires with insufficient time between fires for recovery [61,62]. Extreme events can reset competitive interactions, opening niches that can be filled by range-shifting species, facilitating the rapid movement of species. Such effects are increasingly being observed in natural systems in Australia and around the world [63,64,65].
The influence of the many ecological factors affecting species distribution which are not accounted for in species distribution models highlights the need for more complex and wholistic models. There are several different approaches to address this, such as combining landscape and climate predictor variables [41], using a multi-model framework to assess the combined impacts of climate change on the distribution of a species [66], and multi-species analysis [67]. Nevertheless, the outcomes from this study provide a good insight into changes that may occur in the future, and clearly represent shifts in single species range, from which implications and conclusions can be drawn.

4.4. Species Variation

The two Eucalyptus species exhibited different responses to changing climate in terms of their distributions, suggesting that generalisations regarding the response of different species to changes in climate, even when they are functionally and genetically similar, are not always appropriate. These differing responses are likely to be the due to the differing climate conditions which limit the distribution of each species. For instance, E. delegatensis is restricted to subalpine areas and areas in Tasmania with average winter temperatures of less than 8 °C, whereas E. obliqua requires slightly warmer conditions (average winter temperatures greater than 10 °C) (Supplementary Figures S1 and S2).

4.5. Model Evaluation

The response curves for both E. obliqua and E. delegatensis indicate some degree of overfitting, where the model fits species distribution too strictly to the environments of known occurrence points, overstating noise and resulting in a failure to accurately predict occurrence [68]. This overfitting is especially evident in the Maxent algorithm, and more prevalent in E. obliqua than E. delegatensis, possibly due to increased noise resulting from the larger dataset of E. obliqua occurrences.
Multiple peaks in probability of occurrence were observed for some environmental variables for E. obliqua (annual temperature, warmest month and coldest quarter) (Supplementary Figure S2). This could possibly be explained by the existence of ecotypes, which are a sub-unit of a species resulting from a genotypical response to habitat [69] as described in [70]. This would be in agreement with previous research which has shown evidence for the existence of E. obliqua ecotypes [71], and could provide further explanation as to why the models projected differing responses between E. obliqua and E. delegatensis.

4.6. Implications for Fire Management

The projected shifts in environmentally suitable area for E. delegatensis and E. obliqua indicate a change in fire risk and management requirements, due to shifting fuel type and amount [12], and demonstrate the usefulness of SDMs as a complimentary tool in assessing fuel loads and informing longitudinal fire management plans. This has implications for the mapping and management of existing fuel and high fire danger areas as well as future fuel loads, which cannot be assumed to be static. Locations that may be high or low fire danger under present conditions may shift significantly over the next decades.

5. Conclusions

Species distribution modelling shows a shift in the climatic suitability for both E. obliqua and E. delegatensis over the next century, suggesting that these species may change their geographic distribution in the future. This has implications for fuel loads and flammability across the landscape, which could have a notable impact on fire management practices as the areas of greatest concern to fire management shift over time. These observations highlight the usefulness of SDMs as a complimentary tool for assessing fuel loads and informing long-term fire management plans. The two Eucalyptus species show contrasting responses to changing climate conditions, suggesting that generalisations regarding species’ response to climate change are not always appropriate, and that climate change may pose a greater risk to narrowly distributed species than to those with wide distributions. The findings of this study highlight a need for fire management plans to be regularly updated as the climate continues to change, and for longitudinal plans to consider changing fire risk associated with vegetation change over time.
There is much that can still be learned about the impacts that changing vegetation distributions will have on fire management and how to best address these changes in management plans. There are many opportunities for further study in determining the complex ecological effects of contractions and expansions of a species, including the specific effects these will have on fire regimes. Opportunities for further study also lie in assessing what characteristics, such as breadth of original distribution, cause different species to respond to climate change differently. The responses of other fire-sensitive species to climate change is also a valid area for further research, due to this demonstration that there is unlikely to be a uniform response across even genetically similar species. This study provides an insightful initial step into the use of SDM as a tool for informing long term fire management practices and highlights a range of potential areas for further investigation.

Supplementary Materials

The following are available online at https://www.mdpi.com/2571-6255/4/1/1/s1, Figure S1: Response curves showing the relationship between probability of occurrence for E. delegatensis and each of the environmental variables used for the three species distribution models Artificial Neural Networks, Maxent and Multivariate Adaptive Regression Splines, Figure S2: Response curves showing the relationship between probability of occurrence for E. obliqua and each of the environmental variables used for the three species distribution models Artificial Neural Networks, Maxent and Multivariate Adaptive Regression Splines, Table S1: Default species distribution model configurations for the Biodiversity and Climate Change Virtual Laboratory, Table S2: Change in species range for E. delegatensis according to 3 SDMs (Maxent, MARS and ANN) and 3 GCMs (ACCESS1.0, CNRM-CM5 and MIROC5) as a percentage of initial distribution and areal extent (km2), with ensemble means for each, Table S3: Change in species range for E. obliqua according to 3 SDMs (Maxent, MARS and ANN) and 3 GCMs (ACCESS1.0, CNRM-CM5 and MIROC5) as a percentage of initial distribution and areal extent (km2), with ensemble means for each.

Author Contributions

Conceptualization, R.M.B.H.; Formal analysis, J.L.; Investigation, J.L.; Methodology, J.L. and R.M.B.H.; Supervision, R.M.B.H.; Visualization, J.L.; Writing—original draft, J.L.; Writing—review & editing, J.L. and R.M.B.H. All authors have read and agreed to the published version of the manuscript.

Funding

This research received no external funding.

Data Availability Statement

The data presented in this study are openly available in Mendely Data at doi:10.17632/bmx6zsjxy8.2.

Conflicts of Interest

The authors declare no conflict of interest.

References

  1. Mutlu, M.; Popescu, S.C.; Stripling, C.; Spencer, T. Mapping surface fuel models using lidar and multispectral data fusion for fire behavior. Remote Sens. Environ. 2008, 112, 274–285. [Google Scholar] [CrossRef]
  2. Clarke, H.; Lucas, C.; Smith, P. Changes in Australian fire weather between 1973 and 2010. Int. J. Clim. 2012, 33, 931–944. [Google Scholar] [CrossRef]
  3. Bradstock, R.A.; Penman, T.D.; Boer, M.M.; Price, O.; Clarke, H. Divergent responses of fire to recent warming and drying across south-eastern Australia. Glob. Chang. Biol. 2014, 20, 1412–1428. [Google Scholar] [CrossRef] [PubMed]
  4. Press, T. Tasmanian Wilderness World Heritage Area Bushfire and Climate Change Research Project; Tasmanian Government: Hobart, Australia, 2016.
  5. Australasian Fire and Emergency Service Authorities Council. AFAC Independent Operational Review: A Review of the Management of the Tasmanian Fires of December 2018–March 2019. Available online: http://www.fire.tas.gov.au/userfiles/AFAC/AFAC_Review.pdf (accessed on 1 March 2020).
  6. Sharples, J.J.; Cary, G.J.; Fox-Hughes, P.; Mooney, S.; Evans, J.P.; Fletcher, M.-S.; Fromm, M.; Grierson, P.F.; McRae, R.; Baker, P. Natural hazards in Australia: Extreme bushfire. Clim. Chang. 2016, 139, 85–99. [Google Scholar] [CrossRef]
  7. Fox-Hughes, P.; Harris, R.; Lee, G.; Grose, M.; Bindoff, N. Future fire danger climatology for Tasmania, Australia, using a dynamically downscaled regional climate model. Int. J. Wildland Fire 2014, 23, 309–321. [Google Scholar] [CrossRef]
  8. Clarke, H.; Pitman, A.; Kala, J.; Carouge, C.; Haverd, V.; Evans, J.P. An investigation of future fuel load and fire weather in Australia. Clim. Chang. 2016, 139, 591–605. [Google Scholar] [CrossRef] [Green Version]
  9. Pearson, R.G.; Dawson, T.P. Predicting the impacts of climate change on the distribution of species: Are bioclimate envelope models useful? Glob. Ecol. Biogeogr. 2003, 12, 361–371. [Google Scholar] [CrossRef] [Green Version]
  10. Root, T.L.; Price, J.T.; Hall, K.R.; Schneider, S.H.; Rosenzweigk, C.; Pounds, J.A. Fingerprints of global warming on wild animals and plants. Nat. Cell Biol. 2003, 421, 57–60. [Google Scholar] [CrossRef]
  11. Hughes, L. Biological consequences of global warming: Is the signal already apparent? Trends Ecol. Evol. 2000, 15, 56–61. [Google Scholar] [CrossRef]
  12. Harris, R.M.B.; Remenyi, T.A.; Williamson, G.J.; Bindoff, N.L.; Bowman, D.M.J.S. Climate-vegetation-fire interactions and feedbacks: Trivial detail or major barrier to projecting the future of the Earth system? Wiley Interdiscip. Rev. Clim. Chang. 2016, 7, 910–931. [Google Scholar] [CrossRef]
  13. Cornelissen, J.H.; Grootemaat, S.; Verheijen, L.M.; Cornwell, W.K.; Van Bodegom, P.M.; Van Der Wal, R.; Aerts, R. Are litter decomposition and fire linked through plant species traits? New Phytol. 2017, 216, 653–669. [Google Scholar] [CrossRef] [PubMed] [Green Version]
  14. Porfirio, L.L.; Harris, R.M.B.; Lefroy, E.C.; Hugh, S.; Gould, S.F.; Lee, G.; Bindoff, N.L.; Mackey, B. Improving the Use of Species Distribution Models in Conservation Planning and Management under Climate Change. PLoS ONE 2014, 9, e113749. [Google Scholar] [CrossRef] [PubMed] [Green Version]
  15. Harris, R.M.B.; Porfirio, L.L.; Hugh, S.; Lee, G.; Bindoff, N.L.; Mackey, B.; Beeton, N. To Be Or Not to Be? Variable selection can change the projected fate of a threatened species under future climate. Ecol. Manag. Restor. 2013, 14, 230–234. [Google Scholar] [CrossRef]
  16. Matthews, S.; Sullivan, A.L.; Watson, P.; Williams, R.J. Climate change, fuel and fire behaviour in a eucalypt forest. Glob. Chang. Biol. 2012, 18, 3212–3223. [Google Scholar] [CrossRef] [PubMed] [Green Version]
  17. Brown, J.K. Surface Fuel Loadings and Predicted Fire Behavior for Vegetation Types in the Northern Rocky Mountains; US Department of Agriculture, Forest Service, Intermountain Research Station: Corvallis, OR, USA, 1986. Available online: https://books.google.com/books?hl=en&lr=&id=sysbvZ_vTyMC&oi=fnd&pg=PP3&dq=Surface+Fuel+Loadings+and+Predicted+Fire+Behaviour+for+Vegetation+Types+in+the+Northern+Rocky+Mountains&ots=rJhHCLRFKD&sig=pyipuLhPRXI68H4eRAwtEzBG2ss (accessed on 10 December 2020).
  18. Arroyo, L.A.; Pascual, C.; Manzanera, J.A. Fire models and methods to map fuel types: The role of remote sensing. For. Ecol. Manag. 2008, 256, 1239–1252. [Google Scholar] [CrossRef] [Green Version]
  19. Cassandra, V.A.; Van Altena, C.; Van Logtestijn, R.; Cornwell, W.; Cornelissen, J.H. Species composition and fire: Non-additive mixture effects on ground fuel flammability. Front. Plant Sci. 2012, 3, 63. [Google Scholar] [CrossRef] [Green Version]
  20. Gill, A.M.; Zylstra, P. Flammability of Australian forests. Aust. For. 2005, 68, 87–93. [Google Scholar] [CrossRef] [Green Version]
  21. Potts, B.M.; Williams, K.J. The natural distribution of Eucalyptus species in Tasmania. Tasforests 1996, 8, 39–165. [Google Scholar]
  22. Williamson, G.J.; Prior, L.D.; Grose, M.R.; Harris, R.M.B.; Bowman, D.M.J.S. Projecting canopy cover change in Tasmanian eucalypt forests using dynamically downscaled regional climate models. Reg. Environ. Chang. 2014, 14, 1373–1386. [Google Scholar] [CrossRef]
  23. Butt, N.; Pollock, L.J.; McAlpine, C.A. Eucalypts face increasing climate stress. Ecol. Evol. 2013, 3, 5011–5022. [Google Scholar] [CrossRef]
  24. Hughes, L.; Cawsey, E.M.; Westoby, M. Climatic Range Sizes of Eucalyptus Species in Relation to Future Climate Change. Glob. Ecol. Biogeogr. Lett. 1996, 5. [Google Scholar] [CrossRef]
  25. Garzón, M.B.; De Dios, R.S.; Sainz, H. Effects of climate change on the distribution of Iberian tree species. Appl. Veg. Sci. 2008, 11, 169–178. [Google Scholar] [CrossRef]
  26. Booth, T.; Broadhurst, L.; Pinkard, E.; Prober, S.; Dillon, S.; Bush, D.; Pinyopusarerk, K.; Doran, J.; Ivkovich, M.; Young, A. Native forests and climate change: Lessons from eucalypts. For. Ecol. Manag. 2015, 347, 18–29. [Google Scholar] [CrossRef]
  27. Hallgren, W.; Beaumont, L.; Bowness, A.; Chambers, L.; Graham, E.; Holewa, H.; Laffan, S.; Mackey, B.; Nix, H.; Price, J.; et al. The Biodiversity and Climate Change Virtual Laboratory: Where ecology meets big data. Environ. Model. Softw. 2016, 76, 182–186. [Google Scholar] [CrossRef] [Green Version]
  28. Lucas, J.; Harris, R. Delegatensis Occurrence. 2020. Available online: https://biocache.ala.org.au/occurrences/3febe465-fde2-4e81-8aea-9628380b5e9b (accessed on 28 November 2020).
  29. Lucas, J.; Harrris, R. Obliqua Occurrence. 2020. Available online: https://doi.ala.org.au/doi/7d232471-18ad-4aec-ba39-f78b9e74749c (accessed on 28 November 2020).
  30. Gueta, T.; Carmel, Y. Quantifying the value of user-level data cleaning for big data: A case study using mammal distribution models. Ecol. Inform. 2016, 34, 139–145. [Google Scholar] [CrossRef]
  31. Feeley, K.J.; Silman, M. Modelling the responses of Andean and Amazonian plant species to climate change: The effects of georeferencing errors and the importance of data filtering. J. Biogeogr. 2010, 37, 733–740. [Google Scholar] [CrossRef]
  32. Lucas, J.; Harris, R.; Mendeley Data. Eucalyptus Obliqua and Eucalyptus Delegatensis Occurances Tasmania (ALA Cleaned). 2020. Available online: https://data.mendeley.com/datasets/bmx6zsjxy8/1 (accessed on 28 November 2020).
  33. Olden, J.D.; Lawler, J.J.; Poff, N.L. Machine Learning Methods without Tears: A Primer for Ecologists. Q. Rev. Biol. 2008, 83, 171–193. [Google Scholar] [CrossRef] [Green Version]
  34. Elith, J.; Phillips, S.J.; Hastie, T.; Dudík, M.; Chee, Y.E.; Yates, C.J. A statistical explanation of MaxEnt for ecologists. Divers. Distrib. 2010, 17, 43–57. [Google Scholar] [CrossRef]
  35. Friedman, J.H. Multivariate Adaptive Regression Splines. Ann. Stat. 1991, 19, 1–67. [Google Scholar] [CrossRef]
  36. Breiner, F.T.; Guisan, A.; Bergamini, A.; Nobis, M.P. Overcoming limitations of modelling rare species by using ensembles of small models. Methods Ecol. Evol. 2015, 6, 1210–1218. [Google Scholar] [CrossRef]
  37. Booth, T.H.; Nix, H.A.; Busby, J.R.; Hutchinson, M.F. bioclim: The first species distribution modelling package, its early applications and relevance to most currentMaxEntstudies. Divers. Distrib. 2014, 20, 1–9. [Google Scholar] [CrossRef]
  38. Beaumont, L.J.; Hughes, L.; Poulsen, M. Predicting species distributions: Use of climatic parameters in BIOCLIM and its impact on predictions of species’ current and future distributions. Ecol. Model. 2005, 186, 251–270. [Google Scholar] [CrossRef]
  39. Vanderwal, J.J. All Future Climate Layers for Australia—5 km Resolution. 2012. Available online: https://researchdata.edu.au/future-climate-layers-5km-resolution/10856 (accessed on 28 November 2020).
  40. National Soil Grids Australia. 2012. Available online: https://www.asris.csiro.au/themes/NationalGrids.html (accessed on 28 November 2020).
  41. Austin, M.P.; Van Niel, K.P. Impact of landscape predictors on climate change modelling of species distributions: A case study with Eucalyptus fastigata in southern New South Wales, Australia. J. Biogeogr. 2010, 38, 9–19. [Google Scholar] [CrossRef]
  42. Harris, R.M.B.; Grose, M.R.; Lee, G.; Bindoff, N.L.; Porfirio, L.L.; Fox-Hughes, P. Climate projections for ecologists. Wiley Interdiscip. Rev. Clim. Chang. 2014, 5, 621–637. [Google Scholar] [CrossRef]
  43. Meteorology, C.a.B.o. Climate Change in Australia. Information for Australia’s Natural Resource Management Regions: Technical Report; CSIRO and Bureau of Meteorology: Canberra, Australia, 2015. [Google Scholar]
  44. England, M.H.; McGregor, S.; Spence, P.; Meehl, G.A.; Timmermann, A.; Cai, W.; Gupta, A.S.; McPhaden, M.J.; Purich, A.; Santoso, A. Recent intensification of wind-driven circulation in the Pacific and the ongoing warming hiatus. Nat. Clim. Chang. 2014, 4, 222–227. [Google Scholar] [CrossRef]
  45. Riahi, K.; Rao, S.; Krey, V.; Cho, C.; Chirkov, V.; Fischer, G.; Kindermann, G.; Nakicenovic, N.; Rafaj, P. RCP 8.5—A scenario of comparatively high greenhouse gas emissions. Clim. Chang. 2011, 109, 33–57. [Google Scholar] [CrossRef] [Green Version]
  46. Peters, G.P.; Andrew, R.M.; Boden, T.; Canadell, J.G.; Ciais, P.; Le Quéré, C.; Marland, G.; Raupach, M.R.; Wilson, C. The challenge to keep global warming below 2 °C. Nat. Clim. Chang. 2012, 3, 4–6. [Google Scholar] [CrossRef]
  47. BCCVL. SDM—Interpretation of Model Outputs. Available online: https://support.bccvl.org.au/support/solutions/articles/6000127046-sdm-interpretation-of-model-outputs (accessed on 29 June 2020).
  48. Payne, J.L.; Finnegan, S. The effect of geographic range on extinction risk during background and mass extinction. Proc. Natl. Acad. Sci. USA 2007, 104, 10506–10511. [Google Scholar] [CrossRef] [Green Version]
  49. Parmesan, C. Range and Abundance Changes. In Biodiversity and Climate Change: Transforming the Biosphere; Lovejoy, T.E., Lee, H., Eds.; Yale University Press: London, UK, 2019. [Google Scholar]
  50. Parmesan, C.; Yohe, G. A globally coherent fingerprint of climate change impacts across natural systems. Nat. Cell Biol. 2003, 421, 37–42. [Google Scholar] [CrossRef]
  51. Travis, J.M.; Delgado, M.; Bocedi, G.; Baguette, M.; Bartoń, K.; Bonte, D.; Boulangeat, I.; Hodgson, J.A.; Kubisch, A.; Penteriani, V.; et al. Dispersal and species’ responses to climate change. Oikos 2013, 122, 1532–1540. [Google Scholar] [CrossRef] [Green Version]
  52. Angert, A.L.; Crozier, L.G.; Rissler, L.J.; Gilman, S.E.; Tewksbury, J.J.; Chunco, A.J. Do species’ traits predict recent shifts at expanding range edges? Ecol. Lett. 2011, 14, 677–689. [Google Scholar] [CrossRef] [PubMed]
  53. Saura, S.; Bodin, Ö.; Fortin, M.-J. EDITOR’S CHOICE: Stepping stones are crucial for species’ long-distance dispersal and range expansion through habitat networks. J. Appl. Ecol. 2014, 51, 171–182. [Google Scholar] [CrossRef]
  54. Scheller, R.; Mladenoff, D. Simulated effects of climate change, fragmentation, and inter-specific competition on tree species migration in northern Wisconsin, USA. Clim. Res. 2008, 36, 191–202. [Google Scholar] [CrossRef] [Green Version]
  55. Von Oheimb, P.V.; Albrecht, C.; Riedel, F.; Bössneck, U.; Zhang, H.; Wilke, T. Testing the role of the Himalaya Mountains as a dispersal barrier in freshwater gastropods (Gyraulus spp.). Biol. J. Linn. Soc. 2013, 109, 526–534. [Google Scholar] [CrossRef] [Green Version]
  56. Green, D.G.; Sadedin, S. Interactions matter—complexity in landscapes and ecosystems. Ecol. Complex. 2005, 2, 117–130. [Google Scholar] [CrossRef]
  57. Metzger, J.P.; Martensen, A.C.; Dixo, M.; Bernacci, L.C.; Ribeiro, M.C.; Teixeira, A.M.G.; Pardini, R. Time-lag in biological responses to landscape changes in a highly dynamic Atlantic forest region. Biol. Conserv. 2009, 142, 1166–1177. [Google Scholar] [CrossRef]
  58. Stoneman, G.L. Ecology and physiology of establishment of eucalypt seedlings from seed: A review. Aust. For. 1994, 57, 11–29. [Google Scholar] [CrossRef]
  59. Special Climate Statement 73: Extreme Heat and Fire Weather in December 2019 and January 2020. Available online: http://www.bom.gov.au/climate/current/statements/scs73.pdf (accessed on 29 June 2020).
  60. Hoffmann, A.A.; Rymer, P.; Byrne, M.; Ruthrof, K.X.; Whinam, J.; McGeoch, M.; Bergstrom, D.M.; Guerin, G.R.; Sparrow, B.; Joseph, L.; et al. Impacts of recent climate change on terrestrial flora and fauna: Some emerging Australian examples. Austral Ecol. 2019, 44, 3–27. [Google Scholar] [CrossRef] [Green Version]
  61. Bowman, D.M.J.S.; Murphy, B.P.; Neyland, D.L.J.; Williamson, G.J.; Prior, L.D. Abrupt fire regime change may cause landscape-wide loss of mature obligate seeder forests. Glob. Chang. Biol. 2014, 20, 1008–1015. [Google Scholar] [CrossRef]
  62. Harris, R.M.B.; Remenyi, T.; Fox-Hughes, P.; Love, P.; Bindoff, N.L. Exploring the Future of Fuel Loads in Tasmania, Australia: Shifts in Vegetation in Response to Changing Fire Weather, Productivity, and Fire Frequency. Forests 2018, 9, 210. [Google Scholar] [CrossRef] [Green Version]
  63. Harris, R.M.B.; Beaumont, L.J.; Vance, T.R.; Tozer, C.R.; Remenyi, T.A.; Perkins-Kirkpatrick, S.; Mitchell, P.J.; Nicotra, A.B.; McGregor, S.; Andrew, N.R.; et al. Biological responses to the press and pulse of climate trends and extreme events. Nat. Clim. Chang. 2018, 8, 579–587. [Google Scholar] [CrossRef]
  64. Parmesan, C.; Root, T.L.; Willig, M.R. Impacts of extreme weather and climate on terrestrial biota. Bull. Am. Meteorol. Soc. 2000, 81, 443–450. [Google Scholar] [CrossRef] [Green Version]
  65. Seneviratne, S.I.; Nicholls, N.; Easterling, D.; Goodess, C.M.; Kanae, S.; Kossin, J.; Luo, Y.; Marengo, J.; McInnes, K.; Rahimi, M.; et al. Changes in climate extremes and their impacts on the natural physical environment. In Managing the Risks of Extreme Events and Disasters to Advance Climate Change Adaptation; A Special Report of Working Groups I and II of the Intergov-Ernmental Panel on Climate Change (IPCC); Field, C.B., Barros, T.F.V., Stocker, D., Qin, D.J., Dokken, K.L., Ebi, M.D., Mastrandrea, K.J., Mach, G.-K., Plattner, S.K., et al., Eds.; Cambridge University Press: Cambridge, UK; New York, NY, USA, 2012; pp. 109–230. [Google Scholar]
  66. Franklin, J. Moving beyond static species distribution models in support of conservation biogeography. Divers. Distrib. 2010, 16, 321–330. [Google Scholar] [CrossRef]
  67. Harris, D.J. Generating realistic assemblages with a joint species distribution model. Methods Ecol. Evol. 2015, 6, 465–473. [Google Scholar] [CrossRef]
  68. Radosavljevic, A.; Anderson, R.P. Making better Maxent models of species distributions: Complexity, overfitting and evaluation. J. Biogeogr. 2014, 41, 629–643. [Google Scholar] [CrossRef]
  69. Turesson, G. The Species and the Variety as Ecological Units. Hereditas 2010, 3, 100–113. [Google Scholar] [CrossRef]
  70. Turrill, W.B. The Ecotype Concept. A Consideration with Appreciation and Criticism, Especially Oe Recent Trends. New Phytol. 1946, 45, 34–43. [Google Scholar] [CrossRef]
  71. Anderson, C.; Ladiges, P. A Comparison of Three Populations of Eucalyptus obliqua L’hérit. Growing on Acid and Calcareous Soils in Southern Victoria. Aust. J. Bot. 1978, 26, 93–109. [Google Scholar] [CrossRef]
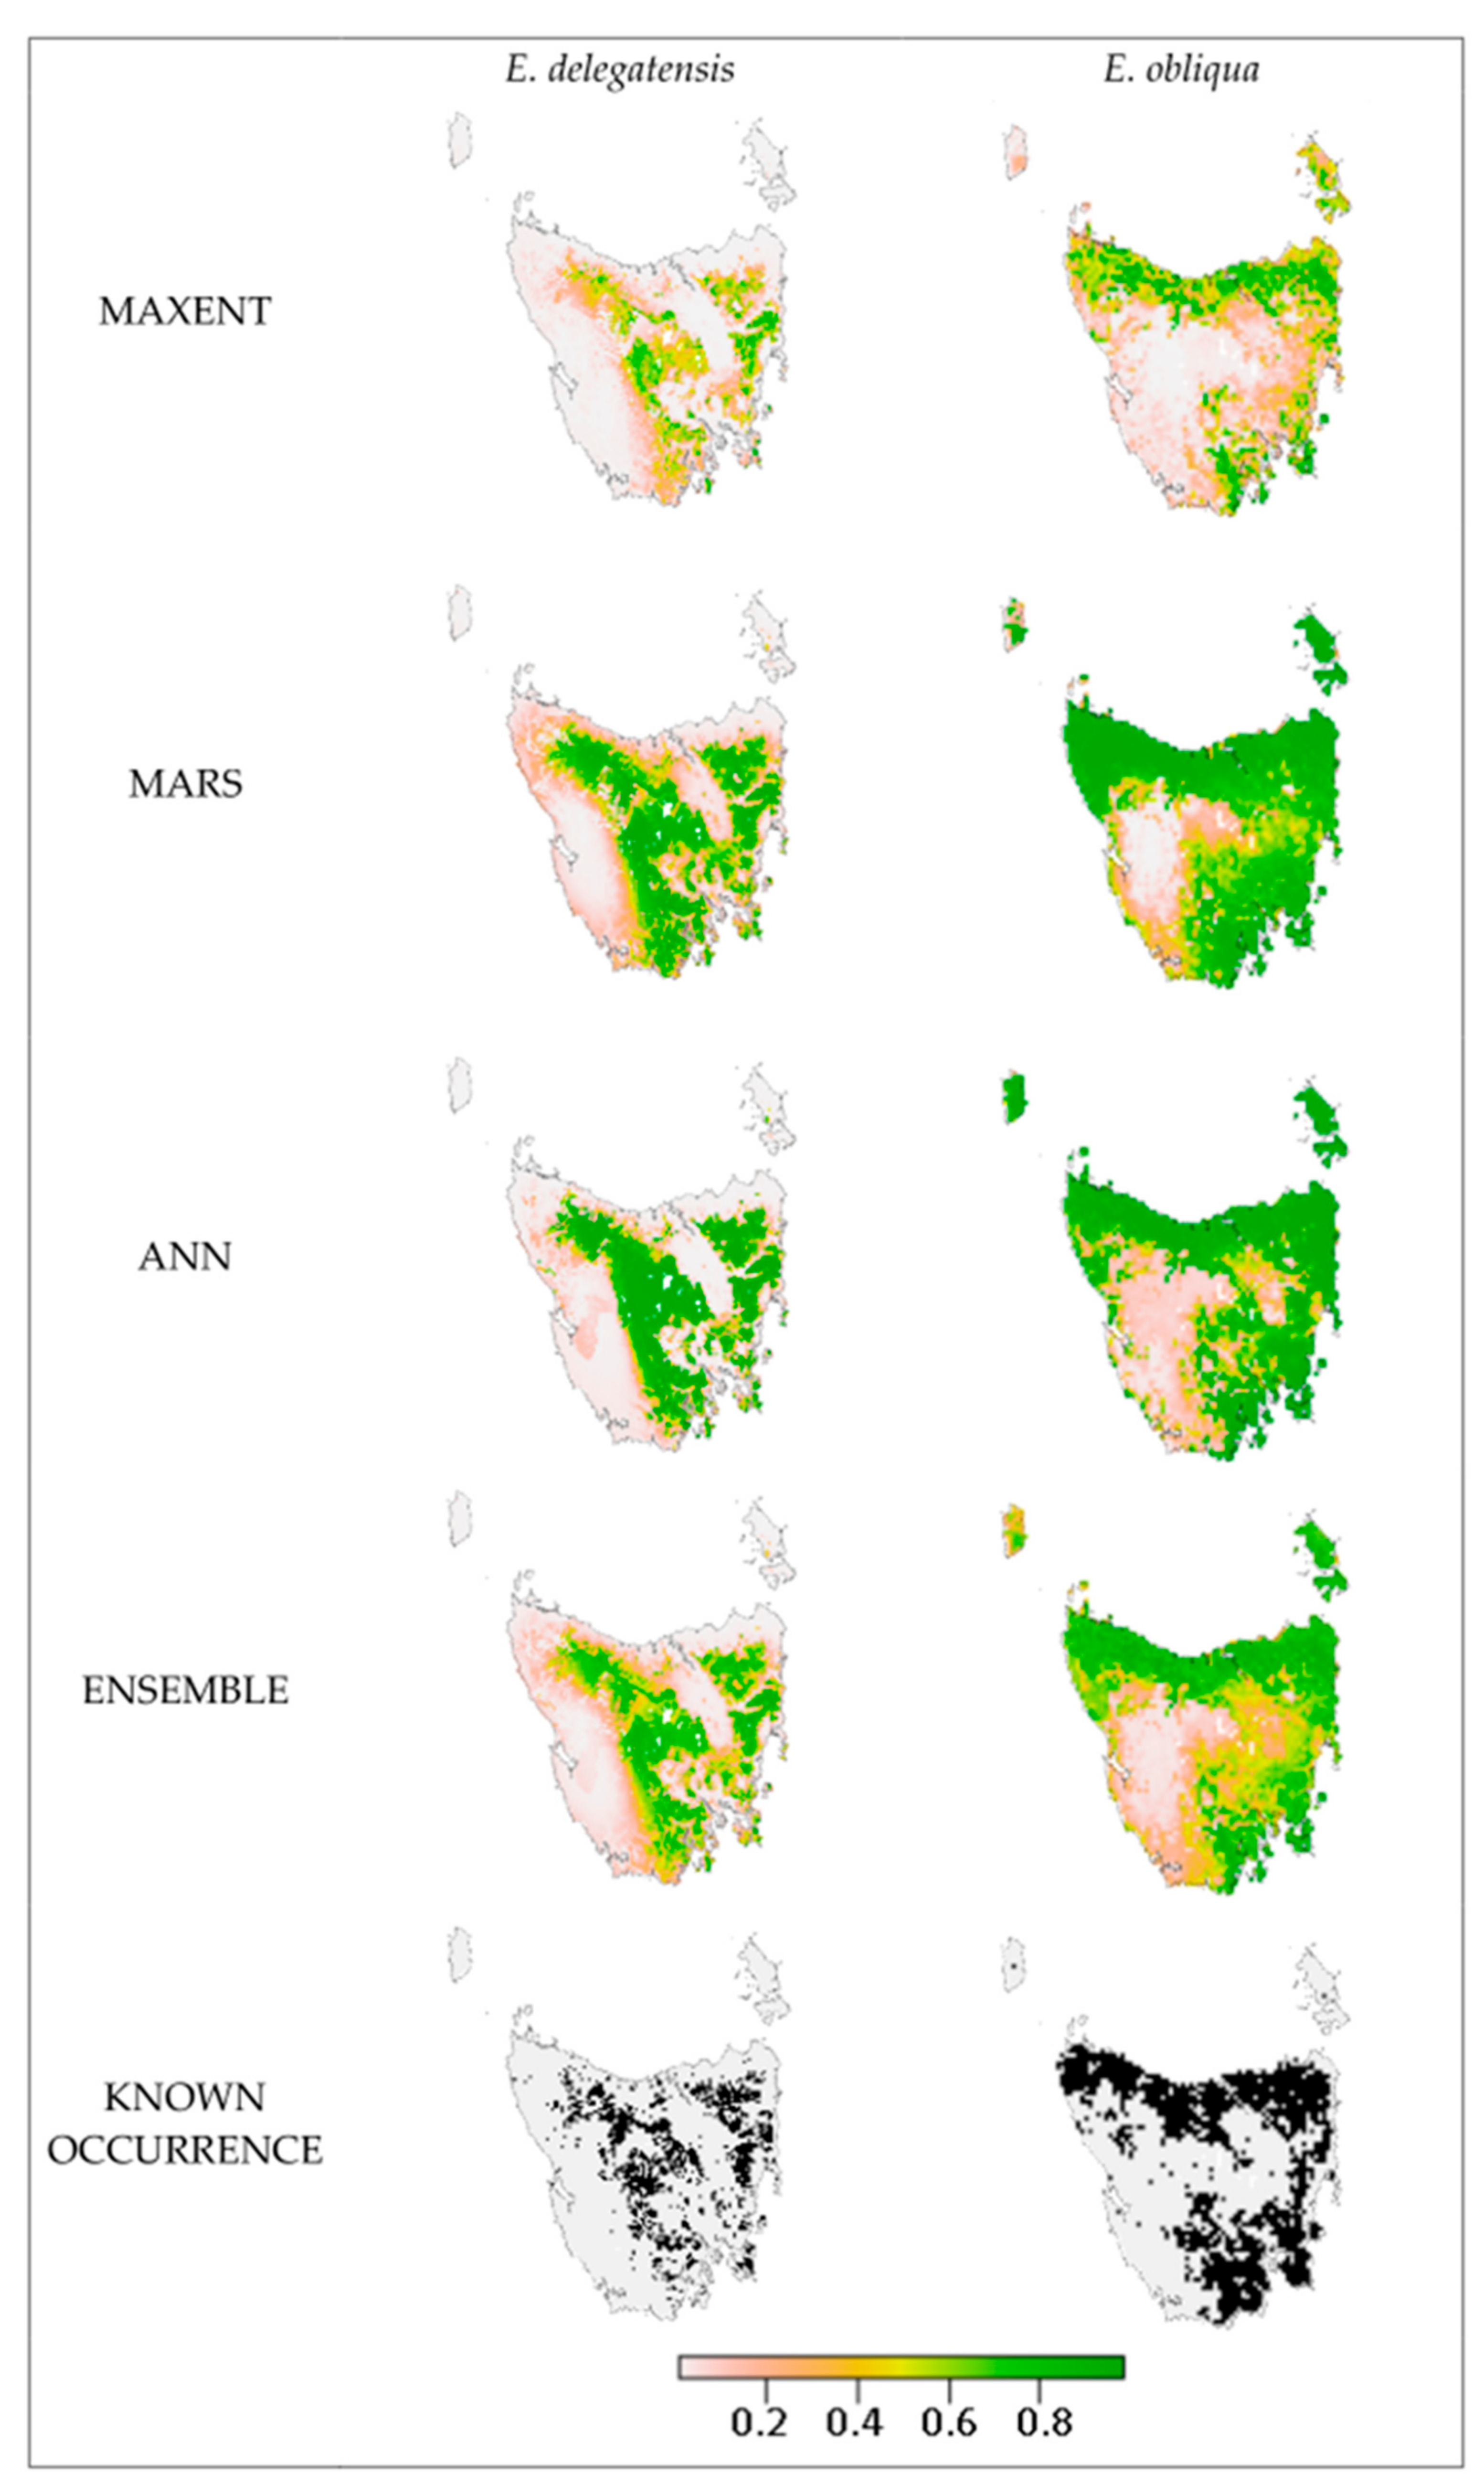
Figure 1. Environmental suitability for E. delegatensis and E. obliqua in Tasmania as modelled by SDM algorithms Maxent, multivariate adaptive regression splines (MARS) and artificial neural networks (ANN). The ensemble displays the mean of the three models. Black dots represent observed occurrence points.
Fire 04 00001 g001
Figure 2. Environmental suitability for E. delegatensis in Tasmania as determined by an ensemble mean of 3 SDMs (Maxent, MARS and ANN) under historical (1960–1990) and projected future climates for mid (2041–2060) and end of century (2060–2081) according to global climate models ACCESS1.0, CNRM-CM5 and MIROC5, with ensemble mean of the 3 GCMs for each time period.
Fire 04 00001 g002
Figure 3. Environmental suitability for E. obliqua in Tasmania as determined by an ensemble of 3 SDMs (Maxent, MARS and ANN) under historical (1960–1990) and projected future climates for mid (2041–2060) and end of century (2060–2081) according to global climate models ACCESS1.0, CNRM-CM5 and MIROC5, with ensemble mean of the three GCMs for each time period.
Fire 04 00001 g003
Figure 4. Environmental suitability for E. delegatensis in Tasmania, shown as a probability of occurrence, and change in species range projected under historical (1960–1990) and future climates for mid (2041–2060) and end of century (2060–2081), as modelled by SDM Maxent and GCM ACCESS1.0.
Fire 04 00001 g004
Figure 5. Environmental suitability for E. obliqua in Tasmania, shown as a probability of occurrence, and change in species range projected under historical (1960–1990) and future climates for mid (2041–2060) and end of century (2060–2081), as modelled by SDM Maxent and GCM ACCESS1.0.
Fire 04 00001 g005
Table 1. Details of the three species distribution modelling algorithms used with associated descriptions, strengths and weaknesses.
AlgorithmDescriptionStrengthsWeaknesses
Artificial Neural Network (ANN)A collection of models consisting of interconnected nodes arranged in three layers. Layer one is an input layer with a node for each environmental variable (EV), layer two is a hidden layer consisting of different weighted combinations of the EVs, and the third layer is an output layer representing a prediction of presence. The model learns by calculating the difference between the output layer and known occurrences and back propagating to achieve more accurate outcomes [33]Powerful predictions;
Handles large amounts of data;
Can model non-linear relationships
Does not deal well with missing or outlying data;
Inefficient handling of mixed data types;
Long processing times
MaxentMaximum entropy modelling finds the most uniform distribution that falls within the limits of the environments observed at known occurrence points. These limits are implemented as constraints of six types, being linear, quadratic, product, threshold, hinge and categorical [34]Does not require absence data;
Compatible with continuous and categorical variables;
Considers interactions between variables;
Inbuilt mechanisms to avoid overfitting
Provides suitability rather than probability of presence
Multivariate Adaptive Regression Splines (MARS)A model that finds and partitions at appropriate points in environmental data and builds a linear regression model for each partitioned section which is then knotted together. The model has built-in pruning mechanisms to avoid overfitting, and makes no assumptions about response-predictor variable relationships (as linear regression models do) [35].Handles many variables;
Detects inter-variable interactions;
Complex but fast;
Handles outliers well
Overfitting;
Difficult interpretation;
Handles missing data poorly
Table 2. Climate models selected to represent a range of plausible futures.
Climate ModelProjection for 2100 in Relation to the CMIP5 Archive Mean
ACCESS1.0A hot, dry future. Warming exceeds 2.5 °C across most of Australia, and >3.5 °C in central Australia. Drying is projected over most areas, with decreased annual precipitation of 15%. This model shows high skill in modelling historical climate. Maximum consensus for many regions across Australia.
MIROC5Moderate warming and slight changes in annual precipitation, with declines in north-east Queensland and south-west Australia; Relatively low warming, wetter model, with a 1.5–3 °C temperature increase and −5% to 5% change in annual precipitation.
CNRM-CM5Hot/wet end of range in Southern Australia. A temperature increase of 1.5–3 °C and −15% to −5% change in annual precipitation. It also has a good representation of extreme El Niño in CMIP5 evaluations [44].
Table 3. Change in species range for E. delegatensis according to the mean of 3 SDMs (Maxent, MARS and ANN) and 3 global climate models (GCMs) (ACCESS1.0, CNRM-CM5 and MIROC5) as a percentage of initial distribution and areal extent (km2).
20502070
km2%km2%
Contraction18,76356 ± 7.324,59167 ± 22.7
No Change14,50044 ± 7.3878326 ± 7.8
Expansion20976 ± 1.416585 ± 1.8
Table 4. Change in species range for E. obliqua according to the mean of 3 SDMs (Maxent, MARS and ANN) and 3 GCMs (ACCESS1.0, CNRM-CM5 and MIROC5) as a percentage of initial distribution and areal extent (km2).
20502070
km2%km2%
Contraction59,26440 ± 13.981,09855 ± 16.8
No Change85,34260 ± 12.163,47445 ± 16.8
Expansion26,08518 ± 5.124,39817 ± 6.3
Publisher’s Note: MDPI stays neutral with regard to jurisdictional claims in published maps and institutional affiliations.