Abstract
Accurate maps of the wildland–urban interface (WUI) are critical for the development of effective land management policies, conducting risk assessments, and the mitigation of wildfire risk. Most WUI maps identify areas at risk from wildfire by overlaying coarse-scale housing data with land cover or vegetation data. However, it is unclear how well the current WUI mapping methods capture the patterns of building loss. We quantified the building loss in WUI disasters, and then compared how well census-based and point-based WUI maps captured the building loss. We examined the building loss in both WUI and non-WUI land-use types, and in relation to the core components of the United States Federal Register WUI definition: housing density, vegetation cover, and proximity to large patches of wildland vegetation. We used building location data from 70 large fires in the conterminous United States, which cumulatively destroyed 54,000 buildings from 2000 through to 2018. We found that: (1) 86% and 97% of the building loss occurred in areas designated as WUI using the census-based and point-based methods, respectively; (2) 95% and 100% of all of the losses occurred within 100 m and 850 m of wildland vegetation, respectively; and (3) WUI components were the most predictive of building loss when measured at fine scales.
Keywords:
wildfire; risk assessment; structure loss; wildland–urban interface; mitigation; mapping; land use; disaster 1. Introduction
The rapid development and expansion of the wildland–urban interface (WUI) into areas with highly-flammable vegetation has significantly increased the potential for building loss during wildland fires [1,2,3,4,5]. Recent wildfire losses in the United States, Australia, and Spain have highlighted the global nature of this phenomenon [6]. Globally, wildfires have occurred across the full spectrum of rural to urban communities with a range of housing densities and arrangements, and have even spread into urban areas that were considered low risk [7]. In the United States, which has seen extensive losses in the 2020 fire season, there are currently an estimated 1.7 million residences in areas at high or extreme risk of wildfire [8], the majority of which are in the WUI.
Wildfires that cause substantial building loss are known as WUI disasters [9]. Many WUI disasters follow the same sequence of events. First, a wildfire ignites in an extreme environment (i.e., fuel, weather, and topography) that allows it to escape initial attack. Then, as the fire grows, it threatens a large number of homes and buildings relative to firefighting resources, which reduces the efficacy of the fire suppression, which leads to numerous losses [9,10]. The increased fuel loading in fire-adapted ecosystems due to historical fire suppression practices [9], increased residential development and increased anthropogenic ignitions [11] due to an expanding WUI [12], and climate change [13] is believed to exacerbate the WUI problem. Although the exact number of WUI disasters is unknown, these events likely represent only a small subset of the total number of wildfires that ignite annually [14]. Understanding when and where WUI disasters are likely to occur, and how buildings and community characteristics influence the likelihood of building loss is critical for the development of strategies for the reduction of wildfire risk and increasing community resiliency [9,10,15,16,17,18,19,20]. Although wildfires can impact WUI communities in multiple ways (e.g., loss of life, smoke, evacuation, post-fire economic recovery), we focused on building loss because, at its core, community wildfire risk has been described as a home ignition problem, with building loss being responsible for the majority of economic loss during WUI disasters [9,10]. Accordingly, land managers tasked with reducing wildfire-caused building loss risk require accurate maps of at-risk buildings within the WUI, calculated at appropriate scales [17,18,20].
WUI mapping efforts in the United States are based on the Federal Register definition of WUI communities [21], which focuses on buildings within or adjacent to wildland vegetation. The Federal Register definition further differentiates two subtypes within the WUI based on housing density and the proximity of buildings relative to wildland vegetation: (1) intermix, in which housing units are dispersed among wildland vegetation; and (2) interface, in which housing units are adjacent to wildland vegetation. Several different WUI mapping efforts have operationalized these definitions in order to estimate the number of at-risk housing units and the total extent of the WUI [1,5,12,22,23,24]. The SILVIS WUI maps made available by the University of Wisconsin SILVIS Lab have emerged as the most widely-used WUI maps in the United States [5,22,23]. For example, a presidential executive order in 2016 directed federal wildfire mitigation and planning efforts to use SILVIS WUI maps or their equivalent when determining wildfire risk [25]. SILVIS WUI maps rely on the U.S. Census Bureau (Census) block level accounting of housing units and wildland vegetation extents extracted from land cover data in order to classify WUI based on three specific components: housing unit density, vegetation cover, and proximity to large patches of contiguous wildland vegetation [5,22,23]. Although SILVIS WUI maps are often used to estimate the number of at-risk housing units and communities at risk in the WUI, they may be insufficient for wildfire planning and response due to the relatively coarse spatial scale of the census blocks, the decadal update interval, and the lack of consideration of fire’s behavior [17,18,20].
The increasing availability and use of individual building location data in WUI mapping overcomes the uncertainty associated with housing unit locations and other critical factors that influence the fire behavior and response in census block data [1,18]. Although fine-scale data have historically only been available for limited spatial extents [17,18], recent developments in remote sensing technology have greatly increased the ability to collect fine-scale building locations [26,27]. Point-based building location and development data are now available across large extents through commercial vendors and open data archives [28,29]. With these advances in technology, a single dataset of at-risk buildings, the finest spatial unit of the WUI problem, can be used in various applications, and provide consistency across multiple scales.
Wildland–urban interface categories can be assigned to building points using the spatial analysis of WUI components (housing unit density, vegetation cover, and proximity to large patches of contiguous wildland vegetation) calculated at appropriate scales [1,5,17,24]. Regardless of whether WUI maps are developed based on individual building locations or census blocks as inputs, WUI maps should align with our understanding of what and where the WUI is [24]. Although numerous concerns exist in the WUI (e.g., loss of life, evacuation, smoke impacts), of particular interest to managers is the ability of WUI maps to identify buildings that are at risk of igniting [20,30]. However, there is a paucity of information on how well WUI maps capture the observed patterns of building loss during WUI disasters. A systematic assessment of building loss alignment with point-based and census-based WUI maps is needed [30,31].
In order to advance our understanding of where building loss occurs and how we spatially conceptualize the WUI problem [9,21], this study sought to: (1) characterize the occurrence of WUI disasters; (2) assess building loss relative to the three core components of the WUI (building density, vegetation cover, and proximity to large patches of contiguous wildland vegetation) at multiple scales, hereinafter referred to as WUI component-scale combinations; and (3) evaluate how well the SILVIS and point-based WUI maps capture the patterns of building loss in WUI disasters. We anticipated that building loss would be positively-correlated with housing density, vegetation cover, and proximity to vegetation, as all three of these factors increase the potential for heat and fire brand exposure [9]. We also expected that both WUI mapping methods would capture a majority of the building loss in WUI disasters, but that point-based maps would perform better due to their finer spatial resolution.
2. Methods and Data
2.1. Overview of Methods
We utilized a combination of spatial and non-spatial datasets to identify WUI disasters and examine the patterns of building loss within those disasters. We start with a summary of our analyses, followed by detailed description of the data sources and methods. First, we queried the National Wildfire Coordinating Group Wildfire Incident Status Summary Reports, which are referred to as ICS-209 [32], in order to identify individual wildfires and the associated building loss. WUI disasters were identified through the inclusion of only those wildfires that reported more than 50 destroyed buildings, which is similar to the thresholds used by others [9,10]. Next, we examined how well the SILVIS WUI maps and point-based WUI maps captured the patterns of building loss. This involved the use of geospatial datasets of fire perimeters and building location points affected by and adjacent to WUI disasters. Using a series of spatial overlays, we attributed each building location to a specific fire, burn status (burned or unburned), census block housing unit density, and SILVIS WUI type [23]. The building density, percent vegetation cover, and distance to vegetation were then calculated at multiple scales, following the framework proposed by Bar-Massada et al. [18], using the National Land Cover Database (NLCD) [33]. Figure 1 provides an overview of the spatial datasets used in this analysis for the 2012 Waldo Canyon Fire in Colorado.
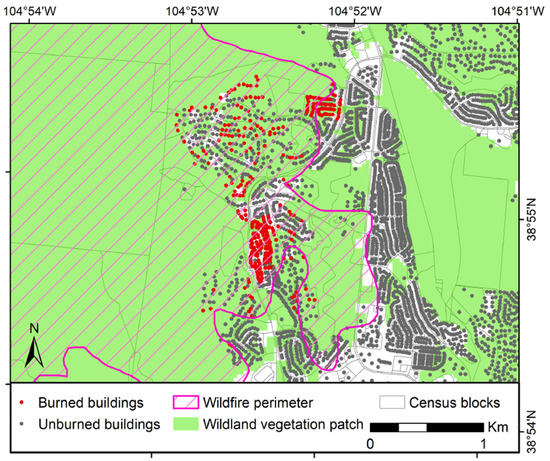
Figure 1.
An example of the spatial datasets used in our analysis, including fire perimeters, wildland vegetation land cover, census blocks, and building locations using the 2012 Waldo Canyon Fire in Colorado. Each building location was assigned a burn status and attributed with information from layers derived from the above data and the SILVIS wildland–urban interface data, including building density, percent vegetation cover, and distance to vegetation.
2.2. Identifying WUI Disasters
In order to identify WUI disasters, we queried the ICS-209 databases from 2000 to 2018. Individual ICS-209 reports capture daily information on the incident type, fire size, percent containment, significant events, resource needs, and cumulative number of threatened and destroyed structures [32]. The ICS-209 reports changed the ways in which they recorded structure types over time. Before 2014, they recorded structures as either primary buildings, outbuildings, or commercial buildings, whereas in 2014 and after, they included several additional categories. We used the total destroyed primary structures before 2014, and the total destroyed single residences for 2014 onwards as proxies for building loss. Primary structures made up 63% of all of the destroyed structures from 2000 to 2013. This change in the data reporting introduces a small bias, but the focus on homes and residential structures aligns well with prior conceptualizations of the WUI problem [9,10], and better matches the spatial building location datasets described below. We then identified 108 wildfire incidents with more than 50 destroyed buildings. We chose the 50-building threshold, which is slightly lower than the thresholds used by others to identify WUI disasters [9,10], in order to account for potential errors in the ICS-209 reported structure loss [34].
2.3. Building Location Data
We were able to acquire the building location data for 70 of the fires we identified as WUI disasters in the ICS-209. We achieved this by querying and merging four distinct point-based building location datasets. Henceforth, we refer to buildings, but also acknowledge the differences in terminology and potential bias between buildings and the housing units referenced in the Census-based data, and between buildings and the destroyed structures referenced in ICS-209 reports. For the subsequent analysis and discussion, we equate the three terms. First, the building location data were acquired for 44 fires from a spatial dataset of burned and unburned buildings created by visually digitizing the buildings and evaluating the building burn status from high-resolution pre- and post-fire Google Earth imagery from 2000 through 2013, which was produced by Alexandre et al. [35]. Second, the building location data were acquired for 15 fires from the California Department of Forestry and Fire Protection (CalFire) as part of their Damage Inspection Report Program (DINS) [36]. This dataset was produced from door-to-door damage inspections collected by CalFire staff with GPS-enabled tablets during and after wildfire incidents. However, the CalFire dataset is only available for a limited set of fires in California, starting in 2013. The CalFire data collection process, data attributes, and limitations are further described in Syphard and Keeley [7]. Third, the building location data were acquired for 11 fires identified in the ICS-209 analysis that were missing the building location data from other sources. For these fires, the affected buildings were digitized, and the burn status (burned or unburned) was determined using pre- and post-fire Google Earth imagery using similar methods to those described in Alexandre et al. [35]. The fourth building location dataset used in this analysis was the Microsoft structure footprint dataset [29]. This dataset allowed us to augment the CalFire data by identifying missing undamaged building locations within the fire perimeters. It also allowed us to identify buildings within 2400 m of each fire perimeter, and to reduce edge effects when calculating the building density. The Microsoft dataset was generated using the RefineNet convolutional neural network for semantic segmentation, followed by a polygonization process to identify the building footprints in high-resolution satellite images [37] collected roughly around 2015. Although it is impossible to determine the exact build date of a specific structure in the Microsoft data, the building locations have a reported accuracy of 99.3%, with commission and omission error rates of 0.7% and 6.5%, respectively [29]. For this study, the footprint polygon centroid locations were used in order to match the other building datasets.
The remaining 38 WUI disasters were excluded because of data limitations. These limitations included: limited pre- and post-fire image availability regarding the evaluation of the fate of the buildings (6 fires), insufficient building location data (15 fires), missing fire perimeters (5 fires), or errors in the ICS-209 reports (12 fires). Fires which were missing high-resolution imagery included the 2002 Hayman Fire in Colorado and the 2004 Bear Fire in California, and recent fires such as the 2018 Roosevelt Fire in Wyoming and the 2018 Spring Creek Fire in Colorado, which both lacked publicly-available post-fire imagery as of 1st January 2020. Other fires, such as the 2003 Padua Fire and the 2007 Ham Lake Fire, were excluded due to insufficient building location data. For example, the ICS-209 reported that the 2003 Padua Fire destroyed 60 buildings, but the corresponding spatial dataset of the building locations only included 22 burned building location points. Fires for which the ICS-209 reported more than 50 burned buildings, but the spatial data had less than 50 burned buildings, were included in the initial ICS-209 analysis, but were excluded from subsequent building location analyses evaluating the census-based and point-based WUI map accuracy. Fires with missing or insufficient building location data occurred in states that were generally well-represented by other fires, allowing us to assume that the missing fires would not bias the results. The final fire perimeter for each WUI disaster identified in the ICS-209 database was identified using data from either the Monitoring Trends in Burn Severity (MTBS) [38] or the Geospatial Multi-Agency Coordination program (GeoMAC) [39]. Because the perimeters for the 2008 Parker Road Fire, the 2013 Carolina Forest Condo Fire, the 2016 Glendale fire, the 2017 NEU Wind Complex, and the 2017 County Road 630 E were not included in these databases, they were removed from all of the subsequent analyses.
2.4. Census-Based WUI Map Building Loss
We assigned a SILVIS WUI type and census block-based housing unit density to each building location prior to the assessment of the proportion of the building loss in the different WUI categories [5,23]. For each WUI disaster, we calculated the total number of exposed buildings (total buildings within the fire perimeter), the total number of burned buildings, the proportion of burned buildings to total exposed buildings, and the total number of unburned buildings adjacent to the fire (within 2400 m) in each SILVIS WUI type. We used a buffer distance of 2400 m because this is the buffer distance commonly used in Census-based WUI maps, and it represents the expected maximum travel distance for fire brands [5,23]. The total number of buildings and proportion of loss between the WUI and non-WUI buildings, as well as among the WUI types (interface, intermix, low density vegetated, high density non-vegetated), were assessed for both the individual fires and the dataset as a whole.
2.5. Point-Based WUI Map and Building Loss
We calculated the values for each WUI component (housing unit density, vegetation cover, and proximity to large patches of contiguous wildland vegetation) at multiple scales, referred to as WUI component-scale combinations, using the framework proposed by Bar-Massada et al. [18], and then assigned values to each individual building point. The building density was calculated using the locations of the building points measured at different neighborhood sizes, ranging from 100-m to 1000-m radii in 100-m increments. In order to calculate the percentage of vegetation cover around each building, we first reclassified the 2011 NLCD data [33] in order to delineate the wildland vegetation using forest, shrub/scrub, grassland, wetland, and open space categories. We then estimated the percentage of the vegetation cover surrounding each building using circular neighborhoods with radii increasing in 100-m increments from 100 to 1000 m. In order to identify the proximity to contiguous patches of wildland vegetation at multiple scales, we varied the patch size. A single binary morphology shrink and expand algorithm was applied to the national NLCD wildland vegetation data in order to remove isolated pixels of vegetation and generalize the edges [40]. The resulting data were converted into polygons, from which the patch size was measured. Five different layers of wildland vegetation were created, with minimum patch sizes of 0.2, 0.4, 1.25, 2.5, and 5.0 km2, and then the distance to the vegetation was measured for each building location using the approach outlined by Chen and McAneney [41].
We used logistic regression on the entire dataset in order to assess the relationship between the building burn status and the WUI components at different scales after first conducting indicator kriging with semivariogram analysis in order to determine the distance at which the burn status was correlated between adjacent building locations [42,43]. This resulted in correlative models, the fit of which was then assessed using the area under the curve (AUC) of the receiver operating characteristic plots [44] and p-values to assess the predictor significance. WUI component-scale models and AUC results were used in order to determine which scale had the highest predictive performance for each WUI component.
For each building location, we measured the value of each of the three WUI components at the scale with the highest predictive performance based on the AUC. Point-based WUI classifications were then determined for each building location using these three component values and the framework presented by Bar-Massada et al. [18]. The classification of the WUI type using both point-based and census-based WUI mapping approaches allowed us to compare the ways in which each approach aligned with the observed building loss in WUI disasters, and to categorize the burned buildings as either WUI or non-WUI. Using a heuristic approach, we assessed how the burned buildings were distributed across the range of building density, vegetation cover, and distance to contiguous patches of wildland vegetation using histograms and cumulative distribution functions. This facilitated the examination of the building loss in relation to both the distribution extremes and the WUI component thresholds operationalized in the WUI definitions; a minimum building density of 6.17 buildings per km2, a maximum distance to wildland vegetation of 2400 m, and a vegetation cover percentage threshold of 50% in order to differentiate the intermix from the interface [5,23,24].
3. Results
3.1. Identifying WUI Disasters
Between 2000 and 2018, the ICS-209 reports documented 2777 wildfires that burned at least one building, and cumulatively burned 58,705 buildings (Table 1). Of these 2777 fires, 108 fires burned more than 50 buildings, and were classified as WUI disasters. These 108 fires were responsible for 83% of all of the building loss reported in the ICS-209 database. Geographically, the WUI disasters were distributed primarily across the western United States (Figure 2). Over half of the WUI disasters occurred in California (51%), followed by Texas (10%), Colorado (7%), Arizona (7%), and New Mexico (6%). On average, there were five WUI disasters and 2433 buildings lost per year. We observed a slight increase in both the number of buildings lost and the number of WUI disasters per year through time, but the building loss was heavily influenced by fires in 2018, and the number of WUI disasters had a high year to year variability (Figure 3).

Table 1.
The number and percentage of wildfires and building loss reported in the Incident Status Summary Reports (ICS-209) between 2000 and 2018.
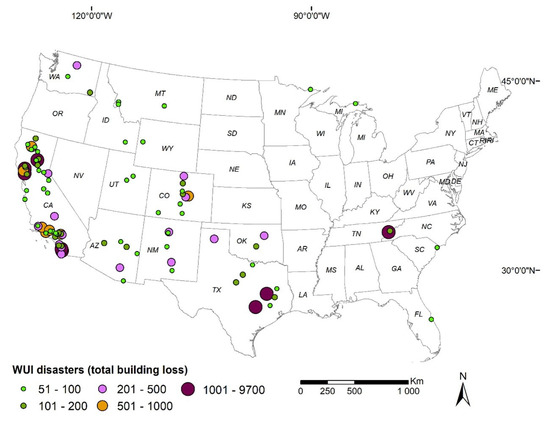
Figure 2.
The spatial distribution and magnitude of wildland–urban interface (WUI) disasters in the conterminous United States from 2000 to 2018.
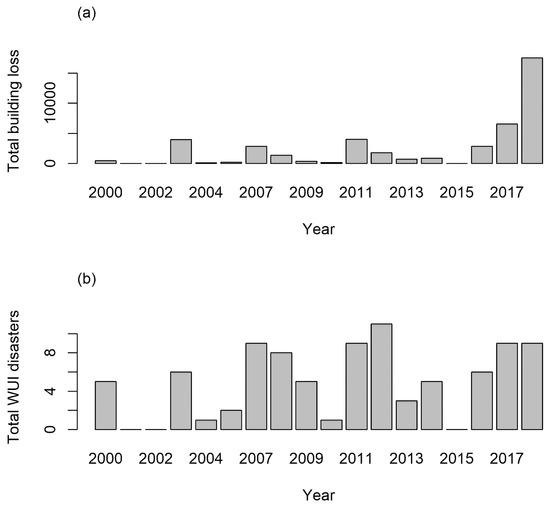
Figure 3.
Trends in (a) wildland–urban interface (WUI) disaster annual building loss from 2000 to 2018, and (b) the number of WUI disasters from 2000 to 2018.
3.2. Census-Based WUI Map Building Loss
The composite building location dataset created by merging the four point-based building location datasets contained 987,430 total buildings within and adjacent to fire perimeters. This included 135,416 buildings that were within fire perimeters, of which 53,786 were burned. The minimum, median, and maximum number of burned buildings per fire were 51, 194, and 18,831, respectively. California’s 2018 Camp Fire was responsible for 35% of the total building loss in our dataset. Eighty-six percent of all of the burned buildings were in areas classified as WUI interface (16,009 buildings) and intermix (30,441 buildings) based on the SILVIS WUI map (Table 2). The remaining 14% of the burned buildings were located in areas classified as non-WUI, either areas with vegetation and low building density, or areas with no vegetation and medium or high building density. Most of these buildings (11% of total) were in areas with building densities of less than 6.17 buildings per km2, which is the threshold used by SILVIS to distinguish WUI from non-WUI. There was considerable variability among the individual WUI disasters in terms of how the building loss was distributed between the SILVIS WUI categories (Figure 4). In total, 42 of 70 WUI disasters experienced 80% or more of their losses in the WUI interface or intermix categories, but 12 WUI disasters had more than 50% of their loss occur in non-WUI areas. While most WUI disasters (90%) engendered some building loss in low-density non-WUI areas, only 9% caused building loss in high-density non-WUI areas.
Table 2.
Total number of buildings and burned buildings by SILVIS wildland–urban interface (WIU) type for WUI disasters from 2000 to 2018.
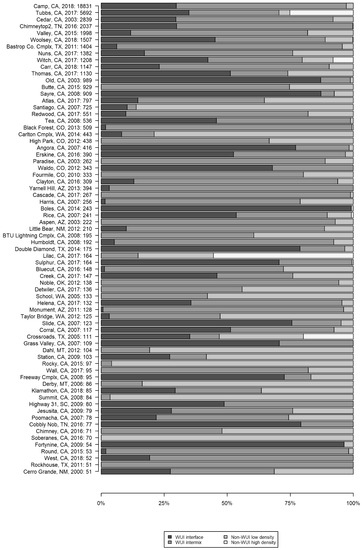
Figure 4.
Percentage of building loss in wildland–urban interface (WUI) and non-WUI land use types for the most destructive WUI disasters, using SILVIS WUI categories. The data were sorted by most to least destructive, with the fire name, state, year, and total building loss.
3.3. Determining the Scale to Measure WUI Components for Point-Based WUI Maps
Indicator kriging and semivariogram analysis documented the sample independence between the point-based building locations, with a range, sill, and nugget of <0.01 m2, 0.002 m, and 0.14 m2, respectively. The small values for the range, sill, and nugget indicated no spatial autocorrelation in the building location burn status at meaningful scales. After measuring and assigning values for each WUI component at multiple scales for all 135,416 affected buildings, we assessed their relationship to burn status using bivariate logistic regression models (Table 3). Based on the AUC, the best performing scales were a 1000-m neighborhood for building density and a 100-m neighborhood for vegetation cover. The multiple WUI component-scale combinations for distance to wildland vegetation patch size all resulted in the same AUC value, indicating that most buildings were lost near a 5 km2 or larger patch of wildland vegetation. Overall, low AUC values suggest poor predictive power for most individual WUI component-scale combinations. Building density AUC values tended to slowly increase and then level off with neighborhood sizes up to 1000 m. We observed building density AUC values dropping off and becoming erratic after 1000 m. Vegetation cover AUC values were greatest at 100 m, and declined with increasing neighborhood size. The relationships between building loss and proximity to the various vegetation patch sizes we tested were all similar to one another, indicating no difference in the predictive performance between the various patch sizes. The p-values did not vary and were significant (<0.0001) for all of the models, likely due to the large sample size.
Table 3.
Logistic regression results testing WUI component-scale combinations for building density, vegetation cover, and distance to wildland vegetation.
The wildland–urban interface component values for the burned buildings were distributed across a wide range of building densities, vegetation cover, and proximities to wildland vegetation when calculated at the highest performing WUI component-scale combinations. However, the majority of the building loss occurred in areas with low building density, high vegetation cover, and within close proximity to large patches of wildland vegetation (Figure 5). Only 2.7% of the burned buildings occurred at densities of <6.17 buildings per km2 (the minimum housing density threshold used to differentiate WUI from non-WUI areas in the census-based SILVIS WUI maps). Ten percent of the burned buildings occurred in areas with less than 25% vegetation cover. In comparison, 80% of the building loss occurred in areas with 50% or more vegetation cover (the threshold used in the SILVIS WUI data to distinguish WUI interface from WUI intermix). Eighty percent of all of the burned buildings were located within wildland vegetation (0 m distance), 95% of the burned buildings occurred within 100 m, and 100% of the burned buildings occurred within 850 m, which is substantially less than the 2400-m threshold used in the SILVIS WUI data to distinguish WUI from non-WUI areas. Only seven WUI disasters resulted in building loss at distances greater than 300 m from wildland vegetation, and only California’s 2017 Tubbs Fire caused building loss further than 500 m from large patches of wildland vegetation.
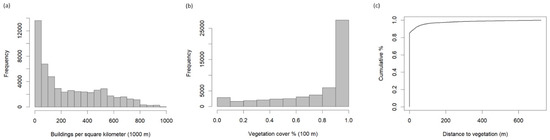
Figure 5.
Building loss by wildland–urban interface components: (a) histogram of the building density calculated with a 1000-m neighborhood size, (b) histogram of the vegetation cover within 100 m, and (c) cumulative percentage of the building loss by distance to 5 km2 or larger patches of wildland vegetation.
3.4. Building Loss by Point-Based WUI Type
Each building’s point-based WUI type was determined using the point-based WUI framework and the WUI component values calculated at the best-performing predictive scale. We used a minimum building density threshold of 6.17 buildings per km2, calculated using a 1000-m neighborhood in order to distinguish WUI from low-density non-WUI; a vegetation cover threshold of 50%, calculated using a 100-m neighborhood in order to differentiate the WUI interface from WUI intermix; and a maximum distance of 850 m from wildland vegetation patches of 5 km2 or larger. The point-based WUI map classified 97% of the burned buildings as either WUI interface (20%) or WUI intermix (77%) (Table 4). The remaining 3% of the burned buildings were located in areas classified as non-WUI, primarily in areas with vegetation and low to very-low building density (less than 6.17 buildings per km2). The percentage of building loss was 22% to 31% in non-WUI areas, and 33% and 42% for interface and intermix areas. The WUI intermix areas experienced the highest rates of loss, at 42%.
Table 4.
Total buildings and building loss by wildland–urban interface (WUI) type, created using a point-based WUI mapping method in which the WUI component values were calculated using the best-performing scale for each. The building density and percentage of vegetation cover were measured in 1000-m and 100-m neighborhoods, respectively, and the distance to wildland vegetation was measured using a 5 km2 minimum patch size and a maximum distance of 850 m.
4. Discussion
This study characterized the occurrence of WUI disasters and assessed building loss relative to housing density, vegetation cover, and proximity to large patches of contiguous wildland vegetation, and evaluated how well census-based and point-based WUI maps captured patterns of building loss in WUI disasters. We identified 108 wildfires in the United States between 2000 and 2018 that burned more than 50 buildings. These WUI disasters were the most destructive wildfires in the United States in terms of building loss. However, they represented only a small fraction of the estimated 1.4 million wildfire ignitions estimated to have occurred during our study period [14]. The WUI disasters tended to be concentrated in California, Colorado, Texas, Arizona, and New Mexico. The number of WUI disasters and the associated building loss has been increasing since 2000. However, there was considerable interannual variation, with extensive losses in 2017 and 2018, and with the Camp Fire in Paradise, California heavily influencing the overall trend. Widespread drought conditions in the western United States in 2020, along with climactic and demographic trends, resulted in extensive areas burned and building losses in many western states [9,11,12,13,23,45], with over 17,663 buildings destroyed as of 30 November 2020 [46].
We defined WUI disasters as those wildfires that burned more than 50 buildings, but there is no formally agreed-upon definition. Cohen suggested 100 burned buildings was an appropriate threshold [9], but we lowered that number in order to capture more loss and account for potential errors in the ICS-209 data. Had we used Cohen’s threshold of 100 burned buildings, the proportion of the WUI interface loss relative to WUI intermix loss would have likely been slightly higher. If we had further lowered the threshold or examined all of the fires with building loss, the proportion of WUI interface loss would have likely been slightly lower. Future research investigating the sensitivity of WUI disasters’ building-loss thresholds would be useful in advancing our understanding of the spatial nature of building loss, and could help to develop a framework to synthesize findings from disparate post-wildfire building-loss case studies [5,18,24].
Census-based and point-based WUI maps, respectively, classified 86% and 97% of all of the buildings lost in WUI disasters as being in either the WUI interface or intermix. Despite the coarse resolution of the SILVIS WUI data, these maps effectively identify the majority of structures that are at risk of loss during WUI disasters. The SILVIS WUI mapping methods are transparent and easy to replicate with publicly available data [23]. Census and land cover data collection efforts are both well-documented and routinely updated, allowing managers and researchers to account for temporal changes in WUI development [12,33,47]. Both the demonstrated utility of the SILVIS WUI maps and their acceptance as a standard through Executive Order #13728 [25] suggest that they will continue to serve an essential role at a national scale, and for many broad-scale WUI mapping efforts that do not require specific building locations. That said, point-based WUI mapping methods classified more burned buildings as either WUI interface or intermix. Their ability to include the specific locations of at-risk building locations and exclude low-risk buildings offers additional advantages for certain applications at multiple scales, and more closely aligns with our conceptual understanding of the WUI problem as one for which the fundamental unit is the individual building [9,10,17,18,20].
Our finding, that building loss mostly occurs in areas with low building densities and high vegetation cover, supports previous findings [35,48,49,50]. Higher losses in rural intermix environments with more wildland vegetation may be due to multiple factors, such as: continuous vegetation providing more potential for fire spread and building ignition, lower fire response capacity, the relative inaccessibility of dispersed buildings, or incident managers’ choices to direct resources to areas with higher-density clusters of buildings [51]. However, 20.5% of the building loss occurred in areas with > 500 buildings per km2, suggesting that the building loss in dense environments may be influenced by a set of unique environmental factors related to the buildings themselves, such as construction materials, landscaping, and proximity to neighboring buildings, all of which may facilitate building-to-building ignition [35,48,52]. Our results indicate that the building loss declined rapidly with the increasing distance from vegetation. All building loss in the study occurred within 850 m from large patches of wildland vegetation, and less than 5% of the building loss occurred at distances exceeding 100 m. The fires’ spread is likely hindered in environments with fragmented vegetation, and likely depends on embers, which rarely travel and ignite buildings farther than several hundred meters from the nearest patch of wildland vegetation [52,53].
Point-based WUI maps identified a higher percentage of burned buildings as WUI compared to the census-based methods. This suggests that, if the goal is to identify at-risk buildings, map developers can adjust WUI mapping methods to align with the observed losses. This could involve the selection of specific scales and thresholds for the calculation of WUI component values (minimum housing density, vegetation cover, and maximum buffer distance). The fact that all of the building loss occurs at distances substantially less than the 2400 m used in other WUI mapping efforts [5,22,23] suggests that this threshold could potentially be altered for WUI maps that seek to identify at-risk buildings. The 2400-m distance threshold used in the SILVIS WUI maps may be appropriate for census-based WUI maps, but our results suggest that a more conservative distance threshold may be appropriate for point-based WUI maps. The reduction of the buffer distance threshold to 850 m or shorter would focus attention on buildings with the highest risk of ignition, whilst also removing buildings at lower risk.
Detailed WUI maps of individual at-risk structures can also improve land use and wildfire mitigation planning at both the community and national scales [10,15,19,30]. Detailed point-based WUI maps overcome a key limitation of Census-based maps, which are sufficient at a national scale, but often insufficient for local applications such as wildfire incident response or neighborhood evacuation planning [17,18]. Furthermore, the documentation of losses across a range of building densities and vegetation cover percentages underscores the need to customize wildfire mitigation techniques for different environments [16,52]. In areas between 100 and 850 m from wildland vegetation, buildings may still be at risk of igniting, but the exposure in this zone is likely due to embers [53], and ignition becomes more influenced by the built environment. In areas where wildland hazardous fuel reduction projects are not feasible, there may be a benefit to the removal of flammable landscaping and the implementation of building hardening techniques. Our results, which describe the pattern of loss in different environments, underscore the need to tailor distinct mitigation techniques across a range of building density, vegetation cover, and community types, including some areas that are not traditionally considered at risk [16,48,49,50]. Fine-scale WUI maps of at-risk buildings also provide the potential to improve quantitative wildfire risk assessments, refine estimates of values at risk, and better identify community wildfire exposure zones [17,18,20,52].
Detailed point-based maps can help local governments assess strategies to limit residential development in fire-prone areas, and enact building codes that require defensible space, [10,15,16,18]. The use of detailed WUI maps focused on at-risk buildings enables more in-depth discussions about the ways in which communities and property owners can mitigate risk, and facilitates more nuanced mitigation efforts that consider local knowledge about the building’s immediate surroundings, property access, construction materials, and vegetation cover on the property. The knowledge from detailed WUI maps reduces the uncertainties that WUI residents and communities need to navigate, including the ways in which buildings and vegetation are co-located within a census block. Point-based maps also have additional benefits because they offer a nationally-consistent approach that can be scaled up and summarized at multiple scales (e.g., counties, firesheds, states, regions) [30,54,55]. Their improved spatial resolution relative to census blocks allows for improved estimates of community wildfire exposure, helps to refine estimates of values at risk, and can inform local fire planning and response strategies, as well as regional land management budget allocations tied to building exposure [20,55,56,57].
Our findings are particularly informative in light of previous WUI sensitivity analyses. Previous work has examined the ways in which the adjustment of WUI component parameters would change the spatial extent of the WUI and the number of buildings categorized as intermix or interface areas [5,18,23,24]. For example, shrinking the WUI buffer distance from 2400 m to 850 m would exclude low-risk buildings while reducing the total number of buildings and the spatial extent of the WUI interface. The reduction of the building density threshold or the calculation of the building density using a smaller neighborhood size would increase the number of buildings in the WUI intermix. Many building points have building densities >6.17 buildings per km2 when calculated using a 1000-m neighborhood, but <6.17 buildings per km2 when calculated at the census-block scale. These adjustments could have significant implications for informing land management decisions. Expanding the WUI intermix and shrinking the WUI interface could influence funding allocations tied to the number of at-risk WUI buildings present in a landscape. The expansion of how and where the intermix is represented in WUI maps could also inform land management agencies whose hazardous fuel reduction efforts are often tied to WUI community protection objectives [57]. Additional research is needed in order to investigate the potential implications these adjustments may have for different states and regions, depending on their unique residential development patterns and mix of WUI interface and WUI intermix.
In conclusion, our results indicate that point-based WUI maps can improve our understanding of where building loss occurs during WUI disasters, and can more accurately identify at-risk buildings relative to existing census-based mapping. By documenting the pattern of home loss relative to the standard WUI mapping components (building density, vegetation cover, distance from vegetation), this study also improves our understanding of the WUI problem as a complex spatial phenomenon. Although the WUI is the fastest-growing land-use type in the United States [23], our results suggest that building loss is variable, localized, and is not equally distributed throughout the interface, intermix, and WUI-adjacent areas. Although this variation needs to be explored further, the findings herein have important implications for land-use planning, risk assessments, and wildfire mitigation. Our findings improve our understanding of historical patterns of loss and the potential for loss in the future, which will become increasingly important as the WUI expands, and the number of at-risk buildings increases.
Author Contributions
Conceptualization, M.D.C., T.J.H., B.M.G., C.M.H.; methodology, M.D.C., T.J.H., B.M.G., C.M.H.; formal analysis, M.D.C., T.J.H., B.M.G., C.M.H.; writing—original draft M.D.C., T.J.H., B.M.G., C.M.H. All authors have read and agreed to the published version of the manuscript.
Funding
Funding for T.J. Hawbaker was provided by the U.S. Department of the Interior, U.S. Geological Survey (USGS), Land Change Science Program managed by the Core Science Systems Mission Area, and the U.S. Department of the Interior North Central Climate Adaptation Science Center, which is managed by the USGS National Climate Adaptation Science Center.
Conflicts of Interest
The authors declare no conflict of interest.
Disclaimers
Any use of trade, firm, or product names is for descriptive purposes only and does not imply endorsement by the U.S. Government.
References
- Theobald, D.M.; Romme, W.H. Expansion of the US wildland–urban interface. Landsc. Urban Plan. 2007, 83, 340–354. [Google Scholar] [CrossRef]
- Platt, R.V.; Schoennagel, T.; Veblen, T.T.; Sherriff, R.L. Modeling wildfire potential in residential parcels: A case study of the north-central Colorado Front Range. Landsc. Urban Plan. 2011, 102, 117–126. [Google Scholar] [CrossRef]
- Syphard, A.D.; Massada, A.B.; Butsic, V.; Keeley, J.E. Land use planning and wildfire: Development policies influence future probability of housing loss. PLoS ONE 2013, 8, e71708. [Google Scholar] [CrossRef] [PubMed]
- Haas, J.R.; Calkin, D.E.; Thompson, M.P. Wildfire risk transmission in the Colorado Front Range, USA. Risk Anal. 2015, 35, 226–240. [Google Scholar] [CrossRef]
- Radeloff, V.C.; Hammer, R.B.; Stewart, S.I.; Fried, J.S.; Holcomb, S.S.; McKeefry, J.F. The Wildland–Urban Interface in the United States. Ecol. Appl. 2005, 15, 799–805. [Google Scholar] [CrossRef]
- Gill, A.M.; Stephens, S.L. Scientific and social challenges for the management of fire-prone wildland–urban interfaces. Environ. Res. Lett. 2009, 4, 034014. [Google Scholar] [CrossRef]
- Syphard, A.D.; Keeley, J.E. Factors associated with structure loss in the 2013–2018 California wildfires. Fire 2019, 2, 49. [Google Scholar] [CrossRef]
- Corelogic. 2019 Wildfire Risk Report. Available online: https://www.corelogic.com/insights-download/wildfire-risk-report.aspx (accessed on 1 December 2020).
- Cohen, J.D. The wildland-urban interface fire problem: A consequence of the fire exclusion paradigm. For. Hist. Today 2008, Fall, 20–26. [Google Scholar]
- Calkin, D.E.; Cohen, J.D.; Finney, M.A.; Thompson, M.P. How risk management can prevent future wildfire disasters in the wildland-urban interface. Proc. Natl. Acad. Sci. USA 2014, 111, 746–751. [Google Scholar] [CrossRef]
- Balch, J.K.; Bradley, B.A.; Abatzoglou, J.T.; Nagy, R.C.; Fusco, E.J.; Mahood, A.L. Human-started wildfires expand the fire niche across the United States. Proc. Natl. Acad. Sci. USA 2017, 114, 2946–2951. [Google Scholar] [CrossRef]
- Hammer, R.B.; Stewart, S.I.; Radeloff, V.C. Demographic trends, the wildland–urban interface, and wildfire management. Soc. Nat. Resour. 2009, 22, 777–782. [Google Scholar] [CrossRef]
- Westerling, A.L.; Hidalgo, H.G.; Cayan, D.R.; Swetnam, T.W. Warming and earlier spring increase western U.S. forest wildfire activity. Science 2006, 313, 940–943. [Google Scholar] [CrossRef] [PubMed]
- Short, K.C. A spatial database of wildfires in the United States, 1992–2011. Earth Syst. Sci. Data 2014, 6, 1–27. [Google Scholar] [CrossRef]
- Smith, A.M.S.; Kolden, C.A.; Paveglio, T.B.; Cochrane, M.A.; Bowman, D.M.; Moritz, M.A.; Kliskey, A.D.; Alessa, L.; Hudak, A.T.; Hoffman, C.M.; et al. The science of firescapes: Achieving fire-resilient communities. BioScience 2016, 66, 130–146. [Google Scholar] [CrossRef]
- Paveglio, T.B.; Moseley, C.; Carroll, M.S.; Williams, D.R.; Davis, E.J.; Fischer, A.P. Categorizing the cocial context of the wildland urban interface: Adaptive capacity for wildfire and community “archetypes”. For. Sci. 2015, 61, 298–310. [Google Scholar] [CrossRef]
- Calkin, D.E.; Rieck, J.D.; Hyde, K.D.; Kaiden, J.D. Built structure identification in wildland fire decision support. Int. J. Wildland Fire 2011, 20, 78–90. [Google Scholar] [CrossRef]
- Bar-Massada, A.; Stewart, S.I.; Hammer, R.B.; Mockrin, M.H.; Radeloff, V.C. Using structure locations as a basis for mapping the wildland urban interface. J. Environ. Manag. 2013, 128, 540–547. [Google Scholar] [CrossRef]
- Jakes, P.; Burns, S.; Cheng, A.; Saeli, E.; Brummel, K.N.R.; Grayzeck, S.; Sturtevant, V.; Williams, D. Critical elements in the development and implementation of Community Wildfire Protection Plans (CWPPs). In The Fire Environment—Innovations, Management, and Policy, Proceedings of the RMRS-P-46CD, Destin, FL, USA, 26–30 March 2007; CD-ROM; Butler, B.W., Cook, W.C., Eds.; U.S. Department of Agriculture, Forest Service, Rocky Mountain Research Station: Fort Collins, CO, USA, 2007; pp. 613–624. [Google Scholar]
- Scott, J.H.; Thompson, M.P.; Calkin, D.E. A wildfire risk assessment framework for land and resource management. In Gen. Tech. Rep. RMRS-GTR-315; U.S. Department of Agriculture, Forest Service, Rocky Mountain Research Station: Station, 2013; Volume 315, p. 83. [Google Scholar] [CrossRef]
- Federal Register. Urban Wildland Interface Communities within the Vicinity of Federal Lands That Are at High Risk from Wildfire. Available online: https://www.federalregister.gov/documents/2001/01/04/01-52/urban-wildland-interface-communities-within-the-vicinity-of-federal-lands-that-are-at-high-risk-from (accessed on 2 December 2020).
- Martinuzzi, S.; Stewart, S.I.; Helmers, D.P.; Mockrin, M.H.; Hammer, R.B.; Radeloff, V.C. The 2010 Wildland-Urban Interface of the Conterminous United States; U.S. Department of Agriculture, Forest Service, Northern Research Station: Newtown Square, PA, USA, 2015. [CrossRef]
- Radeloff, V.C.; Helmers, D.P.; Kramer, H.A.; Mockrin, M.H.; Alexandre, P.M.; Bar-Massada, A.; Butsic, V.; Hawbaker, T.J.; Martinuzzi, S.; Syphard, A.D.; et al. Rapid growth of the US wildland-urban interface raises wildfire risk. Proc. Natl. Acad. Sci. USA 2018, 115, 3314. [Google Scholar] [CrossRef]
- Stewart, S.I.; Radeloff, V.C.; Hammer, R.B.; Hawbaker, T.J. Defining the wildland–urban interface. J. For. 2007, 105, 201–207. [Google Scholar] [CrossRef]
- Federal Register. Wildland-Urban Interface Federal Risk Mitigation. Available online: https://www.federalregister.gov/documents/2016/05/20/2016-12155/wildland-urban-interface-federal-risk-mitigation (accessed on 2 December 2020).
- Blaschke, T. Object based image analysis for remote sensing. ISPRS J. Photogramm. Remote Sens. 2010, 65, 2–16. [Google Scholar] [CrossRef]
- Caggiano, M.D.; Tinkham, W.T.; Hoffman, C.; Cheng, A.S.; Hawbaker, T.J. High resolution mapping of development in the wildland-urban interface using object based image extraction. Heliyon 2016, 2, e00174. [Google Scholar] [CrossRef] [PubMed]
- Leyk, S.; Uhl, J.H. HISDAC-US, historical settlement data compilation for the conterminous United States over 200 years. Sci. Data 2018, 5, 180175. [Google Scholar] [CrossRef] [PubMed]
- Microsoft Building Footprints-Bing Maps. Available online: https://www.microsoft.com/en-us/maps/building-footprints (accessed on 2 December 2020).
- Scott, J.H.; Thompson, M.P.; Gilbertson-Day, J.W. Exploring how alternative mapping approaches influence fireshed assessment and human community exposure to wildfire. GeoJournal 2017, 82, 201–215. [Google Scholar] [CrossRef]
- Stewart, S.I.; Wilmer, B.; Hammer, R.; Aplet, G.; Hawbaker, T.; Miller, C.; Radeloff, V. Wildland-urban interface maps vary with purpose and context. J. For. 2009, 107, 78–83. [Google Scholar]
- National Wildfire Coordinating Group. Wildfire Incident Status Summary Reports (ICS-209). Available online: https://famit.nwcg.gov/applications/SIT209/NIMSICS209 (accessed on 2 December 2020).
- Yang, L.; Jin, S.; Danielson, P.; Homer, C.; Gass, L.; Bender, S.M.; Case, A.; Costello, C.; Dewitz, J.; Fry, J.; et al. A new generation of the United States National Land Cover Database: Requirements, research priorities, design, and implementation strategies. ISPRS J. Photogramm. Remote Sens. 2018, 146, 108–123. [Google Scholar] [CrossRef]
- Katuwal, H.; Dunn, C.J.; Calkin, D.E. Characterising resource use and potential inefficiencies during large-fire suppression in the western US. Int. J. Wildland Fire 2017, 26, 604–614. [Google Scholar] [CrossRef]
- Alexandre, P.M.; Stewart, S.I.; Keuler, N.S.; Clayton, M.K.; Mockrin, M.H.; Bar-Massada, A.; Syphard, A.D.; Radeloff, V.C. Factors related to building loss due to wildfires in the conterminous United States. Ecol. Appl. 2016, 26, 2323–2338. [Google Scholar] [CrossRef]
- California Department of Forestry and Fire Protection CAL FIRE Damage Inspection Program. Available online: https://www.fire.ca.gov/ (accessed on 2 December 2020).
- Lin, G.; Milan, A.; Shen, C.; Reid, I. RefineNet: Multi-path refinement networks for high-resolution semantic segmentation. In Proceedings of the 2017 IEEE Conference on Computer Vision and Pattern Recognition (CVPR), Honolulu, HI, USA, 21–26 July 2017; pp. 5168–5177. [Google Scholar]
- Eidenshink, J.; Schwind, B.; Brewer, K.; Zhu, Z.-L.; Quayle, B.; Howard, S. A project for monitoring trends in burn severity. Fire Ecol. 2007, 3, 3–21. [Google Scholar] [CrossRef]
- U.S. Geological Survey. GeoMAC Wildfire Application. Available online: https://www.geomac.gov/ (accessed on 2 December 2020).
- Environmental Systems Research Institute. ArcGIS Desktop: Release 10; Environmental Systems Research Institute: Redlands, CA, USA, 2011. [Google Scholar]
- Chen, K.; McAneney, J. Quantifying bushfire penetration into urban areas in Australia. Geophys. Res. Lett. 2004, 31. [Google Scholar] [CrossRef]
- Solow, A.R. Mapping by simple indicator kriging. Math. Geosci. 1986, 18, 335–352. [Google Scholar] [CrossRef]
- Curran, P.J. The semivariogram in remote sensing: An introduction. Remote Sens. Environ. 1988, 24, 493–507. [Google Scholar] [CrossRef]
- Fawcett, T. An introduction to ROC analysis. Pattern Recognit. Lett. 2006, 27, 861–874. [Google Scholar] [CrossRef]
- Mueller, S.E.; Thode, A.E.; Margolis, E.Q.; Yocom, L.L.; Young, J.D.; Iniguez, J.M. Climate relationships with increasing wildfire in the southwestern US from 1984 to 2015. For. Ecol. Manag. 2020, 460, 117861. [Google Scholar] [CrossRef]
- Headwaters Economics Wildfires Destroy Thousands of Structures Each Year. Available online: https://headwaterseconomics.org/natural-hazards/structures-destroyed-by-wildfire/ (accessed on 2 December 2020).
- Wickham, J.; Stehman, S.V.; Gass, L.; Dewitz, J.A.; Sorenson, D.G.; Granneman, B.J.; Poss, R.V.; Baer, L.A. Thematic accuracy assessment of the 2011 National Land Cover Database (NLCD). Remote Sens. Environ. 2017, 191, 328–341. [Google Scholar] [CrossRef]
- Syphard, A.D.; Keeley, J.E.; Massada, A.B.; Brennan, T.J.; Radeloff, V.C. Housing arrangement and location determine the likelihood of housing loss due to wildfire. PLoS ONE 2012, 7, e33954. [Google Scholar] [CrossRef]
- Kramer, H.A.; Mockrin, M.H.; Alexandre, P.M.; Stewart, S.I.; Radeloff, V.C. Where wildfires destroy buildings in the US relative to the wildland–urban interface and national fire outreach programs. Int. J. Wildland Fire 2018, 27, 329–341. [Google Scholar] [CrossRef]
- Kramer, H.A.; Mockrin, M.H.; Alexandre, P.M.; Radeloff, V.C. High wildfire damage in interface communities in California. Int. J. Wildland Fire 2019, 28, 641–650. [Google Scholar] [CrossRef]
- Clark, A.M.; Rashford, B.S.; McLeod, D.M.; Lieske, S.N.; Coupal, R.H.; Albeke, S.E. The impact of residential development pattern on wildland fire suppression expenditures. Land Econ. 2016, 92, 656–678. [Google Scholar] [CrossRef]
- Maranghides, A.; Mell, W. Framework for Addressing the National Wildland Urban Interface Fire Problem—Determining Fire and Ember Exposure Zones Using a WUI Hazard Scale; U.S. Department of Commerce, National Institute of Standards and Technology: Newtown Square, PA, USA, 2012; p. 25.
- Koo, E.; Pagni, P.J.; Weise, D.R.; Woycheese, J.P. Firebrands and spotting ignition in large-scale fires. Int. J. Wildland Fire 2010, 19, 818–843. [Google Scholar] [CrossRef]
- Ager, A.A.; Day, M.A.; Palaiologou, P.; Houtman, R.M.; Ringo, C.; Evers, C.R. Cross-boundary wildfire and community exposure: A framework and application in the western U.S. In Gen. Tech. Rep. RMRS-GTR-392; U.S. Department of Agriculture, Forest Service, Rocky Mountain Research Station: Fort Collins, CO, USA, 2019; Volume 392, p. 36. [Google Scholar]
- Evers, C.R.; Ager, A.A.; Nielsen-Pincus, M.; Palaiologou, P.; Bunzel, K. Archetypes of community wildfire exposure from national forests of the western US. Landsc. Urban Plan. 2019, 182, 55–66. [Google Scholar] [CrossRef]
- Miller, S.R.; Wuerzer, T.; Vos, J.; Lindquist, E.; Mowery, M.; Holfeltz, T.; Stephens, B.; Grad, A. Planning for Wildfire in the Wildland-Urban Interface: A Resource Guide for Idaho Communities; Social Science Research Network: Rochester, NY, USA, 2016. [Google Scholar]
- Schoennagel, T.; Nelson, C.R.; Theobald, D.M.; Carnwath, G.C.; Chapman, T.B. Implementation of National Fire Plan treatments near the wildland-urban interface in the western United States. Proc. Natl. Acad. Sci. USA 2009, 106, 10706–10711. [Google Scholar] [CrossRef] [PubMed]


Publisher’s Note: MDPI stays neutral with regard to jurisdictional claims in published maps and institutional affiliations. |
© 2020 by the authors. Licensee MDPI, Basel, Switzerland. This article is an open access article distributed under the terms and conditions of the Creative Commons Attribution (CC BY) license (http://creativecommons.org/licenses/by/4.0/).