Article

Soil Enzyme Activity and Soil Nutrients Jointly Influence Post-Fire Habitat Models in Mixed-Conifer Forests of Yosemite National Park, USA

Wildland Resources Department and the Ecology Center, Utah State University, Logan, UT 84322, USA
*
Author to whom correspondence should be addressed.
Submission received: 23 June 2020 / Revised: 16 September 2020 / Accepted: 19 September 2020 / Published: 23 September 2020

Abstract

:
Disentangling the relative importance of habitat filtering and dispersal limitations at local scales (<1 km2) in shaping species composition remains an important question in community ecology. Previous studies have examined the relative importance of these mechanisms using topography and selected soil properties. We examined both topography and edaphic properties from 160 locations in the recently burned 25.6 ha Yosemite Forest Dynamics Plot (YFDP) in Yosemite National Park, California, USA. In addition to eight soil chemical properties, we included phosphatases and urease enzymes in a definition of habitat niches, primarily because of their rapid changes with fire (compared to soil nutrients) and also their role in ecosystem function. We applied environmental variables to the distributions of 11 species. More species–habitat associations were defined by soil properties (54.5%) than topographically-defined habitat (45.4%). We also examined the relative importance of spatial and environmental factors in species assemblage. Proportions explained by spatial and environmental factors differed among species and demographic metrics (stem abundance, basal area increment, mortality, and recruitment). Spatial factors explained more variation than environmental factors in stem abundance, mortality, and recruitment. The contributions of urease and acid phosphatase to habitat definition were significant for species abundance and basal area increment. These results emphasize that a more complete understanding of niche parameters is needed beyond simple topographic factors to explain species habitat preference. The stronger contribution of spatial factors suggests that dispersal limitation and unmeasured environmental variables have high explanatory power for species assemblage in this coniferous forest.

1. Introduction

Niche-based processes and neutral processes both shape species assemblages in ecological communities. Niche theory assumes that different species have their own niche and species adaptation to specific environmental heterogeneity and biotic interactions determine the species coexistence. In contrast, neutral theory emphasizes the role of stochastic events such as dispersal-assembly in shaping community structure. Neutral theory assumes that all individuals of all species are ecologically equivalent and the environmental variables play no role in community structure [1]. Dispersal limitation controls the spread of individuals into various habitats, while habitat filtering helps multi-species remain in coexistence through interspecific competition for the same restricted resources [2].
Understanding the relationships between species demographic metrics (stem density, basal area increment, mortality, and recruitment) and habitats in forests is important not only in shaping community structure at different spatial scales, but also in providing valuable information regarding the environmental requirements of tree species in successful ecological restoration [3]. The effect of some spatially structured habitat variables such as topographic and edaphic components could be reflected in species composition and distribution by habitat associations. However, topographic variables are commonly used as a proxy for habitat heterogeneity in governing community structure [4,5] due to their impact on hydrological condition, flow patterns, and soil biogeochemical processes [6,7], and topographic factors sometimes covary with the soil conditions and temperature [8,9].
Soil enzymes are produced by microorganisms, plants, and animals in the soil [10] and the enzymes originated by microorganisms (bacteria and fungi) play key roles in mineralization of organic matter and nutrient cycling [11,12]. Their activities depend on soil conditions (soil pH, soil depth, soil organic matter) [13], climatic parameters (temperature, precipitation), and geographic factors including elevation, longitude, latitude [14], and disturbance [15]. Fire changes soil enzyme activities through reduction of soil organic matter content, production of ash and char layers from soil organic matter, and change in soil temperature [16]. The degree to which these factors influence soil chemical properties and enzyme activity would be expected to differ in burned areas and adjacent, small unburned patches [17,18].
In addition to the associations of species demographic metrics to habitats, recent studies have used theoretical explanations to dissociate the contribution of environment and space. The relative importance of environmental and spatial components can provide information with respect to habitat filtering and dispersal process dominance in shaping community assembly. The proportion explained by pure space is linked to dispersal processes and other unmeasured structured environmental factors. The fraction explained by environmental variables (pure environmental plus the spatially structured environmental factors) is related to species responses to measured environmental variables. If dispersal limitation is considered as the principal determinant of the variations in species composition, spatial variables will explain most of the variation. Otherwise, sites with the same species composition will be expected to have similar environmental conditions [19]. Species mortality depends on various factors including proximity to canopy gaps [20], climate variability [21], and fire [22,23]. Understanding the relative importance of the habitat filtering and dispersal limitation in explaining variation in species demographic metrics would be a good approach to predicting the potential response of species to the future climatic events and improving our understanding regarding the important processes that promote species coexistence in temperate mixed-conifer forest.
In this study, we examined the habitat associations and determined the effects of edaphic properties (soil chemical and soil enzymes activities), topography, and space on species composition. Our objectives were to examine (1) species–environment associations in order to determine the total numbers of the habitat associated species, (2) how much variation of species demographic metrics (stem abundance, basal area increment, mortality, and recruitment numbers) could be explained by spatial and environmental variables in order to determine the importance of dispersal limitation and niche differentiation on species assemblage, (3) the effect of fire on the levels of soil enzyme activities as explanatory variables in defining habitats, and (4) the importance of adding enzymatic activity to ascertain the effect of different environmental variables on improving habitat characterization.

2. Materials and Methods

2.1. Study Area

This study was conducted in the Yosemite Forest Dynamic Plot (YFDP, 37.77° N, 119.82° W) near Crane Flat in Yosemite National Park, central Sierra Nevada, California, USA (Figure 1) [24]. The YFDP comprises 25.6 ha (320 × 800 m, further divided into 640 quadrats of 20 × 20 m). All stems ≥ 1 cm diameter at breast height (DBH) were identified, mapped, and tagged according to the Smithsonian ForestGEO protocols in 2009 and 2010 [25,26]. Elevation ranges from 1774.1 to 1911.3 m. Yosemite’s climate is Mediterranean with hot, dry summers and cool, wet winters. Minimum mean monthly temperature was 13.7 °C in January and maximum mean monthly temperature was 34.6 °C in July [27]. The annual mean monthly minimum and maximum temperatures were 6 °C and 16 °C, respectively, from 1981 to 2010; most of the precipitation falls from December through March as snow, with an annual average of 1070 mm [27]. The YFDP is located in Abies concolor-Pinus lambertiana forest [28].
The five most abundant species are Abies concolor (white fir), Pinus lambertiana (sugar pine), Cornus nuttallii (Pacific dogwood,) Calocedrus decurrens (incense-cedar), and Quercus kelloggii (California black oak) (Table 1, Supplementary material, Figure S1). The YFDP is situated on two soil polygons of the Clarks Lodge–Ultic Palexeralfs complex and the Typic Dystroxerepts–Humic Dystroxerepts complex [29].
Prior to Euro-American settlement, the mean fire return interval was 29.5 years in the YFDP [30]. The last widespread fire occurred in 1899 [31] and fire was excluded from 1900 to 2012. In August 2013, the Rim Fire burned 104,131 ha, with approximately 31,263 ha within Yosemite National Park [32]. The YFDP was burnt on September first and second by a management-ignited (but subsequently unmanaged) backfire to slow the spread of the Rim fire (see [33] for details regarding fire weather, [34] for details regarding Landsat-derived fire severity, and [35] for details on surface fuel consumption). The Rim Fire burned almost all litter and duff, leaving 3.22 and 13.1 Mg ha−1, respectively [35,36]. Within the YFDP, the overall effect of the Rim Fire was a burn severity, initial tree mortality, and surface fuel consumption similar to recent Yosemite fires (1985 and 2008), rather than the high severity present in parts of the Rim Fire footprint [22,33,37,38].
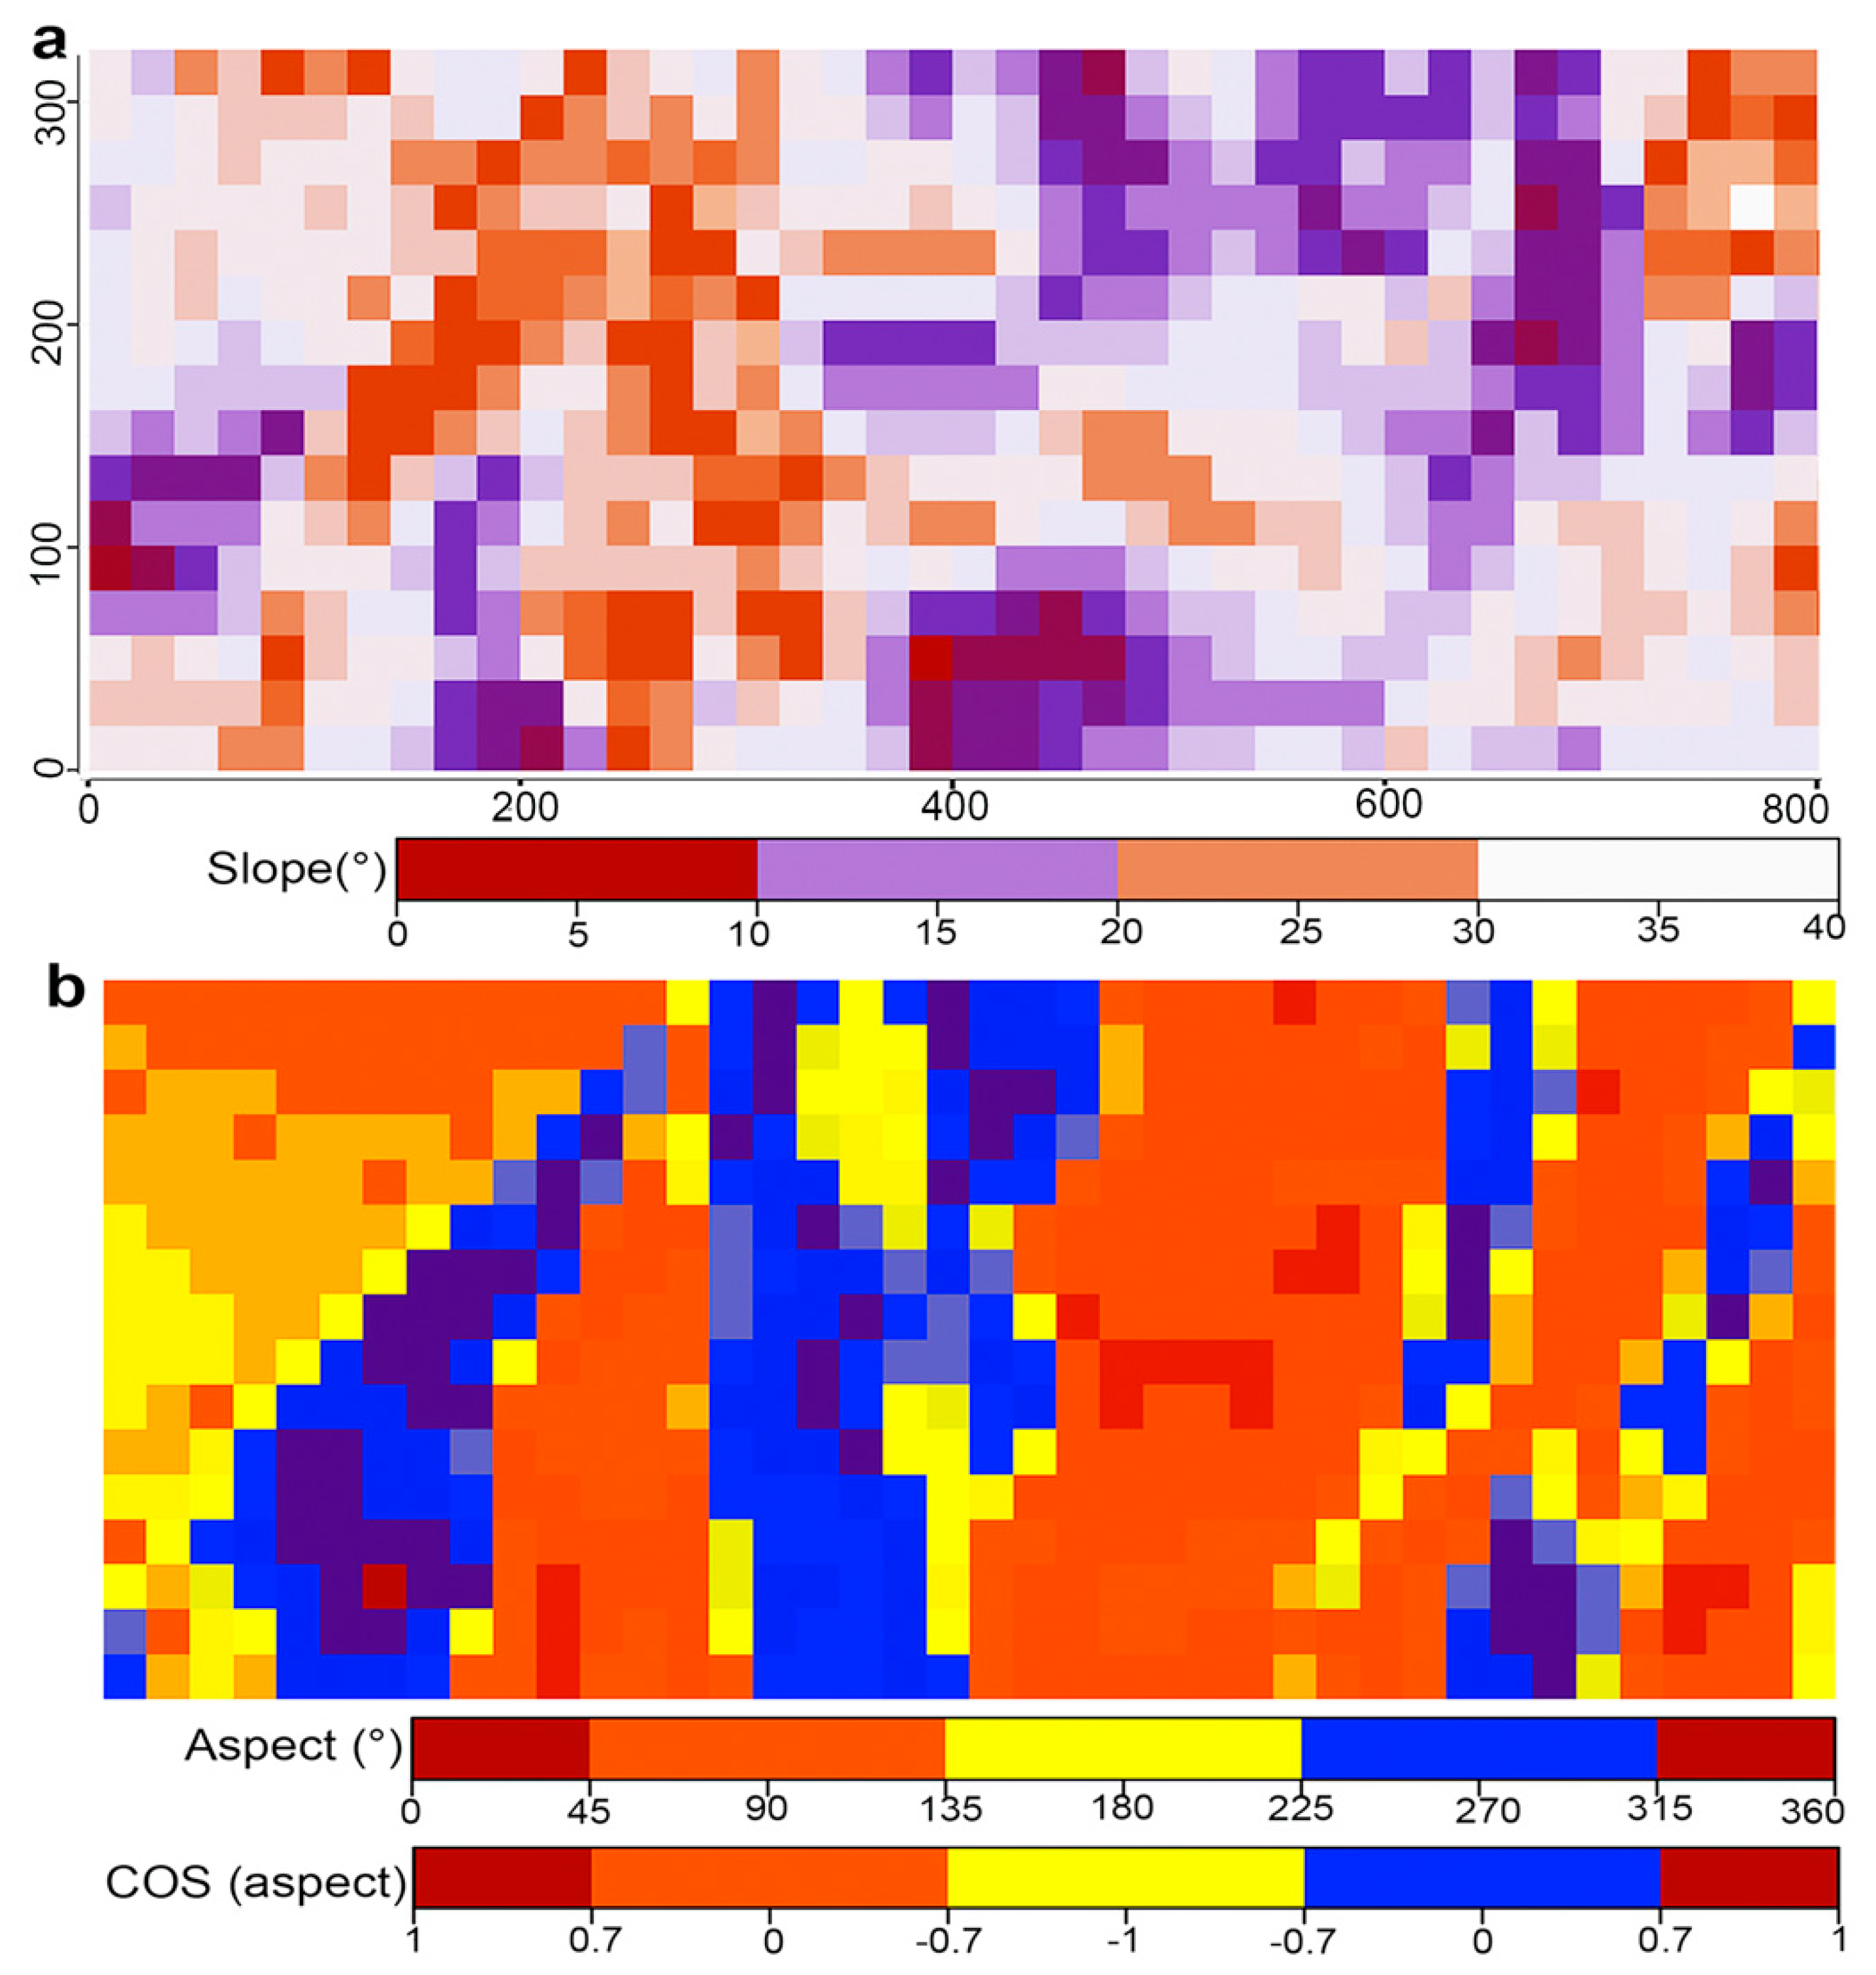
Each stem was revisited annually between 2011 and 2019, and the status (live or dead) was checked each year, with diameters remeasured in 2014 and 2019. Unburned patches ≥1 m2 (unburned litter and duff layer) were mapped at the beginning of the growing season immediately after the fire [34]. Topographic variables (elevation, aspect, and slope) of each 20 × 20 m quadrat were calculated based on the surveyed position and elevation of the 20-m grid reference corners. Elevation was taken as the average of elevation of four corners of each quadrat, and slope was measured as the mean angle of the four panels by connecting three corners of a quadrat. Aspects between 135° and 225° were considered south facing, because they receive the most direct solar exposure [39]. Aspect >225° and <135° were considered as one group due to the lower amount of sun radiation and temperature. As aspect is a land-surface variable, we used a cosine transformation to obtain a continuous gradient, describing the north–south gradient.
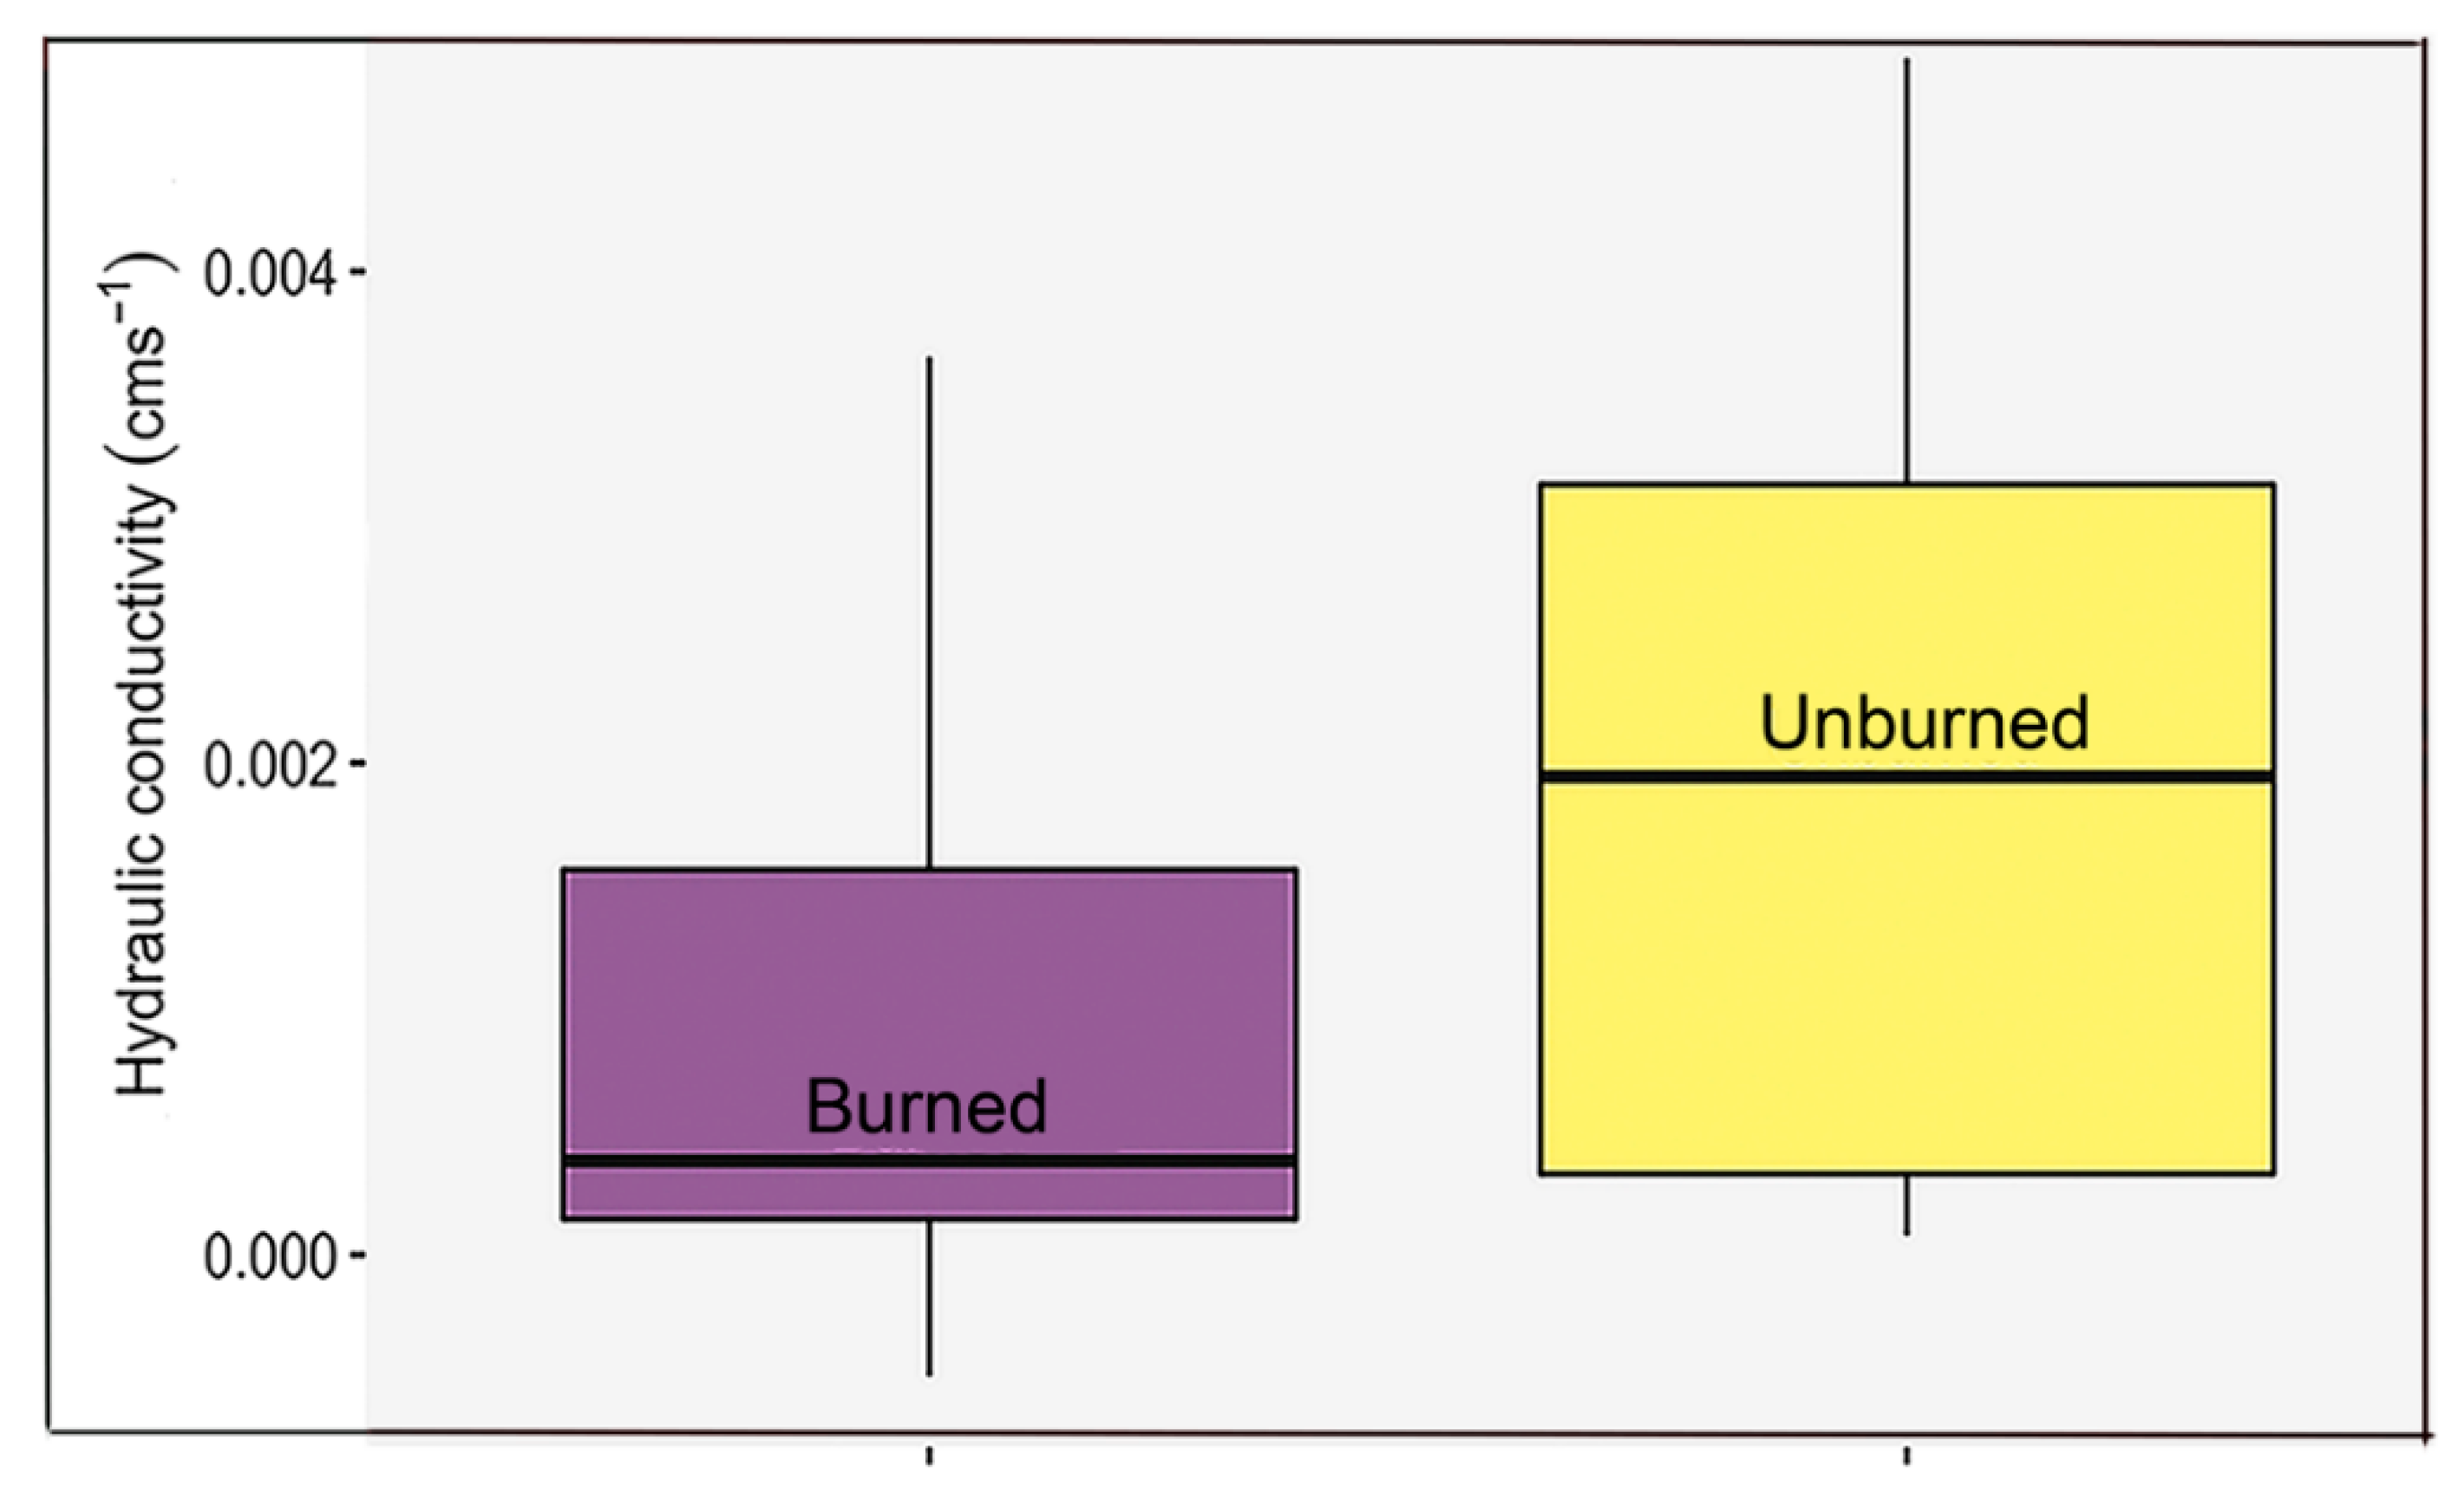
Cumulative infiltration and hydraulic conductivity were calculated using mini disk infiltrometer in 56 burned and 39 unburned sites. The infiltrometer was placed on the soil surface and the water was pulled from the tube by soil suction. The volume of water was recorded at 30 s intervals and plotted (cumulative infiltration versus the square root of time) according to the methods of Zhang [40]
K = C 1 A  
where C 1 is the slope for the cumulative infiltration vs. the square root of time, and A is a value that relates the van Genuchten parameters for a given soil texture class to both disk radius and the suction we selected. A is computed from the below formula:
A = 11.65 ( n 0.1     1 ) exp [ 2.92 ( n 1.9 ) α h ] ( α r 0 ) 0.91     ( n 1.9 )
A = 11.65 ( n 0.1     1 ) exp [ 7.5 ( n 1.9 ) α h ] ( α r 0 ) 0.91     ( n   <   1.9 )
where r is the disk radius, h is the suction at the disk surface, n and α are the van Genuchten parameters for the soil. The van Genuchten parameters for the 12 texture classes were obtained from Carsel and Parrish [41] (Table S1).
Soil samples were collected at 160 points (98 samples from burned sites and 62 samples from unburned patches) within the YFDP in May 2017. Samples were air dried at temperature (22 °C) and sieved to remove stones (with < 2 mm sieve). The BaCl2 method was used to determine the concentration of Ca (calcium), K (potassium), Mg (magnesium), and Mn (manganese). The Bray method was used to measure the concentration of P (phosphorus). Soil samples were extracted in 0.1 M BaCl2 for two hours, and the concentration of Ca, K, Mg, and Mn were determined by Inductivity Coupled Plasma Analyzer [42]. Effective cation exchange capacity (ECEC) was calculated as the sum of the exchangeable cations, which are mostly Ca, Na (sodium), K, and Mg. Cation exchange capacity (CEC) was calculated as a total quantity of negative surface charges. Total exchangeable bases (TEB) was obtained from summation of exchangeable K, Ca, Mg, and Na. Base saturation (BS) was calculated by dividing TEB by CEC value and multiplying by 100. Soil samples were collected at the same locations (160 quadrats; 98 burned patches and 62 unburned patches) for measuring the alkaline phosphatase, acid phosphatase, and urease activity in 2018. We collected three soil samples per quadrat and mixed them thoroughly. The mixed samples were considered as the representative of a sample for each quadrat. Samples were sieved from quadrats and maintained at < 5°C during transport to the lab. We allowed them to equilibrate at room temperature before starting enzymes measurements. Enzyme activity analysis was conducted using the methods developed by Dick [43]. Urease activity was assayed according to the methods of Kandeler and Gerber [44]. We used 2.5 milliliters (ml) of urea solution and 20 mL borate buffer containing disodium tetraborate for each 5 g soil sample and incubated them at 37 °C for two hours. A 30 mL potassium chloride (2 M)–hydrochloric acid (0.01 M) solution was added, and the mixtures were shaken on a shaker for 30 min. Soil suspensions were filtered and filtrates analyzed for ammonium by colorimetric procedure. Phosphatases (acid and alkaline phosphatases) were measured by the method of Tabatabai and Bremner [45,46], which includes colorimetric estimation of p-nitrophenol release (acid solution of the p-nitrophenol is colorless and the alkaline solution has yellow color) when 1 g of soil is incubated with 0.2 mL toluene and 4 mL of buffered sodium p-nitrophenyl phosphate solution (pH for buffer were considered equal to 6.5 for acid phosphatase and 11 for alkaline phosphatase) at 37 °C for 1 h. After incubation, CaCl2–NaOH treatment was used to extract the p-nitrophenol released by phosphatase activity.

2.2. Habitat Definition

We identified two classes of habitat predictors (topographic and soil variables) to define habitat maps. Topographic variables were comprised of elevation, aspect, and slope. Soil variables were Ca, K, Mg, Mn, total exchangeable bases (TEB), base saturation (BS), P, pH, and soil enzymes, including acid and alkaline phosphatases and urease. We calculated topographic variables (elevation, aspect, and slope) at the 1 × 1 m and 20 × 20 m scales (Figure S2 and Figure 2) within the YFDP. The optimal number of habitats was determined by elbow and gap statistic methods using the fviz_nbclust function from factoextra package version 1.0.3 [47]. In the elbow method, a K-means clustering algorithm was run on the data set and the total within-cluster sum of square (WSS) was calculated. By plotting the WSS curve and number of clusters, the point of inflection on the curve was chosen as the optimal number of clusters. We verified the appropriate number of clusters using complementary methods (gap statistic and NbClust function). The hierarchical clustering was used to classify each quadrat within a plot into a habitat based on the environmental variables. Selective cuts across dendrogram were made to generate habitats based on the optimal number of habitats, which were determined by previous step. All analyses were performed in R version 3.4.3 [48].
We performed a species–habitat association test (torus translation) on species with ≥25 stems (stem density ≥1 stem/ha) (eleven species) (Table 2). This threshold for local abundance was applied to differentiate rare from abundant species [39,49]. The associations of stem abundance in 2019, basal area increment from 2014 to 2019, mortality from 2014 to 2019, and recruitment from 2014 to 2019 in these eleven species were assessed within 160 quadrats (20 × 20 m). The torus translation test was conducted by following the methods of Harms et al. [50]. This test calculates the observed abundance of each species in each habitat type and compares these observed values with abundance values obtained from simulated habitat maps. Simulated maps were generated by shifting the actual habitat map in four directions by 20-m increments, while the location of the stems did not change. A species was significantly positively (aggregated) or negatively (repelled) with a specific habitat type at (α = 0.05) if observed abundance was higher (lower) than at least 97.5% (or 2.5%) of the simulated abundance in simulated maps (Figure S3).

2.3. Principal Coordinates of Neighbor Matrices

Principal coordinates of neighbor matrices (PCNM) proposed by Bocard and Legendre [51] were used to model spatial variation. Generation of spatial variables was conducted using the pcnm function from the “vegan” package version 2.5-6 [52]. The distance between spatial data was represented as a Euclidean distance matrix. This method creates a set of spatial explanatory variables and determines significant variables based on the statistical responding of the response variable [53]. Data was normalized using the Hellinger transformation before PCNM analysis. The PCNM function provides negative and positive eigenvalues as predictors, but only positive eigenvalues were selected as explanatory variables.
The number of variables was reduced by selecting variables with a statistically significant contribution on variation of species abundance (α = 0.05) using forward selection with the ordistep function (999 permutations) [54]. The variation partitioning was conducted using the varpart function from the “vegan” package [52] to partition the explained proportions of variation in species composition by environmental and spatial variables. The significance of each component was tested using anova and rda functions from the “vegan” package.

3. Results

Most soil properties were not significantly correlated with topography (Supplementary material, Figure S4, Table S2). Hydraulic conductivity was slightly greater in unburned sites, but the difference between burned and unburned sites was not significant five years after fire (Figure 3).
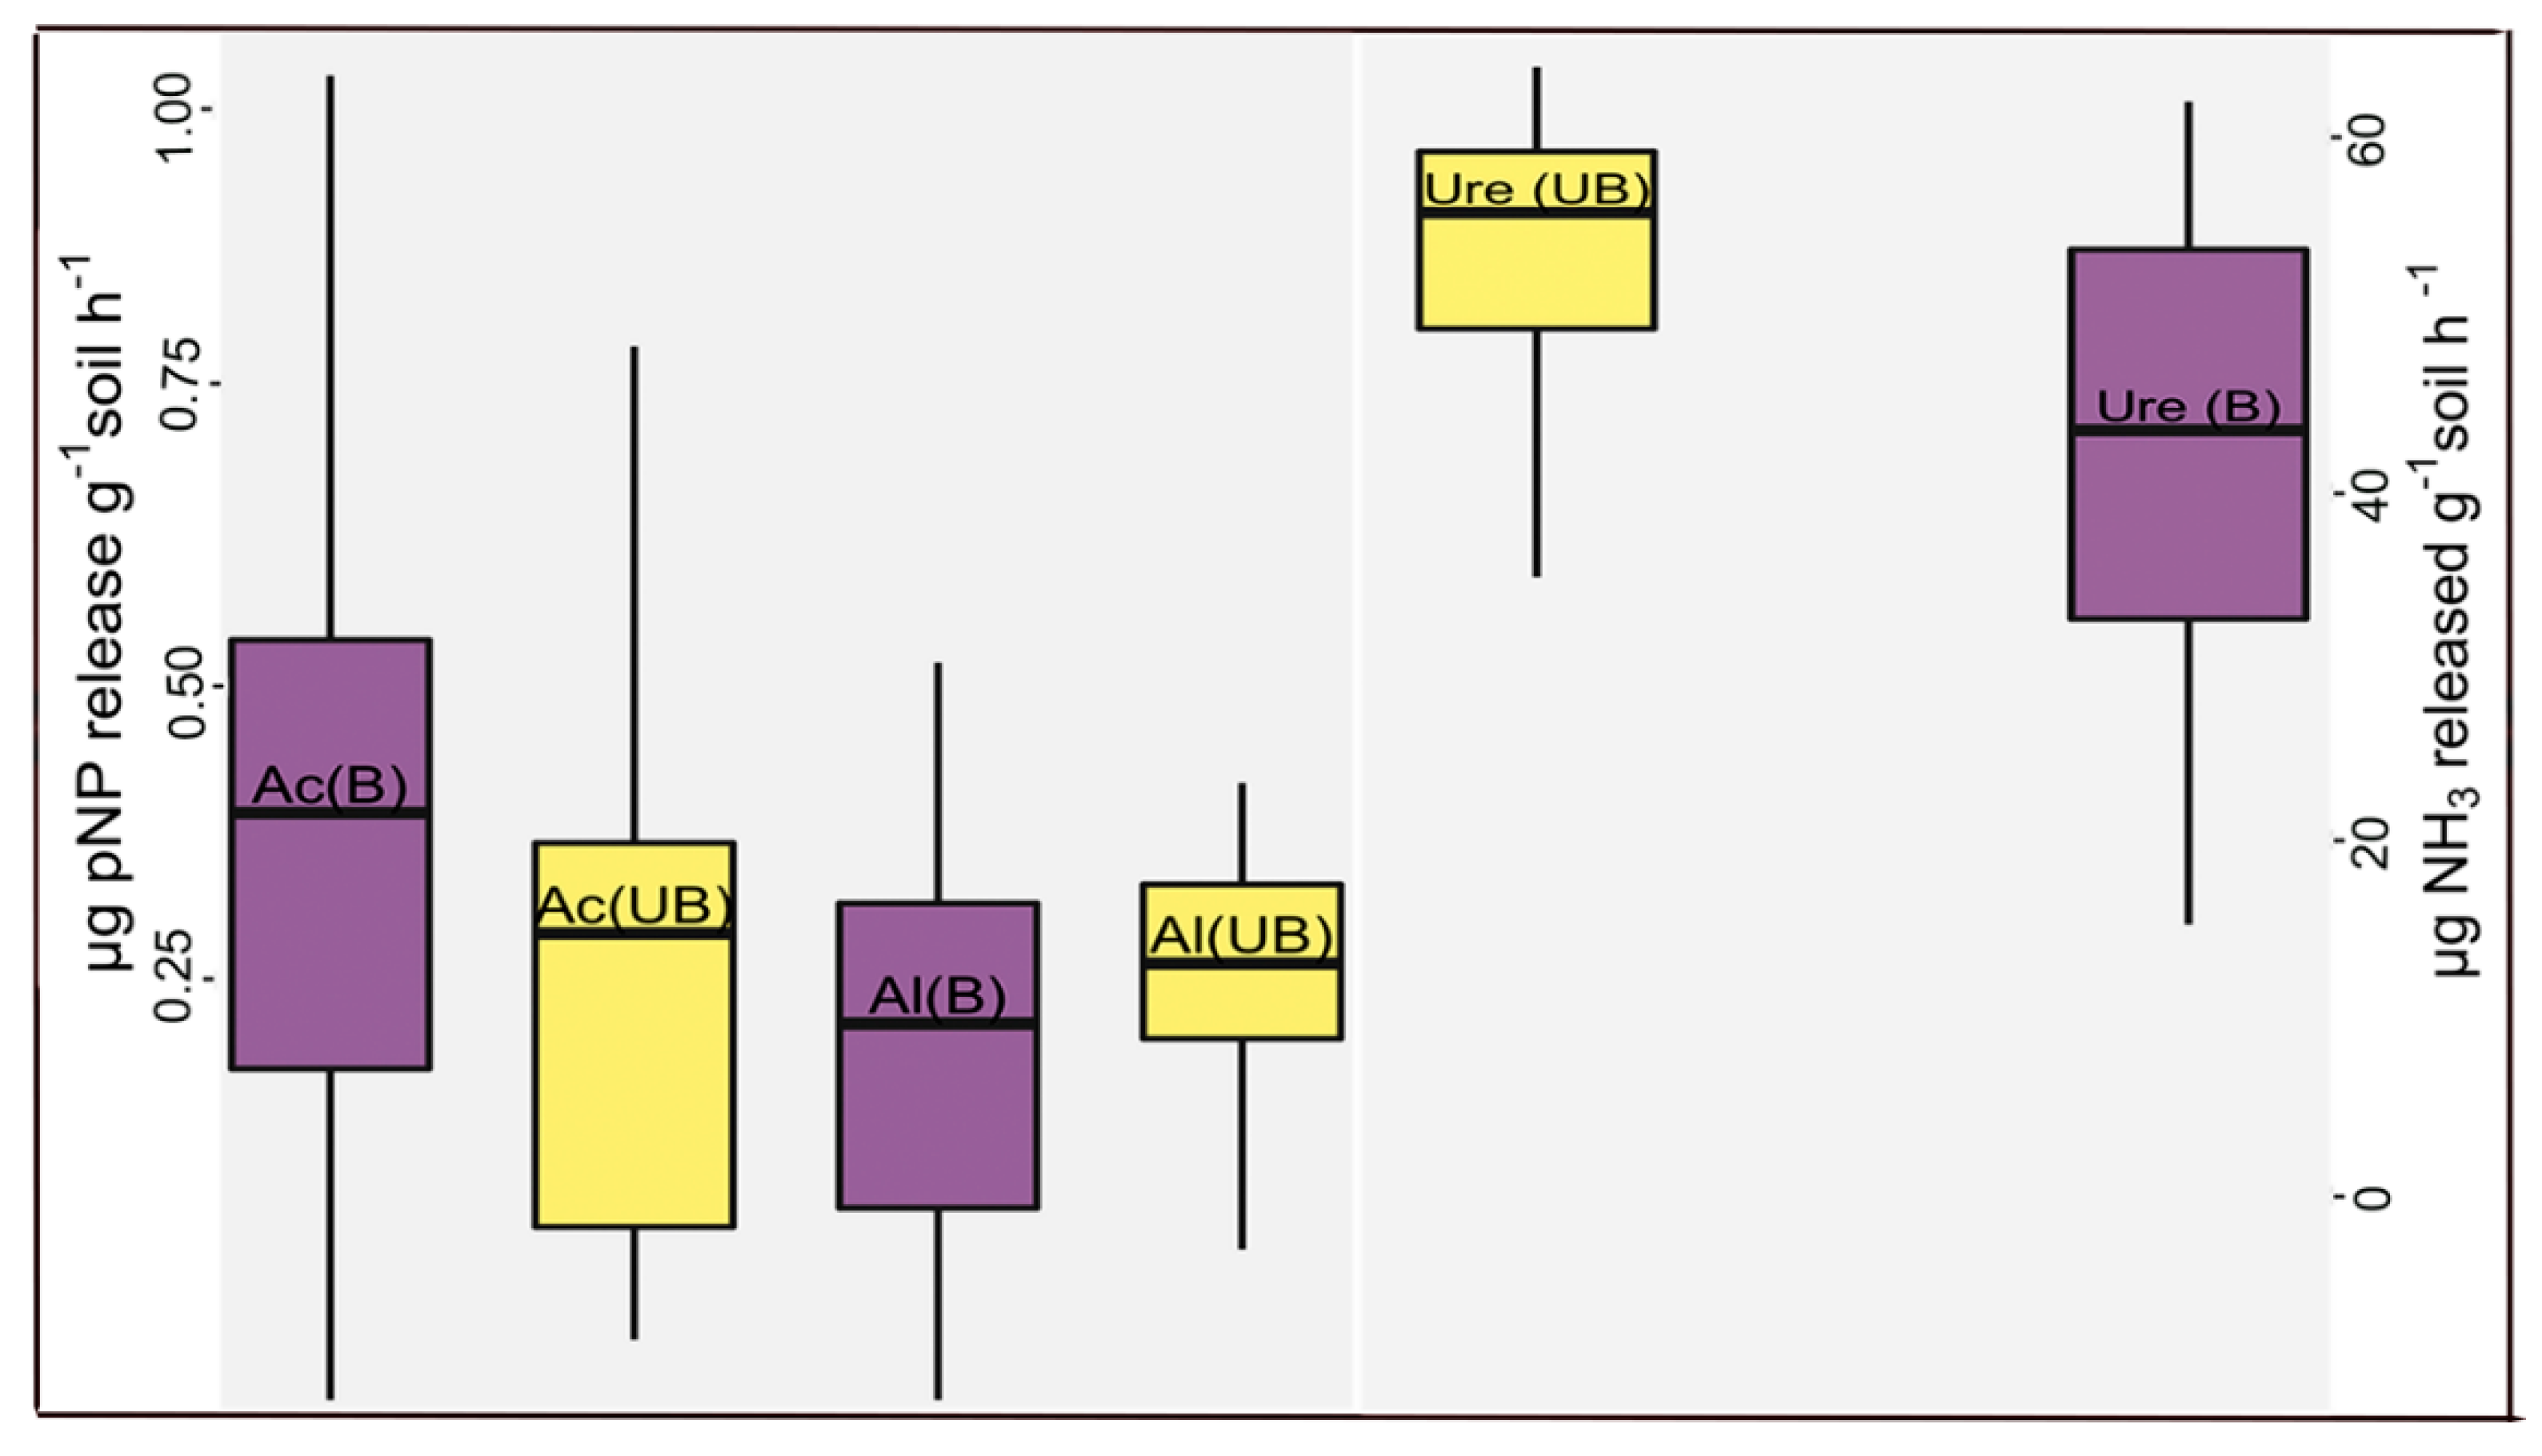
Differences in enzyme activity (urease, phosphatase, and alkaline phosphatase) between burned and unburned sites were only significant for urease five years after fire (p-value < 0.05) (Figure 4).
Hydraulic conductivity and alkaline phosphatase were added to our soil data as predictors, which resulted in a lower explained proportion of edaphic component in species demographic metrics, compared to those with consideration of two enzymes (acid phosphatase and urease) (Supplementary material, Figures S5 and S6 and Figure 6). The number of habitats as identified by the combination of the elbow method (Supplementary material, Figure S7), gap statistic, and the diagnostics of the NbClust package resulted in four and seven habitats based on the topographic (slope, elevation, and aspect) and eleven soil variables (eight soil chemical properties plus three soil enzyme activities) (Figure 5, Supplementary material, Figure S8, Table S3).
Among the eleven species, stem abundance of five species in 2019 (45.5% of stems) were negatively or positively associated with habitats (Table 2). The number of significantly associated species in habitats defined by soil variables was slightly greater compared to total number of species associated with habitatsdefined by topographic factors alone (6 versus 5). The total number of demographic metrics (basal area increment, mortality, and recruitment) of species associated with habitats were smaller than number of species abundance associated with habitats (one (9.1%), two (18.2%), and two (18.2%), respectively).
Only 27 PCNMs were selected to predict the variation in community composition. The adjusted cumulative square for all 27 PCNMs was 27.9% (Supplementary material, Table S4). The proportion of variance explained by spatial and environmental variables with and without soil enzymes as a predictor for stem abundance was 45% as opposed to 41%; for species basal area the increase was 10% vs. 7%; for species mortality 53% vs. 52%; and for species recruitment, 52% vs. 51%, respectively (Figure 6).
The variation explained by spatial variables alone was greater compared to other variables for stem abundance, mortality, and recruitment in the YFDP (Figure 6). The contributions of only the topographic component in species abundance, basal area increment, and mortality were decreased by removing soil enzymes data from edaphic predictors. Soil variables explained more variation than topographic variables in species abundance.

4. Discussion

4.1. Associations of Different Species with Habitat Types

About half of the species were positively (six species) or negatively (seven species) associated with specific habitats. Species that are positively associated with a specific habitat may be more competitive than the species that are negatively repelled or neutrally (no association with respect to habitat) associated with the same habitat [55]. Five species were associated with habitats defined by topographic variables. Slope is an important factor, likely due to its effect on water availability, especially during the dry seasons [50]. Aspect often plays a role in species composition [56], by influencing water potential, organic matter, irradiance availability at ground level, and the creation of different microclimates [57]. Generally, low-slope north-facing sites experienced cooler temperature, a lower solar radiation and evapotranspiration rate due to the lower exposure of sunlight, greater runoff water accumulation due to the deep soil [58], and a greater amount of organic matter. Abies concolor grows in the environment with heterogenous soil conditions and shows the best growth on a moderate slopes and level ground [59]. The abundance of Abies concolor showed positive association with the low slope. Consistent with those results, mortality of Abies concolor was negatively associated with north-facing, low slopes (observed mortality number from habitat map was <2.5% of the simulated mortality value from torus-translation). The importance of water availability as a restricting factor in Abies concolor development was also found by Laacke [59].
Recruitment of Cornus sericea was positively associated with habitat 1. The levels of P concentration and K were high in these habitats. However, this positive association may be related to other factors including the high soil moisture in this habitat and the proximity to high abundances of parent plants at moist sites (considerable reproduction for this species is vegetative). Quercus kelloggii mortality was positively associated with habitat 6, where phosphorus, calcium, and urease enzyme levels were high. This association could be created as a result of higher competition in habitats with greater nutrient sources, which could result in a greater number of observed mortalities. Basal area increment of Quercus kelloggii was positively associated with habitat 7, where phosphatase enzyme activity, Ca, K, and Mg were all high. Additionally, Quercus kelloggii basal area increment was negatively associated with habitat 5 where Ca, Mg, and phosphatase levels were the lowest among all habitats and P concentration was not high. Neba et al. [60] found that the addition of Mg resulted in a better height and diameter growth due to a better root growth and greater nutrient uptake from the soil. The important effect of P in dry matter production and basal area increment was also found by another study [61]. Increase in tree growth with the availability of Ca was presented by Baribault et al. [62]. In addition, a significant effect of Mg on stem diameter growth at breast height by increasing nutrient uptake was confirmed by other studies [63].
The habitat map created by edaphic variables produced a more heterogeneous pattern than a habitat map generated by topographic variables in this study (Figure 5). The result was a greater number of species associated with edaphically-defined habitats in comparison with the number of species associated with topographically-defined habitats. The greater number of species associated with habitats in a more complex habitat map (heterogeneous pattern) was supported by Borcard and Legendre [51].

4.2. Niche vs. Dispersal Limitation Drive Variations in Species Abundance and Basal Area Increment

The role of niche and dispersal limitation in shaping forest communities within the YFDP was investigated by partitioning the variation in species demographic metrics into different portions determined by edaphic, topographic, and spatial variables. The variance explained by purely spatial variables was attributed to dispersal-assembly and responses of species to the unmeasured environmental variation [64]. Although in general, variance partitioning analyses with observational data cannot distinguish unmeasured environmental variables and neutral processes [65], this analysis included a more comprehensive environmental dataset than that used by Legendre et al. [65], which considered topography as the principal environmental factor. We thus decreased the effect of unmeasured environmental variables in the pure spatial fraction. However, other unmeasured environmental variables (such as light availability, soil temperature, soil moisture, and competition in the local tree neighborhood) undoubtedly contribute to the community structure. Dispersal limitation has a strong potential to structure communities at fine scales, especially in species with a lower dispersal ability, whose seeds are dispersed close to their parents [66,67,68]. Spatial, topography, and soil resources (soil properties with and without enzymes) were all statistically significant in their contribution to species abundance (P = 0.01 and P = 0.03, respectively) and basal area increment (P = 0.02 and P = 0.03, respectively). Results showed that a large contribution (more than 30%) of total variation of species abundances was explained by spatial variables. The important effects of biotic processes such as dispersal, stochasticity process such as demographic stochasticity, and the weak effects of habitat filtering in structuring species composition at small scale (10 m to 20 m) were presented by Méndez-Toribio et al., Yuan et al., and Shipley et al. [58,69,70].
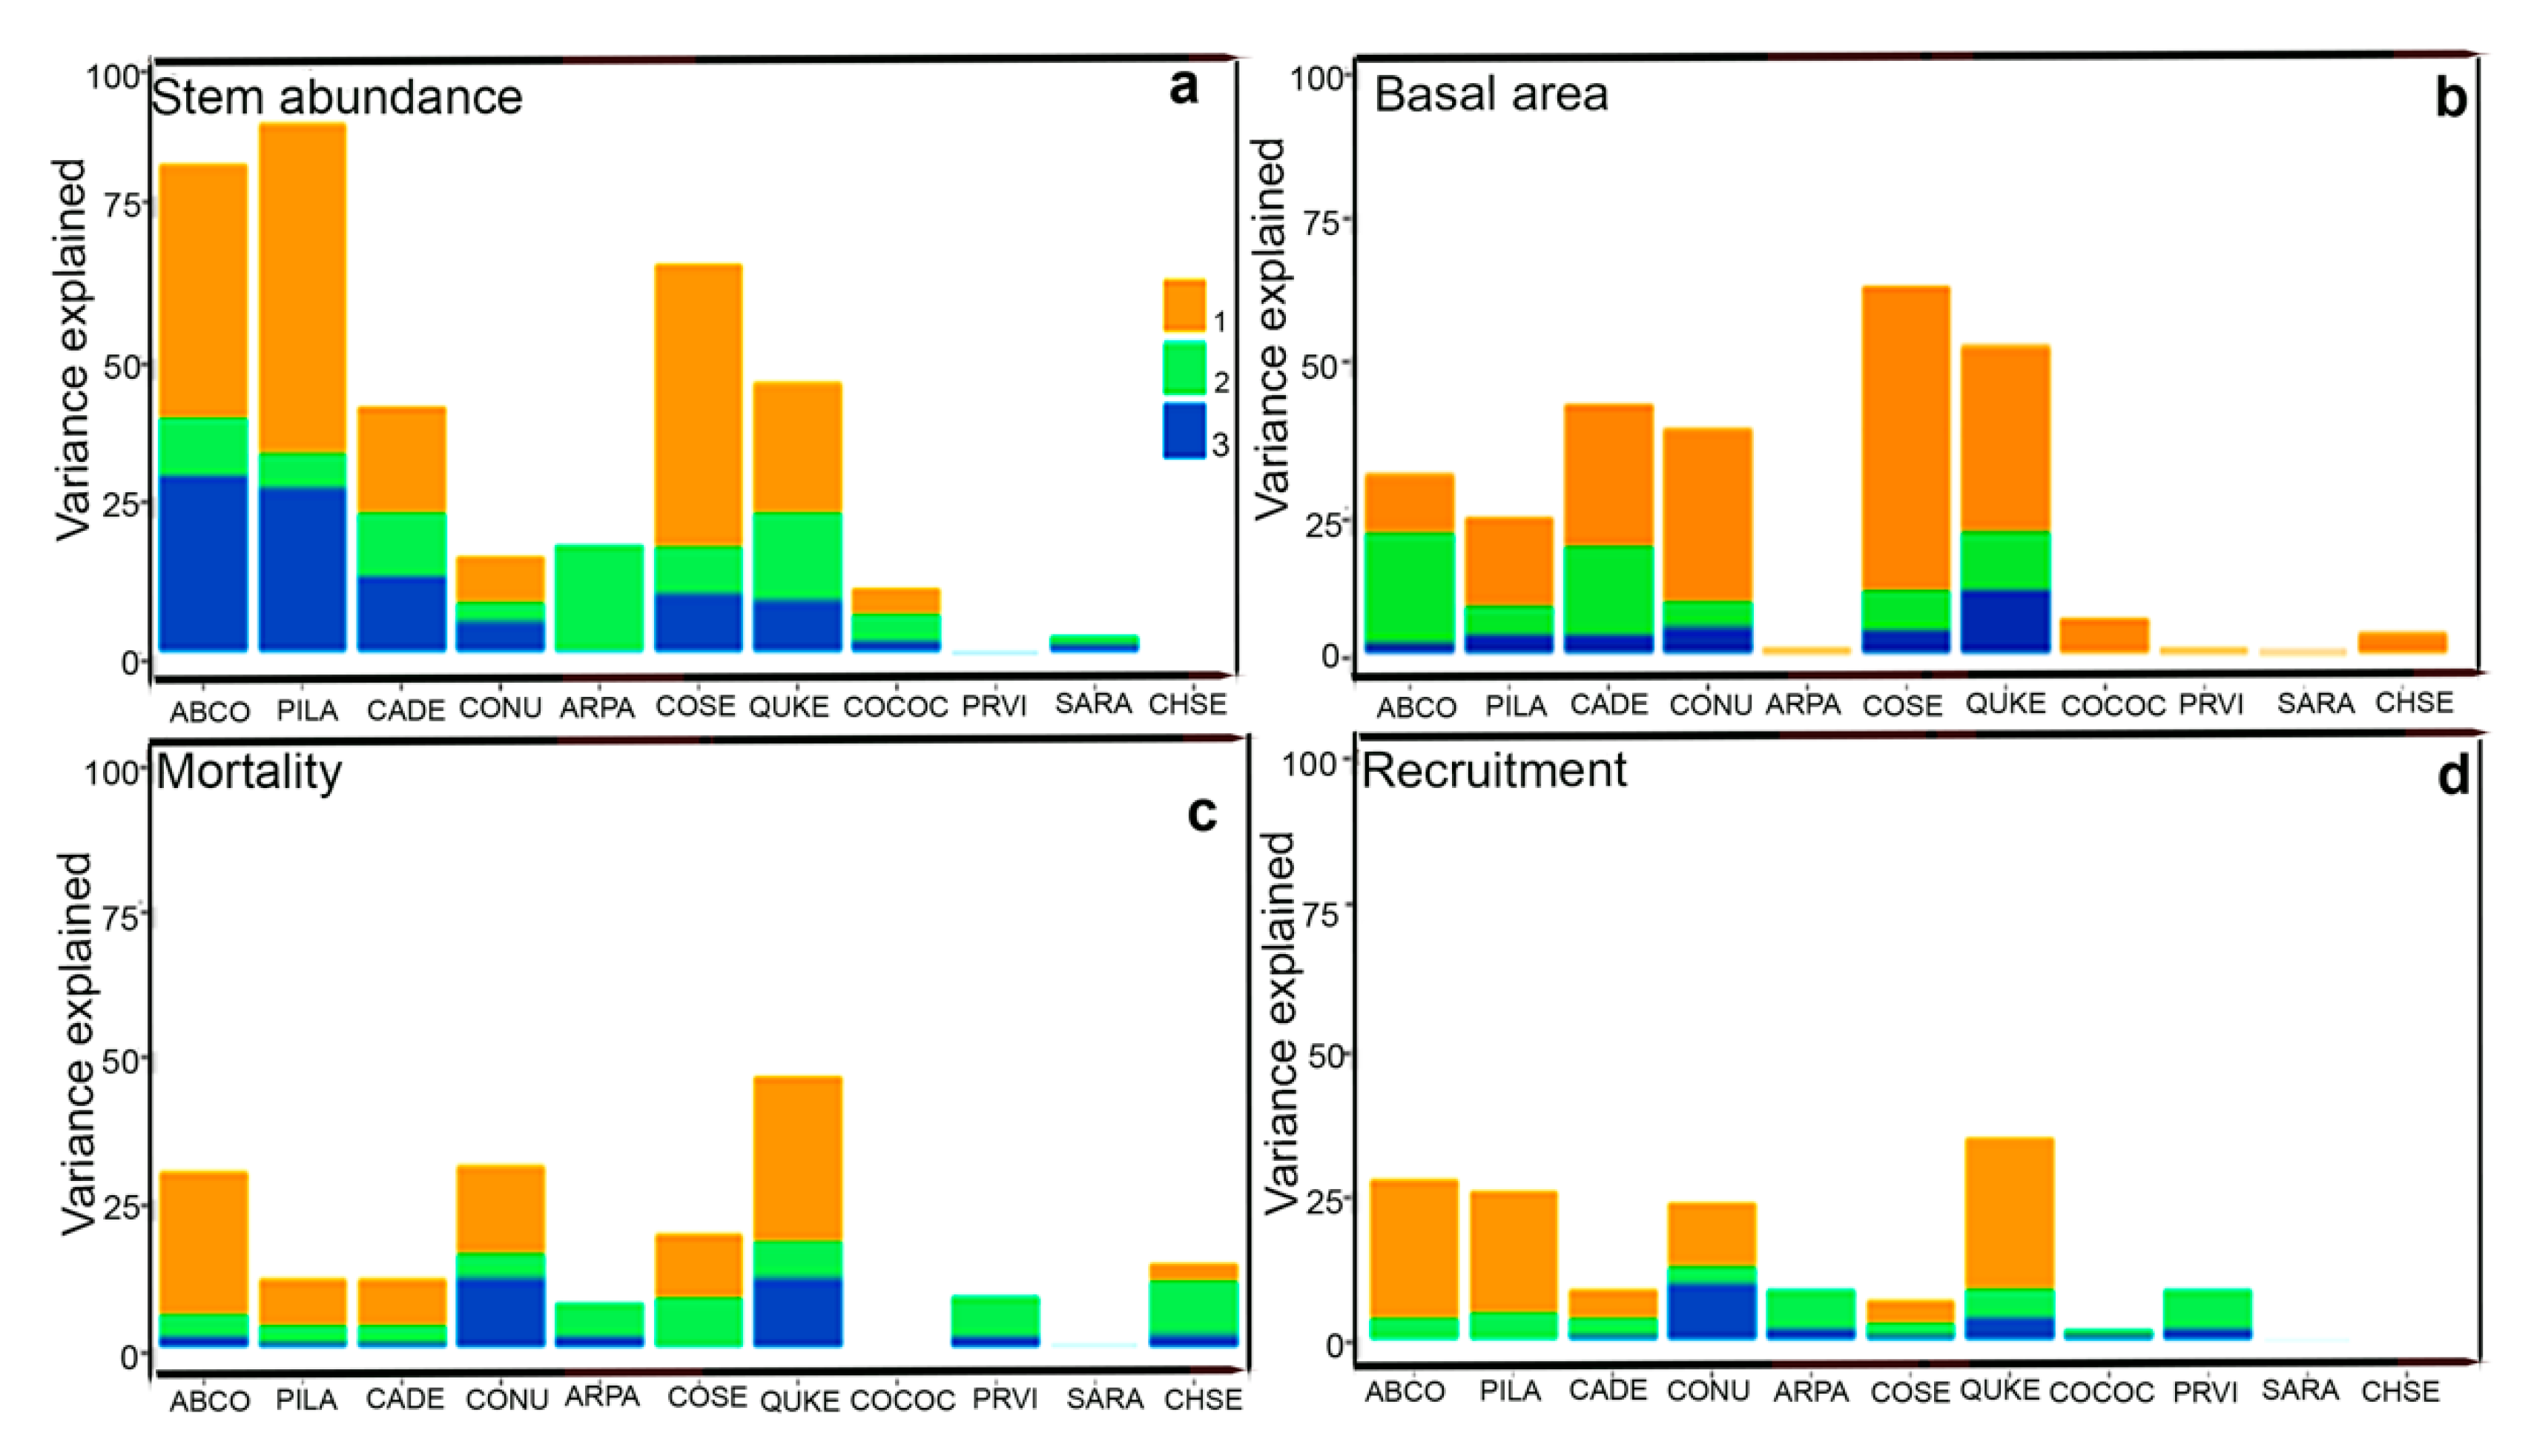
The incremental contribution of spatial and environmental factors varied among species (Tables S5 and S6). The variation in stem abundance explained by spatial variables was the highest for Pinus lambertiana, which has heavy seeds with small wings that could result in a shorter primary dispersal distances [71] (Figure 7). Abies concolor grows on a variety of soil conditions and pH levels. In addition to fire history, their abundance mostly depends on water availability and temperature [59], supporting the high contribution of topographic variables in explaining variation in Abies concolor stem abundance (Figure 7).

4.3. The Contribution of Environmental and Spatial Variables in Forming Mortality Abundances Across Species

Spatial and topographic variables were significant (P = 0.02) in their contribution to species mortality and not significant considering the effect of soil factors (soil properties with and without soil enzymes). The higher contribution of the spatial variables in explaining the variation of species mortality may be related to strong neighborhood competition in species with limited dispersal ability due to a higher density of small individuals near the parent tree [72]. As opposed to recruitment, mortality in old-growth forests is often due to insects; physical damage by wind, snow, other falling trees; disease; and intense neighborhood competition [73]. Furniss et al. [22] found that mortality following the fire was differentiated based on diameter class, and that large-diameter trees had higher survival rates than small-diameter trees. The changes in variation of species mortality explained by inclusion of soil enzymes into edaphic factors was marginal (1%). The negligible proportion of soil variables in explaining mortality indicates that soil variables are not differentiating factors for mortality in old-growth forests.
The variation in mortality explained by environmental and spatial components varied with species (Table S7). This could be related to soil nutrient availability [74,75]. The contribution of topographic variables was the highest for Cornus nuttallii, indicating the hydrological variations related to topography.

4.4. The Contribution of Environmental and Spatial Variables in Forming Ingrowth Numbers Across Species

Spatial and topographic variables were significant (P = 0.01) contributors to recruitment and not significant when considering soil factors (soil properties with and without soil enzymes) alone. The fraction of the spatial component in explaining variation of species recruitment was the highest among the other variables (Figure 6). This showed the principal role of seed availability (or vegetative propagation) in recruitment at a local scale [76]. The low contribution of environmental heterogeneity to recruitment may be related to the importance of other factors, such as fecundity, germination rates, and initial growth rates of large-seeded species [77,78]. It is likely that other soil properties including temperature, especially during the January to March, affect the survival rate of seedlings due to the susceptibility of young seedlings to low temperature [79]. In addition, other factors include litter layer depth, which may prevent seedling emergences in small-seeded species [79].
The contribution of environmental and spatial components in explaining recruitment changed with species (Table S8). The proportion of environmental variables was the lowest for Chrysolepis sempervirens, potentially due to the hypogeal germination [80], clonal nature of this species, and low sample size.

4.5. Edaphic Effects

Compared to topography, we found that soil variables explained a greater proportion of the variance in stem abundance (14% vs. 6%) within the YFDP (Figure 6), although the total explained variance was low. Lin et al. [68] found that edaphic properties explained more variation in species distribution compared to the topographic variables by having the direct effect on the plant growth at local scales [81]. Potassium, phosphorus, calcium [82], and micronutrient deficiency [83] can limit plant growth and function. We found that the distribution of 45.5% of species was associated with edaphic properties (Table 2), consistent with results showing that 40% of species distribution was associated with soil nutrients [84]. The association of species to soil properties can be related to the direct effect of species characteristics on soil nutrients inputs and uptake, which contribute to species–soil associations as a function of species abundance [85]. We included soil enzymes in the list of soil variables due to their key role in ecosystem dynamics and biochemical functioning through the decomposition of soil organic matter and release of nutrients such as nitrogen (urease enzyme), and phosphorus (phosphatase enzyme) [12] into the soil. Soil enzymes are sensitive to small changes that occur in the environment and catalyze many essential processes necessary for soil microorganisms’ life and affect the stabilization of soil structure. Their earlier response to soil disturbance compared to other soil quality indicators, made them an appropriate tool to evaluate the degree of soil alteration following fire. Soil enzyme activity showed a significant difference in urease activity between burned and unburned patches four years after fire occurrence (P = 0.01). This decrease may be related to the reduced microbial activity and biomass in the soil after fire. The decrease may also reflect the decreased soil pH in the burned microsites compared to the unburned patches (5.93 versus 7.07; P = 0.04). The long-term changes in soil acidity may affect microbial activity in burned sites and result in a higher release of urease in the unburned patches (higher pH) compared to those in the burned sites. Additionally, the reduced urease activity, which is the first hydrolytic enzyme involved in the breakdown of urea, may be related to the increase in non-hydrolysable N forms after fire [86,87].
We expected that the amount of inorganic N would have been higher (due to the activity of urease enzyme) in the unburned patches. However, there were no significant differences (P = 0.7) in NH4+ between the burned and unburned sites. This result may be related to the nutrient loss by leaching following the fire. Additionally, the availability of substrate (ammonium) to the nitrifying organisms may increase nitrification, which in turn leads to a decrease in the level of ammonium in the soil. Furthermore, the inclusion of soil enzyme activity improved (albeit by 5%) the explanatory power of soil properties in explaining variation in species stem abundance and basal area increment (Figure 6a–d). Soil enzymes (acid phosphatase and urease) alone were significant (P = 0.01) in their contribution to species abundance and basal area increment, even though the amounts of variation improvement explained by enzymes were small. The contribution of more explanatory variables (alkaline phosphatase and hydraulic conductivity shown in Figure S6) alone were not significant (P = 0.4) to species abundance and basal area increment.

5. Conclusions

The total number of species associated with habitats defined by soil properties was slightly greater than those associated with topographically-defined habitats. This finding suggests that niche partitioning caused by edaphic variables played a more important role compared to topographic variables in shaping species distributions. In addition, the contribution of spatial variables over topography and soil factors in explaining variation in species demographic metrics (stem abundance, mortality, and recruitment) indicates that community assembly was largely driven by spatially structured processes consistent with dispersal limitation and responses of species to the unmeasured environmental variables. Inclusion of two soil enzymes statistically improved predictions of species abundance and basal area increment, suggesting that future studies of soil enzymes may improve habitat definitions in forests. Adding soil enzymes to habitat definitions improved the explanatory power of edaphic variables to species abundance over the predictive ability of topography and soil nutrients alone. Species habitat associations and higher explanatory power of spatial factors compared to environmental variables suggest that both niche processes and dispersal limitations affect species distributions, but dispersal processes and unmeasured environmental variables were more important in the YFDP. The implication of a stronger contribution of neutral processes could reduce some concerns about the effects of increasing disturbance, decreasing habitat heterogeneity, and climate change on local species extinction in the future.

Supplementary Materials

The following are available online at https://www.mdpi.com/2571-6255/3/4/54/s1.

Author Contributions

Data curation, J.A.L.; Formal analysis, J.T. and J.A.L.; Methodology, J.T. and J.A.L.; Supervision, J.A.L.; Visualization, J.T.; Writing—original draft, J.T.; Writing—review & editing, J.A.L. All authors have read and agreed to the published version of the manuscript.

Funding

Funding was received from the Utah Agricultural Experiment Station (projects 1153 and 1398 to JAL).

Acknowledgments

Support was received from Utah State University, the Ecology Center at Utah State University, and the Utah Agricultural Experiment Station, which has designated this as journal paper 9332. We thank the field staff who collected data, each individually acknowledged at http://yfdp.org. We thank the managers and staff of Yosemite National Park for their logistical support.

Conflicts of Interest

The authors declare no conflict of interest.

References

  1. Potts, M.D.; Davies, S.J.; Bossert, W.H.; Tan, S.; Supardi, M.N. Habitat heterogeneity and niche structure of trees in two tropical rain forests. Oecologia 2004, 139, 446–453. [Google Scholar] [CrossRef] [PubMed]
  2. Keddy, P.A. Assembly and response rules: Two goals for predictive community ecology. J. Veg. Sci. 1992, 3, 157–164. [Google Scholar] [CrossRef] [Green Version]
  3. Zhang, Z.-h.; Hu, G.; Ni, J. Effects of topographical and edaphic factors on the distribution of plant communities in two subtropical karst forests, southwestern China. J. Mt. Sci. 2013, 10, 95–104. [Google Scholar] [CrossRef]
  4. Valencia, R.; Foster, R.B.; Villa, G.; Condit, R.; Svenning, J.C.; Hernández, C.; Romoleroux, K.; Losos, E.; Magård, E.; Balslev, H. Tree species distributions and local habitat variation in the Amazon: Large forest plot in eastern Ecuador. J. Ecol. 2004, 92, 214–229. [Google Scholar] [CrossRef]
  5. Kanagaraj, R.; Wiegand, T.; Comita, L.S.; Huth, A. Tropical tree species assemblages in topographical habitats change in time and with life stage. J. Ecol. 2011, 99, 1441–1452. [Google Scholar] [CrossRef]
  6. Griffiths, R.; Madritch, M.; Swanson, A. The effects of topography on forest soil characteristics in the Oregon Cascade Mountains (USA): Implications for the effects of climate change on soil properties. For. Ecol. Manag. 2009, 257, 1–7. [Google Scholar] [CrossRef]
  7. Seibert, J.; Stendahl, J.; Sørensen, R. Topographical influences on soil properties in boreal forests. Geoderma 2007, 141, 139–148. [Google Scholar] [CrossRef]
  8. Aandahl, A.R. The characterization of slope positions and their influence on the total nitrogen content of a few virgin soils of western Iowa. Soil Sci. Soc. Am. J. 1949, 13, 449–454. [Google Scholar] [CrossRef] [Green Version]
  9. Fu, B.; Liu, S.; Ma, K.; Zhu, Y. Relationships between soil characteristics, topography and plant diversity in a heterogeneous deciduous broad-leaved forest near Beijing, China. Plant Soil 2004, 261, 47–54. [Google Scholar] [CrossRef]
  10. Sherene, T. Role of soil enzymes in nutrient transformation: A review. Bio Bull. 2017, 3, 109–131. [Google Scholar]
  11. Burns, R. Extracellular enzyme-substrate interactions in soil. In Microbes in their Natural Environment; Slater, J.H., Wittenbury, R., Wimpenny, J.W.T., Eds.; Cambridge University Press: London, UK, 1983; pp. 249–298. [Google Scholar]
  12. Sinsabaugh, R.L.; Antibus, R.K.; Linkins, A.E. An enzymic approach to the analysis of microbial activity during plant litter decomposition. Agric. Ecosyst. Environ. 1991, 34, 43–54. [Google Scholar] [CrossRef]
  13. Bielińska, E.J.; Kołodziej, B.; Sugier, D. Relationship between organic carbon content and the activity of selected enzymes in urban soils under different anthropogenic influence. J. Geochem. Explor. 2013, 129, 52–56. [Google Scholar] [CrossRef]
  14. Siles, J.A.; Cajthaml, T.; Minerbi, S.; Margesin, R. Effect of altitude and season on microbial activity, abundance and community structure in Alpine forest soils. FEMS Microbiol. Ecol. 2016, 92. [Google Scholar] [CrossRef] [Green Version]
  15. Boerner, R.E.; Decker, K.L.; Sutherland, E.K. Prescribed burning effects on soil enzyme activity in a southern Ohio hardwood forest: A landscape-scale analysis. Soil Biol. Biochem. 2000, 32, 899–908. [Google Scholar] [CrossRef]
  16. Nannipieri, P.; Ceccanti, B.; Conti, C.; Bianchi, D. Hydrolases extracted from soil: Their properties and activities. Soil Biol. Biochem. 1982, 14, 257–263. [Google Scholar] [CrossRef]
  17. Lutz, J.A.; Matchett, J.R.; Tarnay, L.W.; Smith, D.F.; Becker, K.M.; Furniss, T.J.; Brooks, M.L. Fire and the distribution and uncertainty of carbon sequestered as aboveground tree biomass in Yosemite and Sequoia & Kings Canyon National Parks. Land 2017, 6, 10. [Google Scholar] [CrossRef] [Green Version]
  18. Meddens, A.J.; Kolden, C.A.; Lutz, J.A.; Smith, A.M.; Cansler, C.A.; Abatzoglou, J.T.; Meigs, G.W.; Downing, W.M.; Krawchuk, M.A. Fire refugia: What are they, and why do they matter for global change? BioScience 2018, 68, 944–954. [Google Scholar] [CrossRef]
  19. Page, N.V.; Shanker, K. Environment and dispersal influence changes in species composition at different scales in woody plants of the Western Ghats, India. J. Veg. Sci. 2018, 29, 74–83. [Google Scholar] [CrossRef] [Green Version]
  20. Beckage, B.; Clark, J.S. Seedling survival and growth of three forest tree species: The role of spatial heterogeneity. Ecology 2003, 84, 1849–1861. [Google Scholar] [CrossRef]
  21. Neumann, M.; Mues, V.; Moreno, A.; Hasenauer, H.; Seidl, R. Climate variability drives recent tree mortality in Europe. Glob. Chang. Biol. 2017, 23, 4788–4797. [Google Scholar] [CrossRef]
  22. Furniss, T.J.; Larson, A.J.; Kane, V.R.; Lutz, J.A. Multi-scale assessment of post-fire tree mortality models. Int. J. Wildland Fire 2019, 28, 46–61. [Google Scholar] [CrossRef]
  23. Furniss, T.J.; Kane, V.R.; Larson, A.J.; Lutz, J.A. Detecting tree mortality with Landsat-derived spectral indices: Improving ecological accuracy by examining uncertainty. Remote Sens. Environ. 2020, 237, 111497. [Google Scholar] [CrossRef]
  24. Lutz, J.A.; Larson, A.J.; Swanson, M.E.; Freund, J.A. Ecological importance of large-diameter trees in a temperate mixed-conifer forest. PLoS ONE 2012, 7, e36131. [Google Scholar] [CrossRef] [PubMed]
  25. Lutz, J.A. The evolution of long-term data for forestry: Large temperate research plots in an era of global change. Northwest Sci. 2015, 89, 255–269. [Google Scholar] [CrossRef]
  26. Anderson-Teixeira, K.J.; Davies, S.J.; Bennett, A.C.; Gonzalez-Akre, E.B.; Muller-Landau, H.C.; Joseph Wright, S.; Abu Salim, K.; Almeyda Zambrano, A.M.; Alonso, A.; Baltzer, J.L.; et al. CTFS-Forest GEO: A worldwide network monitoring forests in an era of global change. Glob. Chang. Biol. 2015, 21, 528–549. [Google Scholar] [CrossRef] [PubMed] [Green Version]
  27. Lutz, J.A.; van Wagtendonk, J.W.; Franklin, J.F. Climatic water deficit, tree species ranges, and climate change in Yosemite National Park. J. Biogeogr. 2010, 37, 936–950. [Google Scholar] [CrossRef]
  28. Keeler-Wolf, T.; Moore, P.; Reyes, E.; Menke, J.; Johnson, D.; Karavidas, D. Yosemite National Park vegetation classification and mapping project report. In Natural Resource Technical Report NPS/YOSE/NRTR—2012/598; National Park Service: Fort Collins, CO, USA, 2012. [Google Scholar]
  29. Soil Survey Staff, Natural Resources Conservation Service, United States Department of Agriculture. Web Soil Survey. Available online: http://websoilsurvey.sc.egov.usda.gov/ (accessed on 8 May 2018).
  30. Barth, M.A.; Larson, A.J.; Lutz, J.A. A forest reconstruction model to assess changes to Sierra Nevada mixed-conifer forest during the fire suppression era. For. Ecol. Manag. 2015, 354, 104–118. [Google Scholar] [CrossRef]
  31. Scholl, A.E.; Taylor, A.H. Fire regimes, forest change, and self-organization in an old-growth mixed-conifer forest, Yosemite National Park, USA. Ecol. Appl. 2010, 20, 362–380. [Google Scholar] [CrossRef]
  32. Stavros, E.N.; Tane, Z.; Kane, V.R.; Veraverbeke, S.; McGaughey, R.J.; Lutz, J.A.; Ramirez, C.; Schimel, D. Unprecedented remote sensing data over King and Rim megafires in the Sierra Nevada Mountains of California. Ecology 2016, 97, 3244. [Google Scholar] [CrossRef]
  33. Kane, V.R.; Cansler, C.A.; Povak, N.A.; Kane, J.T.; McGaughey, R.J.; Lutz, J.A.; Churchill, D.J.; North, M.P. Mixed severity fire effects within the Rim fire: Relative importance of local climate, fire weather, topography, and forest structure. For. Ecol. Manag. 2015, 358, 62–79. [Google Scholar] [CrossRef] [Green Version]
  34. Blomdahl, E.M.; Kolden, C.A.; Meddens, A.J.; Lutz, J.A. The importance of small fire refugia in the central Sierra Nevada, California, USA. For. Ecol. Manag. 2019, 432, 1041–1052. [Google Scholar] [CrossRef]
  35. Cansler, C.A.; Swanson, M.E.; Furniss, T.J.; Larson, A.J.; Lutz, J.A. Fuel dynamics after reintroduced fire in an old-growth Sierra Nevada mixed-conifer forest. Fire Ecol. 2019, 15, 16. [Google Scholar] [CrossRef] [Green Version]
  36. Larson, A.J.; Cansler, C.A.; Cowdery, S.G.; Hiebert, S.; Furniss, T.J.; Swanson, M.E.; Lutz, J.A. Post-fire morel (Morchella) mushroom abundance, spatial structure, and harvest sustainability. For. Ecol. Manag. 2016, 377, 16–25. [Google Scholar] [CrossRef]
  37. van Wagtendonk, J.W.; Lutz, J.A. Fire regime attributes of wildland fires in Yosemite National Park, USA. Fire Ecol. 2007, 3, 34–52. [Google Scholar] [CrossRef]
  38. Lutz, J.; Larson, A.; Swanson, M. Advancing fire science with large forest plots and a long-term multidisciplinary approach. Fire 2018, 1, 5. [Google Scholar] [CrossRef] [Green Version]
  39. Furniss, T.J.; Larson, A.J.; Lutz, J.A. Reconciling niches and neutrality in a subalpine temperate forest. Ecosphere 2017, 8, e01847. [Google Scholar] [CrossRef]
  40. Zhang, R. Determination of soil sorptivity and hydraulic conductivity from the disk infiltrometer. Soil Sci. Soc. Am. J. 1997, 61, 1024–1030. [Google Scholar] [CrossRef]
  41. Carsel, R.F.; Parrish, R.S. Developing joint probability distributions of soil water retention characteristics. Water Resour. Res. 1988, 24, 755–769. [Google Scholar] [CrossRef] [Green Version]
  42. Jönsson, U.; Rosengren, U.; Nihlgård, B.; Thelin, G. A comparative study of two methods for determination of pH, exchangeable base cations, and aluminum. Commun. Soil Sci. Plant Anal. 2002, 33, 3809–3824. [Google Scholar] [CrossRef]
  43. Dick, R.P. Methods of Soil Enzymology; Soil Science Society of America: Madison, WI, USA, 2020; pp. 154–196. [Google Scholar]
  44. Kandeler, E.; Gerber, H. Short-term assay of soil urease activity using colorimetric determination of ammonium. Biol. Fertil. Soils 1988, 6, 68–72. [Google Scholar] [CrossRef]
  45. Tabatabai, M.; Bremner, J. Use of p-nitrophenyl phosphate for assay of soil phosphatase activity. Soil Biol. Biochem. 1969, 1, 301–307. [Google Scholar] [CrossRef]
  46. Eivazi, F.; Tabatabai, M. Phosphatases in soils. Soil Biol. Biochem. 1977, 9, 167–172. [Google Scholar] [CrossRef]
  47. Kassambara, A.; Mundt, F. Package ‘Factoextra’. Extract and Visualize the Results of Multivariate Data Analyses. 2017, 76. Available online: https://cran.r-project.org/web/packages/factoextra/index.html (accessed on 23 September 2020).
  48. R Core Team. R: A Language and Environment for Statistical Computing; Version 3.4.3; R Core Team, R fundation for statistical Computing: Vienna, Austria, 2017. [Google Scholar]
  49. Pitman, N.C.; Terborgh, J.; Silman, M.R.; Nuñez, V.P. Tree species distributions in an upper Amazonian forest. Ecology 1999, 80, 2651–2661. [Google Scholar] [CrossRef]
  50. Harms, K.E.; Condit, R.; Hubbell, S.P.; Foster, R.B. Habitat associations of trees and shrubs in a 50-ha neotropical forest plot. J. Ecol. 2001, 89, 947–959. [Google Scholar] [CrossRef]
  51. Borcard, D.; Legendre, P. All-scale spatial analysis of ecological data by means of principal coordinates of neighbour matrices. Ecol. Model. 2002, 153, 51–68. [Google Scholar] [CrossRef]
  52. Oksanen, J.; Blanchet, F.G.; Kindt, R.; Legendre, P.; Minchin, P.R.; O’hara, R.; Simpson, G.L.; Solymos, P.; Stevens, M.H.H.; Wagner, H. Package ‘Vegan’. Community Ecology Package, Version 2013, 2. Available online: http://CRAN.R-project.org/package=vegan (accessed on 23 September 2020).
  53. Borcard, D.; Legendre, P.; Avois-Jacquet, C.; Tuomisto, H. Dissecting the spatial structure of ecological data at multiple scales. Ecology 2004, 85, 1826–1832. [Google Scholar] [CrossRef] [Green Version]
  54. Blanchet, F.G.; Legendre, P.; Borcard, D. Forward selection of explanatory variables. Ecology 2008, 89, 2623–2632. [Google Scholar] [CrossRef]
  55. Zhang, C.; Zhao, Y.; Zhao, X.; Gadow, K. Species-habitat associations in a northern temperate forest in China. Silva Fenn 2012, 46, 501–519. [Google Scholar] [CrossRef] [Green Version]
  56. Kutiel, P.; Lavee, H. Effect of slope aspect on soil and vegetation properties along an aridity transect. Isr. J. Plant Sci. 1999, 47, 169–178. [Google Scholar] [CrossRef]
  57. Punchi-Manage, R.; Getzin, S.; Wiegand, T.; Kanagaraj, R.; Savitri Gunatilleke, C.; Nimal Gunatilleke, I.; Wiegand, K.; Huth, A. Effects of topography on structuring local species assemblages in a Sri Lankan mixed dipterocarp forest. J. Ecol. 2013, 101, 149–160. [Google Scholar] [CrossRef]
  58. Méndez-Toribio, M.; Ibarra-Manríquez, G.; Navarrete-Segueda, A.; Paz, H. Topographic position, but not slope aspect, drives the dominance of functional strategies of tropical dry forest trees. Environ. Res. Lett. 2017, 12, 085002. [Google Scholar] [CrossRef]
  59. Laacke, R. Chapter Fir. In Silvics of North America; Burns, R., Honkala, B., Eds.; United States Department of Agriculture, Forest Service: Washington, DC, USA, 1990; Volume 1, pp. 36–46. [Google Scholar]
  60. Neba, G.A.; Newbery, D.M.; Chuyong, G.B. Limitation of seedling growth by potassium and magnesium supply for two ectomycorrhizal tree species of a Central African rain forest and its implication for their recruitment. Ecol. Evol. 2016, 6, 125–142. [Google Scholar] [CrossRef] [PubMed] [Green Version]
  61. Aydin, I.; Uzun, F. Nitrogen and phosphorus fertilization of rangelands affects yield, forage quality and the botanical composition. Eur. J. Agron. 2005, 23, 8–14. [Google Scholar] [CrossRef]
  62. Baribault, T.W.; Kobe, R.K.; Finley, A.O. Tropical tree growth is correlated with soil phosphorus, potassium, and calcium, though not for legumes. Ecol. Monogr. 2012, 82, 189–203. [Google Scholar] [CrossRef]
  63. Gagnon, J. Effect of magnesium and potassium fertilization on a 20-year-old red pine plantation. For. Chron. 1965, 41, 290–294. [Google Scholar] [CrossRef]
  64. Baldeck, C.A.; Harms, K.E.; Yavitt, J.B.; John, R.; Turner, B.L.; Valencia, R.; Navarrete, H.; Davies, S.J.; Chuyong, G.B.; Kenfack, D. Soil resources and topography shape local tree community structure in tropical forests. Proc. R. Soc. B Biol. Sci. 2013, 280, 20122532. [Google Scholar] [CrossRef]
  65. Legendre, P.; Mi, X.; Ren, H.; Ma, K.; Yu, M.; Sun, I.F.; He., F. Partitioning beta diversity in a subtropical broad-leaved forest of China. Ecology 2009, 90, 663–674. [Google Scholar] [CrossRef] [Green Version]
  66. Gilbert, B.; Lechowicz, M.J. Neutrality, niches, and dispersal in a temperate forest understory. Proc. Natl. Acad. Sci. USA 2004, 101, 7651–7656. [Google Scholar] [CrossRef] [Green Version]
  67. Girdler, E.B.; Barrie, B.T.C. The scale-dependent importance of habitat factors and dispersal limitation in structuring Great Lakes shoreline plant communities. Plant Ecol. 2008, 198, 211–223. [Google Scholar] [CrossRef]
  68. Lin, G.; Stralberg, D.; Gong, G.; Huang, Z.; Ye, W.; Wu, L. Separating the effects of environment and space on tree species distribution: From population to community. PLoS ONE 2013, 8, e56171. [Google Scholar] [CrossRef] [Green Version]
  69. Yuan, Z.; Gazol, A.; Wang, X.; Lin, F.; Ye, J.; Bai, X.; Li, B.; Hao, Z. Scale specific determinants of tree diversity in an old growth temperate forest in China. Basic Appl. Ecol. 2011, 12, 488–495. [Google Scholar] [CrossRef]
  70. Shipley, B.; Paine, C.T.; Baraloto, C. Quantifying the importance of local niche-based and stochastic processes to tropical tree community assembly. Ecology 2012, 93, 760–769. [Google Scholar] [CrossRef] [PubMed] [Green Version]
  71. Kinloch, B.B.; Scheuner, W.H. Chapter Sugar Pine. In Silvics of North America; Burns, R., Honkala, B., Eds.; United States Department of Agriculture, Forest Service: Washington, DC, USA, 1990; Volume 1, pp. 370–379. [Google Scholar]
  72. Ma, L.; Lian, J.; Lin, G.; Cao, H.; Huang, Z.; Guan, D. Forest dynamics and its driving forces of sub-tropical forest in South China. Sci. Rep. 2016, 6, 22561. [Google Scholar] [CrossRef] [PubMed] [Green Version]
  73. Larson, A.J.; Lutz, J.A.; Donato, D.C.; Freund, J.A.; Swanson, M.E.; HilleRisLambers, J.; Sprugel, D.G.; Franklin, J.F. Spatial aspects of tree mortality strongly differ between young and old-growth forests. Ecology 2015, 96, 2855–2861. [Google Scholar] [CrossRef] [PubMed] [Green Version]
  74. Davies, S.J. Tree mortality and growth in 11 sympatric Macaranga species in Borneo. Ecology 2001, 82, 920–932. [Google Scholar] [CrossRef]
  75. Bazzaz, F. The physiological ecology of plant succession. Annu. Rev. Ecol. Syst. 1979, 10, 351–371. [Google Scholar] [CrossRef] [Green Version]
  76. Eriksson, O. Seedling recruitment in deciduous forest herbs: The effects of litter, soil chemistry and seed bank. Flora 1995, 190, 65–70. [Google Scholar] [CrossRef]
  77. Dalling, J.W.; Hubbell, S.P. Seed size, growth rate and gap microsite conditions as determinants of recruitment success for pioneer species. J. Ecol. 2002, 90, 557–568. [Google Scholar] [CrossRef]
  78. Vera, M. Effects of altitude and seed size on germination and seedling survival of heathland plants in north Spain. Plant Ecol. 1997, 133, 101–106. [Google Scholar] [CrossRef]
  79. Dzwonko, Z.; Gawroński, S. Influence of litter and weather on seedling recruitment in a mixed oak–pine woodland. Ann. Bot. 2002, 90, 245–251. [Google Scholar] [CrossRef]
  80. Baraloto, C.; Forget, P.M. Seed size, seedling morphology, and response to deep shade and damage in neotropical rain forest trees. Am. J. Bot. 2007, 94, 901–911. [Google Scholar] [CrossRef] [PubMed] [Green Version]
  81. Holdridge, L.R. Determination of world plant formations from simple climatic data. Science 1947, 105, 367–368. [Google Scholar] [CrossRef] [PubMed]
  82. Naples, B.K.; Fisk, M.C. Belowground insights into nutrient limitation in northern hardwood forests. Biogeochemistry 2010, 97, 109–121. [Google Scholar] [CrossRef]
  83. Fay, P.A.; Prober, S.M.; Harpole, W.S.; Knops, J.M.; Bakker, J.D.; Borer, E.T.; Lind, E.M.; MacDougall, A.S.; Seabloom, E.W.; Wragg, P.D. Grassland productivity limited by multiple nutrients. Nat. Plants 2015, 1, 1–5. [Google Scholar] [CrossRef]
  84. John, R.; Dalling, J.W.; Harms, K.E.; Yavitt, J.B.; Stallard, R.F.; Mirabello, M.; Hubbell, S.P.; Valencia, R.; Navarrete, H.; Vallejo, M. Soil nutrients influence spatial distributions of tropical tree species. Proc. Natl. Acad. Sci. USA 2007, 104, 864–869. [Google Scholar] [CrossRef] [Green Version]
  85. Gleason, S.M.; Read, J.; Ares, A.; Metcalfe, D.J. Species–soil associations, disturbance, and nutrient cycling in an Australian tropical rainforest. Oecologia 2010, 162, 1047–1058. [Google Scholar] [CrossRef]
  86. Hernández, T.; Garcia, C.; Reinhardt, I. Short-term effect of wildfire on the chemical, biochemical and microbiological properties of Mediterranean pine forest soils. Biol. Fertil. Soils 1997, 25, 109–116. [Google Scholar] [CrossRef]
  87. Xue, L.; Li, Q.; Chen, H. Effects of a wildfire on selected physical, chemical and biochemical soil properties in a Pinus massoniana forest in South China. Forests 2014, 5, 2947–2966. [Google Scholar] [CrossRef] [Green Version]
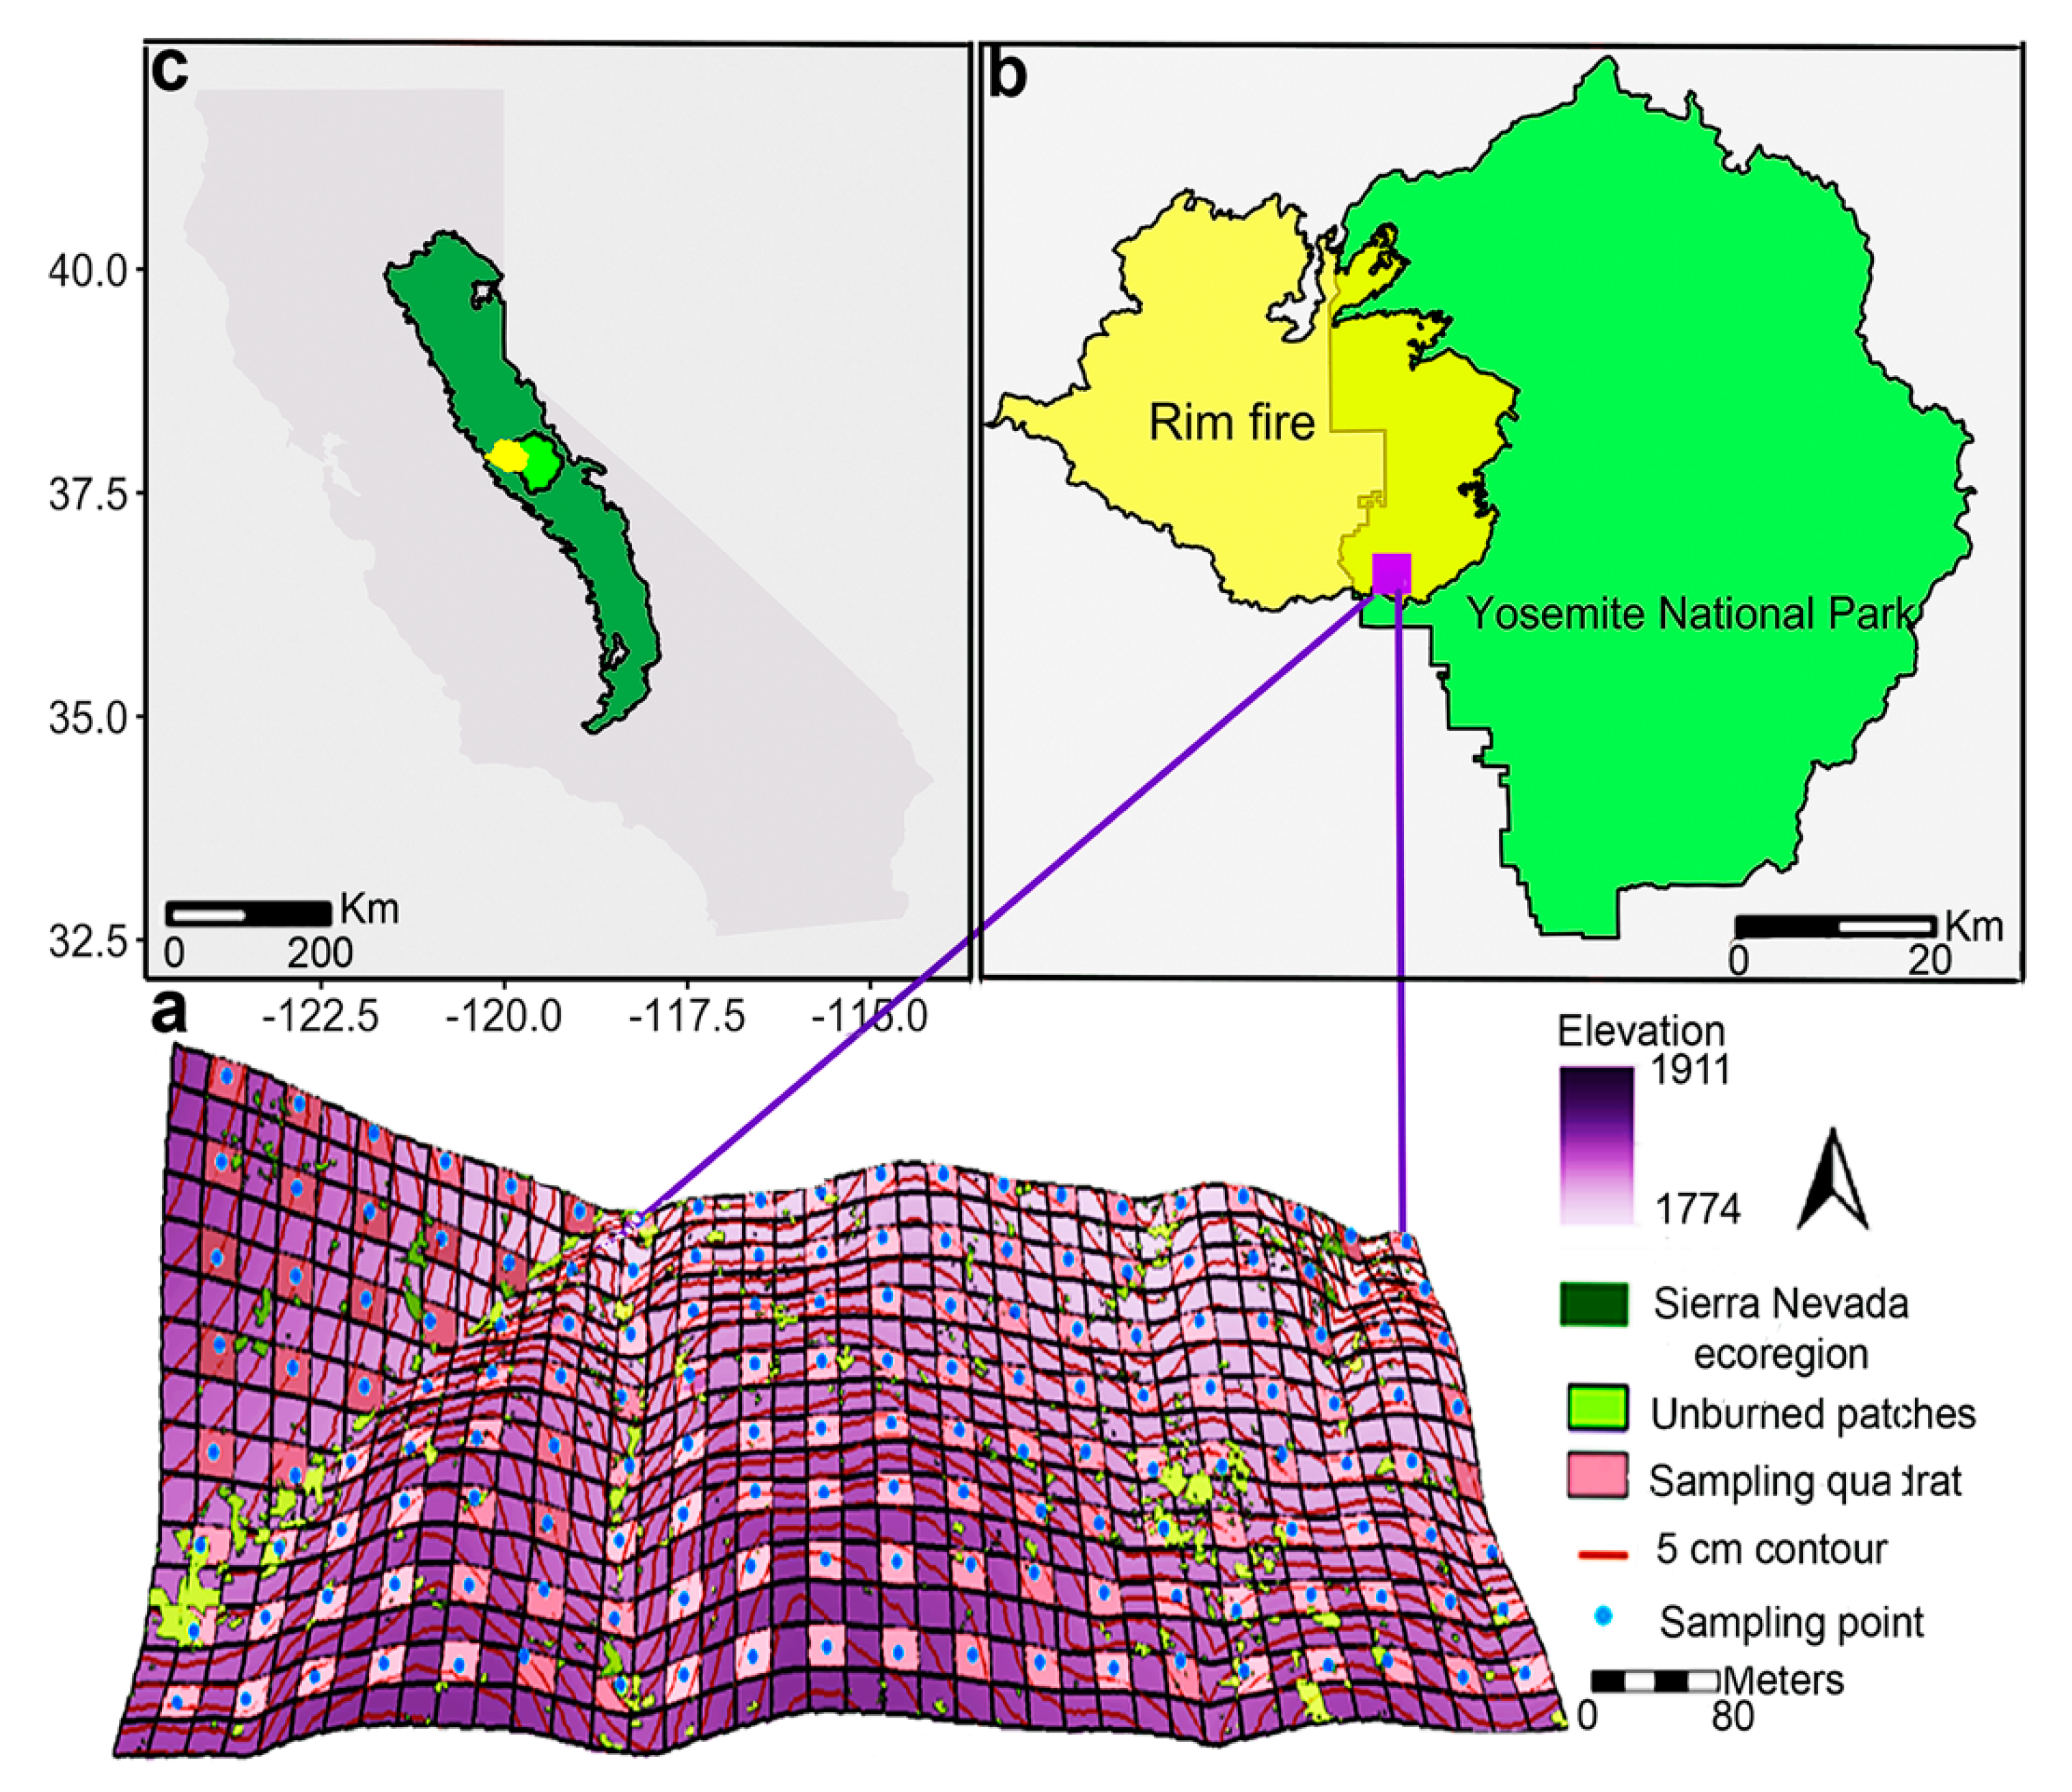
Figure 1. Location of Yosemite Forest Dynamic Plot (YFDP, 25.6 ha; 320 × 800 m) (a) in Yosemite National Park (b), California (c). The unburned patches ≥1 m2 (following the Rim fire in 2013) include a total area 12,597 m2 throughout the YFDP.
Fire 03 00054 g001
Figure 2. Slope (a) and aspect (b) at the scale of 20 × 20 m in the Yosemite Forest Dynamic Plot (25.6 ha), California, USA.
Fire 03 00054 g002
Figure 3. Hydraulic conductivity between burned site and unburned patches in the Yosemite Forest Dynamics Plot. Differences in hydraulic conductivity were non-significant (p-value > 0.05) between burned and unburned.
Fire 03 00054 g003
Figure 4. Comparison of the soil enzyme activity of acid phosphatases (Ac), alkaline phosphatases (Al), and urease (Ure) between burned (B) and unburned (UB) sites within the Yosemite Forest Dynamics Plot. Differences were significant (p-value ≤ 0.05) only for urease. Box plots based on the first quartile, median (segment inside the box), and third quartile. Location of minimum and maximum data were shown in the first point below the box and last point above the box, respectively. Units are µg p-nitrophenol and µg NH3 released g−1 soil h−1.
Fire 03 00054 g004
Figure 5. Topographic habitat types (a) and habitat map derived from soil properties (b) at a scale of 20 × 20 m in the Yosemite Forest Dynamics Plot. Every other quadrat was assigned to a specific habitat, and the unassigned quadrats were removed from the analysis. “HS” and “LS” indicate high and low slope in habitats. “North” and “south” show north or south facing habitats.
Fire 03 00054 g005
Figure 6. Variation partitioning of 11 live species with ≥ 25 stems in the Yosemite Forest Dynamics Plot. The numbers correspond to the proportion of variations explained by spatial, edaphic (chemical properties with and without acid phosphatase and urease enzymes), and topographic variables in species stem abundance with (a) and without enzymes (b); basal area increment with (c) and without enzymes (d); mortality with (e) and without enzymes (f); and recruitment with (g) and without enzymes (h). Negative values of explained variation were not shown in the figures (unlabeled regions).
Fire 03 00054 g006
Figure 7. Graphs show the contribution of spatial, soil, and topographic variables with respect to each species stem abundance in 2019 (a), basal area increment in species (between 2014 to 2019) (b), mortality (between 2014 to 2019) (c), and recruitment (between 2014 to 2019) (d) in each quadrat (400 m2) within the Yosemite Forest Dynamic Plot. 1 = the pure spatial component; 2 = the proportion explained by soil variables; 3 = the proportion explained by topographic variables.
Fire 03 00054 g007
Table 1. Total number of live stems, basal area (BA, m2/ha), and basal area increment (BAI, m2/ha) of eleven species with 25 stems (dbh ≥ 1 cm) in the Yosemite Forest Dynamic Plot (25.6 ha) from 2014 to 2019. Number of stems and basal area increment (BAI) between 2014 and 2019 were calculated for those stems in 2014 that survived through 2019.
201420192014–2019
SpeciesStems
≥ 1 cm
DBH
Stems
≥ 60 cm
DBH
BA
≥ 1 cm
DBH
BA
≥ 60 cm
DBH
Stems
≥ 1 cm
DBH
Stems
≥ 60 cm
DBH
BA
≥ 1 cm
DBH
BA
≥ 60 cm
BDH
BAI
≥ 1 cm
DBH
BAI
≥ 60 cm
DBH
Abies concolor281540315.258.56281542015.898.920.640.36
Pinus lambertiana85539815.2913.7785540915.6714.170.380.4
Cornus nuttallii439 0.06 439 0.07 0.01
Calocedrus decurrens440853.412.52440893.502.590.090.07
Quercus kelloggii27810.480.0127810.510.010.03t
Arctostaphylos patula 82 t t
Cornus sericea11 t 11 t t
Corylus cornuta var. californica 275 t t
Prunus virginiana2 t 2 t t
Sambucus racemosa 35 t t
Chrysolepis sempervirens 36 t t
Table 2. Results of torus-translation test of abundance in 2019 (stems per 400 m2), basal area increment (per 400 m2) (BAI), mortality numbers (per 400 m2), and recruitment numbers (per 400 m2) of eleven species with greater than 25 stems in the Yosemite Forest Dynamic Plot (25.6 ha), California. Ingrowth and mortality numbers show annually compounded numbers and increment of diameter growth at breast height was calculated between 2014 and 2019. Habitats defined by topographic variables (HSN: High Slope North facing, HSS: High Slope South facing, LSS: Low Slope South facing) and soil variables (h1: h7). The symbol “+” indicates positive association; “-” indicates negative association.
TopographyEdaphic
SpeciesDensity (stems ha−1)Stems ≥ 1 cm dbhAbundance BAIMortalityRecruit.AbundanceBAIMortalityRecruit.
Abies concolor111.82862LSN+ LSN- h3+
Quercus kelloggii50.11282 h3-h7+/h5-h6+
Pinus lambertiana33.5857LSN+/LSS- h3+/h7-
Cornus nuttallii32817LSN-
Calocedrus decurrens17.6450LSN- h7+/h5-
Corylus cornuta var. californica10.7275 h6+/h2-
Cornus sericea9.8252 HSS/HSN- h1+
Arctostaphylos patula34.582
Chrysolepis sempervirens1.436
Sambucus racemosa1.435
Prunus virginiana125