A Multipollutant Smoke Emissions Sensing and Sampling Instrument Package for Unmanned Aircraft Systems: Development and Testing


 ,
,  ,
,  , and
, and
Abstract
:1. Introduction
2. Materials and Methods
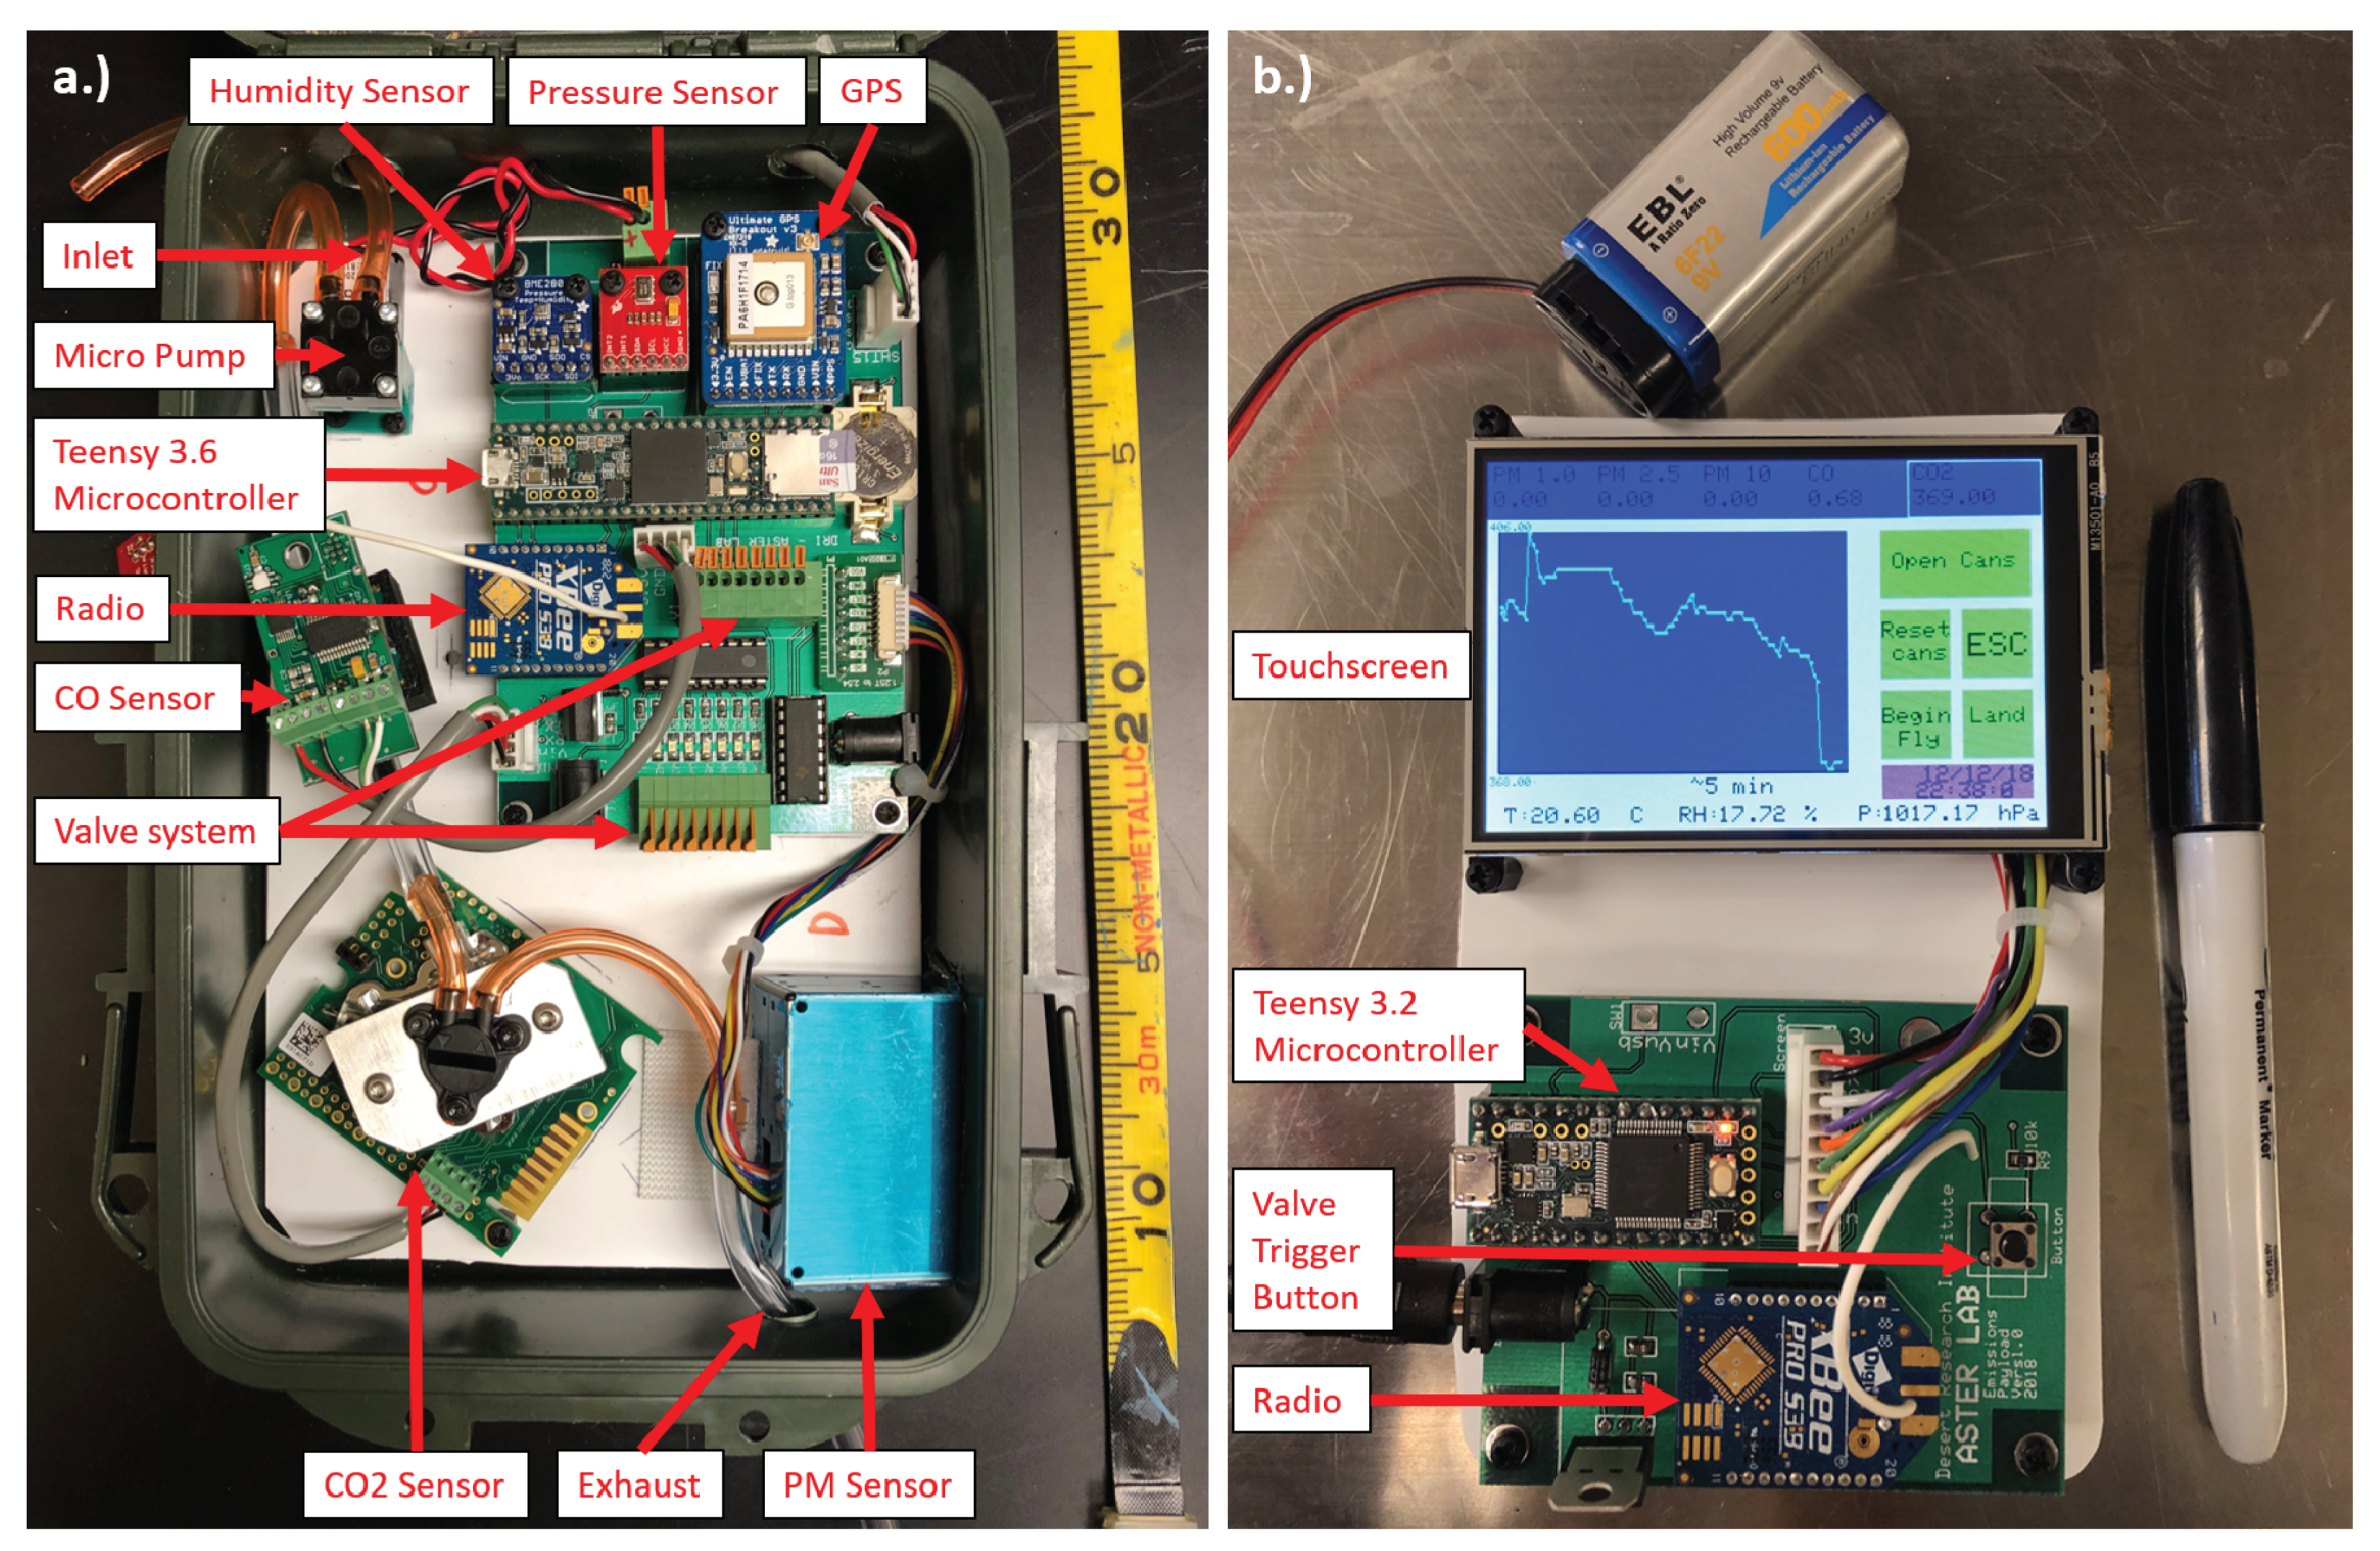
2.1. Instrument Components
2.1.1. Teensy 3.6/3.2 Microcontroller Units
2.1.2. K-30 Carbon Dioxide Sensor
2.1.3. DGS-CO 968-034 Carbon Monoxide Sensor
2.1.4. PMS5003 Particulate Matter Sensor
2.1.5. Global Positioning System (GPS)
2.1.6. BME 280 Humidity Sensor
2.1.7. SHT-15 Temperature Sensor
2.1.8. MPL3115A2 Pressure Sensor
2.1.9. Micropump
2.1.10. XBee Pro S3B Radio Module
2.1.11. Adafruit Featherwing Touch Screen
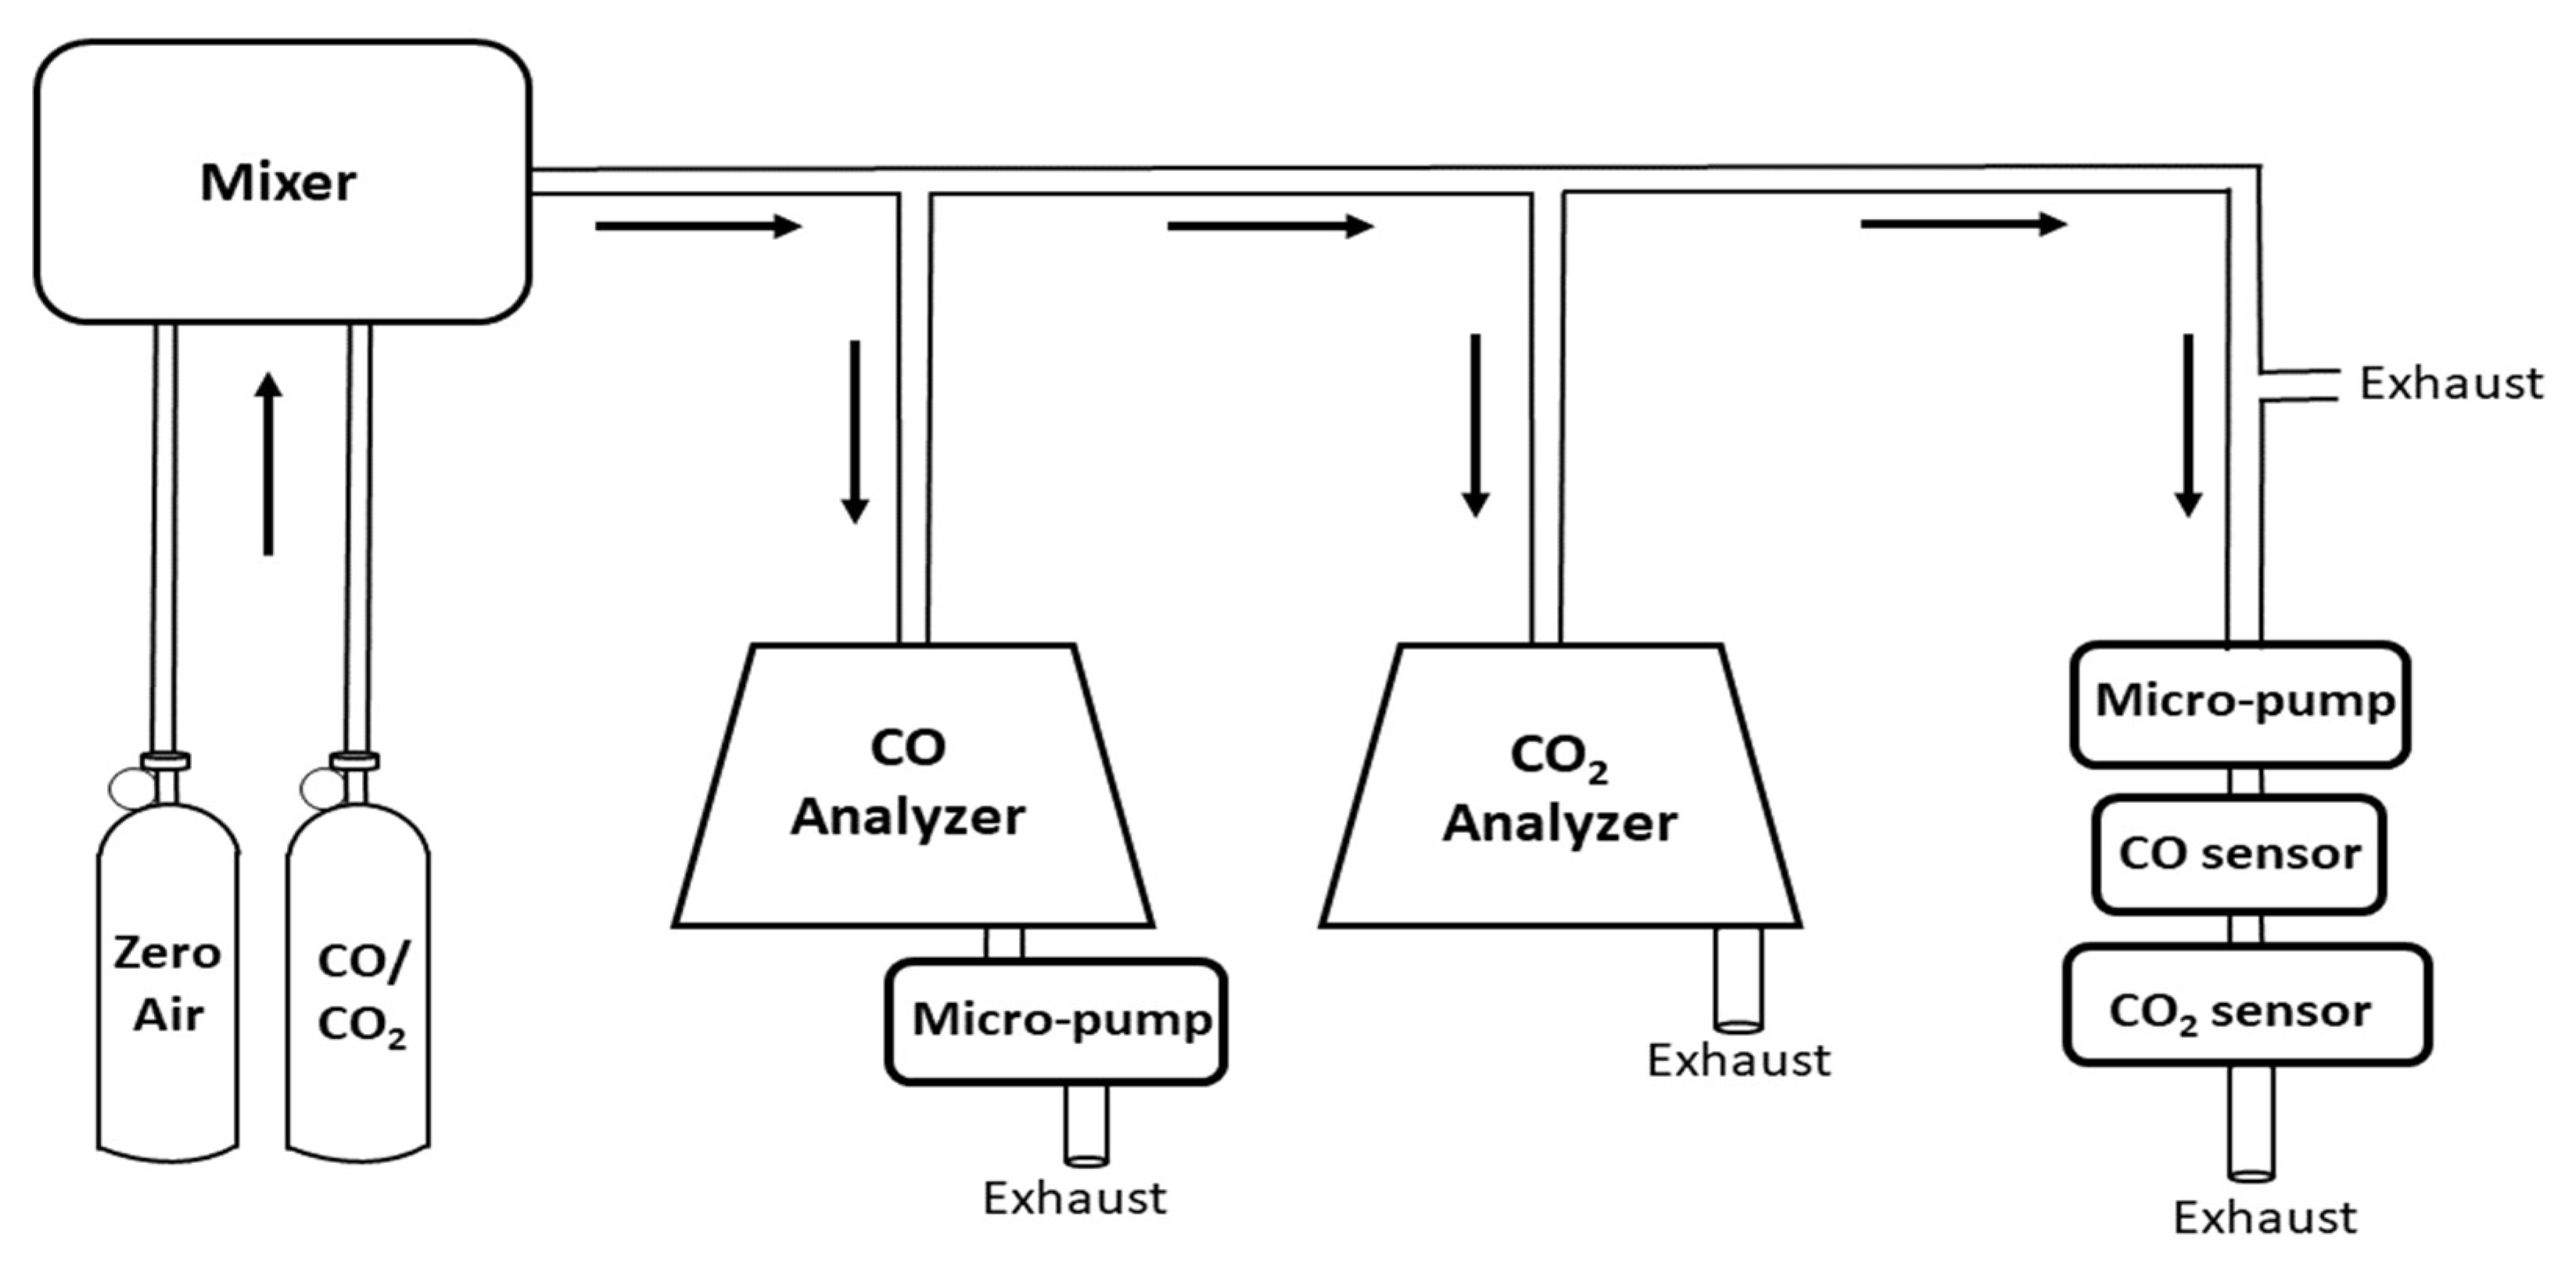
2.2. Instrument Performance Experiments
2.3. Field Testing
2.3.1. Tall Timbers Research Station, FL, USA
2.3.2. Sycan Marsh Preserve, OR, USA
3. Results and Discussion
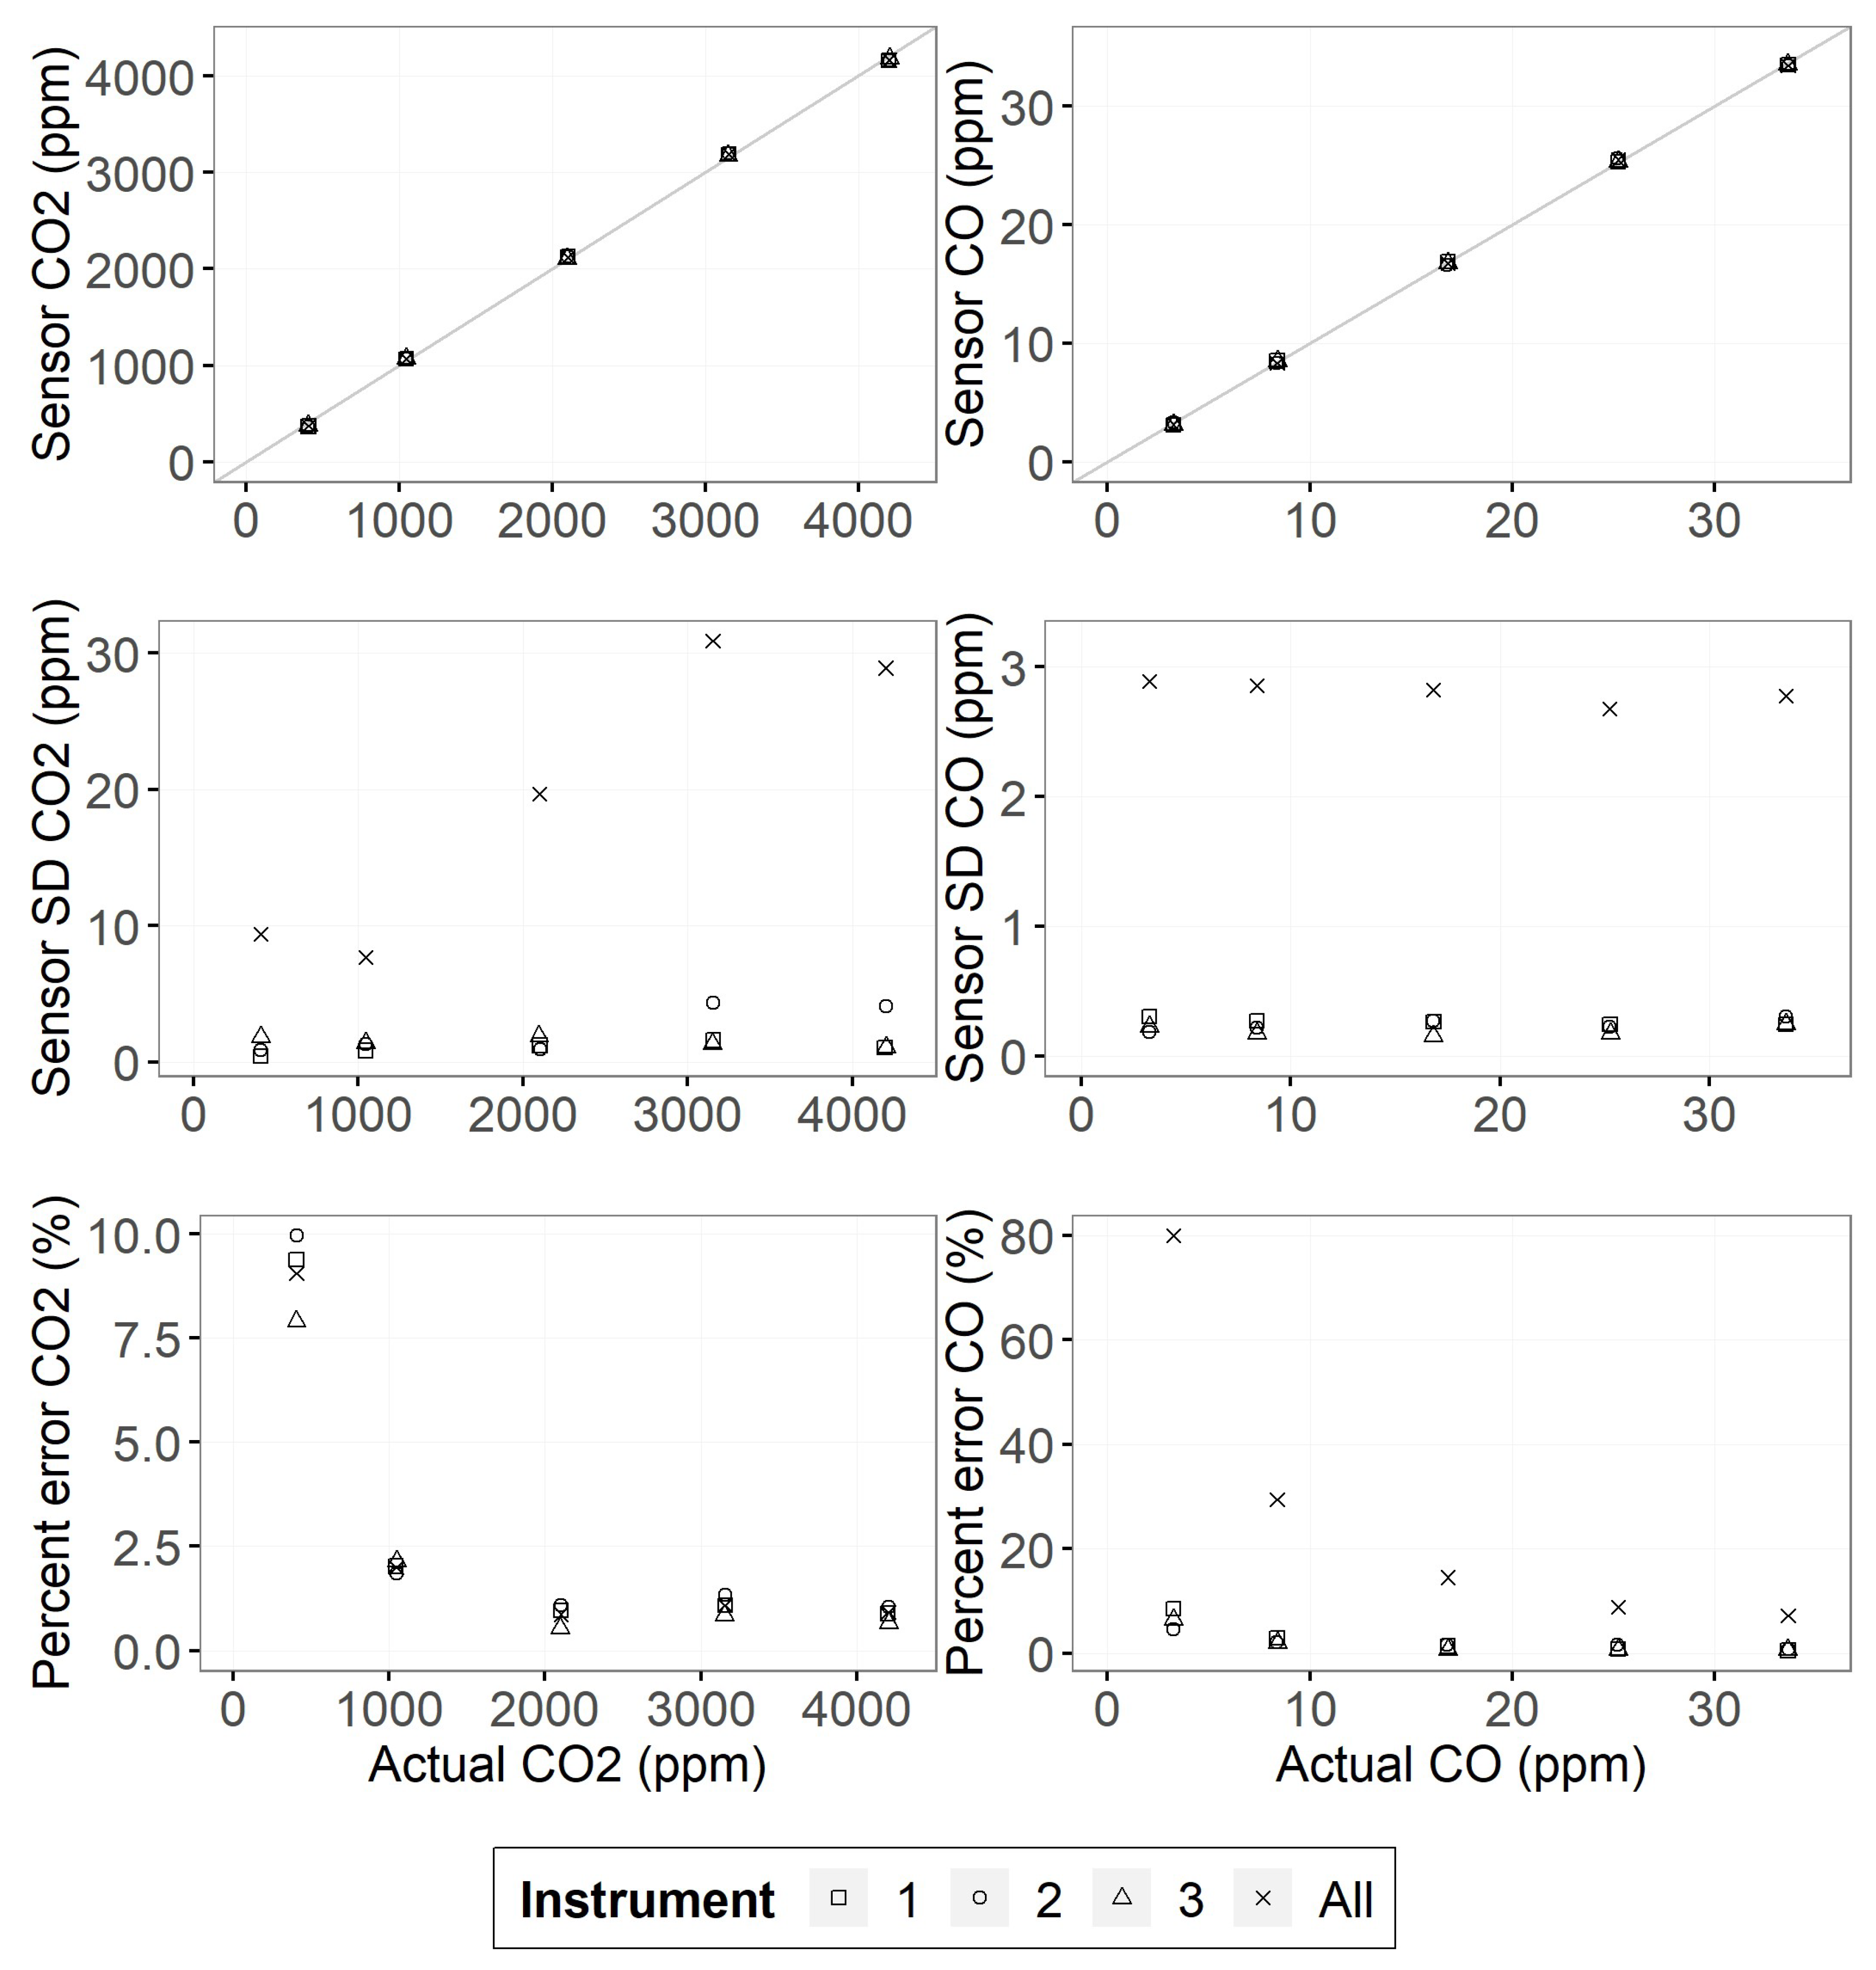
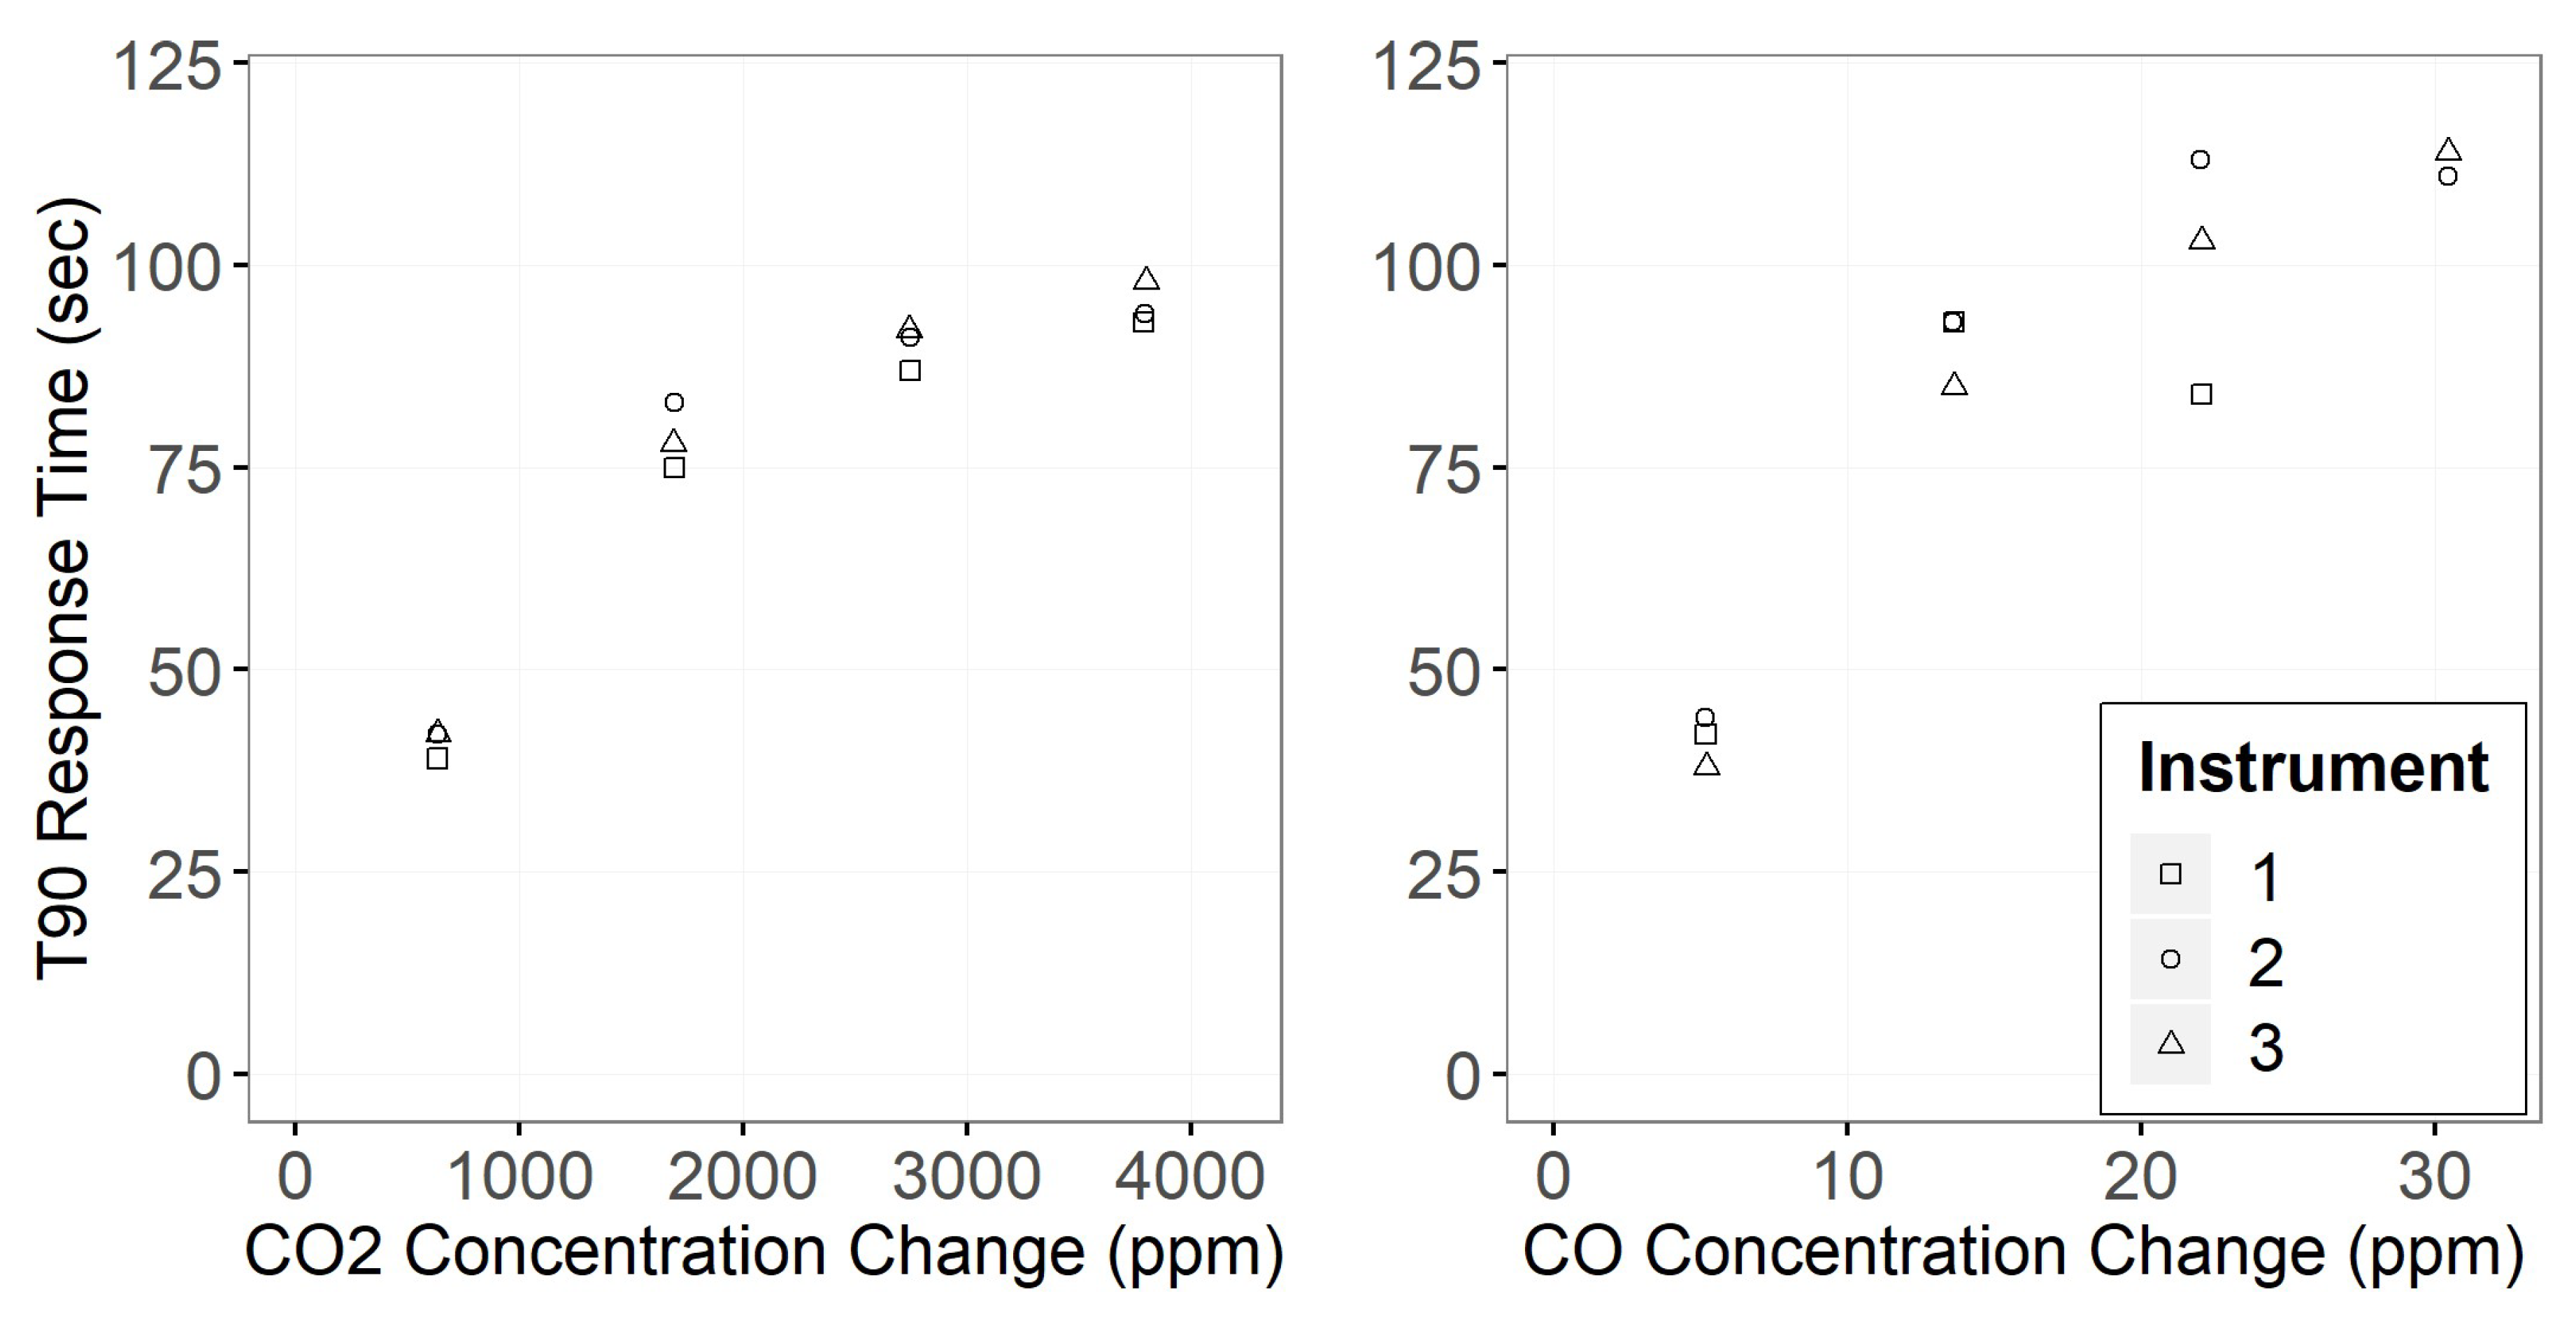
3.1. Gas Sensor Performance
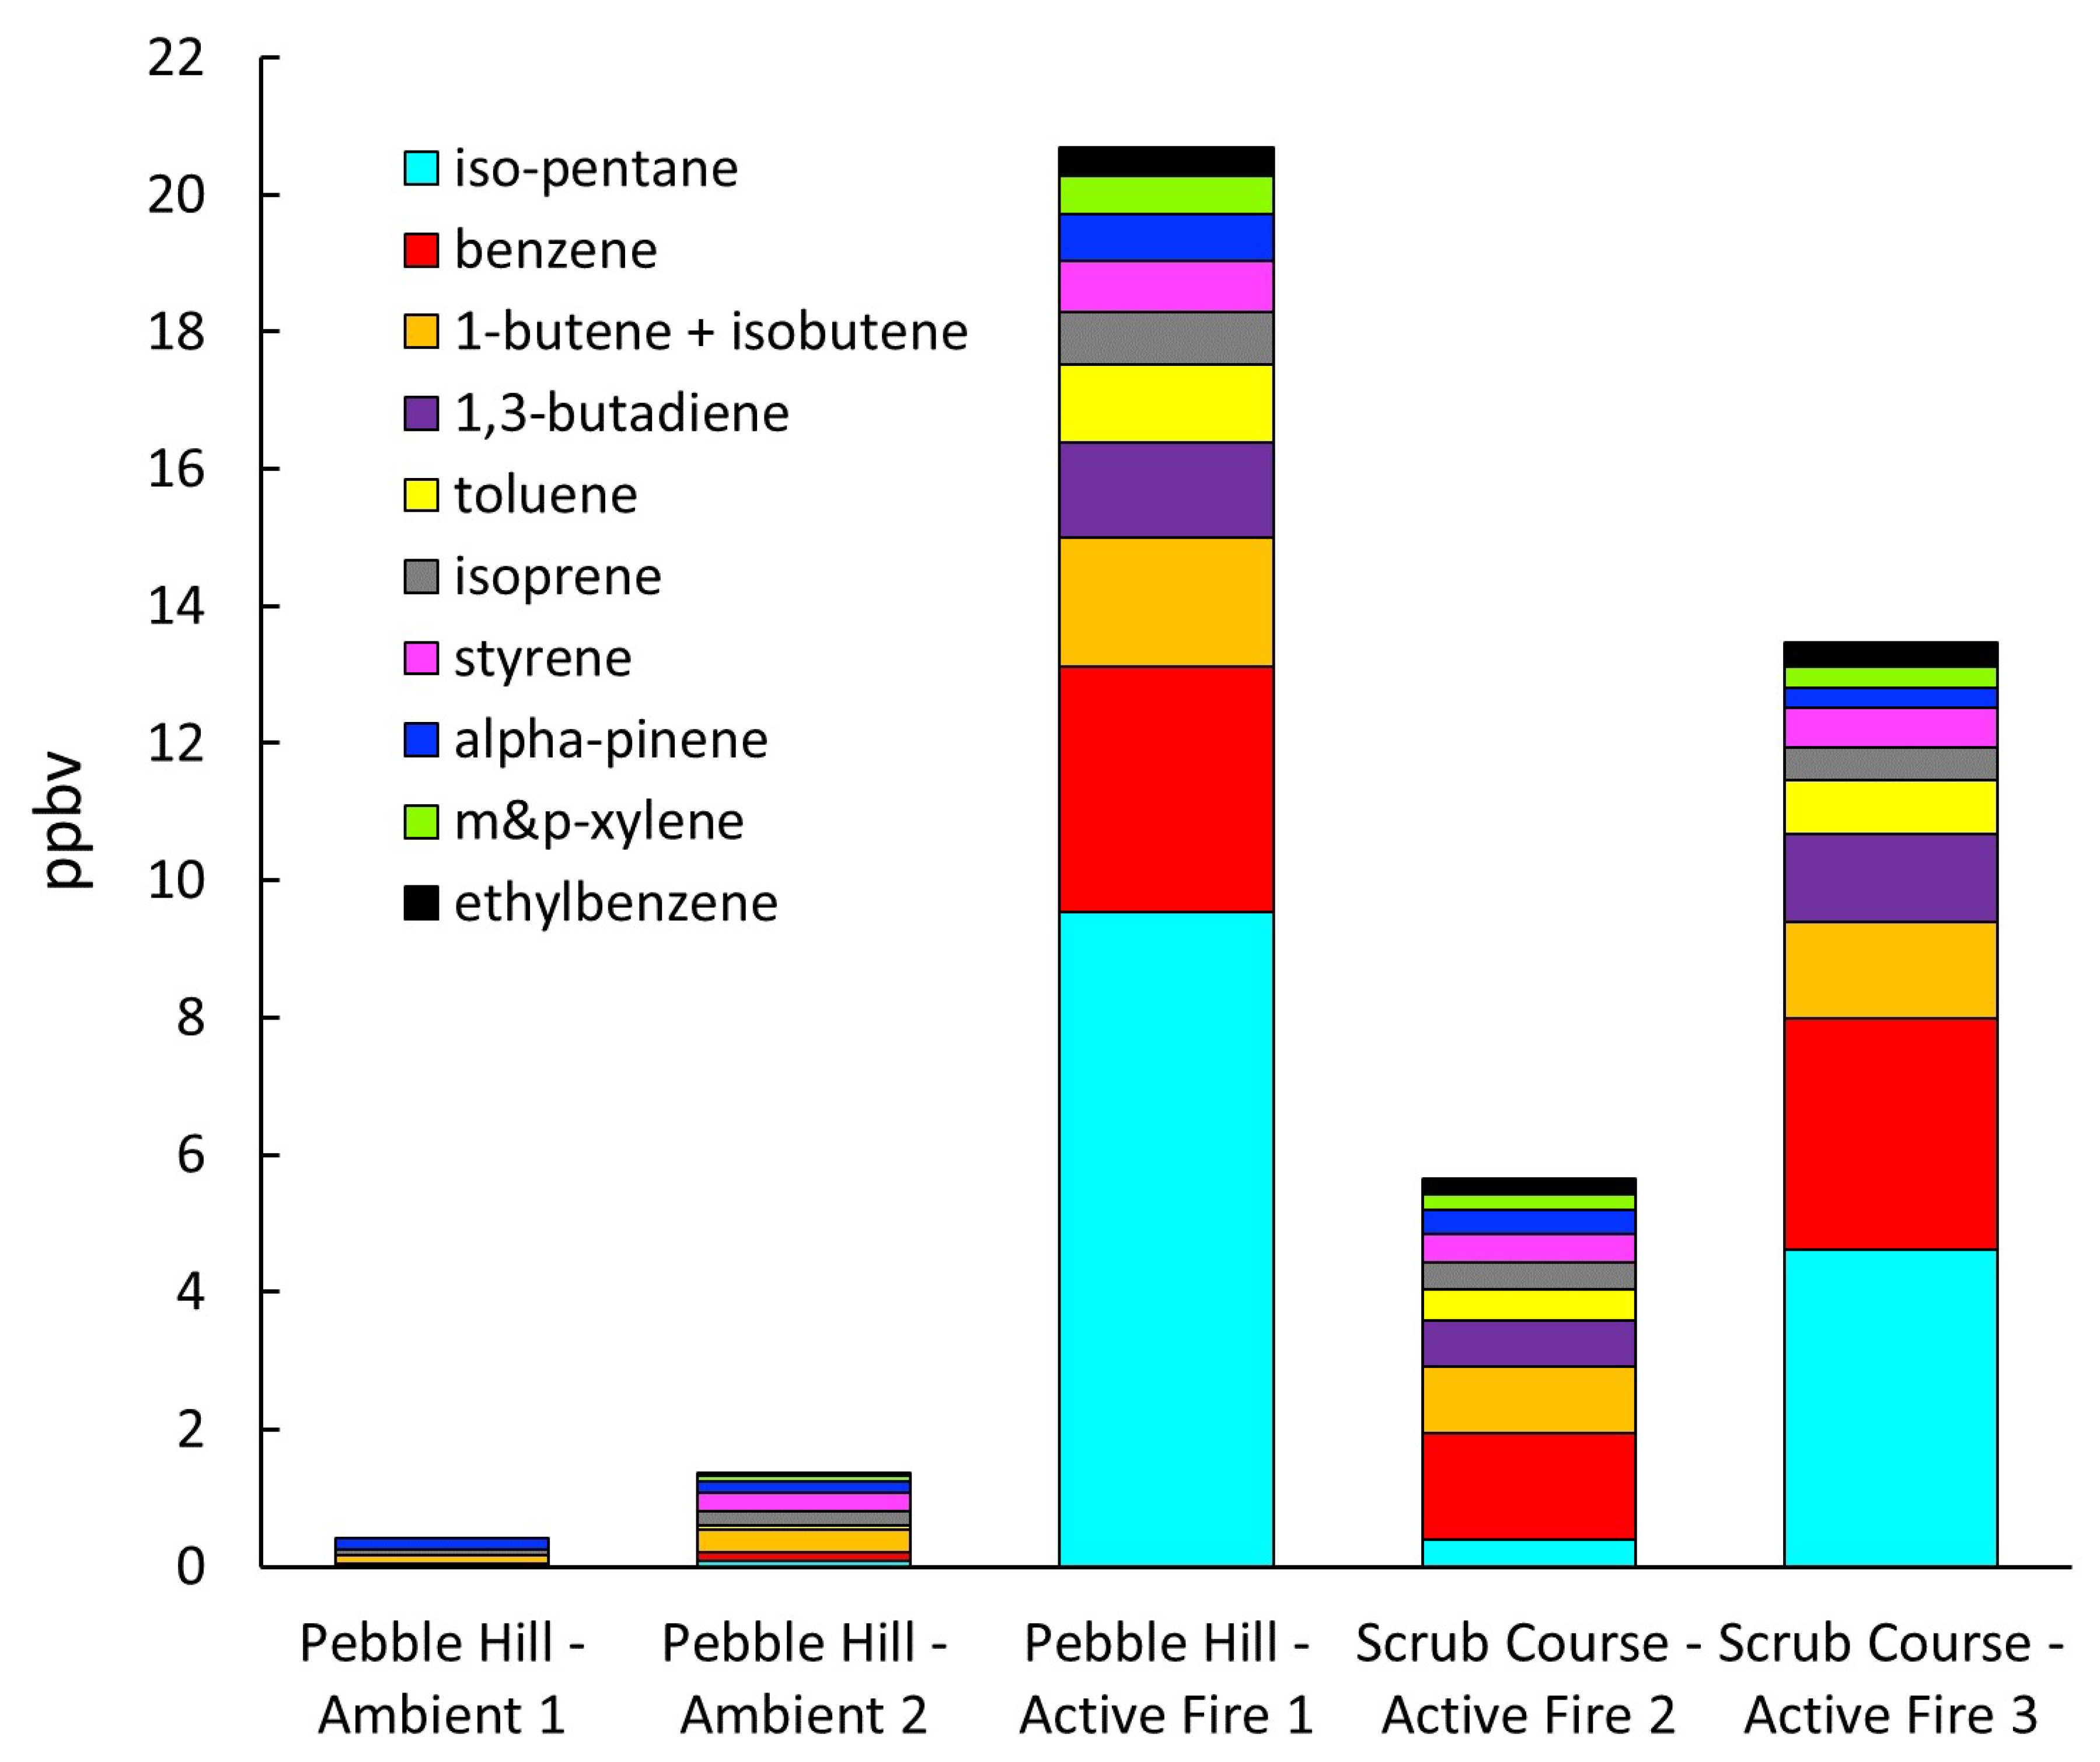
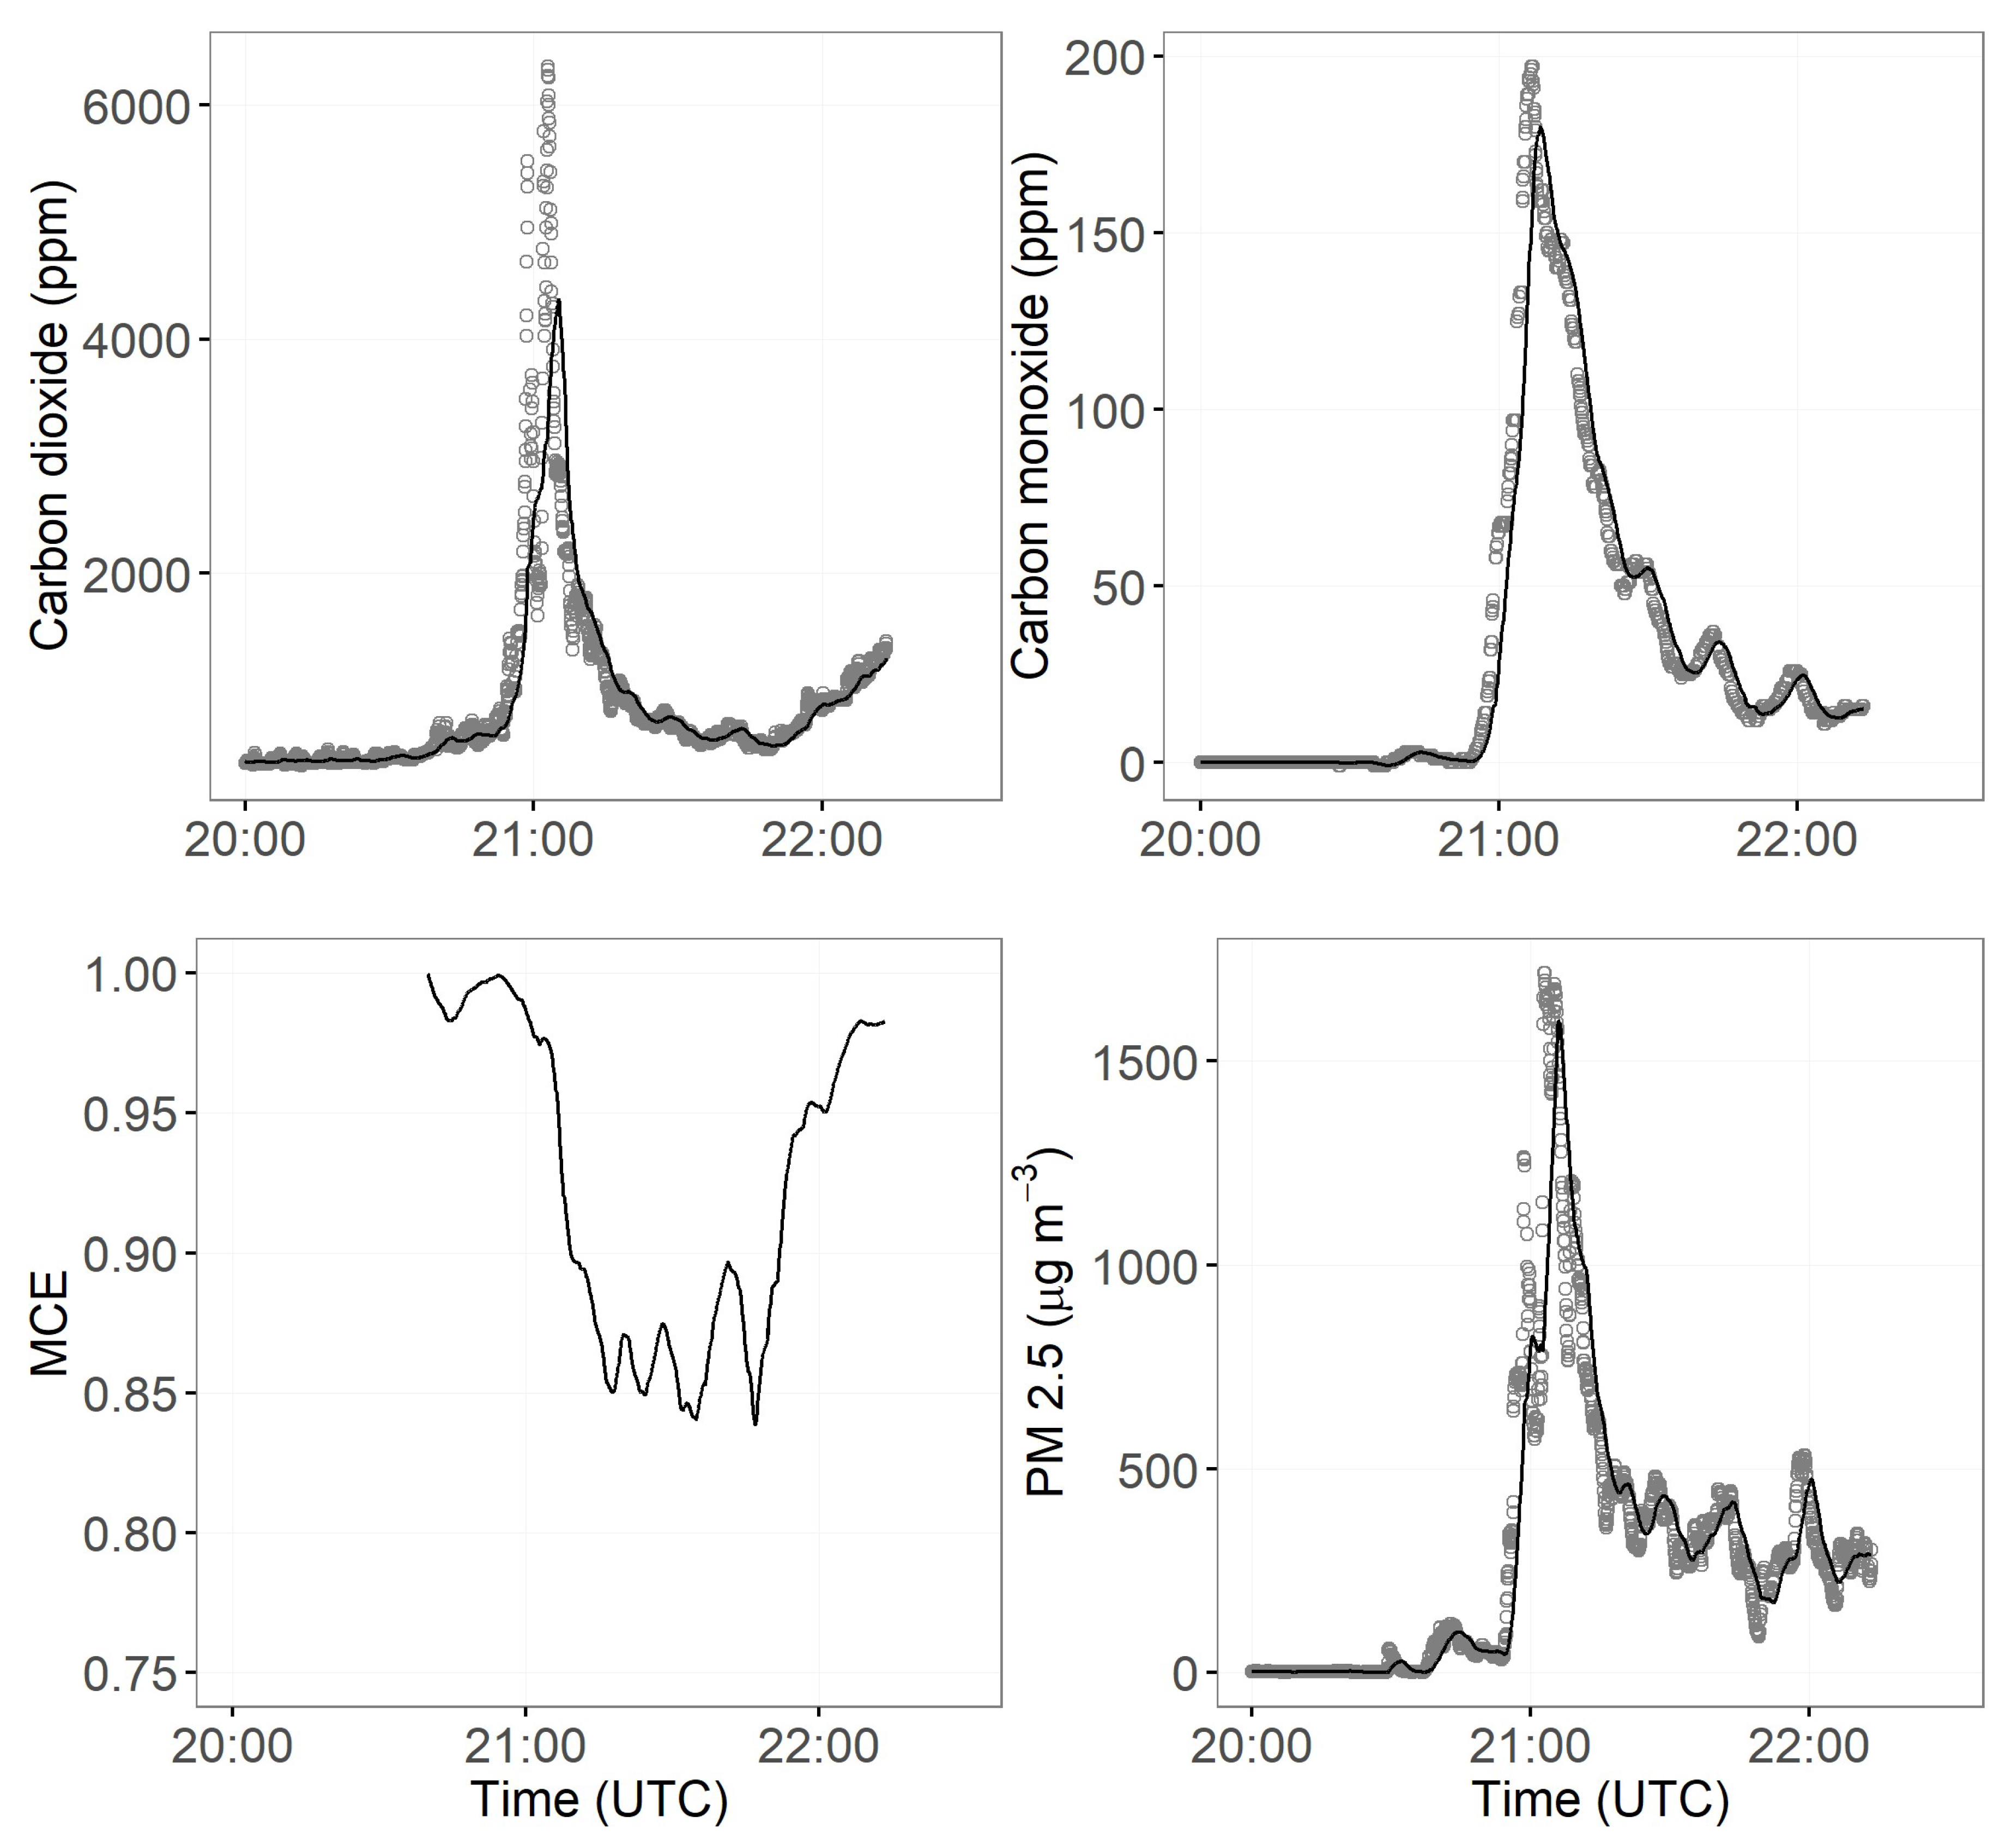
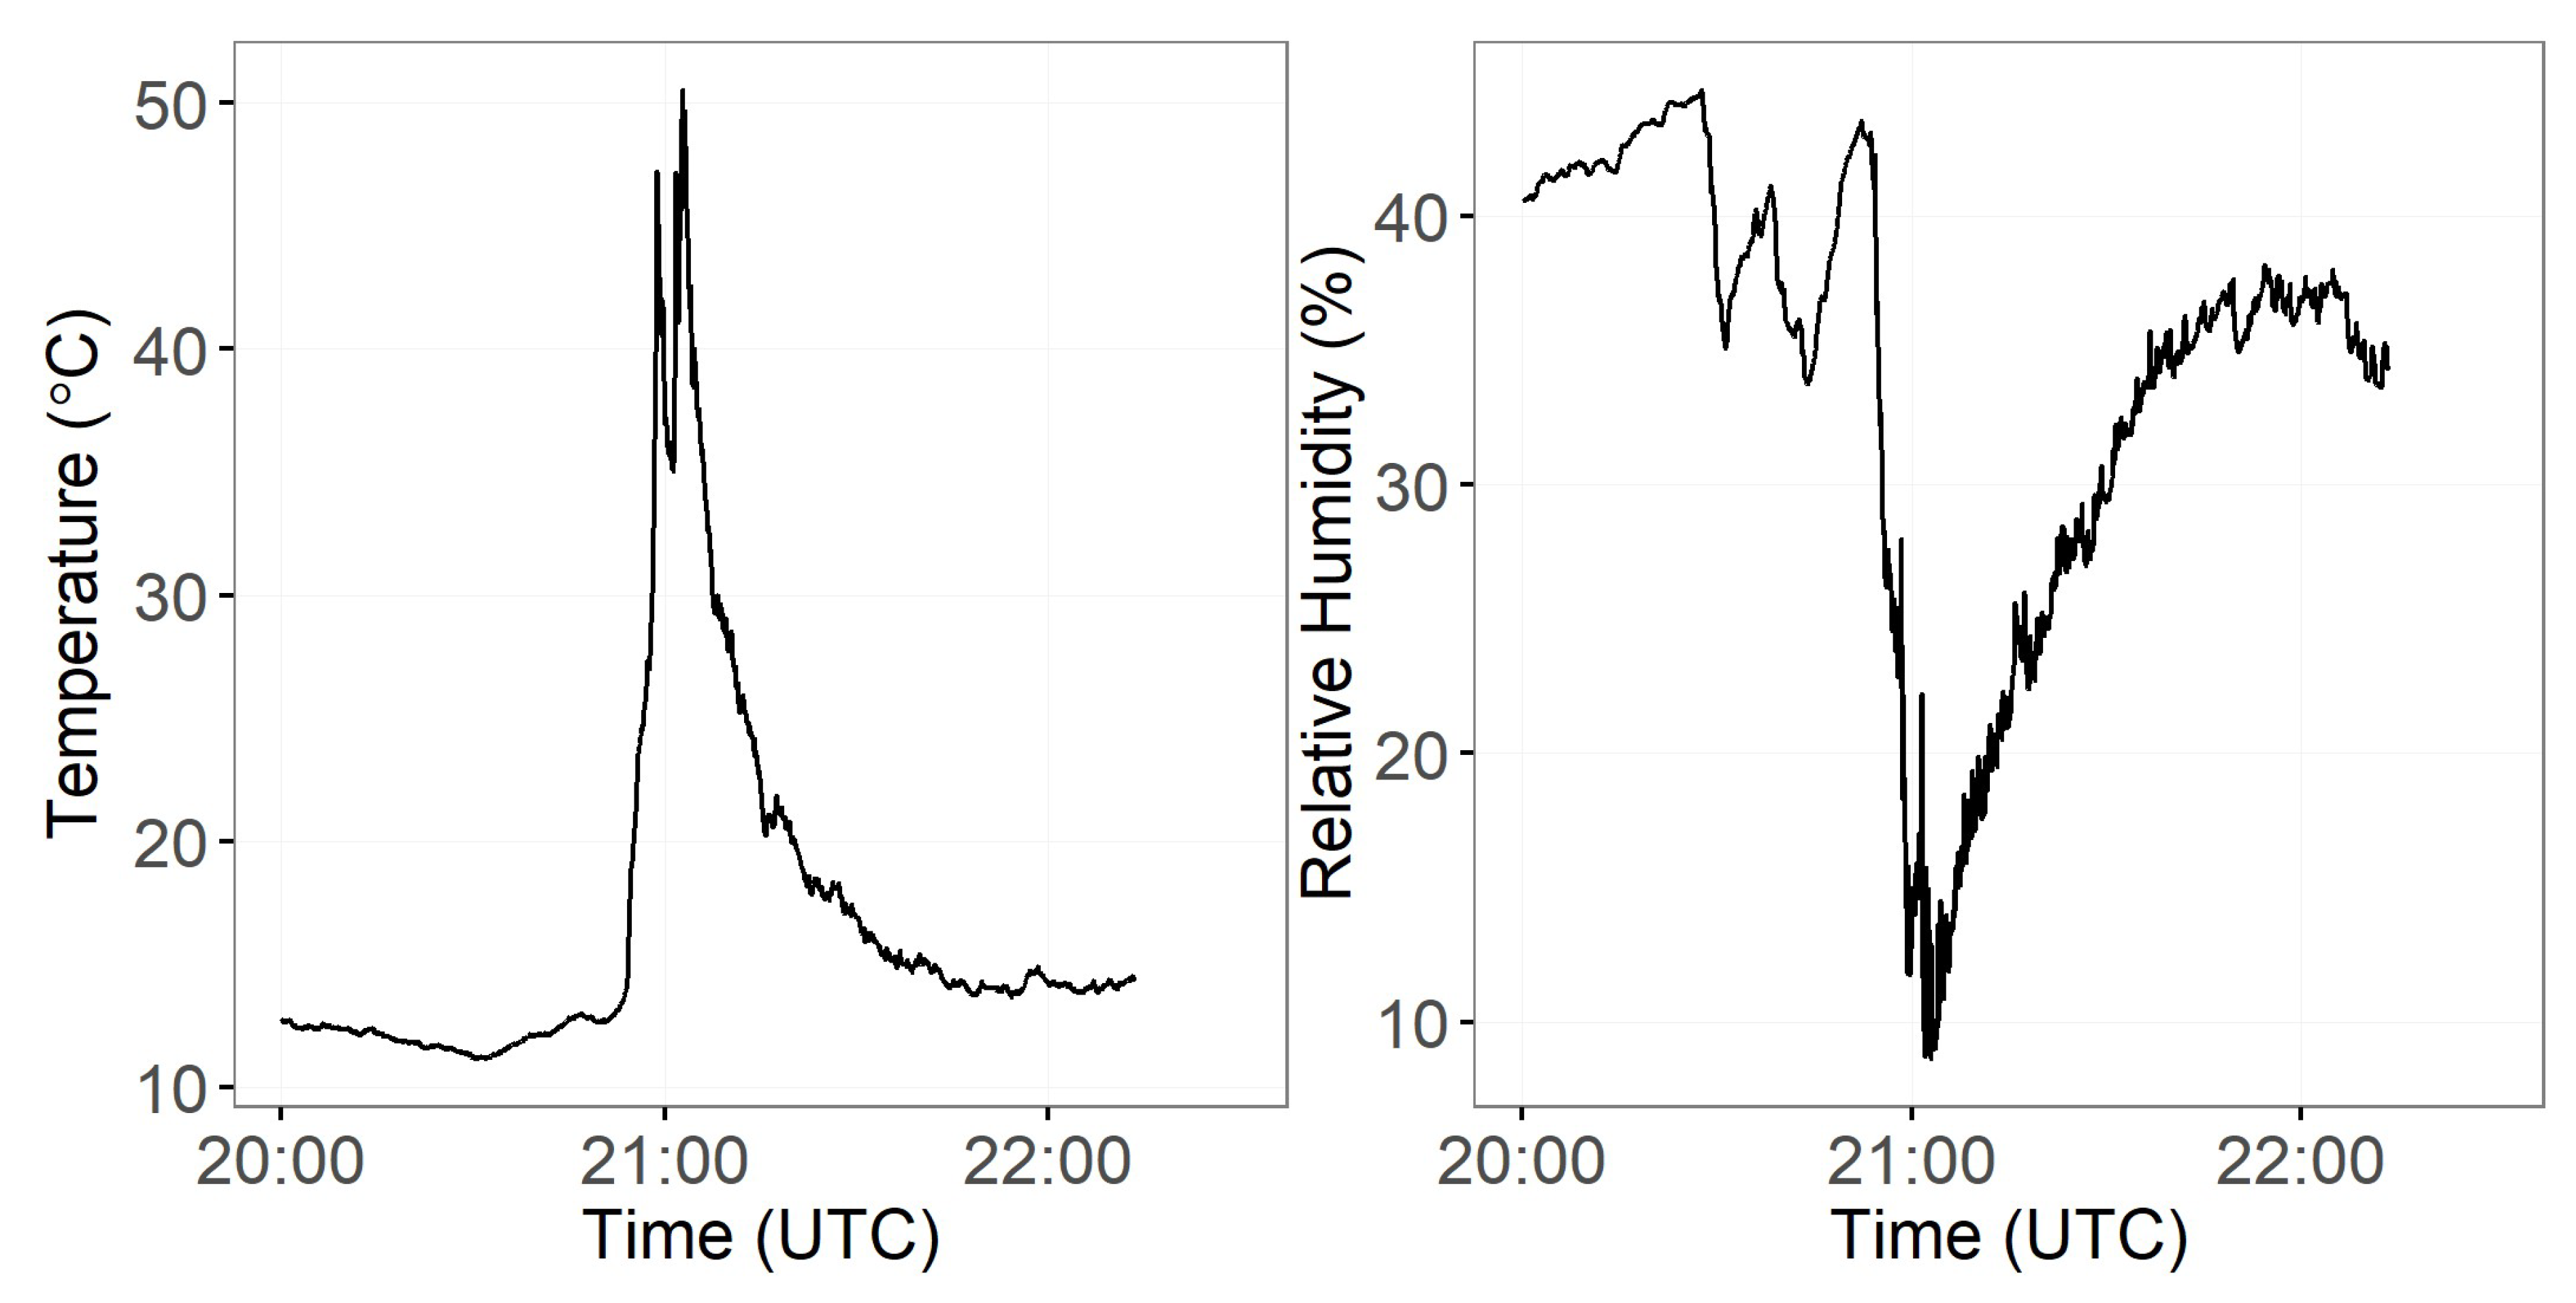
3.2. Smoke Emissions Sampling
3.3. Smoke Emissions Sensing
4. Conclusions
Supplementary Materials
Author Contributions
Funding
Acknowledgments
Conflicts of Interest
References
- Landrigan, P.J.; Fuller, R.; Acosta, N.J.R.; Adeyi, O.; Arnold, R.; Basu, N.; Baldé, A.B.; Bertollini, R.; Bose-O’Reilly, S.; Boufford, J.I.; et al. The Lancet Commission on pollution and health. Lancet 2018, 391, 462–512. [Google Scholar] [CrossRef] [Green Version]
- Chakrabarty, R.K.; Beres, N.D.; Moosmüller, H.; China, S.; Mazzoleni, C.; Dubey, M.K.; Liu, L.; Mishchenko, M.I. Soot superaggregates from flaming wildfires and their direct radiative forcing. Sci. Rep. 2014, 4, 5508. [Google Scholar] [CrossRef] [PubMed] [Green Version]
- Hobbs, P.V.; Reid, J.S.; Kotchenruther, R.A.; Ferek, R.J.; Weiss, R. Direct Radiative Forcing by Smoke from Biomass Burning. Science 1997, 275, 1777–1778. [Google Scholar] [CrossRef]
- Jiang, Y.; Lu, Z.; Liu, X.; Qian, Y.; Zhang, K.; Wang, Y.; Yang, X.-Q. Impacts of global open-fire aerosols on direct radiative, cloud and surface-albedo effects simulated with CAM5. Atmos. Chem. Phys. 2016, 16, 14805–14824. [Google Scholar] [CrossRef] [Green Version]
- Hardy, C.C.; Ottmar, R.D.; Peterson, J.L.; Core, J.E.; Seamon, P. Smoke Management Guide for Prescribed and Wildland Fire: 2001 Edition; PMS 420-2. NFES 1279; National Wildfire Coodination Group: Boise, ID, USA, 2001; p. 226.
- North, M.; Hurteau, M.; Innes, J. Fire suppression and fuels treatment effects on mixed-conifer carbon stocks and emissions. Ecol. Appl. 2009, 19, 1385–1396. [Google Scholar] [CrossRef] [PubMed]
- McClure, C.D.; Jaffe, D.A. US particulate matter air quality improves except in wildfire-prone areas. Proc. Natl. Acad. Sci. USA 2018, 115, 7901–7906. [Google Scholar] [CrossRef] [Green Version]
- Urbanski, S.P. Combustion efficiency and emission factors for wildfire-season fires in mixed conifer forests of the northern Rocky Mountains, US. Atmos. Chem. Phys. 2013, 13, 7241–7262. [Google Scholar] [CrossRef] [Green Version]
- Akagi, S.K.; Yokelson, R.J.; Wiedinmyer, C.; Alvarado, M.J.; Reid, J.S.; Karl, T.; Crounse, J.D.; Wennberg, P.O. Emission factors for open and domestic biomass burning for use in atmospheric models. Atmos. Chem. Phys. 2011, 11, 4039–4072. [Google Scholar] [CrossRef] [Green Version]
- Yokelson, R.J.; Burling, I.R.; Gilman, J.B.; Warneke, C.; Stockwell, C.E.; de Gouw, J.; Akagi, S.K.; Urbanski, S.P.; Veres, P.; Roberts, J.M.; et al. Coupling field and laboratory measurements to estimate the emission factors of identified and unidentified trace gases for prescribed fires. Atmos. Chem. Phys. 2013, 13, 89–116. [Google Scholar] [CrossRef] [Green Version]
- Brown, T.; Clements, C.; Larkin, N.; Anderson, K.; Butler, B.; Goodrick, S.; Ichoku, C.; Lamb, B.; Mell, R.; Ottmar, R. Validating the Next Generation of Wildland Fire and Smoke Models for Operational and Research Use—A National Plan; Report 13-S-01-01; Joint Fire Science Program: Boise, ID, USA, 2014; p. 73.
- Prichard, S.; Larkin, N.S.; Ottmar, R.; French, N.H.F.; Baker, K.; Brown, T.; Clements, C.; Dickinson, M.; Hudak, A.; Kochanski, A.; et al. The Fire and Smoke Model Evaluation Experiment—A Plan for Integrated, Large Fire–Atmosphere Field Campaigns. Atmosphere 2019, 10, 66. [Google Scholar] [CrossRef]
- Aurell, J.; Gullett, B.K. Emission Factors from Aerial and Ground Measurements of Field and Laboratory Forest Burns in the Southeastern U.S.: PM2.5, Black and Brown Carbon, VOC, and PCDD/PCDF. Environ. Sci. Technol. 2013, 47, 8443–8452. [Google Scholar] [CrossRef]
- Radke, L.F.; Hegg, D.A.; Lyons, J.H.; Brock, C.A.; Hobbs, P.V.; Weiss, R.; Rasmussen, R. Airborne measurements on smokes from biomass burning. Aerosols Clim. 1988, 411–422. [Google Scholar]
- Ferrare, R.A.; Fraser, R.S.; Kaufman, Y.J. Satellite measurements of large-scale air pollution: Measurements of forest fire smoke. J. Geophys. Res. Atmos. 1990, 95, 9911–9925. [Google Scholar] [CrossRef]
- Zhou, X.; Aurell, J.; Mitchell, W.; Tabor, D.; Gullett, B. A small, lightweight multipollutant sensor system for ground-mobile and aerial emission sampling from open area sources. Atmos. Environ. 2017, 154, 31–41. [Google Scholar] [CrossRef] [Green Version]
- Villa, T.F.; Gonzalez, F.; Miljievic, B.; Ristovski, Z.D.; Morawska, L. An Overview of Small Unmanned Aerial Vehicles for Air Quality Measurements: Present Applications and Future Prospectives. Sensors 2016, 16, 1072. [Google Scholar] [CrossRef]
- Holder, A.L.; Gullett, B.K.; Urbanski, S.P.; Elleman, R.; O’Neill, S.; Tabor, D.; Mitchell, W.; Baker, K.R. Emissions from prescribed burning of agricultural fields in the Pacific Northwest. Atmos. Environ. 2017, 166, 22–33. [Google Scholar] [CrossRef]
- Aurell, J.; Gullett, B.K.; Tabor, D. Emissions from southeastern U.S. Grasslands and pine savannas: Comparison of aerial and ground field measurements with laboratory burns. Atmos. Environ. 2015, 111, 170–178. [Google Scholar] [CrossRef]
- Keating, F.; Mitchell, T.; Kidd, J.; Jacob, J.D. Wildfire Plume Tracking and Dynamics Using UAS. In Proceedings of the AIAA Infotech @ Aerospace, San Diego, CA, USA, 4–8 January 2016. [Google Scholar]
- Ottmar, R.D.; Brown, T.J.; French, N.H.F.; Larkin, N.K. Fire and Smoke Model Evaluation Experiment (FASMEE) Study Plan; Joint Fire Sciences Program Project 15-S-01-01; Joint Fire Sciences Program: Boise, ID, USA, 2017; p. 148.
- NOAA. U.S. Standard Atmosphere, 1976; NOAA: Rockville, MD, USA, 1976.
- Zheng, T.; Bergin, M.H.; Johnson, K.K.; Tripathi, S.N.; Shirodkar, S.; Landis, M.S.; Sutaria, R.; Carlson, D.E. Field evaluation of low-cost particulate matter sensors in high- and low-concentration environments. Atmos. Meas. Tech. 2018, 11, 4823–4846. [Google Scholar] [CrossRef] [Green Version]
- Sayahi, T.; Butterfield, A.; Kelly, K.E. Long-term field evaluation of the Plantower PMS low-cost particulate matter sensors. Environ. Poll. 2019, 245, 932–940. [Google Scholar] [CrossRef]
- Bulot, F.M.J.; Johnston, S.J.; Basford, P.J.; Easton, N.H.C.; Apetroaie-Cristea, M.; Foster, G.L.; Morris, A.K.R.; Cox, S.J.; Loxham, M. Long-term field comparison of multiple low-cost particulate matter sensors in an outdoor urban environment. Sci. Rep. 2019, 9, 7497. [Google Scholar] [CrossRef]
- Kelleher, S.; Quinn, C.; Miller-Lionberg, D.; Volckens, J. A low-cost particulate matter (PM2.5) monitor for wildland fire smoke. Atmos. Meas. Tech. 2018, 11, 1087–1097. [Google Scholar] [CrossRef]
- Millard, S.P. EnvStats: An R Package for Environmental Statistics; Springer: New York, NY, USA, 2013; ISBN 978-1-4614-8455-4. [Google Scholar]
- U.S. EPA. Technical Assistance Document for Sampling and Analysis of Ozone Precursors; United States Environmental Protection Agency: Research Triangle Park, NC, USA, 1998.
- U.S. EPA. Technical Assistance Document for the National Ambient Air Toxics Trends and Assessment Program, Revision 2; U.S. Environmental Protection Agency: Research Triangle Park, NC, USA, 2009.
- U.S. EPA. Compendium Method TO-15—Determination of Volatile Organic Compounds (VOCs) in Air Collected in Specially-Prepared Canisters and Analyzed by Gas Chromatography/Mass Spectrometry (GC/MS), 2nd ed.; Office of Research and Development: Cincinnati, OH, USA, 1999.
- R Core Team. R: A Language and Environment for Statistical Computing; R Foundation for Statistical Computing: Vienna, Austria, 2018; Available online: http://www.R-project.org/ (accessed on 1 August 2018).
- Grolemund, G.; Hadley, W. Dates and Times Made Easy with lubridate. J. Stat. Softw. 2011, 40, 1–25. [Google Scholar] [CrossRef]
- Vaughan, D.; Dancho, M. tibbletime: Time Aware Tibbles, R package Version 0.1.1; 2018. Available online: https://mran.microsoft.com/snapshot/2018-02-12/web/packages/tibbletime/index.html (accessed on 31 January 2018).
- Wickham, H. tidyverse: Easily Install and Load the “Tidyverse.”, R package Version 1.2; 2017. Available online: https://rdrr.io/cran/tidyverse/ (accessed on 31 January 2018).
- Ward, D.E.; Hao, W.M.; Susott, R.A.; Babbitt, R.E.; Shea, R.W.; Kauffman, J.B.; Justice, C.O. Effect of fuel composition on combustion efficiency and emission factors for African savanna ecosystems. J. Geophys. Res. Atmos. 1996, 101, 23569–23576. [Google Scholar] [CrossRef]
- Ward, D.E.; Susott, R.A.; Kauffman, J.B.; Babbitt, R.E.; Cummings, D.L.; Dias, B.; Holben, B.N.; Kaufman, Y.J.; Rasmussen, R.A.; Setzer, A.W. Smoke and fire characteristics for cerrado and deforestation burns in Brazil: BASE-B Experiment. J. Geophys. Res. 1992, 97, 14601. [Google Scholar] [CrossRef]
- Yasuda, T.; Yonemura, S.; Tani, A. Comparison of the Characteristics of Small Commercial NDIR CO2 Sensor Models and Development of a Portable CO2 Measurement Device. Sensors 2012, 12, 3641–3655. [Google Scholar] [CrossRef] [Green Version]
- Liu, Y.; Shao, M.; Fu, L.; Lu, S.; Zeng, L.; Tang, D. Source profiles of volatile organic compounds (VOCs) measured in China: Part I. Atmos. Environ. 2008, 42, 6247–6260. [Google Scholar] [CrossRef]
- Schauer, J.J.; Kleeman, M.J.; Cass, G.R.; Simoneit, B.R.T. Measurement of Emissions from Air Pollution Sources. 3. C1−C29 Organic Compounds from Fireplace Combustion of Wood. Environ. Sci. Technol. 2001, 35, 1716–1728. [Google Scholar] [CrossRef]
- Dreessen, J.; Sullivan, J.; Delgado, R. Observations and impacts of transported Canadian wildfire smoke on ozone and aerosol air quality in the Maryland region on June 9–12, 2015. J. Air Waste Manag. Assoc. 2016, 66, 842–862. [Google Scholar] [CrossRef]
- Simpson, I.J.; Akagi, S.K.; Barletta, B.; Blake, N.J.; Choi, Y.; Diskin, G.S.; Fried, A.; Fuelberg, H.E.; Meinardi, S.; Rowland, F.S.; et al. Boreal forest fire emissions in fresh Canadian smoke plumes: C1-C10 volatile organic compounds (VOCs), CO2, CO, NO2, NO, HCN and CH3CN. Atmos. Chem. Phys. 2011, 11, 6445–6463. [Google Scholar] [CrossRef]
- Prudden, S.; Fisher, A.; Mohamed, A.; Watkins, S. An anemometer for UAS-based atmospheric wind measurements. In Proceedings of the 17th Australian International Aerospace Congress, Melbourne, Australia, 26–28 February 2017; p. 303. [Google Scholar]
- Yeo, D.; Shrestha, E.; Paley, D.A.; Atkins, E.M. An Empirical Model of Rotorcrafy UAV Downwash for Disturbance Localization and Avoidance. In Proceedings of the AIAA Atmospheric Flight Mechanics Conference, Kissimmee, FL, USA, 5–9 January 2015; p. 1685. [Google Scholar]
- Barbieri, L.; Kral, S.T.; Bailey, S.C.C.; Frazier, A.E.; Jacob, J.D.; Reuder, J.; Brus, D.; Chilson, P.B.; Crick, C.; Detweiler, C.; et al. Intercomparison of Small Unmanned Aircraft System (sUAS) Measurements for Atmospheric Science during the LAPSE-RATE Campaign. Sensors 2019, 19, 2179. [Google Scholar] [CrossRef]
- Asher, E.; Hills, A.J.; Hornbrook, R.S.; Stephens, B.B.; Shertz, S.; Gabbard, S.; Apel, E.C. Quality Assessment and airborne measurements in the Colorado Front Range using the Unmanned Whole Air Sampling System (UWASS). In Proceedings of the AGU Fall Meeting, Washington, DC, USA, 10–14 December 2018; Volume 43. [Google Scholar]


| Coefficient | SE | t | p | r2 | |
|---|---|---|---|---|---|
| Instrument 1 | |||||
| Intercept | 10.975 | 0.19 | 58.326 | <0.001 | 0.999 |
| Raw CO (ppm) | 1.516 | 0.01 | 166.347 | <0.001 | |
| Instrument 2 | |||||
| Intercept | 7.633 | 0.35 | 21.8 | <0.001 | 0.999 |
| Raw CO (ppm) | 1.492 | 0.02 | 87.968 | <0.001 | |
| Instrument 3 | |||||
| Intercept | 17.773 | 0.15 | 118.261 | <0.001 | 0.999 |
| Raw CO (ppm) | 1.483 | 0.01 | 203.794 | <0.001 | |
| Global (All Instruments) | |||||
| Intercept | 12.123 | 2.14 | 5.655 | <0.001 | 0.941 |
| Raw CO (ppm) | 1.497 | 0.1 | 14.42 | <0.001 | |
| Coefficient | SE | t | p | r2 | |
|---|---|---|---|---|---|
| Instrument 1 | |||||
| Intercept | 144.389 | 23.6 | 6.107 | 0.009 | 0.999 |
| Raw CO2 (ppm) | 0.698 | 0.01 | 76.202 | <0.001 | |
| Instrument 2 | |||||
| Intercept | 143.947 | 27.2 | 5.298 | 0.013 | 0.999 |
| Raw CO2 (ppm) | 0.71 | 0.01 | 67.442 | <0.001 | |
| Instrument 3 | |||||
| Intercept | 157.002 | 18.8 | 8.348 | 0.004 | 0.999 |
| Raw CO2 (ppm) | 0.695 | 0.01 | 95.309 | <0.001 | |
| Global (All Instruments) | |||||
| Intercept | 148.439 | 13.4 | 11.099 | <0.001 | 0.999 |
| Raw CO2 (ppm) | 0.701 | 0.01 | 135.259 | <0.001 | |
© 2019 by the authors. Licensee MDPI, Basel, Switzerland. This article is an open access article distributed under the terms and conditions of the Creative Commons Attribution (CC BY) license (http://creativecommons.org/licenses/by/4.0/).
Share and Cite
Nelson, K.N.; Boehmler, J.M.; Khlystov, A.Y.; Moosmüller, H.; Samburova, V.; Bhattarai, C.; Wilcox, E.M.; Watts, A.C. A Multipollutant Smoke Emissions Sensing and Sampling Instrument Package for Unmanned Aircraft Systems: Development and Testing. Fire 2019, 2, 32. https://doi.org/10.3390/fire2020032
Nelson KN, Boehmler JM, Khlystov AY, Moosmüller H, Samburova V, Bhattarai C, Wilcox EM, Watts AC. A Multipollutant Smoke Emissions Sensing and Sampling Instrument Package for Unmanned Aircraft Systems: Development and Testing. Fire. 2019; 2(2):32. https://doi.org/10.3390/fire2020032
Chicago/Turabian StyleNelson, Kellen N., Jayne M. Boehmler, Andrey Y. Khlystov, Hans Moosmüller, Vera Samburova, Chiranjivi Bhattarai, Eric M. Wilcox, and Adam C. Watts. 2019. "A Multipollutant Smoke Emissions Sensing and Sampling Instrument Package for Unmanned Aircraft Systems: Development and Testing" Fire 2, no. 2: 32. https://doi.org/10.3390/fire2020032
APA StyleNelson, K. N., Boehmler, J. M., Khlystov, A. Y., Moosmüller, H., Samburova, V., Bhattarai, C., Wilcox, E. M., & Watts, A. C. (2019). A Multipollutant Smoke Emissions Sensing and Sampling Instrument Package for Unmanned Aircraft Systems: Development and Testing. Fire, 2(2), 32. https://doi.org/10.3390/fire2020032