Article

Calculation of Critical Water Flow Rates for Wildfire Suppression

1
Edith Cowan University, School of Engineering, Joondalup Campus, Perth 6027, Australia
2
Edith Cowan University; School of Medical and Health Sciences, Joondalup Campus, Perth 6027, Australia
3
Rural Fire Division, Department of Fire and Emergency Services; Perth 6000, Australia
*
Author to whom correspondence should be addressed.
Submission received: 12 November 2018 / Revised: 27 December 2018 / Accepted: 30 December 2018 / Published: 3 January 2019

Abstract

:
Predicting water suppression requirements and its impacts on firefighting strategies and logistics within the urban environment has been the subject of many previous studies, however the same level of research has yet to be applied in the realm of wildfire suppression. To work towards addressing this knowledge gap, this paper provides guidance for Incident Controllers in relation to critical water flow rates required to extinguish large wildfire across a wide range of forest fuel loads, fire weather and active fire front depths. This is achieved through mathematical empirical analysis of water flow rates required for head fire suppression during 540 simulated wildfires in forest vegetation. This research applies a fire engineering approach to wildfire suppression logistics and deterministically assess the suitability of appliance and aircraft based head fire suppression. The results highlight the limitations of offensive wildfire suppression involving direct head fire attacks by appliances once wildfires attain a quasi-steady state in forest fuels.

1. Introduction

Globally various retardants are applied during wildfire suppression efforts, yet water remains the primary extinguishing agent [1]. Whilst prediction of water suppression requirements and its impacts on firefighting strategies and logistics within the urban environment has been the subject of many previous publications [2,3], the same level of research has yet to be applied in the field of wildfire suppression [1]. With fire services around the globe advocating offensive wildfire fighting strategies [4,5,6,7,8,9,10] heavily reliant the application of both water and other suppressants, it is suggested this knowledge gap and a lack of suitable data may be impeding firefighting efforts of significant wildfires, known as siege or campaign wildfires amongst fire services internationally.
One of the major differences affecting data collection from major urban structure fires and siege wildfires is that structure fires are inherently contained and last a matter of hours whereas siege wildfires routinely consume thousands of hectares of vegetation, multiple structures and last days if not weeks. Using recent fires of note for comparison, even the devastating Grenfell Tower fire of 14 June 2017 [11] did not result in the same scale of destruction or require the extent of fire suppression resourcing of recent and more frequent siege wildfires such as those experienced in California [12,13], Greece [14] or Victoria [15] which required the mobilization of military or international firefighting assistance.
For Incident Management Teams (IMT’s) and Incident Controllers (IC’s) to develop and execute successful and safe suppression strategies it is critical they are able to appropriately analyse and manage risk [16]. This not only requires a comprehensive knowledge of wildfire behaviour, but also the abilities and limitations of both firefighting personnel, appliances and aircraft. Hindering the ability of the IMT’s and IC’s is a lack of formal evidence to support operational decisions [10,17,18,19], with decision makers having to rely on personal experience [16,20] and empirical wildfire behaviour or suppression models which also have inherent limitations [1,21,22,23].
Existing water extinguishment models [1] have been validated against field data from low intensity experimental burns with fire line intensities of less than 1 MWm−1 and flame lengths of less than 2.5 m. These experimental conditions are far from the conditions faced during siege wildfire events which can include fire line intensities of 88 MWm−1 and flame heights extending 10–20 m above the crowns of trees [24]. Further limiting the application of existing research to dynamic emergency conditions is the lack of consideration for the capabilities of firefighting vehicles and aircraft that have limited water capacities and may be away from the active fire front for considerable durations whilst they refill.
To work towards addressing the identified knowledge gap, this paper builds upon previous research [1] by applying a fire engineering deterministic analysis of water flow rates required for head fire suppression during wildfires. The aim of this study is to provide guidance for Incident Controllers in relation to critical water flow rates required to extinguish large wildfire across a wide range of forest fuel loads, fire weather and active fire front depths. The impacts of the results on current suppression strategies and logistics are discussed in order to facilitate enhanced effectiveness and safety of operational response to siege wildfire incidents. In doing so, this paper provides the critical connection between firefighting theory and practice that is essential within the firefighting profession [19].

2. Materials and Methods

The prevention or extinguishment of fire through the application of water occurs by three methods [1,2]:
  • Water is applied to fuel surfaces not yet involved in fire, preventing pyrolysis and the production of combustion gases;
  • Water is applied directly into the flames, cooling the flame below the critical temperature; or
  • Water is applied directly to the burning fuel surface, cooling the fuel and resulting in a reduced pyrolysis rate and quenching of the flames.
When considering active suppression efforts during high intensity bushfires only surface cooling should be considered as evaporating water vapour is rapidly dispersed and will not noticeably affect the flame temperature [1]. As a result, by applying Fire Point Theory and accounting for external radiant and convective heat flux, the critical flow rate (CF) in Lm−2s−1 can be calculated for the wildfire scenarios using Equation (1) [1]. CF is the flow rate of water required to extinguish a burning surface, with an infinite period of time available [19]. As the wildfire length and depth of the active flame front changes over time and is influenced by many factors including but not limited to terrain, wind, fuel structure and fuel geometry [21], the CF can only be calculated at a specific point in time. The limitations of fire ground suppression, including appliance or aircraft capacity and available must be considered and are addressed later in the report.
C F = m ˙ w a t e r , c r , 0 + q ˙ E η w a t e r × L v , w a t e r
where:
  • m ˙ w a t e r , c r , 0 is the critical water application rate assuming no external heat flux, identified as ≈0.0129 Lm−2s−1 [1],
  • η w a t e r is the efficiency of water application, representing the portion of water leaving the firefighting branch which actually contributes to fire extinguishment, conservatively assumed to be 0.7 [1],
  • L v , w a t e r is the enthalpy change of water, identified as 2640 kJkg−1,
  • q ˙ E is external heat flux, calculated using Equation (2),
q ˙ E = ( 0.27 × I ( 2 × L f + D ) × τ ϕ ) + ( h × ( T g T f u e l ) ) .
where:
  • I is fire line intensity in kWm−1 calculated using Byram’s fire line intensity equation [25], calculated using Equation (3),
  • L f is flame length in m, calculated using Equation (4),
  • D is depth of the active flame in m,
  • τ is atmospheric transmissivity, assumed to be 1 due to the proximity of the unburned fuel in respect to the flames,
  • ϕ is view factor, assumed to be 1 due to the proximity of the unburned fuel in respect to the flames,
  • h is the convective heat transfer coefficient set at 0.077 kW/m2K assuming a forced convection and air velocity at 10 ms−1 [1],
  • Tg is gas temperature of the flame, assumed to be 1090 K, representative of siege wildfire conditions [22,26,27,28,29],
  • Tfuel is the fuel temperature of the fuel, assumed to be 588 K, being the ignition surface temperature for pine-needle fuel beds [1].
The fire line intensity (I) is given by:
I = H W R o S 36
where:
  • H is effective heat of combustion, assumed to be 18,600 kJkg−1 [22,26] (noting this will vary with vegetation type)
  • W is total fuel load in tha−1, considering fine fuels typically less than 6 mm in diameter [22]
  • RoS is the forward Rate of Spread corrected for slope in kmh−1, calculated using Equation (5). Noting that terrain influences RoS, slope is assumed to be flat for the purposes of the study.
Flame length (Lf) is given by:
L f = 13 R o S + 0.24 W 2
R o S = 0.0012 ( F D I ) w
where:
  • FDI is Forest Fire Danger Index, a dimensionless factor incorporating the chance of a fire starting, its Rate of Spread, its intensity and the difficulty of its suppression, according to various combinations of air temperature, relative humidity, wind speed and both the long- and short-term drought effects [26],
  • w is understorey fuel load in tha−1, considering fine fuels typically less than 6 mm in diameter [22].
Analysis included spreadsheet calculation of CF using Equation (1) across variations of fuel load, FDI and active flame depth to simulate a large range of wildfire conditions and scenarios. Six variations of forest understory fuel loads at 5 tha−1 increments between 5–30 tha−1 with corresponding total fuel loads between 15–40 tha−1 (Note: the assumption that the canopy contributes 10 tha−1 [26] is retained) were simulated, representing a broad spectrum of forest fuel loads [22]. Ten variations of FDI at increments of 10 between 10–100, identified as the 99.9th percentile of fire weather conditions across Australia [22,30] were incorporated into the simulations. Nine variants of active flame depth (D) were also modelled at 1m increments between 2–10 m, representative of the optically thick head fire flame experienced during severe wildfire events [22,26,27,28]. In total, 540 wildfire scenarios were analysed. Calculations were confirmed using separate spreadsheets by the research team. Appliance and aircraft water suppression capabilities were derived from technical literature [31,32,33,34,35] and discussions with technical experts [36]. These capabilities are summarized in Table 1, with maximum potential flow rates, representing best case scenario, selected for the study. Deterministic analysis of calculated required CF to available flow rates was completed. For the purposes of deterministic analysis, it is assumed that appliances and aircraft can apply a uniform pattern of water to a 10 m length of active head fire front [4,5,6,31,32,33,34,35,36]. These values can be easily converted should different active head fire lengths be required.
Incident Controllers utilise a number of wildfire behaviour thresholds including Rate of Spread (RoS), intensity (I) and flame length (Lf) to assess the suitability and potential success of suppression strategies. However there is some discrepancy between these thresholds and identification of suitable suppression strategies [23]. In order to provide further guidance for Incident Controllers and provide connection between firefighting theory and practice, the findings were subsequently analysed to determine CF as functions of these parameters.

3. Results

Illustrated in Figure 1a–f, critical flow (CF) rates per 10 m section of active head fire range from 0.94 Ls−1 in a 2 m deep active flame front through understorey fuels of 5 tha−1 at a FDI of 10 through to 21.10 Ls−1 in a 10 m deep active flame front through understorey fuels of 30 tha−1 at an FDI of 100. Note: As described above, this study assumes appliances and aircraft can apply a uniform pattern of water to a 10 m length of active head fire front and the results are presented on this basis.
Deterministic analysis of required CF to available CF identifies that a single Light Tanker cannot apply the required flow rate to 10 m section of wildfire front once an active flame depth of 6 m is attained, irrespective of fuel loads and FDI. Prior to the active head fire attaining a 6 m depth, in limited Light Tankers can engage in head fire suppression for a duration of 200 s in limited circumstances. Larger appliances such as the Heavy Tanker have a maximum flow rate of 7.9 Ls−1 and can supply enough water to extinguish at 10 m section of active wildfire front at all FDI’s in understorey fuel loads of 5 tha−1. As conditions worsen, the capacity of a single Heavy Tanker to extinguish a 10 m section of active head fire rapidly diminishes. With significantly higher capabilities, all aircraft assessed are found to provide enough flow rates to extinguish a 10 m section of active head fire, regardless of flame depth, FDI or understorey fuel load. Whilst Figure 1a–f may assist Incident Controllers to determine the suitability of wildfire suppression strategies, the full application of these findings, including the impacts on the logistics of siege wildfire suppression is explored in the Discussion section of this manuscript.
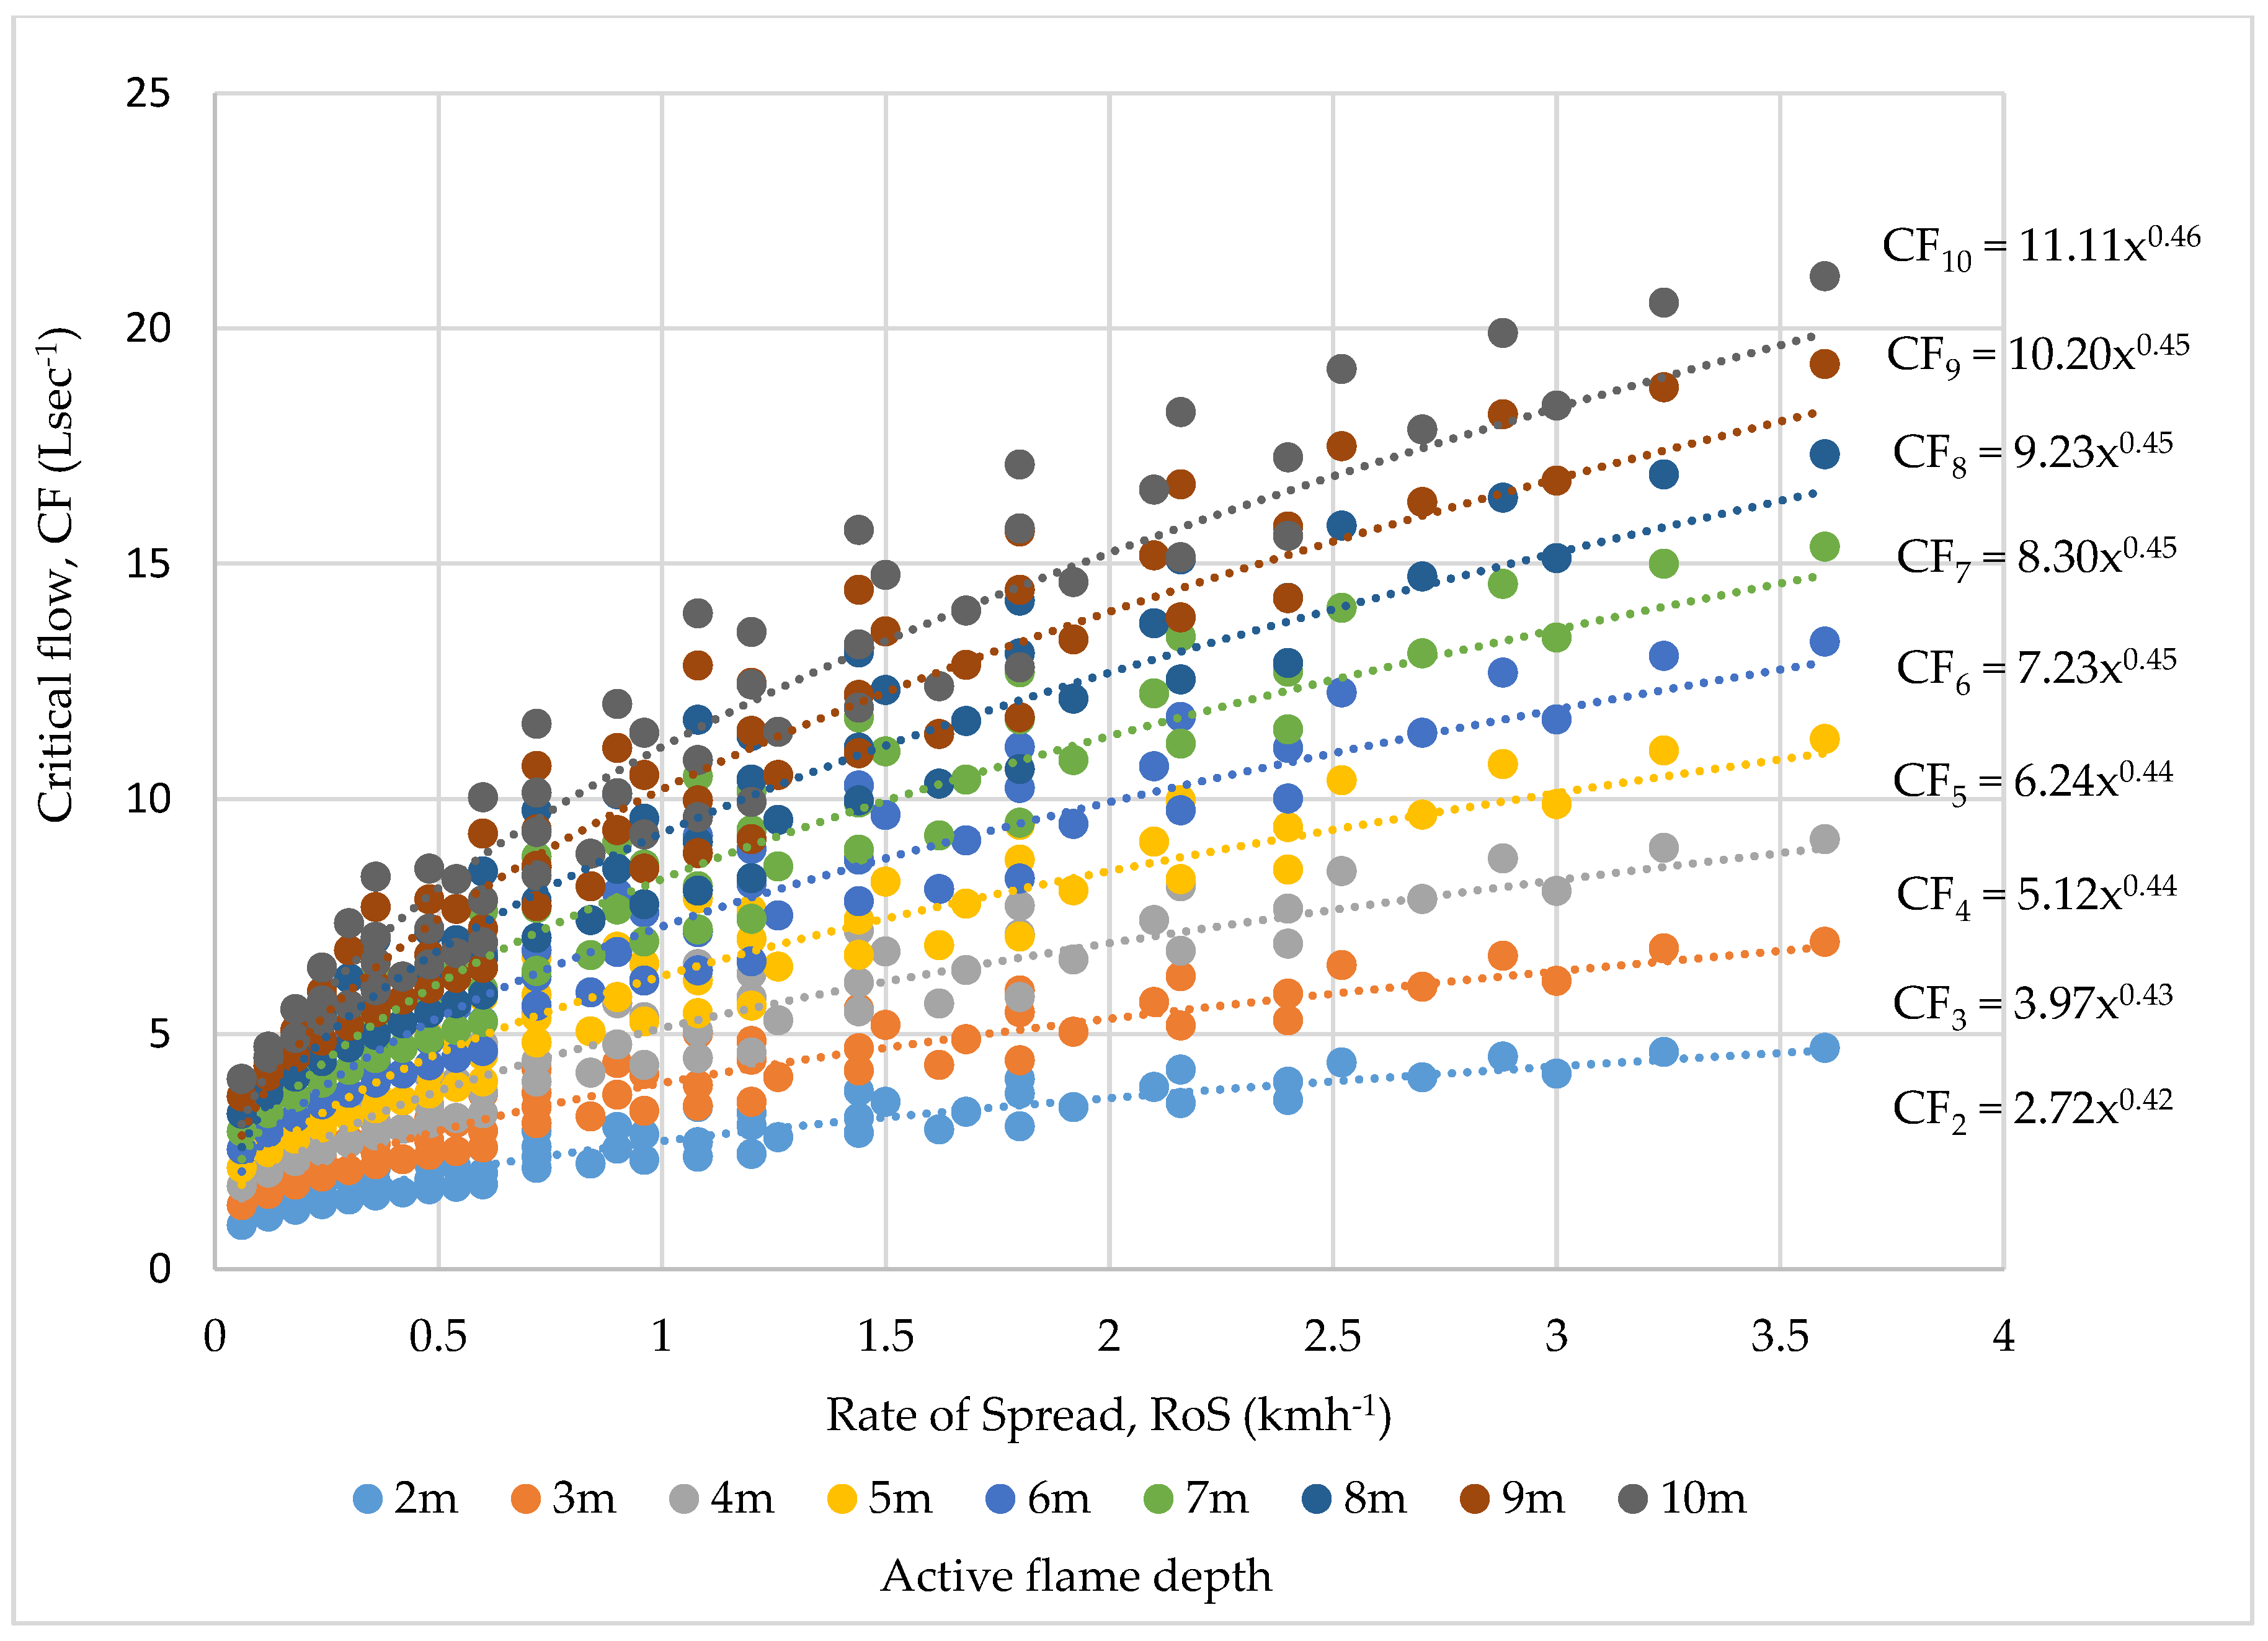
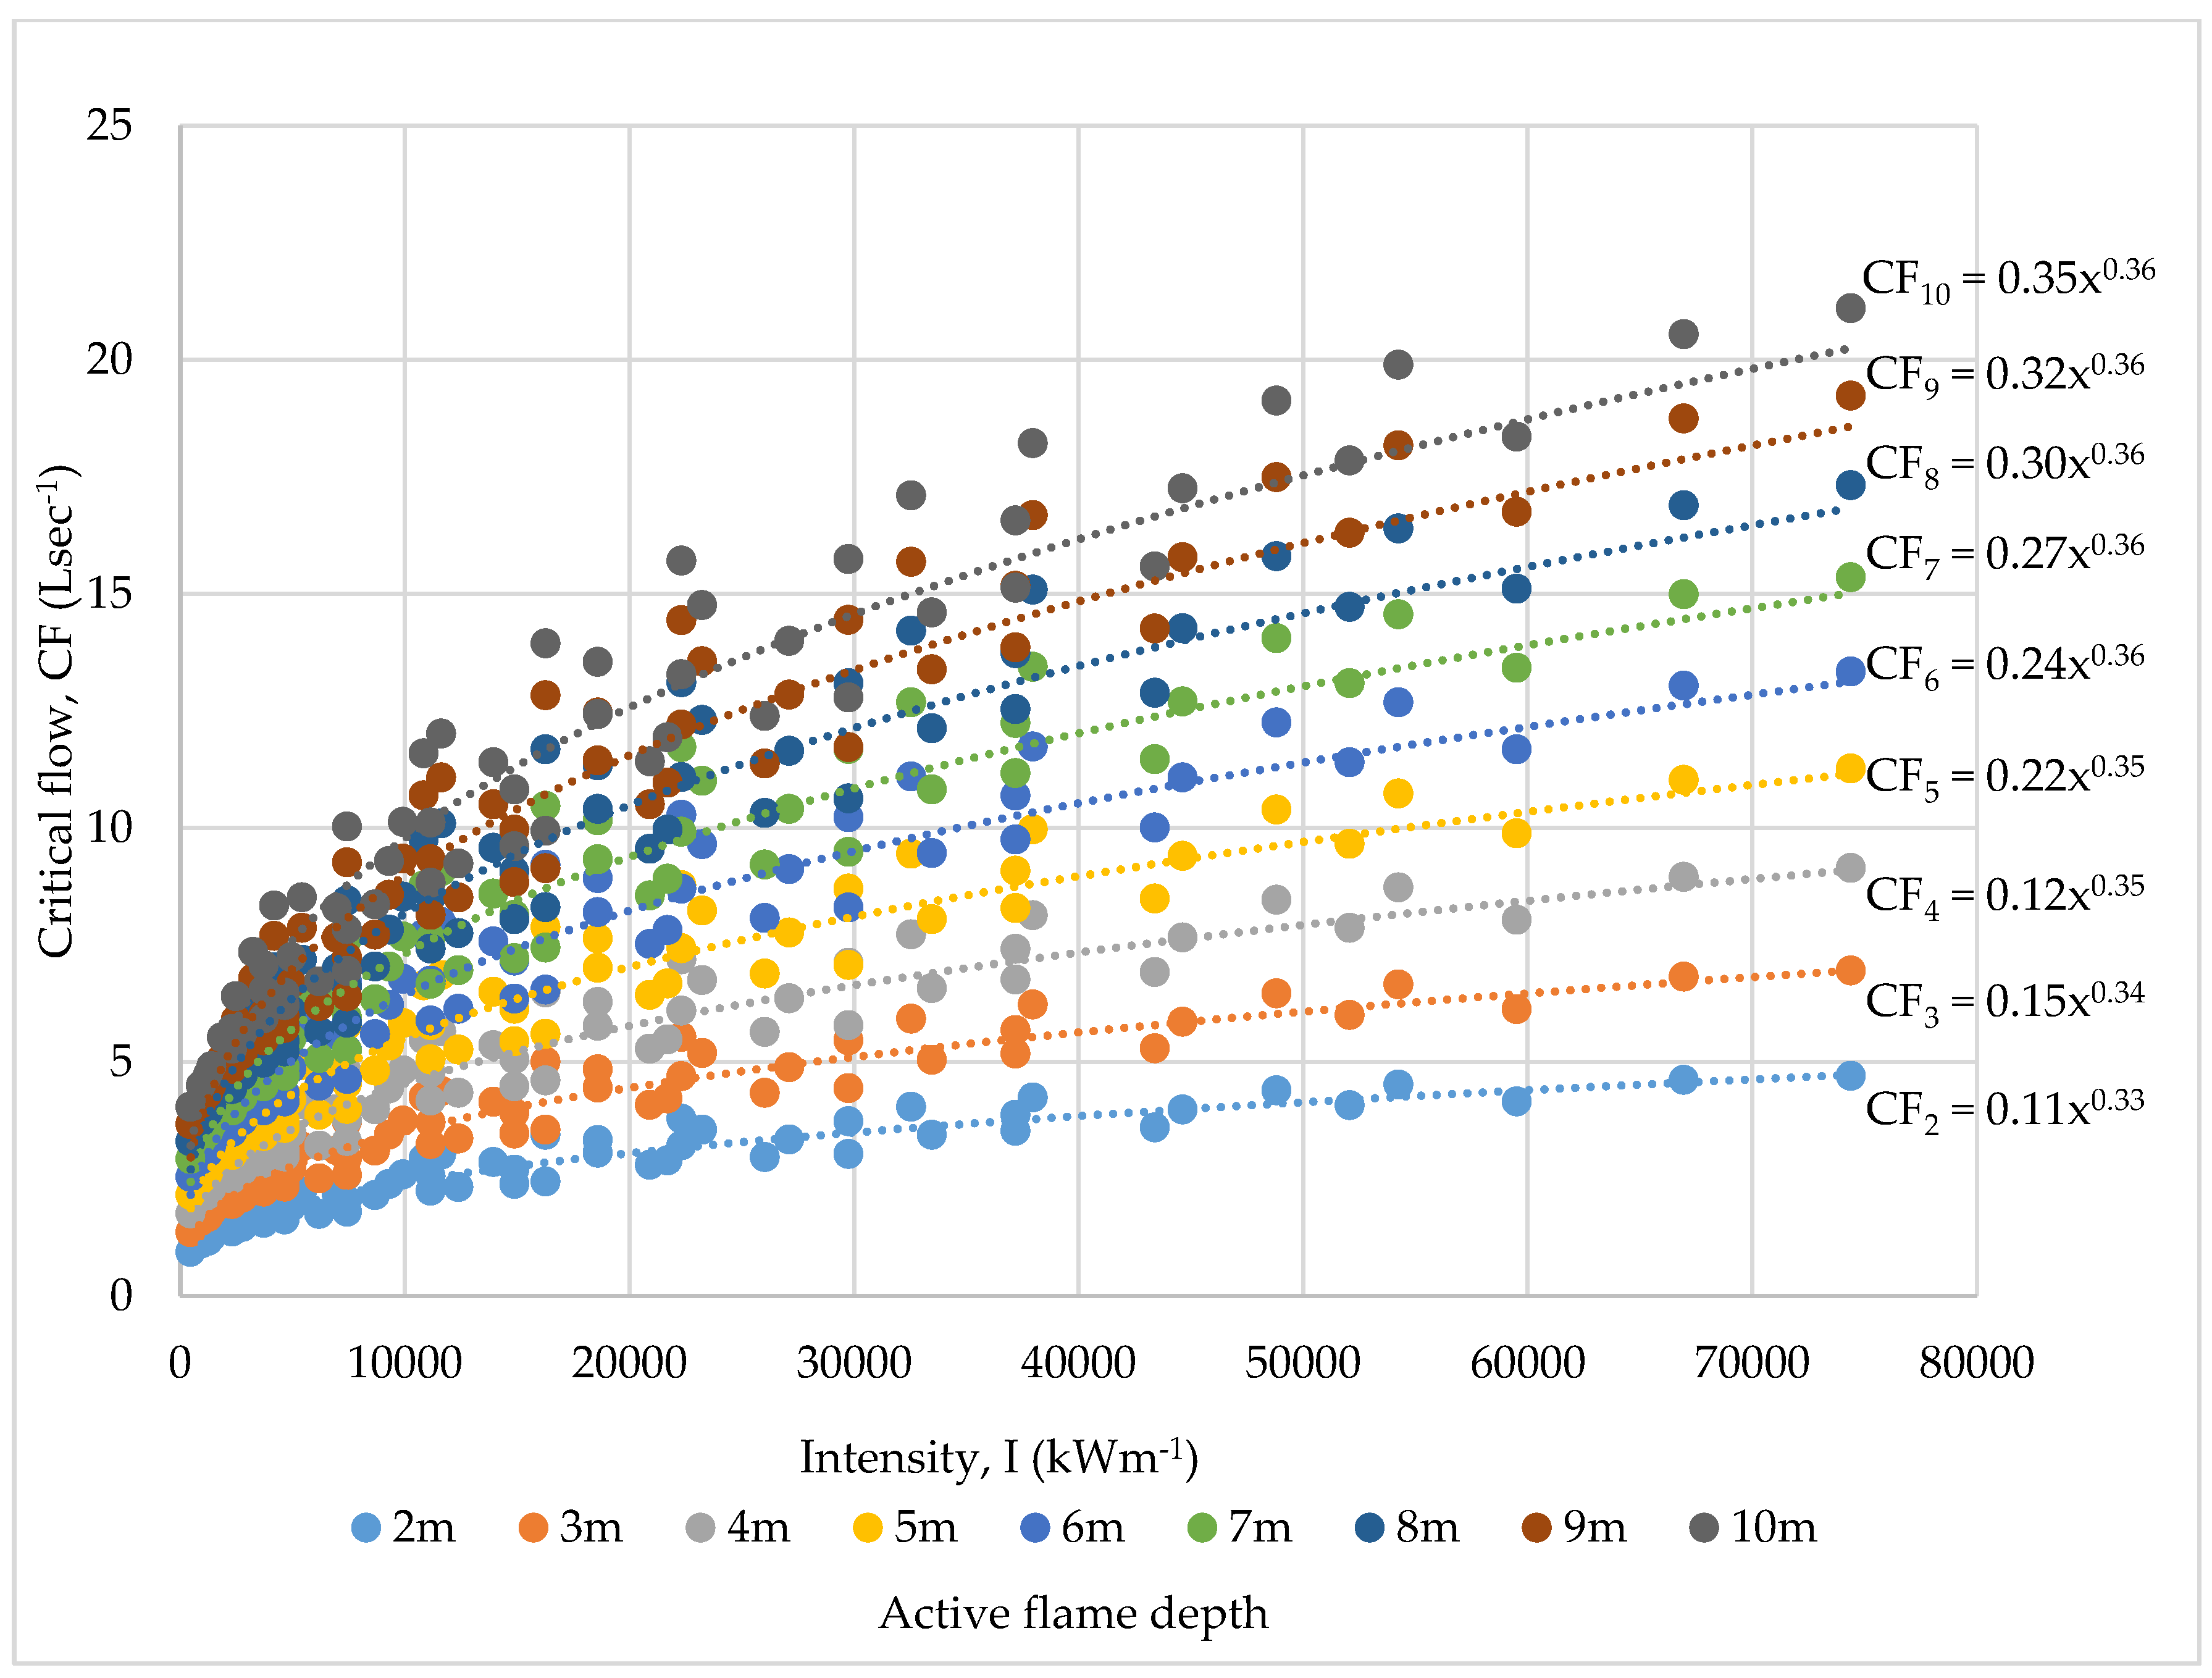
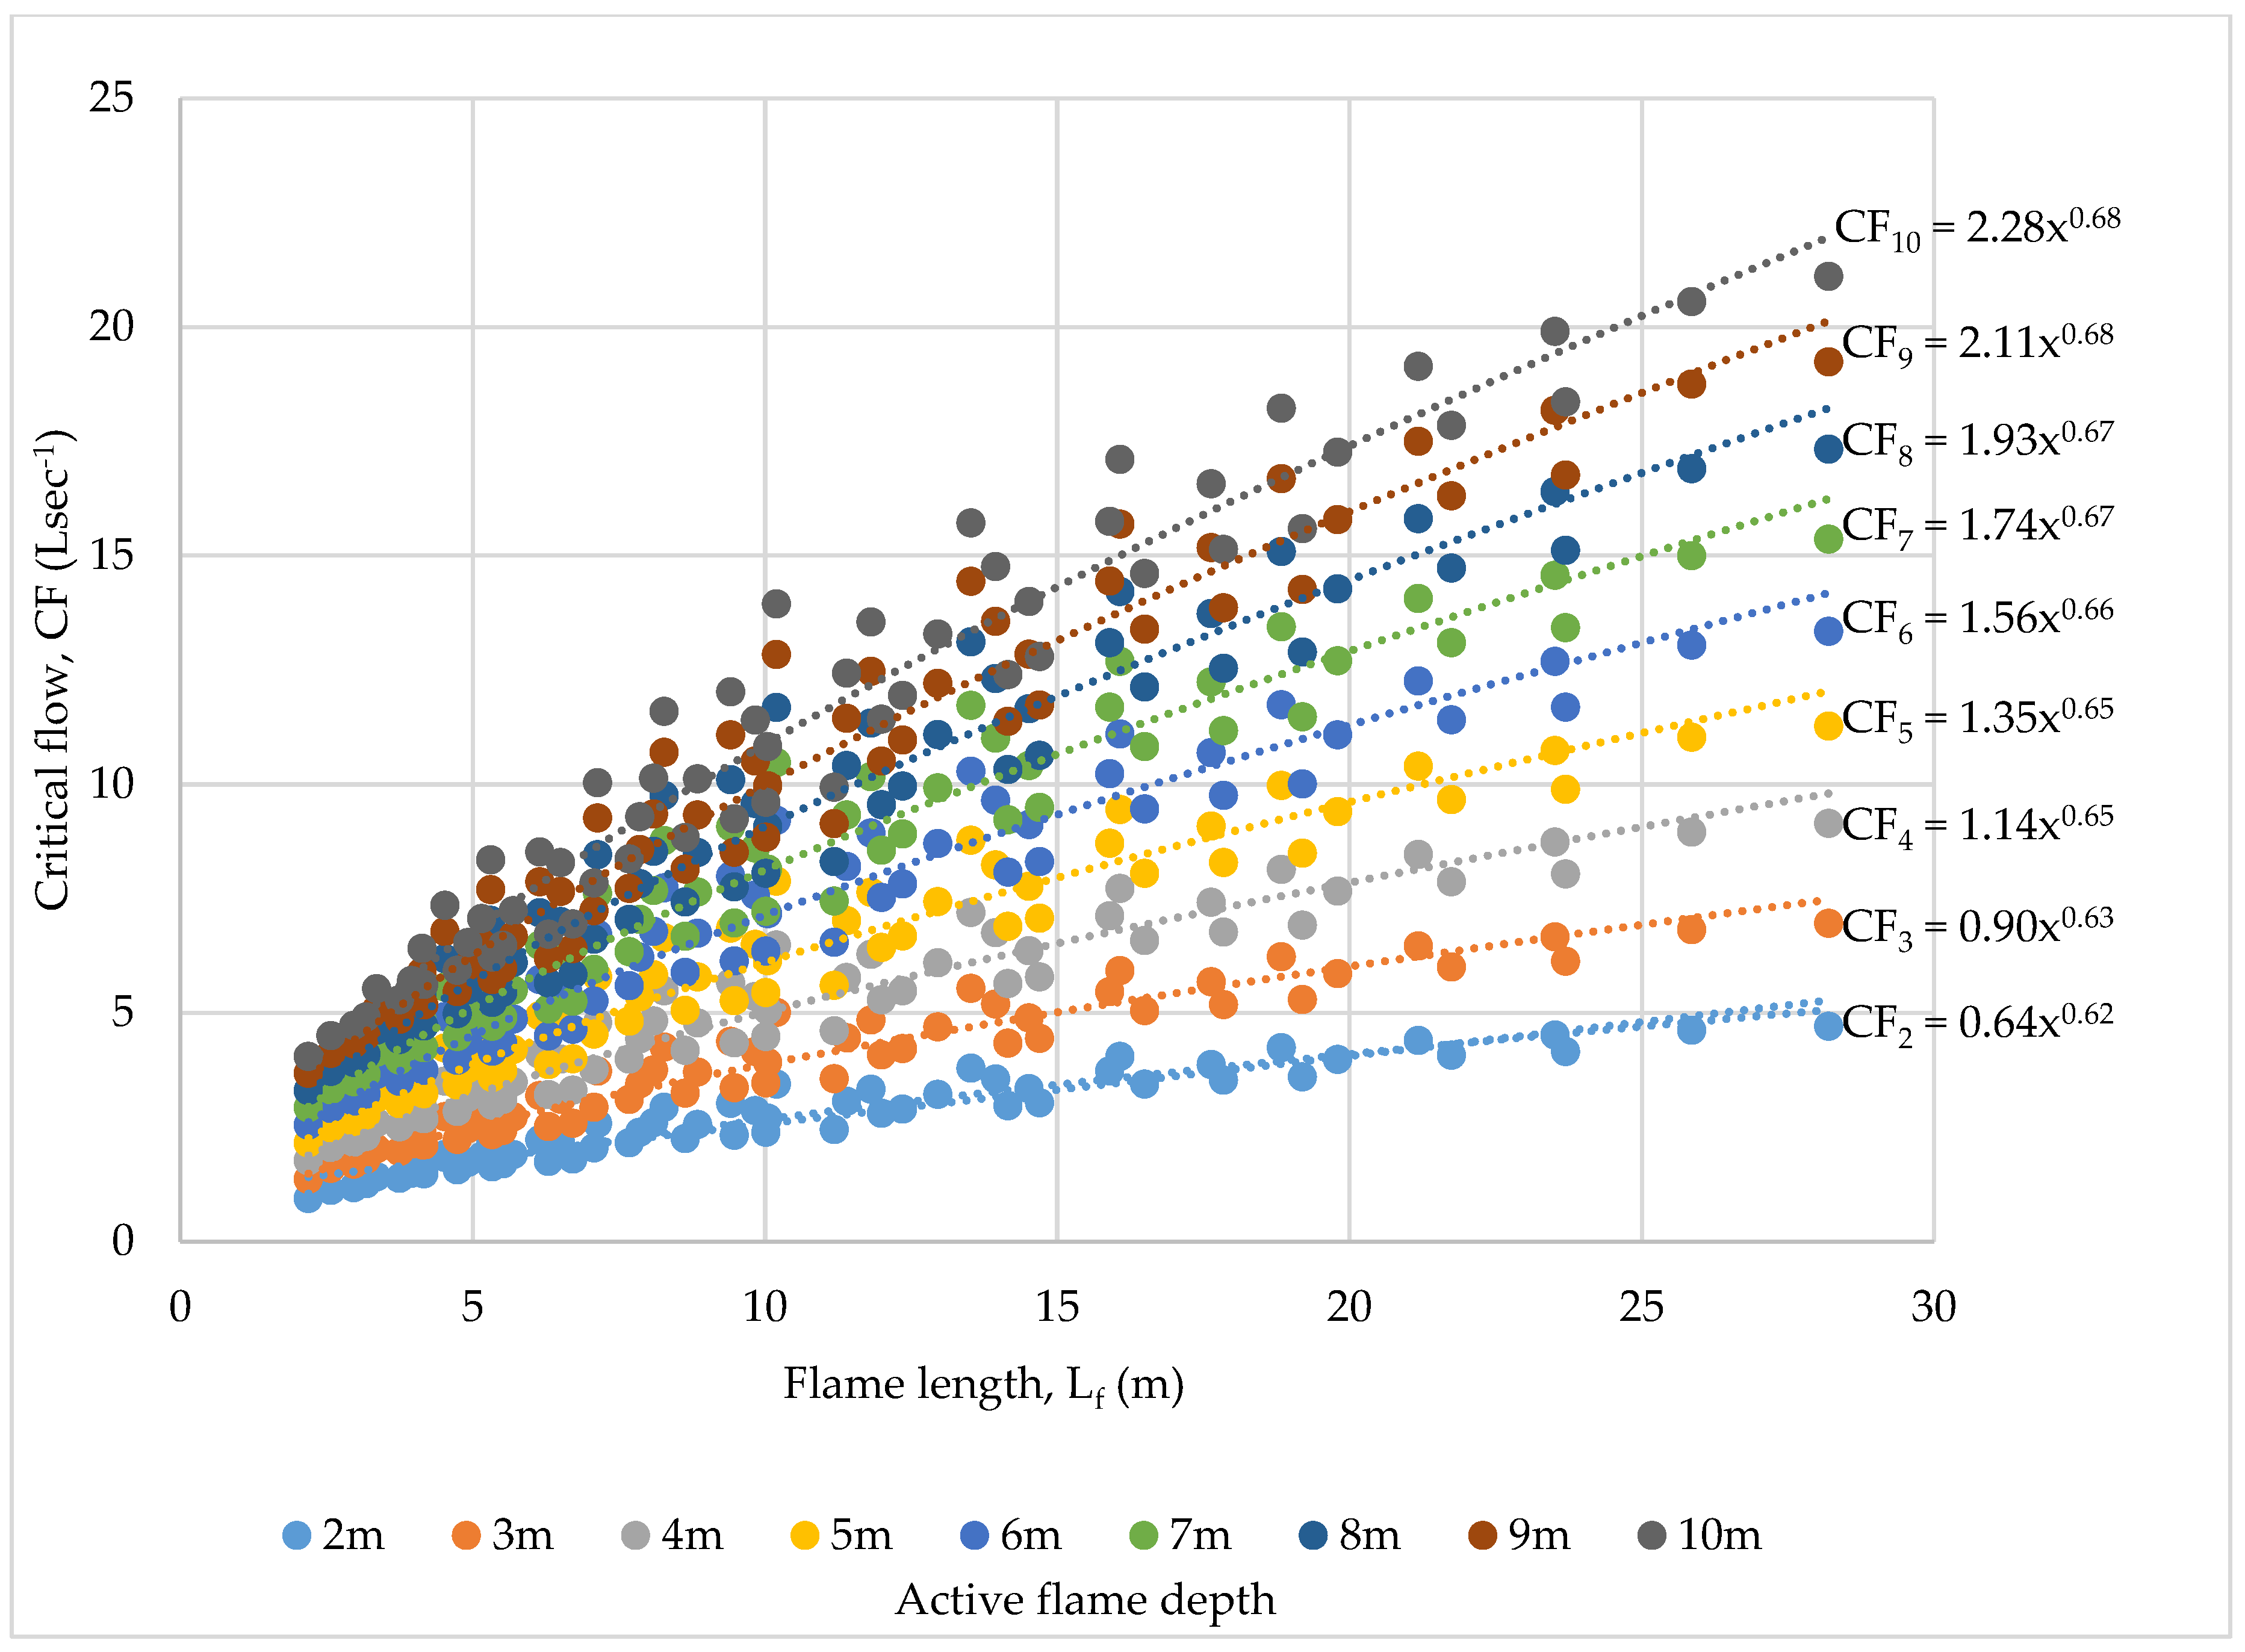
CF as functions of (RoS), intensity (I) and flame length (Lf) are illustrated in Figure 2, Figure 3 and Figure 4. This also enabled CF as a function of active flame depth (CFD) to be expressed as equations of the corresponding the fire behaviour, summarized in Table 2. The advantages of this approach are:
(1)
The analysis incorporates the full spectrum of fire weather conditions and understorey fuel loads. Therefore the CF can be rapidly estimated by Incident Controllers without requiring current or predicted fire weather conditions (an essential component for calculating FDI) or understorey fuel loads (w) which may vary across the landscape. Both these inputs are required for calculating CF refer to Equations (1)–(5); and
(2)
It provides Incident Controllers both visual and mathematical tools to assess the potential suitability of suppression strategies.
The limitation of this approach is that as wildfire behaviour intensifies the power functions appeared to under-predict CF at active flame depths greater than 6m compared to using Fire Point Theory and Equation (1) directly. This may be explained however as the equations are trend lines of the data, which are influenced by the somewhat clustered data at lower levels of wildfire behaviour.

4. Sensitivity

Sensitivity to variations in the base inputs was conducted to evaluate how they influence CF. To complete the sensitivity analysis the following inputs were assumed: FDI = 80, w = 25 tha−1, W = 35 tha−1, D = 4 m, Lf = 19.8 m, I = 43,000 kWm−1, h = 0.077 kW/m2K, Tg = 1090 K, Tfuel = 588 K, η w a t e r = 0.7, L v , w a t e r = 2640 kJkg−1, m ˙ w a t e r , c r , 0 ≈ 0.0129 Lgm−2s−1, τ = 0.8, ϕ = 0.8. As the effects of FDI, fuel load (and thereby Lf and I due to the mathematical relationships identified in Equations (3)–(5)) and flame depth are investigated throughout the study, sensitivity to the remaining inputs was assessed by decreasing and increasing the subject base input by 20%, all other inputs as assumed. The results are summarized in Table 3. With the exception of τ and ϕ , there was little if any change to CF as a result of a 20% to the base input. It is worth noting that in the context of wildfire where the fuel and the flame are in close proximity, both τ and ϕ should be set at 1 [1].

5. Validation

Validation of predictive suppression modelling against large scale, chaotic and turbulent wildfire is inherently problematic. The scale of wildfires such as those described in [12,13,14,15] combined with the limited suitability of suppression strategies [23] and lack of technology available to capture both the efficiency and total application of water [31,32,35,36] during wildfire suppression facilitates little if any available, reliable and relevant data. As a result, like many of the wildfire studies and models currently used by fire services [21,37,38,39,40,41,42], validation of the methodology applied in this study has been only completed for low-intensity wildfire experiments [1].
Hansen [1] reported that whilst experimental values matched ‘very well’ the calculated CF for red pine needles, however in balsam fir slash and black spruce slash the calculated and experimental values did not align well. One of the reasons identified for this occurrence was the variance in flame length and active flame depth through slash compared to that experienced in the fine fuels of pine needles. It should be noted that Equations (3)–(5) applied in this study assume fine fuel involvement only. Another reason for the potential disagreement between experimental slash values and calculated values was identified as the inability of Byram’s active flame depth equation [1]. The methods applied in this report require visual identification of active flame depth which may assist eliminate this issue.
In order to further validate this study during large wildfires the following is recommended:
(1)
real time fire appliance and aircraft telemetry that records active fire suppression time, water application rates and location;
(2)
enhanced quantitative measurement of wildfire behaviour such as that available through aerial intelligence and analysis [36];
(3)
further experimental study in scaled controlled wildfires through natural vegetation structures with a specific focus on CF requirements.
The potential difficulty and expense in completing the identified research is acknowledged, however it should be considered an essential component of enhancing wildfire suppression strategies and thereby reducing the impacts of wildfire on the greater community.

6. Discussion

The results demonstrate small firefighting appliances such as light tankers cannot deliver sufficient water flow rates to extinguish wildfire, regardless of FDI, once the active flame depth reaches 2.5 m in typical Woodland fuels of w = 15 tha−1 or 3 m in typical Forest fuels of w = 25 tha−1 [22,26]. In larger appliances with higher delivery capacities, the required CF cannot be achieved once the active flame depth reaches approximately 5 m with an FDI of 40. All aircraft reviewed are capable of achieving the required CF. However, they remain restricted by the inherent limitations of availability, turn around, restricted ability to operate at night where they may be most effective due to reduced fire behaviour, and the increasing presence of privately operated drones over fire grounds which requires the cessation of aerial suppression on safety grounds [36].
In translating the theory to practical application during a wildfire emergency, Figure 1a–f may assist Incident Controllers quickly determine the suitability of appliance-based suppression strategies where fuel load, FDI and active flame depth are known. In jurisdictions that do not rely on FDI or surface fuel loads, it is suggested Table 2 (with an appropriate safety factor) may be suitable to provide a deterministic assessment required CF to available CF, and therefore determine whether ground suppression efforts are potentially suitable. Used in conjunction with existing suppression thresholds and newer thresholds that consider radiant heat flux and firefighter tenability [23], these results will assist provide greater justification for the selection of appropriate wildfire suppression strategies.
The results also demonstrate the importance of active flame depth when analyzing wildfire severity and the suitability of suppression strategies. In addition to having a significant impact on CF as shown in this study, the depth of the active flame front has significant effects on emissivity and subsequently, radiant heat flux [22,23]. It is therefore proposed that active flame depth may be a better measure of wildfire intensity than the traditional measures of RoS, intensity or Lf utilized internationally. Where active flame depths remain less than 3 m, traditional suppression strategies may remain suitable as long as firefighter tenability is considered and due care is exercised.
In order to meet the required CF to extinguish a wildfire in accordance with the assumptions applied in this research, firefighters must be able to have appliances consistently attacking each 10 m section of wildfire. Whilst it is not in any way suggested incident logistics is as simplistic as providing a single suitable ground appliance for every 10 m section of fire front, it may be applied for determining initial resourcing turnout to developing wildfires that have the potential to grow into siege wildfire dimensions.

7. Conclusions

This study provides guidance for Incident Controllers in relation to CF required to extinguish large wildfire across a wide range of forest fuel loads, fire weather and active fire front depths. Perhaps the greatest ramification of the results is the need to reexamine the use of aerial and appliance suppression in high fire intensity conditions. The use of ground based appliances remains vital in suppression of wildfires. However, in both forest and woodland fuel structures, and when faced with siege wildfire behavior with active flame depths across the head fire greater than 3 m, increased reliance on aerial suppression may be required to deliver the CF necessary to impact the head fire and have any effect on the forward Rate of Spread. In reality of this will require greater investment to ensure that fuel loads adjacent or near congregations of high value assets are prevented from reaching the thresholds that support this level of fire intensity. Fire services investment in improved technologies that supports night time aerial suppression operations during periods of reduced fire behaviour is also suggested. Where aerial resourcing is limited, strategies such as guiding head fire direction and pre-emptive line building adjacent to existing fuel breaks such as major roads, supported by appliance based suppression may provide enhanced outcomes compared to reliance on head fire suppression alone.

Author Contributions

Conceptualization, G.P.; Methodology, G.P.; Validation, G.P.; D.H.; M.C. (Marcus Cattani); M.C. (Murray Carter); Formal Analysis, G.P.; Investigation, G.P.; Resources, G.P.; Data Curation, G.P.; Writing-Original Draft Preparation, G.P.; Writing-Review & Editing, G.P.; D.H.; M.C. (Marcus Cattani); M.C. (Murray Carter); Visualization, G.P.; Supervision, D.H.; M.C. (Marcus Cattani); M.C. (Murray Carter); Project Administration, G.P.

Funding

This research received no external funding.

Acknowledgments

The efforts of the anonymous reviewers and Editorial Board are gratefully acknowledged.

Conflicts of Interest

The authors declare no conflict of interest.

References

  1. Hansen, R. Estimating the amount of water required to extinguish wildfires under different conditions and in various fuel types. Int. J. Wildand Fire 2012, 17, 525–536. [Google Scholar] [CrossRef]
  2. Grimwood, P. Euro Firefighter 2; D&M Heritage Press: West Yorkshire, UK, 2017; ISBN 978-1-911148-10-4. [Google Scholar]
  3. Barnett, C. SFPE (NZ) Technical Publication—TP 2004/1; Society of Fire Protection Engineers: Auckland, New Zealand, 2004; Available online: http://highrisefirefighting.co.uk/docs/sfpe-TP2004-1.pdf (accessed on 3 September 2018).
  4. DFES. Respond to Wildfire—Participant’s Resource; revision 2.1; Department of Fire and Emergency Services: Perth, Australia, 2012.
  5. DFES. Advanced Bush Fire Fighting Learners Manual; revision 1.1; Department of Fire and Emergency Services: Perth, Australia, 2014.
  6. DCBA. Bushfire Behaviour and Suppression Manual; Department of Biodiversity, Conservation and Attractions: Perth, Australia, 2014.
  7. Smith, R. Fire Behaviour Formulas—A Guide for Bushfire Managers; Department of Fire and Emergency Services: Perth, Australia, 2013.
  8. Hirsch, K.; Martell, D. A Review of Initial Attack Fire Crew Productivity and Effectiveness. Int. J. Wildland Fire 1996, 199–215. Available online: http://www.CFs.nrcan.gc.ca/bookstore_pdfs/18905.pdf (accessed on 10 October 2017).
  9. EuroFire. Unit EF2: Apply Techniques and Tactics to Control Vegetation Fires; Global Fire Monitoring Centre, International Association of Fire and Rescue Services and Rural Development Initiatives, Europe, 2012. Available online: http://www.fire.uni-freiburg.de/eurofire/index.html (accessed on 10 October 2017).
  10. Johansson, N.; Svensson, S. Review of the Use of Fire Dynamics Theory in Fire Service Activities. Fire Technol. 2018. [Google Scholar] [CrossRef]
  11. Grenfell Tower Inquiry. Available online: https://www.grenfelltowerinquiry.org.uk/ (accessed on 3 September 2018).
  12. Top 20 Destructive Fires. Available online: http://www.fire.ca.gov/communications/downloads/fact_sheets/Top20_Destruction.pdf (accessed on 3 September 2018).
  13. USFS; CDFFP. California Fire Siege 2003—The Story; United States Fire Service and California Department of Forestry and Fire Protection: Sacramento, CA, USA, 2004.
  14. Death Toll Rises to 91 in Deadly Greece Wildfire. Available online: https://www.cbsnews.com/news/death-toll-rises-deadly-greece-wildfires-today-2018-07-29/ (accessed on 3 September 2018).
  15. Bushfire CRC. Victorian 2009 Bushfire Research Response Final Report; Bushfire Collaborative Research Council: Melbourne, Australia, 2009. [Google Scholar]
  16. Penney, G. Dynamic Risk Management in Fire and Rescue Emergency Operations. Master’s Thesis, Edith Cowan University, Perth, Australia, 2016. [Google Scholar]
  17. Duff, T.; Tolhurst, K. Operational wildfire suppression modelling: A review of evaluating development, state of the art and future directions. Int. J. Wildland Fire 2015, 24, 735–748. [Google Scholar] [CrossRef]
  18. Thompson, M.; Silva, F.R.; Calkin, D.; Hand, M. A review of challenges to determining and demonstrating efficiency of large fire management. Int. J. Wildland Fire 2017, 26, 562–573. [Google Scholar] [CrossRef]
  19. Särdqvist, S. Water and Other Extinguishing Agents; Swedish Rescue Services Agency: Lund, Switzerland, 2002; ISBN 91-7253-265-3. [Google Scholar]
  20. Penney, G. Evidence Based Practice in Fire & Rescue Operations. Tech. Rescue 2013, 65, 68–70. [Google Scholar]
  21. Cruz, M.; Gould, J.; Alexander, M.; Sullivan, A.; McCaw, L.; Matthews, S. Empirical-based models for predicting head-fire rate of spread in Australian fuel types. Aust. For. 2015, 78, 118–158. [Google Scholar] [CrossRef]
  22. Penney, G. Bushfire Fuels—Representation in Empirical and Physics Based Models. Master’s Thesis, Victoria University, Melbourne, Australia, 2017. [Google Scholar]
  23. Penney, G.; Habibi, D.; Cattani, M. Firefighter tenability and its influence on siege wildfire suppression. Fire Saf. J. 2019. under review. [Google Scholar]
  24. Cruz, M.; Sullivan, A.; Gould, J.; Sims, N.; Bannister, A.; Hollis, J.; Hurley, R. Anatomy of catastrophic wildfire: The Black Saturday East fire in Victoria, Australia. For. Ecol. Manag. 2012, 284, 269–285. [Google Scholar] [CrossRef]
  25. Byram, G. Combustion of forest fuels. In Forest Fire: Control and Use; Davis, K., Ed.; McGraw-Hill Book Company Inc.: New York, NY, USA, 1959. [Google Scholar]
  26. SAI Global. AS3959:2009 Construction of Buildings in Bushfire-Prone Areas; Standards Australia: Sydney, Australia, 2009. [Google Scholar]
  27. Poon, S. Predicting Radiation Exposure from an Advancing Bushfire Flame Front; Warrington Fire: Dandenong South, Australia, 2003. [Google Scholar]
  28. Rossi, J.; Simeoni, A.; Moretti, B.; Leroy-Cancellieri, V. An analytical model based on radiative heating for the determination of safety distances in wildland fires. Fire Saf. J. 2011, 46, 520–527. [Google Scholar] [CrossRef]
  29. Wotton, M.; Gould, J.; McCaw, L.; Cheney, N.; Taylor, W. Flame temperature and residence times of fires in dry eucalypt forest. Int. J. Wildland Fire 2011, 21, 270–281. [Google Scholar] [CrossRef]
  30. Dowdy, A.; Mills, G.; Finkele, K.; deGroot, W. CAWCR Technical Report No. 10—Australian Fire Weather as Represented by the McArthur Forest Fire Danger Index and Canadian Forest Fire Danger Index; The Centre for Australian Weather and Climate Research: Canberra, Australia, 2012; ISBN 9781921605185.
  31. DFES. Driver/Operator Manual Urban Tanker 3.4; 1st version; Department of Fire and Emergency Services: Perth, Australia, 2017.
  32. DFES. Driver/Operator Manual Light Tanker MK22; 2nd version; Department of Fire and Emergency Services: Perth, Australia, 2013.
  33. DFES. Operational Equipment Resource NUCOM—Delta 500 Branch; version 1.0; Department of Fire and Emergency Services: Perth, Australia, 2014.
  34. DFES. Operational Equipment Resource NUCOM—Task Force Tip; version 1.0; Department of Fire and Emergency Services: Perth, Australia, 2014.
  35. DFES. Specification FES-023 for Vehicle Crew Protection Deluge Systems; version 1.9; Department of Fire and Emergency Services: Perth, Australia, 2016.
  36. Parks, D.; (Department of Fire and Emergency Services, Perth, Australia); Penney, G.; (Edith Cowan University, Perth, Australia). Personal Communication, 10 August 2018.
  37. Noble, I.; Bary, G.; Gill, A. McArthur’s fire-danger meters expressed as equations. Aust. J. Ecol. 1980, 5, 201–203. [Google Scholar] [CrossRef]
  38. Cheney, N. Fire behaviour. In Fire and the Australian Biota; Australian Academy of Science: Canberra, Australia, 1981; pp. 151–175. [Google Scholar]
  39. Sullivan, A. Wildland surface fire spread modelling, 1990–2007. 1: Physical and quasi-physical models. Int. J. Wildland Fire 2009, 18, 349–369. [Google Scholar] [CrossRef]
  40. Sullivan, A. Wildland surface fire spread modelling, 1990–2007. 2: Empirical and quasi-empirical models. Int. J. Wildland Fire 2009, 369–386. [Google Scholar] [CrossRef]
  41. Cruz, M.; Sullivan, A.; Leonard, R.; Malkin, S.; Matthews, S.; Gould, J.; McCaw, W.; Alexander, M. Fire Behaviour Knowledge in Australia; Bushfire Cooperative Research Centre: Melbourne, Australia; ISBN 987-0-9925684-2-9.
  42. Gould, J.; McCaw, W.; Cheney, N.; Ellis, P.; Knight, I.; Sullivan, A. Project Vesta—Fire in Dry Eucalypt Forest: Fuel Structure, Dynamics and Fire Behaviour; CSIRO: Perth, Australia, 2007; ISBN 978-0643065345.
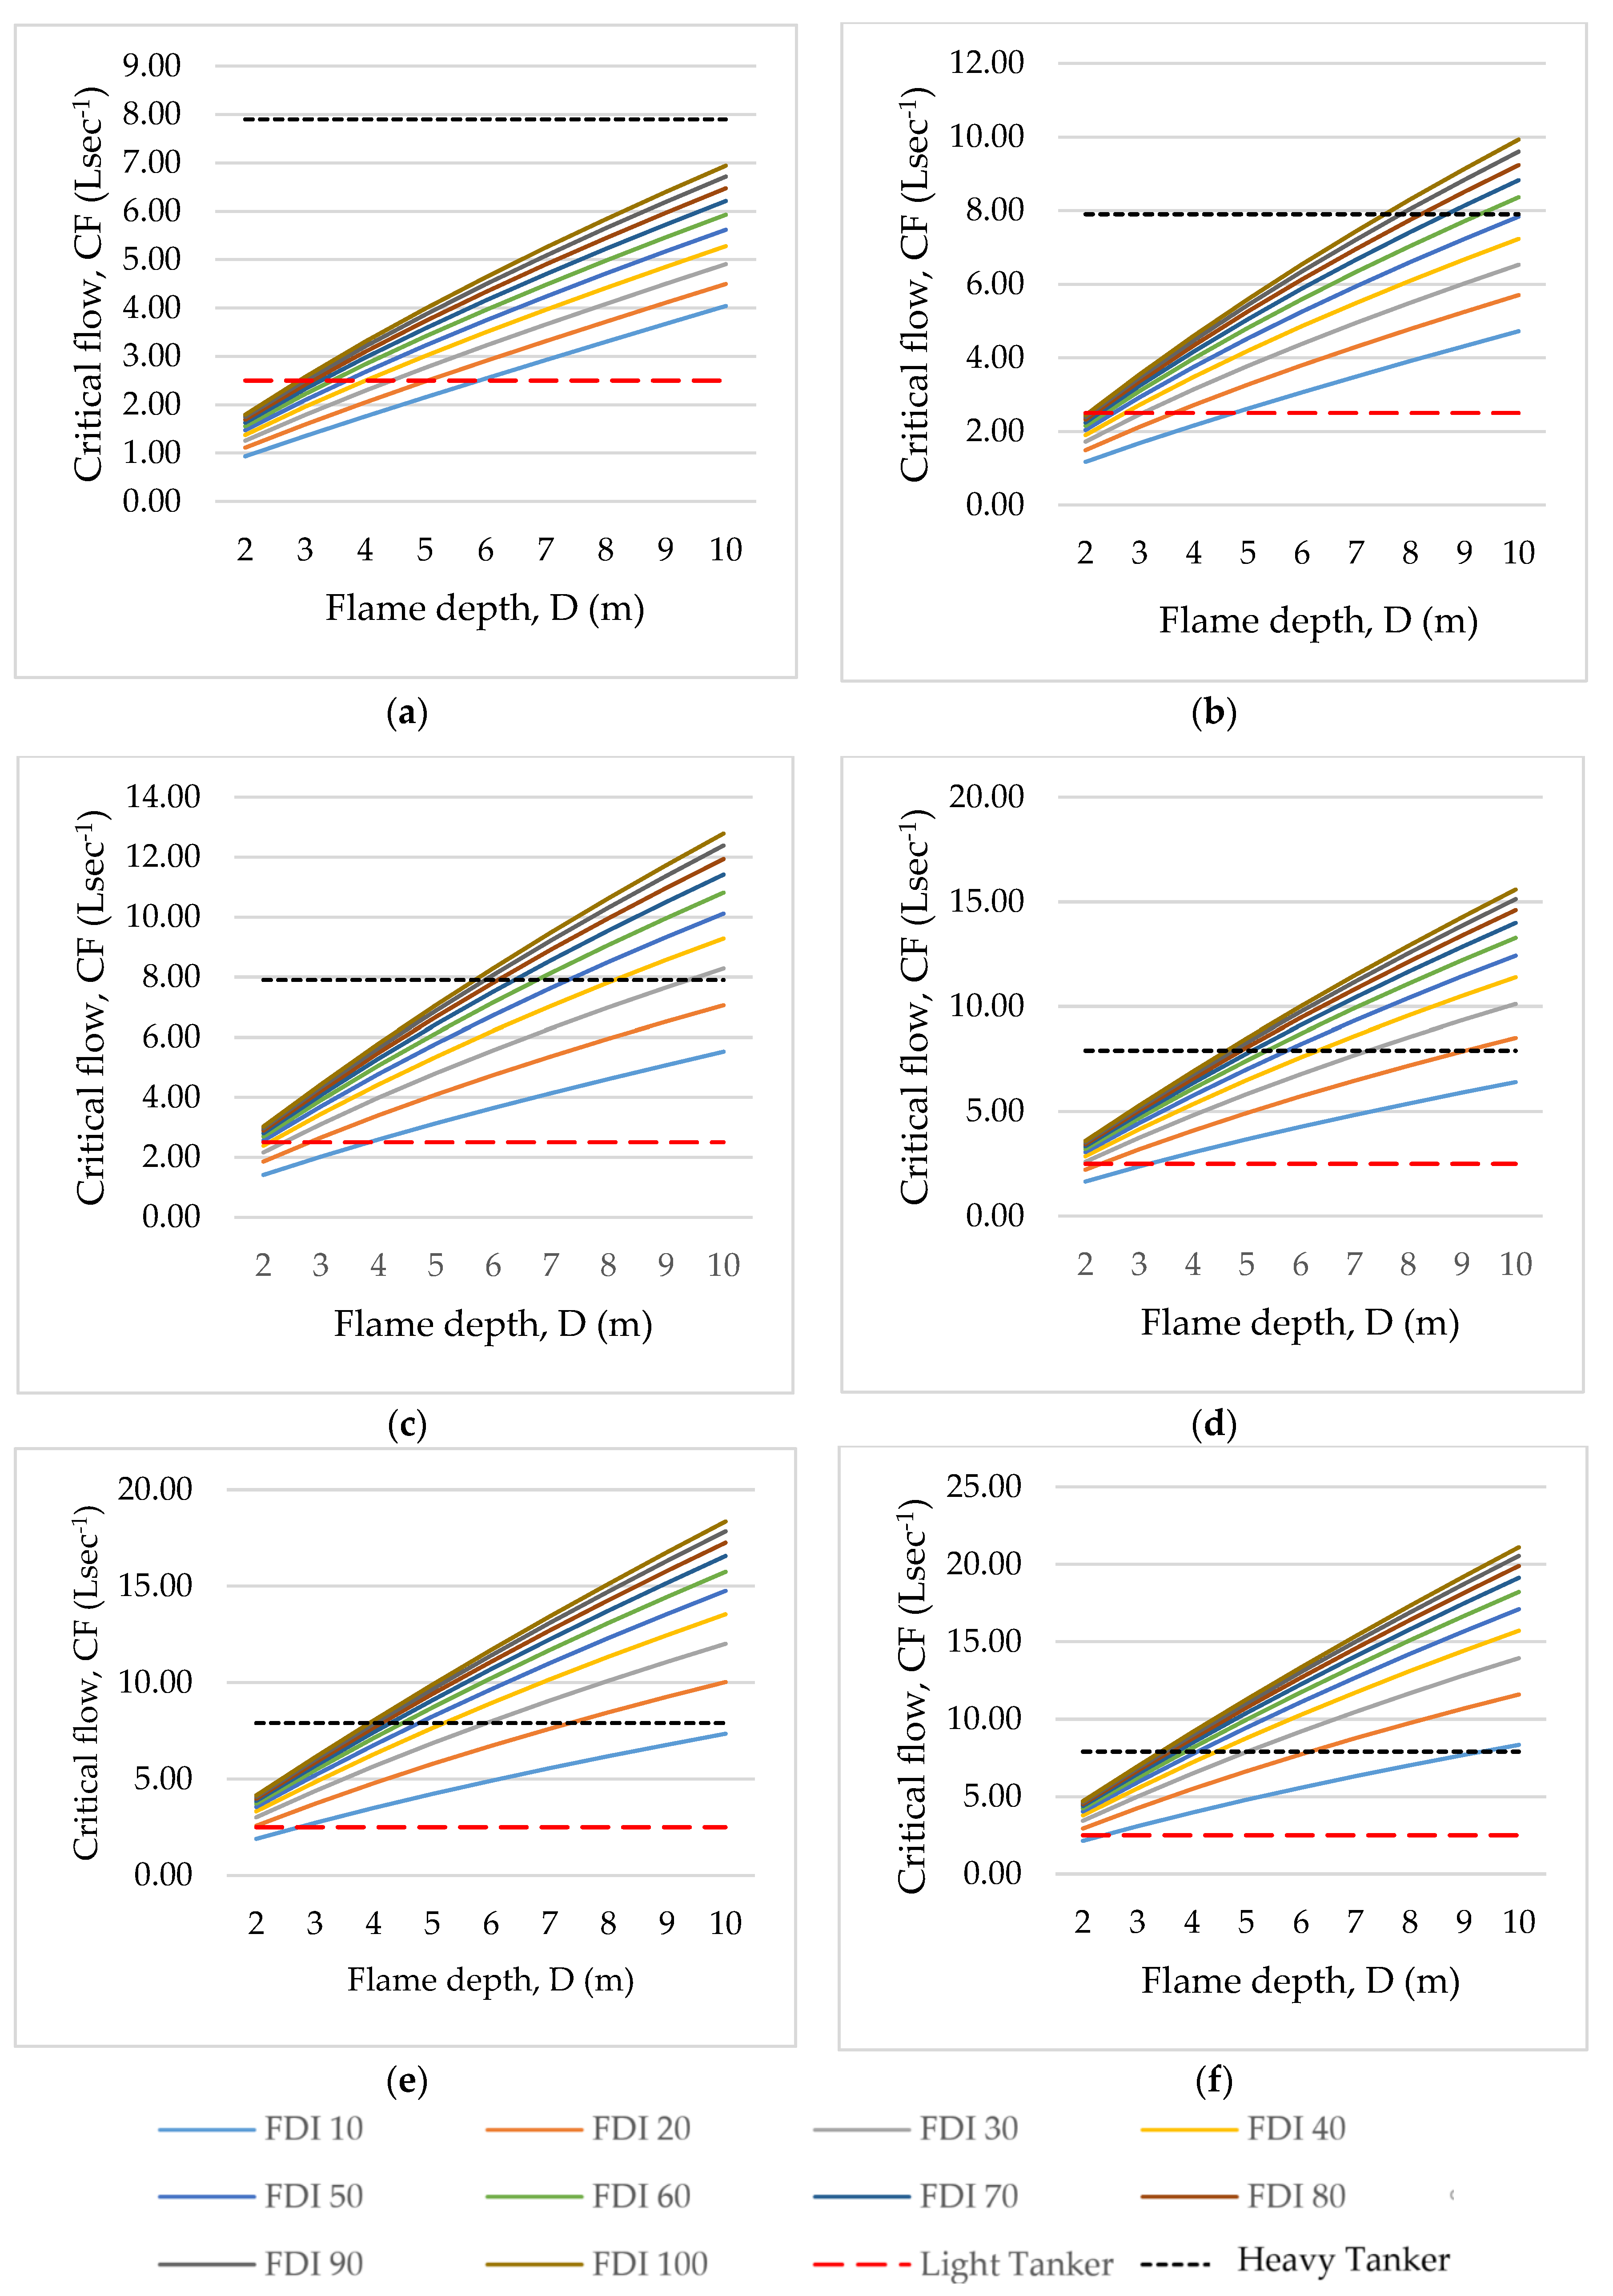
Figure 1. Critical flow, (CF) per 10 m length of head fire across the selected range of FDI’s for Forest with surface fuel loads (w) of: (a) 5 tha−1; (b) 10 tha−1; (c) 15 tha−1; (d) 20 tha−1; (e) 25 tha−1; (f) 30 tha−1.
Fire 02 00003 g001
Figure 2. Critical flow rates at various active flame depths, CFD (Ls−1), as a function of head fire Rate of Spread, RoS (kmh−1).
Fire 02 00003 g002
Figure 3. Critical flow rates at various active flame depths, CFD (Ls−1), as a function of intensity, I (kWm−1).
Fire 02 00003 g003
Figure 4. Critical flow rates at various active flame depths, CFD (Ls−1), as a function of flame length, Lf (m)
Fire 02 00003 g004
Table 1. Appliance and aircraft water suppression capabilities.
TypeNameWater Capacity (L)Flow Rate (Ls−1)
Aircraft-Rotary 1 [36]Dauphin Type 21000–1200~333–400
Aircraft-Rotary 2 [36]Erikson S64E Aircrane7560~1512
Aircraft-Fixed wing 3 [36]AirTractor AT802F3150~1050
Appliance 4WD 4 [32,33,34]Light Tanker~5002.5
Appliance 4WD 4,5 [31,33,34,35]Heavy Tanker~30003.8–7.9
1 Drop width ~6 m, drop length ~15 m, full deployment in 3 s; 2 Drop width >8 m, drop length ~30 m, full deployment in 5 s; 3 Drop width ~6 m, drop length ~30 m, full deployment in 3 s; 4 Branch jet spray width ~1 m; 5 700 L water required for appliance sprinkler protection which activates at 3 Ls−1 from each head.
Table 2. CFd as functions of Rate of Spread, intensity and flame length.
Rate of Spread, RoS (kmh−1)
Active Flame Depth (m)Function
2CF2 = 2.72 RoS0.42
3CF3 = 3.97 RoS0.43
4CF4 = 5.12 RoS0.44
5CF5 = 6.24 RoS0.44
6CF6 = 7.23 RoS0.45
7CF7 = 8.30 RoS0.45
8CF8 = 9.23 RoS0.45
9CF9 = 10.20 RoS0.45
10CF10 = 11.11 RoS0.46
Intensity, I (kWm−1)
Active Flame Depth (m)Function
2CF2 = 0.11(I)0.33
3CF3 = 0.15(I)0.34
4CF4 = 0.12(I)0.35
5CF5 = 0.22(I)0.35
6CF6 = 0.24(I)0.36
7CF7 = 0.27(I)0.36
8CF8 = 0.30(I)0.36
9CF9 = 0.32(I)0.36
10CF10 = 0.35(I)0.36
Flame Length, Lf (m)
Active Flame Depth (m)Function
2CF2 = 0.64 Lf0.62
3CF3 = 0.90 Lf0.63
4CF4 = 1.14 Lf0.65
5CF5 = 1.35 Lf0.65
6CF6 = 1.56 Lf0.66
7CF7 = 1.74 Lf0.67
8CF8 = 1.93 Lf0.67
9CF9 = 2.11 Lf0.68
10CF10 = 2.28 Lf0.68
Table 3. Sensitivity analysis.
Input% Change to Base Input% Change to Critical Flow (CF)
h±20%±1%
Tg±20%±2%
Tfuel±20%±1%
η w a t e r ±20%±1%
L v , w a t e r ±20%±1%
m ˙ w a t e r , c r , 0 ±20%±0%
τ ±20%±24%
ϕ ±20%±24%