1. Introduction
Cold atmospheric plasma (CAP) exists in non-thermal equilibrium, with hot electrons and relatively cold ions and neutrals, at atmospheric pressure. Due to the unique nature of CAP, it can be used on many sensitive targets for applications such as medicine, agriculture, and beyond [
1,
2,
3]. These applications include surface sterilization [
4,
5] and wood treatment [
6], as well as food production [
2]. A field of major potential for CAP is the medical field. CAP can be used for wound healing [
1], cancer treatment [
7,
8], dental treatments [
9,
10], and others [
11]. These applications have garnered attention for CAP across many fields. However, CAP is a relatively new field with many unexplored avenues of control and optimization. One such avenue is the application of network analysis. Network analysis can have many potential benefits, including finding key operational modes for CAP devices.
1.1. CAP Devices
Little research has been performed on optimizing CAP devices. Research primarily analyzes general trends through experimental data in one and two dimensions [
12]. Recently, several efforts have started to apply machine learning to CAP devices to better predict the behavior of these highly sensitive devices [
13,
14,
15,
16]. CAP is sensitive to environmental factors such as humidity and distance to the target. This makes predicting the behavior of these devices in application difficult. However, a high level of control and predictability is required when dealing with sensitive targets, such as human neural tissue.
One key diagnostic of CAP is optical emission spectroscopy. The emission lines of CAP devices have been well studied, and key excited species have been identified [
17]. Through our experimentation, we have noticed potential repeating patterns in our CAP device when analyzing how these peaks fluctuate with changes in input voltage and frequency. However, understanding the landscape of these patterns is difficult. Network analysis allows us to identify modality within our jet data to identify key operational modes.
1.2. Network Analysis
Network analysis creates graphs containing nodes and edges from complex systems for analysis. Nodes are parts of a system and edges are formed based on the transfer of information, energy, or physical material. Network analysis can be used to identify modality, determine robustness, and more within a system. However, for the analysis to be valid, the assumption that the graph is based on must be true. This is easier in the case of physical systems where parts are nodes, and the transfer of energy and materials can be more easily tracked. However, this can be more complicated in more abstract and/or poorly understood systems.
CAP devices are extremely complicated. The plasma forms part of the electrical circuit that powers the jet. However, the jet also interacts with the air and nearby electromagnetic boundaries, such as the target and objects in the room. Further, the chemistry that is part of the jet formation depends heavily on the atmosphere. The many different chemical and physical influences on the jet make the CAP device itself a complex system that is difficult to understand and predict. In addition, these numerous factors make determining what elements to use as nodes when creating a network representation of CAP devices difficult.
To overcome this issue, we took inspiration from an effort that used biological neurons as nodes and the ignition of signals between neurons as edges [
18]. We took the ignition of the plasma jet as an indication of energy being passed within the system. However, creating a physical network to represent the passing of this energy was beyond our current capabilities. Instead, we looked at the CAP parameter space.
The parameter space allowed an easily bounded system to be created while still allowing an underlying structure of how plasma ignition depends on voltage and frequency to be uncovered. Complex analysis with a network in an abstract space has been conducted before in the literature, such as one study that worked with random boolean networks in state space [
19]. In our effort, we treated input voltages and frequencies as nodes in a bipartite graph and formed edges between these nodes when a voltage and frequency combination resulted in an ignited jet. Frequency and voltage were chosen as nodes because these parameters are highly controllable and consistently exhibit operational differences in CAP research. Several other parameters such as flow rate, gap length, and environmental conditions are also of interest and will be considered in future studies.
We found a modality within the system using the SVD method described by Dong et al. that reflected groups of points in a parameter space that resulted in jets with similar spectrographic data [
20]. The correlation of this modality to the spectral data indicates that the found structure is reflected in the physical system. In addition, we determined that the voltage and frequency predominantly affected the jet’s operating space independently from one another.
2. Materials and Methods
2.1. Experimental Setup
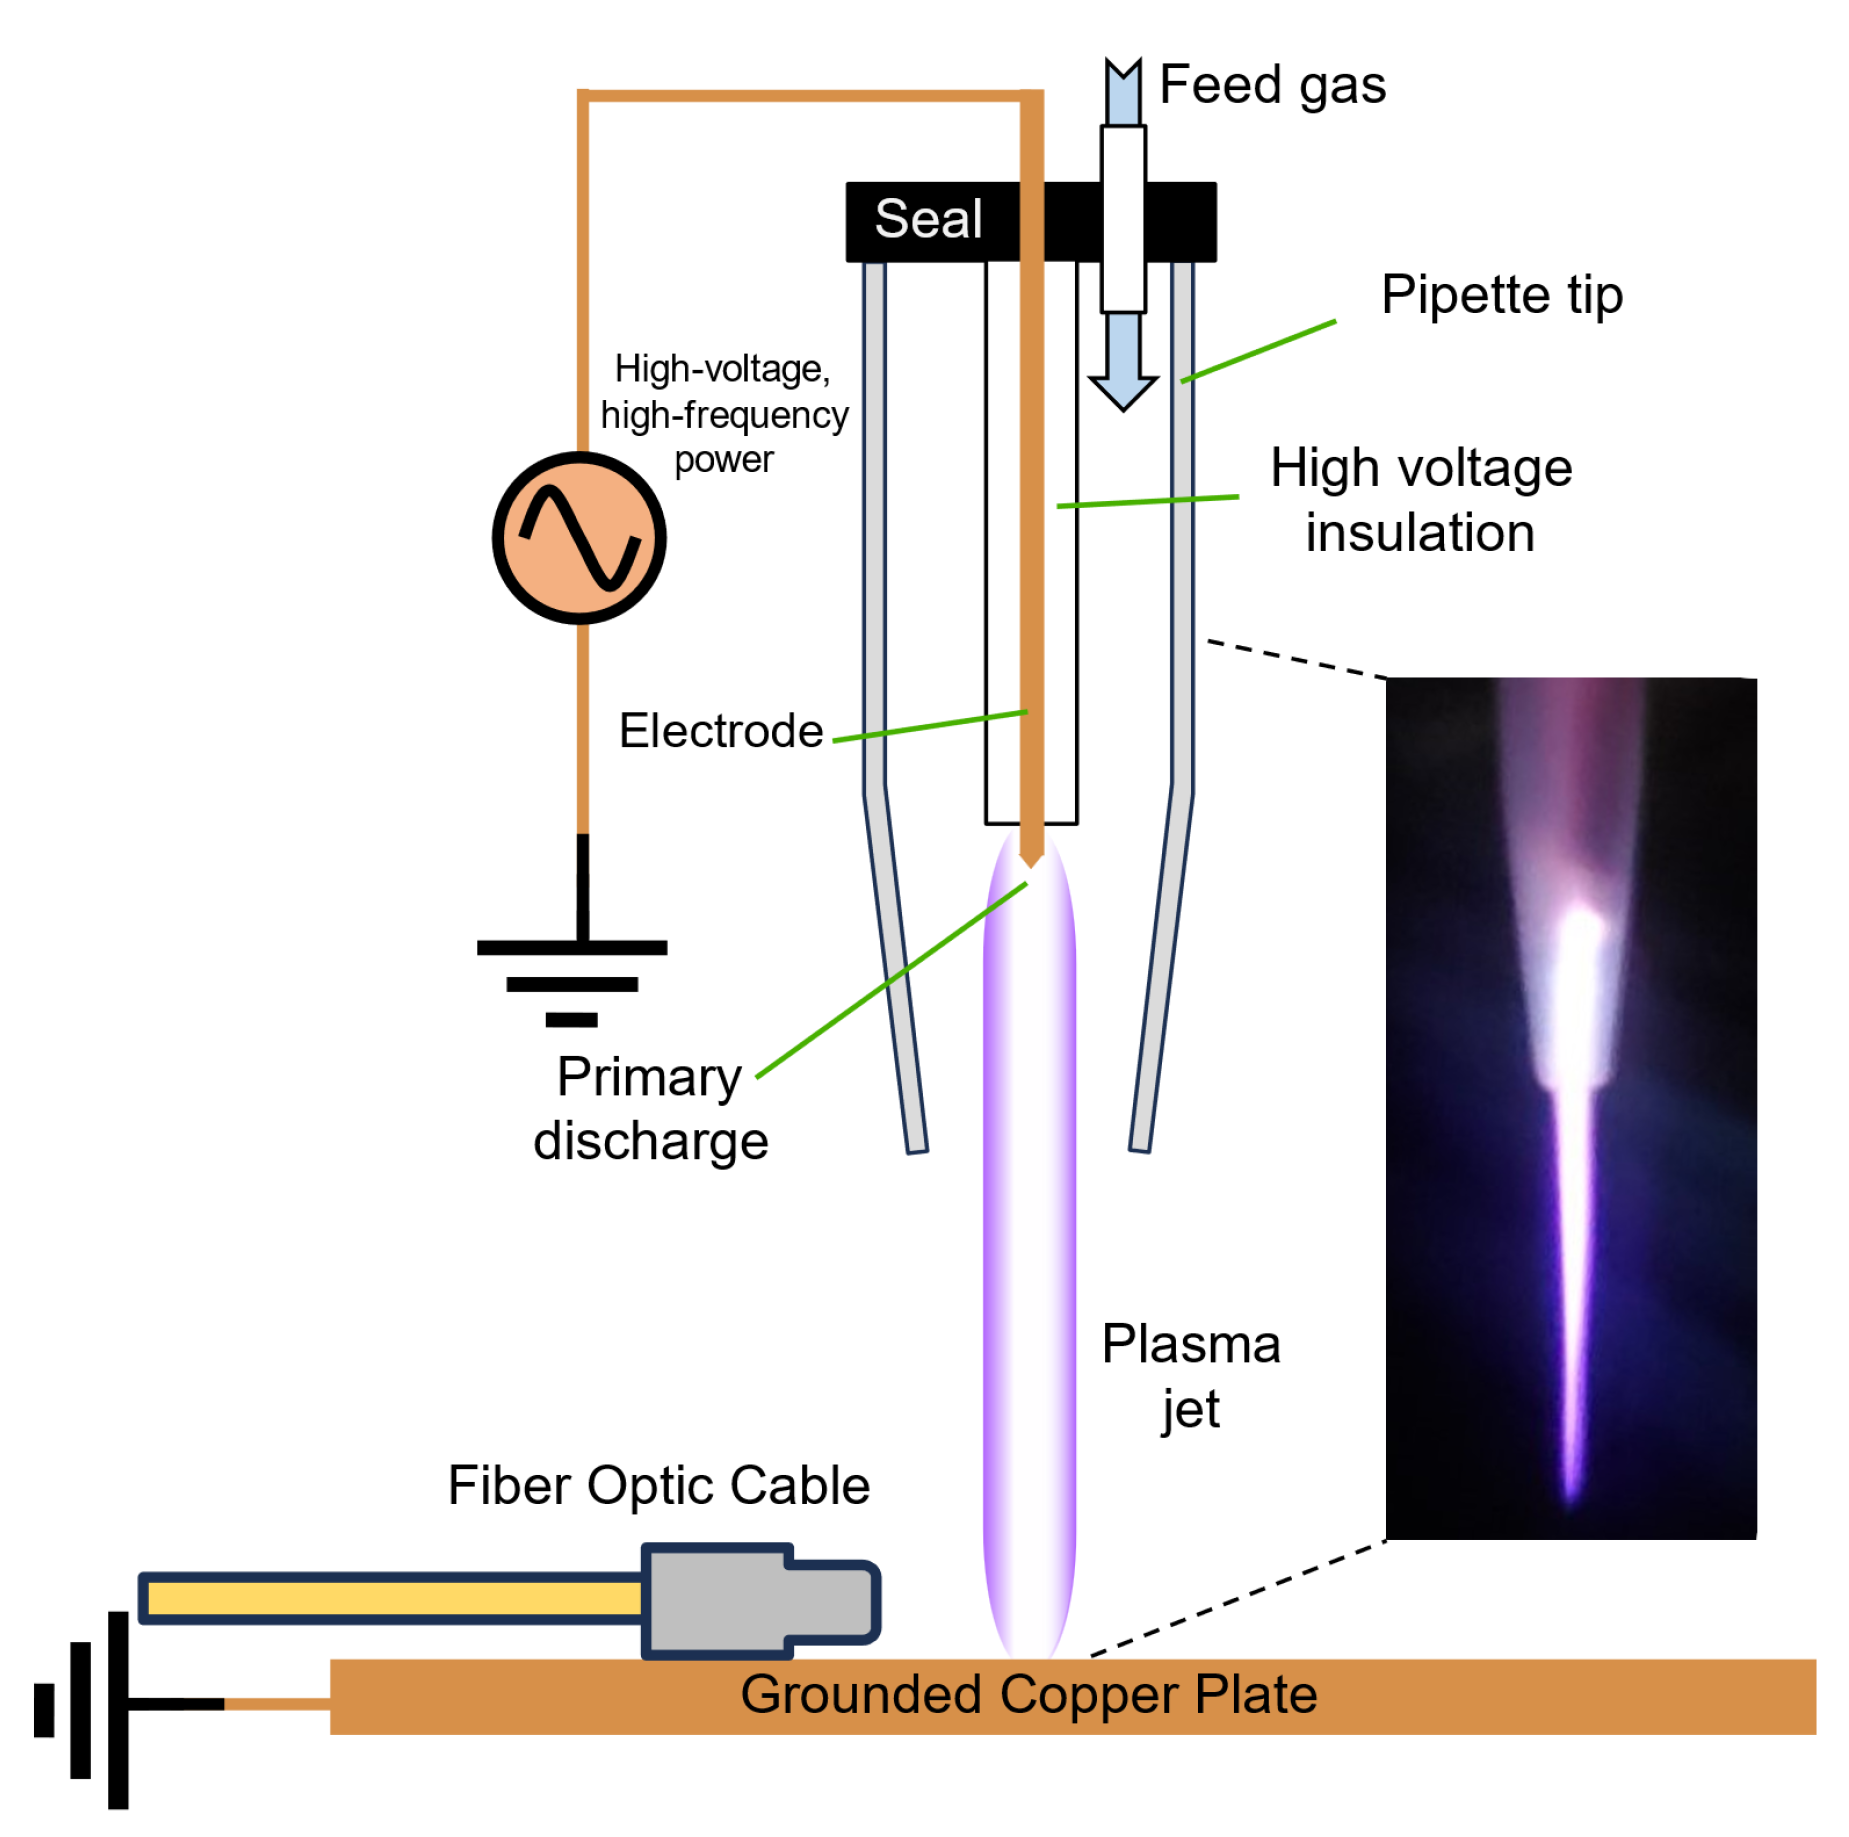
We used a single-electrode cold atmospheric plasma jet for data collection as shown in
Figure 1. Ultrahigh-purity helium was used as a feed gas with a flow rate of 5 lpm. The flow was controlled by an Apex flow controller. The electronic signal to the electrode was generated by custom electronics and controlled by inputs from a B&K Precision 4040B—20 MHz DDS Function Generator and a B&K Precision 9201B Power Supply. The input voltage from the power supply (current limited to 2.7 amps) and the frequency of the input from the function generator were varied in the experiment. The plasma impinged on a grounded copper plate 10 mm below the tip of the CAP device. The spectrographic data were collected with a fiber optic fed into an LR1-B ASEQ Instruments spectrometer. The device was enclosed to limit noise from ambient light, but a red LED was included to provide photons to aid in jet ignition.
2.2. Data Collection
The voltage varied from approximately 2.57 to 3.43 kV in 0.029 kV steps, and the frequency varied from 30 to 60 kHz in 1 kHz steps in a grid pattern. The order in which the points in this grid were measured was randomized to mitigate effects from the order of measurements. The jet was allowed to rest at the new set point for 25 s to allow it to reach equilibrium before taking spectrographic data.
2.3. Mode Identification
The singular value decomposition method for finding modality described by Dong et al. was used to identify the operational modes of the jet [
20]. Each voltage and frequency where a jet occurred was used in the analysis as a node. An edge between a frequency node and a voltage node was formed by the ignition of the jet at the voltage and frequency combination. These nodes and edges formed a bipartite graph that we then converted to a monopartite graph. Only the largest connected section of the bipartite graph was used to form the monopartite graph. The monopartite graph was used for the analysis performed in this study. The network formation was performed using the NetworkX package version 3.3 in Python 3.10.11.
2.4. Similarity Analysis and Silhouette Score
In order to validate the modules found from the mode identification and, therefore, the assumptions made in the graph generation, the spectral data of the points within each module were analyzed. Points were in a group corresponding to a module if their voltage and/or frequency belonged in the module. This spectral analysis utilized seven wavelengths corresponding to key excited species as outlined in the literature [
17]. The wavelengths were 308, 337, 391, 656, 706, 728, and 777 nm. These wavelengths correspond to the following excited species: OH,
,
,
, He(1), He(2), and O.
Similarity analysis was performed on these data using cosine similarity analysis to compare data points within and outside groups. Cosine similarity analysis of a matrix treats each row of the matrix as a vector in space. It then finds the cosine of the angle between each combination of row vectors and returns them in a matrix the same size as the one entered into the analysis. The similarity scores range from 0 to 1, with 0 being orthogonal (no similarity) and 1 being the same vector (identical data). For similarity analysis performed on spectral data in this paper, the average spectral data of each unique point in parameter space were used.
To test the quality of this grouping for spectral data, we determined the Silhouette Score for the groupings of spectral data. A Silhouette Score represents the quality of a clustering algorithm [
21]. The score ranges from −1 to 1, where negative scores indicate points in the wrong group, scores near zero indicate overlapping groups, and a score of 1 indicates perfect groups. The average spectral data of each unique point in parameter space were used for this analysis.
3. Results
3.1. Network
The network, as shown in
Figure 2, is composed of voltage nodes clustered around frequency nodes. This configuration indicated that the frequency nodes generally have a higher centrality than the voltage nodes. By completing a singular value decomposition on the graph, we can find the eigenvalues of the network. Eleven clusters of eigenvalues are present above the noise threshold (near-zero magnitude). This indicates that there are eleven key subgroups in the system. We reduced the system based on the eigenvectors corresponding to the eleven largest eigenvalues and performed the cosine similarity analysis on the resulting network adjacency matrix. The results can be seen in
Figure 3.
Most frequencies are clustered in the similarity matrix’s top-left and bottom-right corners and form independent clusters. This indicates that the frequencies form two independent modules. More importantly, it indicates that the frequencies are largely separate from the voltages. It is likely that, in the governing equations, any terms relying solely on voltage or frequency are far more influential than those relying on both. One can likely ignore any cross terms between frequency and voltage when predicting CAP-excited species generation in many applications.
Figure 3 shows potentially more modules than the eleven selected. The other possible modules sometimes contain multiple selected modules, and sometimes they lie within a chosen module. This is due to the hierarchy within this system’s module structure. Like Russian nesting dolls, the overall data contain models that contain smaller modules, eventually culminating in the data points themselves. The chosen modules were determined to identify effective modules that reflected operating modes with varying qualities without being too small to be useful.
3.2. Verification
To verify the validity of the assumptions made when creating the network, namely having a bipartite network with voltage and frequency nodes and the conditions to create edges, we performed a similarity analysis on the spectral data of points contained in each module. Points were considered part of a group, defined by a module, if the voltage and/or frequency was found in the corresponding module. The average spectral data within each mode are shown in
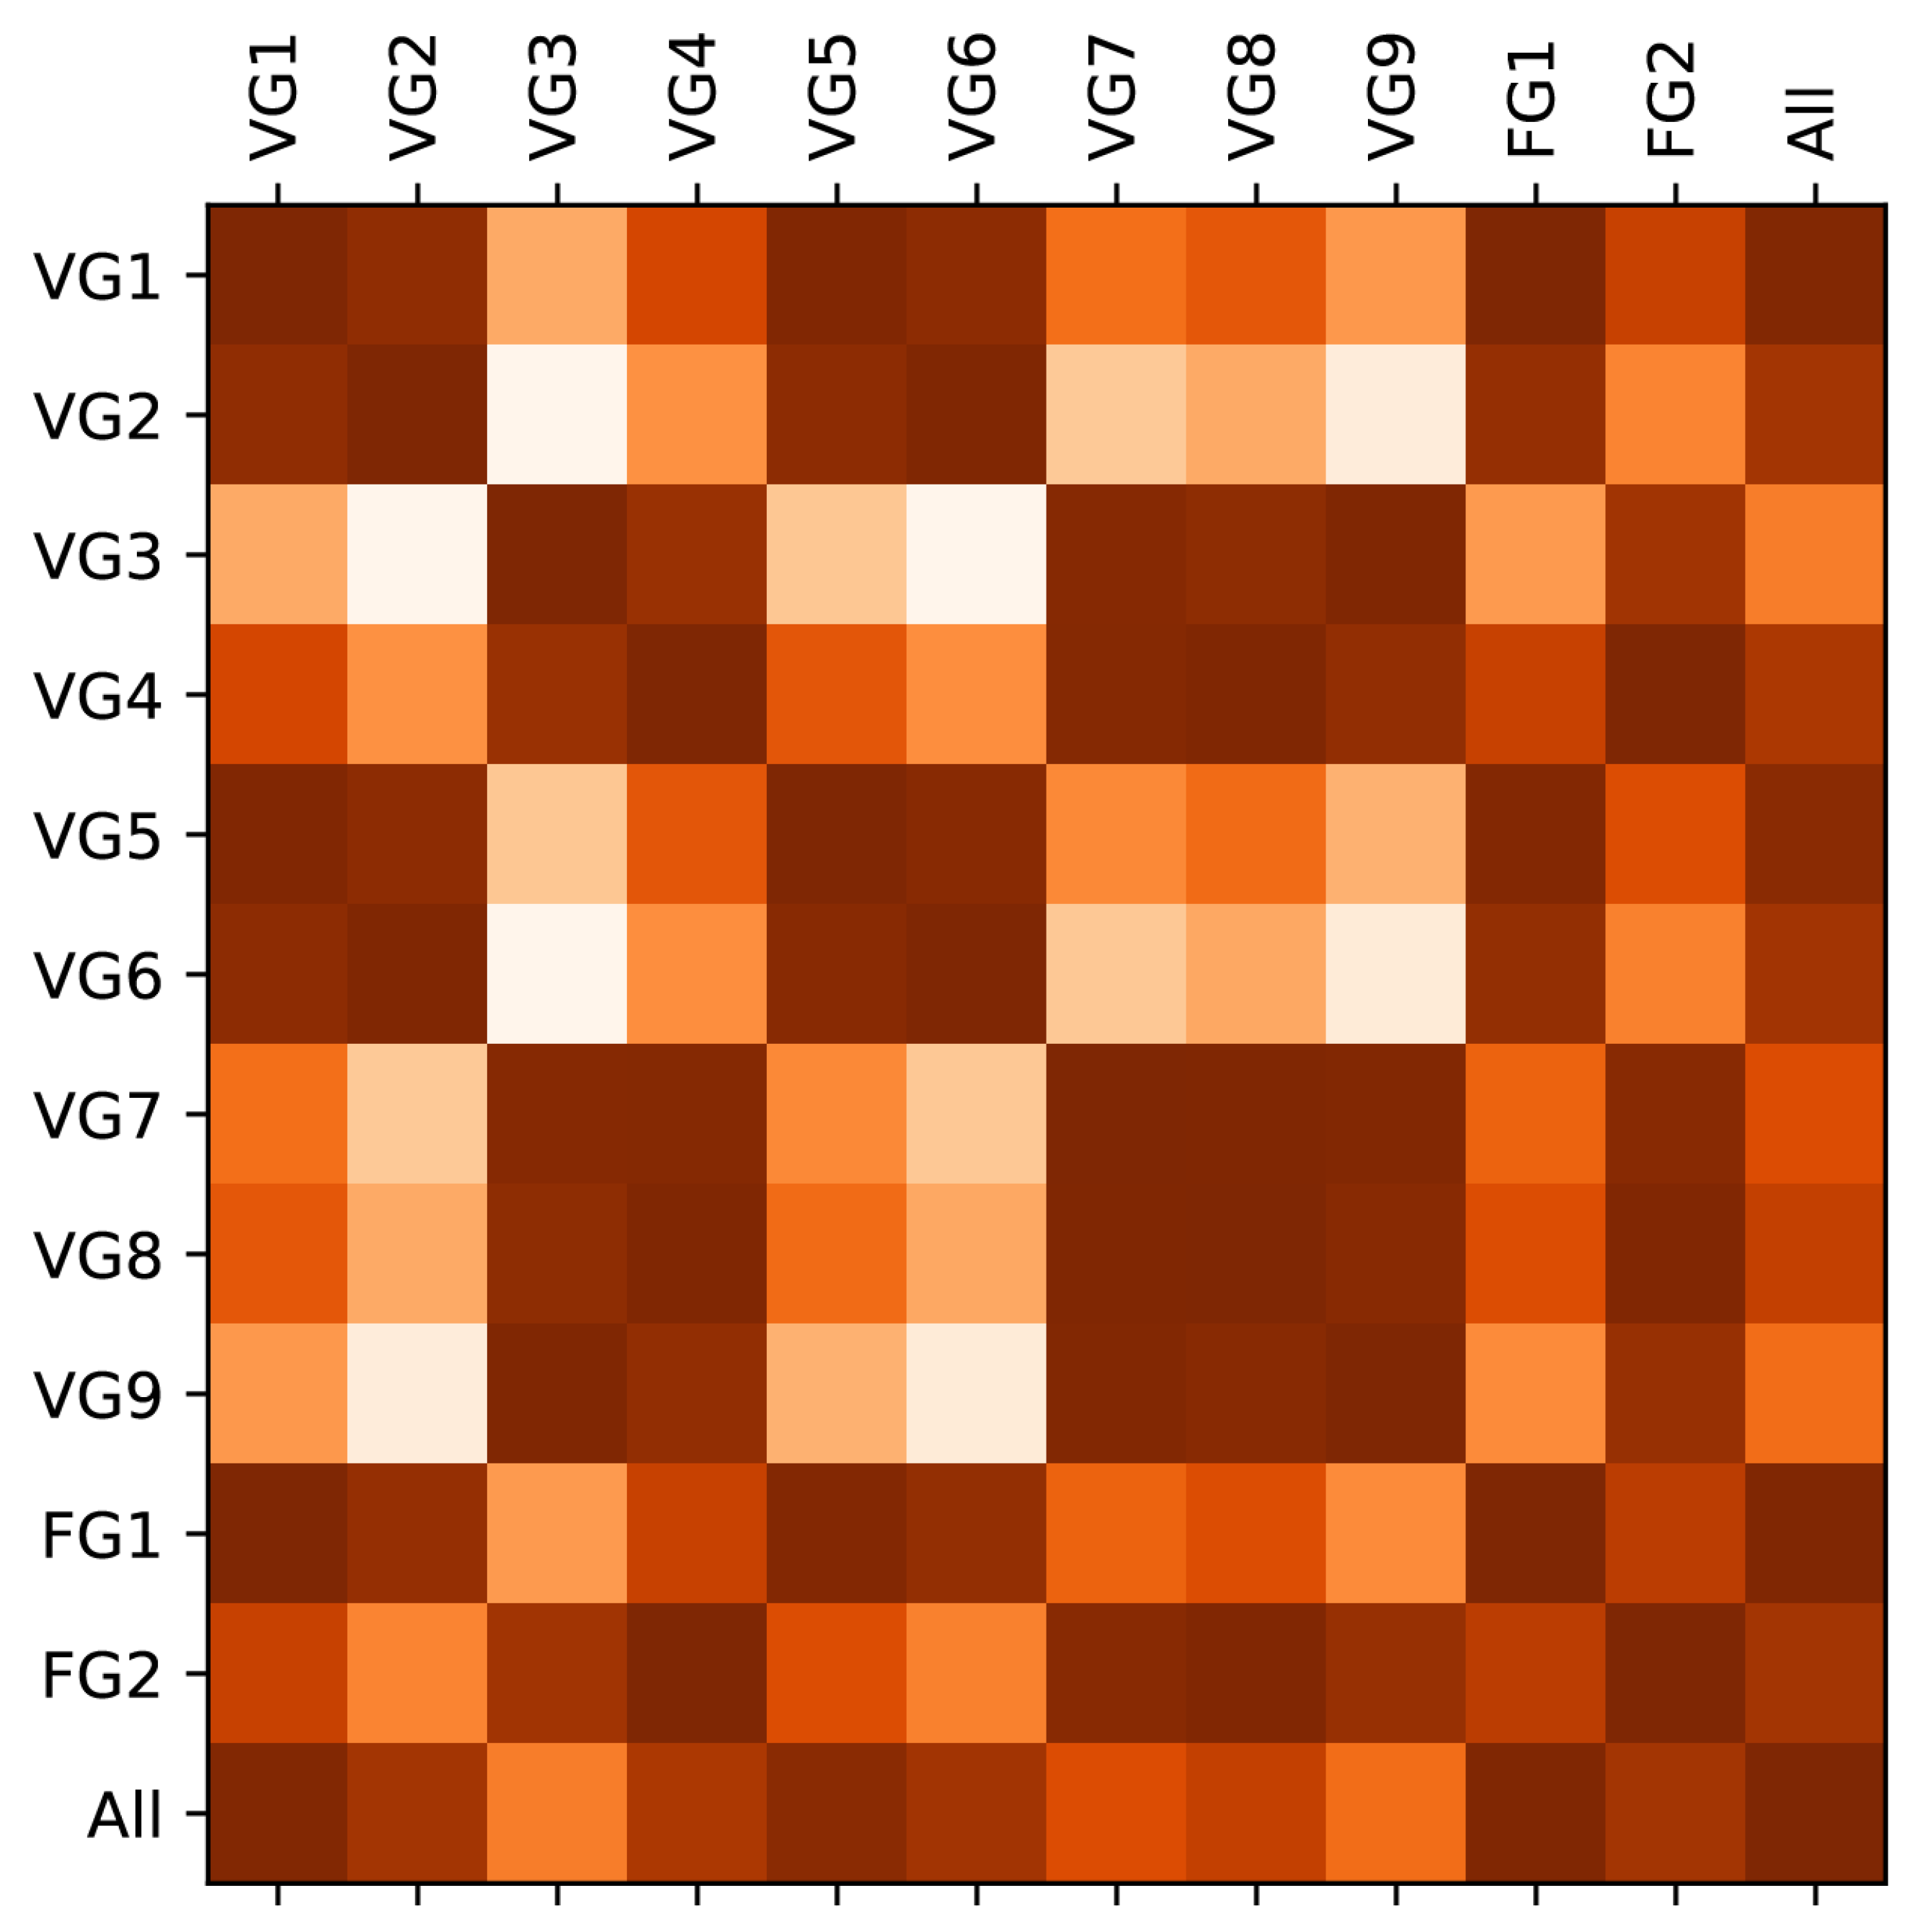
Figure 4. As can be seen from the figure, the spectrographs vary across the modules. We used a cosine similarity between the average of these graphs, as shown in
Figure 5, to quantitatively compare each module and the overall data. Different modules are more similar than others. For instance, Voltage Groups 1, 2, 5, and 6 and Frequency Group 1 correspond more strongly than with the rest of the voltage or frequency groups. However, they are also similar to the overall data average. This trend supports the presence of hierarchy, which was discussed previously.
To test the quality of this grouping for spectral data, we determined the Silhouette Score of the groupings of spectral data as described in
Section 2.4. We analyzed all groups together and the voltage and frequency groups separately to minimize repeated data points. All groups scored 0.22, voltage groups scored 0.21, and frequency groups scored 0.75. These scores indicate that the groups, while not perfect, group the spectral data well despite not being formed based on the spectral data. This effective grouping is reflected in the similarity of the spectral data within each group to each other as shown in
Figure 6. All modules have a higher similarity than the overall data, with an average of 16.6 percent greater similarity than the overall data. This improvement varies between groups depending on the variety of subgroups found within them.
4. Discussion
Network analysis of the described graph effectively determines modularity within the CAP jet parameter space, including grouping points corresponding to CAP jets that produce similar spectroscopic data. As shown in
Figure 7, the modules do not cluster in parameter space. All the voltage modules are heavily intermingled, as are the frequency modules. This is reflected in the highly multimodal and complex nature of CAP jets. The excited species of the jets fluctuate rapidly throughout the parameter space; however, patterns do exist within these fluctuations, as shown by the reoccurrence of modules. The dependence of these patterns on frequency and voltage combinations is insignificant compared to the dependence on voltage and frequency independently as discussed previously.
The highly multimodal nature of CAP-excited species generation reaffirms the need for well-controlled and monitored CAP treatments. Different concentrations of excited species delivered at any given point will affect the dosage of RONS delivered to a target. This could lead to dramatic consequences for medical treatments. By understanding how these groups cluster and, therefore, how relative concentrations of different species vary across parameter space, medical professionals can design treatments to have greater robustness and/or flexibility.
For instance, certain treatments may require more or less
compared to OH. When operating in Voltage Group 2, at just above 3.29 kV, certain concentrations of excited species are expected, as shown in
Figure 4. This parameter set provides users with flexibility as other modes are located nearby, as seen in
Figure 7. By shifting the voltage down slightly, one can move into Voltage Group 1 and boost the ratio of OH compared to
. On the other hand, by moving the voltage slightly up, one can move into Voltage Group 4 and achieve the opposite effect. However, the neighboring groups vary throughout the parameter space, and specific operating conditions can be chosen to increase the robustness of a treatment instead.
Figure 5 shows the similarities between groups. If a consistent plasma composition is more important than flexibility, neighboring groups with high similarity can help maintain the consistency of treatments under fluctuations. The balance between flexibility and robustness of the plasma composition can be designed to best meet the users’ needs by utilizing data from the analysis outlined in this paper.
One promising aspect of this work is that the trends identified using network analysis are largely consistent with observations in CAP research. Therefore, this work demonstrates the utility of data-driven approaches to provide quantitative and rigorous methods to gain insight into robust treatments for individual CAP devices, operational environments, and objectives.
5. Conclusions
Despite not being built with any consideration for spectrographic data, the network representation of the CAP jet could derive information about the system’s spectrographic data. This information reflects network analysis’s ability to describe the complex mechanisms in CAP jets without a complete understanding of the system. While a complete understanding of the system is ideal, many CAP applications involve many complex and hard-to-model interactions. These results allow for the development of more robust CAP treatments without as intensive of an effort required for each individual treatment type.
For instance, with a copper target at a fixed distance, we determined a strong dependence of the governing equations of the excited species generation on voltage and frequency, with any cross terms between voltage and frequency in these equations being negligible. This would allow for the development of feedback control for the jet that utilizes spectrographic data as a form of measurement and voltage and frequency as control parameters. The minor influence of cross terms would allow this feedback method to have greater flexibility. This understanding of the system could prove useful in targets as complex as biological targets. To further explore the potential of this effort, more parameters and targets should be tested to investigate the level of control that could be achieved in different applications.
Author Contributions
Conceptualization, B.H. and R.E.W.; methodology, B.H. and R.E.W.; software, B.H.; validation, B.H.; formal analysis, B.H.; investigation, B.H.; resources, R.E.W.; data curation, B.H.; writing—original draft preparation, B.H.; writing—review and editing, B.H. and R.E.W.; visualization, B.H. and R.E.W.; supervision, R.E.W.; project administration, R.E.W.; funding acquisition, R.E.W. All authors have read and agreed to the published version of the manuscript.
Funding
This research was funded by the Oregon State University Advantage Fund and the Oregon State University Boeing Chair in Mechanical Systems.
Institutional Review Board Statement
Not applicable.
Informed Consent Statement
Not applicable.
Data Availability Statement
Acknowledgments
The authors would like to acknowledge Graeme Sabiston for his work on the custom electronics for the CAP device. We would also like to acknowledge Andy Dong for his help with network analysis.
Conflicts of Interest
The authors declare no conflicts of interest.
Abbreviations
The following abbreviations are used in this manuscript:
| CAP | Cold Atmospheric Plasma |
References
- Cheng, K.Y.; Lin, Z.H.; Cheng, Y.P.; Chiu, H.Y.; Yeh, N.L.; Wu, T.K.; Wu, J.S. Wound healing in streptozotocin-induced diabetic rats using atmospheric-pressure argon plasma jet. Sci. Rep. 2018, 8, 12214. [Google Scholar]
- Bourke, P.; Ziuzina, D.; Boehm, D.; Cullen, P.J.; Keener, K. The potential of cold plasma for safe and sustainable food production. Trends Biotechnol. 2018, 36, 615–626. [Google Scholar] [CrossRef] [PubMed]
- O’Neill, F.; O’Neill, L.; Bourke, P. Recent Developments in the Use of Plasma in Medical Applications. Plasma 2024, 7, 284–299. [Google Scholar] [CrossRef]
- Adesina, K.; Lin, T.C.; Huang, Y.W.; Locmelis, M.; Han, D. A Review of Dielectric Barrier Discharge Cold Atmospheric Plasma for Surface Sterilization and Decontamination. IEEE Trans. Radiat. Plasma Med. Sci. 2024, 8, 295–306. [Google Scholar] [CrossRef]
- Chen, Z.; Garcia, G.; Arumugaswami, V.; Wirz, R.E. Cold atmospheric plasma for SARS-CoV-2 inactivation. Phys. Fluids 2020, 32, 111702. [Google Scholar] [CrossRef] [PubMed]
- Bigan, M.; Mutel, B. Cold remote plasma modification of wood: Optimization process using experimental design. Appl. Surf. Sci. 2018, 453, 423–435. [Google Scholar] [CrossRef]
- Azzariti, A.; Iacobazzi, R.M.; Di Fonte, R.; Porcelli, L.; Gristina, R.; Favia, P.; Fracassi, F.; Trizio, I.; Silvestris, N.; Guida, G.; et al. Plasma-activated medium triggers cell death and the presentation of immune activating danger signals in melanoma and pancreatic cancer cells. Sci. Rep. 2019, 9, 4099. [Google Scholar] [CrossRef] [PubMed]
- Chen, G.; Chen, Z.; Wen, D.; Wang, Z.; Li, H.; Zeng, Y.; Dotti, G.; Wirz, R.E.; Gu, Z. Transdermal cold atmospheric plasma-mediated immune checkpoint blockade therapy. Proc. Natl. Acad. Sci. USA 2020, 117, 3687–3692. [Google Scholar] [CrossRef] [PubMed]
- Arora, V.; Nikhil, V.; Suri, N.; Arora, P. Cold atmospheric plasma (CAP) in dentistry. Dentistry 2014, 4, 1. [Google Scholar] [CrossRef]
- Fridman, G.; Friedman, G.; Gutsol, A.; Shekhter, A.B.; Vasilets, V.N.; Fridman, A. Applied plasma medicine. Plasma Processes Polym. 2008, 5, 503–533. [Google Scholar] [CrossRef]
- Chen, Z.; Wirz, R.E. Cold Atmospheric Plasma (CAP). In Cold Atmospheric Plasma (CAP) Technology and Applications; Springer: Berlin/Heidelberg, Germany, 2021; pp. 7–22. [Google Scholar]
- Lin, L.; Keidar, M. A map of control for cold atmospheric plasma jets: From physical mechanisms to optimizations. Appl. Phys. Rev. 2021, 8, 011306. [Google Scholar] [CrossRef]
- Özdemir, M.A.; Özdemir, G.D.; Gül, M.; Güren, O.; Ercan, U.K. Machine learning to predict the antimicrobial activity of cold atmospheric plasma-activated liquids. Mach. Learn. Sci. Technol. 2023, 4, 015030. [Google Scholar] [CrossRef]
- Chai, Z.N.; Wang, X.C.; Yusupov, M.; Zhang, Y.T. Unveiling the interaction mechanisms of cold atmospheric plasma and amino acids by machine learning. Plasma Processes Polym. 2024, 21, e2300230. [Google Scholar] [CrossRef]
- Deepak, G.D.; Bhat, S.K. Predictive modeling and optimization of pin electrode based cold plasma using machine learning approach. Multiscale Multidiscip. Model. Exp. Des. 2024, 7, 2045–2064. [Google Scholar] [CrossRef]
- Gidon, D.; Pei, X.; Bonzanini, A.D.; Graves, D.B.; Mesbah, A. Machine learning for real-time diagnostics of cold atmospheric plasma sources. IEEE Trans. Radiat. Plasma Med. Sci. 2019, 3, 597–605. [Google Scholar] [CrossRef]
- Joh, H.M.; Kang, H.R.; Chung, T.H.; Kim, S.J. Electrical and optical characterization of atmospheric-pressure helium plasma jets generated with a pin electrode: Effects of the electrode material, ground ring electrode, and nozzle shape. IEEE Trans. Plasma Sci. 2014, 42, 3656–3667. [Google Scholar] [CrossRef]
- Robinson, P.A.; Zhao, X.; Aquino, K.M.; Griffiths, J.; Sarkar, S.; Mehta-Pandejee, G. Eigenmodes of brain activity: Neural field theory predictions and comparison with experiment. NeuroImage 2016, 142, 79–98. [Google Scholar] [CrossRef]
- Shreim, A.; Berdahl, A.; Sood, V.; Grassberger, P.; Paczuski, M. Complex network analysis of state spaces for random Boolean networks. New J. Phys. 2008, 10, 013028. [Google Scholar] [CrossRef]
- Sarkar, S.; Dong, A.; Henderson, J.A.; Robinson, P. Spectral characterization of hierarchical modularity in product architectures. J. Mech. Des. 2014, 136, 011006. [Google Scholar] [CrossRef] [PubMed]
- Rousseeuw, P.J. Silhouettes: A graphical aid to the interpretation and validation of cluster analysis. J. Comput. Appl. Math. 1987, 20, 53–65. [Google Scholar] [CrossRef]
| Disclaimer/Publisher’s Note: The statements, opinions and data contained in all publications are solely those of the individual author(s) and contributor(s) and not of MDPI and/or the editor(s). MDPI and/or the editor(s) disclaim responsibility for any injury to people or property resulting from any ideas, methods, instructions or products referred to in the content. |
© 2025 by the authors. Licensee MDPI, Basel, Switzerland. This article is an open access article distributed under the terms and conditions of the Creative Commons Attribution (CC BY) license (https://creativecommons.org/licenses/by/4.0/).


