Abstract
This paper investigates a novel combined laser and plasma heating test technique. Integrating the 1.5 kW Raycus RFL-C1500 laser source into the VGU-4 Inductively Coupled Plasma Facility (IPMech RAS) allowed the study of fine-grain MPG-7 graphite ablation in the high-temperature range from 2920 to 3865 K under exposure to subsonic nitrogen plasma flow and combined exposure to nitrogen plasma flow and laser irradiation. Graphite nitridation and sublimation were observed. The subsonic nitrogen plasma flow was characterized by numerical modeling, probes, and spectral measurements. The proposed experimental approach is promising for simulating the entry conditions of planetary mission vehicles into different atmospheres.
Keywords:
graphite; ablation; nitridation; nitrogen plasma; RF plasmatron; laser heating; numerical modeling 1. Introduction
Carbon-based materials have extensive applications in thermal protection systems for re-entry capsules and planetary probes [1,2,3]. Among the many properties and behavioral features of these materials that should be studied experimentally in detail, ablation in high-enthalpy dissociated gas flows of different compositions is of particular interest, as this phenomenon is crucial for the survivability of space vehicles during entry into planetary atmospheres. Carbon ablation in air plasma is governed by surface chemical reactions (oxidation and nitridation) and sublimation [4,5,6]. Arc-jet and inductively coupled plasma (ICP) facilities are widely used to study the above processes [7,8,9]. Experiments in pure nitrogen flows are conducted to study nitridation reactions at the carbon surface separately from possible oxidation reactions [10,11,12,13,14]. Pure gas flow in ICP facilities is not contaminated by electrode fracture products, which makes them a good research instrument for investigating the behavior of materials under the influence of high-enthalpy dissociated jets. However, their power limitations make it difficult to achieve ultra-high surface temperatures (above 3500 K) and to study the process of carbon ablation under these conditions. At the same time, other test methods such as laser and resistive heating do not allow the aerothermal effects of chemically active flow to be fully simulated. In this case, facilities where the advantages of a high-enthalpy wind tunnel are combined with an additional heating source seem quite promising. In [15], a test system consisting of a resistive heating furnace and an RF-powered plasma source was used to study the oxidation and nitridation of graphite. A 3 kW radiative heating laser has been installed and paired with the 500 kW pulsed arc-jet tunnel at the University of Tennessee [16], and experiments with preheated graphite samples have been carried out. A new technique for preheating axisymmetric graphite samples from the downstream side with a plasma to approximately 2500 K was used at the TUSQ wind tunnel facility [17]. The Laser-Enhanced Arc-jet Facility (LEAF) is used for materials testing at NASA Ames Research Center [18,19]. Oxidation of SiC samples was studied with arc-heated plasma wind tunnel and laser heating [20].
Previously, a 200 W ytterbium laser was added as an optional heat source to the VGU-4 ICP facility at IPMech RAS. The behavior of heat-shielding material based on quartz fibers [21], silicon carbide samples [22], and HfB2-SiC-based ceramics [23,24] under the combined effect of plasma flow and laser beam was studied. The campaign demonstrated the promising potential of this novel testing technique. The laser used in the experiments was replaced by a more powerful 1.5 kW source. The objectives of this work were to determine the temperature limit that can be reached on the graphite surface in the nitrogen plasma flow of the VGU-4 ICP facility under additional radiative heating with a new laser source and to investigate the behavior of graphite samples under these conditions. Although all experiments were performed in pure dissociated nitrogen, we did not focus on the problem of carbon nitridation (some results on this topic can be found in [12,13,25,26,27,28]). Nitrogen was used to avoid chemical reactions in oxygen, which could make it challenging to record temperature due to rapid changes in sample shape.
2. Materials and Methods
2.1. Graphite Samples
Samples of MPG-7 fine-grain isotropic graphite (density not less than 1.80 g/cm3) were used in this research. All samples were cut from the same billet. The samples had the shape of a 20 mm diameter cylinder with a spherical nose. Mounting feet with a diameter of 12 mm and a length of 10 mm were made on the back of the samples. During the exposure, the samples were mounted in a water-cooled holder as shown in Figure 1. The general thermophysical properties of MPG-7 graphite were studied in [29,30,31]. The length of the samples was measured before () and after () exposure along the axis of symmetry of the original sample. Surface recession in the front area was evaluated as with an accuracy of ±0.1 mm. Samples were weighed before () and after () exposure using a VL-124V analytical balance (Gosmetr, Russia) with an accuracy of ±0.0003 g. Mass loss was calculated as .
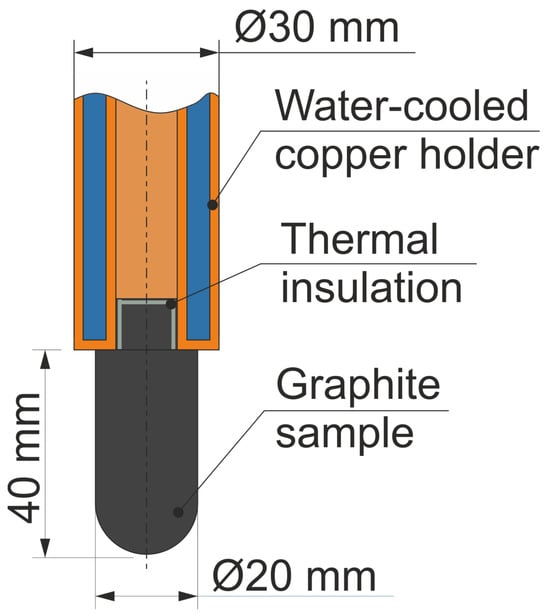
Figure 1.
Graphite sample mounted in the water-cooled holder.
2.2. Test Facility
The experiments were carried out in subsonic pure nitrogen plasma jets of the VGU-4 (also named IPG-4 [32]) ICP facility manufactured by the Ishlinsky Institute for Problems in Mechanics RAS. The facility has a maximum anode power of 72 kW and allows experiments in sub- and supersonic plasma jets of different chemical compositions with samples of various shapes (cones and cylinders with spherical and blunt noses, disks, and tiles). General parameters of the VGU-4 ICP facility are given in [33]. A sketch of the test configuration is shown in Figure 2.
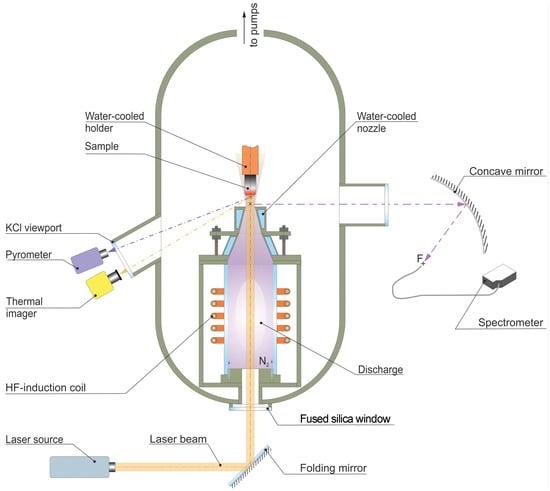
Figure 2.
Sketch of the test configuration in the VGU-4 ICP facility with an additional laser source. Note: graph is not to scale.
To provide radiative heating, the VGU-4 facility was equipped with a 1.5 kW Raycus RFL-C1500 laser source (Wuhan Raycus Fiber Laser Technologies Co., Wuhan, China, operating wavelength 1.080 ± 0.005 µm). The external optical system designed to transfer radiation from the laser head to the sample surface along the axis of the plasma jet included a water-cooled folding mirror. The position of the mirror and its tilt angle were adjusted using micrometer screws. The size of the laser irradiation spot on the sample surface was governed by the adjustable laser beam collimator with an effective focal length of 125 mm. The laser beam was injected into the volume of the test chamber through a transparent fused silica window. Radiation losses on the elements of the optical system due to absorption, scattering, and back reflection from transparent surfaces resulted in a 17% lower incident laser power on the sample than the laser output power.
2.3. Temperature Measurements
The temperature at the stagnation point area of the heated sample was measured with an AST Swift 350 PL brightness pyrometer (Accurate Sensors Technologies Ltd., Udaipur, India) in a spectral range from 1.9 to 2.6 µm with maximum sensor sensitivity at 2.3 µm. The pyrometer readings were corrected for the KCl viewport transmittance (0.93, [34]) and the spectral emissivity of the surface, which was assumed to be = 0.91. An estimate of was obtained by comparing the AST Swift 350 PL brightness pyrometer and Mikron M700S spectral-ratio pyrometer (Mikron Infrared Inc., Oakland, CA, USA) readings (this method is described in [35,36]) in preliminary experiments without a laser source, where a cylindrical 30 mm diameter flat-nosed MPG-7 graphite sample was heated to 2850 K in a nitrogen plasma flow. The obtained value is within the range typical for graphite materials, although the available literature data have a large variation and depend on specific test conditions [37,38,39]. It also should be noted that, in [40], a tendency of increasing graphite emissivity under the sublimation regime was observed.
The brightness temperature distribution over the sample surface was obtained using a Tandem VS-415U thermal imager (OOO «PK ELGORA», Korolev, Moscow region, Russia) with an operating wavelength of 0.65 µm. The thermal imager was used to monitor heating and ablation processes during the tests. Thermal images were corrected for the KCl viewport transmittance.
2.4. Probe Measurements
A steady-state probe with a cooled copper surface was used for heat flux measurements in a nitrogen plasma flow. The probe was installed in a water-cooled cylindrical holder of 20 mm diameter with a spherical nose so that the resulting shape matched the shape of the tested samples (Figure 3).
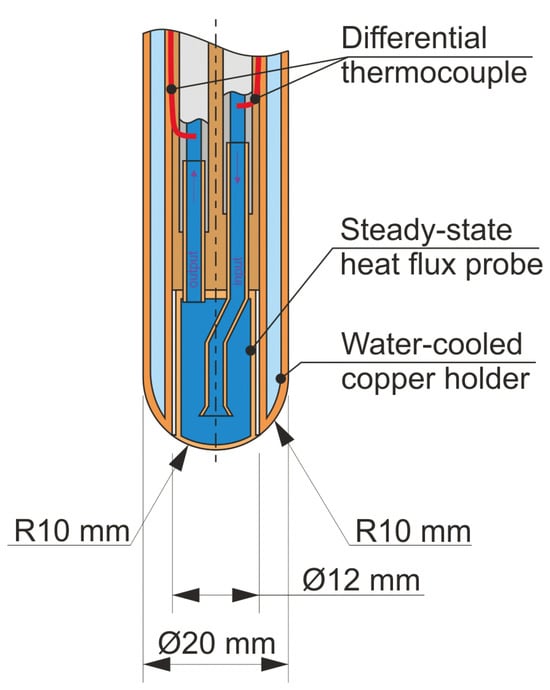
Figure 3.
Water-cooled holder with steady-state heat flux probe.
The heat flux can be obtained from the energy balance equation:
is the front heat-absorbing area of the probe, is the mass flow rate of the cooling water, and () are the specific heat and temperature rise of the cooling water, and is the unknown heat flux.
The mass flow rate of the cooling water was measured with an ES-FLOW ultrasonic liquid flow meter (Bronkhorst, The Netherlands) with an accuracy of ±2%. The heat-absorbing area of the probe was 1.20 ± 0.02 cm2. The temperature rise of the cooling water was measured with a chromel–alumel (type K) differential thermocouple (typical accuracy ±1.5 °C over the range −40 °C to +375 °C). The probe was thermally insulated from the holder. Heat flux measurements are estimated to have an uncertainty less than 10%.
Dynamic pressure on the jet axis was measured with a water-cooled Pitot probe. The outer probe diameter was 16.5 mm, and the orifice diameter was 3.5 mm. Measurements were performed using a pressure transducer Elemer AIR-20/M2-DA (NPP «Elemer», Moscow, Russia).
2.5. Plasma Spectroscopy
The emission of the nitrogen plasma jet behind the nozzle outlet was monitored using a high-resolution spectrometer HR4000 (Ocean Optics, Orlando, FL, USA) with a spectral range of 200–1100 nm. The light was coupled to the entrance slit of the spectrometer using a concave mirror and a quartz optical fiber (see Figure 2). Relative irradiance calibration of the HR4000 spectrometer was done using a DH-2000-CAL Deuterium Tungsten Halogen Calibration light source (Ocean Optics, Orlando, FL, USA). The emission spectra were captured using the OceanView (version 1.6.7) software package.
2.6. Numerical Simulation
Numerical simulation of subsonic nitrogen plasma flow in the VGU-4 ICP facility was performed using specialized software developed at the Laboratory for Interaction of Plasma and Radiation with Materials (IPMech RAS). This scientific software has been described in [41,42,43,44,45].
The nitrogen plasma flow in the VGU-4 ICP facility was divided into three specific areas for calculations:
- Axisymmetric subsonic flow with azimuthal swirling within the discharge channel and conical nozzle. The two-dimensional Navier–Stokes equations in the cylindrical coordinate system coupled with the simplified Maxwell equations for an RF electromagnetic field were solved using the control volumes method and SIMPLE algorithm of Patankar and Spalding [46] («Alpha» code).
- Axisymmetric subsonic flow past the sample. The flow parameters at the nozzle outlet obtained from the «Alpha» code were used as boundary conditions. The two-dimensional Navier–Stokes equations in the cylindrical coordinate system were also solved using the Patankar–Spalding method. («Beta» code).
- Boundary layer near the front face of the sample on the symmetry axis. The sample surface was assumed to have a temperature = 300 K and an effective catalytic recombination coefficient of atoms = 1. The calculations were based on a one-dimensional boundary layer model of finite thickness for a chemical nonequilibrium dissociated gas («Gamma» code). The enthalpy at the outer edge of the boundary layer was determined from the equality condition of the calculated heat flux to the ideal catalytic surface and the measured value.
All calculations were performed under the assumption of steady laminar flow. The «Alpha» and «Beta» code calculations were performed under the thermodynamic and chemical equilibrium plasma flow assumption. Plasma radiation was not considered.
The «SoVA» code [47] was used to calculate the chemical composition and transport properties of the equilibrium multicomponent mixture.
3. Test Conditions and Flow Characterization
All experiments were conducted in subsonic high-enthalpy nitrogen plasma jets emanating from a water-cooled conical nozzle with an outlet diameter of mm at a test chamber pressure of Pa, and a gas mass flow rate of g/s. The distance from the nozzle outlet to the graphite sample was 15 mm. In all experiments, the anode power of the VGU-4 RF generator was kept constant throughout the exposure. In tests with additional laser heating RF generator anode power was kW. In experiments without additional laser heating RF generator anode power was , 50, and 70 kW. The graphite sample was immersed in the high-enthalpy jet when stable test conditions were achieved. Under these conditions, the sample was held until the end of the experiment; the total exposure time was 1 min (60 s) in each test. After exposure, the samples were cooled in a flow of cold pure nitrogen to avoid possible contact with an oxygen-containing environment.
The main thermodynamic parameters and equilibrium chemical composition calculated with «Alpha» and «SoVA» codes at the nozzle outlet on the nozzle symmetry axis at the test conditions ( kW, Pa, g/s) are shown in Table 1. It should be noted that, in this particular case, the assumption of chemical and thermal equilibrium used in these codes may have been violated in the short end of the conical nozzle, where the flow accelerates rapidly and the pressure drops sharply.

Table 1.
Calculated pressure (p), temperature (T), and equilibrium mole concentrations (X) of gas mixture components at the nozzle outlet ( kW, Pa, g/s).
Collected emission spectra for the nitrogen plasma jet behind the nozzle outlet at test conditions ( kW, Pa, g/s) are shown in Figure 4.
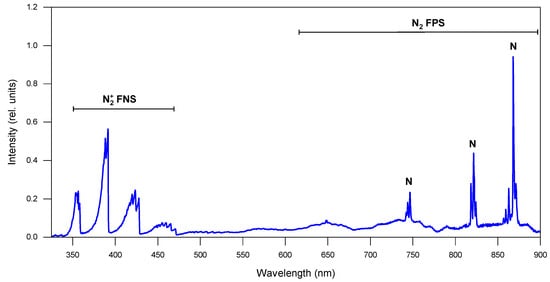
Figure 4.
Emission spectra for nitrogen plasma free-stream behind the nozzle outlet ( kW, Pa, g/s).
The spectra have many features in common with those acquired in the Plasmatron X facility at a static pressure of Pa [48]. Analysis of the free-stream spectra shows the presence of N2, , and atomic nitrogen (sharp emission lines at 745, 821, and 869 nm). At the same time, characteristic lines of atomic oxygen (e.g., at 777 nm) are not observed. This indicates that there is no air admixture and that graphite oxidation reactions do not affect the test results. Since both spectra and calculation results show the presence of atomic nitrogen in the flow, nitridation of the graphite surface is expected.
The temperature distribution of the nitrogen plasma jet flowing past the sample, calculated by the «Beta» code, is shown in Figure 5.

Figure 5.
Nitrogen plasma jet: calculated temperature distribution ( kW, Pa, g/s).
The cold wall heat flux measured with the steady-state probe at 15 mm from the nozzle outlet as a function of RF generator power is shown in Figure 6. The dynamic pressure measured with the Pitot tube at the same distance was Pa ( kW, Pa, g/s).
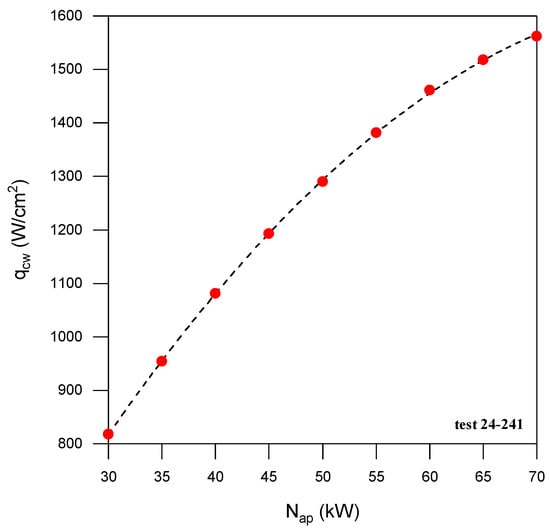
Figure 6.
Heat flux measured on the jet axis at 15 mm from the nozzle outlet as a function of RF generator anode power ( Pa, g/s).
The values of heat flux = 1562 W/cm2 and dynamic pressure Pa measured at RF generator anode power kW allowed us to obtain enthalpy MJ/kg and temperature K at the outer edge of the boundary layer in front of the sample using the «Gamma» code (the method is described in [44,49]). Mass concentrations of main gas mixture components at the outer edge of the boundary layer: ; .
Experiments with laser heating were performed at laser output powers and 1.5 kW. Considering radiation losses, these values correspond to incident laser powers and 1.245 kW, respectively. Maximum incident laser intensity is estimated to be and 1440 W/cm2, respectively. The intensity distribution in the cross section of the multimode laser beam at the sample surface was bell-shaped, as shown in Figure 7.
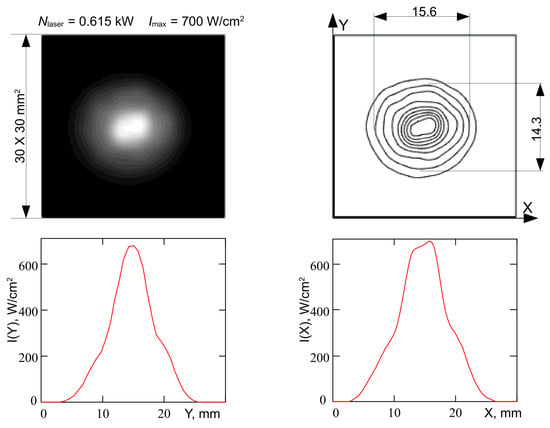
Figure 7.
Typical intensity distribution in the laser spot.
4. Results and Discussion
Five graphite samples were tested in this campaign. Three of them were exposed to a subsonic nitrogen plasma jet at constant RF generator power kW: without additional laser heating and with incident laser powers and 1.245 kW. The plasma free-stream parameters in these three cases were the same and have been described in detail above. All changes in temperature and behavior of the samples were related to the laser irradiation. Two experiments without laser irradiation were performed at reduced values of RF generator anode power and 50 kW. Thus, the lower surface temperature was achieved by decreasing the enthalpy of the plasma flow. It should be noted that the enthalpy reduction leads to a change in the composition of the gas mixture (atomic nitrogen fraction decreases). This affects the nitridation and catalytic recombination processes at the surface. The maximum sample surface temperature () versus exposure time for all tests is shown in Figure 8. After the 60th second, the exposure was stopped. The curves show a cooling phase.
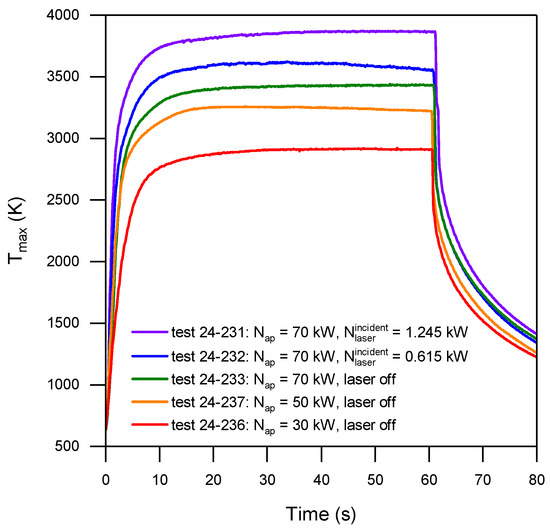
Figure 8.
Maximum graphite surface temperature vs. exposure time.
Additional laser heating with incident power kW increased the graphite surface temperature by 430 K at constant RF generator power kW. In experiments without laser heating, reducing the RF generator power from 70 to 30 kW reduced the maximum temperature by 515 K. In summary, the range of maximum graphite surface temperatures obtained in the experiments was from 2920 to 3865 K.
The thermal image of the sample recorded under the most severe test conditions ( kW; kW) is shown in Figure 9.
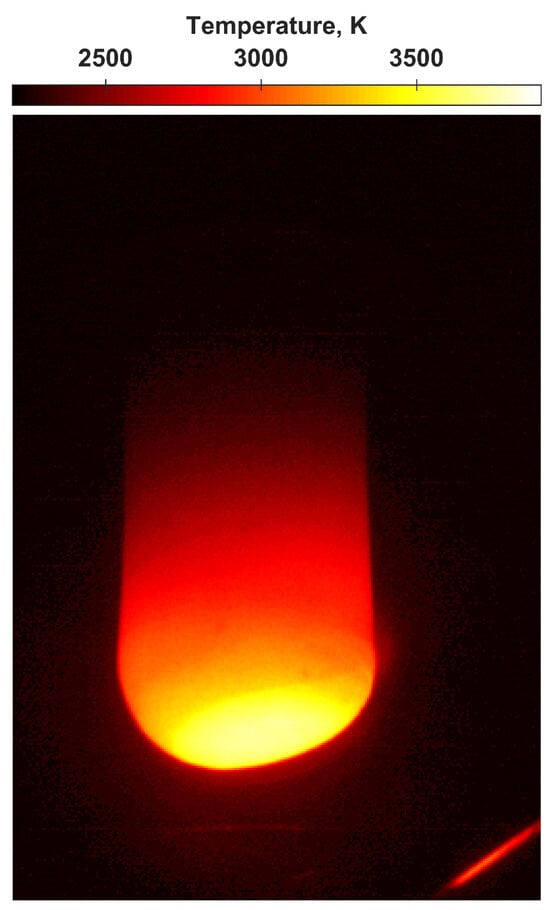
Figure 9.
Thermal image of the sample recorded in Test 24-231 immediately before exposure was terminated.
The maximum temperature spot is slightly shifted relative to the sample axis due to the laser beam aiming error. The thermal image was taken immediately before the end of the exposure, so the change in the shape of the front surface due to the intense ablation of the material in the area of the combined laser and plasma heating is visible. The temperature on the cylindrical side surface heated by the plasma flow and heat conduction from the front of the sample is significantly lower (2500–3000 K). The ablation of material on the side surface of the sample is mainly due to nitridation process, while intensive sublimation occurred on the front surface.
The nitridation process on the solid (s) carbon surface is described by the reaction:
Carbon atoms removed from the surface are partly recovered in the gas (g) phase:
Some carbon atoms in the boundary layer may recondense on the surface:
In the sublimation regime (above 3300 K at atmospheric pressure [4]), mass loss due to vaporization of carbon species becomes dominant, and the ablation rate increases exponentially:
Species may range from to or higher [50], but the main products are , , and .
Photos of standard graphite samples before exposure and tested in nitrogen plasma at constant RF generator power kW with and without laser irradiation are shown in Figure 10 and Figure 11.
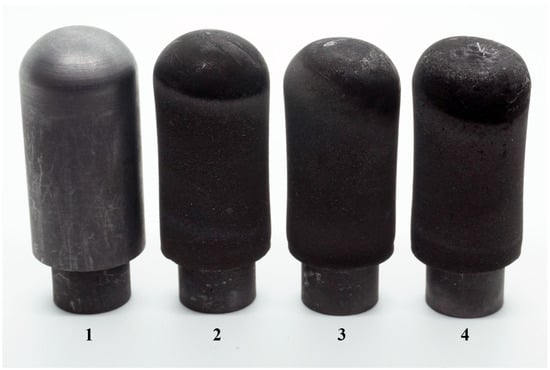
Figure 10.
Graphite samples: before exposure (1); tested in nitrogen plasma flow at constant RF generator power kW without laser heating (2) and with laser heating kW (3), kW (4).
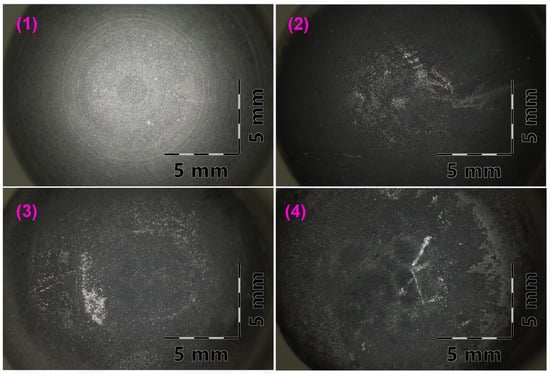
Figure 11.
Front surface of graphite samples: before exposure (1); tested in nitrogen plasma flow at constant RF generator power kW without laser heating (2) and with laser heating kW (3), kW (4).
The initial samples had a gray polished surface. After exposure, the surface became rougher. The greatest recession occurred at the spherical nose, but a change in the profile of the cylindrical side surface is also visible. A black powder-like coating was formed on the front surface of the samples, indicating carbon redeposition due to the process (4). The gray areas visible under the coating are attributed to some of the powder crumbling off after the tests. Craters were formed in the areas exposed to the laser beam. The irregularities at the bottom of the crater formed by exposure to the laser at maximum power are probably related to the nonlinearity of the ablation process in the sublimation regime.
The experimental results are summarized in Table 2. A rapid exponential increase in the front surface recession is observed in tests with additional laser irradiation (Figure 12). This change in ablation rate with increasing temperature corresponds to the graphite sublimation regime. At the same time, the increase in the total mass loss of the sample with increasing temperature is not as significant. It was pointed out in [12,27,28] that some carbon atoms may recondense on the sample surface, reducing the net mass loss. Also, in our tests, the area of maximum heat fluxes and temperatures in the front part of the sample is small compared to the area of the entire heated surface. Therefore, despite the high ablation rate in the region of the maximum heating spot (where laser craters have formed), the significant contribution to mass loss still comes from the nitridation of the long side surface.

Table 2.
Overview of experimental results: —RF generator power; —incident laser power; —cold copper wall heat flux (without laser); —maximum incident laser intensity; —maximum surface temperature; —initial sample length; —recession; —initial sample mass; —mass loss.
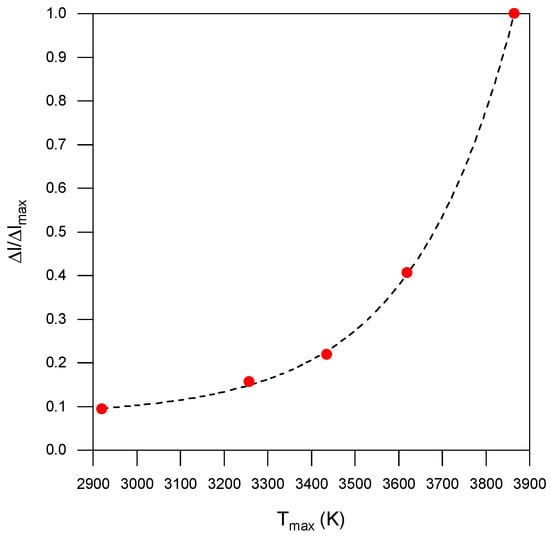
Figure 12.
Surface recession in the front area of graphite samples divided by the maximum value in the test series as a function of temperature.
Analysis of the results allows us to highlight some aspects of the novel high-temperature testing technique that require future improvement:
- Accurate measurement of the surface temperature is essential for valid studies of material behavior. The data obtained by optical pyrometry often depend on the radiative properties of the surface, which may be unknown or poorly investigated. In our case, we used the emissivity data from preliminary tests, but they were conducted at lower temperatures. The use of the Mikron M700S spectral-ratio pyrometer, which does not require emissivity correction (assuming the surface is gray-body, which also is not always true), was not possible in the combined heating experiments because its operating wavelengths were close to the operating wavelength of the Raycus RFL-C1500 laser source. In addition, the temperature limit for this pyrometer model is 3000 °C, which is below the achieved values. We consider a spectral pyrometry method to be a possible solution in the future [51,52].
- When studying the mass loss of the samples, it is fairly difficult to separate the contribution of ablation on the front surface from that on the side surface. This is important because different ablation mechanisms can be observed due to varying temperatures and exposure conditions. One solution may be to use samples of a different shape whose side surface will be protected from the flow effect, or short enough that its contribution to mass loss can be negligible. In this case, however, the maximum temperature may be lower due to heat losses in the water-cooled holder.
- When testing small axisymmetric samples, precise aiming of the laser beam is very important. We have found that even a small shift of the laser spot can cause asymmetric ablation, which affects the flow during the test and makes it complicated to evaluate the results. A possible solution is to increase the number of preliminary tests and calibrate the optical scheme. However, in this particular study, we were limited by the number of samples available.
Combined plasma and laser heating significantly expand the range of possible thermal loads available for future materials testing in the VGU-4 facility. The maximum heat flux to a highly catalytic and emissive surface at 70 kW RF generator power and maximum laser output power of 1.5 kW can reach ∼28 MW/m2. A comparison of the pressure and heat fluxes in the experiments performed with the entry conditions for some planetary mission vehicles is shown in Figure 13.
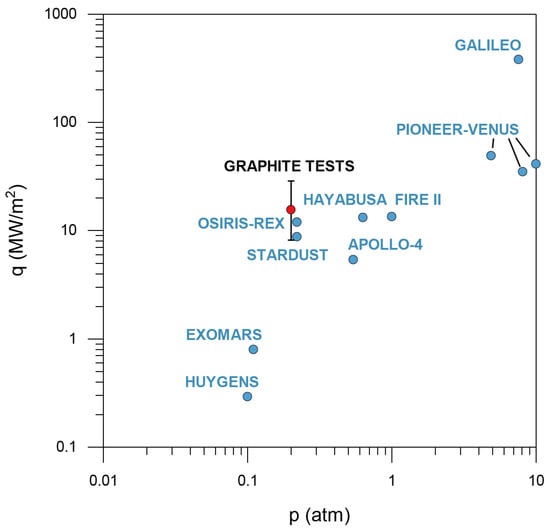
Figure 13.
Pressure and range of maximum heat fluxes in the presented experiments compared to values for different planetary mission entry vehicles [53].
In the tests, the estimated radiative part in the total heat flux due to laser irradiation could reach 40–45% (at maximum laser intensity). For some entry conditions, radiation can provide a significant input to the total heat flux. Thus, for the Hayabusa entry vehicle, the radiation part in the total heat flux was 17%, for Apollo-4 it was 35%, and for Pioneer-Venus North Probe it reached 47% [6]. The combined radiative-convective heating method used in this work allows us to simulate the re-entry conditions more comprehensively in the cases presented. It should be noted that in the tests performed, a nozzle with an outlet diameter of 16 mm was used to obtain maximum heat fluxes. However, the VGU-4 ICP facility can also be equipped with conical nozzles of 20, 30, 40, and 50 mm outlet diameters. In addition, experiments can be conducted in a subsonic plasma jet emanating directly from a cylindrical discharge channel of 80 mm diameter. By using different nozzles, changing the shape of the samples and their position in the jet, and changing the pressure in the discharge channel, the gas mass flow rate, and the power of the RF generator (ranging from 15 to 72 kW), it is possible to obtain heat fluxes in a wide range from 0.05 to 16 MW/m2 (without additional laser irradiation). The operating pressure range of the VGU-4 ICP facility (0.006 to 1 atm) cannot be extended without major modifications to the test chamber. The latter makes it difficult to simulate the Venus atmospheric entry conditions (typical conditions are shown for the Pioneer-Venus probes). At the same time, our previous experience with experiments in pure carbon dioxide plasma [22,23,24,33,54] and preliminary tests in mixtures of nitrogen and methane (95%N2 + 5%CH4) have shown the potential of the proposed approach for Mars and Titan entry simulations (see ExoMars and Huygens entry conditions). Another possible improvement is increasing the total heat flux using more powerful laser sources. This could have potential applications in materials testing for future «shallow» Saturn probes, Saturn aerocapture, and sample Earth return missions from Mars, Venus, comets, and asteroids with heating rates in the range of 10 to 60 MW/m2 [55].
5. Conclusions
In this research, we used combined laser and nitrogen plasma heating to study the behavior of graphite at high temperatures. Integrating the 1.5 kW Raycus RFL-C1500 laser source into the VGU-4 ICP facility allowed us to increase the surface temperature by 430 K. We have demonstrated the ability to heat graphite above 3850 K in a dissociated nitrogen flow. The data on the ablation of fine-grain MPG-7 graphite samples in the surface temperature range from 2920 to 3865 K under exposure to nitrogen plasma jet and combined exposure to nitrogen plasma jet and laser beam have been obtained. Nitridation and sublimation (with crater formation) of graphite samples were observed. A rapid increase in the surface recession rate was observed in tests where samples were exposed to a combined plasma jet and laser beam. The subsonic nitrogen plasma jet has been characterized by numerical simulations, probes, and spectral measurements. The high content of atomic nitrogen in the plasma free-stream was indicated. The measured values of heat flux and dynamic pressure allowed us to obtain the enthalpy and the temperature at the outer edge of the boundary layer in front of the sample. This work can be used as a starting point for a more detailed study of the behavior of graphite and carbon-based materials at high temperatures in dissociated nitrogen flows. The most important result, however, is the further evolution of the novel testing technique. The powerful laser heating source combined with the VGU-4 ICP facility has greatly increased the maximum heat flux. The ability to combine varying radiative and convective parts makes this approach promising for simulating entry conditions in different atmospheres (e.g., Earth, Venus, Mars, and Titan). Further work will focus on studying the behavior of graphite when heated by the proposed technique in plasma jets of different chemical compositions. The acquisition of plasma spectra in the boundary layer is also of great interest.
Author Contributions
Conceptualization, A.C.; methodology, M.Y., S.V., A.C. and I.L.; investigation, A.C., M.Y., S.V., I.L. and S.G.; writing—original draft preparation, A.C.; writing—review and editing, M.K., M.Y. and S.V.; visualization, S.G., S.V., M.Y. and A.C.; supervision, A.K., N.S. and A.S.; project administration, A.C. and M.K.; funding acquisition, A.C. All authors have read and agreed to the published version of the manuscript.
Funding
The research was supported by the Russian Science Foundation (project No. 22-79-10083, https://rscf.ru/en/project/22-79-10083/ (accessed on 26 January 2025)).
Institutional Review Board Statement
Not applicable.
Informed Consent Statement
Not applicable.
Data Availability Statement
Data are contained within the article.
Acknowledgments
The experiments were carried out at induction RF plasmatron VGU-4 (IPMech RAS Research Resource Center).
Conflicts of Interest
The authors declare no conflict of interest.
Abbreviations
The following abbreviations are used in this manuscript:
| RAS | Russian Academy of Sciences |
| ICP | Inductively Coupled Plasma |
| RF | Radio Frequency |
References
- Mangalgiri, P. Composite materials for aerospace applications. Bull. Mater. Sci. 1999, 22, 657–664. [Google Scholar] [CrossRef]
- Windhorst, T.; Blount, G. Carbon-carbon composites: A summary of recent developments and applications. Mater. Des. 1997, 18, 11–15. [Google Scholar] [CrossRef]
- Poloni, E.; Bouville, F.; Schmid, A.L.; Pelissari, P.I.; Pandolfelli, V.C.; Sousa, M.L.; Tervoort, E.; Christidis, G.; Shklover, V.; Leuthold, J.; et al. Carbon ablators with porosity tailored for aerospace thermal protection during atmospheric re-entry. Carbon 2022, 195, 80–91. [Google Scholar] [CrossRef]
- Scala, S.M.; Gilbert, L.M. Sublimation of graphite at hypersonic speeds. AIAA J. 1965, 3, 1635–1644. [Google Scholar] [CrossRef]
- Lundell, J.H.; Dickey, R.R. Ablation of graphitic materials in the sublimation regime. AIAA J. 1975, 13, 1079–1085. [Google Scholar] [CrossRef]
- Duffa, G. Ablative Thermal Protection Systems Modeling; American Institute of Aeronautics and Astronautics, Inc.: Reston, VA, USA, 2013. [Google Scholar]
- Zibitsker, A.L.; McQuaid, J.A.; Stern, E.C.; Palmer, G.E.; Libben, B.J.; Brehm, C.; Martin, A. Finite-rate and equilibrium study of graphite ablation under arc-jet conditions. Comput. Fluids 2023, 267, 106069. [Google Scholar] [CrossRef]
- Chen, Y.K.; Milos, F.; Reda, D.; Stewart, D. Graphite ablation and thermal response simulation under arc-jet flow conditions. In Proceedings of the 36th AIAA Thermophysics Conference, Orlando, FL, USA, 23–26 June 2003; p. 4042. [Google Scholar]
- Vancrayenest, B.; Fletcher, D. Emission spectroscopic survey of graphite ablation in the VKI plasmatron. In Proceedings of the 9th AIAA/ASME Joint Thermophysics and Heat Transfer Conference, San Francisco, CA, USA, 5–8 June 2006; p. 2907. [Google Scholar]
- Helber, B.; Turchi, A.; Magin, T.E. Determination of active nitridation reaction efficiency of graphite in inductively coupled plasma flows. Carbon 2017, 125, 582–594. [Google Scholar] [CrossRef]
- Lutz, A.J.; Owens, W.; Meyers, J.; Fletcher, D.; Marschall, J. Investigation of CN Production from Carbon Materials in Nitrogen Plasmas. Ph.D. Thesis, University of Vermont, Burlington, VT, USA, 2011. [Google Scholar]
- Suzuki, T.; Fujita, K.; Ando, K.; Sakai, T. Experimental study of graphite ablation in nitrogen flow. J. Thermophys. Heat Transf. 2008, 22, 382–389. [Google Scholar] [CrossRef]
- Suzuki, T.; Fujita, K.; Sakai, T. Experimental study of graphite ablation in nitrogen flow, part II: Further numerical analysis. J. Thermophys. Heat Transf. 2010, 24, 589–597. [Google Scholar] [CrossRef]
- Vignoles, G.L.; Turchi, A.; Bianchi, D.; Blaineau, P.; Lamboley, X.; Huy, D.L.Q.; Levet, C.; Caty, O.; Chazot, O. Ablative and catalytic behavior of carbon-based porous thermal protection materials in nitrogen plasmas. Carbon 2018, 134, 376–390. [Google Scholar] [CrossRef]
- Anderson, N.A.; Zolfaghari, P.; Bhattacharya, S.; Capponi, L.; Oldham, T.; Sankaran, R.M.; Elliott, G.S.; Panerai, F. Flow reactor experiments of high-temperature graphite oxidation and nitridation. High Temp. Corros. Mater. 2024, 101, 185–201. [Google Scholar] [CrossRef]
- Isaacs, C.T.; Trotsky, M.; Samuels, K.E.; Thompson, T.; Dove, D.K.; Kihm, K.; Baccarella, D. Aerothermal Testing in a Pulsed Arc-Jet Tunnel With Laser Pre-Heating. In Proceedings of the AIAA SCITECH 2025 Forum, Orlando, FL, USA, 6–10 January 2025; p. 0323. [Google Scholar]
- Iyinomen, D.O. Numerical and experimental analyses of ablation measurements in expansion wind tunnel facilities using a new plasma pre-heating technique. Int. J. Thermofluids 2020, 3, 100019. [Google Scholar] [CrossRef]
- Cushman, G.; Alunni, A.; Balboni, J.; Zell, P.; Hartman, J.; Empey, D. The laser enhanced arc-jet facility (LEAF-Lite): Simulating convective and radiative heating with arc-jets and multiple 50-kW CW lasers. In Proceedings of the 2018 Joint Thermophysics and Heat Transfer Conference, Atlanta, GA, USA, 25–29 June 2018; p. 3273. [Google Scholar]
- Alunni, A.I.; Gokcen, T.; Boghozian, T. Laser-enhanced arc-jet facility wedge tests: Avcoat material performance under convective and radiative heating environments. In Proceedings of the Joint Thermophysics and Heat Transfer Conference, Dallas, TX, USA, 17–21 June 2019. [Google Scholar]
- Momozawa, A.; Yokote, N.; Terutsuki, D.; Komurasaki, K. Dynamic oxidation of SiC with arc-heated plasma wind tunnel and laser heating. Vacuum 2021, 185, 109899. [Google Scholar] [CrossRef]
- Chaplygin, A.; Kotov, M.; Yakimov, M.; Lukomskii, I.; Galkin, S.; Kolesnikov, A.; Shemyakin, A.; Solovyov, N. Combined surface heating by laser beam and subsonic nitrogen plasma jet. Fluids 2022, 8, 11. [Google Scholar] [CrossRef]
- Chaplygin, A.; Galkin, S.; Kotov, M.; Yakimov, M.Y.; Lukomskii, I.; Kolesnikov, A.; Shemyakin, A.; Solovyov, N. Heat Transfer and Behavior of Silicon Carbide in Subsonic Nitrogen and Carbon Dioxide Plasma Flows under Additional Radiative Heating. Fluid Dyn. 2023, 58, 1483–1494. [Google Scholar] [CrossRef]
- Simonenko, E.P.; Kolesnikov, A.F.; Chaplygin, A.V.; Kotov, M.A.; Yakimov, M.Y.; Lukomskii, I.V.; Galkin, S.S.; Shemyakin, A.N.; Solovyov, N.G.; Lysenkov, A.S.; et al. Oxidation of Ceramic Materials Based on HfB2-SiC under the Influence of Supersonic CO2 Jets and Additional Laser Heating. Int. J. Mol. Sci. 2023, 24, 13634. [Google Scholar] [CrossRef] [PubMed]
- Chaplygin, A.; Simonenko, E.; Simonenko, N.; Kotov, M.; Yakimov, M.; Lukomskii, I.; Galkin, S.; Kolesnikov, A.; Vasil’evskii, S.; Shemyakin, A.; et al. Heat transfer and behavior of ultra high temperature ceramic materials under exposure to supersonic carbon dioxide plasma with additional laser irradiation. Int. J. Therm. Sci. 2024, 201, 109005. [Google Scholar] [CrossRef]
- Goldstein, H.W. The reaction of active nitrogen with graphite. J. Phys. Chem. 1964, 68, 39–42. [Google Scholar] [CrossRef]
- Park, C.; Bogdanoff, D.W. Shock-tube measurement of nitridation coefficient of solid carbon. J. Thermophys. Heat Transf. 2006, 20, 487–492. [Google Scholar] [CrossRef]
- Zhang, L.; Pejaković, D.A.; Marschall, J.; Dougherty, M.; Fletcher, D.G. Laboratory investigation of the active nitridation of graphite by atomic nitrogen. J. Thermophys. Heat Transf. 2012, 26, 10–21. [Google Scholar] [CrossRef]
- Suzuki, T.; Fujita, K.; Sakai, T. Numerical analysis of graphite ablation in nitrogen flow. In Proceedings of the 46th AIAA Aerospace Sciences Meeting and Exhibit, Reno, NV, USA, 7–10 January 2008; p. 1217. [Google Scholar]
- Vershinin, A.; Gorbatov, V.; Kurichenko, A.; Koitov, S. Thermophysical Properties of Fine-Grain MPG-7 Graphite with Chemical and Structural Heterogeneity. High Temp. 2022, 60, 616–620. [Google Scholar] [CrossRef]
- Kostanovskii, A.V.; Zeodinov, M.G.; Kostanovskaya, M.E. Experimental determination of the emissivity of isotropic graphite at temperatures above 2300 K. High Temp. 2001, 39, 159–161. [Google Scholar] [CrossRef]
- Kostanovskii, A.; Zeodinov, M.; Kostanovskaya, M. The Determination of Thermal Conductivity and Emissivity of Graphite at High Temperatures. High Temp. 2005, 43, 793. [Google Scholar] [CrossRef]
- Boulos, M.I.; Fauchais, P.L.; Pfender, E. Handbook of Thermal Plasmas; Springer: Berlin/Heidelberg, Germany, 2023. [Google Scholar]
- Chaplygin, A.V.; Simonenko, E.P.; Kotov, M.A.; Sakharov, V.I.; Lukomskii, I.V.; Galkin, S.S.; Kolesnikov, A.F.; Lysenkov, A.S.; Nagornov, I.A.; Mokrushin, A.S.; et al. Short-Term Oxidation of HfB2-SiC Based UHTC in Supersonic Flow of Carbon Dioxide Plasma. Plasma 2024, 7, 300–315. [Google Scholar] [CrossRef]
- McCarthy, D.E. Transmittance of Optical Materials from 0.17 μ to 3.0 μ. Appl. Opt. 1967, 6, 1896–1898. [Google Scholar] [CrossRef]
- Biasetto, L.; Manzolaro, M.; Andrighetto, A. Emissivity measurements of opaque gray bodies up to 2000 C by a dual-frequency pyrometer. Eur. Phys. J. A 2008, 38, 167–171. [Google Scholar] [CrossRef]
- Purpura, C. Methods for the Material Spectral Emissivity Evaluation by Dual-Color Pyrometer in a Hypersonic Plasma Test Facility. IEEE J. Miniaturization Air Space Syst. 2020, 2, 92–97. [Google Scholar] [CrossRef]
- Latyev, L.; Petrov, V.; Chekhovskoi, V.Y.; Shestakov, E. Radiative Properties of Solid Materials; Energiya: Moscow, Russia, 1974. [Google Scholar]
- Neuer, G. Spectral and total emissivity measurements of highly emitting materials. Int. J. Thermophys. 1995, 16, 257–265. [Google Scholar] [CrossRef]
- Thorn, R.; Simpson, O. Spectral emissivities of graphite and carbon. J. Appl. Phys. 1953, 24, 633–639. [Google Scholar] [CrossRef]
- Basharin, A.Y.; Kirillin, A.V.; Sheindlin, M.A. Method of experimental investigation of the optical characteristics of refractory materials at very high-temperature. Teplofiz. Vysok. Temp. 1984, 22, 131–137. [Google Scholar]
- Rini, P.; Vasil’evskii, S.; Kolesnikov, A.; Chazot, O.; Degrez, G. Inductively coupled CO2 plasma flows: Code-to-code comparison. In Proceedings of the 4-th International Symposium Atmospheric Reentry Vehicles and Systems, Arcachon, France, 21–23 March 2005; pp. 21–23. [Google Scholar]
- Utyuzhnikov, S.; Konyukhov, A.; Rudenko, D.; Vasil’evskii, S.; Kolesnikov, A.; Chazot, O. Simulation of subsonic and supersonic flows in inductive plasmatrons. AIAA J. 2004, 42, 1871–1877. [Google Scholar] [CrossRef][Green Version]
- Sakharov, V.; Kolesnikov, A.; Gordeev, A.; Vérant, J.L. CFD modeling of thermally and chemically nonequilibrium flows in discharge channel and in subsonic plasmatron jets around of the flat-face model. In Proceedings of the 6th European Symposium on Aerothermodynamics for Space Vehicles, Versailles, France, 3–6 November 2009; Volume 659, p. 61. [Google Scholar]
- Vasil’evskii, S.; Gordeev, A.; Kolesnikov, A.; Chaplygin, A. Thermal effect of surface catalysis in subsonic dissociated-air jets. Experiment on a high-frequency plasmatron and numerical modeling. Fluid Dyn. 2020, 55, 708–720. [Google Scholar] [CrossRef]
- Chaplygin, A.; Vasil’evskii, S.; Galkin, S.; Kolesnikov, A. Thermal state of uncooled quartz discharge channel of powerful high-frequency induction plasmatron. Phys. Kinet. Gas Dyn. 2022, 23, 38–56. [Google Scholar] [CrossRef]
- Patankar, S.V.; Spalding, D.B. A calculation procedure for heat, mass and momentum transfer in three-dimensional parabolic flows. In Numerical Prediction of Flow, Heat Transfer, Turbulence and Combustion; Elsevier: Amsterdam, The Netherlands, 1983; pp. 54–73. [Google Scholar]
- Sokolova, I.; Vasiljevskii, S.; Andriatis, A. Calculation of transport coefficients of multicomponent gas and plasma. Phys.-Chem. Kinet. Gas Dyn. 2005, 3, 1–30. (In Russian) [Google Scholar]
- Oldham, T.; Capponi, L.; Konnik, M.; Stephani, K.; Bodony, D.J.; Panesi, M.; Elliott, G.S.; Panerai, F. Aerothermal characterization of the Plasmatron X wind tunnel: Optical emission spectroscopy and jet temperature reconstruction. In Proceedings of the AIAA Scitech 2023 Forum, Online, 23–27 January 2023; p. 2516. [Google Scholar]
- Kolesnikov, A.F.; Pershin, I.S.; Vasil’evskii, S.A.; Yakushin, M.I. Study of quartz surface catalycity in dissociated carbon dioxide subsonic flows. J. Spacecr. Rocket. 2000, 37, 573–579. [Google Scholar] [CrossRef]
- Keenan, J.; Candler, G. Simulation of graphite sublimation and oxidation under re-entry conditions. In Proceedings of the 6th Joint Thermophysics and Heat Transfer Conference, Colorado Springs, CO, USA, 20–23 June 1994; p. 2083. [Google Scholar]
- Magunov, A. Spectral pyrometry. Instruments Exp. Tech. 2009, 52, 451–472. [Google Scholar] [CrossRef]
- Chaplygin, A.; Gordeev, A. Heat transfer and flow visualization experiments for plasma jets issuing from slit nozzles. In AIP Conference Proceedings; AIP Publishing: Melville, NY, USA, 2021; Volume 2351. [Google Scholar]
- Parcero, K.; Allen, G.; Witkowski, A.; McKee, S.; Torres, L. Planetary Mission Entry Vehicles. Quick Reference Guide Version 4.0; 2022; NASA/SP-20220010761. Available online: https://ntrs.nasa.gov/citations/20220010761 (accessed on 26 January 2025).
- Chaplygin, A.; Galkin, S.; Lukomskii, I.; Tepteeva, E.; Vasil’evskii, S.; Kolesnikov, A.; Simonenko, E.; Simonenko, N. Heat Transfer and Behavior of Silicon Carbide Samples in Subsonic Air, Nitrogen, and Carbon Dioxide Plasma Flows. Fluid Dyn. 2024, 59, 1462–1482. [Google Scholar] [CrossRef]
- Venkatapathy, E.; Laub, B.; Hartman, G.; Arnold, J.; Wright, M.; Allen, G., Jr. Thermal protection system development, testing, and qualification for atmospheric probes and sample return missions: Examples for Saturn, Titan and Stardust-type sample return. Adv. Space Res. 2009, 44, 138–150. [Google Scholar] [CrossRef]
Disclaimer/Publisher’s Note: The statements, opinions and data contained in all publications are solely those of the individual author(s) and contributor(s) and not of MDPI and/or the editor(s). MDPI and/or the editor(s) disclaim responsibility for any injury to people or property resulting from any ideas, methods, instructions or products referred to in the content. |
© 2025 by the authors. Licensee MDPI, Basel, Switzerland. This article is an open access article distributed under the terms and conditions of the Creative Commons Attribution (CC BY) license (https://creativecommons.org/licenses/by/4.0/).