Brief Report

Positive- and Negative-Polarity Nanosecond-Pulsed Cryogenic Plasma in Liquid Argon

C&J Nyheim Plasma Institute, Drexel University, Camden, NJ 08103, USA
*
Author to whom correspondence should be addressed.
Plasma 2024, 7(3), 510-516; https://doi.org/10.3390/plasma7030027
Submission received: 7 June 2024 / Revised: 25 June 2024 / Accepted: 27 June 2024 / Published: 29 June 2024

Abstract

:
This work reports on observations of positive and negative nanosecond-pulsed discharge in liquid argon. The structures of both positive and negative discharges, their sizes, and the propagation velocities exhibit remarkable similarity. Similar to the streamers in liquid nitrogen and gases, negative streamers require higher applied voltages (electric fields) and propagate to shorter distances. For both polarities, the spectra are almost identical and appear to be a superposition of strongly broadened atomic lines, with preliminary analysis of broadening indicating densities of about 40% that of liquid.

1. Introduction

Over the past decade, there has been a considerable interest in low-energy nanosecond-pulsed in-liquid discharges, particularly as they represent extreme cases of plasmas in high-density environments with direct ionization without creation of bubbles and/or other significant low-density voids [1,2,3,4,5,6,7,8,9,10,11,12,13,14,15,16,17]. These discharges are typically initiated using positive short-duration high-voltage pulses applied to electrodes submerged in dielectric liquids such as water or transformer oil. Due to the high applied electric field values, fast rise times of the voltage pulses, and inertia of the liquid, formation of luminous mm-scale filaments is assumed to be initiated directly within the liquid. One proposed scenario of the initiation and propagation of such discharges in liquids involves the formation of positive streamers or direct ionization of the liquid phase [13,18]. Negative discharges ignited with the pulses of similar characteristics, on the other hand, are often observed in either “glow” Townsend-like regime or in the negative streamer mode [10,11,12]. In our recent study, we demonstrated that in-liquid nitrogen negative discharge, similar to negative discharges in gases, exhibits transition from the “glow” to streamer regime [19].
In this manuscript, we present the experimental results of imaging and spectroscopic measurements of the emission spectra of positive and negative nanosecond-pulsed discharges in liquid argon ignited at the tip of a needle electrode. We compare these observations with those obtained for nanosecond-pulsed cryogenic in-liquid nitrogen plasma and suggest a similarity between positive and negative streamers in cryogenic liquid plasma conditions.

2. Materials and Methods

In the experiments, we used a setup that was described previously (see [18,19]). Briefly, the nanosecond-pulsed discharge in liquid argon (Airgas, Sacramento, CA, USA) was ignited at the tip of a copper needle with a radius of curvature of 100 μm. As a second electrode, a copper disc with a diameter of 2 cm was used. An FPG 120-01NM10 high-voltage power supply (FID Technology, Burbach, Germany) was used to provide high-voltage pulses with the following parameters: pulse duration at 90% of amplitude—8 ns, rise time from 10% to 90% amplitude—1 ns, amplitude—+40 to +120 kV. To generate positive or negative discharge, either the needle or planar electrode was powered, while the other one was grounded. For the negative discharge, the gap distance was 5 mm and for the positive–4 cm. A double-walled borosilicate glass vessel was used as a liquid argon-containing chamber. The discharge shape and development patterns were visualized using a 4Picos intensified charge-coupled device (ICCD) camera (Stanford Computer Optics, Berkeley, CA, USA) coupled with a VZM™ 450 zoom imaging lens (Edmund Optics, Barrington, NJ, USA). Shadow imaging was performed with a 75 W Xe arc lamp (6251NS, Newport, Irvine, CA, USA) as a source of back light. For spectra measurements, we utilized an SP-2500i monochromator (Princeton Instruments, Trenton, NJ, USA) operating at a single stage with 750 L/mm grating with a 4Picos camera as a detector. Light from the discharge was collected using a 1 m single-leg fiber optic bundle with nineteen 200 μm fibers (190–1100 nm, Princeton Instruments, USA). To correct the recorded spectra of the discharge, the optical transmission of the measurement setup was characterized with a quartz tungsten halogen calibrated lamp (63350, Newport, USA).

3. Results

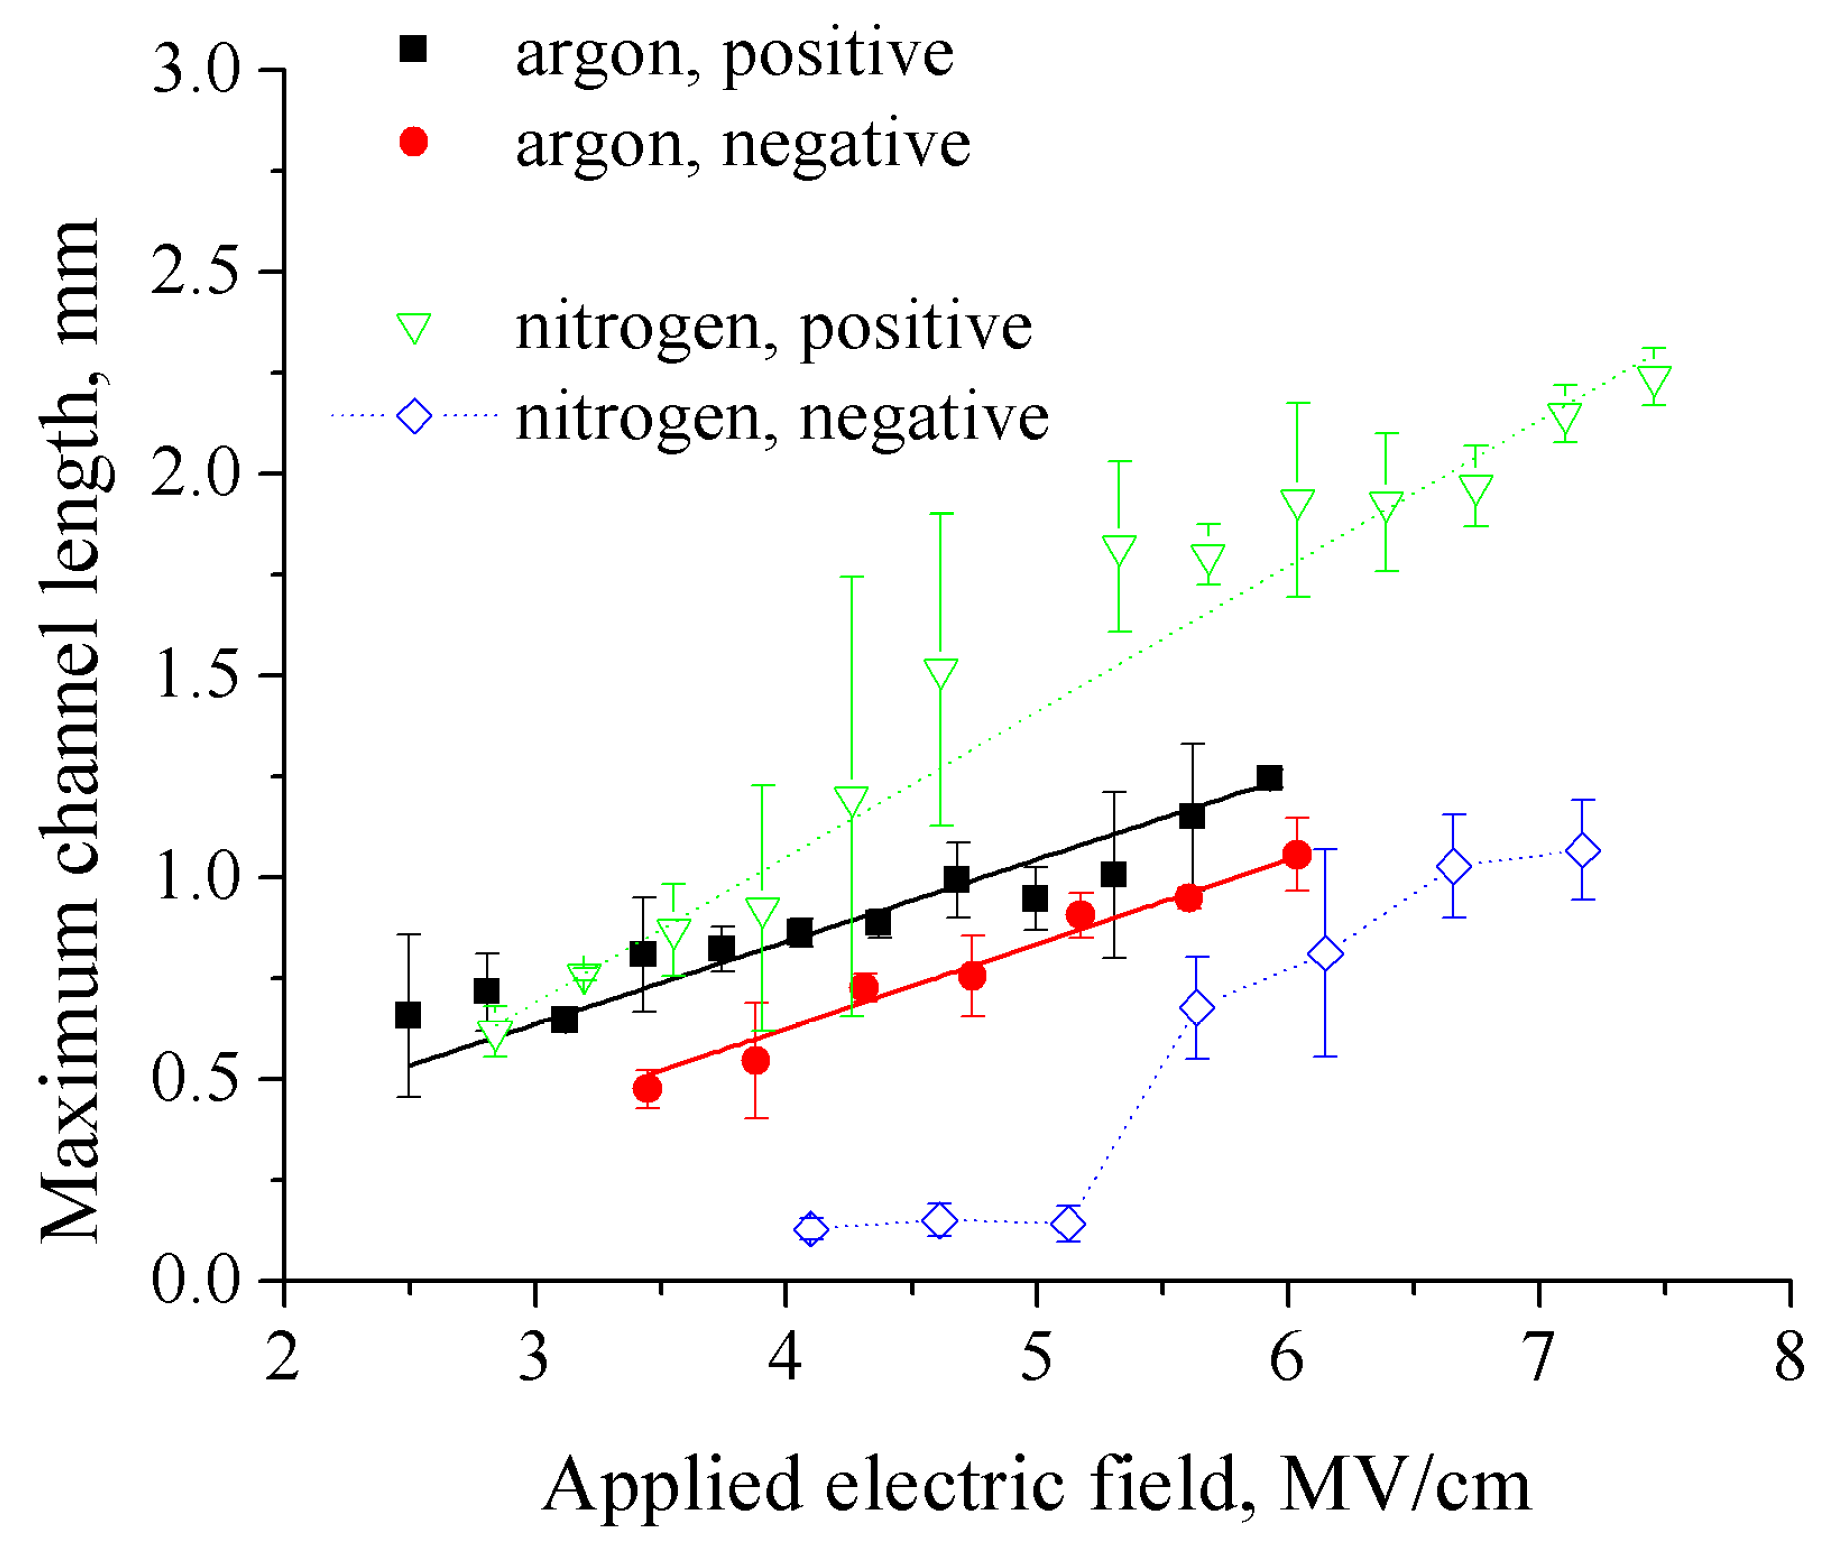
Integral images of both positive and negative discharges in liquid argon taken with 50 ns of exposure time are shown in Figure 1. The discharge appearance seems to be very similar for both polarities, both in shape of the luminous filaments, their number, and length. Typical propagation lengths of the discharge are in the order of 0.5–1 mm, and they increase with the applied voltage. A plot of the channel maximum length as a function of the maximum applied electric field (Figure 2) shows very close curves for both positive and negative polarity discharge. The maximum applied electric field was calculated using the maximum of the voltage pulse V:
E m a x = 2 V r   l n 4 d r ,
where r is the needle radius of the curvature, and d is the distance to the second electrode. It is interesting that compared to the negative discharge in liquid nitrogen [19], we did not see the transition from the “glow” (or corona) mode to the streamer mode. This could be due to the increased losses to the vibrational excitation of nitrogen that results in the higher electric fields required for a sufficient charge accumulation and formation of streamers. Similarly to nitrogen [19], however, compared to the positive streamers, negative streamers in liquid argon start at the higher applied electric fields that are required for sufficient charge accumulation (probably due to electron losses along the electric field). The streamers in liquid argon propagate to shorter distances compared to the positive ones due to higher values of the first Townsend coefficient (therefore, shorter distances are required to meet the Meek criterion of streamer formation) and higher electron losses along the electric field.
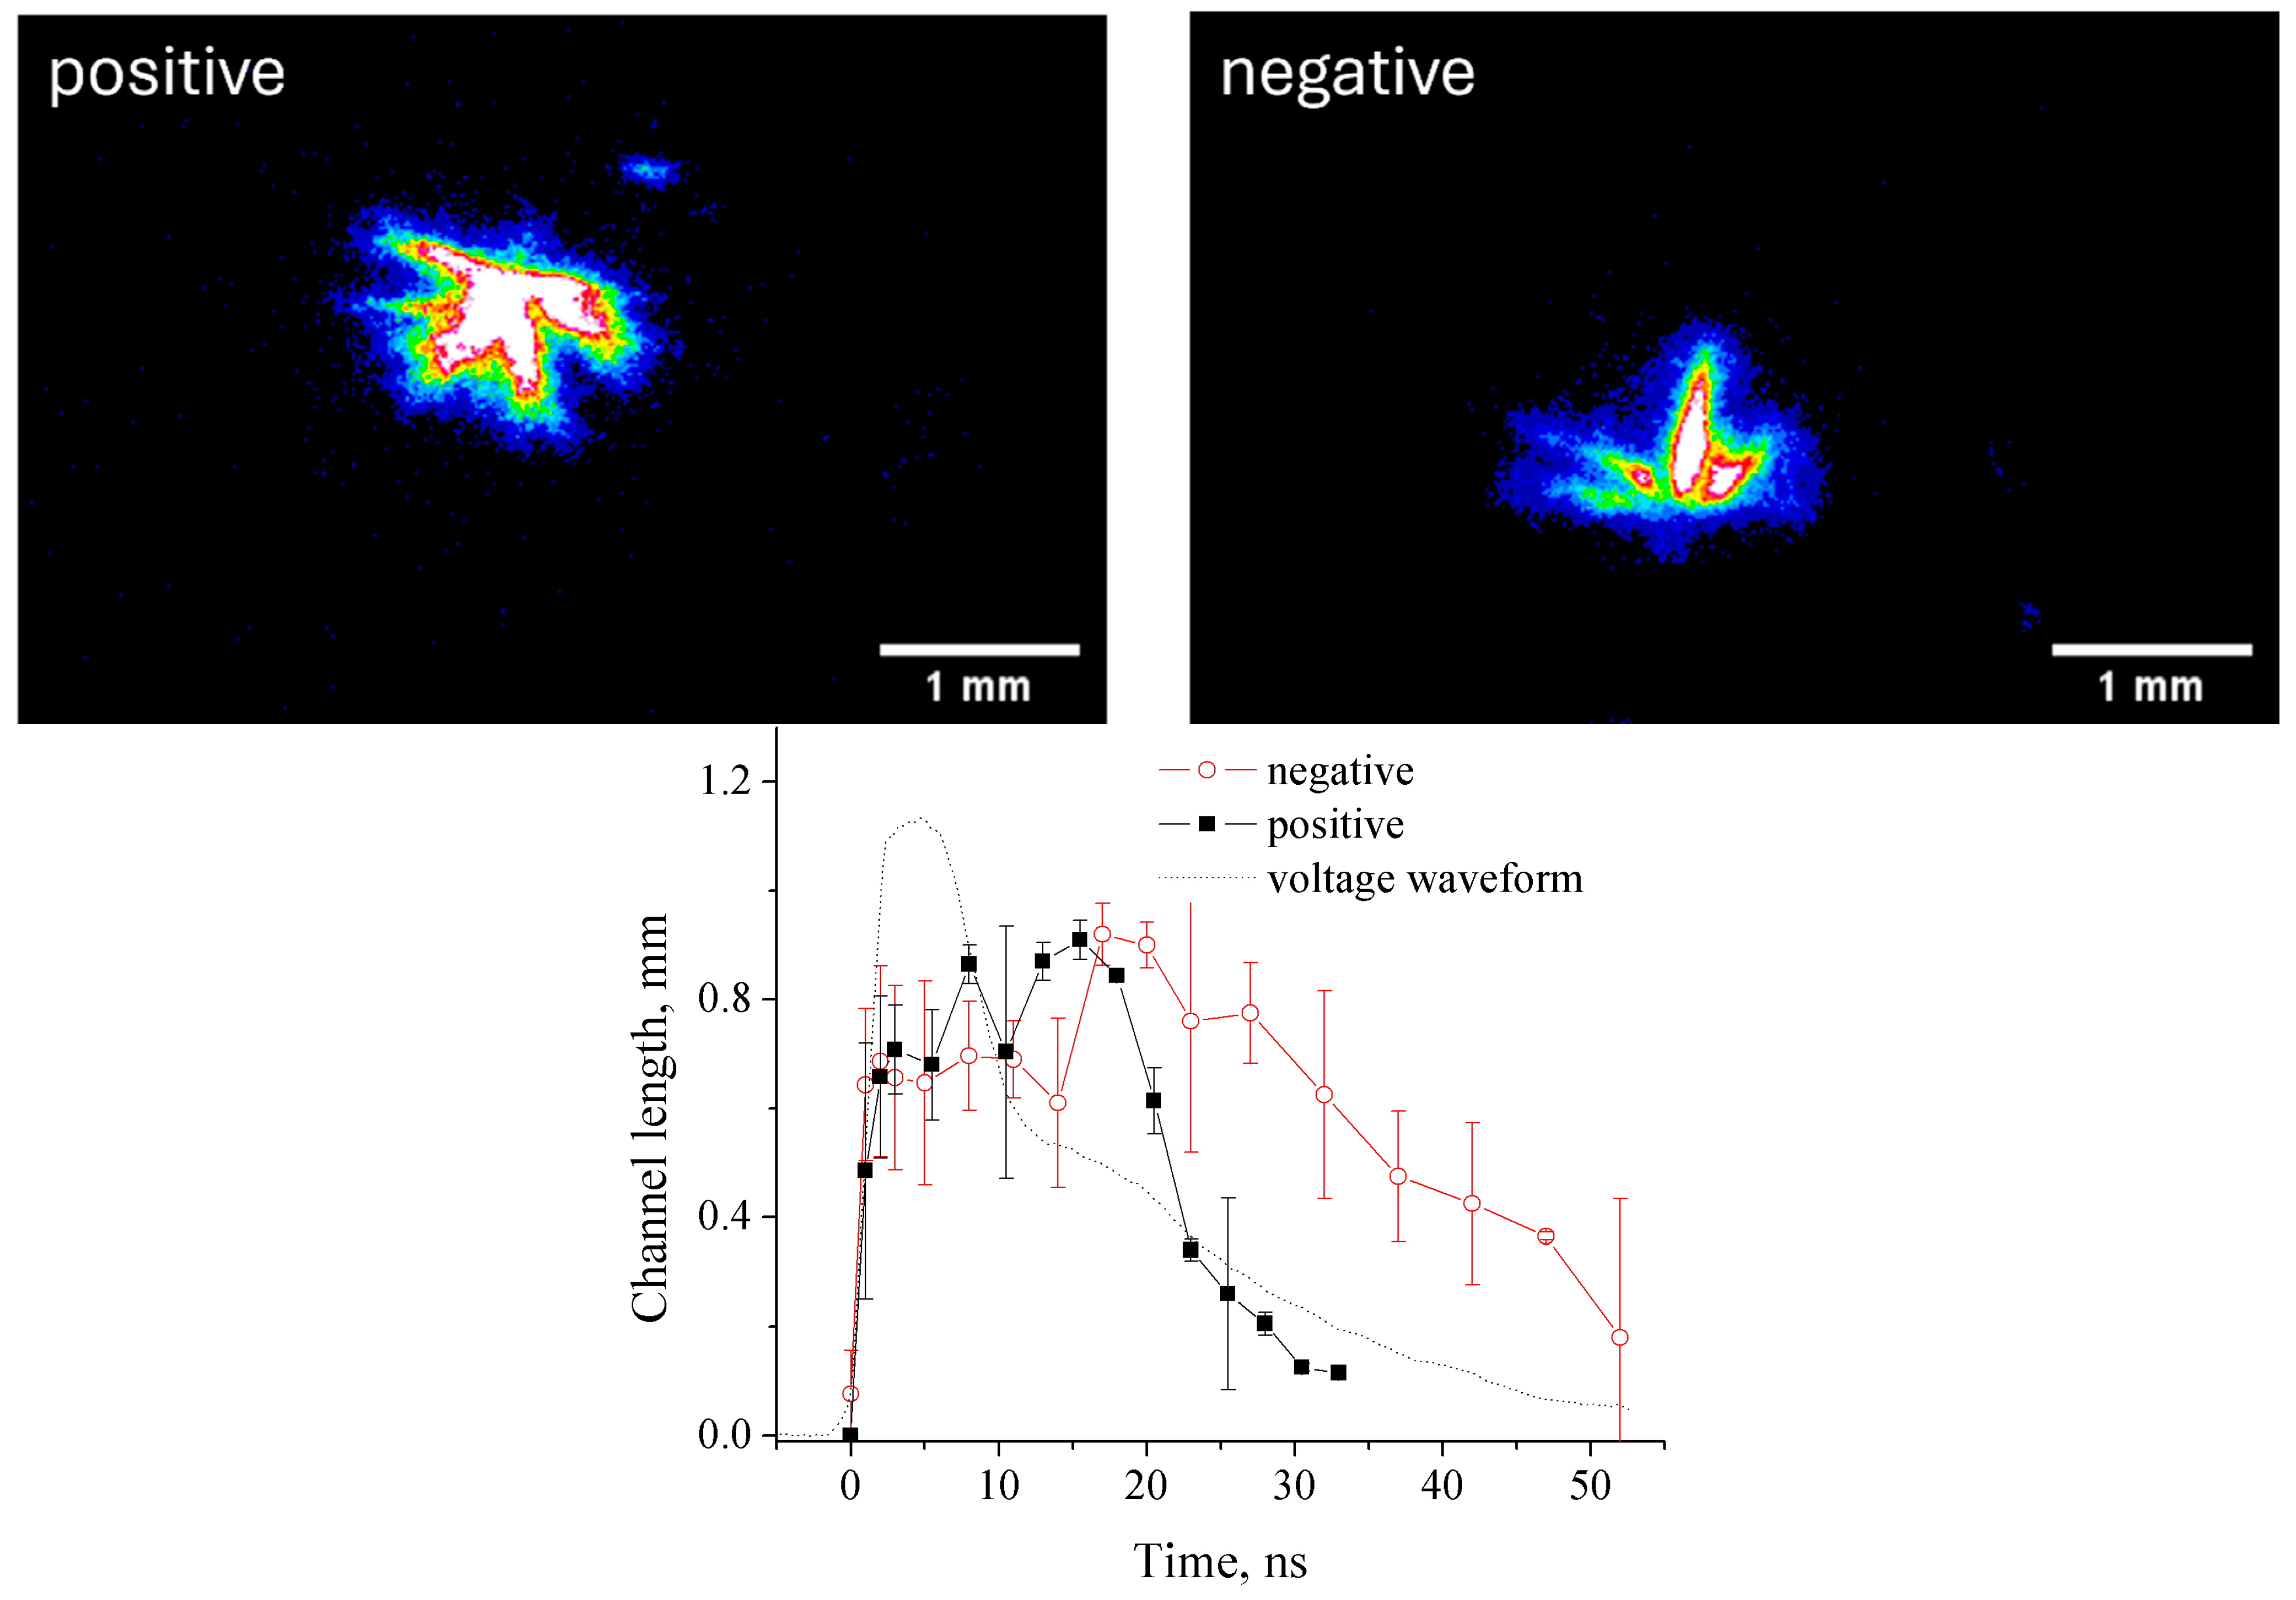
Figure 3 shows the single-shot ICCD images of the streamers in liquid argon taken with a 2 ns camera gate width, 4 ns after the start of the discharge that was ignited with a 50 kV applied voltage pulse. The images of both the positive and negative discharges appear to be virtually identical, characterized by very similar “streamer trees”. This suggests that not only the positive discharges but also the negative ones propagate following the conventional streamer mechanism. Just like the discharges ignited in other liquids (water and nitrogen), liquid argon discharge starts with streamers propagating with a high velocity of ~0.5 mm/ns, typical to streamers in gases where the density is about three orders of magnitude lower [18,19,20]. Following the analysis presented in the case of the cryogenic nitrogen discharge [18], the high streamer propagation velocity in liquid argon allows estimation of the electric field in the streamer head: about 10 MV/cm. The luminous phase of the negative discharge lasts about 20 ns longer than the positive one, until the very end of the applied voltage pulse, which is probably related to the lower rate of the in-volume losses of charges in the negative plasma.
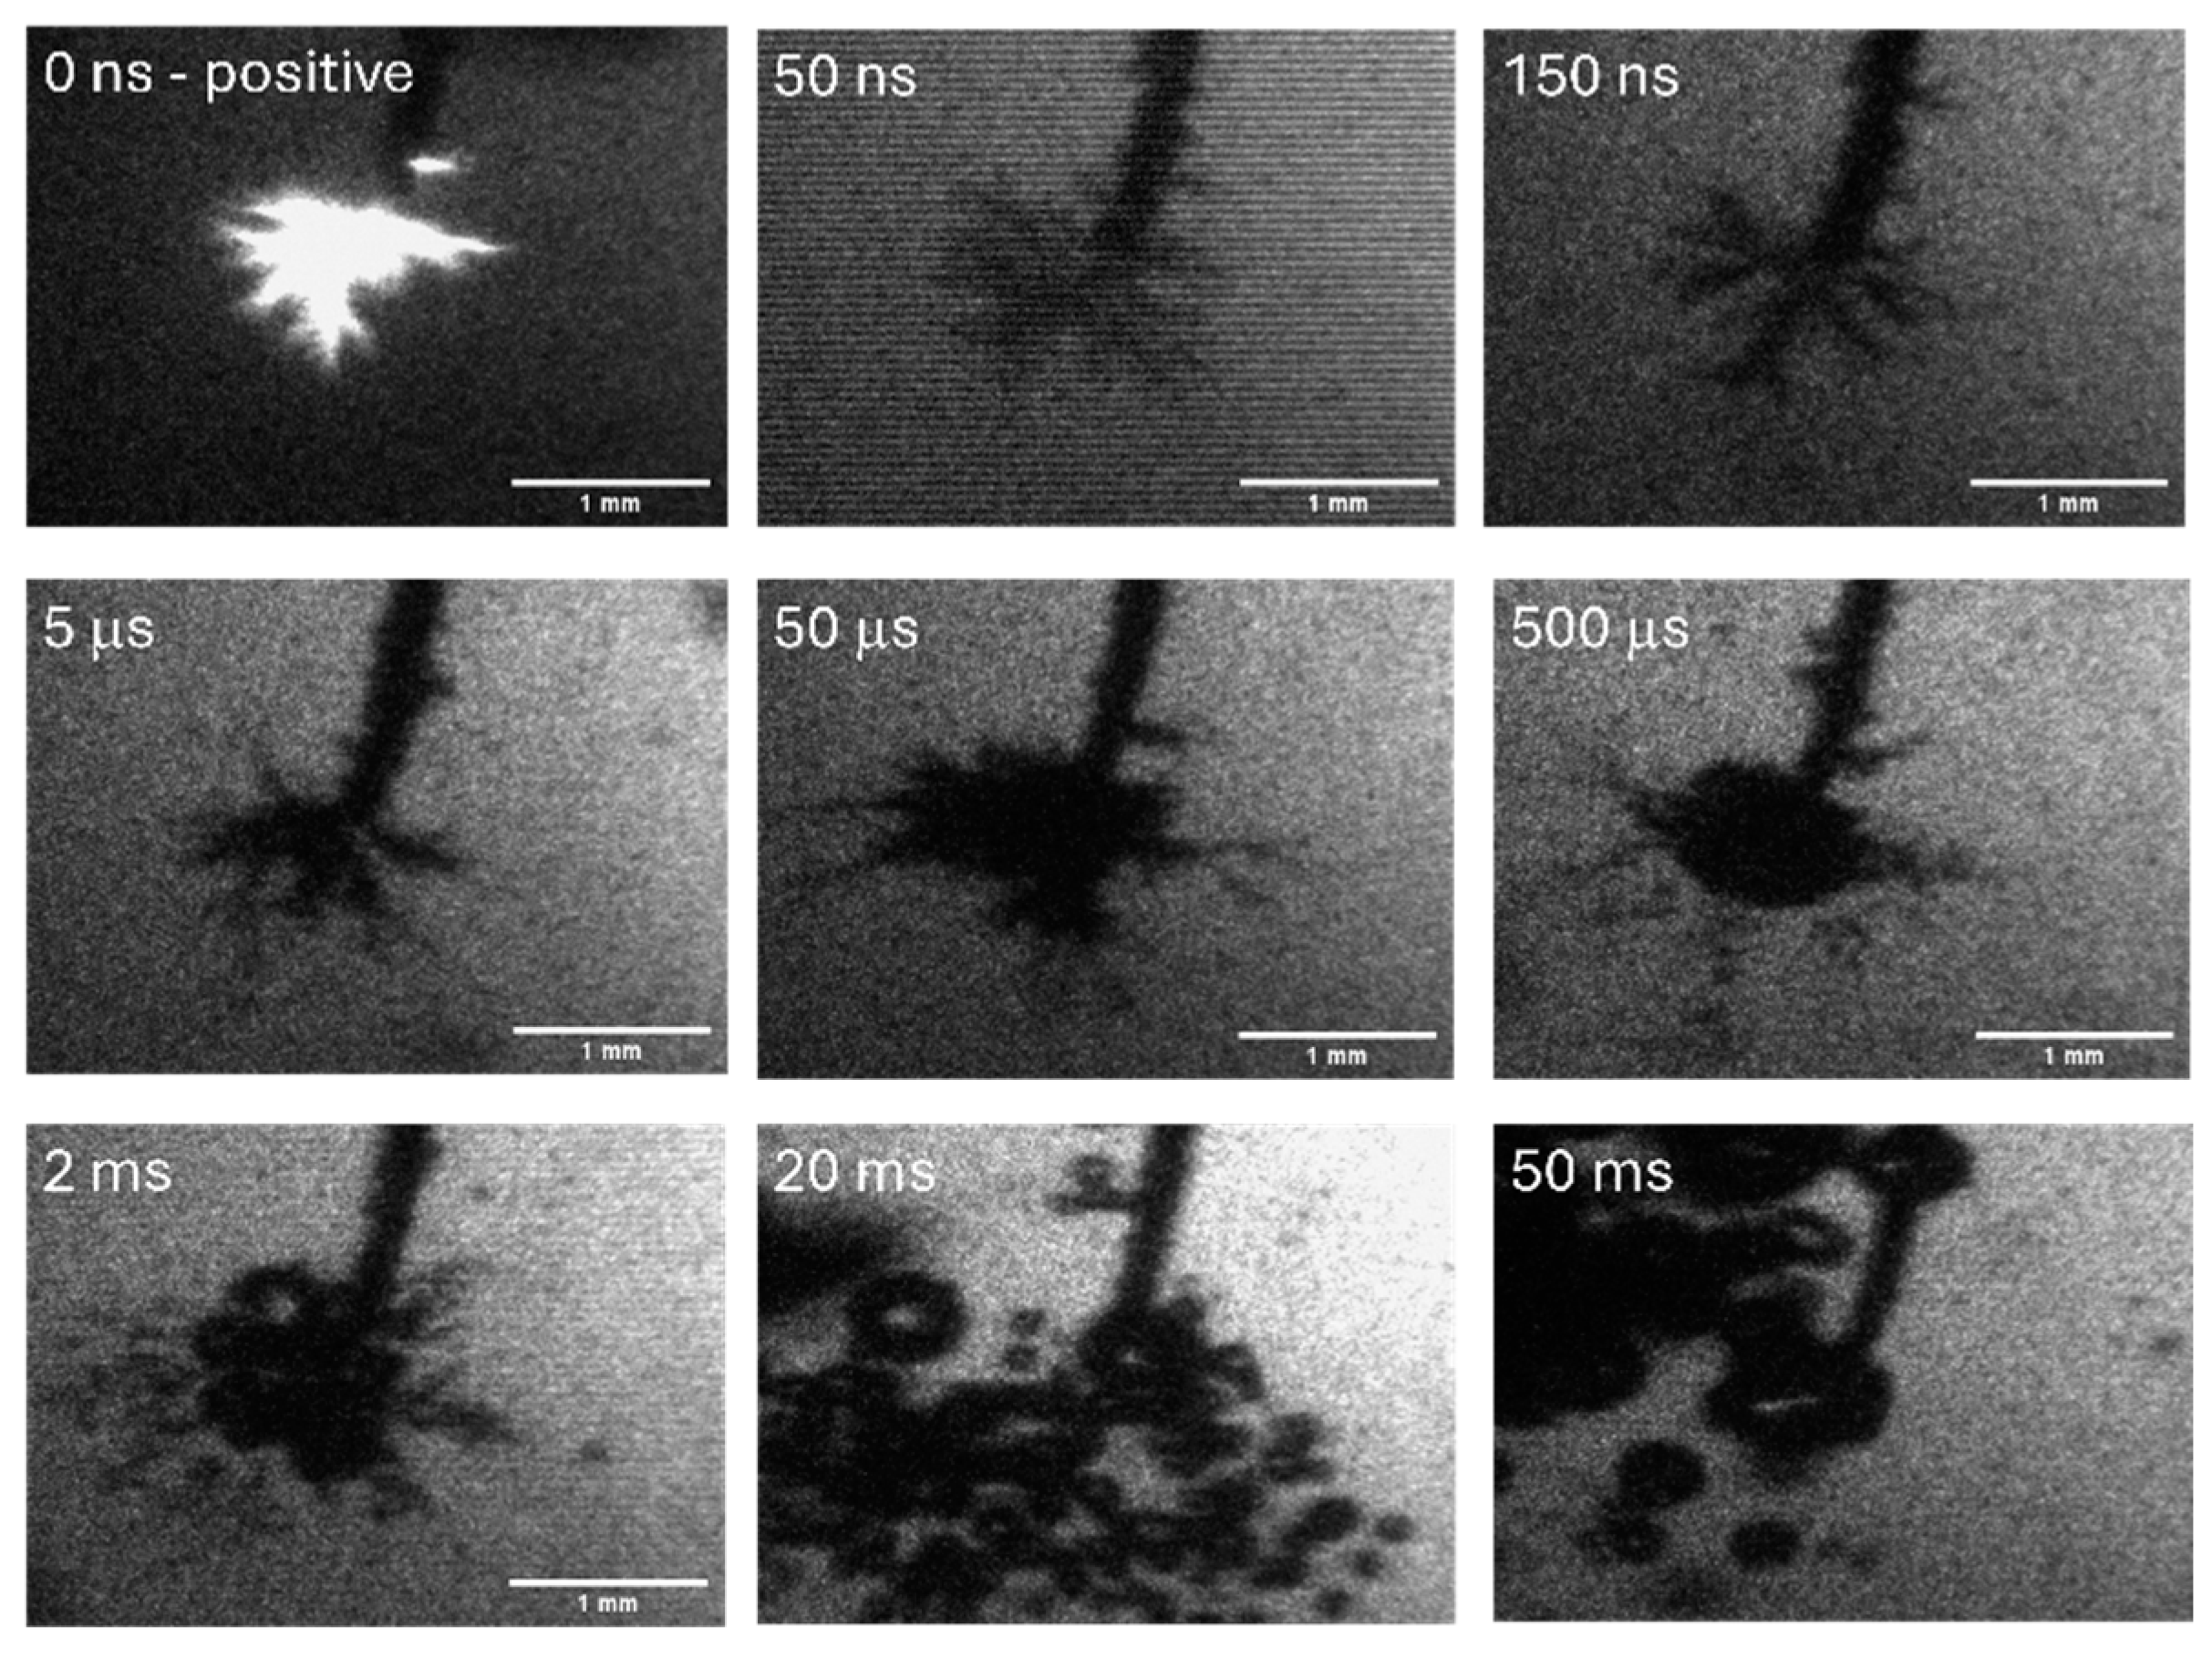
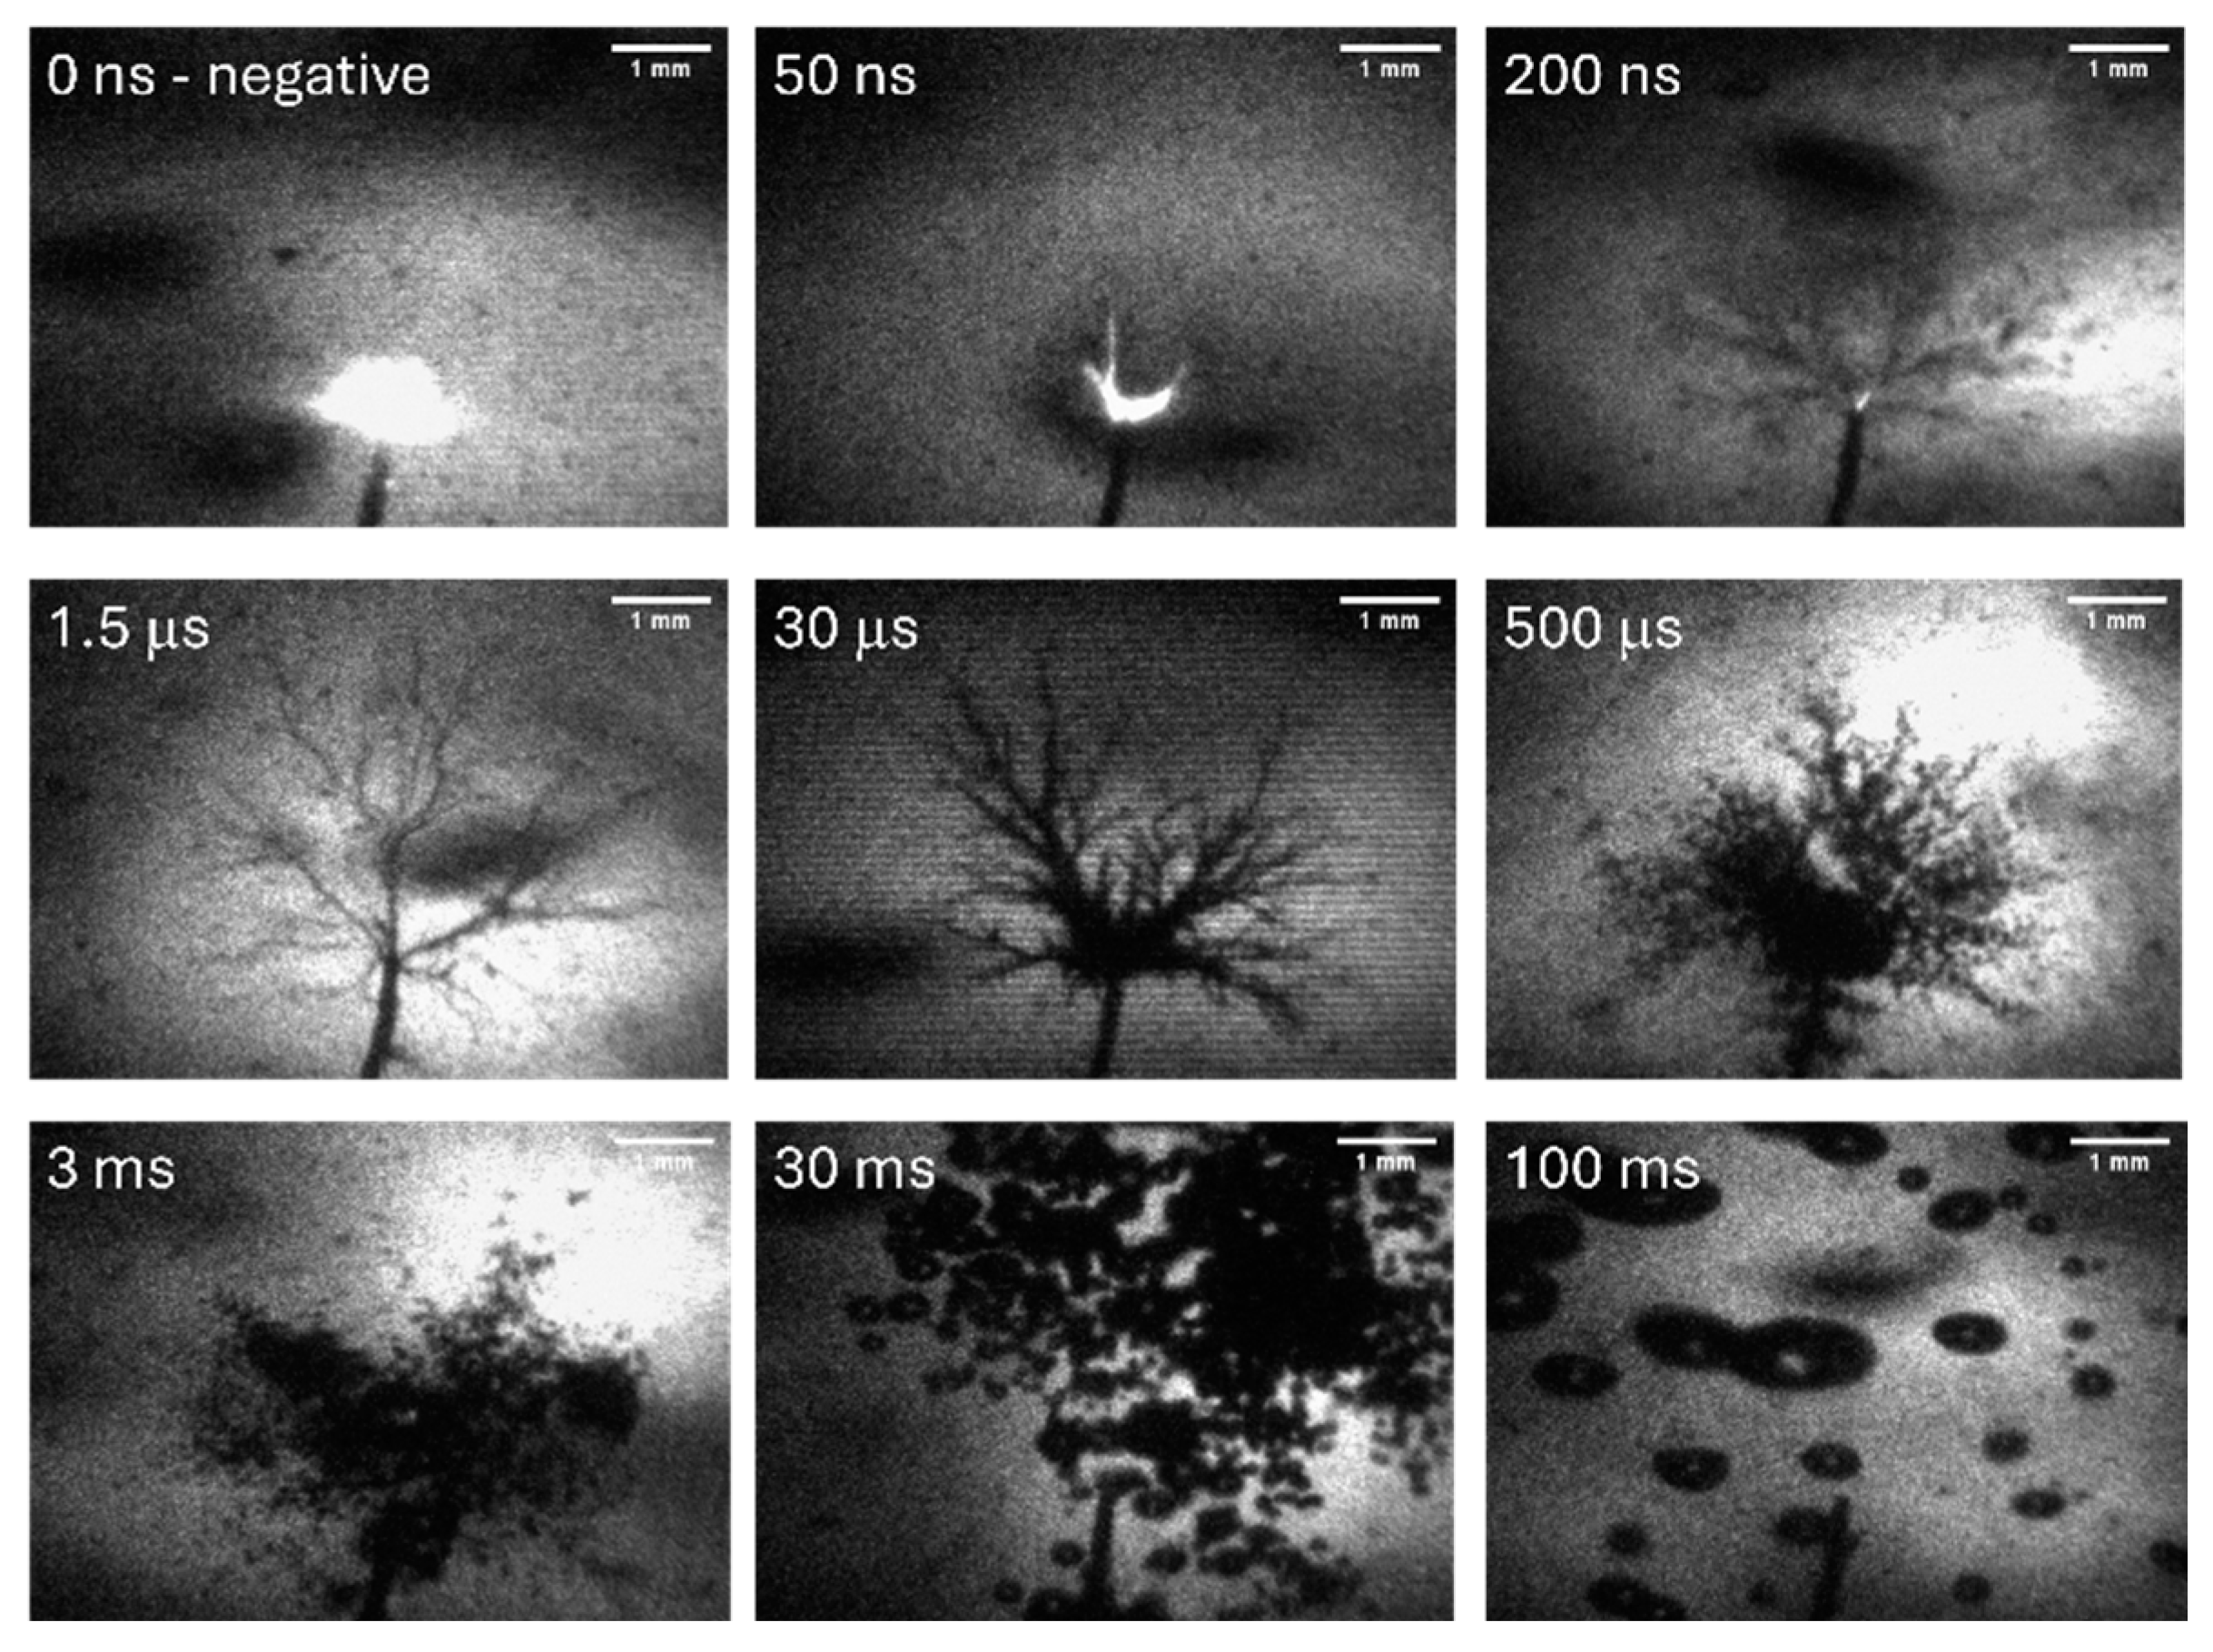
Single-shot, 50 ns exposure, shadow images of discharges initiated by ether positive or negative pulses are shown in Figure 4. In both cases, strong discharge emission prevents the observation of the gaseous voids during the luminous phase; however, they appear immediately after. It is interesting to note that in the case of the negative polarity, the gaseous structures appear to be thinner and almost 2 times longer than those for the positive polarity discharge: about 3.5 mm and 1.6 mm, respectively. This could be due to the longer duration and smaller energy deposition of the negative streamer corona; however, additional measurements are needed to explain these observations. In both cases, a few milliseconds after the discharge, the gaseous structure falls apart into a multitude of small (0.1–0.3 mm in diameter) bubbles that continue to linger in the area for another 100 ms or so. This is in sharp contrast to the bubbles observed in water or liquid nitrogen, where a single spherical bubble takes shape 30–60 μs after the discharge.
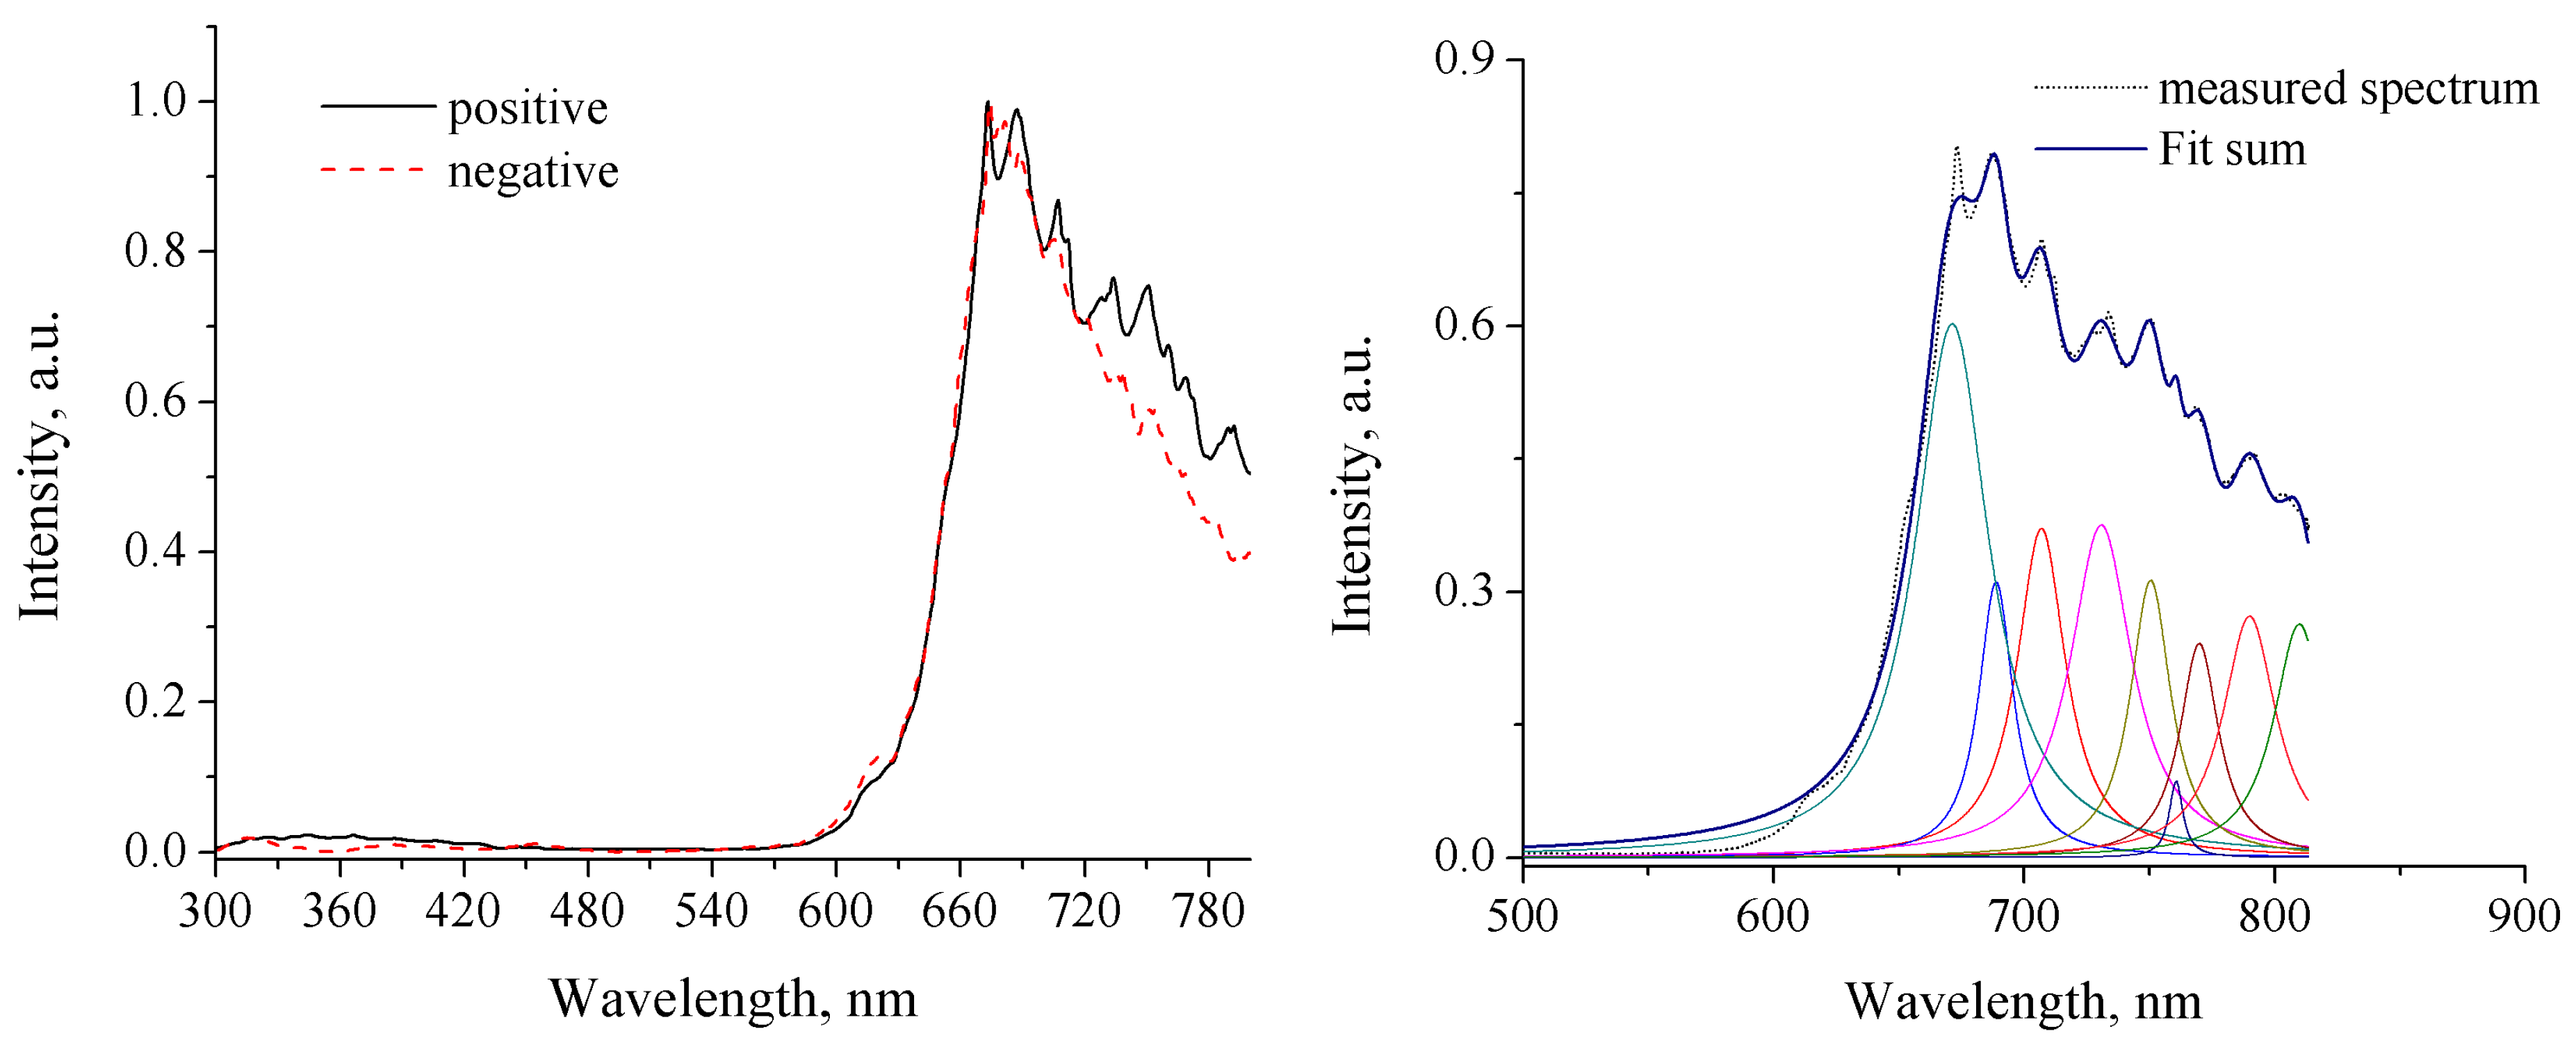
Discharge emission spectra were recorded using 50 ns of exposure time and 100 accumulations of the discharge operating at 5 Hz to avoid discharge reignition in the preexisting bubbles. In Figure 5, the recorded spectra (corrected for the camera detector spectral sensitivity, transmission of optical components, and absorption by the liquid argon) are shown for positive and negative plasmas. As in our previous studies with nanosecond-pulsed plasmas in liquid nitrogen and water [18,19,20], we did not detect blackbody radiation, and the measured neutral temperatures in liquid nitrogen were only on the order of a few tens of degrees above the liquid temperature. In water, however, we did detect strong emission in the UV region that looked like the “structureless” continuum that was previously attributed to the electron–neutral bremsstrahlung continuum emission [20]. In [6], it was suggested that the bremsstrahlung radiation in water discharges could be due to the electron acceleration in nanovoids, which are most likely absent in the case of liquid nitrogen and argon (very small dielectric constant would require very high electric fields for electrostriction-induced cavitation to take place).
As it is typical for argon plasmas, the most intense emission is located in the longer wavelength region where the strongest Ar lines appear. For both polarities, the spectra are almost identical and appear to be a superposition of strongly broadened atomic lines—our rough fitting of the experimental spectra with several strong Ar lines is shown in Figure 5. First of all, it confirms that ionization in the cryogenic plasma conditions occurs not in any kind of bubbles or voids but directly in the condense phase. In addition, the neutral’s density after the ionization front in the liquid argon is higher than that one in the case of liquid nitrogen, where energy release and, therefore, rarefication after the ionization front is stronger due to the significant effect of the vibrational excitation of nitrogen molecules.
Assuming that Van der Waals broadening dominates other pressure effects, we estimate that for the Ar750 line with 9 nm, the half width at half maximum width required neutrals density would be about 9 × 1021 cm−3 (or about 40% number density of liquid argon). We also note that, just like in the case of liquid nitrogen, for argon with a dielectric constant of ~1.5 and the applied electric field of ~1 MV/cm, electrostriction-induced cavitation pressure can be estimated as ~10 kPa, about three orders of magnitude lower than that required for cavitation (~20 MPa [21]). That is an additional indication that the direct streamer ionization mechanism makes the major contribution to the generation of the cryogenic plasma in liquid argon.

4. Conclusions

In this work, we report on observations of positive and negative nanosecond-pulsed cryogenic plasmas in liquid argon. Overall, our experimental results indicate that both positive and negative discharges in liquid argon develop via direct the streamer mechanism in the liquid phase. Regardless of the polarity, the discharge structure and initial velocities exhibit remarkable similarity. The relevant estimation of the electric field based on the streamer’s velocity gives the electric field in the streamer head about 10 MV/cm. While this value of the electric field is extremely high in this case (on the level of 1% of the atomic fields and sufficient for the tunneling effect), it is still lower than the corresponding value in the cryogenic nitrogen plasma, where the relevant electron mobility is lower [18]. Similar to the streamers in liquid nitrogen and gases, negative streamers require higher applied voltages (electric fields) and propagate to shorter distances. The higher applied electric fields are required in the case of negative streamers for sufficient charge accumulation. The propagation to shorter distances is due to the higher values of the first Townsend coefficient (therefore, shorter distances required to meet the Meek criterion of streamer formation) and to the greater electron losses along the electric field.

Author Contributions

Conceptualization, D.D. and A.F.; methodology, D.D.; investigation, D.D.; writing—original draft preparation, D.D.; writing—review and editing, D.D. and A.F.; project administration, D.D.; funding acquisition, D.D. and A.F. All authors have read and agreed to the published version of the manuscript.

Funding

This research was funded by the US National Science Foundation grant number 2108117.

Institutional Review Board Statement

Not applicable.

Informed Consent Statement

Not applicable.

Data Availability Statement

The data that support the findings of this study are available from the corresponding author upon request.

Acknowledgments

This work was supported by the US National Science Foundation award #2108117, PI: Dobrynin.

Conflicts of Interest

The authors declare no conflict of interest.

References

  1. Prukner, V.; Schmidt, J.; Hoffer, P.; Šimek, M. Demonstration of Dynamics of Nanosecond Discharge in Liquid Water Using Four-Channel Time-Resolved ICCD Microscopy. Plasma 2021, 4, 183–200. [Google Scholar] [CrossRef]
  2. Grosse, K.; Schulz-von der Gathen, V.; von Keudell, A. Nanosecond Pulsed Discharges in Distilled Water: I. Continuum Radiation and Plasma Ignition. Plasma Sources Sci. Technol. 2020, 29, 095008. [Google Scholar] [CrossRef]
  3. Von Keudell, A.; Grosse, K.; Schulz-von der Gathen, V. Nanosecond Pulsed Discharges in Distilled Water-Part II: Line Emission and Plasma Propagation. Plasma Sources Sci. Technol. 2020, 29, 085021. [Google Scholar] [CrossRef]
  4. Marinov, I.; Starikovskaia, S.; Rousseau, A. Dynamics of plasma evolution in a nanosecond underwater discharge. J. Phys. D Appl. Phys. 2014, 47, 224017. [Google Scholar] [CrossRef]
  5. Pongrác, B.; Šimek, M.; Člupek, M.; Babický, V.; Lukeš, P. Spectroscopic characteristics of Hα/oiatomic lines generated by nanosecond pulsed corona-like discharge in Deionized Water. J. Phys. D Appl. Phys. 2018, 51, 124001. [Google Scholar] [CrossRef]
  6. Bílek, P.; Tungli, J.; Hoder, T.; Šimek, M.; Bonaventura, Z. Electron–Neutral Bremsstrahlung Radiation Fingerprints the Initial Stage of Nanosecond Discharge in Liquid Water. Plasma Sources Sci. Technol. 2021, 30, 04LT01. [Google Scholar] [CrossRef]
  7. Šimek, M.; Hoffer, P.; Tungli, J.; Prukner, V.; Schmidt, J.; Bílek, P.; Bonaventura, Z. Investigation of the Initial Phases of Nanosecond Discharges in Liquid Water. Plasma Sources Sci. Technol. 2020, 29, 064001. [Google Scholar] [CrossRef]
  8. Grosse, K.; Held, J.; Kai, M.; Von Keudell, A. Nanosecond plasmas in water: Ignition, cavitation and plasma parameters. Plasma Sources Sci. Technol. 2019, 28, 085003. [Google Scholar] [CrossRef]
  9. Jüngling, E.; Grosse, K.; von Keudell, A. Propagation of Nanosecond Plasmas in Liquids—Streamer Velocities and Streamer Lengths. J. Vac. Sci. Technol. A 2022, 40, 043003. [Google Scholar] [CrossRef]
  10. Grosse, K.; Falke, M.; von Keudell, A. Ignition and Propagation of Nanosecond Pulsed Plasmas in Distilled Water—Negative vs Positive Polarity Applied to a Pin Electrode. J. Appl. Phys. 2021, 129, 213302. [Google Scholar] [CrossRef]
  11. Staack, D.; Fridman, A.; Gutsol, A.; Gogotsi, Y.; Friedman, G. Nanoscale Corona Discharge in Liquids, Enabling Nanosecond Optical Emission Spectroscopy. Angew. Chem. 2008, 120, 8140–8144. [Google Scholar] [CrossRef]
  12. Seepersad, Y.; Pekker, M.; Shneider, M.N.; Fridman, A.; Dobrynin, D. Investigation of Positive and Negative Modes of Nanosecond Pulsed Discharge in Water and Electrostriction Model of Initiation. J. Phys. D Appl. Phys. 2013, 46, 355201. [Google Scholar] [CrossRef]
  13. Starikovskiy, A.; Yang, Y.; Cho, Y.I.; Fridman, A. Non-Equilibrium Plasma in Liquid Water: Dynamics of Generation and Quenching. Plasma Sources Sci. Technol. 2011, 20, 024003. [Google Scholar] [CrossRef]
  14. Shneider, M.N.; Pekker, M.; Fridman, A. Theoretical study of the initial stage of sub-nanosecond pulsed breakdown in liquid dielectrics. IEEE Trans. Dielectr. Electr. Insul. 2012, 19, 1579–1582. [Google Scholar] [CrossRef]
  15. Seepersad, Y.; Pekker, M.; Shneider, M.N.; Dobrynin, D.; Fridman, A. On the Electrostrictive Mechanism of Nanosecond-Pulsed Breakdown in Liquid Phase. J. Phys. D Appl. Phys. 2013, 46, 162001. [Google Scholar] [CrossRef]
  16. Starikovskiy, A.Y.; Shneider, M.N. Experimental Study of Cavitation Development in Liquid in Pulsed Non-Uniform Electric Field under the Action of Ponderomotive Forces. arXiv 2024, arXiv:2402.10327. [Google Scholar] [CrossRef]
  17. Starikovskiy, A. Pulsed Nanosecond Discharge Development in Liquids with Various Dielectric Permittivity Constants. Plasma Sources Sci. Technol. 2013, 22, 012001. [Google Scholar] [CrossRef]
  18. Dobrynin, D.; Song, Z.; Fridman, A. Optical Characterization of Nanosecond-Pulsed Discharge in Liquid Nitrogen. J. Phys. D Appl. Phys. 2024, 57, 325204. [Google Scholar] [CrossRef]
  19. Dobrynin, D.; Fridman, A. Negative-Polarity Nanosecond-Pulsed Cryogenic Plasma in Liquid Nitrogen. arXiv 2024, arXiv:2406.02452. [Google Scholar] [CrossRef]
  20. Song, Z.; Fridman, A.; Dobrynin, D. Effects of liquid properties on the development of nanosecond-pulsed plasma inside of liquid: Comparison of water and liquid nitrogen. J. Phys. D Appl. Phys. 2024, 57, 175203. [Google Scholar] [CrossRef]
  21. Malyshev, V.L.; Marin, D.F.; Moiseeva, E.F.; Gumerov, N.A.; Akhatov, I.S. Study of the tensile strength of a liquid by molecular dynamics methods. High Temp. 2015, 53, 406–412. [Google Scholar] [CrossRef]
Figure 1. Integral images (false color) of the positive and negative discharges in liquid argon ignited with pulses of various amplitude. Exposure time 50 ns, single accumulation.
Plasma 07 00027 g001
Figure 2. Dependence of the maximum channel length of the discharge in liquid argon on the amplitude of the applied electric field. Data compared to the discharge in liquid nitrogen [17].
Plasma 07 00027 g002
Figure 3. Short exposure time images (false color) of the negative and positive discharges in liquid argon (2 ns gate, single accumulation, 4 ns delay, 50 kV), and evolution of the discharge size in time.
Plasma 07 00027 g003
Figure 4. Shadow imaging of the discharge in liquid argon—exposure time 50 ns, single accumulation.
Plasma 07 00027 g004aPlasma 07 00027 g004b
Figure 5. (Left): Emission spectra of the negative and positive discharge in liquid argon. (Right): Fitting of the experimental emission spectrum of the positive discharge in liquid argon using broadened strong Ar lines.
Plasma 07 00027 g005
Disclaimer/Publisher’s Note: The statements, opinions and data contained in all publications are solely those of the individual author(s) and contributor(s) and not of MDPI and/or the editor(s). MDPI and/or the editor(s) disclaim responsibility for any injury to people or property resulting from any ideas, methods, instructions or products referred to in the content.