Article

Inclusion of Biological Targets in the Analysis of Electrical Characteristics of Non-Thermal Plasma Discharge

1
Center for Molecular Virology and Gene Therapy, Institute for Molecular Medicine and Infectious Disease and Department of Microbiology and Immunology, Drexel University College of Medicine, Philadelphia, PA 19102, USA
2
Department of Biological Sciences, Drexel University, Philadelphia, PA 19104, USA
3
Princeton Plasma Physics Laboratory, Princeton, NJ 08540, USA
*
Author to whom correspondence should be addressed.
Plasma 2023, 6(3), 577-591; https://doi.org/10.3390/plasma6030040
Submission received: 25 July 2023 / Revised: 10 September 2023 / Accepted: 12 September 2023 / Published: 15 September 2023
(This article belongs to the Special Issue Dielectric Barrier Discharges 2023)

Abstract

:
In Plasma Medicine studies, the effect of non-thermal plasma (NTP) on biological targets is typically correlated with the amount of stable reactive oxygen and nitrogen species produced in a liquid medium. The effect of NTP and the response of the biological target on cellular redox mechanisms is overlooked in these investigations. Additionally, the influence of electrical properties of cells on the physical properties of NTP is neglected. Therefore, we used a floating electrode dielectric barrier discharge plasma to explore the impact of cell structure, size, and viability of the biological target on the physical properties of NTP. Lissajous figures were used to determine circuit capacitance and energy per cycle during NTP exposure of different cell suspensions. We show that both, structural integrity and active enzymic processes of cells change the electrical properties of NTP. Correlations were also drawn between NTP-produced hydrogen peroxide and nitrite with measured capacitance. Our studies indicate that the observed changes between different cell suspensions may be due to a feedback loop between the biological target and the NTP source. In future studies, a more detailed analysis is needed to improve the control of clinical NTP devices.

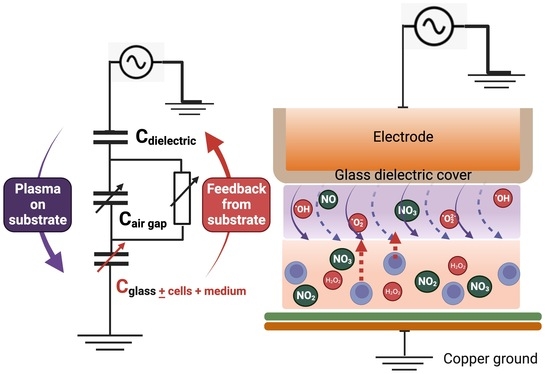
Graphical Abstract

1. Introduction

Non-thermal plasma (NTP) can be safely applied to cells and living tissues to achieve diverse biological effects, ranging from the stimulation of cell division and differentiation to the induction of different cell death pathways [1,2]. These biological effects on cells have allowed the biomedical application of NTP in the treatment of infections, skin diseases, wound healing, and, more recently, cancer [1,3]. So far, partial success in reducing tumor burden and prolonging the life of animals with different cancers, including breast, pancreatic, colon, and melanoma with both direct and indirect treatment has been established [4,5].
The biological effects of NTP are attributed to the unique and complex mixture of NTP physical and chemical properties, including reactive oxygen and nitrogen species (RONS) that influence cellular redox homeostasis and subsequent alterations in cell behavior. No cause-and-effect relationship has been established between specific NTP effector(s) and observed cellular outcomes. Although the role of physical NTP effectors (surface charging, electric, and electromagnetic fields) are actively studied [6], most investigations focus on the amounts and identity of individual RONS delivered to the cells by NTP. These correlations are used to draw conclusions between the concentration of RONS and the observed biological effects. The quantification of RONS is often performed in gas or liquid phases without cells. Here, the assumption is that NTP composition will remain the same when cells are introduced, and that cells are subjected to the RONS present in the gas, and consequently in the liquid surrounding the cells. Additionally, the presence of cells and their properties are not expected to affect RONS concentrations.
The fate of the cell is dependent on the maintenance of redox homeostasis. Cells produce RONS such as superoxide (O2), hydroxyl radical (HO), hydrogen peroxide (H2O2), nitric oxide (NO), and peroxynitrite (ONOO), as byproducts of cellular metabolism through specific cellular enzymes. In low doses, RONS function as signaling molecules for many cellular pathways necessary for cell survival [7]. However, the unmitigated accumulation of these molecules can be toxic to cells. To maintain redox balance, cells execute a controlled destruction of RONS through an antioxidant system consisting of enzymatic and non-enzymatic molecules [8]. Antioxidants protect tissues by either promoting adaptation to RONS or by triggering cell death pathways if the cells cannot be rescued [8]. The interactions between RONS and the cellular antioxidant system serves as the molecular interface to modulate metabolic and environmental signals for maintaining cell survival. Many of the RONS produced by cells are also present in NTP and can become important players in the regulation of cell homeostasis by challenging the redox balance [9,10]. Different types of cells process and produce RONS differently, influencing the RONS concentration in NTP-treated medium. The results of this study strongly suggest that cells have a significant effect on NTP-generated RONS concentrations in their surrounding media [11].
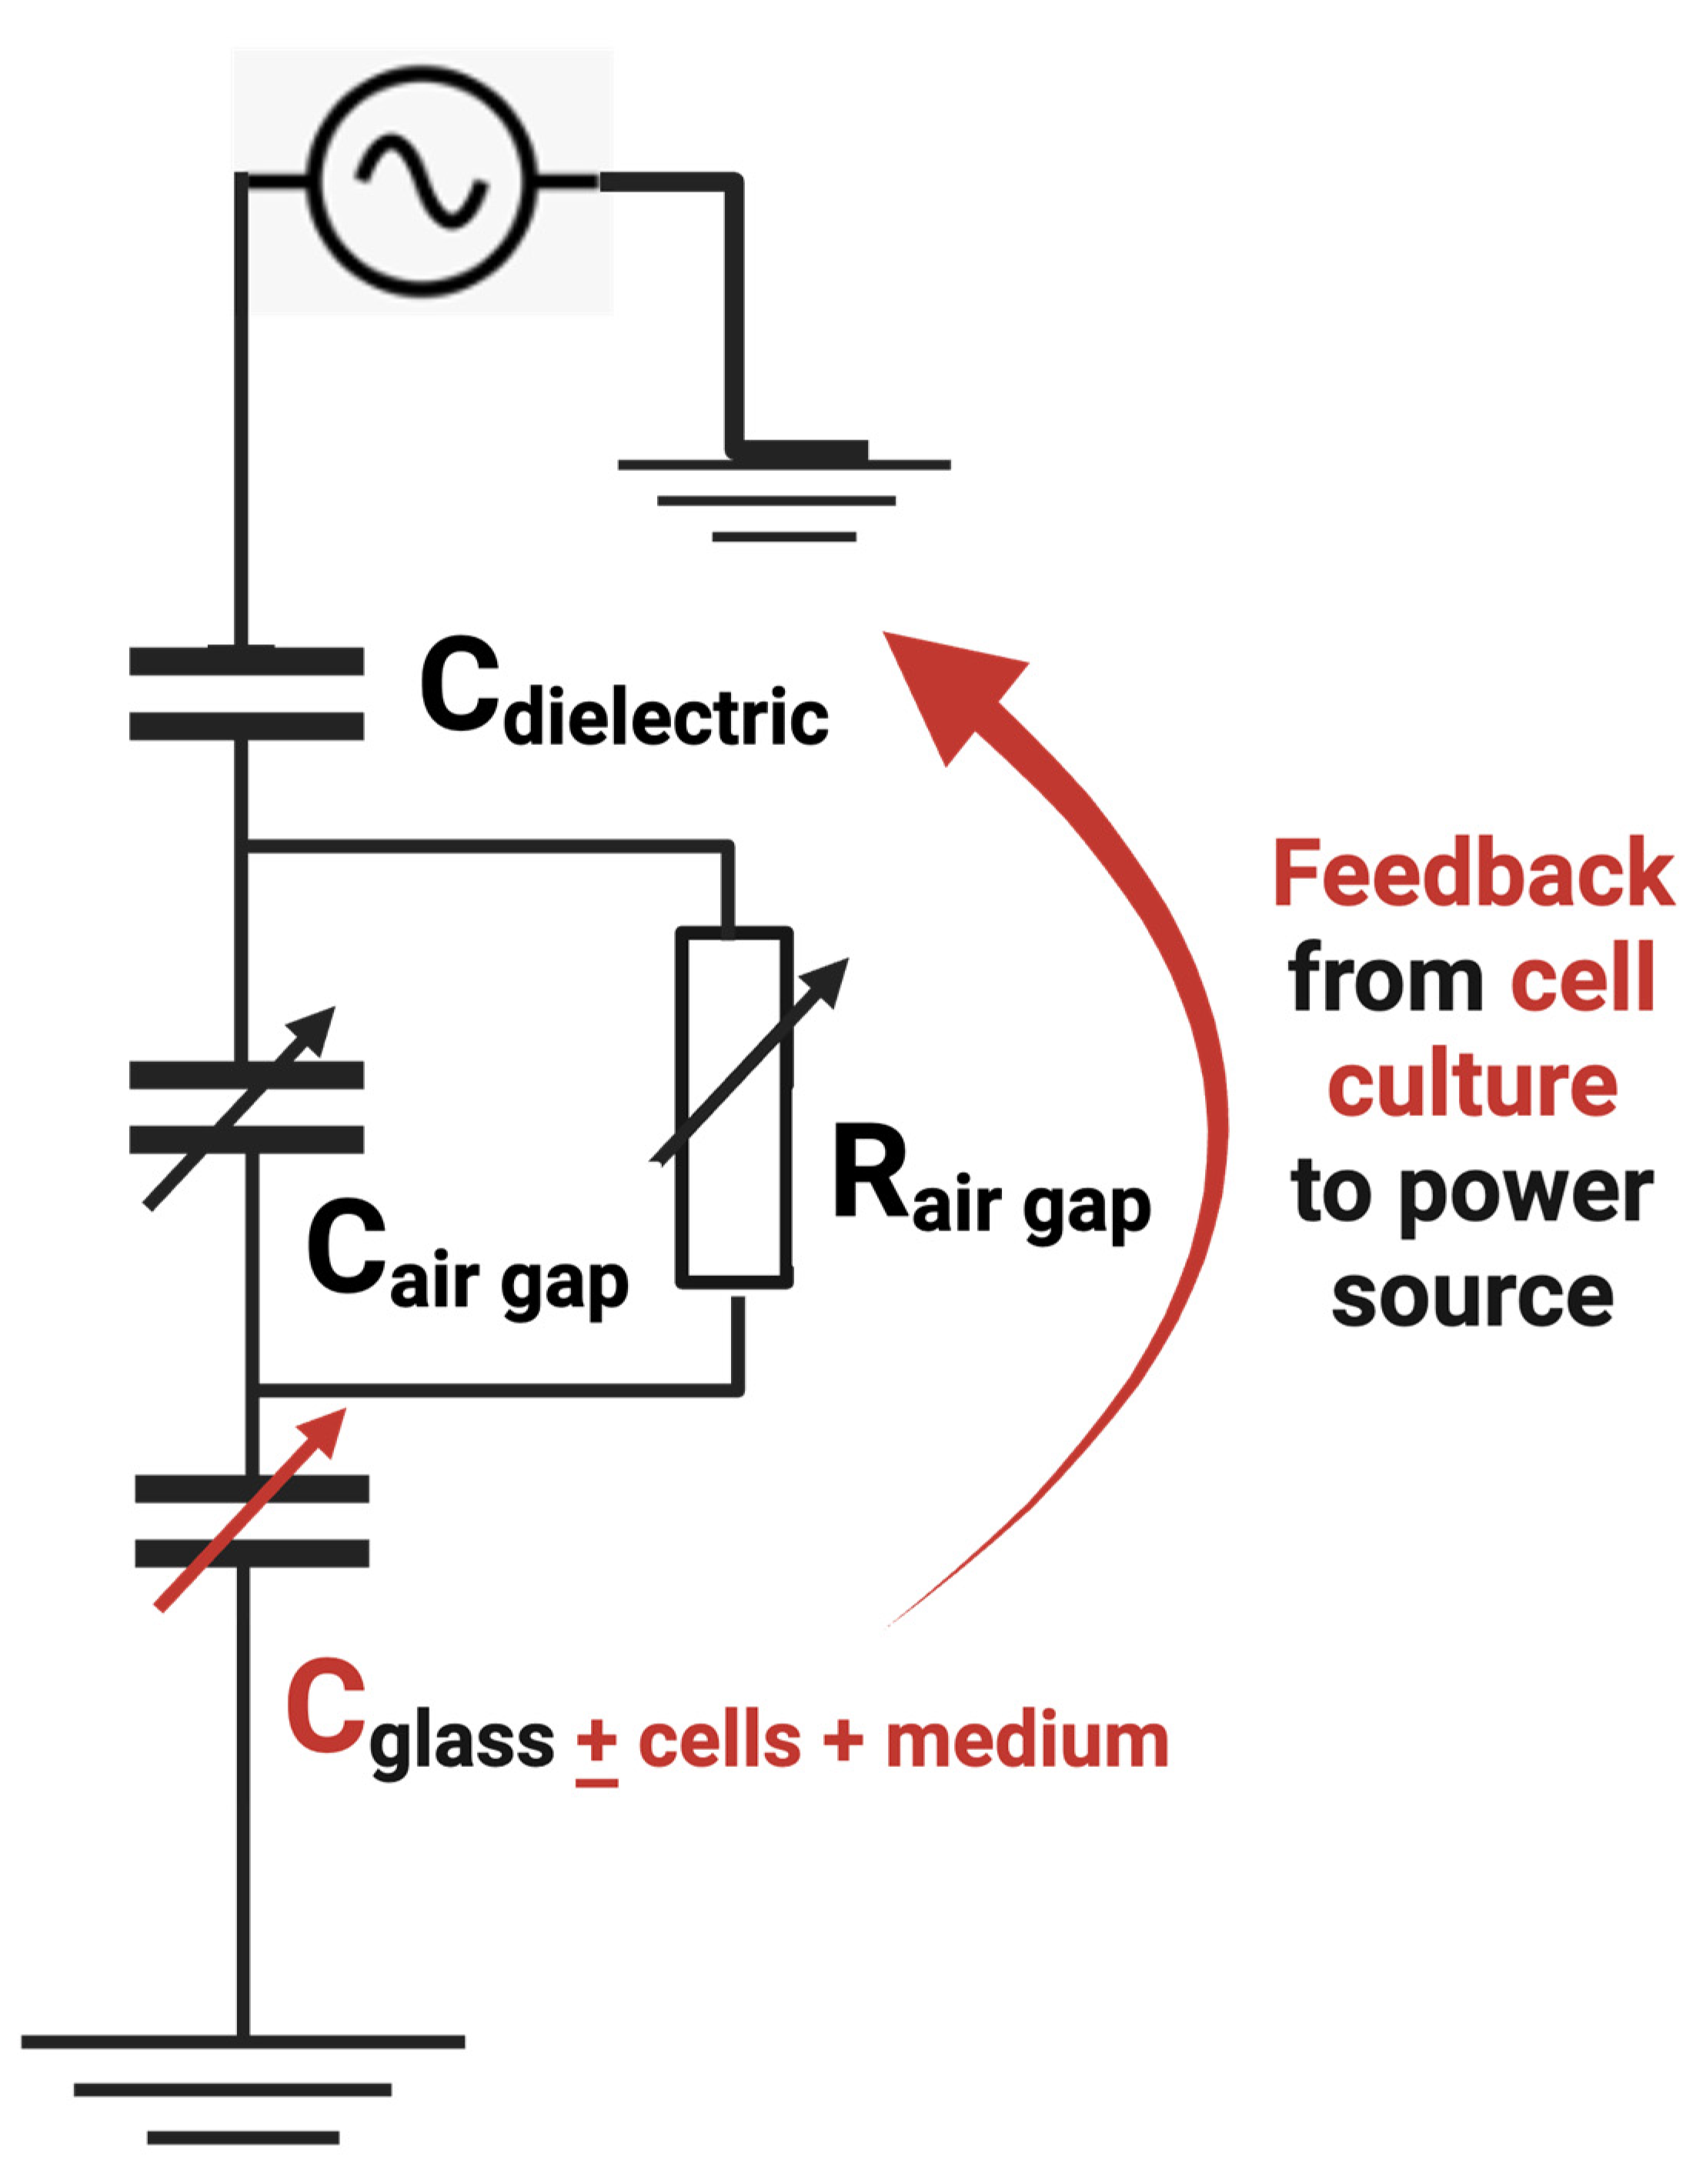
NTP RONS are typically deposited on or in close proximity to cancer cells (in vitro) or tumors in animals (in vivo) through the direct application of NTP, which is generated at atmospheric pressure and room temperature by a variety of NTP sources, including a floating electrode dielectric barrier discharge (FE-DBD). In the case of FE-DBD, NTP is generated between an insulated high-voltage electrode and the biological target that is placed on a ground electrode, or on an insulator such as a well plate or a Petri dish with a low-voltage electrode that remains floating or is grounded or biased [12]. Hence, the biological substrate becomes a part of the overall circuit; its impedance can affect the operation of the entire circuit and NTP properties in a feedback loop.
When the target is a physical substrate, bulk properties such as the conductivity and the dielectric constant are shown to change NTP [13]. Cells are enclosed by a lipid membrane and are filled with electrically charged ions that confer them with biophysical properties like membrane capacitance and cytoplasm conductivity [14]. They maintain an electrical potential difference across the membrane by actively pumping these charged ions. Moreover, the transition of healthy cells to malignant cells changes their electromagnetic signature [14]. The dielectric properties of cells have been a subject of active research for over 80 years since Fricke adopted Maxwell’s theory of suspended dielectric spheres to cell suspensions [15]. Dielectric properties, such as dielectric permittivity and its dispersion relation, vary by cell and are used for cell identification and measuring cellular responses (proliferation, migration, and viability) [16,17,18,19]. Additionally, dielectric spectroscopy has been used to differentiate between cancerous and healthy cells [17,18,20]. Therefore, the electromagnetic signature, cellular morphology, and the physical and chemical conditions influence the dielectric properties of cell suspensions.
Biological cells are dynamic targets that are electrically active and influence the properties of NTP. The exposure of cells to NTP induces oxidative stress responses as a mechanism to maintain redox homeostasis and adapt to their environment. The concept of adaptive plasmas has been proposed by Keidar et al. that transition from a spatially homogeneous state to self-organizing modifiable patterns when they interact with different targets [21,22,23]. Their measurements indicate that cell capacitance influences the properties of the NTP applied by the plasma jet and demonstrate the impendence-based feedback effect [24]. These reports strongly suggest that the interactions at the interface of two dynamic systems—NTP and cells—are likely to induce feedback and feedforward loops which, in turn, will change the NTP properties and the cell response. In addition to the substrate alone, the entire system, including the support, the table, and in case of in vivo targets, the animal or a human, can affect the electrical circuit parameters and the resulting NTP [25].
In this study, we correlate changes in the discharge properties, such as the power delivered to the substrate with the dielectric properties of Vero cell suspensions before, during, and after NTP treatment using the FE-DBD. Based on our observations, we propose a simple global view of the reciprocal interaction of NTP with cell suspensions and a possible method of in situ identification of cell viability during treatment.

2. Materials and Methods

2.1. Vero Cell Maintenance and Preparation

Vero cells were maintained in Dulbecco’s Modified Eagle Medium (DMEM) supplemented with 10% fetal bovine serum (FBS) and 1% penicillin/streptomycin (DMEM10), passaged 2–3 times a week and incubated at 37 °C and 5% carbon dioxide in a humid environment. For experiments, Vero cells were aliquoted into Eppendorf tubes at 5 × 10⁵ cells in 1 mL volume with DMEM10.
Killed Vero cells were prepared as follows. For heat-killed (denoted as heat) Vero cells, Eppendorf tubes containing cells were immersed in a 75 °C water bath for 1 h. For fixed Vero cells, cells were centrifuged to remove the medium and incubated in 500 μL of 4% paraformaldehyde (PFA) in PBS at room temperature for 1 h. After incubation, cells were pelleted and resuspended in DMEM10. To prepare lysed cells, Vero cells suspended in DMEM10 were subjected to 3 cycles of freeze–thaw that consisted of storage at −80 °C overnight, followed by thawing in a 37 °C water bath. Immediately prior to the experiment, cells were rapidly thawed in a 37 °C water bath.

2.2. NTP Device and Exposure of Cells

A FE-DBD electrode connected to an electric power supply was used as the source for NTP (Figure 1). NTP exposures were performed for 20 s with the electrode positioned 2 mm above the target. The treatment was carried out without any imposed gas flow, in ambient air at ~23 °C and ~60% relative humidity (water content of ~13 g/m3). The voltage was set to 8.5 kV and the frequency was set to 250 Hz for all NTP exposures because the viability of the cells does not change significantly as assessed immediately after treatment. In unpublished observations, viability was assessed at the aforementioned NTP conditions via propidium iodide staining. The voltage pulse delivered by the power source was decaying sinusoidal, with the first positive half-cycle reaching a maximum of 4 kV with a pulse-width at half-maximum of 3 µs. Detailed electrical characteristics, the focus of this paper, are presented in the Results section. Glass coverslips, 22 × 22 × 0.15 mm, (Fisher Scientific, Hampton, NH, USA, Cat. 12548B) were pre-exposed to NTP to ensure good spread of the droplet and achieve a flat droplet surface to ensure even exposure of samples to NTP. All liquid and cell samples were uniformly placed in 100 μL suspensions on a glass coverslip.

2.3. Assesment of Evaporation and Change in Temperature

To measure evaporation due to NTP exposure, samples placed on coverslips were weighed before and immediately after NTP exposure. The difference was used as a measurement for evaporation. Control samples not exposed to NTP were weighed twice with a 20 s interval to account for baseline evaporation. Changes in temperature were also determined by infrared measurements before and immediately after NTP exposure using the HHM290/N Supermeter (Newport, Irvine, CA, USA).

2.4. Electrical Characterization and Impedence Measurements

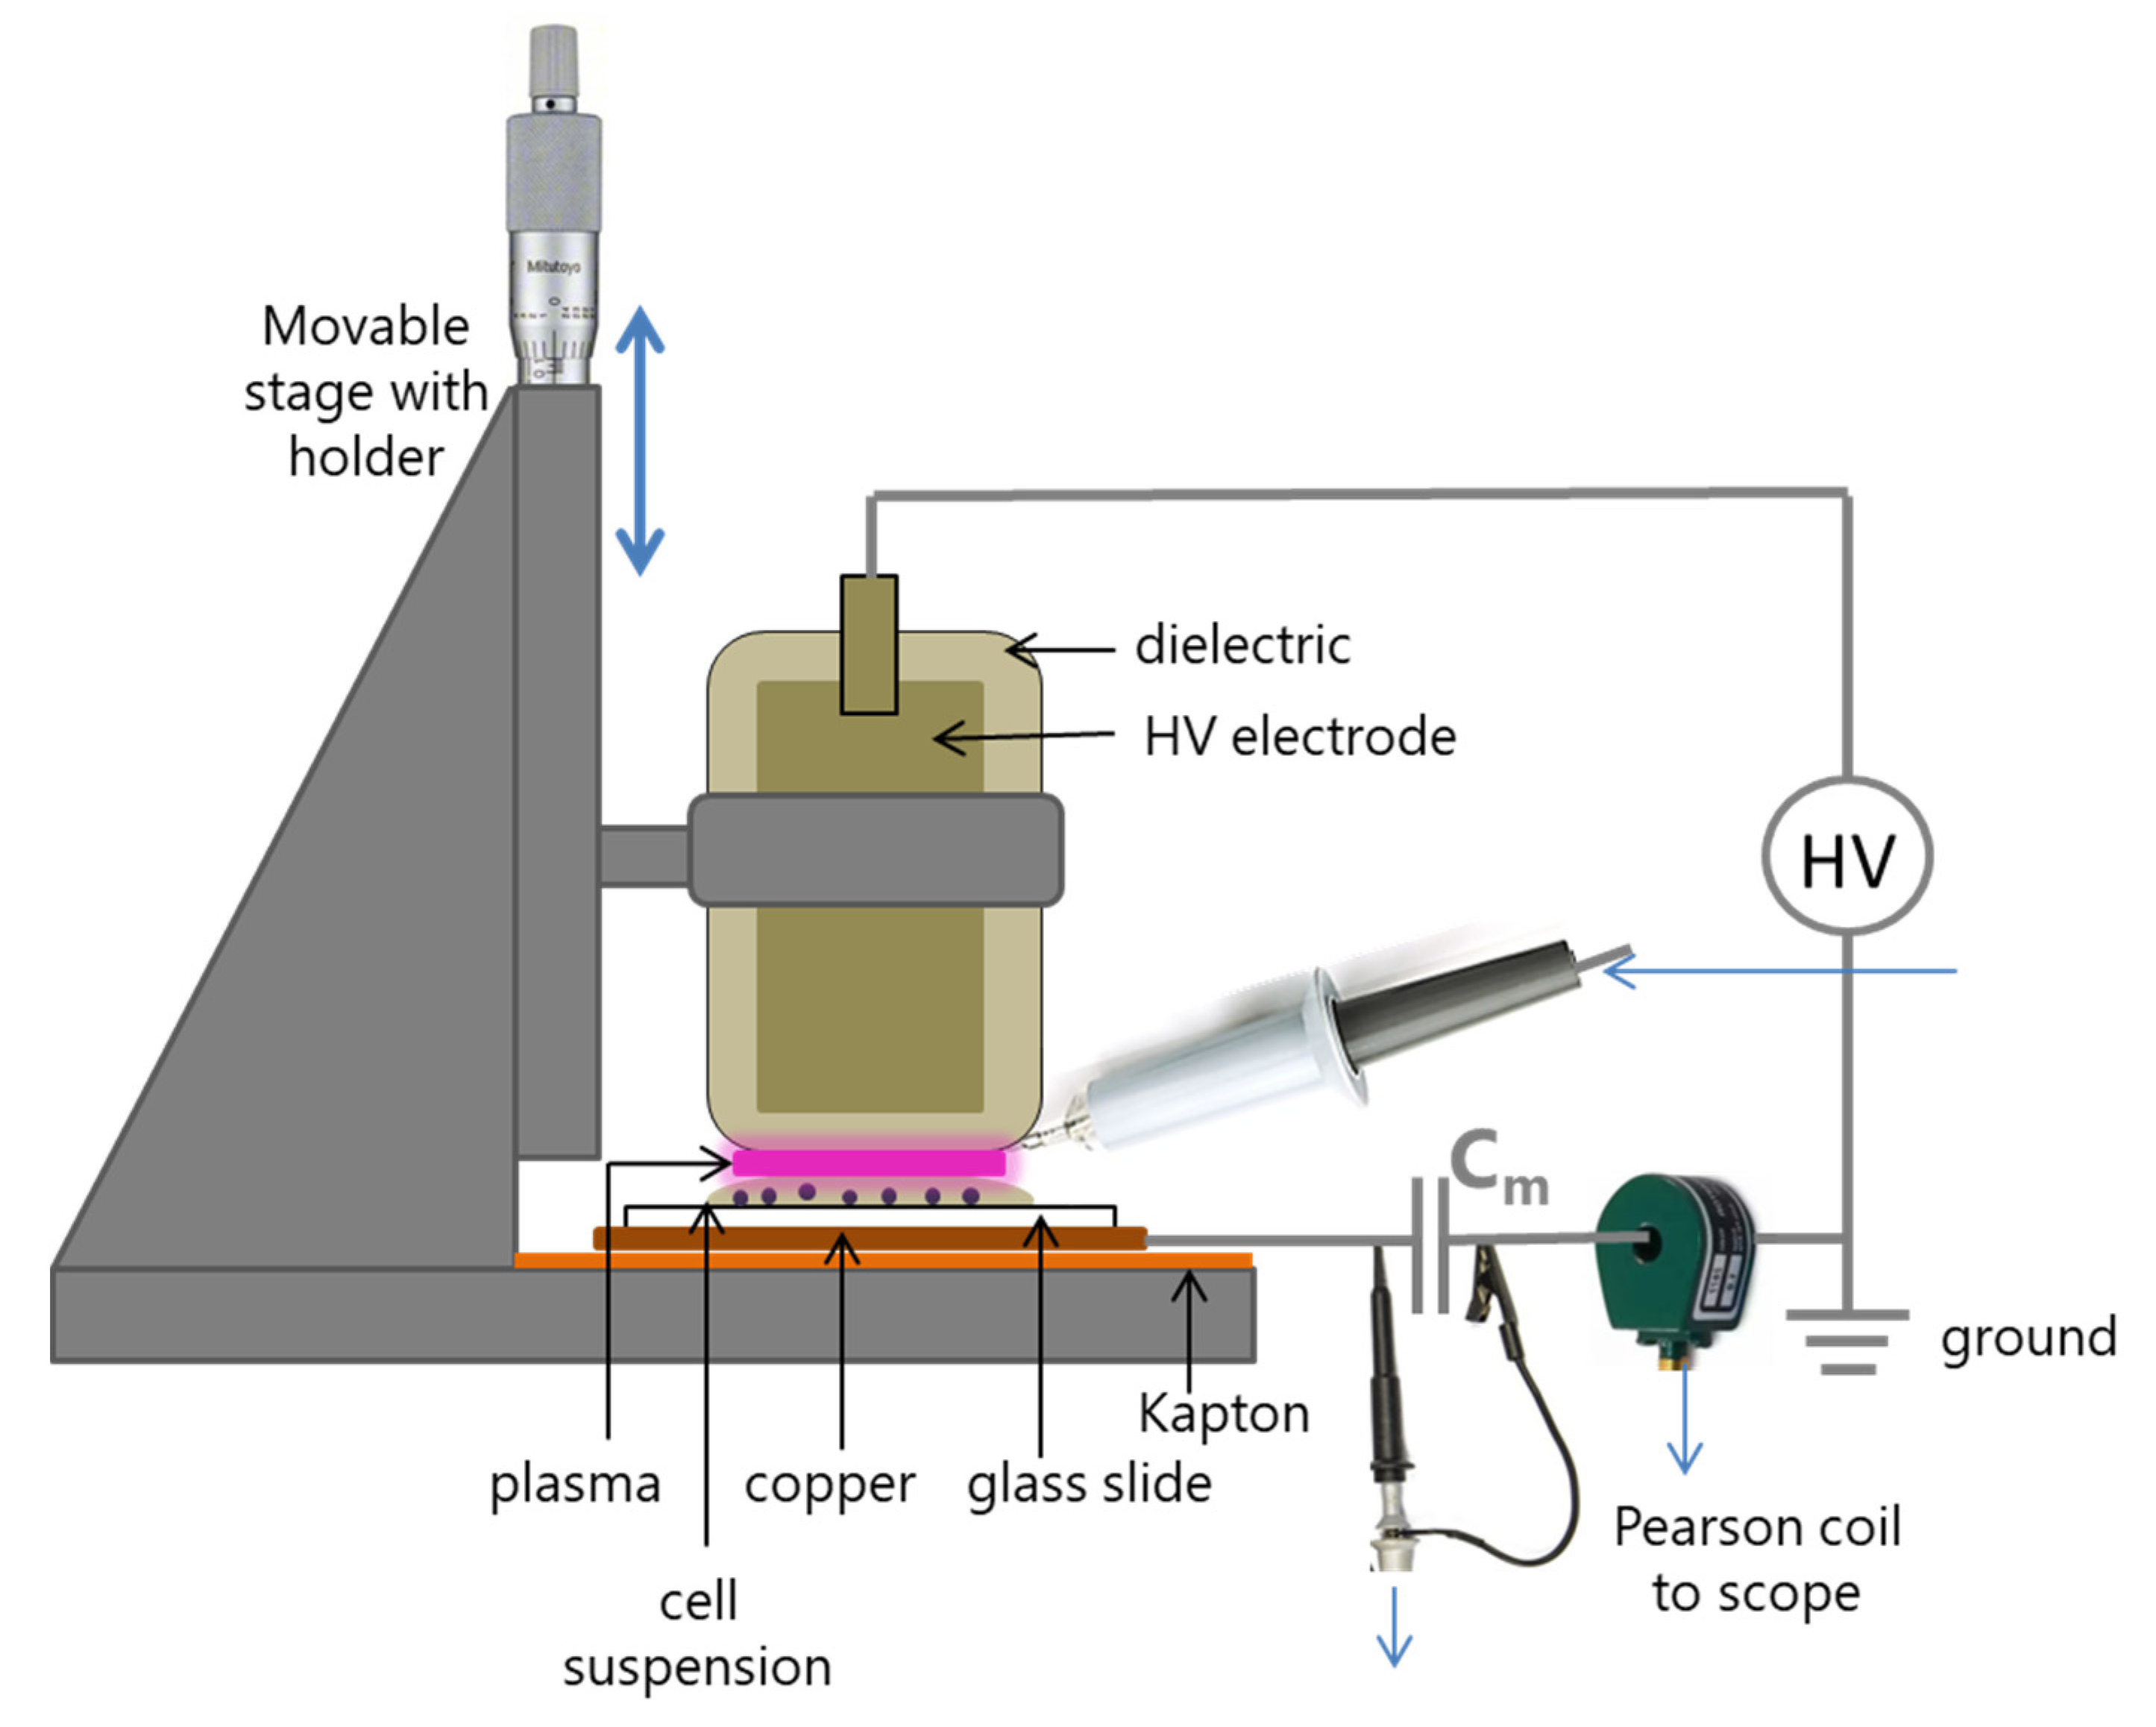
The FE-DBD used for cell treatments generated a main pulse of 8 μs and a total pulse duration of ~15 μs at a controlled repetition rate (250 Hz) and output amplitude dependent on distance of the electrode from the substrate (Figure 2). A Tektronix D (2 GS/s, 250 MHz) oscilloscope was used to monitor the current, voltage, and charge transfer in the circuit during experiments: current to ground (Pearson Model 2877 Current Monitor, 1 V/A, 2 ns rise time); voltage at the high voltage electrode (Tektronix P6015 HV probe); and charge transferred was determined by measuring the voltage across a 10 nF capacitor connected in series on the ground side (Figure 2). The HV probe was connected at the bottom of the electrode in direct contact with the side edge of the dielectric (Figure 2). Measurements of voltage, current, and charge transferred were monitored continuously and recorded within 1 s of turning on the power and again at the end of the 20 s treatment. Lissajous figures, the plots of charge versus voltage in the circuit, were used to estimate the energy consumption per cycle and for monitoring the changes in the substrate capacitance, which included the glass coverslip and the cell suspension. Independence measurements of the dielectric properties of cell suspensions were conducted using a vector network analyzer.

2.5. Assesment of Morphological Changes of Vero Cells

Live and killed Vero cells were imaged using the brightfield high contrast lens at 20× magnification on the Agilent Cytation 5. The Gen5 software (version 3.11) was used for cell size analysis using the brightfield images.

2.6. Hydrogen Peroxide and Nitrite Quantification

In the initial experiment, pH, hydrogen peroxide, and nitrite were measured using commercially available test strips (Bartovation). Because the sensitivity of the strips was not sufficient to discriminate between different conditions (Supplementary Table S1), subsequent measurements were performed using commercially available detection kits, as described below.
The Spectroquant Hydrogen Peroxide test (Millipore Sigma; Burlington, MA, USA, Cat. 118789) was used to quantify hydrogen peroxide concentrations according to the manufacturer’s instructions. Samples suspended in phenol red-free DMEM were added into 12-well plates in 100 μL aliquots and exposed to NTP. Immediately after, NTP exposure samples were supplemented with 900 μL of phenol red-free DMEM. Absorbance was read at 450 nm on the Agilent Cytation 5. Hydrogen peroxide concentration (μM) was calculated from the standard curve line equation.
Nitrite concentrations were quantified using the Invitrogen Griess Reagent Kit (Invitrogen, Waltham, MA, USA, Cat. G7921) in accordance with the manufacturer’s instructions. Samples were prepared and exposed to NTP as described for the hydrogen peroxide assay. Absorbance was measured at 540 nm using the Agilent Cytation 5 and nitrite concentrations (μM) were calculated using a standard curve line equation.

2.7. Statistical Analysis

Statistical analysis was performed in GraphPad Prism (version 9). An ordinary one-way ANOVA was performed, comparing sample means to the mean of live Vero cells. For liquid chemistry data, a two-way ANOVA was performed by comparing all group means to one another.

3. Results

3.1. Electrical Characteristics of NTP with Different Biological Targets

To examine if the biological target impacts NTP delivery, we compared circuit electrical characteristics when NTP was applied to live Vero cells with dead Vero cells killed using three different procedures. These procedures include heat-killed (heat), paraformaldehyde (PFA) fixation (fixed), and freeze–thaw cycles (lysed) that affect the morphology and redox capabilities of cells in distinct ways.
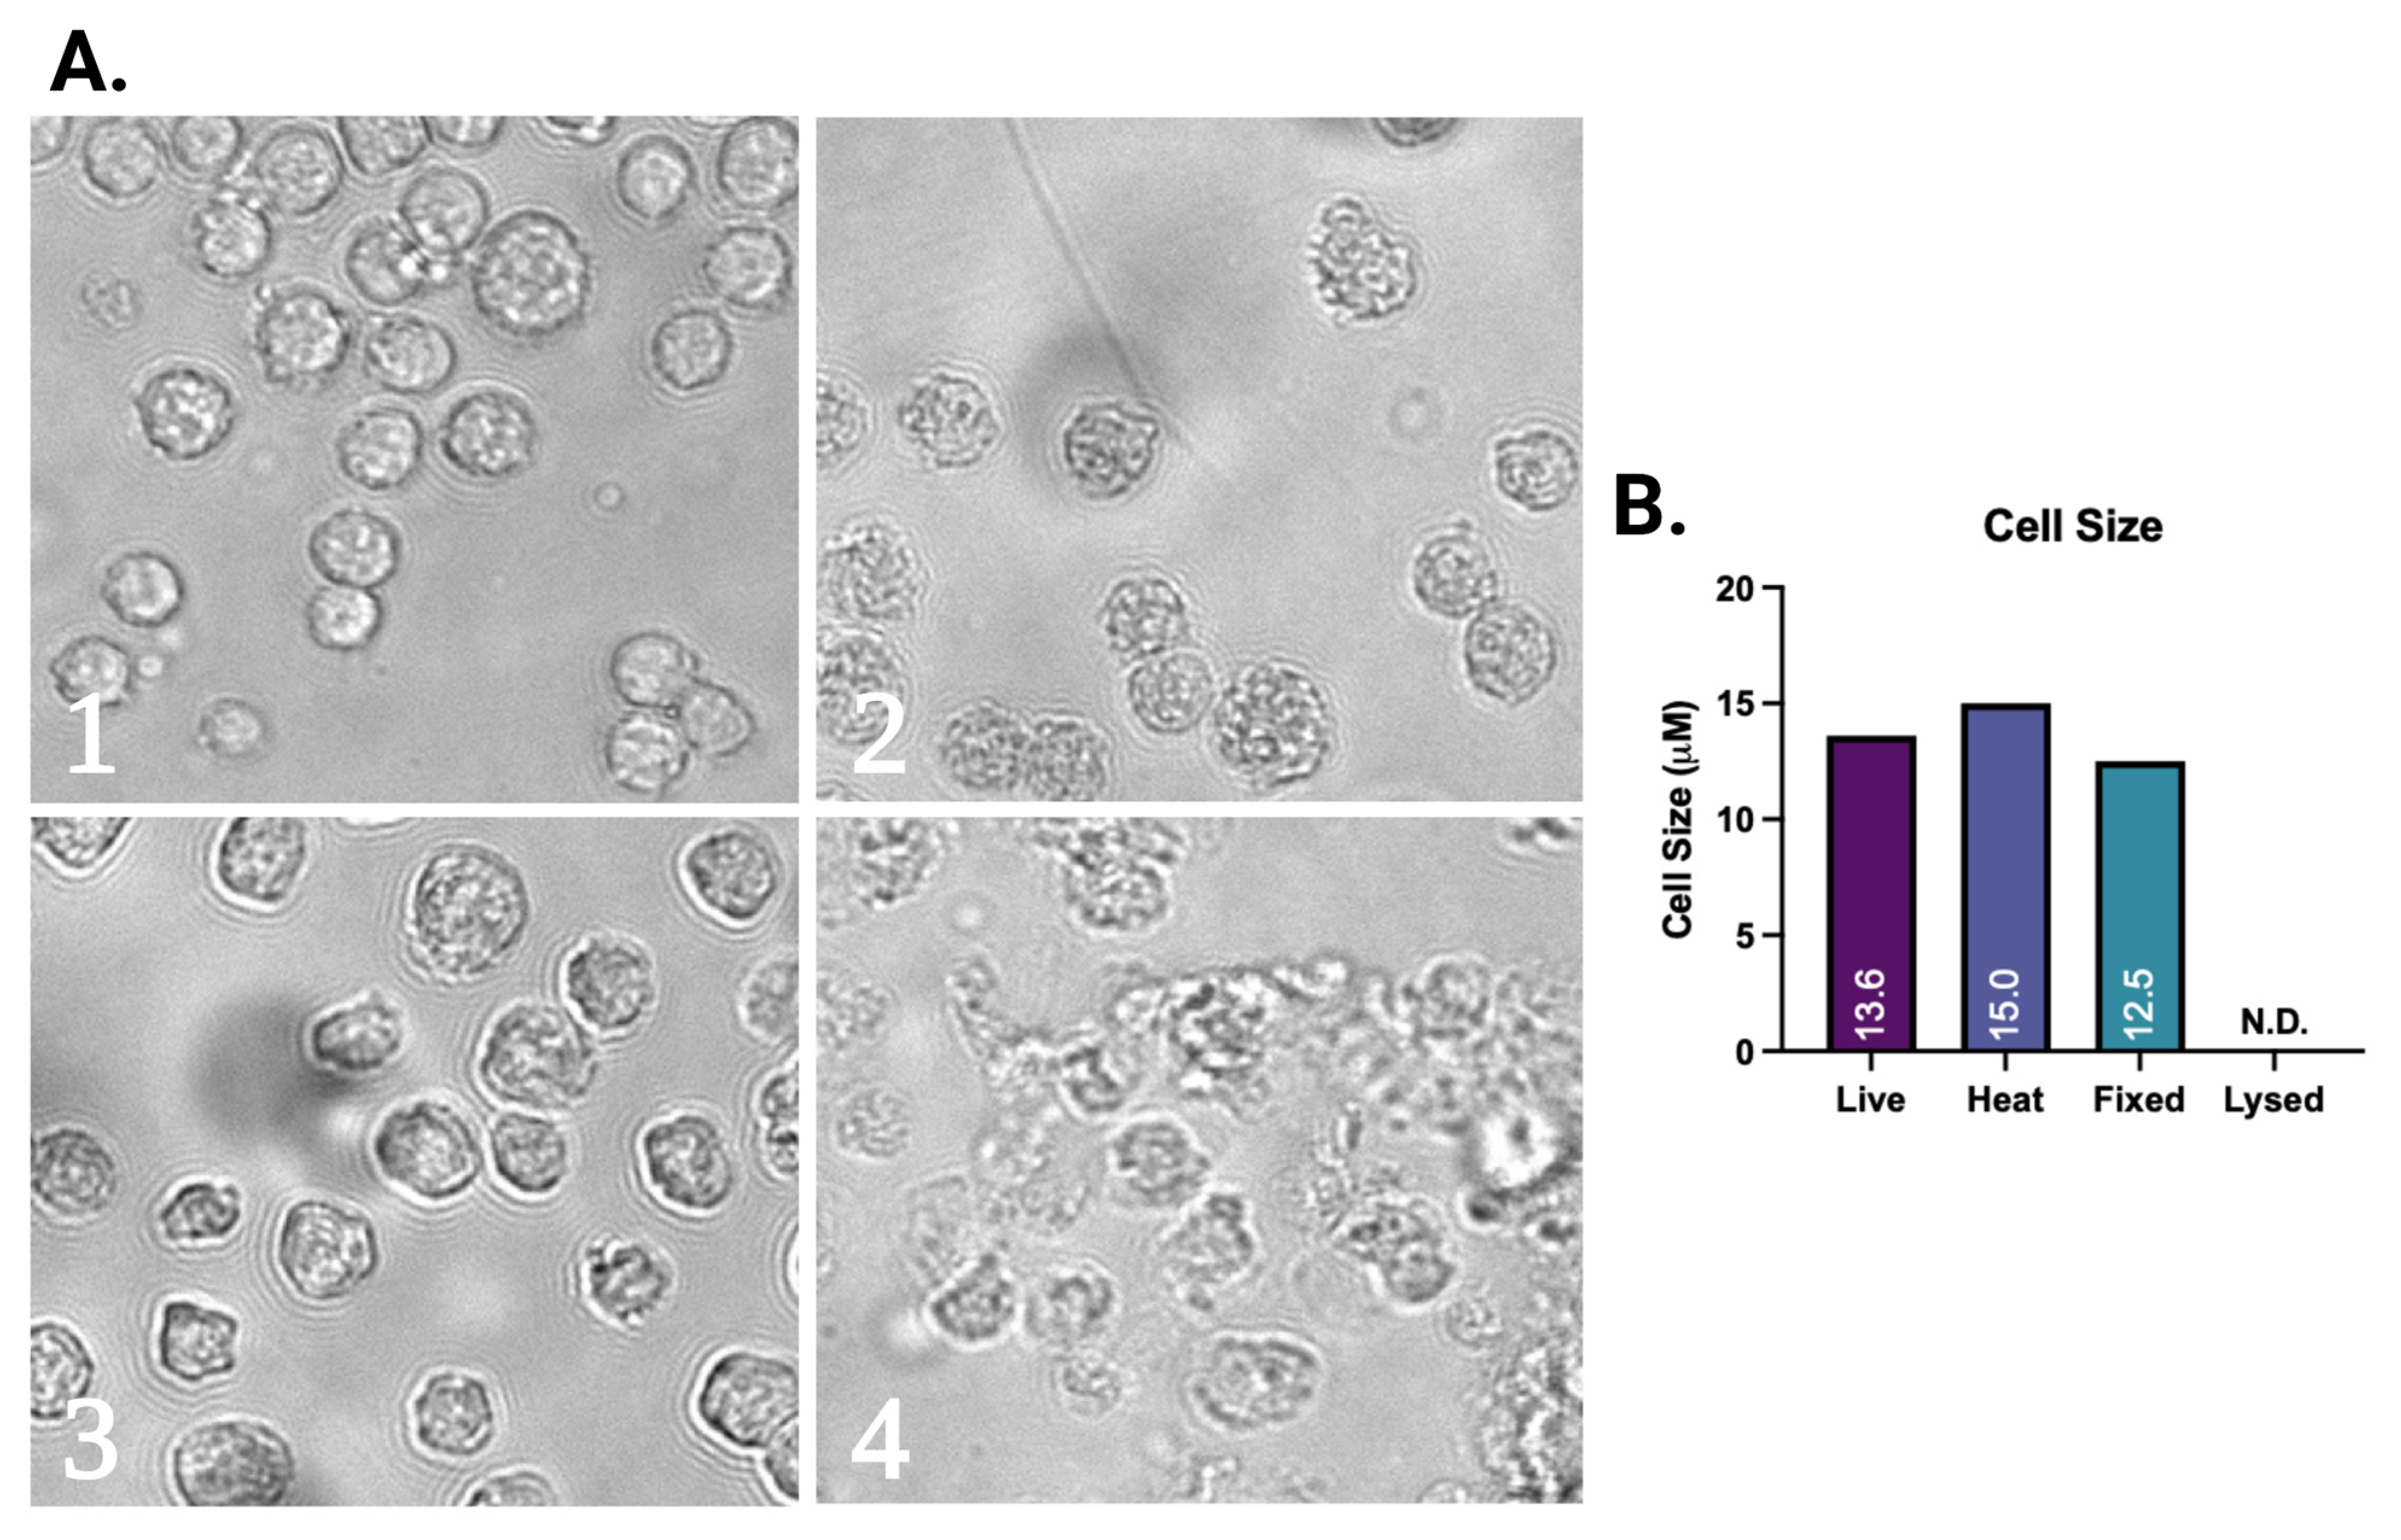
When visualized using high-contrast brightfield microscopy, live Vero cells in suspension appear round and intact (Figure 3A, Panel 1). Their cell membrane and both passive and active cellular redox machinery are intact. When subjected to high temperatures, many proteins are denatured, compromising cell integrity and function. This compromised state of killed Vero cells results in the disruption of membrane integrity, allowing for the leakage of intracellular contents due to the absence of active and passive redox mechanisms. Visually, they have a granular appearance (Figure 3A, Panel 2). When Vero cells are fixed using PFA, their enzymatic functions are compromised, leaving a granular appearance, but their shape remains largely intact due to the aggregation of membrane proteins. Despite some loss in membrane integrity, fixed cells morphologically resemble live cells (Figure 3A, Panel 3) [26]. Lastly, freeze–thaw completely lyses Vero cells, compromising membrane integrity and allowing the leakage of all intracellular contents. Despite lysis, the chemical composition, including enzymes of Vero cells, remain mostly intact in suspension (Figure 3A, Panel 4). Due to these differences in morphology, the different Vero cell preparations have varying cell sizes and cell surface areas, changing the biological target that interacts with NTP (Figure 3B).
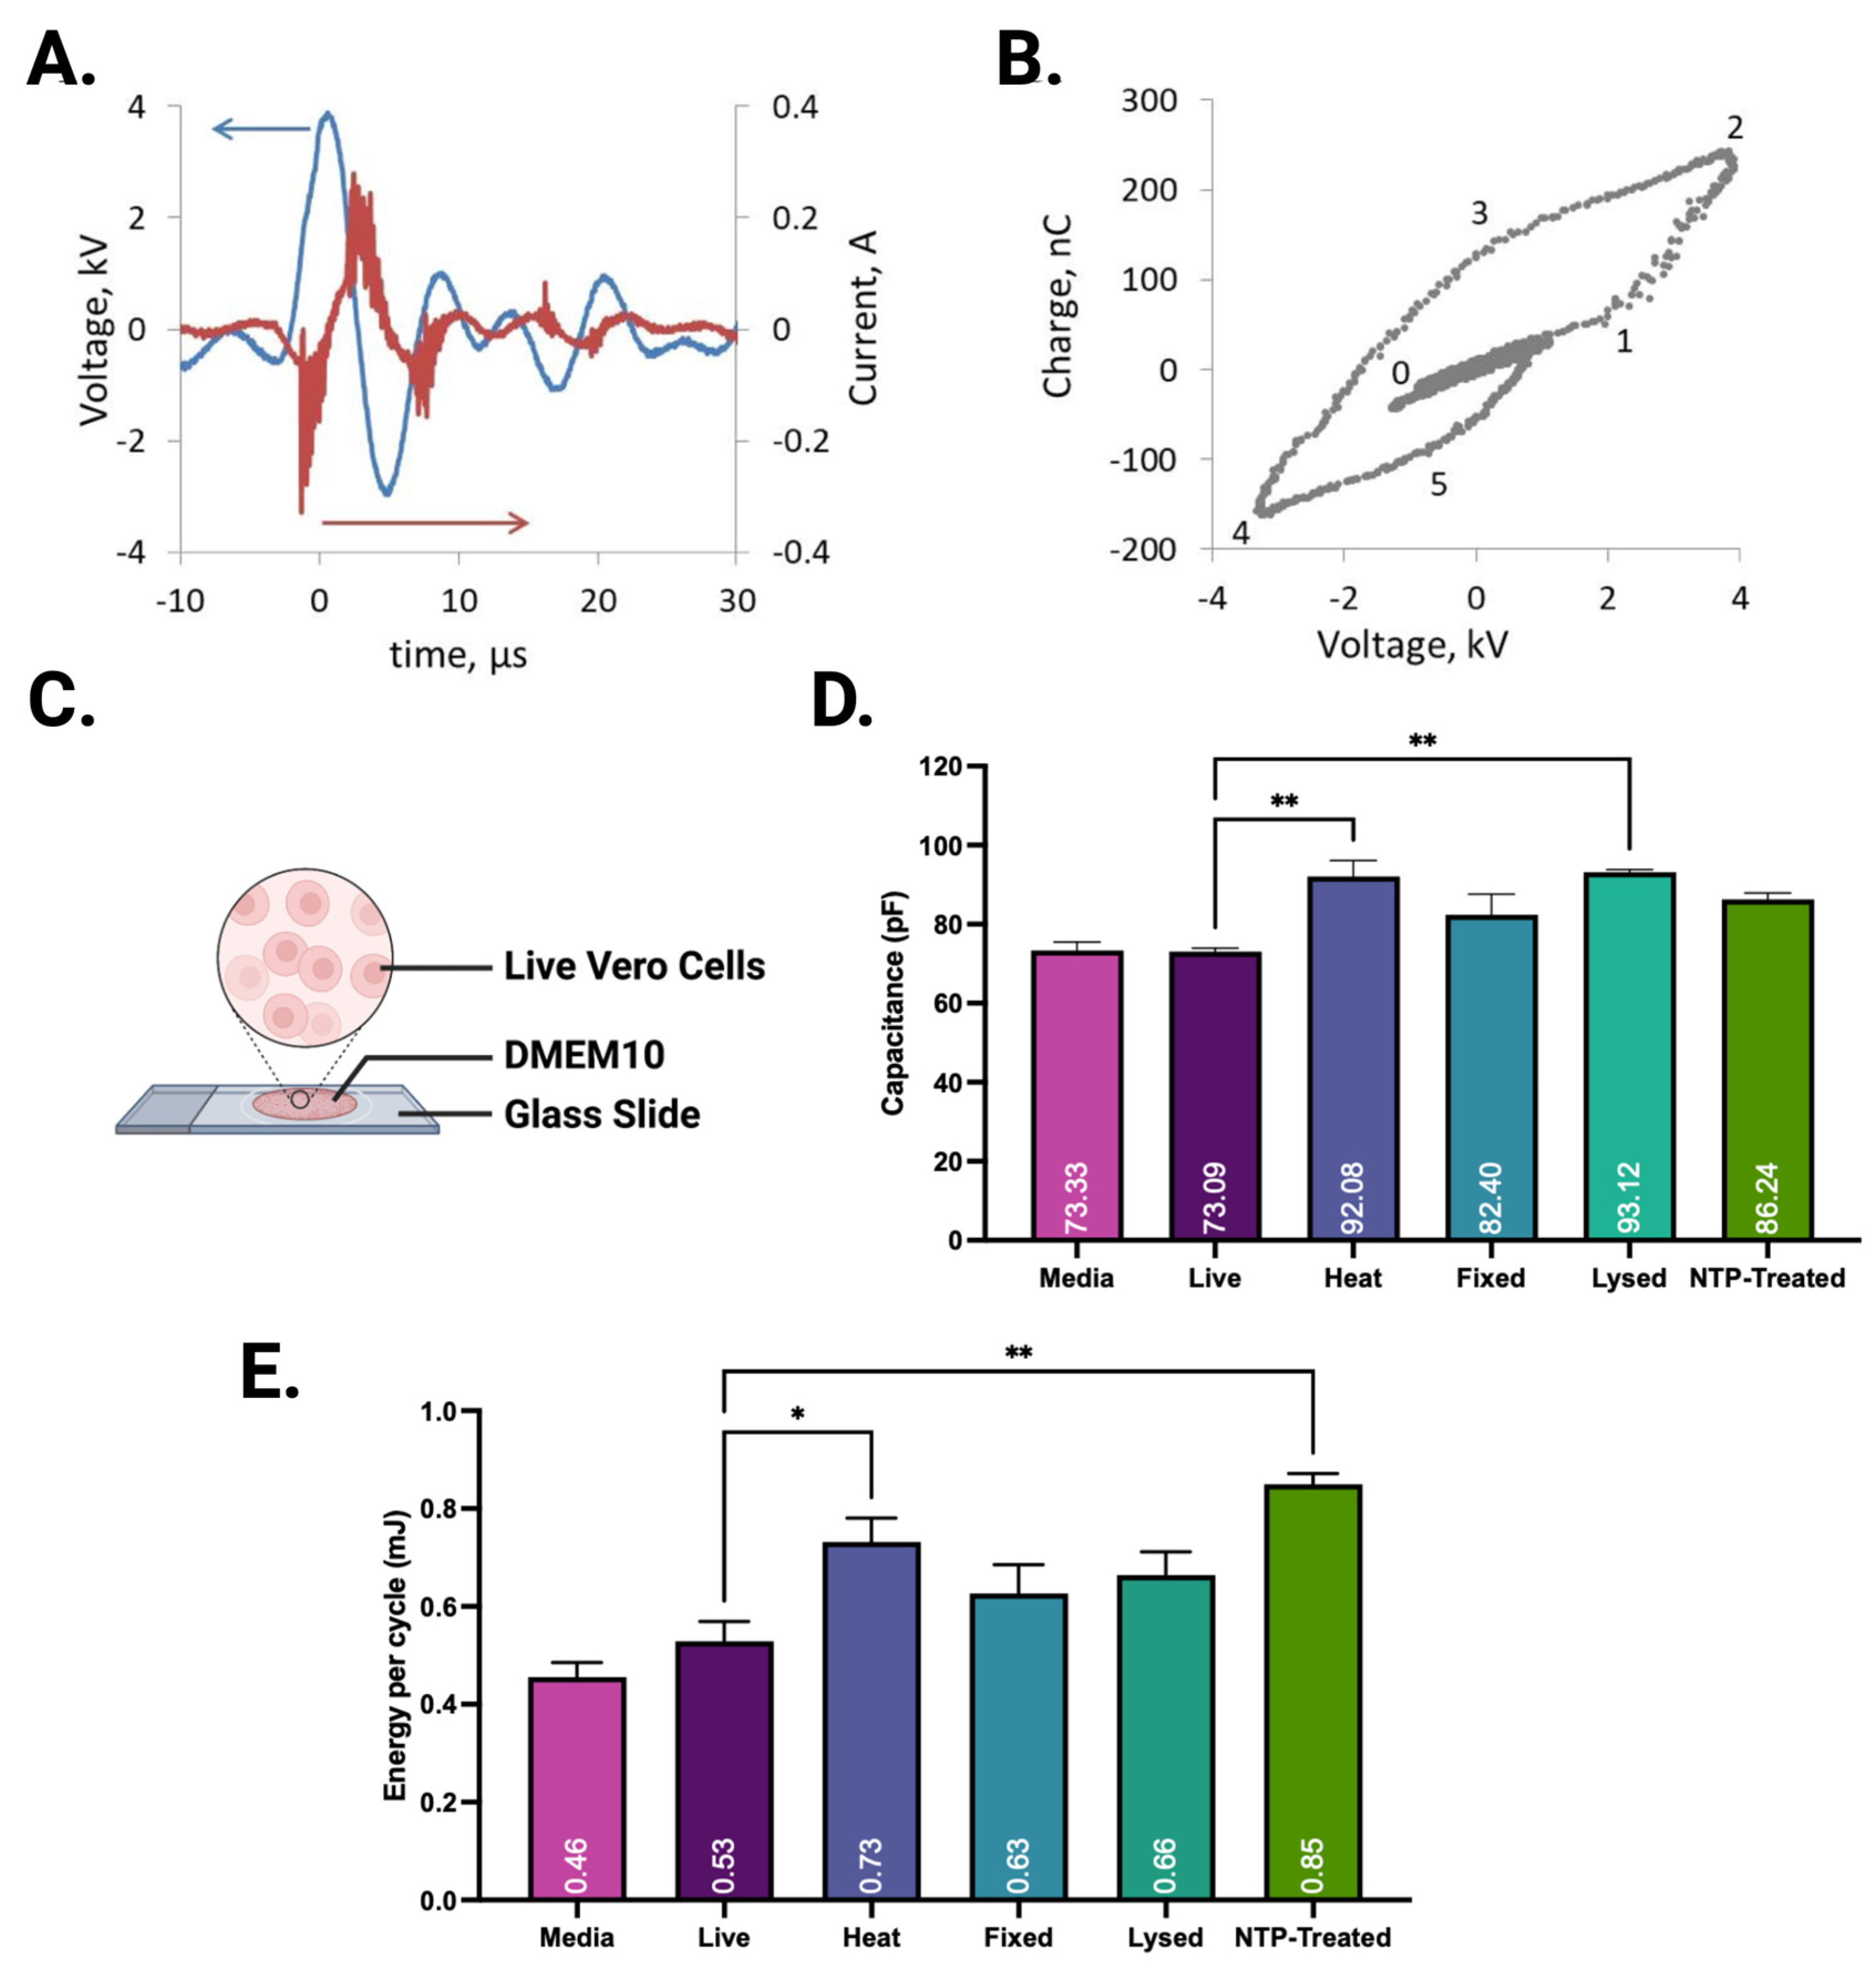
A typical pulse at the settings used for treatment (8.5 kV, 250 Hz) has a first positive peak of about 3.5–4.5 kV, followed by a lower amplitude negative oscillation. The first full oscillation of about 8 μs is followed by several quickly dampened oscillations with a total pulse duration of <50 μs and a pulse repetition rate of 250 Hz (Figure 4A). Most of the discharge current flows during the first full oscillation, during both positive and the negative halves of the first pulse, and almost no subsequent discharges. The Lissajous figure (Figure 4B) is a plot of the charge transferred in the circuit as a function of the applied voltage. We can distinguish several regions. A straight line marked “0–1” corresponds to the increase in the applied voltage without any current other than the displacement current. Point 1 marks the initiation of individual discharges picked up as sharp changes in charge. After a transition section, the line 1–2 corresponds to the discharge also evident in Figure 4A as current spikes during the first voltage peak. Section 2 and Section 3 corresponds to no discharge in the air gap, until it begins again as the applied voltage becomes negative. The Lissajous figures were used to calculate the equivalent capacitance of the circuit for differently treated biotargets, since I d i s c h = d Q d t = C e q d V d t , where the equivalent capacitance of the circuit when the air gap is closed by the discharge, C e q = C c o v e r s l i p · C c e l l s u s p e n s i o n C c o v e r s l i p + C c e l l s u s p e n s i o n . The equivalent capacitance, C e q , is calculated as the slope of the Lissajous section during the discharge. For a dry coverslip, this results in C e q , ≈ 70 ± 5 pF. The capacitance of the coverslip can be estimated as C g l a s s = ε r ε 0 A d , where ε r is the relative dielectric permittivity of glass (~4), ε 0 is the dielectric permittivity of vacuum, A is the area covered by the electrode, and d is the thickness of the coverslip, here, 0.13–0.17 mm. This provides an estimate of ~ 80   p F or less depending on the area covered by the discharge, which is in reasonable agreement with the measured value.
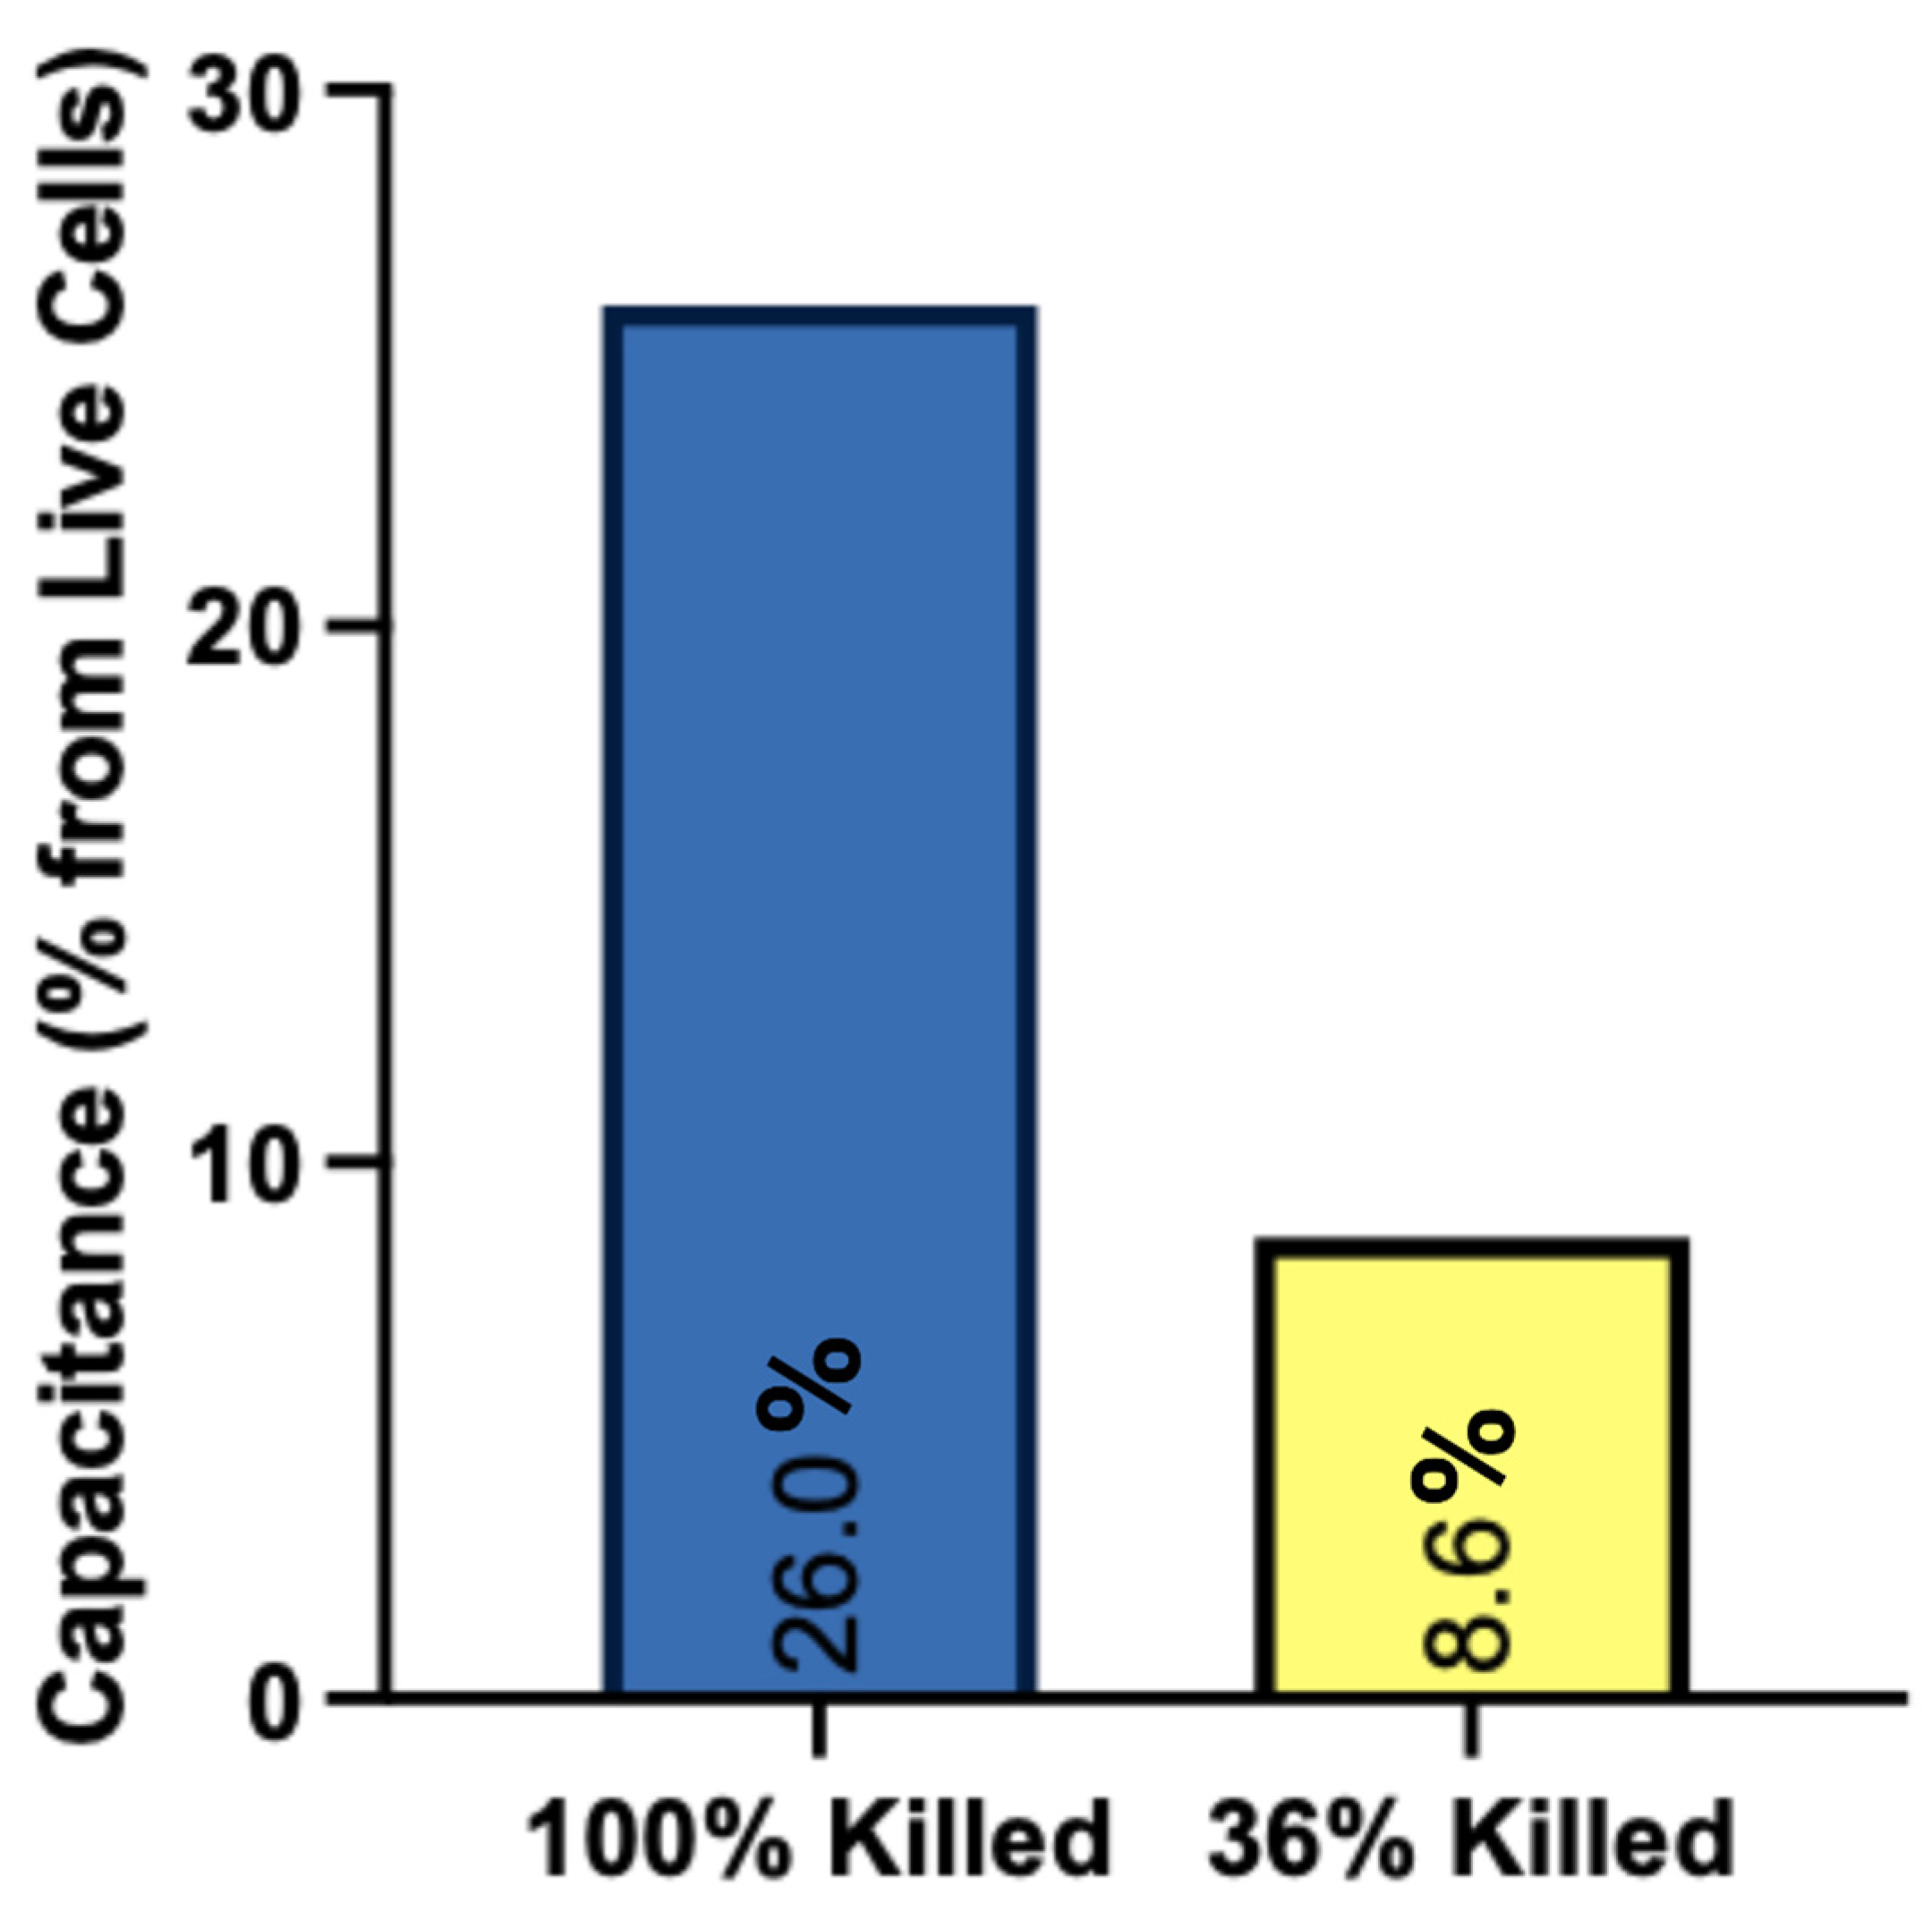
To investigate how the changes in cell morphology and chemistry affect the properties of NTP, we measured the circuit capacitance during NTP treatment of live and dead Vero cell samples (Figure 4C). Compared to live Vero cells, the circuit capacitance increased when a suspension of dead cells became part of the circuit (Figure 4D). The cell cultures with heat-treated and lysed Vero cells result in a significantly higher substrate capacitance (p < 0.005, ANOVA) compared to the medium alone and the live cell culture. The cell treatment conditions selected for these experiments (250 Hz repetition rate, 20 s exposure) did not affect cell viability. This was verified in a separate set of experiments where the electrical characteristics were collected at the start, during the first 1–2 s, and at the end, 19–20 s of treatment. To test if cells killed by NTP exposure induce dielectric changes similar to the other cell death modalities used in this study, the cells were exposed to NTP at 8.5 kV and 2000 Hz for 20 s. The treatment was stopped and the power source returned to 250 Hz prior to collecting the measurements post-treatment. The results show a significant change in the substrate capacitance pre- and post-NTP exposure of live cell cultures (p < 0.005) (Figure 4D). These results indicate that the nature of the substrate impacts the overall electrical circuit used to generate NTP. Specifically, when cellular integrity is compromised, higher circuit capacitance was measured. This was further validated when we compared a suspension with 100% killed cells to a suspension containing approximately 36% killed cells (Figure 5). Our results indicate that the number of dead cells present in a biological target affects the operation of the circuit.
Since the cell suspensions affect the global circuit parameters of the NTP-generating power supply circuit, we next investigated if the energy delivered by the power source per cycle also changes in response to the properties of the biological target. We observed significant changes (p < 0.005) between the energy delivered to live and heat-killed cells (Figure 4E). This energy is calculated as, E = q d V , which, integrated over one cycle, is the area enclosed by the Lissajous figure. This suggests that the electrical properties of cell suspensions, such as the dielectric constant, may be at least partially responsible for these changes.

3.2. Changes in Weight and Temperature Due to NTP Exposure

We speculated that the observed changes in impedance could be due to physical changes in the cell suspension. We first investigated if NTP exposure resulted in evaporation of liquid as reflected by changes in temperature and weight of different samples. Although no significant change in weight (0.5–1.3%) or temperature was observed, there is a trend of increased evaporation due to NTP exposure for all cases (PBS, DMEM10, and cells in DMEM10) (Table 1).

3.3. The Effect of the Cells on the Concentration of NTP RONS

The different cell populations (live, heat-killed, PFA-fixed, and lysed) affect not only the cell morphology, but also their ability to respond to RONS in the media. These responses include the consumption and breakdown of NTP RONS and generation of cellular RONS. To investigate if the changes in NTP properties between live and dead Vero cells were due to RONS in the media, we measured the RONS concentrations in media with Vero cells present following NTP exposure.
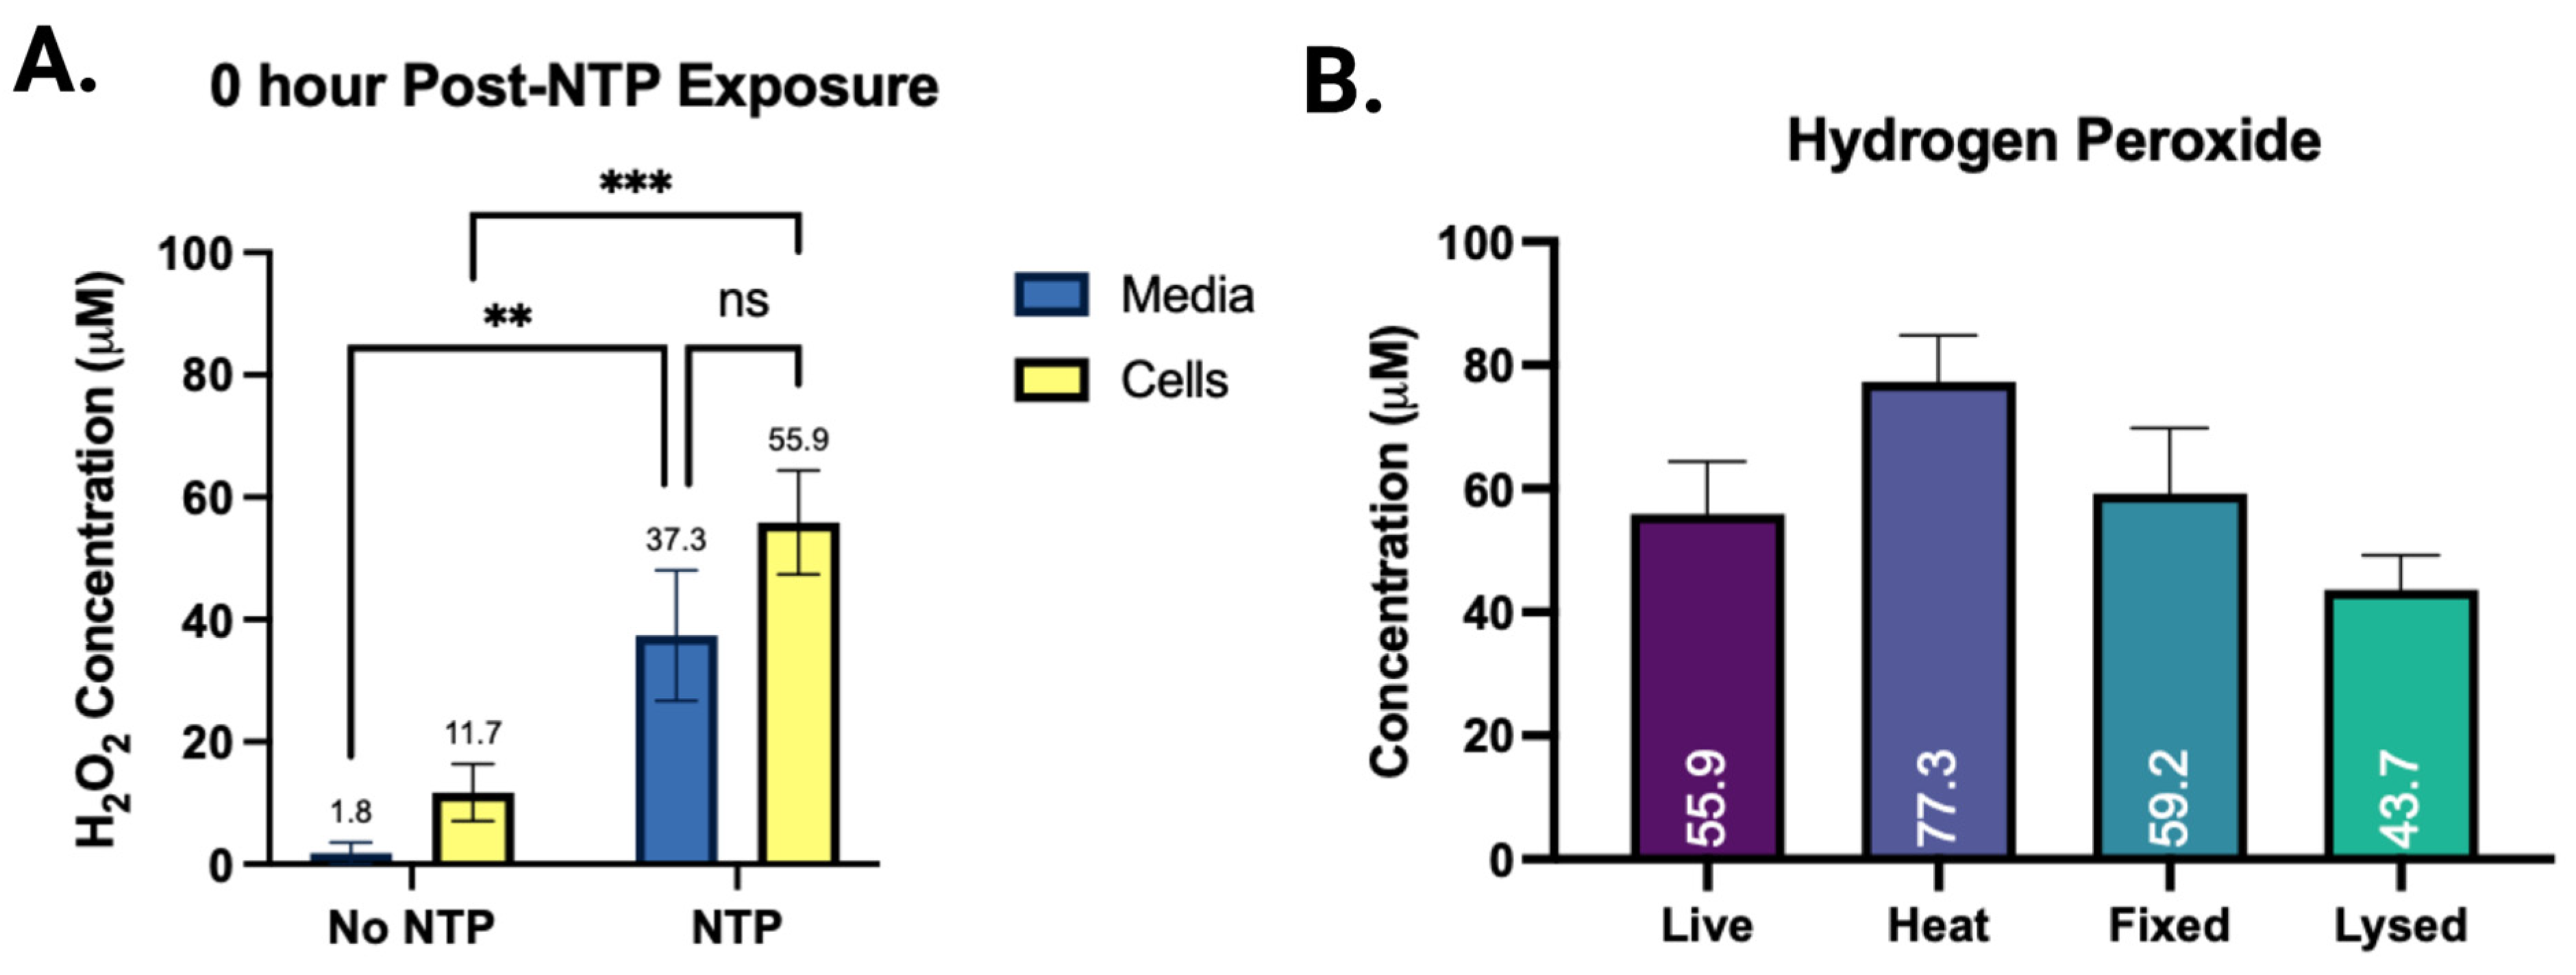
Hydrogen peroxide was measured in media, in the presence and absence of live Vero cells, immediately after NTP exposure. In the presence of live Vero cells, the concentration of hydrogen peroxide in media was ~48% higher, but this change was not statistically significant (Figure 6A). Over the course of 24 h following NTP exposure, hydrogen peroxide significantly increased in the media of live Vero cells, compared to media alone (Supplementary Figure S1). When heat-killed Vero cells were exposed to NTP, the hydrogen peroxide in media was ~37% higher than the media of live Vero cells. These cells have compromised cellular integrity and enzyme functions. The hydrogen peroxide concentration in media containing fixed cells was comparable to live Vero cells. These cells retain some membrane integrity with little change in cell shape and size. Lastly, preserved enzymatic function in lysed cells may contribute to increased neutralization of NTP-generated hydrogen peroxide in media, resulting in lower concentrations compared to live cells (Figure 6B). No appreciable pH changes were observed among different cell preparations (Supplementary Table S1).
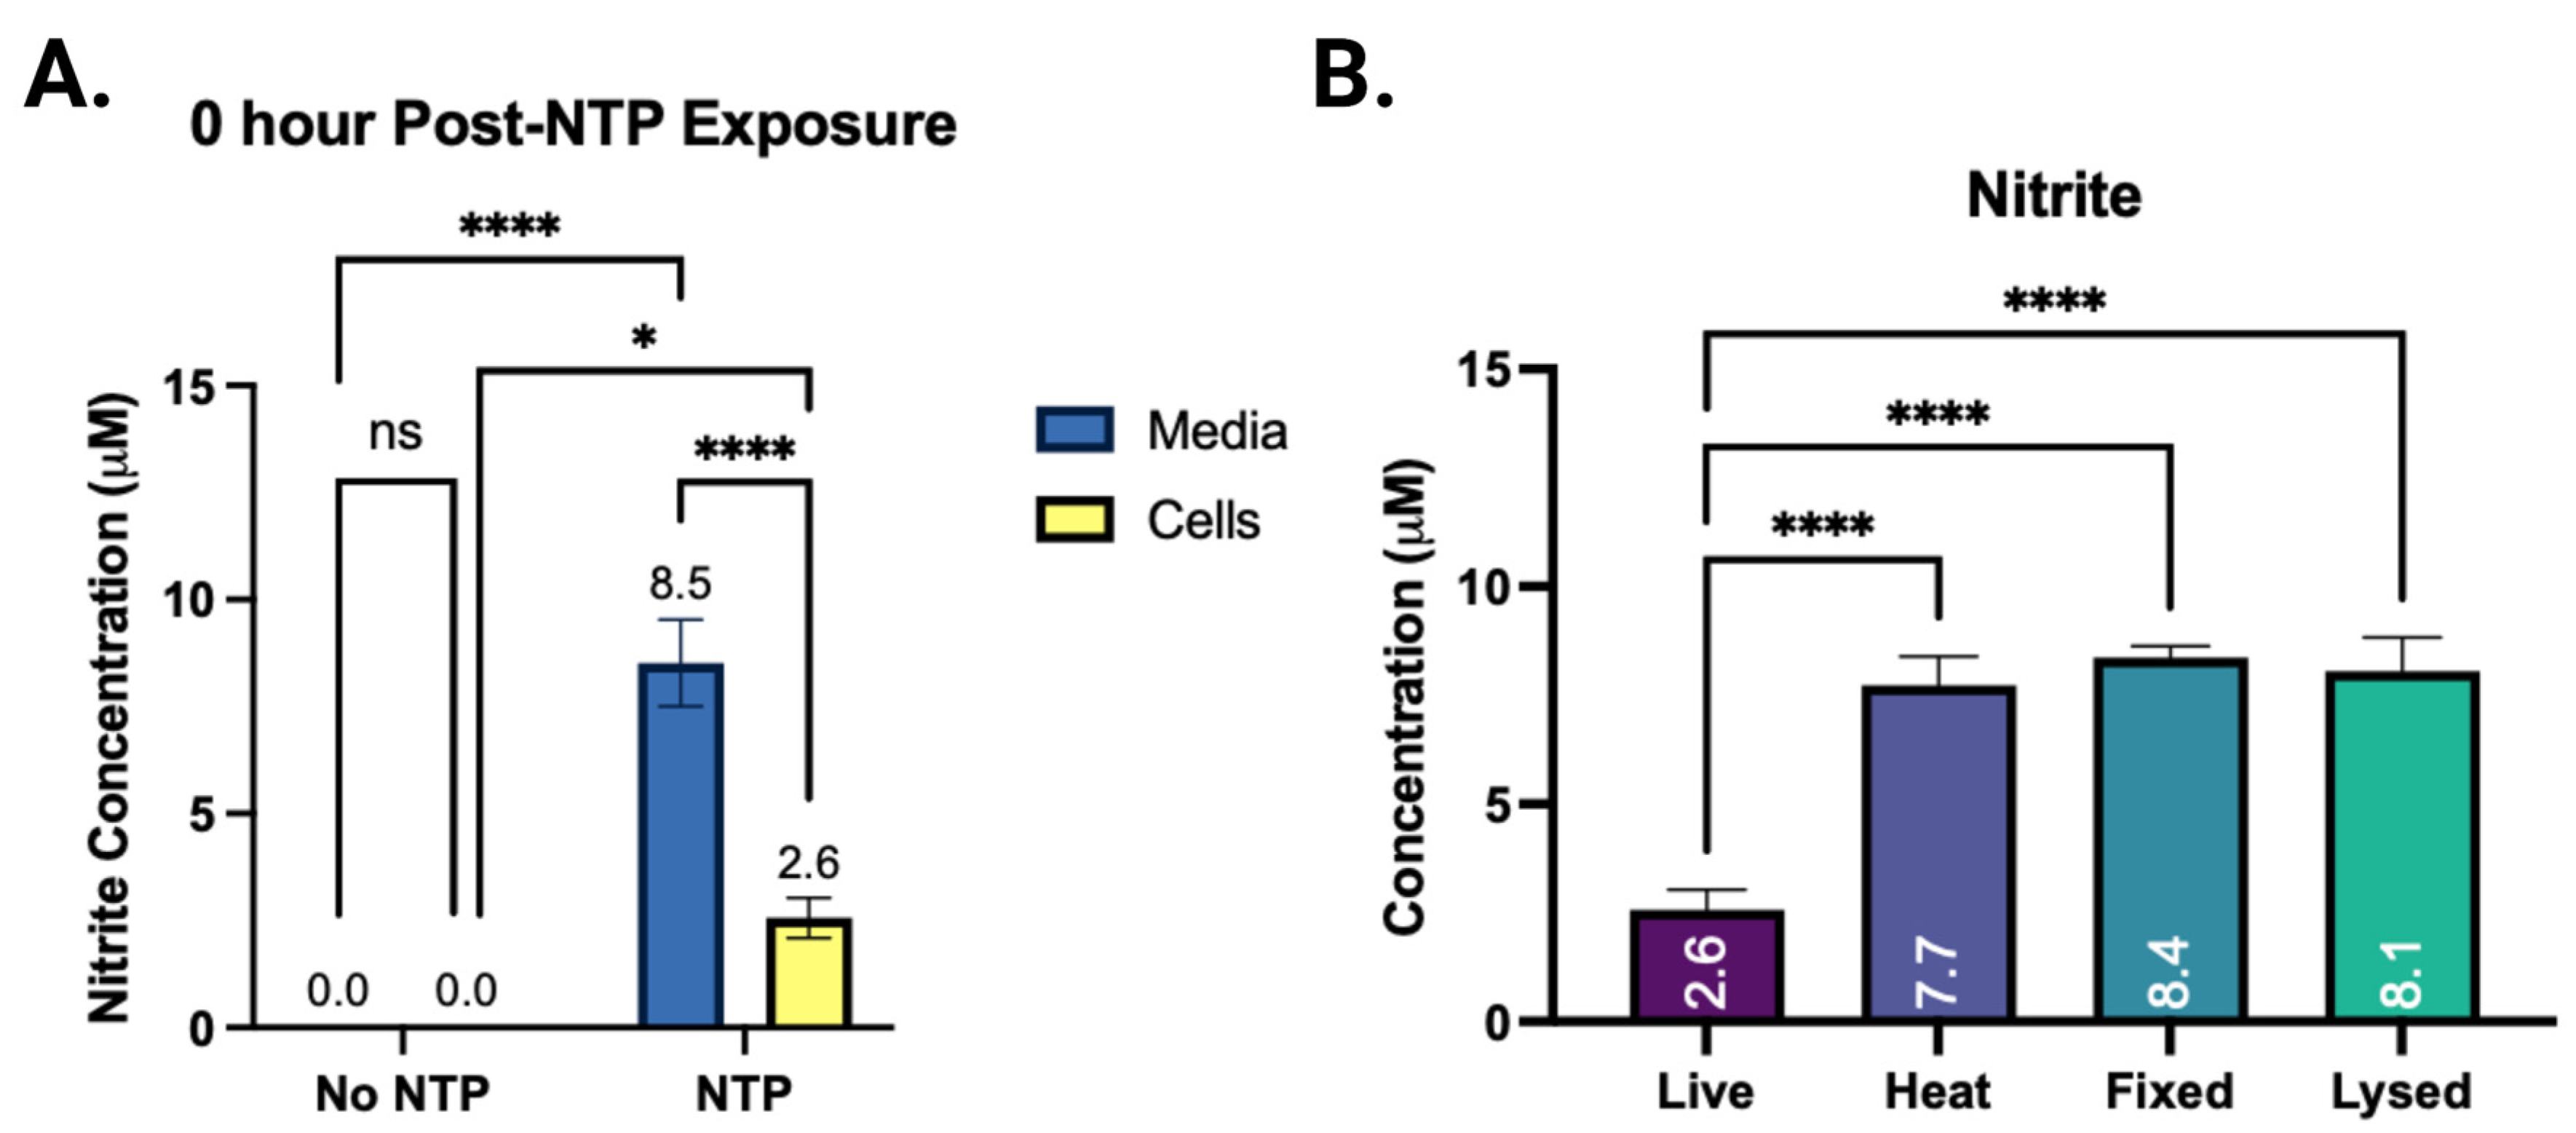
Nitrite, another long-lived RONS generated by NTP, was measured in media in the presence and absence of live Vero cells. Low concentrations of nitrite were detected in media alone immediately after NTP exposure. In the presence of live Vero cells, nitrite concentration decreased by ~70%. This decrease in nitrite concentration could be due to nitrite reacting with other NTP- or cell-generated RONS. Additionally, antioxidant expression in cells induced by NTP exposure could be rapidly neutralizing nitrite [27] (Figure 7A). The nitrite concentartions remain consistent in the presence and absence of live Vero cells, 24 h following NTP exposure (Supplementary Figure S2). When dead Vero cells are exposed to NTP, nitrite concentration in media was significantly higher from ~2 μM in the media of live Vero cells to >7 μM in media of dead Vero cells. This increase could be due to compromised enzymatic functions failing to neutralize nitrite or altered membrane integrities, preventing the consumption of nitrite by cells (Figure 7B).

4. Discussion

A variety of NTP sources are used for biological and medical applications, including plasma jets, where gas flows through an active discharge region and transports a variety of plasma effluent to the biological substrate. In a plasma jet, an operating gas or a mixture of gases flows through the discharge region, delivering electric, electromagnetic fields, charged particles, and RONS to the target. In the case of NTP sources based on surface dielectric barrier, discharges are generated in stationary gas usually ambient air and NTP RONS are transported by energetic flows generated by the surface discharges. In many NTP arrangements, including plasma jets and FE-DBD, the biological substrate is part of the circuit and its electrical properties can affect the operation of the entire circuit and NTP characteristics in a feedback loop.
In an in vitro NTP treatment system that uses an FE-DBD, treated cell layer(s) or cell suspensions are usually deposited on a dielectric substrate such as a well plate or a microscope slide. When the floating electrode DBD is used for in vivo applications, the biomaterial comprising the tissue underneath the cells has a frequency-dependent conductivity and dielectric constant. In both cases, the displacement and conductive currents from the floating electrode cause charging at the surface of the cell layer and the substrate. This bio-layer is a part of the electrical circuit of the NTP system where the gas discharge/gas gap plus the bio (cell)-layer and substrate combination constitute a resistive–capacitive load for the power source. Therefore, the dielectric properties of the cell suspension or the cell layers can influence the electrical performance of the entire power delivery circuit and the resulting discharge properties. Consequently, the electrical characterization of the FE-DBD NTP treatment system is essential for performance monitoring, dose interpretation, and for evaluation of treatment outcomes.
Electrical characterization of DBD systems usually includes voltage measured between the floating electrode and the ground, the current to ground, and the charge transferred. These measurements are conducted via a measurement capacitor in series with the ground electrode. Information about the discharge, the dielectric, and conductive layers involved in the system can be obtained from the Lissajous figures, a plot of the measured charge versus the measured voltage. The classical shape of this figure for a volume DBD (as in a floating electrode DBD used in this study), is a parallelogram. It can also present other shapes depending on the signal from the power source, the development of the discharge, and the dielectric properties of the materials as described in a review by Pipa and Brandenburg [28,29]. The interpretation of the figures depends on the adopted equivalent circuit model. The simplified model adopted here considers the cell suspensions as having a capacitance that is independent of the applied voltage and does not consider changes in the conductivity of the suspensions. An increase in the dielectric constant of cell suspension would lead to an increase in the equivalent circuit capacitance ( C e q = C g l a s s · C c e l l   s u s p C g l a s s + C c e l l   s u s p ) for moderate increases in the dielectric constant of the suspensions. Note that a simplified view of capacitance of a layer of a material is C = ε ε r A r e a t h i c k n e s s , where ε and ε r are the dielectric permeability of free space and the relative dielectric constant, respectively. Our imaging results show changes in cell shapes, sizes, and morphology, which have been shown to affect the dielectric properties of cells. The dielectric properties of cell suspensions also change [15,16], although the effect of changing properties of cells on the dielectric constant of cell suspensions is not easy to predict theoretically due to the simultaneous changes in structure and composition. These results illuminate the complexity of electrical responses in biological systems and the lack of fundamental theoretical understanding of the effects of cells on suspensions that contain cells and other biological substrates.
While a simple circuit may be acceptable to explain the observed changes in power delivered for a glass coverslip, it is not sufficient when biological targets are added. In this case, the C e q for two capacitors in series should be lower than glass alone as observed in our experiments. This can be explained by the changes in the conductivity of the suspensions and (related) changes in the area of the discharge [30]. An increase in conductivity indicates that the suspension layer passes the conduction current as a leaky capacitor, complicating our simple circuit model. In addition, increasing the conductivity of the substrate can affect the distribution of the discharge along the surface. An increase in the number of discharges, or the discharge covering a greater area, means that a greater region of the glass coverslip becomes a part of the overall circuit. Temperature is another potential factor, and again before and after measurements did not show any changes, but in situ measurements were not possible in the present experiment. Additionally, the conductivity of the suspension was measured for all different cell compositions in bulk, with no changes within the error of the instrument, but the measurements were conducted on ~ 10 mL amounts. Thin liquid layers can change conductivity quickly during NTP exposure. In future studies, in situ measurements will be performed.
In this study, we showed that cell structure, shape, and the state of biological activity impacts the properties of NTP. The electrical signatures of cells are influenced by their bulk properties and cellular mechanisms that function to maintain redox homeostasis. In live Vero cells, redox is maintained by active and passive mechanisms. Active mechanisms involve the use of proteins to shuttle ions across membranes and antioxidants to neutralize RONS. Passive mechanisms rely on free diffusion of ions through the intact cell membrane. However, some of these mechanisms can become compromised in non-viable cells. A fundamental obstacle to a straightforward interpretation of results is the multitude of metabolic biochemical, structural, and morphological changes that affect cell viability. For example, a decrease in the capacitance of a cell suspension may be attributed to a decrease in the membrane capacitance due to the decrease in the dielectric permittivity of the membrane. However, the decrease in the accumulated charge may be also due to the increase in the membrane permeability to ions [31].
It is also important to note again that the overall circuit impedance of the load seen by the power source includes not only the cell suspensions and the NTP system, but all the physical components of the system, as discussed by Stancampiano et al. [25]. The glass slide, grounding, electrode positioning, the droplet size, and spread were carefully controlled in these experiments as we attempted to focus on the influence of cells. These conditions cannot be controlled in all in vivo situations; therefore, the success of NTP applications will depend on successful integration of various novel approaches.
Overall, we show that during NTP treatment, when the target is a biological substrate, cell conditions influence the FE-DBD circuit parameters and the energy per pulse deposited by the power source globally (Figure 8). The effect on the dielectric permittivity of cell suspensions warrants further theoretical and experimental investigations since the dielectric properties of the substrate will change the discharge interaction with the surface.

5. Conclusions

The results of our investigation indicate that device optimization and standardization are incomplete without device characterization in the presence of the specific biological target. In addition, simultaneous process monitoring, such as ongoing electrical measurements of the power source output, and dielectric spectroscopy of the biological substrates are essential. Together, these will contribute to improved consistency of NTP application in clinical settings. More focused studies are needed to resolve the complexities presented in this investigation.

Supplementary Materials

The following supporting information can be downloaded at: https://www.mdpi.com/article/10.3390/plasma6030040/s1, Figure S1: Hydrogen peroxide was measured in media and Vero cell media 24 h after NTP exposure; Figure S2: Nitrite was also measured in media alone and media in the presence of live Vero cells 24 h after NTP exposure; Table S1: The concentration of hydrogen peroxide, nitrite, and nitrate were measured using test strips for media containing serum and different cell preparations.

Author Contributions

Conceptualization, V.M. and S.G.; methodology, V.M., F.K. and S.G.; formal analysis, V.M., J.S. and S.G.; investigation, J.S., J.B., S.M., V.M. and S.G.; resources, V.M., F.K. and S.G.; data curation, J.S., J.B., V.M. and S.G.; writing—original draft preparation, J.S., V.M. and S.G.; writing—review and editing, J.S., V.M. and S.G.; supervision, V.M. and S.G.; project administration, V.M. and S.G. All authors have read and agreed to the published version of the manuscript.

Funding

This research was partially funded by the Department of Microbiology and Immunology and the Institute for Molecular Medicine and Infectious Disease at the Drexel University College of Medicine. It was facilitated by the Princeton Collaborative Research Facility (PCRF) User Program. The work by SG is supported by the Princeton Collaborative Research Facility (PCRF), which is supported by the U.S. Department of Energy (DOE) under Contract No. DE-AC02-09CH11466.

Institutional Review Board Statement

Not applicable.

Informed Consent Statement

Not applicable.

Data Availability Statement

Relevant data are contained within the article or the Supplementary Materials.

Conflicts of Interest

The authors declare no conflict of interest.

References

  1. Von Woedtke, T.; Schmidt, A.; Bekeschus, S.; Wende, K.; Weltmann, K.-D. Plasma Medicine: A Field of Applied Redox Biology. In Vivo 2019, 33, 1011–1026. [Google Scholar] [CrossRef] [PubMed]
  2. Dobrynin, D.; Fridman, G.; Friedman, G.; Fridman, A. Physical and biological mechanisms of direct plasma interaction with living tissue. New J. Phys. 2009, 11, 115020. [Google Scholar] [CrossRef]
  3. Laroussi, M. Cold Plasma in Medicine and Healthcare: The New Frontier in Low Temperature Plasma Applications. Front. Phys. 2020, 8, 74. [Google Scholar] [CrossRef]
  4. Brulle, L.; Vandamme, M.; Ries, D.; Martel, E.; Robert, E.; Lerondel, S.; Trichet, V.; Richard, S.; Pouvesle, J.M.; Le Pape, A. Effects of a non thermal plasma treatment alone or in combination with gemcitabine in a MIA PaCa2-luc orthotopic pancreatic carcinoma model. PLoS ONE 2012, 7, e52653. [Google Scholar] [CrossRef] [PubMed]
  5. Liedtke, K.R.; Bekeschus, S.; Kaeding, A.; Hackbarth, C.; Kuehn, J.-P.; Heidecke, C.-D.; von Bernstorff, W.; von Woedtke, T.; Partecke, L.I. Non-thermal plasma-treated solution demonstrates antitumor activity against pancreatic cancer cells in vitro and in vivo. Sci. Rep. 2017, 7, 8319. [Google Scholar] [CrossRef]
  6. Yan, D.; Wang, Q.; Yao, X.; Malyavko, A.; Keidar, M. Anti-Melanoma Capability of Contactless Cold Atmospheric Plasma Treatment. Int. J. Mol. Sci. 2021, 22, 11728. [Google Scholar] [CrossRef]
  7. Kesarwani, P.; Murali, A.K.; Al-Khami, A.A.; Mehrotra, S. Redox regulation of T-cell function: From molecular mechanisms to significance in human health and disease. Antioxid. Redox Signal. 2013, 18, 1497–1534. [Google Scholar] [CrossRef]
  8. He, L.; He, T.; Farrar, S.; Ji, L.; Liu, T.; Ma, X. Antioxidants Maintain Cellular Redox Homeostasis by Elimination of Reactive Oxygen Species. Cell. Physiol. Biochem. 2017, 44, 532–553. [Google Scholar] [CrossRef]
  9. Trachootham, D.; Lu, W.; Ogasawara, M.A.; Nilsa, R.-D.V.; Huang, P. Redox regulation of cell survival. Antioxid. Redox Signal. 2008, 10, 1343–1374. [Google Scholar] [CrossRef]
  10. Lin, A.; Gorbanev, Y.; De Backer, J.; Van Loenhout, J.; Van Boxem, W.; Lemière, F.; Cos, P.; Dewilde, S.; Smits, E.; Bogaerts, A. Non-Thermal Plasma as a Unique Delivery System of Short-Lived Reactive Oxygen and Nitrogen Species for Immunogenic Cell Death in Melanoma Cells. Adv. Sci. 2019, 6, 1802062. [Google Scholar] [CrossRef]
  11. Mohamed, H.; Gebski, E.; Reyes, R.; Beane, S.; Wigdahl, B.; Krebs, F.C.; Stapelmann, K.; Miller, V. Differential Effect of Non-Thermal Plasma RONS on Two Human Leukemic Cell Populations. Cancers 2021, 13, 2437. [Google Scholar] [CrossRef] [PubMed]
  12. Fridman, G.; Shereshevsky, A.; Jost, M.M.; Brooks, A.D.; Fridman, A.; Gutsol, A.; Vasilets, V.; Friedman, G. Floating Electrode Dielectric Barrier Discharge Plasma in Air Promoting Apoptotic Behavior in Melanoma Skin Cancer Cell Lines. Plasma Chem. Plasma Process. 2007, 27, 163–176. [Google Scholar] [CrossRef]
  13. Wang, R.; Xu, H.; Zhao, Y.; Shao, T.; Zhu, W.; Ostrikov, K. Effect of dielectric and conductive targets on plasma jet behaviour and thin film properties. J. Phys. D Appl. Phys. 2019, 52, 13. [Google Scholar] [CrossRef]
  14. Kawai, S.; Suzuki, M.; Arimoto, S.; Korenaga, T.; Yasukawa, T. Determination of membrane capacitance and cytoplasm conductivity by simultaneous electrorotation. Analyst 2020, 145, 4188–4195. [Google Scholar] [CrossRef]
  15. Fricke, H. Relation of the Permittivity of Biological Cell Suspensions to Fractional Cell Volume. Nature 1953, 172, 731–732. [Google Scholar] [CrossRef] [PubMed]
  16. Downey, B.J.; Graham, L.J.; Breit, J.F.; Glutting, N.K. A novel approach for using dielectric spectroscopy to predict viable cell volume (VCV) in early process development. Biotechnol. Prog. 2014, 30, 479–487. [Google Scholar] [CrossRef]
  17. Giana, F.E.; Bonetto, F.J.; Bellotti, M.I. Assay based on electrical impedance spectroscopy to discriminate between normal and cancerous mammalian cells. Phys. Rev. E 2018, 97, 032410. [Google Scholar] [CrossRef]
  18. Qiao, G.; Duan, W.; Chatwin, C.; Sinclair, A.; Wang, W. Electrical properties of breast cancer cells from impedance measurement of cell suspensions. J. Phys. Conf. Ser. 2010, 224, 012081. [Google Scholar] [CrossRef]
  19. Nasir, N.; Al Ahmad, M. Cells Electrical Characterization: Dielectric Properties, Mixture, and Modeling Theories. J. Eng. 2020, 2020, 9475490. [Google Scholar] [CrossRef]
  20. Xiao, C.; Luong, J.H. Assessment of cytotoxicity by emerging impedance spectroscopy. Toxicol. Appl. Pharmacol. 2005, 206, 102–112. [Google Scholar] [CrossRef]
  21. Lin, L.; Hou, Z.; Yao, X.; Liu, Y.; Sirigiri, J.R.; Lee, T.; Keidar, M. Introducing adaptive cold atmospheric plasma: The perspective of adaptive cold plasma cancer treatments based on real-time electrochemical impedance spectroscopy. Phys. Plasmas 2020, 27, 063501. [Google Scholar] [CrossRef]
  22. Lin, L.; Keidar, M. A map of control for cold atmospheric plasma jets: From physical mechanisms to optimizations. Appl. Phys. Rev. 2021, 8, 011306. [Google Scholar] [CrossRef]
  23. Keidar, M.; Yan, D.; Beilis, I.I.; Trink, B.; Sherman, J.H. Plasmas for Treating Cancer: Opportunities for Adaptive and Self-Adaptive Approaches. Trends Biotechnol. 2018, 36, 586–593. [Google Scholar] [CrossRef] [PubMed]
  24. Lin, L.; Yan, D.; Gjika, E.; Sherman, J.H.; Keidar, M. Atmospheric Plasma Meets Cell: Plasma Tailoring by Living Cells. ACS Appl. Mater. Interfaces 2019, 11, 30621–30630. [Google Scholar] [CrossRef]
  25. Stancampiano, A.; Chung, T.H.; Dozias, S.; Pouvesle, J.M.; Mir, L.M.; Robert, E. Mimicking of Human Body Electrical Characteristic for Easier Translation of Plasma Biomedical Studies to Clinical Applications. IEEE Trans. Radiat. Plasma Med. Sci. 2020, 4, 335–342. [Google Scholar] [CrossRef]
  26. Ichikawa, T.; Wang, D.; Miyazawa, K.; Miyata, K.; Oshima, M.; Fukuma, T. Chemical fixation creates nanoscale clusters on the cell surface by aggregating membrane proteins. Commun. Biol. 2022, 5, 487. [Google Scholar] [CrossRef]
  27. Bil, P.; Ciesielska, S.; Jaksik, R.; Rzeszowska-Wolny, J. Circuits Regulating Superoxide and Nitric Oxide Production and Neutralization in Different Cell Types: Expression of Participating Genes and Changes Induced by Ionizing Radiation. Antioxidants 2020, 9, 701. [Google Scholar] [CrossRef]
  28. Kogelschatz, U. Dielectric-Barrier Discharges: Their History, Discharge Physics, and Industrial Applications. Plasma Chem. Plasma Process. 2003, 23, 1–46. [Google Scholar] [CrossRef]
  29. Pipa, A.V.; Brandenburg, R. The Equivalent Circuit Approach for the Electrical Diagnostics of Dielectric Barrier Discharges: The Classical Theory and Recent Developments. Atoms 2019, 7, 14. [Google Scholar] [CrossRef]
  30. Peeters, F.J.J.; van de Sanden, M.C.M. The influence of partial surface discharging on the electrical characterization of DBDs. Plasma Sources Sci. Technol. 2015, 24, 015016. [Google Scholar] [CrossRef]
  31. Patel, P.; Markx, G.H. Dielectric measurement of cell death. Enzym. Microb. Technol. 2008, 43, 463–470. [Google Scholar] [CrossRef]
Figure 1. Setup of a typical FE-DBD cell treatment system used in the lab for treatment of cells was adapted to treat glass coverslips. A Z-positioner was used to position the FE-DBD electrode at a fixed distance above the target on a glass coverslip placed on a metal ground plate. The electrode was connected to an electrical power supply where the voltage, frequency, and treatment time can be adjusted using a touchscreen display.
Plasma 06 00040 g001
Figure 2. Visual representation of the setup used for monitoring the output of the power source during NTP exposure of biological targets. Cm represents a measurement capacitor, Cm = 10 nF >> system (load) capacitance.
Plasma 06 00040 g002
Figure 3. (A) High-contrast brightfield imaging was used to visualize live (A1), heat-killed (A2), PFA-fixed (A3), and lysed Vero cells (A4). Average cell size (B) was calculated using image analysis software (Gen5 software). Statistical analysis was performed using an ordinary one-way ANOVA, comparing the sample means to the mean of live cells. N.D. = No data.
Plasma 06 00040 g003
Figure 4. At a setting of 8.5 kV, 250 Hz pulse repetition rate, the applied pulse (A) has an average voltage of 6–9 kV p-p during the first full oscillation about 8 μs long. A plot of the charge on the measurement capacitor as a function of the applied voltage forms a Lissajous figure (B) used to compute the power per pulse supplied to the discharge as well as the overall equivalent circuit capacitance during the discharge. The different cell preparations were exposed to NTP and substrate capacitances were measured. Statistical analysis was performed using an ordinary one-way ANOVA, comparing the sample means to the mean of live cells (C,D). Energy per cycle delivered by the power source during the discharge for different biological targets (E). * p < 0.05; ** p < 0.005.
Plasma 06 00040 g004
Figure 5. The change in circuit capacitance was compared between two suspensions containing 100% killed Vero cells and 30% killed Vero cells immediately after NTP exposure.
Plasma 06 00040 g005
Figure 6. Media, in the presence and absence of live Vero cells was exposed to NTP at 250 Hz frequency. Immediately after NTP exposure, the hydrogen peroxide concentration in media of live Vero cells was compared to media alone (A) and dead Vero cells (B). ** p = 0.0066, *** p = 0.0009, ns = not significant.
Plasma 06 00040 g006
Figure 7. Media, in the presence and absence of live Vero cells was exposed to NTP at 250 Hz frequency. Immediately after NTP exposure, the nitrite concentration in media of live Vero cells was compared to media alone (A) and dead Vero cells (B); ns = not significant, * p = 0.0192, **** p < 0.0001.
Plasma 06 00040 g007
Figure 8. Graphical representation of the proposed feedback loop between the biological target and the NTP power supply.
Plasma 06 00040 g008
Table 1. There was no appreciable evaporation or temperature change due to NTP exposure. Weights (tared to exclude the weight of the glass slide) ranged from 378 mg to 390 mg. Measured temperatures ranged from 21.7 °C to 23 °C.
NTP ExposureChange in Weight (mg)Change in Temperature (°C)
PBSN 2   ± 0 0   ± 0
Y 5   ± 0 0   ± 0.58
DMEM10N 2   ± 0 0   ± 0
Y 3   ± 0 0   ± 0
Cells in DMEM10N 2   ± 0 0   ± 0
Y 5   ± 0 0   ± 1.0
Disclaimer/Publisher’s Note: The statements, opinions and data contained in all publications are solely those of the individual author(s) and contributor(s) and not of MDPI and/or the editor(s). MDPI and/or the editor(s) disclaim responsibility for any injury to people or property resulting from any ideas, methods, instructions or products referred to in the content.