Article

Features of Pinch Plasma, Electron, and Ion Beams That Originated in the AECS PF-1 Plasma Focus Device

Department of Physics, Atomic Energy Commission, Damascus P.O. Box 6091, Syria
*
Author to whom correspondence should be addressed.
Plasma 2022, 5(2), 184-195; https://doi.org/10.3390/plasma5020014
Submission received: 23 December 2021 / Revised: 17 March 2022 / Accepted: 18 March 2022 / Published: 25 March 2022
(This article belongs to the Special Issue Feature Papers in Plasma Sciences)

Abstract

:
The measured current traces of alow energy AECS PF-1 plasma focus device are used for studying of the formed plasma, and the produced ion and electron beams. Anadapted version of the Lee model (RADPFV5.15FIB&REB) is applied, taking into account the fitting procedures between the measured and computed current waveforms for each shot. The experiments on AECSPF-1 were performed with three different gases—helium, nitrogen, and argon—for studying the effect of the atomic number on the properties of the generated beams. For numerical experiments using the Lee model, 36 successful shots for each gas were selected. The peak values of the total discharge current Ipeak were 50–55 kA, the pinch currents Ipinchwere34–36 kA, and the final pinch radius reached a minimum value of 0.03 cm for argon. The ion mean energy ranged from 35 keV (for He) to 223 keV (for Ar). The beam energy also had an extreme value of 1.34 J (0.05%E0) for argon. The results presented the highest values of 2.4 × 10¹⁴Wm−2 for the power flow density, and adamage factor of around 3.1 × 10¹⁰ Wm−2s0.5 for argon. For electron beams, the results also showed that the fluence and flux increased with the higher atomic number and reached a peak of 9.7 × 10²² m−2 and 5.9 × 1030 m−2 s−1 for argon, respectively. The results presented the highest values of 2.2 × 10¹⁶Wm−2 for the power flow density (heat flux), and adamage factor of around 3 × 10¹² Wm−2s0.5 for argon. The kinetic energy of the relativistic electrons was found to be within the range of 18–23 keV. The results show that the ion and electron beam properties (energy, flux, fluence, ion and electron numbers, current, power flow density, and damage factor) emitted from the plasma focus had wide ranges based on the operational plasma focus parameters. Thus, these results could be used for selection of the suitable plasma focus parameters for desired material processing applications.

1. Introduction

Many experiments and efforts have been performed on the plasma focus for multi-applications such as neutrons, X-radiation, and high energetic particle generation. Most experiments for ion beam diagnostics have been conducted with deuterium to investigate the neutron production and deuteron acceleration. It was found that the pinched plasma shape is related to the acceleration of deuterons. However, when a high atomic number gas is used as a filling gas, the plasma focus phenomena are the changes from a long column to a short hot spot [1]. The electrons produced by the plasma focus devices have been studied using different diagnostics [2,3,4,5]. The electron beam energy emitted from the NX2 device was measured and was found to be around 3.2% of the storage energy E0 [3]. The mean electron beam current produced in a 2.2 kJ PF device operated with nitrogen was estimated to be about 13.5 kA (at 0.3 Torr) and the electron energy was ~80–110 keV [5]. The origin of electrons and ions in the plasma focus devices have been studied and discussed [6,7,8]. A low energy 3 kJ plasma focus device operated with neon has been utilized to study electrons, where the energy of electron was less than 200 keV [9]. The radiation from the dense hot plasma may affect plasmadynamics, causing radiative cooling and collapse for high Z gases such as Ar, Kr, and Xe [10,11,12]. Experimental observations suggests Ar (Z = 18) as the transition gas, below which (Z < 18) the pinching and any radiative cooling effects proceed as a column. For heavier gases (Z > 18), the pinch is broken up into a line of radiatively collapsed dense hot spots [13]. In the plasma focus, the Faraday Cup is used to measure the ion flux, which was found to be 4.34 × 10¹⁶–1.86 × 10¹⁷ ions/sterad for an energy range of 3–12keV [14]. The results on a Mather type 2.3 kJ PF showed that the ion current density decreased from 1.4 × 10⁷ Am−2 to 1.1 × 10⁷ Am−2 as the BPX65 diode moved from 3–9 cm [15]. In another experiment, the results showed that the average ion current density estimated for the solid anode changed with the gas pressure from 1.15 × 10⁷ Am−2 (at 0.13 mbar of nitrogen) to 0.6 × 10⁷ Am−2 (at 1.33 mbar of nitrogen) with a maximum value of 1.25 × 10⁷ Am−2 (at 0.7 mbar of nitrogen) [16]. H. Kelly et al. [17] recorded, in PF II (4.75 kJ, 30 kV), 3.2 × 10¹³ ions/sterad with an energy content of 0.74 J/sterad, measuring ion energies in the range of 50–1000 keV. Sohrabi et al. [18] reported a maximum ion density of about 1025 ions m−2 using the Faraday Cup method. Ion fluences of 1018–1020 m−2werefound using 300–400 ns ion nitrogen pulses [19]. M. Habibi et al. [20] found that a maximum ion flux of 6 × 10¹² ions/steradian was obtained with a cylindrical anode tip that increased to 1013 ions/steradian for a conical anode tip. The Lee model code [21] was extended, based on the virtual plasma diode mechanism proposed by Gribkov et al. [22,23], for studying ion beams from the plasma focus [13,24,25,26], and later were further developed to consider the electron beams from the plasma focus [27,28]. The correlation between the plasma focus parameters and produced ion and electron beam properties could be of help to understand the plasma surface interactions and to find the optimum conditions for the desired material science applications.
So, the major aim of this work wasto investigate the influence of the atomic number on the properties of the generated beams and to provide a basis for estimating the effects of ion and electron beams emitted from the plasma focus on target materials, especially for a single capacitor with an energy of kJ plasma focus devices that dominate the research for small plasma focus groups.

2. Materials and Methods

2.1. Experimental Set up and Diagnostic Tools

The experiments were investigated using AECS PF-1 [29,30] (see Table 1) with helium, nitrogen, and argon gases at an operational optimum pressure of 0.6 ± 0.02 Torr. The electrode system consisted of a central solid cylindrical copper anode of 16 cm in length and 1.9 cm in diameter, and a cathode consisting of six copper rods arranged in a circle of 6.4 cm diameter concentric with the anode. In this work, the copper anode was modified by encapsulating pure Sn(99.99%) in the top of the anode (diameter of 1.8 cm). The anode was insulated from the cathode at the back wall using a Pyrex glass tube of 5 cm in length and 2.4 cm in diameter. To reduce the impurity effect, after every shot, the previous gas was purged and fresh gas was filled. The current in the discharge circuit and the voltage across the AECS PF-1 versus time during the plasma focus discharge were measured at the main collector plate using a Rogowski coil and an Ohmic voltage divider 1:100 probe, respectively. Four-channel digital storage oscilloscopes (TDS 3054C) with shielded connecting cables were used to record the current and voltage signals simultaneously.

2.2. The Lee Model Code Used for the Ion and Electron Beam Computation

The five-phase Lee code is a computer code simulating approximately all main phases of discharge in the plasma focus. It has a consistent energy, mass, momentum and charge. It uses a realistic power source model and assumes the validity of the Bennett relation in each small time step of the code in the equilibrium pinch phase of discharge. It includes the finite velocity of small disturbances propagation in the plasma during radial collapse and compression, taken as the acoustic/sound velocity. The code also includes the ionization effects in the plasma, the shock-wave heating model in the radial phases of discharge before stable pinch formation, the classical model of plasma column ohmic heating based on the Spitzer resistivity, the anomalous resistivity, and heating due to micro-instability development. The code also enables X-ray bremsstrahlung, and line and recombination radiation emission from the pinch column, and couples it with plasma pinch compression dynamics. The plasma self-absorption and transition from volumetric to surface emission is also included, as well as the neutron emission based on both thermonuclear and beam-target fusion models. In the Lee model, a beam of fast deuterons is produced by a vacuum diode in a thin layer close to the anode, with plasma disruptions generating the necessary high voltages. The Lee model code simulates the total current. Four model parameters are used, representing the mass swept-up factor (fm) and the plasma current factor (fc) for the axial phase, as well as the mass swept-up factor (fmr) and the plasma current factor (fcr) for the radial phases. These four model parameters are used to account for the experimentally observed mass loss and current loss in the axial and radial phases of discharge, respectively (percentages of total mass and current flowing between electrodes in axial and radial phases). After each run, the user changes one of the model parameters so as to improve the fitting of the computed to the measured current trace for the next run. This fitting procedure is done sequentially, starting with fm and fc while inspecting the fit of the current trace in the axial phase before the current dip, and then proceeds to fmr and fcr while inspecting the fit of the current dip. Additionally, static inductance L0 and stray resistance r0 parameters may be fine-tuned from run to run during the fitting procedure of current traces. In general, it is well known that the current signal from a plasma focus is one of the best performance indicators that can be obtained. Some of the most important information that can be derived using the Lee model, like the axial and radial phase dynamics, as well as radiation yields, are dependent on the current flow in the plasma. Moreover, once fitted, the code outputs the following realistic data: the dynamics and energy content of the phases, pinch geometry, temperatures and densities, line radiation, and neutron yields. In this article, all experimental discharges (experimental current traces) were fitted individually with simulated discharges (simulated current traces) using four model parameters, as well as L0 and r0 parameters.
The flux equation of the ion beam emitted from the plasma pinch is derived and inserted into the Lee model code, which is in turn used to study the ion beam properties [13,25,26]. As the beam exits the focus pinch with little divergence, the exit beam is best characterized by the ion fluence, defined as the number per unit cross-section. During the numerical experiments, the following equation is utilized for the ion flux:
F l u x   ( i o n s   m 2   s 1 ) = 2.75 10 15 f e ln ( b / r p ) I p i n c h 2 M 1 / 2 Z e f f 1 / 2 r p 2 U 1 / 2
The ion fluence (ions m−2) is then computed by multiplying the flux by the pinch duration.
Here, Mis the mass number of ion; b is the cathode radius; and fe = 0.14 (the fraction of energy converted from pinch inductive energy PIE into beam kinetic energy BKE), which is equivalent to an ion beam energy of 3–6% E0. The diode voltage U is U = 3Vmax, taken from the data fitting, where Vmax is the maximum induced voltage in the axial phase. The code computes the values of effective charge Zeff, pinch radius rp, pinch duration, pinch current Ipinch, and U from which the ion flux is deduced, followed by fluence ions m−2 current density (Am−2), current (A), ions per sec (ions s−1), number of ions in beam (ions), power density flow (energy flux) (Wm−2), energy in beam (J), and damage factor (Wm−2s0.5).
Next, for studying the electron beam characteristics generated in the pinch using the Lee model, the corresponding equations are first deduced and they are then incorporated into the code. Firstly, the electron beam flux formula is taken as Jeb = nebveb (electrons per m2s1), where neb is the density number of beam electrons, which is equal to Neb (total number of electrons) divided by the volume of the pinch plasma, and veb is the electron speed (all quantities are expressed in SI units, except where otherwise stated).
Then, based on the kinetic energy of the beam electrons and pinch inductive energy concepts, neb and veb are derived. The beam kinetic energy is (1/2)Nebmeveb2, where me is the mass of the electron. The pinch inductive energy equals (1/2)LpIpinch2, where Lp =(2) (ln[b/rp])zp is the inductance of the focus pinch, =4 × 10⁻⁷ Hm−1, b is the cathode radius, rp is the pinch radius, zp is the length of the pinch, and Ipinch is the pinch current. As the kinetic energy is imparted by a fraction fe of the pinch inductive energy, it can be written as follows (1/2)Nebmeveb2 = fe (1/2)(2)(ln[b/rp])zpIpinch2.
This gives
neb = Neb/(rp2zp) = (2 me]) (fe) {(ln[b/rp])/(rp2)} (Ipinch2/veb2)
Next, we proceed to derive veb from the accelerating voltage provided by the diode voltage U to an electron. Each electron is given as the kinetic energy of Ee = (1/2)meveb2 by the diode voltage U. Thus, (1/2)meveb2 = eU, where e is the electronic charge. Hence
veb = (2e/me)1/2 U1/2.
Now, we take Equation (2) and combine it withEquation (3), and noting that (2.83 (eme)1/2]) = 1.2 × 10¹⁷, we have the flux equation, as follows:
Flux (electrons m−2s−1) = Jeb =1.2 × 10¹⁷ (fe){(ln[b/rp])/(rp2)}(Ipinch2)/U1/2
The fluence is the flux multiplied by the pulse duration.
Thus:
Fluence (electrons m−2) = 1.2×10¹⁷ (fe){(ln[b/rp])/(rp2)}(Ipinch2)/U1/2
where fe~0.14 for the energy of electron beam = 4% E0 for cases when the pinch inductive energy holds 20–40% of E0, as observed for low inductance PF [3]. From the above-mentioned equations, it is noticed that the electron flux and fluence is (mp/me)1/2~43 of the deuteron beam flux and fluence, where mp is the mass of the proton. However, the experimental observations by the authors over the years show that the electron beam leaves a very fine footprint on a per shot basis, with a diameter of the order of 0.1 mm when the ion beam is of the order of 1mm for a plasma focus with a radius of the order of 1 cm. These experimental observations seem consistent with a necessary assumption that the electron beam current be set to be approximately equal to the ion beam current. To implement this assumption in the code, the radius of the electron beam is taken as (1/43)0.5 times the radius of the ion beam (or the radius of the pinch). The kinetic energy of the relativistic electrons is estimated by Erel = mec2(γ − 1), where γ is the relativity factor [(1/(1 − veb2/c2)1/2)], c is the light speed (c = 3 × 10⁸m/s), and mec2 is the rest mass energy of an electron ~511 keV. Once the flux is determined, the following quantities are also computed: energy flux or power density flow (Wm−2), power flow (W), current density (Am−2), current (A), fluence electrons m−2, energy fluence (J m−2), number of electrons in beam (electrons), energy in beam (J), and damage factor (Wm−2s0.5).

3. Results and Discussion

3.1. Fitting Procedures of the Current Waveforms

The measurements of the current and voltage waveforms on AECS PF-1 were investigated with three different gases—He, N2, and Ar—at an optimum pressure of around 0.6 Torr. The considered current and voltage signals were recorded during the deposition process of tin (Sn) on the silicon substrate located at the different positions from the anode tip. Thirty-six successful shots were selected for each gas, as the plasma focus devices have a variable performance from shot-to-shot even for the same operational parameters, likely due to the random changes in the conditions of the electrodes. In this work, the measured current traces were used to compute the plasma focus parameters, and ion and electron beam properties emitted from AECS PF-1 operated with He, N2, and Ar using the Lee model code (version: RADPFV5.15FIB&REB). The fitting procedures using the Lee model [31,32] were investigated for each meaured current step by step.
For this purpose, the Lee model code was configured as AECS PF-1 (Figure 1a,b) using the following parameters as an example:
Bank: L0 = 1430 nH, C0 = 25 μF, r0 = 50 mΩ;
Tube: b = 3.2 cm, a = 0.95 cm, z0 = 16 cm;
Operational: V0 = 15 kV, p0 = 0.6 Torr for helium gas;
where L0, C0, b, a, z0, V0, and p0 are the static inductance (nominal), storage capacitance, cathode radius, anode radius, anode length, operating voltage, and initial pressure, respectively. The measured wave shape of the current was then used as the basis to fit the computed current. The four model parameters derived from the fitting were the axial phase mass swept-up factor fm = 0.15, corresponding plasma current factor fc = 0.7, the radial phase mass swept-up factor fmr = 0.2, and corresponding current factor fcr = 0.7. Figure 2 shows the measured and computed waveforms of the current and voltage in the AECS PF-1 plasma focus device at p0 = 0.6 Torr of helium. The fitting seemed to be good.
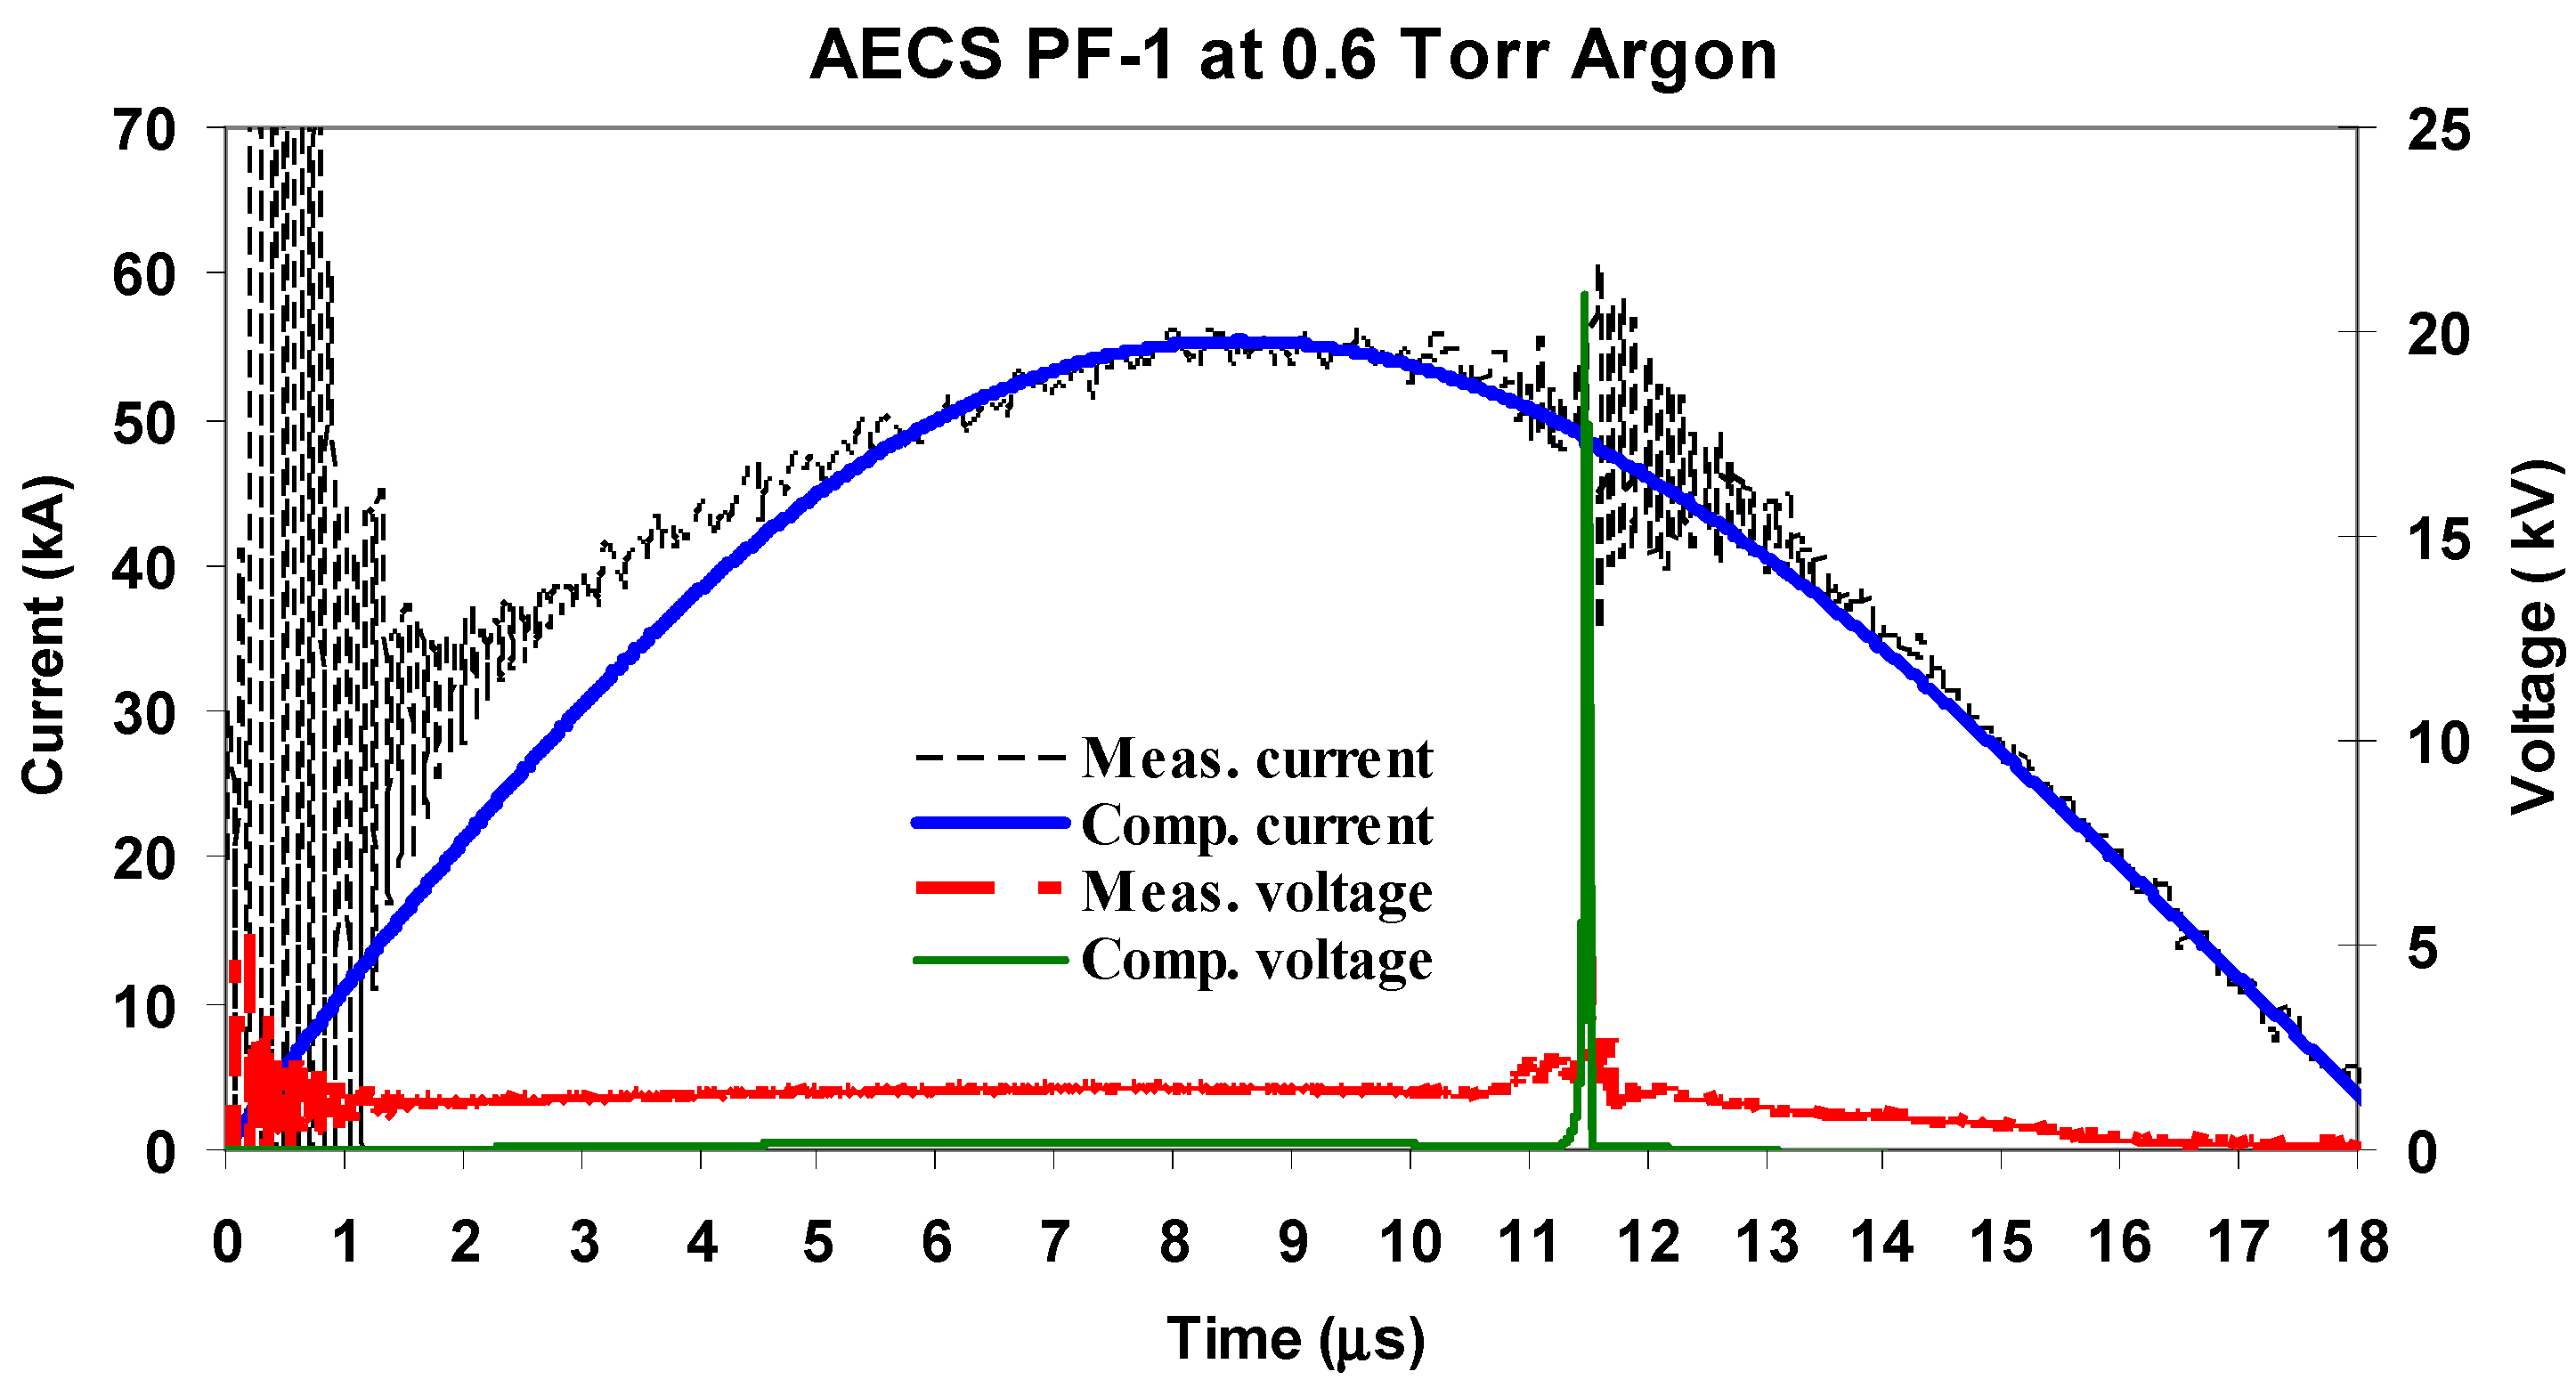
Another example for the fitting procedures is illustrated in Figure 3 for the AECS PF-1 device operated with argon gas. The obtained fitting parameters wereas follows:
Bank: L0 = 1350 nH, C0 = 25 μF, r0 = 46 mΩ;
Tube: b = 3.2 cm, a = 0.95 cm, z0 = 16 cm;
Operational: V0 = 15 kV, p0 = 0.6 Torr for argon gas,
The four model parameters derived from the fitting were fm = 0.09, fc = 0.7, fmr = 0.15, and fcr = 0.7.
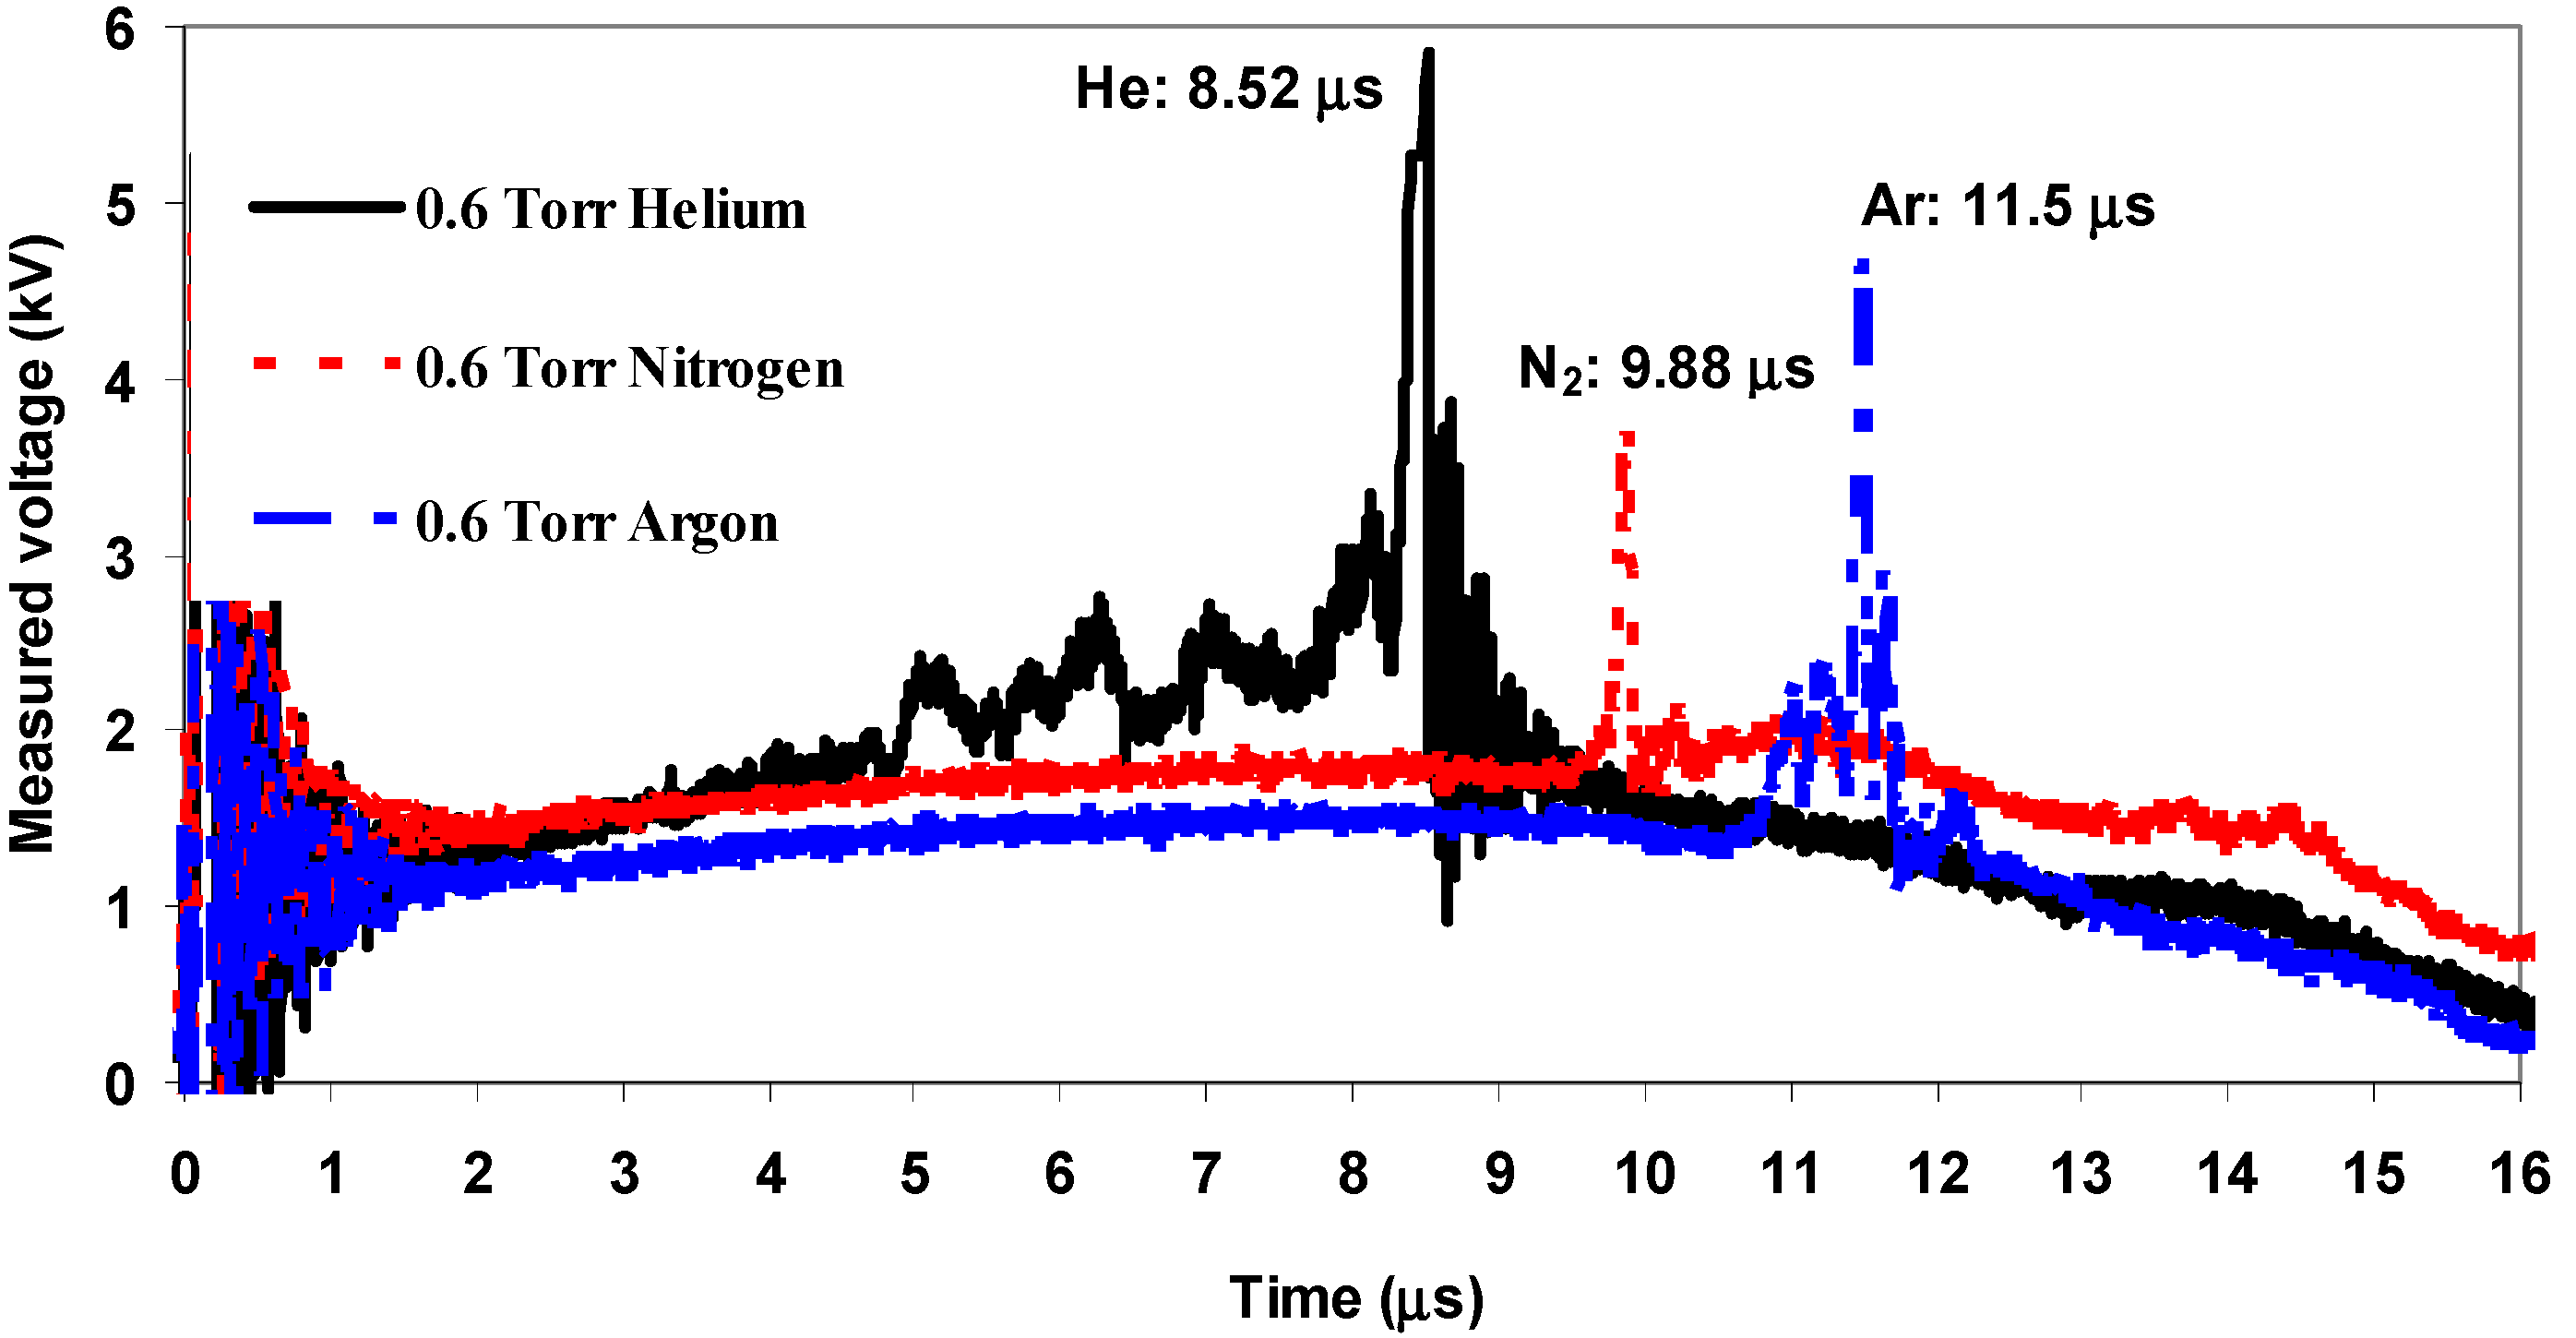
Furthermore, Figure 4 illustrates the measured focusing time using AECS PF-1 at 0.6 Torr for the three studied gases.
In the same manner, applying the adapted version of the Lee model (RADPFV5.15FIB&REB) on the plasma focus device AECS-PF1 (for He, N2, and Ar) and taking into account the fitting procedures, the pinch plasma parameters and the properties of the electron and ion beams were determined for each shot.

3.2. Plasma Parameters Generated in the AECS PF-1 Device

In this study, 36 successful discharges performed on AECS PF-1 were selected for each operational gas, and the demonstrated results represent the mean values of the considered parameters. The plasma parameters generated in AECS PF-1 are presented in Table 2 for the three studied gases. The peak values of the total discharge current Ipeak were 50–55 kA, the pinch currents Ipinch were 34–36 kA, the final pinch radius was0.13 cm for He and it reached a minimum value of 0.03 cm for argon, the pinch length was around 1.4 cm for He and N2 with the highest value (1.65 cm) for argon, and the pinch duration ranged from 11 to 17 ns. The maximum voltage induced by the radially collapsing current sheet Vmax was 5.7 kV, 6 kV, and 22 kV for He, N2, and Ar, respectively. The plasma temperature ranged from 105 eV for N2 to the peak value of 350 eV for He. Moreover, the various speeds were calculated to be as follows for helium: The peak axial speed was Va = 4.5 cm/μs, the shock speed (on-axis) was Vs = 24 cm/μs, and the peak radial piston speed was Vp = 16.5 cm/μs. For nitrogen, Va = 2.5 cm/μs, Vs = 14 cm/μs, and Vp = 10 cm/μs, and the lowest speeds were for argon, Va = 2 cm/μs, Vs = 11 cm/μs, and Vp = 9 cm/μs. The argon plasma focus had a maximum plasma density of 9×10²³ m−3.

3.3. Ion Beam Properties of the AECS PF-1 Device

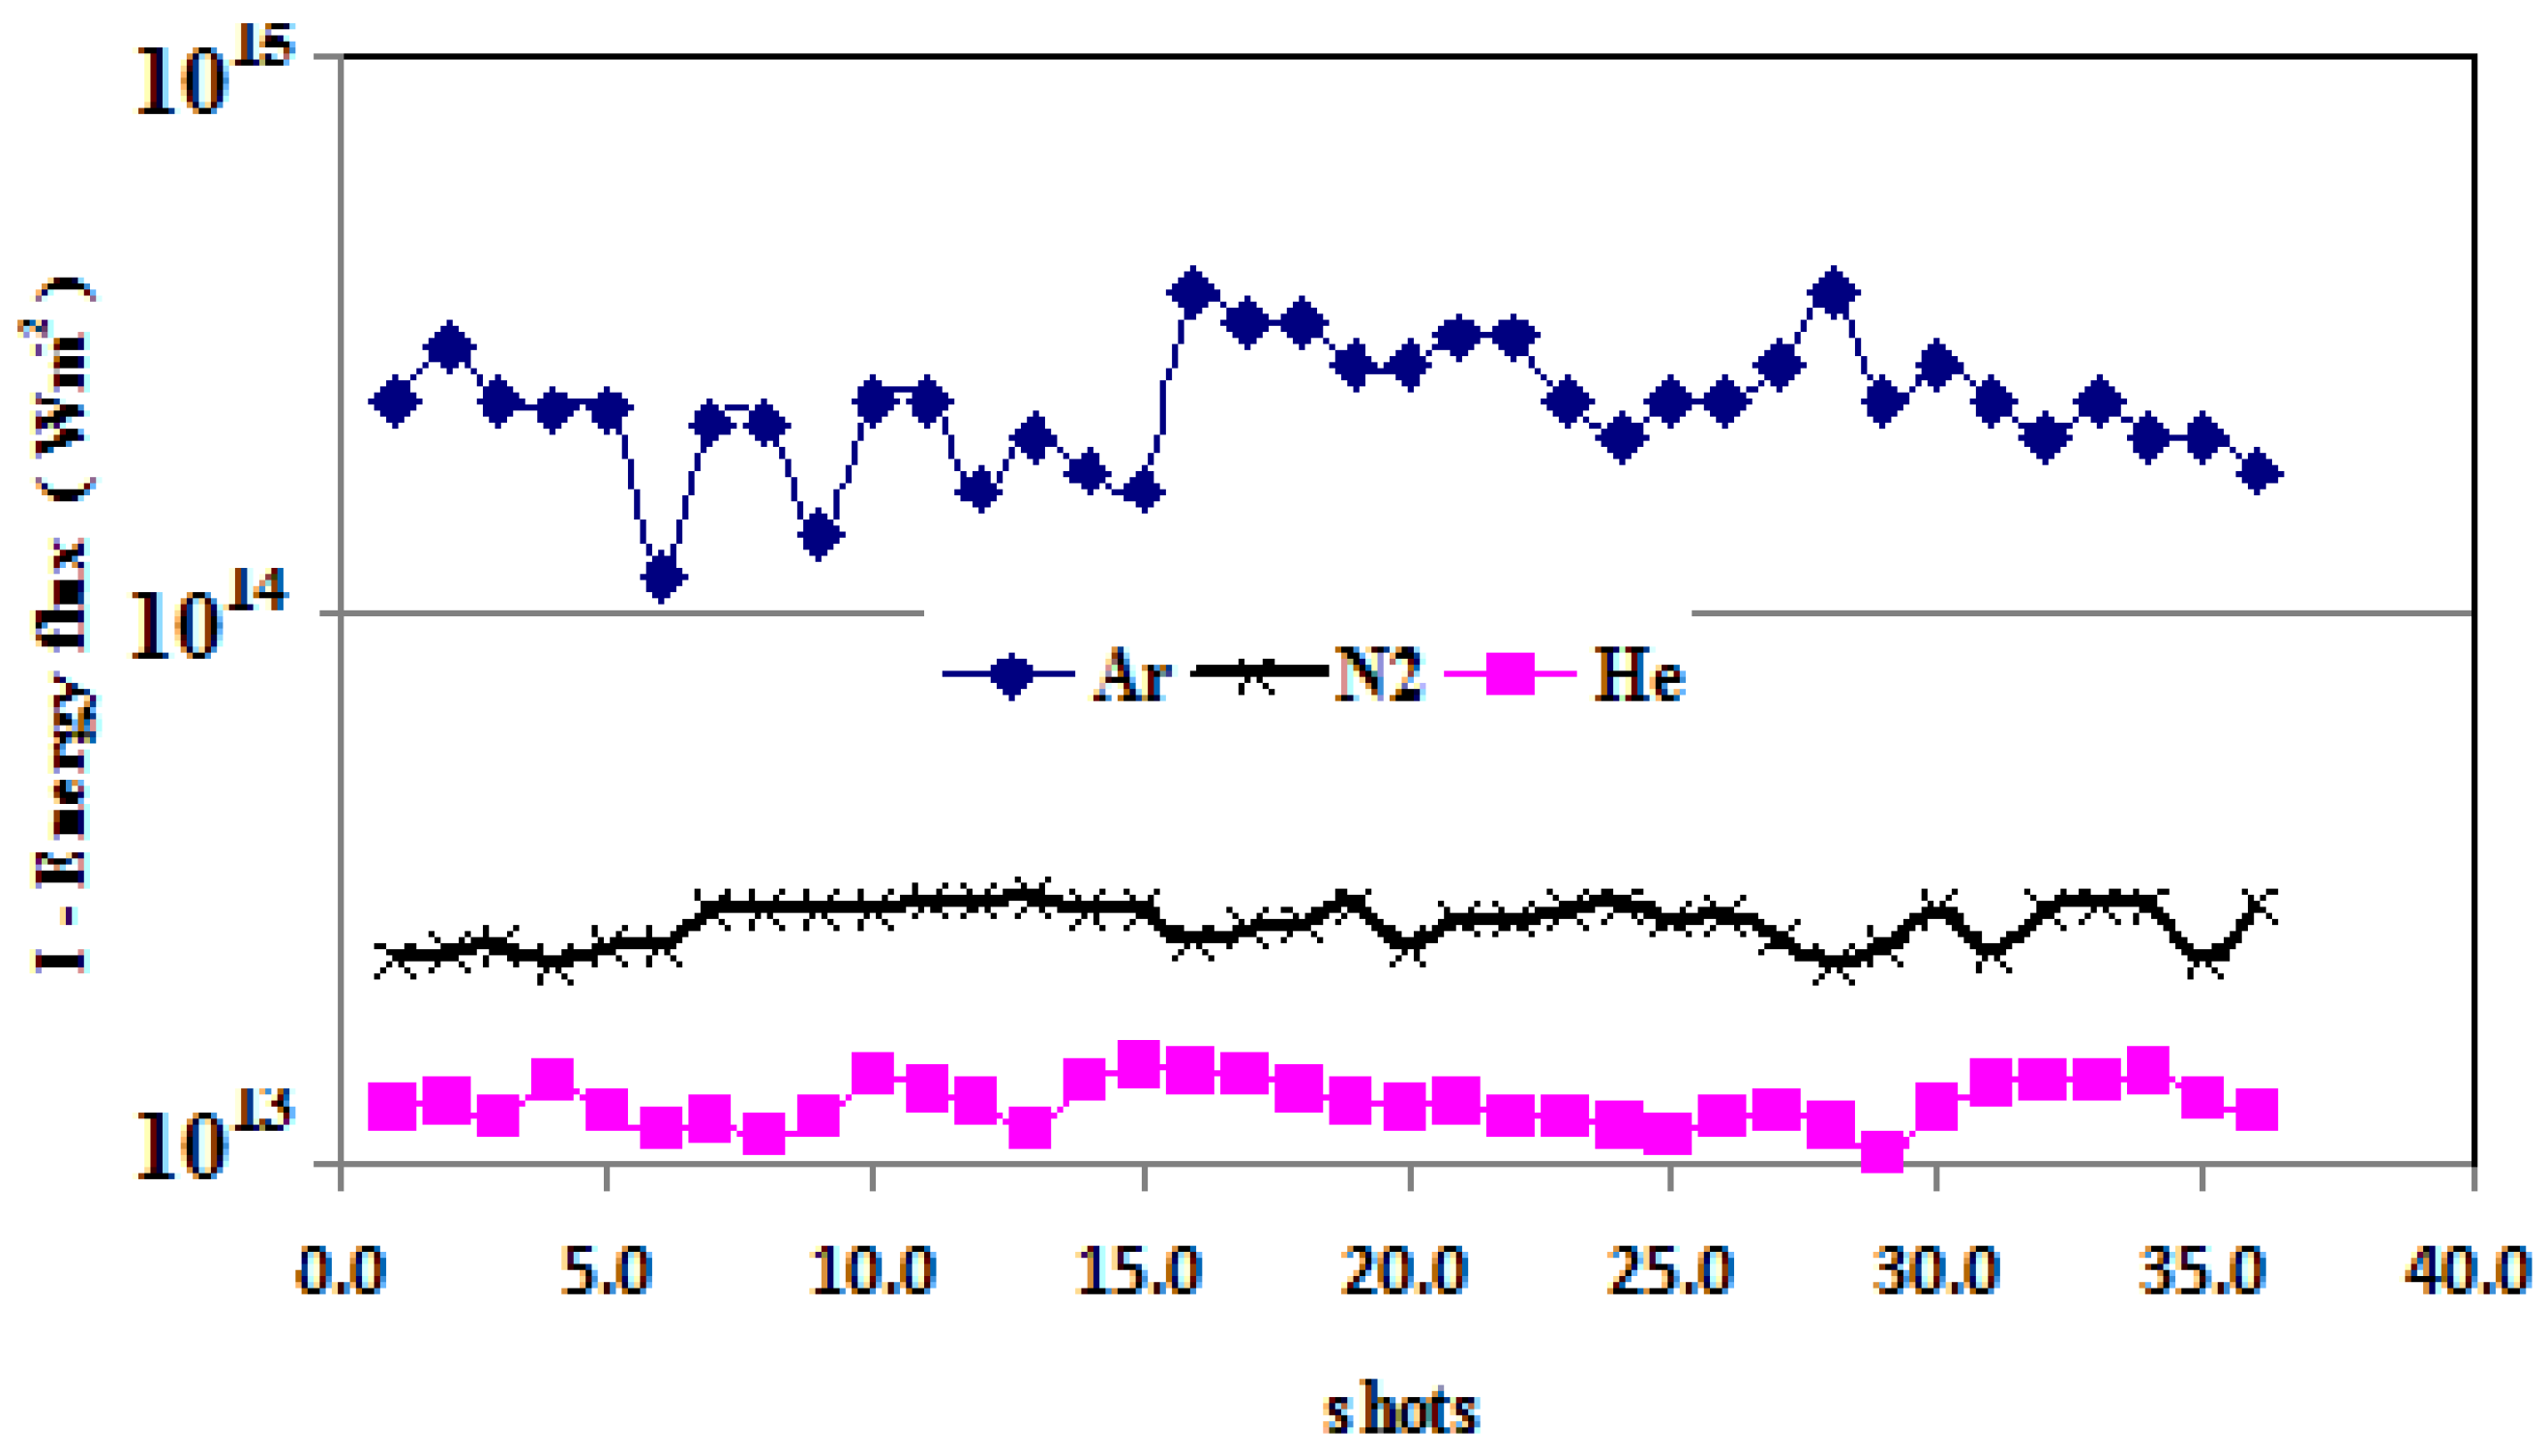
The application of a dense plasma focus device for various material processing utilizes high energy ions. The characterization of these ions is very important, not only for understanding the mechanism of the production of high-energy ions, but also for their applications in different fields, including plasma processing (ion implantation, surface modification, thermal surface treatment, ion assisted coating, device fabrication, thin film deposition, etc.). So, the RADPFV5.15FIB&REB code was used to study the ion beam generated in the AECS PF-1 device using the fitting procedures mentioned above for each plasma focus shot. As an example, Figure 5 and Figure 6 present the ion energy flux and the damage factor for 36 shots.
For the comparison study, the mean values of the considered parameters are illustrated in Table 3. It was noticed that the ion mean energy ranged from 35 keV (for He) to 223 keV (for Ar). The very high ion mean energy (computed by U × Zeff) value of Ar was due to the large diode plasma voltage and high effective charge state Zeff. The results indicate that the ion fluence ranged from 0.2×10²⁰ ions m−2 for nitrogen gas, increasing to the heavier gases until a value of 1.1×10²⁰ ions m−2was achieved for Ar. The ion number ranged from 3.8 × 10¹³ (for Ar) to 1.3 × 10¹⁴ (for He). The beam energy also had an extreme value of 1.34 J (0.05%E0) for argon. The results presented the highest values of 2.4 × 10¹⁴ Wm−2 for the power flow density (heat flux), and adamage factor of around 3.1 × 10¹⁰ Wm−2s0.5 for argon. The large values for argon gas were due to the very small radius ratios of the pinch columns due to the radiative collapse. Plasma focus devices have three typical regimes of influence of ion and plasma beams upon a target material placed downstream of the pinch [23]: (i) “implantation mode” of irradiation when the power flow density of the streams is 109–1011 Wm−2, (ii) screening of the surface by a secondary plasma cloud in the so-called “detachment mode” (≈1011–1012 Wm−2), and (iii) strong damage with the absence of implantation in the “explosive destruction mode” (≈1012–1014 Wm−2). The numerical experiments on the AECS PF-1 device showed that the power flow density ranged from1013–1014 Wm−2 for the studied gases. So, based on the obtained power flow densities, it couldbe said that the explosive destruction mode was dominant for the experimental conditions used. With this method, ion beam and fast plasma stream parameters could be computed for any Mather-type plasma focus operating with different gases.

3.4. Electron Beam Properties of the AECS PF-1 Device

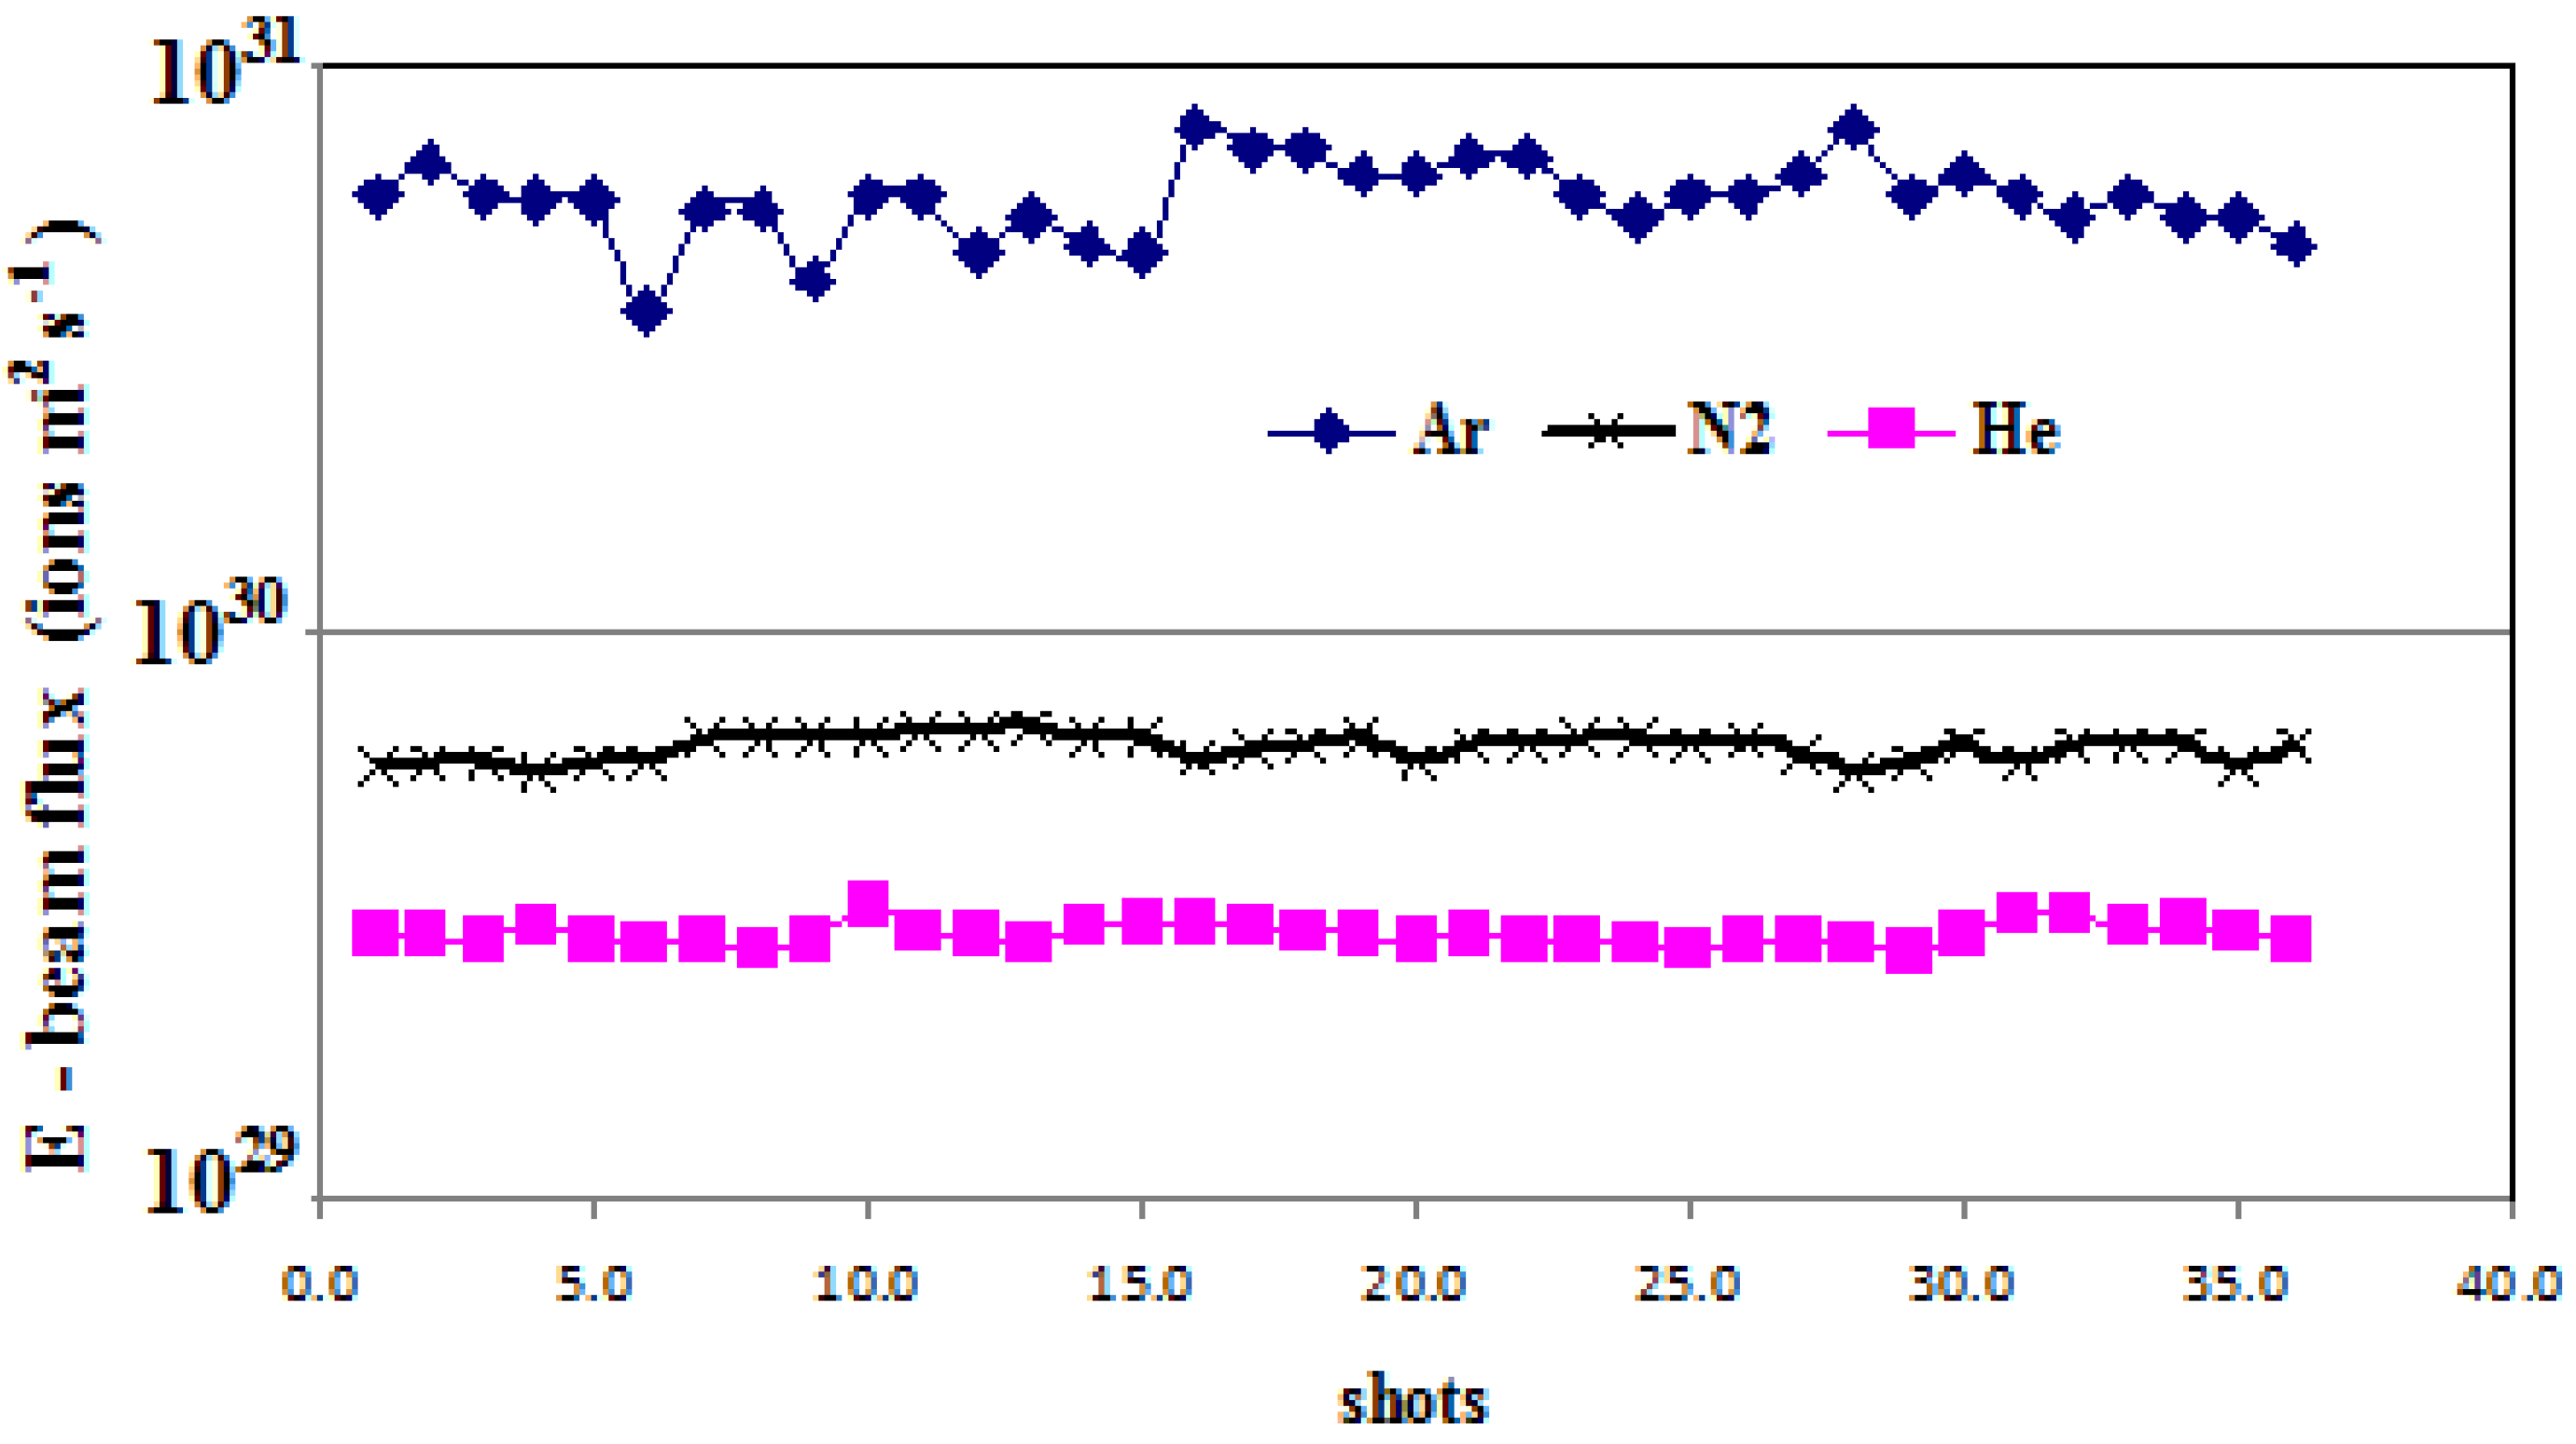
The modified Lee (RADPFV5.15FIB&REB) code also provides information about the electron beam that originates in the pinch plasma of the AECS PF-1 device. For example, Figure 7 and Figure 8 present the electron beam flux and the electron energy for 36 shots.
The mean values of the generated electron beam features for each gas are shown in Table 4. It shows that the fluence and flux increased with the higher atomic number, and reached a peak of 9.7 × 10²² m−2 and 5.9 × 1030 electrons m−2 s−1 for argon, respectively. The electron number ranged from 2.7 × 10¹⁴ (for He) to 5.5 × 10¹⁴ ( for Ar). The beam energy also had a value of 2 J (0.072%E0) for argon, 1.25 J (0.045%E0) for nitrogen, and 0.78 J (0.03%E0) for helium. The results presented the highest values of 2.2 × 10¹⁶Wm−2 for the power flow density (heat flux), and adamage factor of around 3×10¹²Wm−2s0.5at 0.6 Torr of argon due tothe radiatively enhanced compression. The electron currents had values from 3.9 kA for helium (8.12% Ipeak) to 5.2 kA (9.4% of Ipeak) for argon. The kinetic energy of the relativistic electrons was found to be within the range of 18–23 keV.

4. Conclusions

Measurements of the current and voltage waveforms are achieved on the low energy AECS PF-1 plasma focus device with three gases (He, N2, and Ar) around the operational pressure (~0.6 Torr) during the experiments aimed at investigating tin (Sn) deposition on the silicon substrate under various conditions. The Lee model is adapted to the version of RADPFV5.15FIB&REB for studying theformed plasma, as well as the produced ion and electron beams, in one run. The fitting procedures between the measured and computed current waveforms are applied for each shot. Then, numerical experiments are carried out using the Lee model on 36 successful shots for each gas.
The pinch plasma parameters are found to be Ipeak of ~50–55 kA, Ipinch of ~34–36 kA, final pinch radius of ~0.03–0.13 cm, and a pinch duration of ~11–17 ns. The plasma temperature has a peak value of 350 eV for He. The argon plasma focus has a maximum plasma density of 9×10²³ m−3.
It is noticed that the beam ion mean energy ranges from 35 keV (for He) to 223 keV (for Ar), due to the higher diode plasma voltage and Zeff. The ion fluence ranges from 0.2 × 10²⁰ ions m−2 for nitrogen gas, increasing for the heavier gases until a value of 1.1 × 10²⁰ ions m−2 is achieved for Ar. The beam energy also has an extreme value of 1.34 J (0.05%E0) for argon. The highest values of 2.4 × 10¹⁴ Wm−2 for the power flow density and adamage factor of around 3.1 × 10¹⁰ Wm−2s0.5 for argon can be attributed to the very small radius ratios (rp/a) of the pinch columns due to radiative collapse. The power flow density values of an order of 1013–1014 Wm−2 for the studied gases indicate that the explosive destruction mode is dominant for the experimental conditions used.
The fluence and flux values of the generated electron beams increase with the higher atomic number and reach a peak of 9.7 × 10²² m−2and 5.9 × 1030 m−2 s−1 for argon, respectively. The electron number ranges from 2.7 × 10¹⁴ (for He) to 5.5 × 10¹⁴ (for Ar). The beam energy also has a value of 2 J (0.072%E0) for argon, 1.25 J (0.045%E0) for nitrogen, and 0.78 J (0.03%E0) for helium. The highest values of 2.2 × 10¹⁶Wm−2 and 3 × 10¹² Wm−2s0.5 for argon are a result of the radiative collapse effect. The electron currents have values from 3.9 kA for helium (8.12% Ipeak) to 5.2 kA (9.4% of Ipeak) for argon.
Finally, it is worth mentioning that due to the high inductance (1400 nH) and the relatively low peak current (54 kA) of the (2.8 kJ) AECS PF-1 device, the estimations of the ion and electron properties are comparable, but lower than the earlier published values on (20 nH, 400 kA, 2.7 kJ) NX2 [13], (110 nH, 200 kA, 3.4 kJ) INTI PF [26,28] low energy plasma focus devices with a lower inductance and higher maximum current.

Author Contributions

Conceptualization, M.A. (Mohamad Akel); Methodology, M.A. (Mohamad Akel); Software, M.A. (Mohamad Akel), Y.B. and S.S.; Validation, S.A.-H.; formal analysis, M.A. (Mohamad Akel); Investigation, S.A.-H. and M.A. (Muthanna Ahmad); resources, M.A. (Mohamad Akel); Writing—Original draft preparation, M.A. (Mohamad Akel); Writing—Reviewing and Editing, S.A.-H. and M.A. (Muthanna Ahmad). All authors have read and agreed to the published version of the manuscript.

Funding

This research received no external funding.

Institutional Review Board Statement

This study did not require ethical approval.

Acknowledgments

The authors would like to thank the Director General of AECS for the encouragement and permanent support. This work was carried out within the framework of IAEA Research Contract No. SYR-23218 of CRP F43024 (Atomic Data for Vapour Shielding in Fusion Devices).

Conflicts of Interest

The authors declare no conflict of interest.

References

  1. Auluck, S.; Kubes, P.; Paduch, M.; Sadowski, M.J.; Krauz, V.I.; Lee, S.; Soto, L.; Scholz, M.; Miklaszewski, R.; Schmidt, H.; et al. Update on the Scientific Status of the Plasma Focus. Plasma 2021, 4, 450–669. [Google Scholar] [CrossRef]
  2. Hirano, K.; Kaneko, I.; Shimoda, K.; Yamamoto, T. A method for measuring electron energy distribution in a plasma focus. Jpn. J. Appl. Phys. 1990, 29, 1182–1188. [Google Scholar] [CrossRef]
  3. Zhang, T.; Lin, J.; Patran, A.; Wong, D.; Hassan, S.M.; Mahmood, S.; White, T.; Tan, T.L.; Springham, S.V.; Lee, S.; et al. Optimization of a plasma focus device as an electron beam source for thin film deposition. Plasma Sources Sci. Technol. 2007, 16, 250–256. [Google Scholar] [CrossRef]
  4. Khan, M.Z.; Lim, L.K.; Yap, S.L.; Wong, C.S. Imperative function of electron beams in low-energy plasma focus device. Pramana J. Phys. 2015, 85, 1–3. [Google Scholar] [CrossRef]
  5. Khan, M.Z.; Ling, Y.S.; Yaqoob, I.; Kumar, N.N.; Kuang, L.L.; San, W.C. Effects of different mineral admixtures on the properties of fresh concrete. Scient. World J. 2014, 2014, 240729. [Google Scholar] [CrossRef] [PubMed]
  6. Tartari, A.; Da, A.R.; Bonifazzi, C.; Marziani, M. Formation of Nano-Crystalline Phase in Hydrogenated Amorphous Silicon Thin Film by Plasma Focus Ion Beam Irradiation. Nucl. Instrum. Methods Phys. Res. B 2004, 213, 206–209. [Google Scholar] [CrossRef]
  7. Jakubowski, L.; Sadowski, M.J. Hot-spots in plasma-focus discharges as intense sources of different radiation pulses. Braz. J. Phys. 2002, 32, 187–192. [Google Scholar] [CrossRef]
  8. Pouzo, J.; Acuna, H.; Milanese, M.; Moroso, R. Relativistic electron beams detection in a dense plasma focus. Eur. Phys. J. D 2002, 21, 97–100. [Google Scholar] [CrossRef]
  9. Patran, A.; Stoenescu, D.; Rawat, R.S.; Springham, S.V.; Tan, T.L.; Tan, L.C.; Rafique, M.S.; Lee, P.; Lee, S. A magnetic electron analyzer for plasma focus electron energy distribution studies. J. Fusion Energy 2006, 25, 57–66. [Google Scholar] [CrossRef]
  10. Lee, S.; Saw, S.H.; Ali, J. Numerical experiments on radiative cooling and collapse in plasma focus operated in krypton. J. Fusion Energy 2013, 32, 42–49. [Google Scholar] [CrossRef]
  11. Akel, M.; Lee, S. Radiative Collapse in Plasma Focus Operated with Heavy Noble Gases. J. Fusion Energy 2013, 32, 111–116. [Google Scholar] [CrossRef]
  12. Akel, M.; Lee, S.; Saw, S.H. Numerical Experiments in Plasma Focus Operated in Various Gases. IEEE Trans. Plasma Sci. 2012, 40, 3290–3297. [Google Scholar] [CrossRef]
  13. Lee, S.; Saw, S.H. Plasma focus ion beam fluence and flux—For various gases. Phys. Plasmas 2013, 20, 062702. [Google Scholar] [CrossRef]
  14. Tariq, H.A.R.; Khan, I.A.; Ikhlaq, U.; Hussnain, A. Variation of ion energy flux with increasing working gas pressures using faraday cup in plasma focus device. J. Nat. Sci. Math. 2008, 48, 65–72. [Google Scholar]
  15. Hassan, M.; Qayyum, A.; Ahmad, R.; Murtaza, G.; Zakaullah, M. Nitriding of titanium by using an ion beam delivered by a plasma focus. J. Phys. D Appl. Phys. 2007, 40, 769. [Google Scholar] [CrossRef]
  16. Mohanty, S.R.; Neog, N.K.; Bhuyan, H.; Rout, R.K.; Rawat, R.S.; Lee, P. Effect of anode designs on ion emission characteristics of a plasma focus device. Jpn. J. Appl. Phys. 2007, 46, 3039. [Google Scholar] [CrossRef]
  17. Kelly, H.; Lepone, A.; Marquez, A.; Sadowski, M.J.; Baranowski, J.; Skladnik-Sadowska, E. Analysis of the nitrogen ion beam generated in a low-energy plasma focus device by a Faraday cup operating in the secondary electron emission mode. IEEE Trans. Plasma Sci. 1998, 26, 113. [Google Scholar] [CrossRef]
  18. Sohrabi, M.; Habibi, M.; Yousefi, H.R.; Roshani, G.H. Angular Distribution Analysis of Nitrogen Ions in a Low Energy Dense Plasma Focus Device. Contrib. Plasma Phys. 2013, 53, 3. [Google Scholar] [CrossRef]
  19. Feugeas, J.N.; Sanchez, G.; De Gonzalez, C.; Hermida, J.D.; Scordia, G. Pulsed ion implantation of nitrogen in pure titanium. Rad. Rad. Eff. Defects Solids 1993, 25, 1. [Google Scholar]
  20. Habibi, M. Angular distribution of ion beam emitted from a 3.5 kJ plasma focus device using different shapes of anodes. Phys. Lett. A 2016, 380, 439–443. [Google Scholar] [CrossRef]
  21. Lee, S. Radiative Dense Plasma Focus Computation Package: RADPF. Available online: https://www.plasmafocus.net (accessed on 13 December 2021).
  22. Gribkov, V.A.; Banaszak, A.; Bienkowska, B.; Dubrovsky, A.V.; Ivanova-Stanik, I.; Jakubowski, L.; Karpinski, L.; Miklaszewski, R.A.; Paduch, M.; Sadowski, M.J.; et al. Plasma dynamics in the PF-1000 device under full-scale energy storage: II. Fast electron and ion characteristics versus neutron emission parameters and gun optimization perspectives. J. Phys. D Appl. Phys. 2007, 40, 3592–3607. [Google Scholar] [CrossRef] [Green Version]
  23. Pimenov, V.N.; Elena, V.; Demina, S.A.; Maslyaev, L.; Ivanov, I.; Vladimir, A.; Gribkov, A.V.; Dubrovsky, Ü.; Ugaste, T.; Laas, M.S.; et al. Damage and modification of materials produced by pulsed ion and plasma streams in Dense Plasma Focus device. Nukleonika 2008, 53, 111–121. [Google Scholar]
  24. Lee, S.; Saw, S.H. Plasma focus ion beam fluence and flux—Scaling with stored energy. Phys. Plasmas 2012, 19, 112703. [Google Scholar] [CrossRef]
  25. Akel, M.S.; Salo, A.; Saw, S.H.; Lee, S. Properties of Ion Beams Generated by Nitrogen Plasma Focus. J. FusionEnergy 2014, 33, 189–197. [Google Scholar] [CrossRef]
  26. Akel, M.S.; Salo, A.; Saw, S.H.; Lee, S. Ion Beam Features Produced by Two Plasma Focus Machines Operated with Different Gases. IEEE Trans. Plasma Sci. 2014, 42, 2202–2206. [Google Scholar] [CrossRef]
  27. Akel, M.S.; Salo, A.; Saw, S.H.; Lee, S. Electron Beam Properties Emitted From Deuterium Plasma Focus: Scaling Laws. IEEE Trans. Plasma Sci. 2017, 45, 2303–2307. [Google Scholar] [CrossRef]
  28. Akel, M.; AL-Hawat, S.; Lee, S.; Saw, S.H. Characterization of electron beams emitted from dense plasma focus machines using argon, neon and nitrogen. Mod. Phys. Lett. B 2018, 32, 1850397. [Google Scholar] [CrossRef]
  29. Al-Hawat, S. Axial velocity measurement of current sheath in a plasma focus device using a magnetic probe. IEEE Trans. Plasma Sci. 2004, 32, 764–769. [Google Scholar] [CrossRef]
  30. Al-Hawat, S.; Soukieh, M.; Abou Kharoub, M.; Al-Sadat, W. Using Mather-type plasma focus device for surface modification of AISI304 steel. Vacuum 2010, 84, 907. [Google Scholar] [CrossRef]
  31. Al-Hawat, S.; Akel, M.; Saw, S.H.; Lee, S. Model parameters vs. gas pressure in two different plasma focus devices operated in Argon and Neon. J. Fusion Energy 2012, 31, 13–20. [Google Scholar] [CrossRef]
  32. Lee, S. Plasma focus radiative model: Review of the Lee model code. J. Fusion Energy 2014, 33, 319–335. [Google Scholar] [CrossRef]
Figure 1. (a)The major parts of plasma focus device. (b)Equivalent electrical circuit of the plasma focus device, where Lp and rp are the inductance and resistance of the plasma, respectively.
Plasma 05 00014 g001
Figure 2. The measured and computed waveforms of the current and voltage in the AECS PF-1 plasma focus device at p0 = 0.6 Torrofhelium.
Plasma 05 00014 g002
Figure 3. The measured and computed waveforms of the current and voltage in the AECS PF-1 plasma focus device at p0 = 0.6 Torr of argon.
Plasma 05 00014 g003
Figure 4. The focusing time in AECS PF-1 plasma focus device at p0 = 0.6 Torr for He, N2 and Ar gases.
Plasma 05 00014 g004
Figure 5. AECS PF-1 ion energy flux for 36 shots at 0.6 Torr for He, N2, and Ar gases.
Plasma 05 00014 g005
Figure 6. AECS PF-1 damage factor for 36 shots at 0.6 Torr for He, N2, and Ar gases.
Plasma 05 00014 g006
Figure 7. AECS PF-1 electron beam flux for 36 shots at 0.6 Torr for He, N2, and Ar gases.
Plasma 05 00014 g007
Figure 8. Electron energy for 36 shots of AECS PF-1 at 0.6 Torr for He, N2, and Ar gases.
Plasma 05 00014 g008
Table 1. The technical parameters of AECS-PF1plasma focus device.
Operating ParametersDescription
Capacitance25 µF
Operating charging voltage15 kV
Stored energy (E0)2.8 kJ
Peak discharge current54 kA
Inductance of circuit1400 nH
Anode length16 cm
Anode radius0.95 cm
Cathode radius3.2 cm
Rise time of the current~10 μs
Working gasesNitrogen, argon, and helium
Table 2. Average plasma focus parameters of the AECS PF-1 device at 0.6 Torr during the experiments.
AECS PF-1HeN2Ar
Average of 36 ShotsAverage of 36 ShotsAverage of 36 Shots
Peak current Ipeak (kA)505355
Pinch current Ipinch (kA)343634
Plasma temperature Te, (eV)350105126
pinch radius rp (cm)0.130.090.03
Length of the pinch zp (cm)1.41.351.65
Pinch duration τ (ns)11.213.817
Induced voltage Vmax (kV)5.7621.7
Plasma density Ni (×1023 m−3)0.72.39.1
The peak axial speed Va (cm/μs)4.52.52.1
The shock speed Vs (cm/μs)2414.411.4
The peak radial piston speed Vp (cm/μs)16.510.29
Table 3. Average ion beam characteristics of the AECS PF-1 device at 0.6 Torr for N2, Ar, and He.
AECS PF-1HeN2Ar
Average of 36 ShotsAverage of 36 ShotsAverage of 36 Shots
Ion beam(IB) fluence (×1020 m−2)0.30.221.1
Ion flux (×1027 m−2 s−1)2.41.66.6
Ion energy (keV)35105223
En fluence (×106 J m−2)0.140.374.1
En flux (×1014 Wm−2)0.130.272.4
Ion number (×1013)136.23.8
IB energy (J)0.751.051.34
IB energy (%E0)0.0250.040.05
IB current (kA)3.84.13.6
IB current (%Ipeak)87.756.5
IB curr. den. (×1010 A m−2)0.10.151.1
Damage factor (×1010 Wm−2s0.5)0.140.323.1
Table 4. Average electron beam characteristics of the AECSPF-1 device.
AECS PF-1HeN2Ar
Average of 36 ShotsAverage of 36 ShotsAverage of 36 Shots
Electron beam (EB) fluence (×1022 m−2)0.350.869.7
EB flux (×1030 m−2 s−1)0.30.625.9
The kinetic energy of the relativistic electrons Erel (keV)1819.523.1
Energy fluence (×108 J m−2)0.10.273.73
Energy flux (Heat flux) (×1016 Wm−2)0.090.22.2
Electron number (×1014)2.73.995.48
EB energy (J)0.781.252
EB energy (%E0Stored energy)0.0280.0450.072
EB current (kA)3.94.65.2
EB current (%Ipeak)8.128.789.36
EB curr. den. (×1011 A m−2)0.4719.4
Damage factor (×1012 Wm−2 s0.5)0.12.32.87
Publisher’s Note: MDPI stays neutral with regard to jurisdictional claims in published maps and institutional affiliations.