Article

Parametric Studies of a Mercury-Free DBD Lamp

1
Laboratoire Diagnostics Des Plasmas Hors Equilibre (DPHE), INU Champollion, 81000 Albi, France
2
Laboratoire Laplace, UMR 5213, Université Paul Sabatier, 31062 Toulouse, France
*
Author to whom correspondence should be addressed.
Plasma 2021, 4(1), 82-93; https://doi.org/10.3390/plasma4010006
Submission received: 4 November 2020 / Revised: 21 January 2021 / Accepted: 1 February 2021 / Published: 4 February 2021
(This article belongs to the Special Issue Dielectric Barrier Discharges)

Abstract

:
Mercury discharge lamps are often used because of their high efficiency; however, the usage of mercury lamps will be restricted or forbidden for safety and environmental purposes. Finding alternative solutions to suppress mercury is of major interest. The aim of this work is to increase the luminous efficacy of a commercial-free mercury flat dielectric barrier discharge lamp (Planilum, St Gobain) in order to reach the necessary conditions for the lamp to be used as a daily lighting source. The lamp is made of two glass plates separated by a gap of 2 mm. The gap is filled by a neon xenon mixture. The external electrodes made of transparent ITO (indium tin oxide) are deposited on the lamp glass plates. The electrical signal applied to the electrodes generates a UV-emitting plasma inside the gap. Phosphors deposited on the glass allow the production of visible light. The original electrode geometry is plane-to-plane; this induces filamentary discharges. We show that changing the plane-to-plane geometry to a coplanar geometry allows the plasma to spread all over the electrode surface, and we can reach twice the efficacy of the lamp (32 lm/W) as compared to the original value. Using this new electrode geometrical configuration and changing the electrical signal from sinusoidal to a pulsed signal greatly improves the visual uniformity of the emitted light all over the lamp. Electrical and optical parametric measurements were performed to study the lamp characteristics. We show that it is possible to develop a free mercury lamp with an efficacy compatible with lighting purposes.

1. Introduction

Due to its high environmental toxicity [1,2], it is envisaged to suppress the use of mercury for industrial applications. Since 2005, the European community has clearly defined “a community strategy on mercury”. It is leading to several decrees modifying the mercury’s status and limiting its use. Especially with the RoHS directive “Restriction of the use of certain hazardous substances in electrical and electronic equipment” which tends to restrict its use inside electronic devices; the directive 2012/19/EU of the European Parliament and of the Council of 4 July 2012 on waste electrical and electronic equipment (WEEE) sets up procedures for the collection and treatment of mercury-containing devices. Very recently, pursuant to directive 2009/125/EC of the European Parliament, the Commission Regulation 2919/2020 of 1 October 2019 established a laying down ecodesign requirement for light sources for upcoming years.
A few free mercury lighting sources are actually potential candidates to replace mercury lamps as solid-state lighting (SSL) with inorganic light-emitting diode (LED) technology or organic light-emitting diode (OLED) [3,4,5,6].
The work presented here fits into this process through the development of a flat free mercury lamp. Our choice to suppress mercury has been to use a rare gas mixture (neon–xenon) with sustainable and green development considerations. The main difficulty is to reach an efficiency high enough to compete with mercury lamps.
In this paper, electrical (current and voltage measurements) and optical studies (luminance mapping and luminous efficacy) have been performed to characterize a large flat (0.2 m2), free mercury, dielectric barrier discharge (DBD) lamp.
The aim is to obtain a uniform light source with an efficacy compatible with lighting applications.
We have shown that it was possible, changing the signal waveform and changing the electrode geometry configuration to reach these two goals, uniformity and efficacy.

2. Materials and Methods
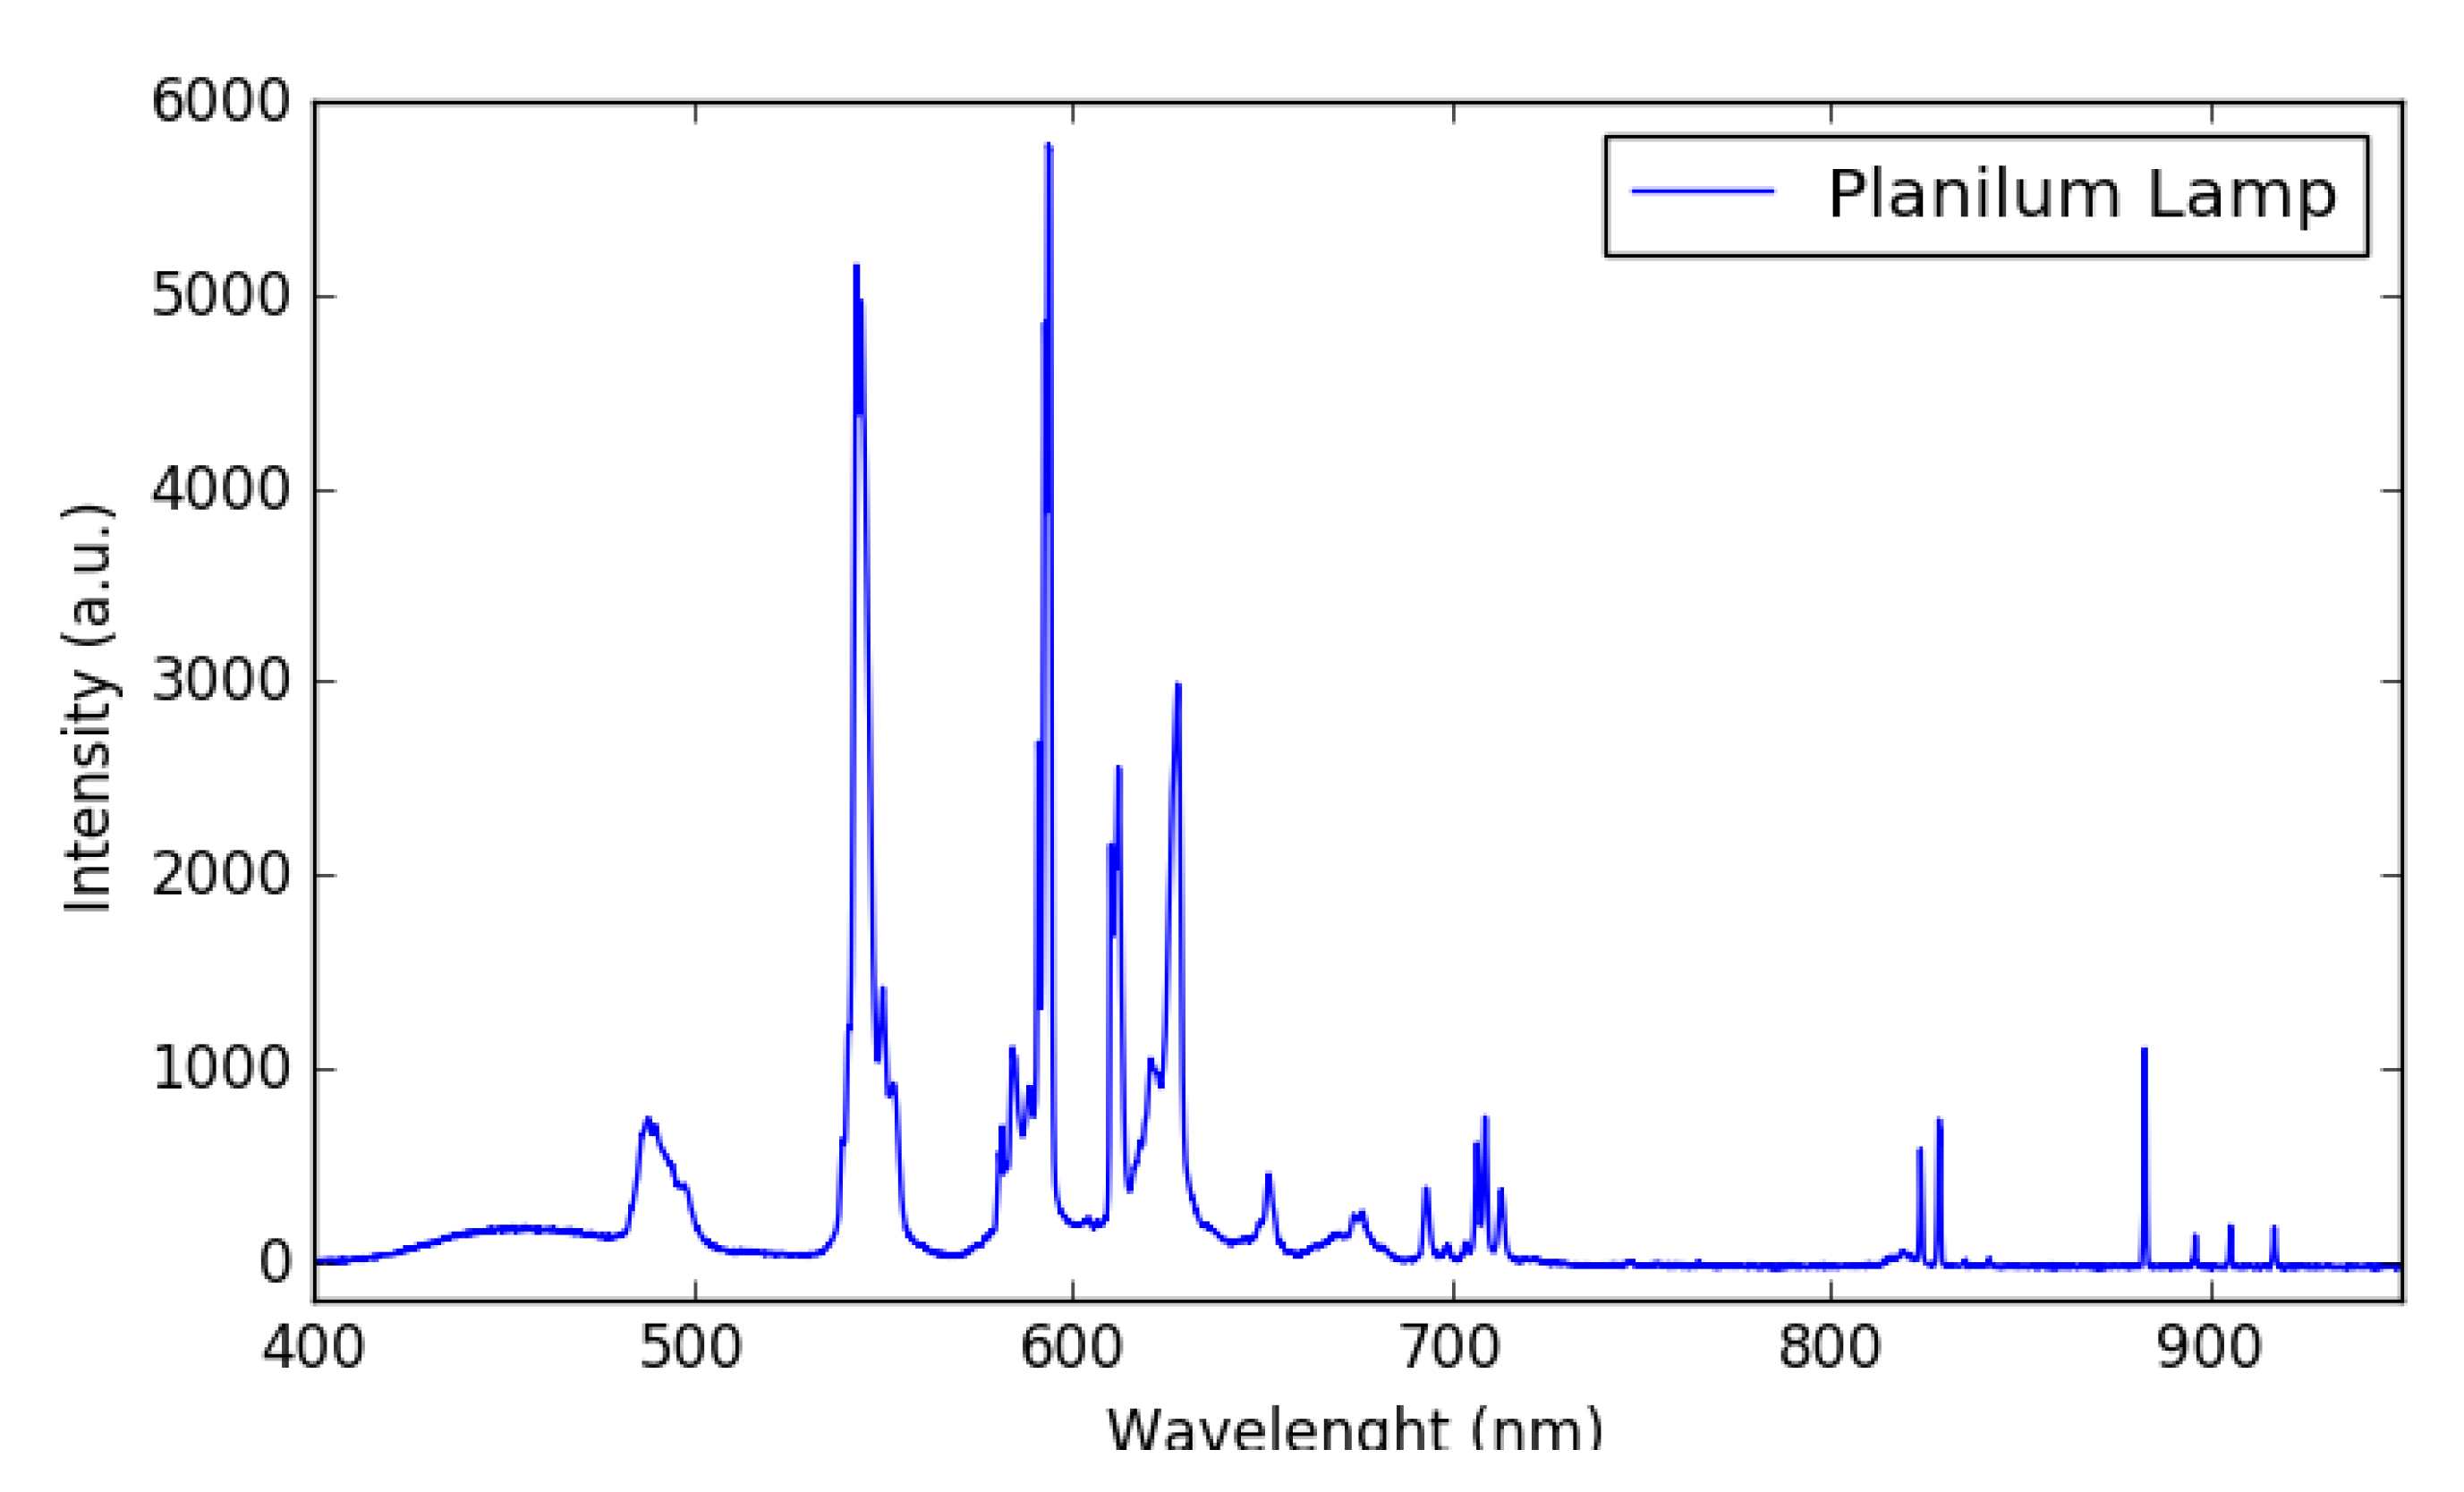
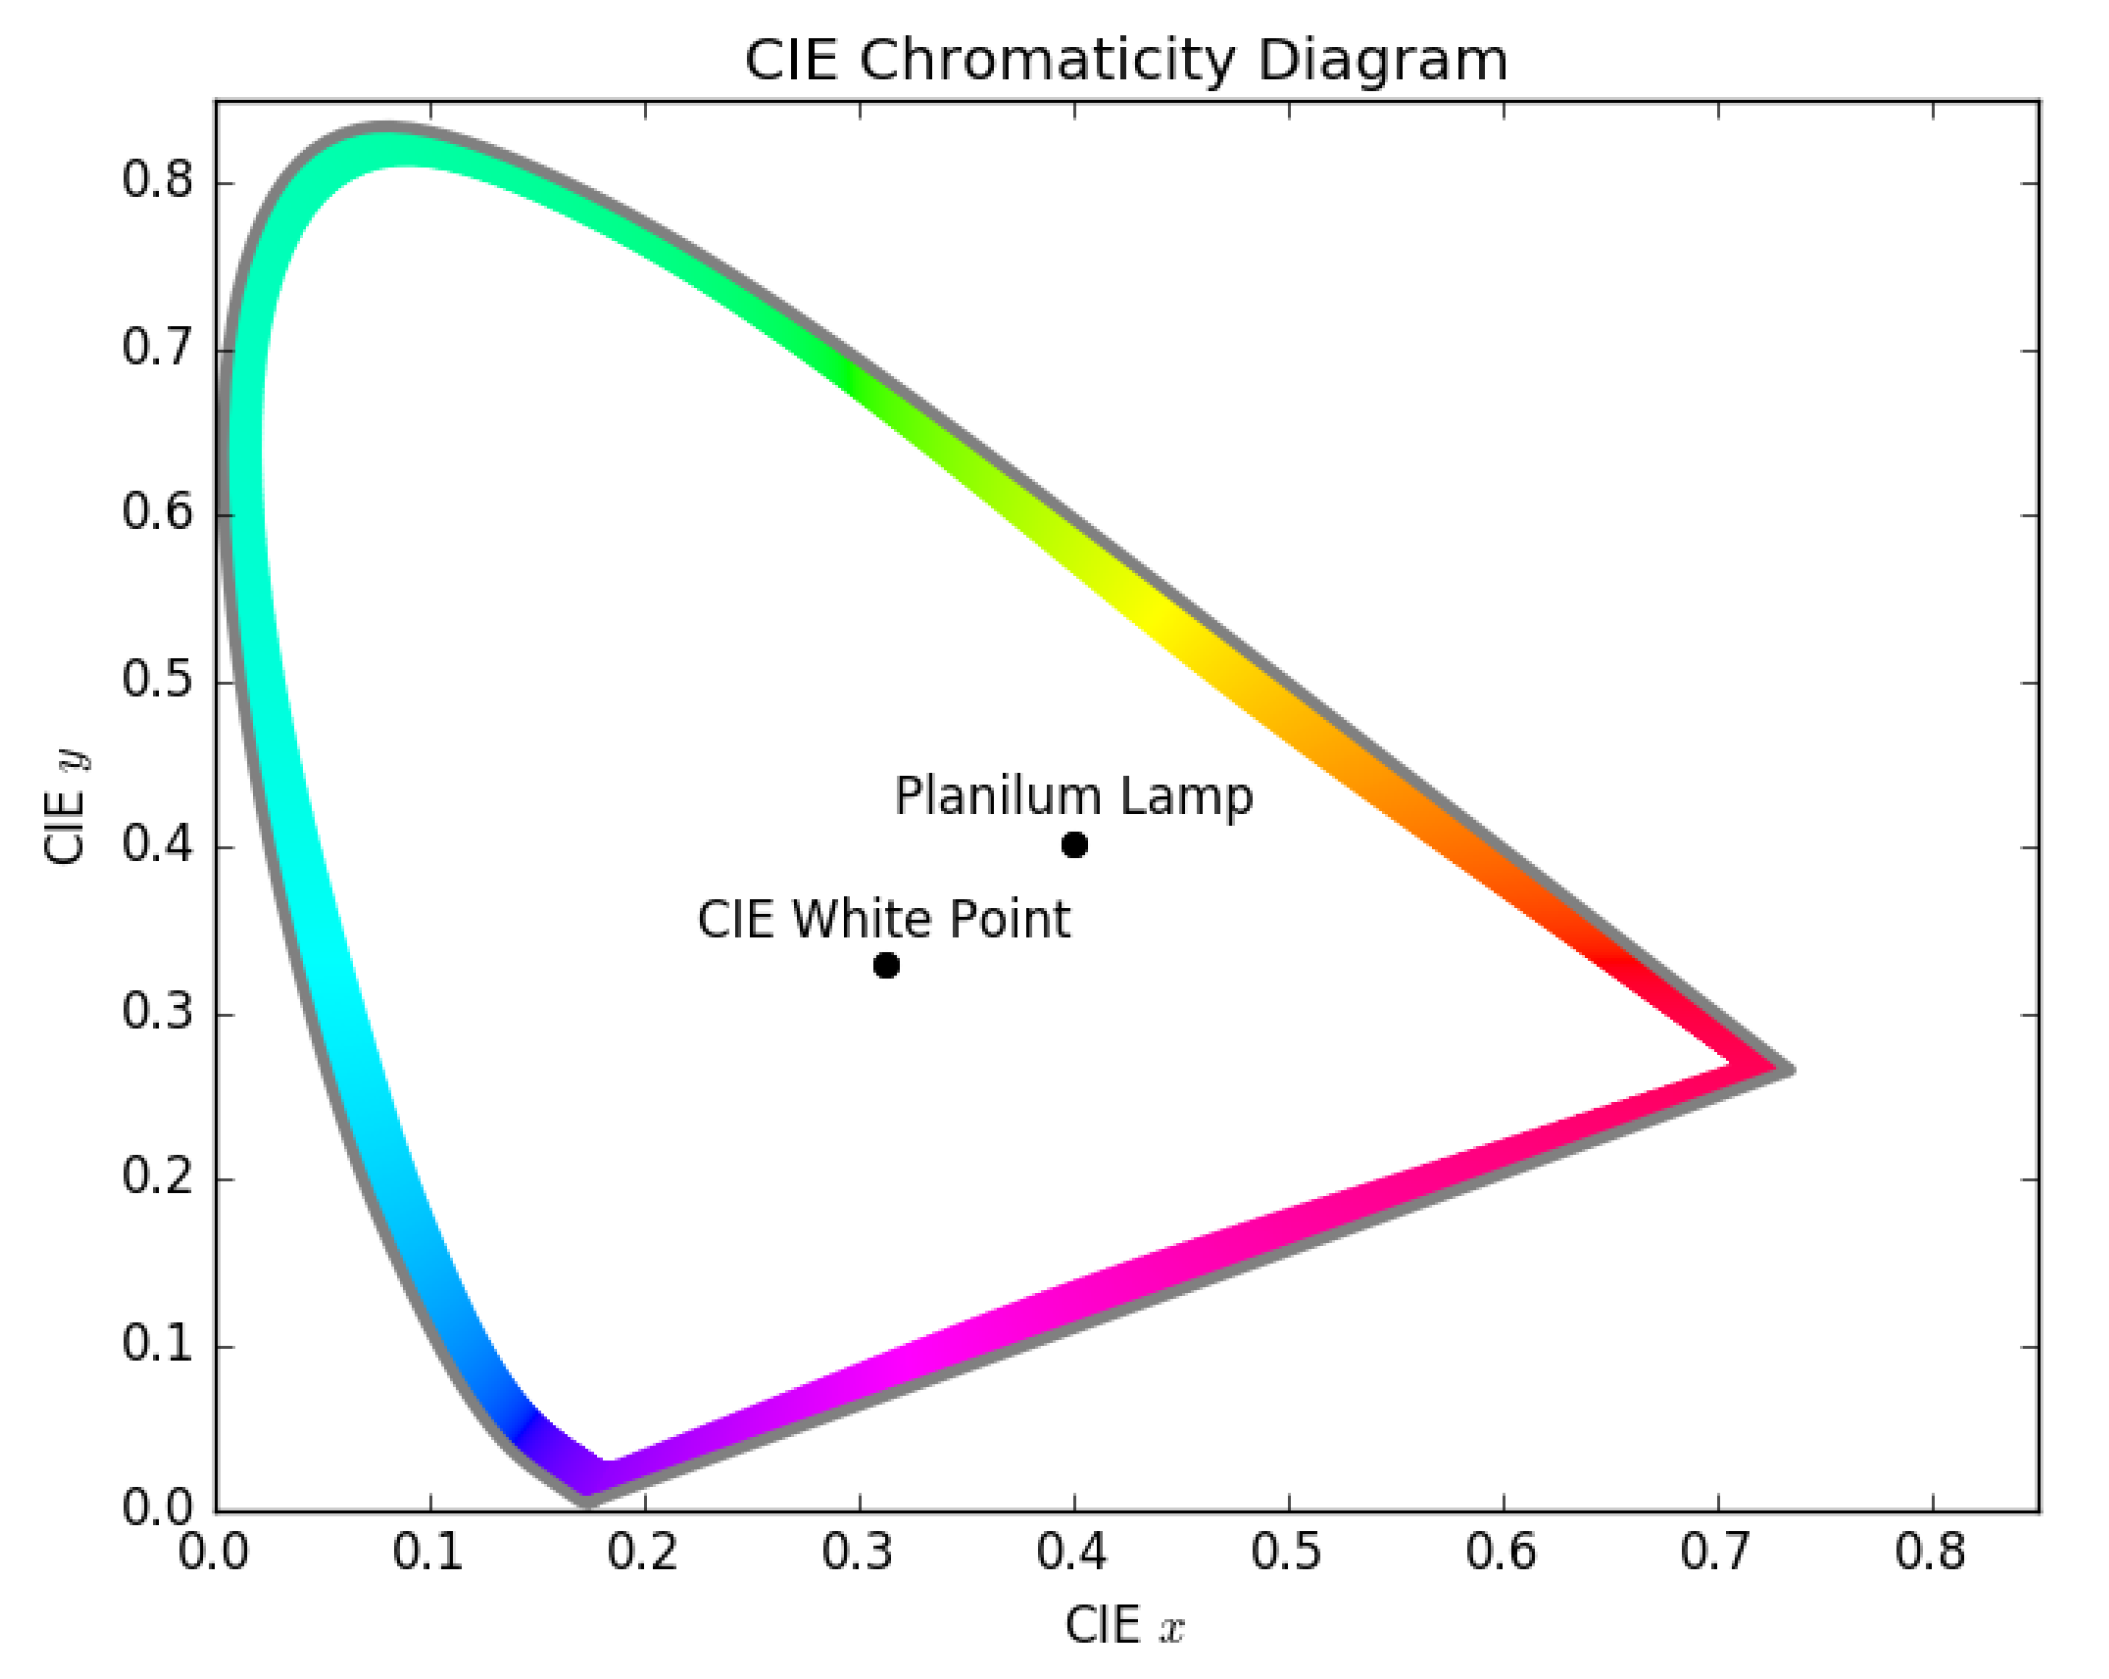
2.1. Planilum Lamp

The Planilum lamp is a dielectric barrier discharge (DBD) lamp. Two “Planilux” glass plates (3.15 mm thickness transparent clear glass with 90% light transmission with a floating process called “PLX” play the role of a dielectric (Figure 1). A gap of two millimeters between the two glass plates is obtained by using spacers all over the surface. Spacers are glass spheres (2 mm diameter), uniformly distributed all over the surface, every 3 cm. They allow to maintain a constant gap between the two glass plates and improve the mechanical resistance of the lamp: the pressure inside the lamp is lower than atmospheric pressure. The gas filling in the standard case is done with a 50% neon–xenon mixture at 250 mbar. On the internal surface, a phosphor layer is deposited by spray coating with a patterned design. The phosphor layer is made of a mixture of three phosphors: red (Y,Gd)BO3:Eu, green LaPO4:Ce,Tb and blue BaMg2Al166O27:Eu. Transparent electrodes are on the outer surface. The plasma inside the gap is produced by applying a high voltage (1500–2000 V) between the electrodes. The plasma considered in this study is a vacuum ultraviolet (VUV) emitter [7,8] (147–173 nm), the VUV emission is converted by the phosphor layer onto a visible emission light passing through the phosphor and glass layers toward the exterior. These flat Planilum lamps are part of a recent trend of lighting sources that integrate the light source and the lamp (Figure 1). The lighting surface is 36 × 46 cm, as the lamp is 60 × 60 cm.

2.2. Experimental Studies

For the electrical and optical measurements, we performed 10 replicates. For luminance and efficacy, we get a standard deviation of 10%.

Standard Case

The commercial case is a lamp powered by a 2000 V sinusoidal wave at a 20 kHz fixed frequency. A resonant power supply is used. For domestic lighting, few frequencies are allowed in order to avoid flickering; the frequencies used are from 20 kHz to 60 kHz. For these frequencies, the output signal has no impact on flickering and no sanitary or biological impact on human safety. The reference structure is a plane-to-plane electrode configuration. The electrodes are deposited all over the glass plate surface.
In this study, an adjustable power supply from 10 to 100 kHz with inductive adaptation is used. Under these standard conditions, as is shown in Figure 2, the luminance from the lamp surface is not uniform. To the naked eye, numerous moving dots are observed. These dots are due to filamentary discharges formed inside the gap and normal to the surface. As the measurements are made on top of the lamp, only the head of the filament can be observed. Filaments are temporally desynchronized spatially moving. These filaments produce a swarming surface during operation. Figure 2 shows the lamp current and voltage distribution as a function of time. Each period we can see two strong current peaks detaching from the capacitive current. Inside each current peaks, numerous discharges take place.
Figure 2 (right) shows the luminance measurement; all the visible lines emission are integrated. There are no drastic changes for other frequencies. To determine the efficacy, the lamp voltage and current are measured. We then can have access to the mean consumed power and luminance (Figure 2). This allows the evaluation of the lamp’s luminous flux. The lamp emission is Lambertian. The 2D luminance measurements are performed by a Rollei d30-flex luminance meter from LMK. The LMK2000 software gives a 2D mapping of the luminance as well as its cross-section. A 12 lm/W efficacy for the Planilum lamp from Saint Gobain Recherche (SGR), Paris, France, with standard conditions is obtained.
Spectra measurements confirm the discrete emission of the lamp (Figure 3). The optical spectrum allows getting the color temperature of the light. Most visible light comes from the three phosphors. Some Infrared emissions come from the discharge itself, like the 823 and 828 nm from xenon and neon. From the spectroradiometer Spec BIOS 1211UV, the CIE 1931 chromaticity diagram, the color temperature and the color rendering index (CRI) could be determined as shown in Figure 4. The CRI is 83.80.5 and the color temperature 3330 ± 20 K. The objective of the manufacturer (SGR) is 3500 K, but during the first 300 h, there is a slight shift from 100% to 90–95%. During our studies, for different regimes (20–40 kHz), no worthy color temperature changes have been being observed.

3. Results

From the standard commercial case, our aim is to generate a uniform lighting surface and improve the luminous efficacy. Dielectric barrier discharge (DBD) has been extensively studied; it has been shown that the voltage waveform plays an important role in the generation of different discharge regime. Usually, a uniform regime is easily obtained by a pulse voltage supply as mentioned by Carman and Mildren [11,12] and Kogelschatz et al. for general DBD [13] or by J. Lee et al. [14] and Urakabe et al. [15] for the flat lamp.

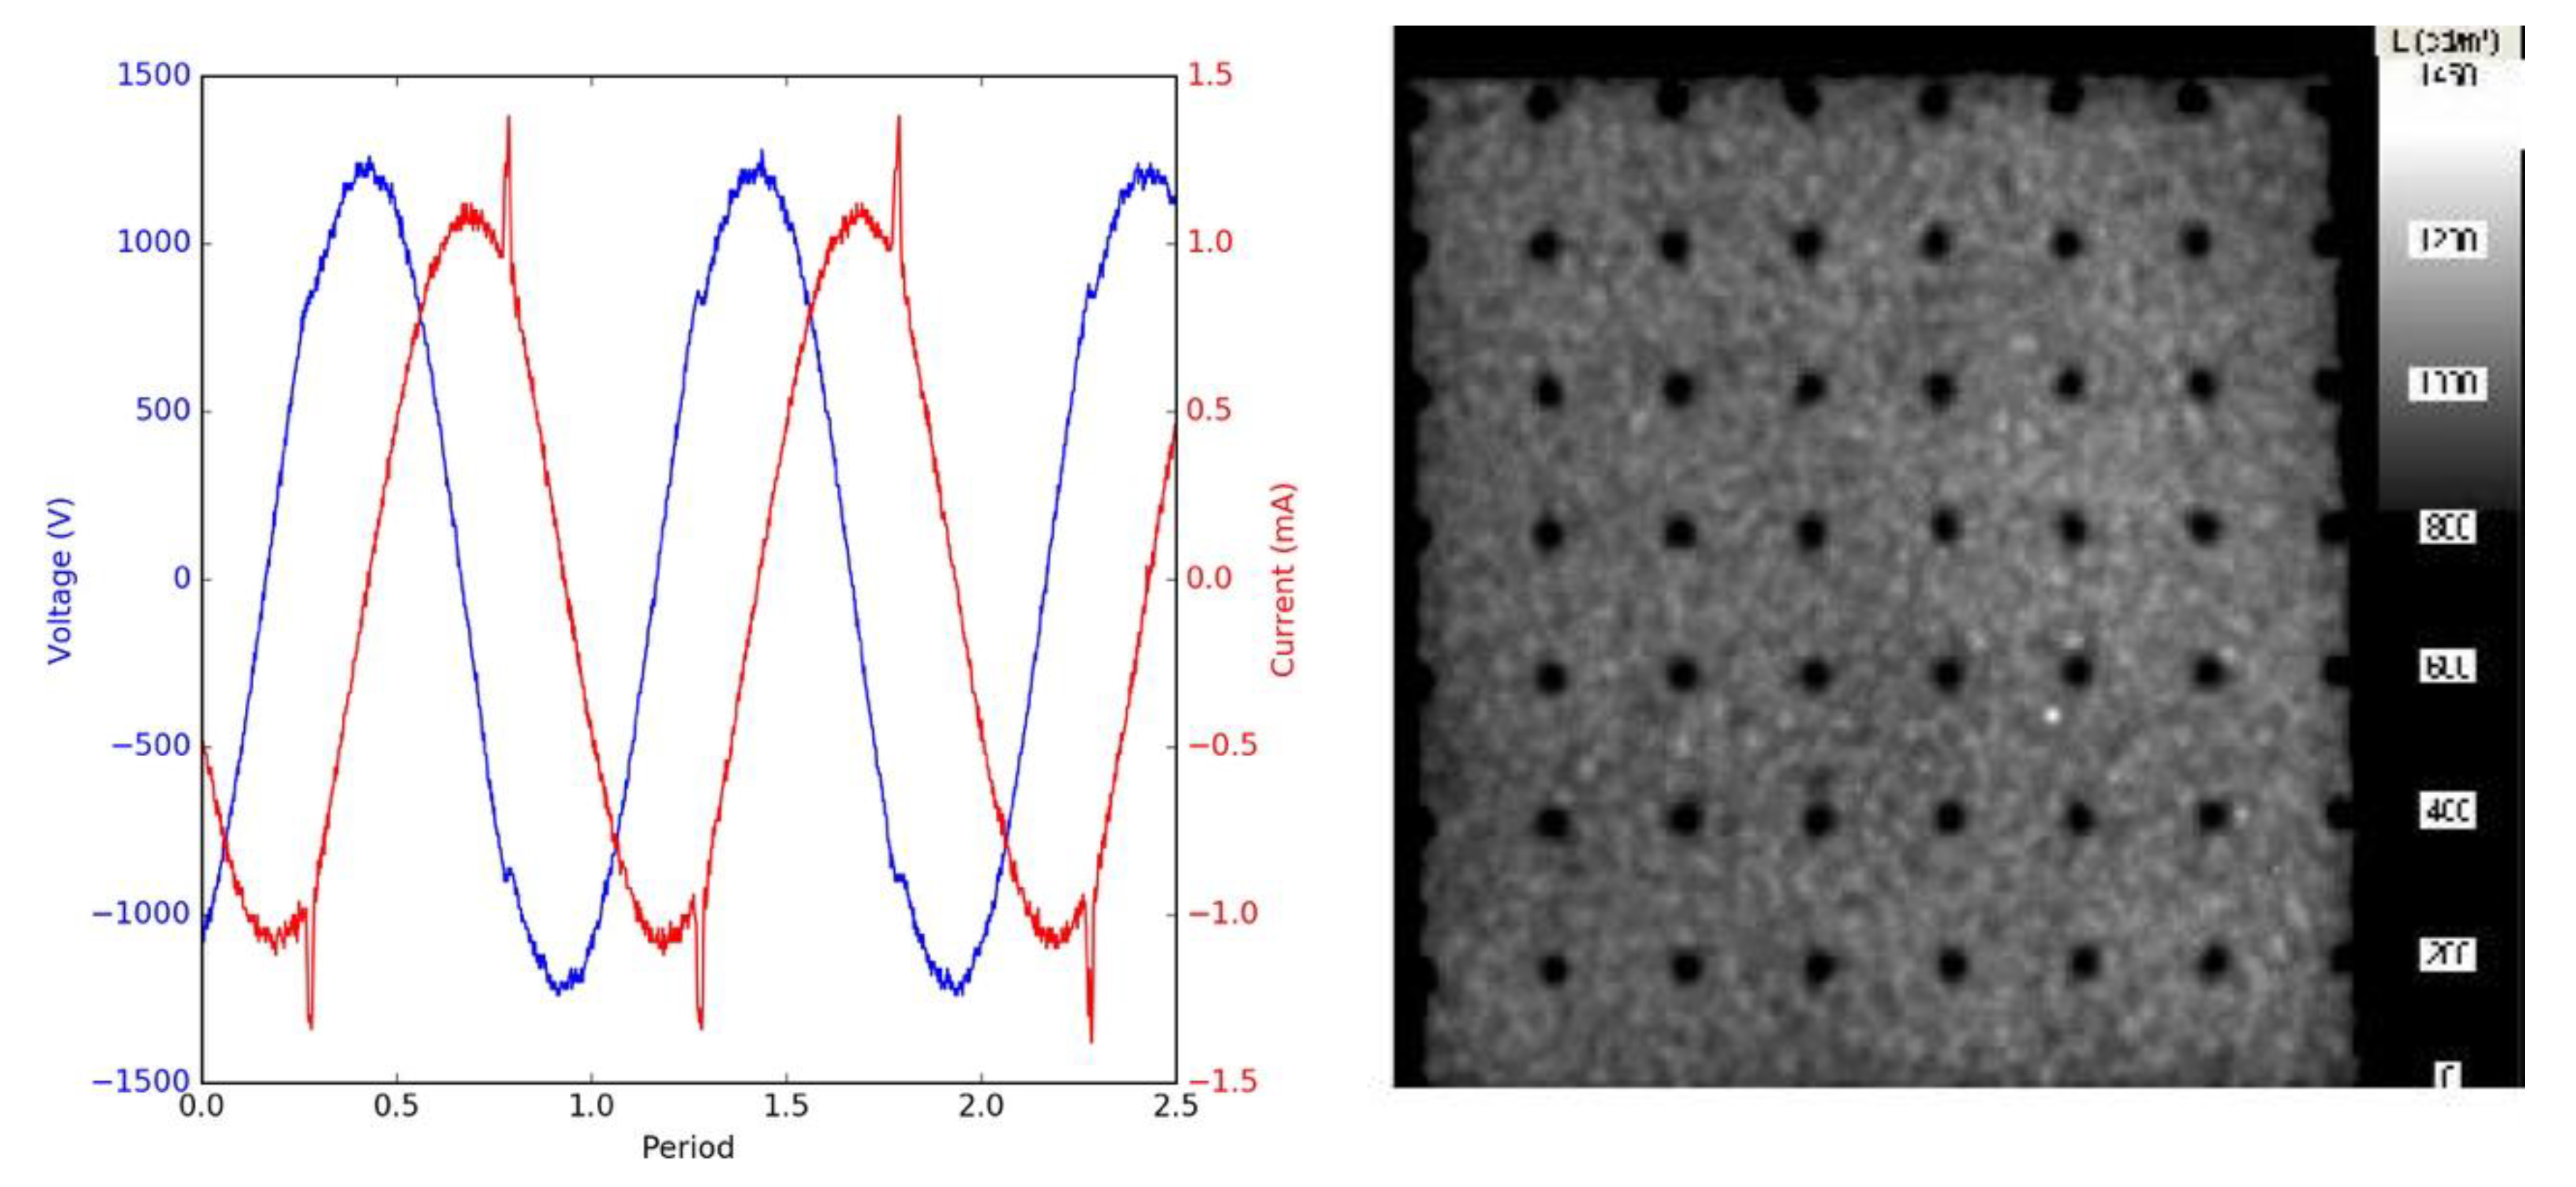
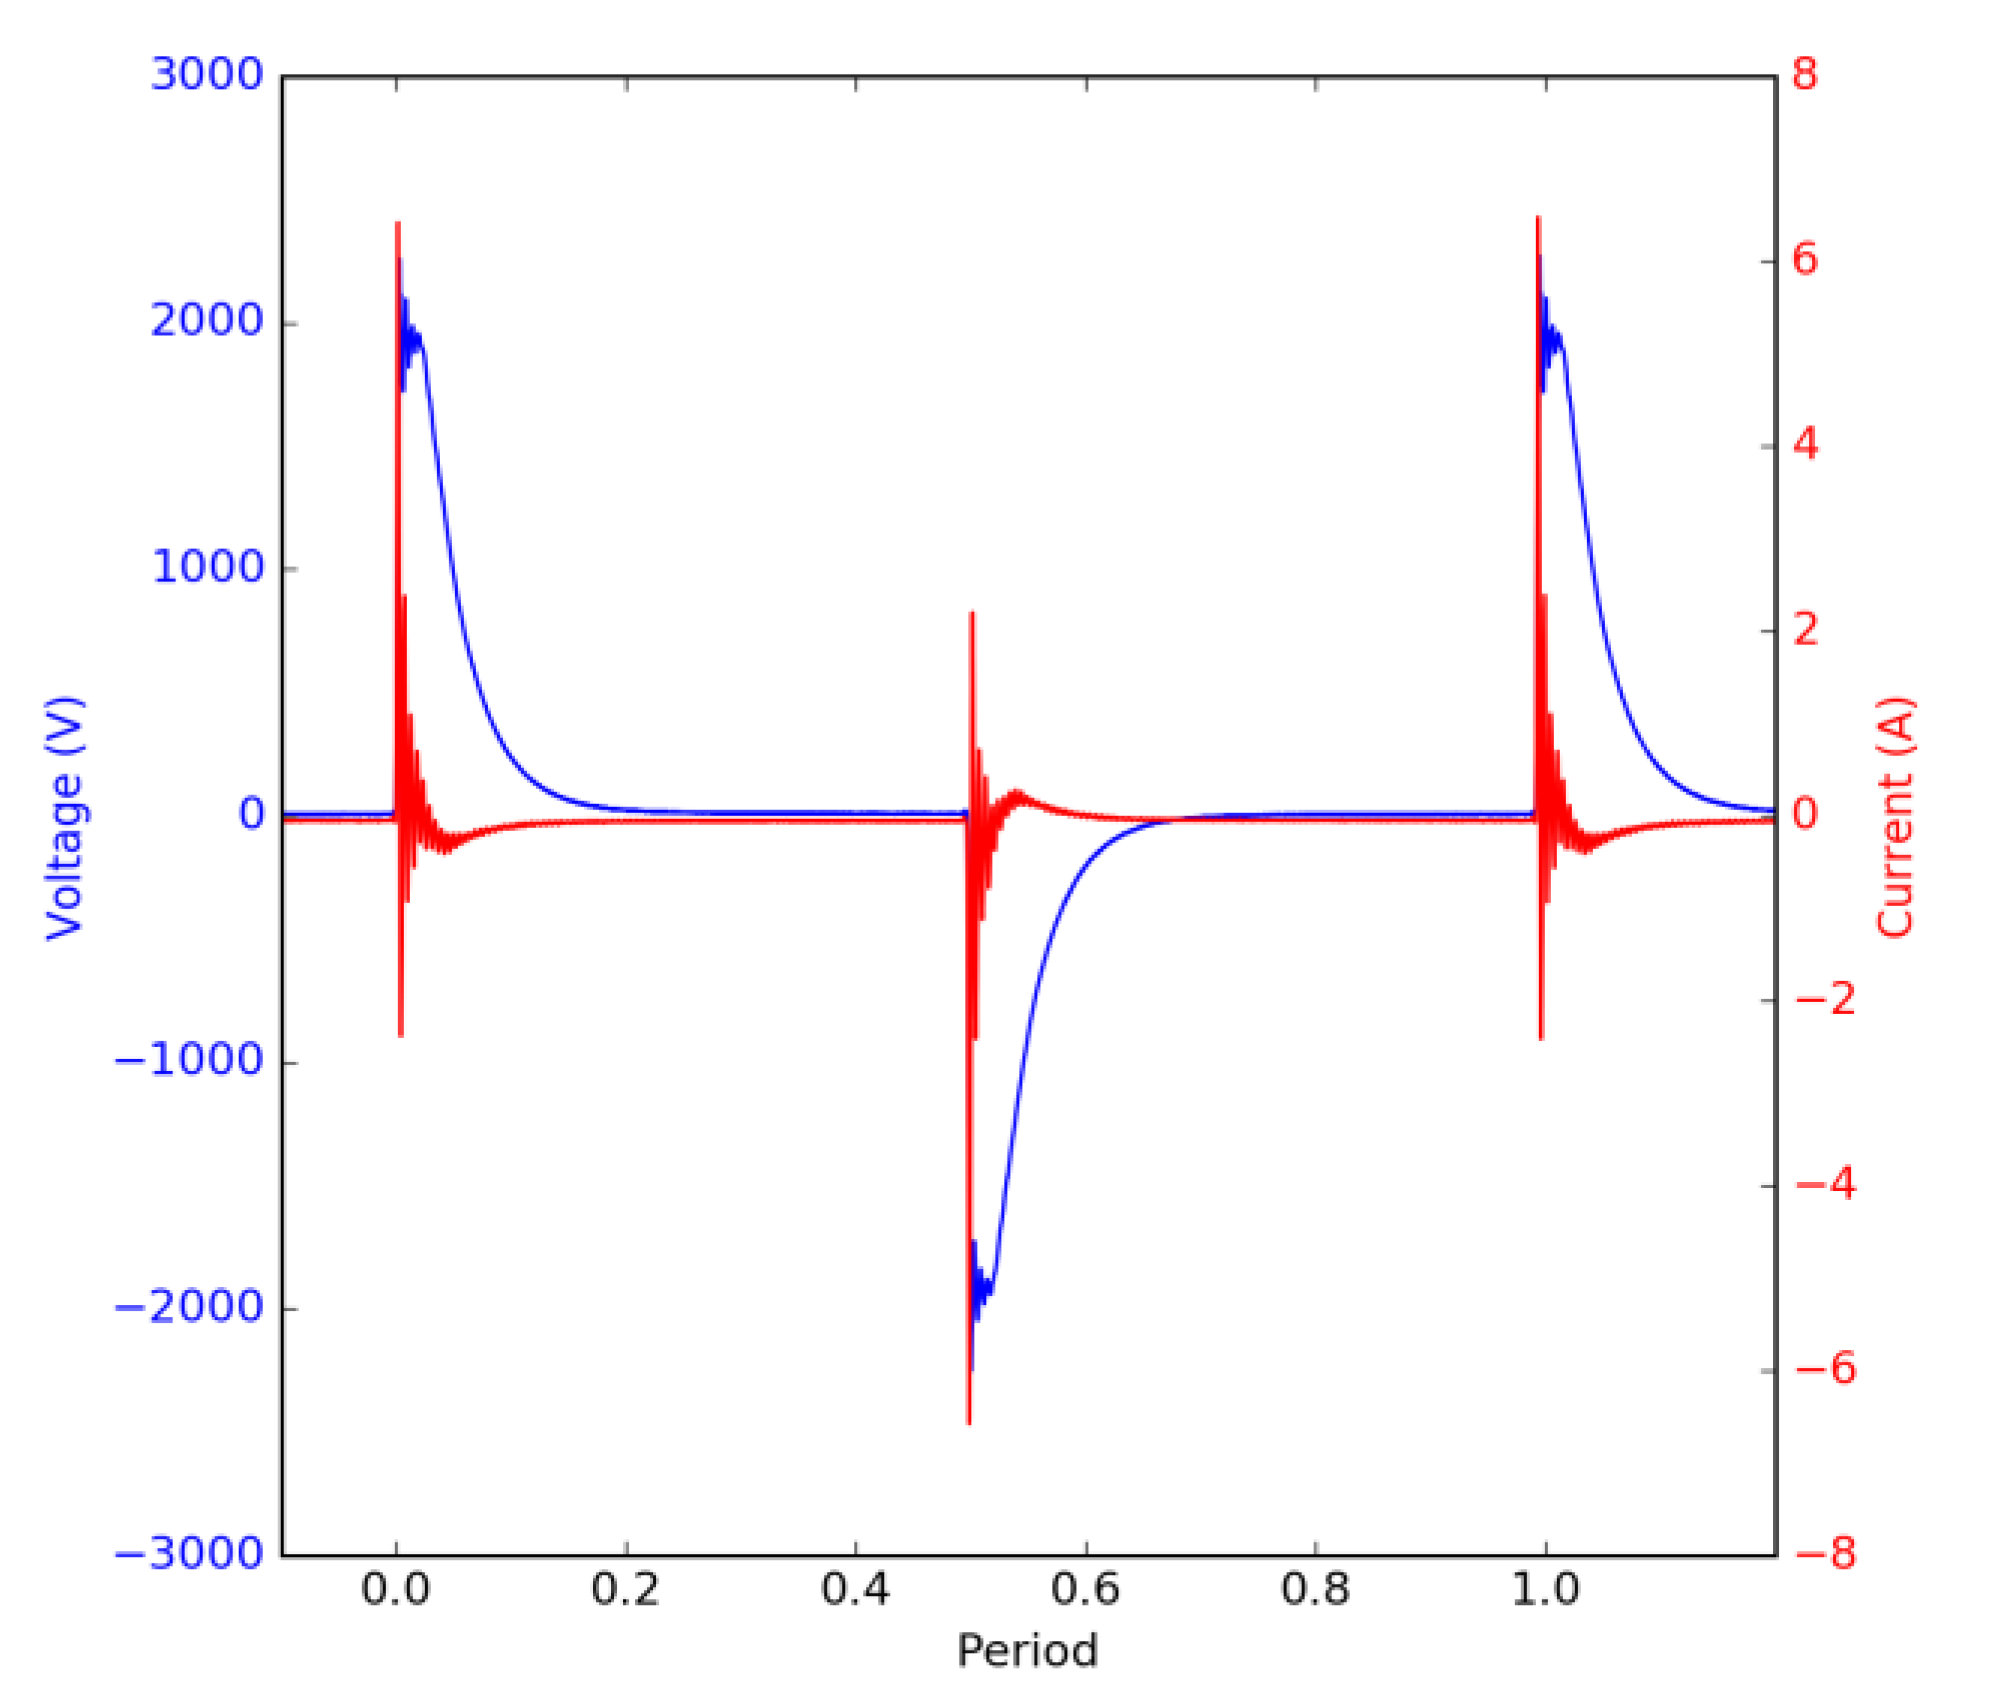
3.1. Pulse Power Supply

Using a pulse power supply, the discharge regime produces a uniform light surface emission; it will be called a homogeneous regime.
During the increase of the voltage, different self-organization patterns are observed, as illustrated in Figure 5. At 1400 V (20 kHz), close to the breakdown voltage, a multitude of dots covers the surface. At 1500 V, joining dots form lines, then forming hexagons. Increasing the voltage again, we get a uniform regime. Uniform and self-organization regimes can exist at the same time as we can see at 1600 V. The last picture of Figure 5 at 2000 V shows the uniform regime [10,16].
In Figure 6, ICCD imaging confirms the previous naked-eye observations: in sinusoidal mode, filaments are observed; on the contrary, for pulse voltage mode, we get a uniform light. The uniformity of the emitted light is due to the time synchronization of all the filaments in the discharge plasma. The filaments synchronization is also observed on the current waveform: a stable narrow current peak for a pulsed signal, instead of a large unstable shifting peak for sinusoidal case. A mapping of the luminance from a 36 × 46 cm Planilum lamp is shown in Figure 7, under standard conditions (250 mbar, 2000 V, 20 kHz) excepted the waveform, which is a pulse form. The applied scale is logarithmic, which is closer to human vision. The surface is full filled with light and does not show filamentary discharges. We observe that the light emission is mostly uniform all over the lamp surface. The uniformity is one of the lamp characteristics we wanted to achieve. The luminance is greater in the center than in the border, as shown by the image with a linear scale. There are two reasons: the electric field is lower on the border due to the absence of electrodes on it, and some planarity changes between the center maintained by spherical spacers as the border of the lamp are maintained by frit sealing. However, the difference in the luminance is imperceptible to the naked eye.
The rise time of the pulse waveform is short, from 50 to 100 ns (Figure 8), followed by a slower decreasing slope. The duty cycle is fixed at 1%. These times are characteristics of our power supply, the electric circuit and the lamp capacitance. It is not possible to adjust them. Electromagnetic compatibility tests were performed by the company to follow the actual norms. The shape of the discharge current is a unique peak, narrower than the one obtained with sinusoidal power supply. The fast rise time is responsible for this.

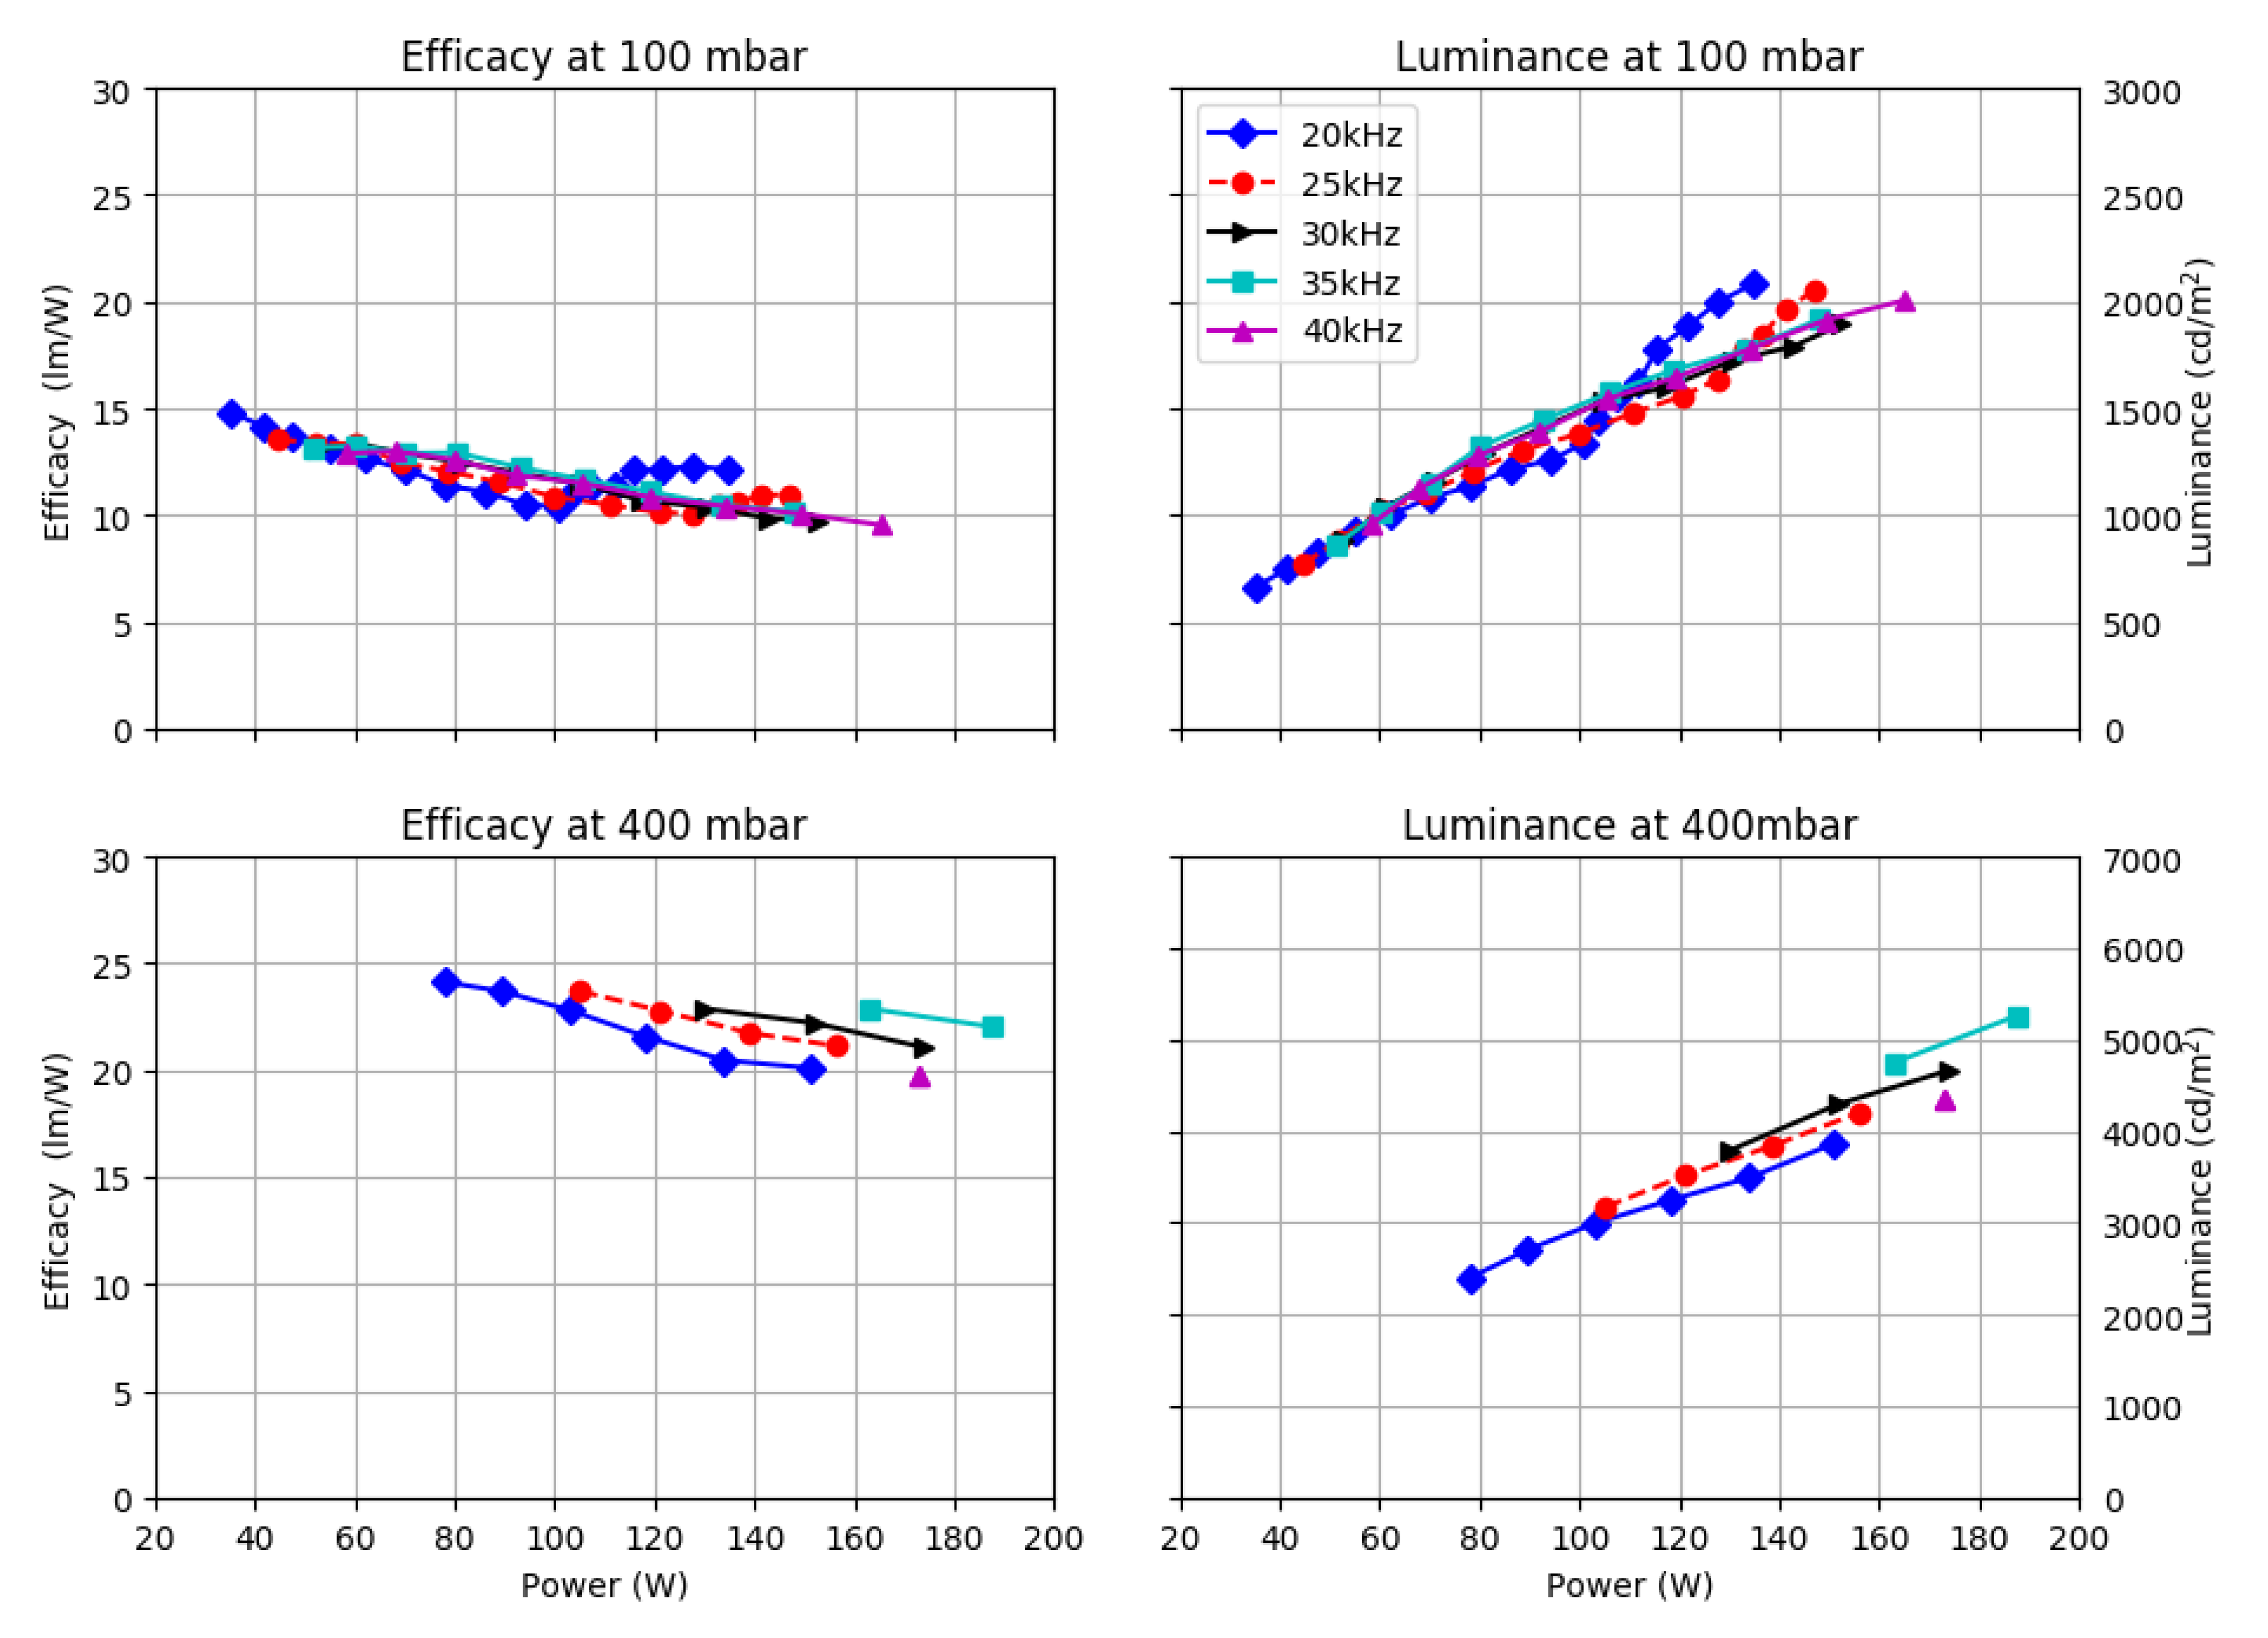
3.2. Optimizations Studies: Efficacy vs. (Pressure, Frequency and Power)

The luminance and the luminous efficacy were measured for several powers, frequencies and two filling pressure of 50% neon-xenon mixture; a synthesis of the obtained results is shown in Figure 9.
The duty cycle used was 1%. This value was chosen from our experimental experiment and justified by the literature. From Shiga and al. [17,18,19], the duty cycle is an important parameter on the efficacy and the consumed power. For a fixed pressure:
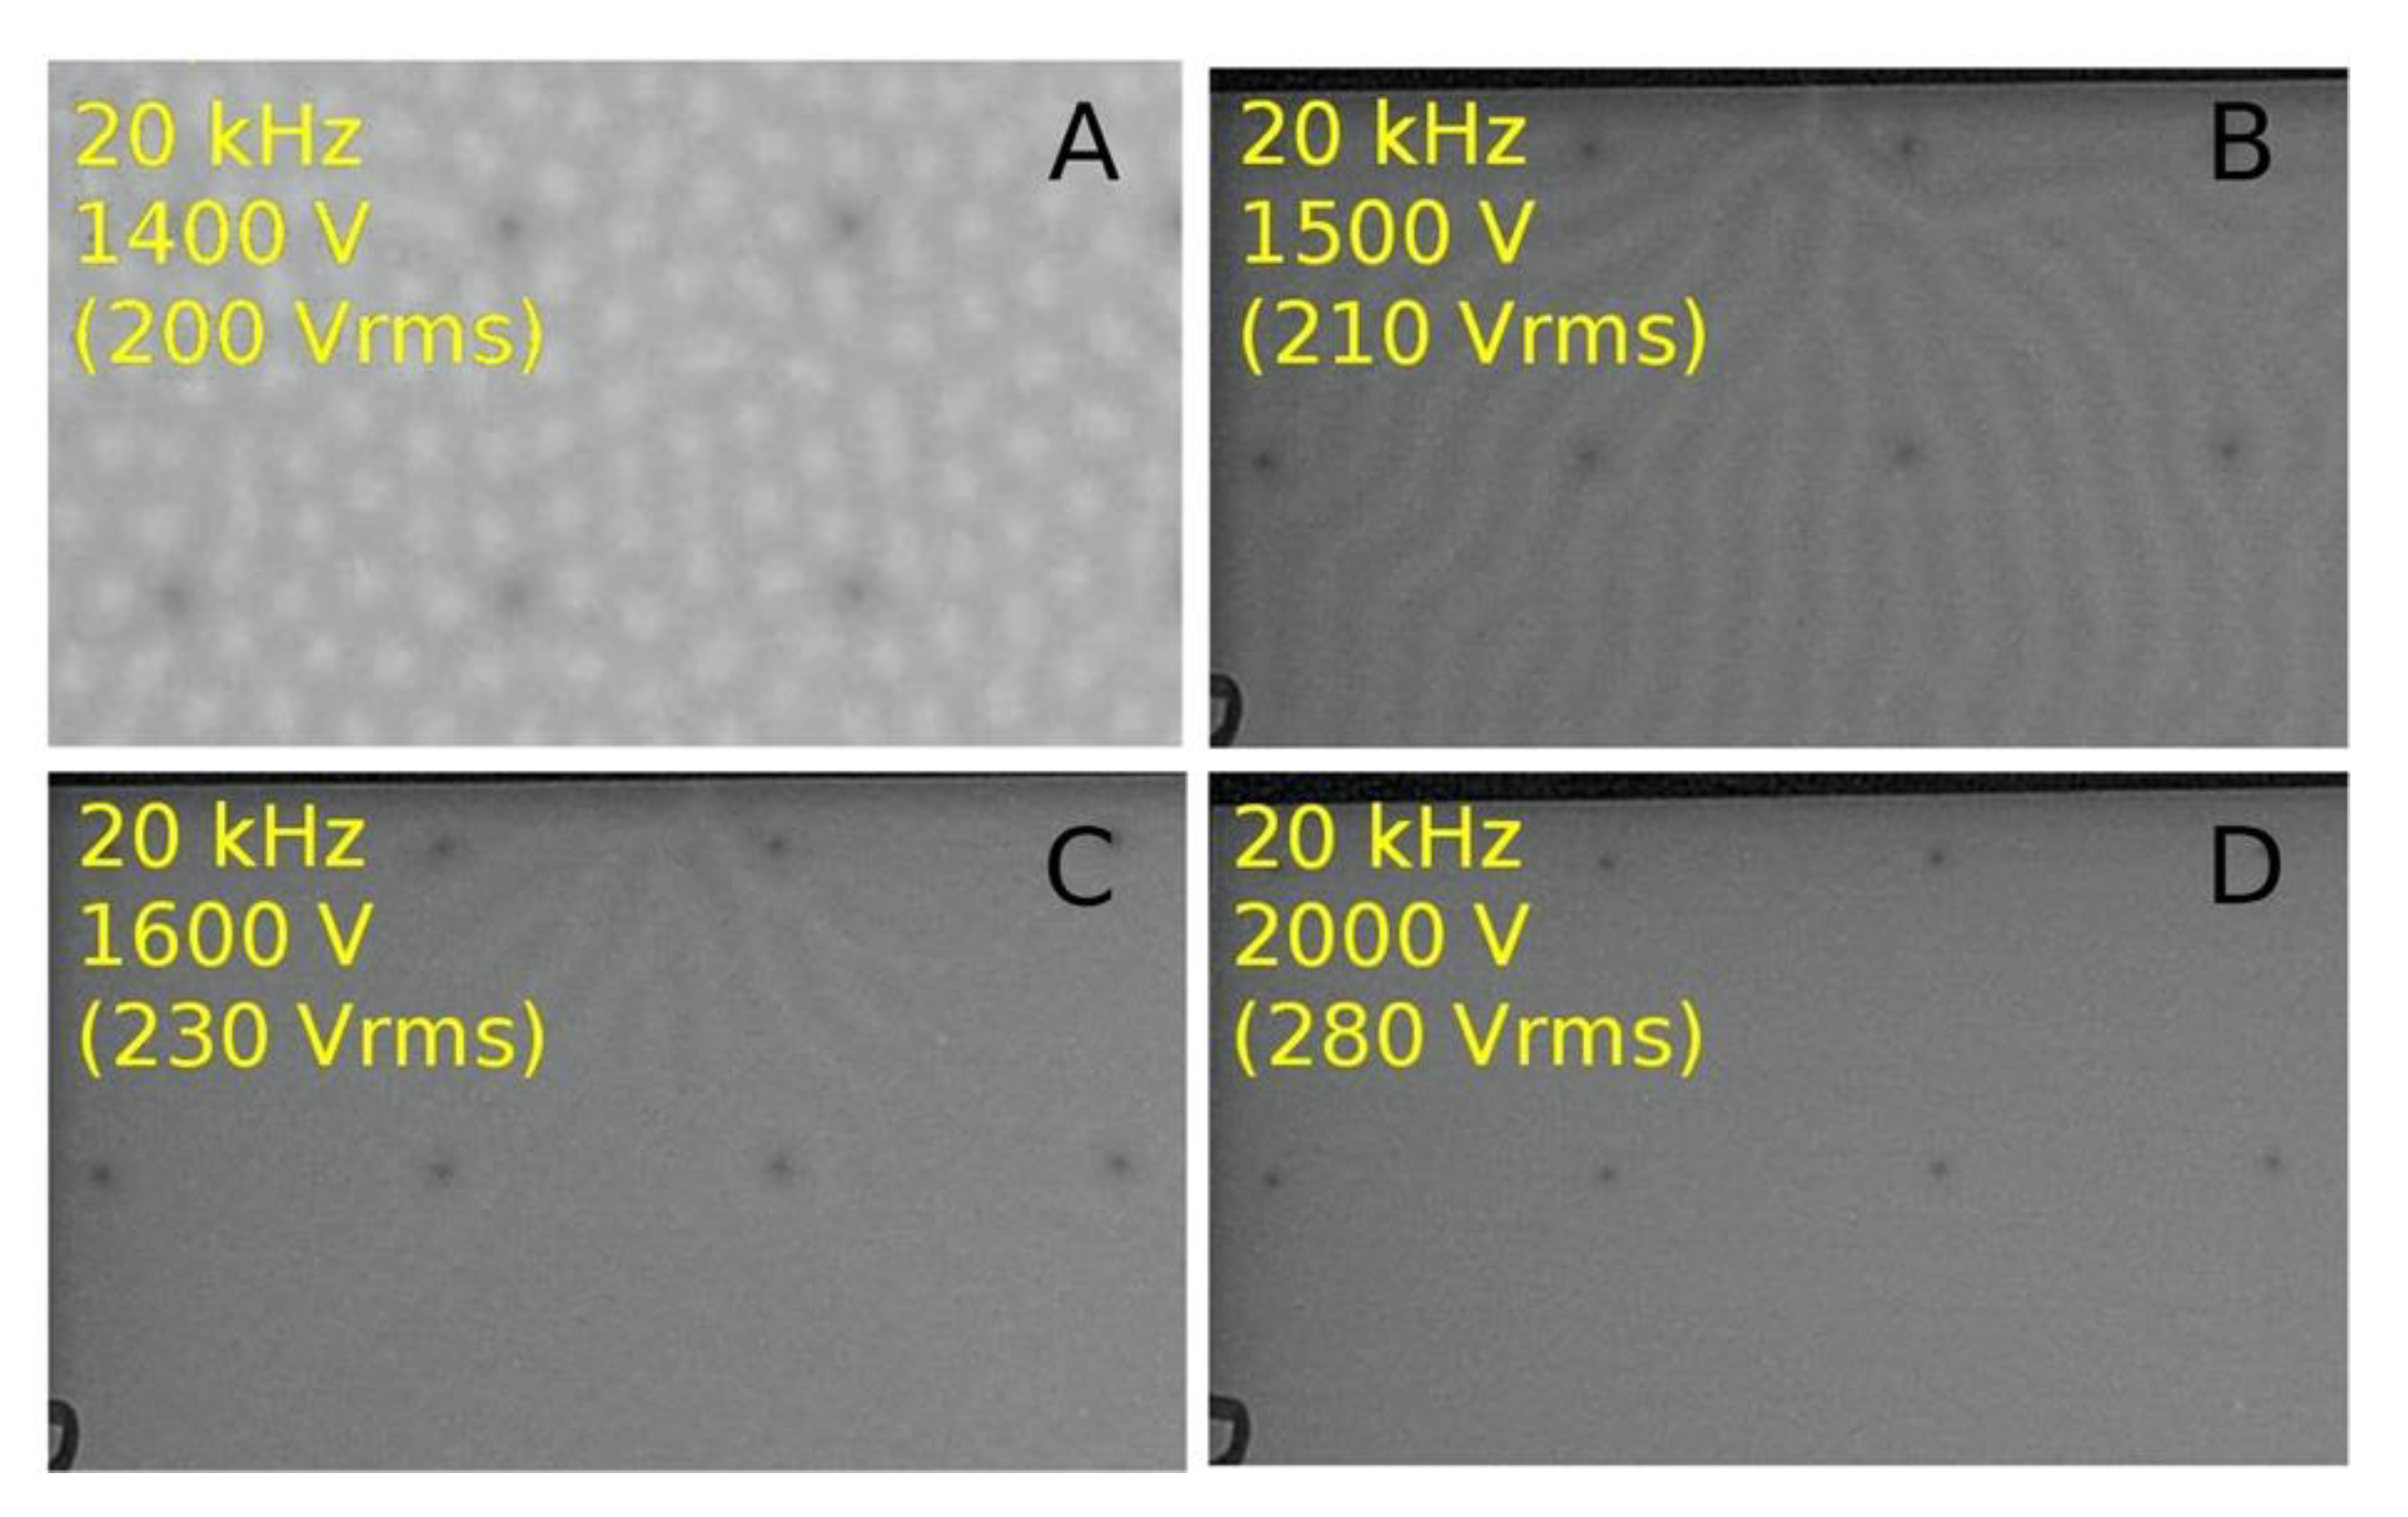
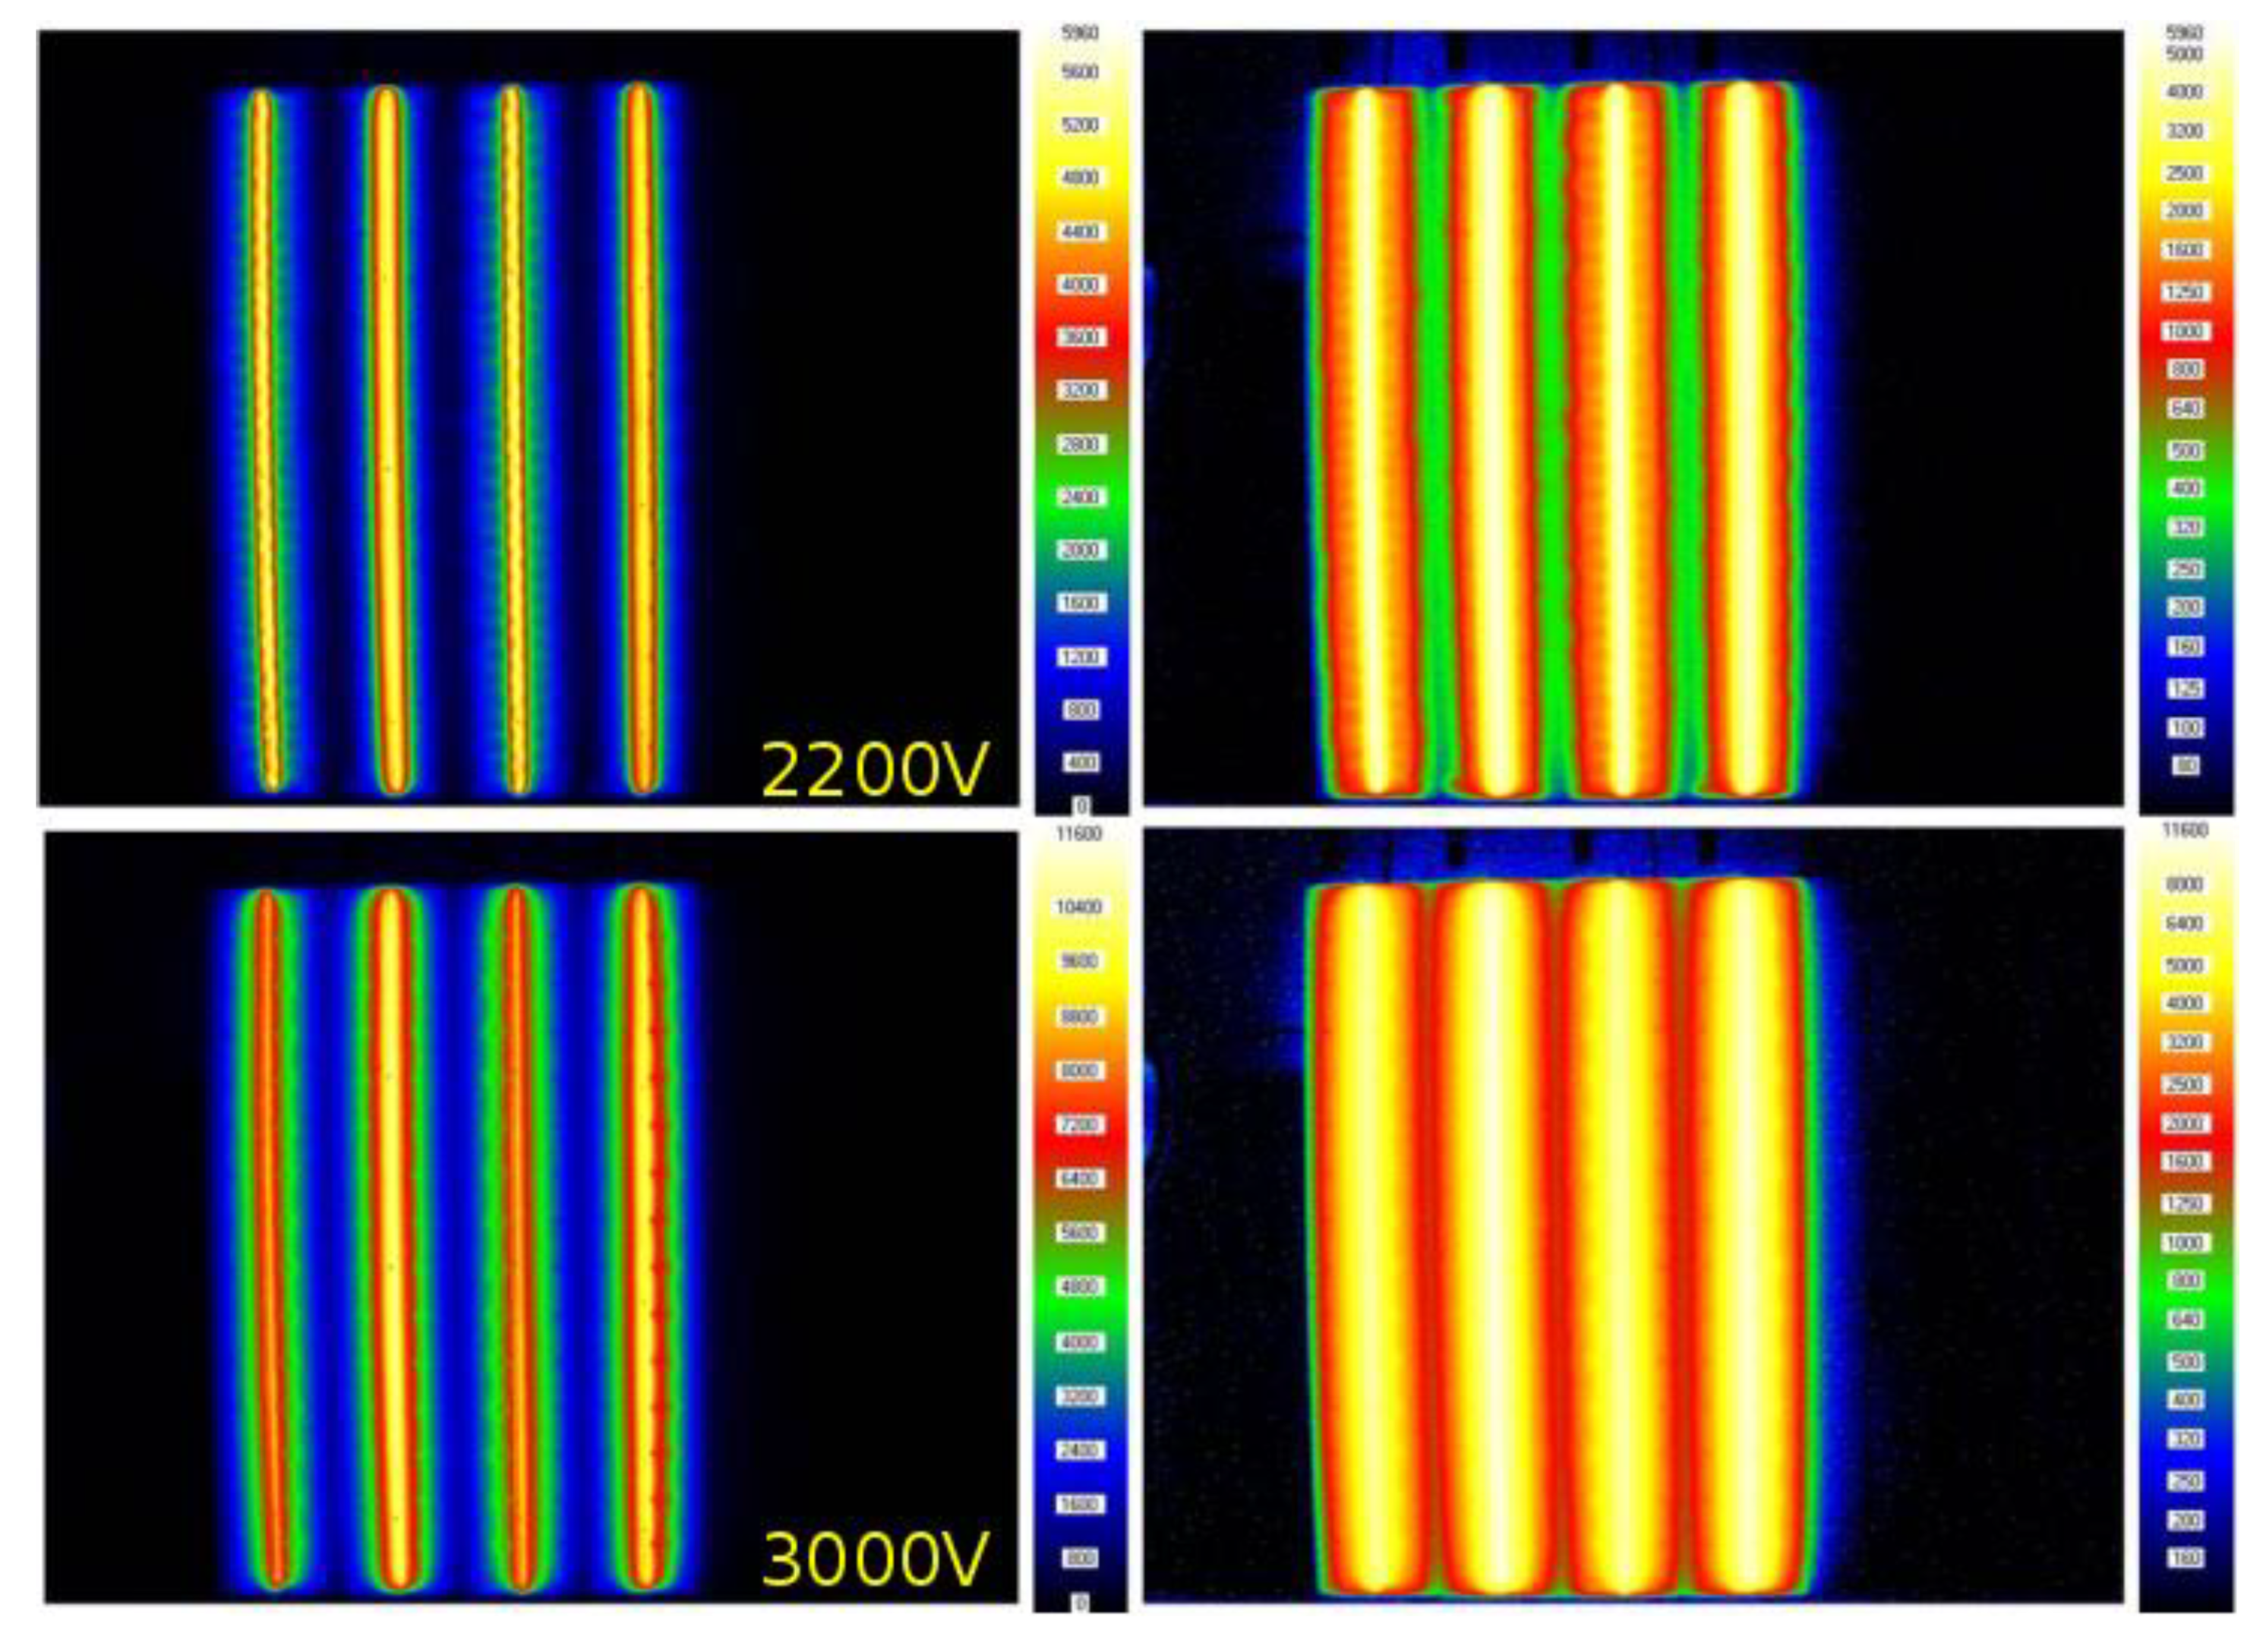
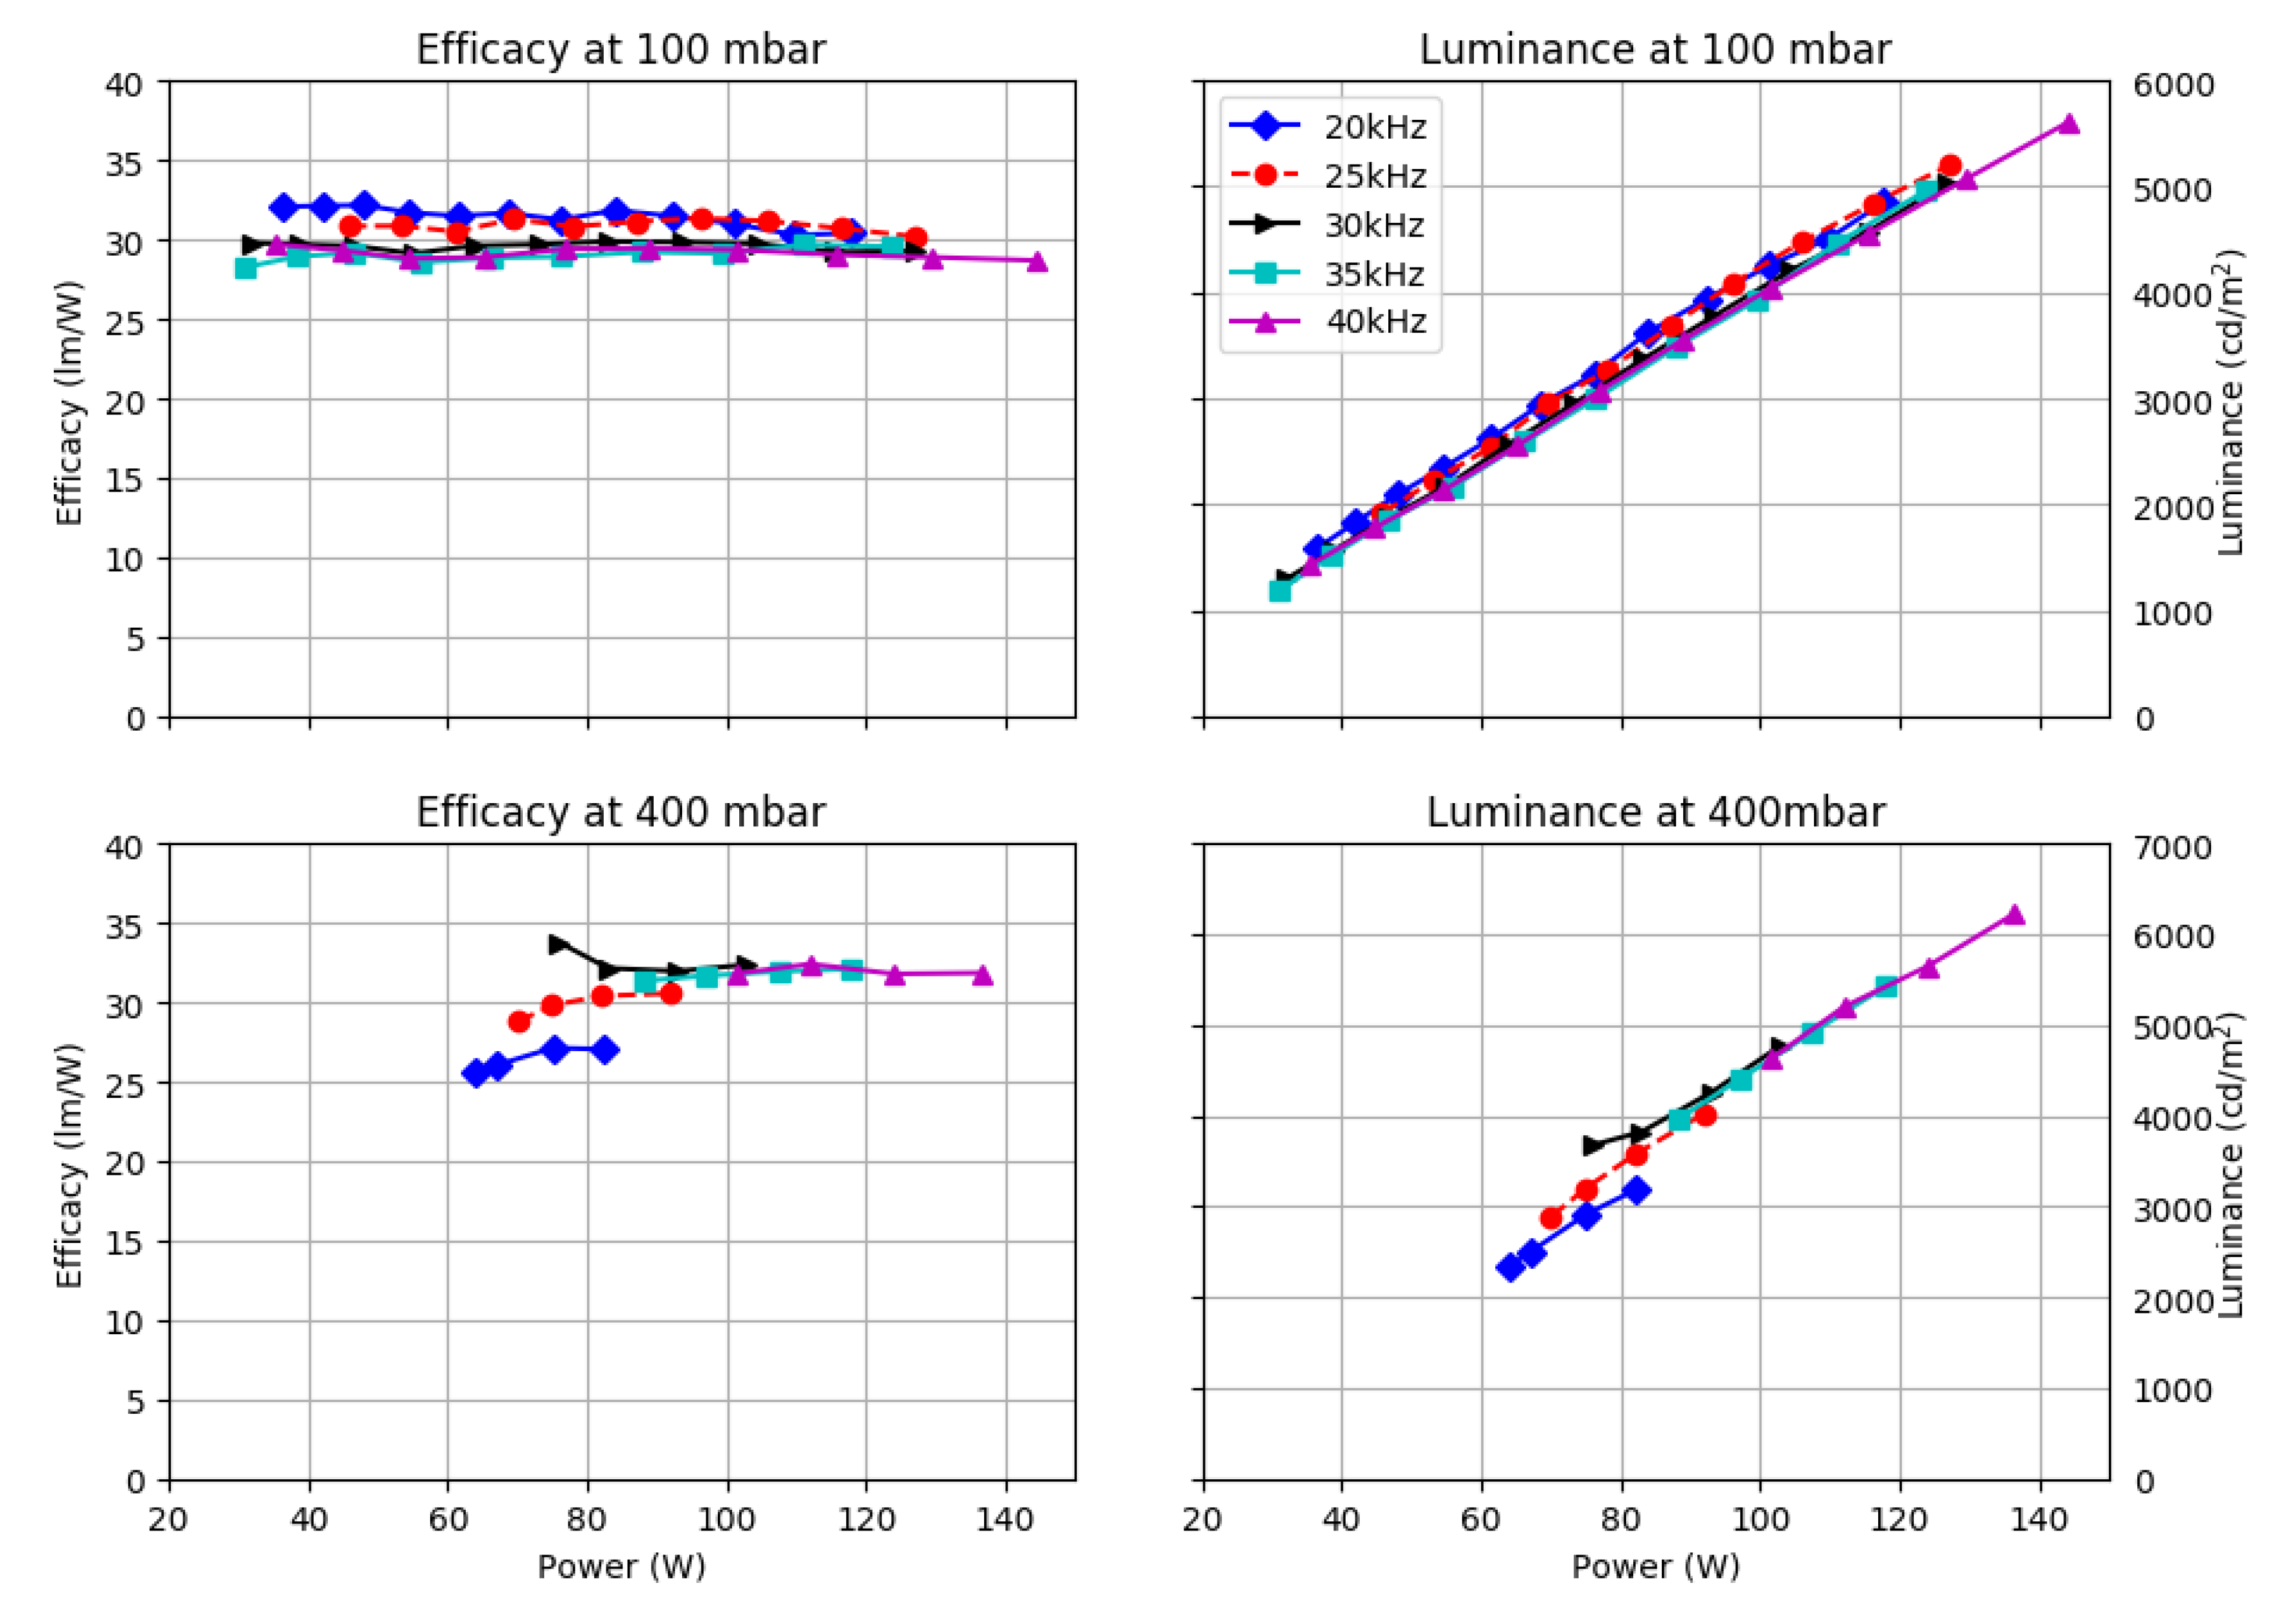
  • The luminance increases with the power as the excimer production. There is more UV photon produced by the discharge converted on a visible wavelength by the phosphors;
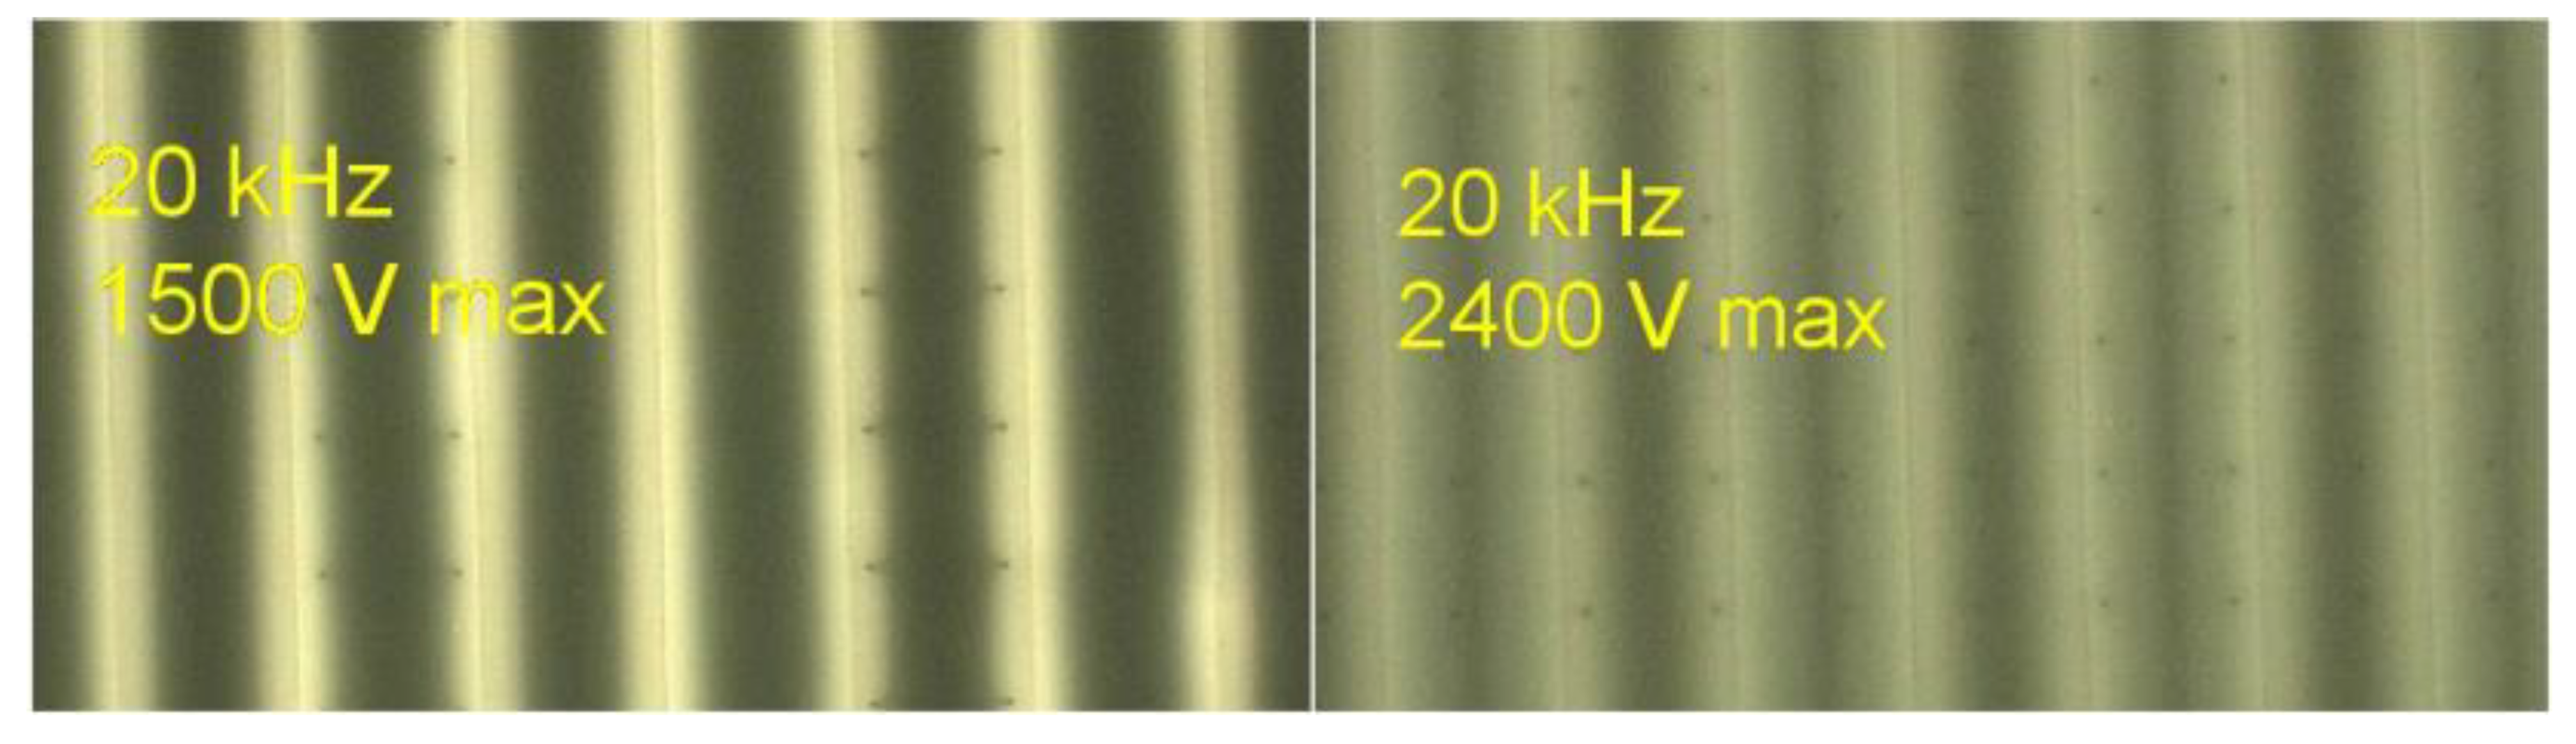
  • An increase in the frequency shifts the luminance value toward high power. For the same applied voltage, it is possible to achieve higher luminance using higher power and higher frequency. Efficacy decreases with power and frequency;
  • Efficacy is calculated from measured luminance and power. The increase of the current leads to an increase of the consumed power faster than the luminance so guiding a decrease of the efficacy.
We can see in Figure 9 that the efficacy increases with pressure. Unfortunately, the breakdown voltage increases also with pressure. This will lead to an operating voltage too high to be used for a lighting source.
The jump in luminance observed at 20 kHz, and 100 mbar from 140 watts is probably due to a better spreading of the plasma on the electrodes.
The best efficacy is obtained for the lower frequency, which is the regime needed the lower power, but with a drawback of lower light emission. For the same voltage (arbitrary at 100 W), an increase of the pressure produces an increase of the luminance from 1200 cd/m to 3000 cd/m and better efficacy. For information, the mean luminous efficacy over all frequencies and powers for each pressure increases from 12 lm/W at 100 mbar to 22 lm/W at 400 mbar.
For the standard geometry (plane-to-plane electrode configuration), using a pulsed electrical signal does not significantly improve the luminous efficacy (14 lm/W vs. 12 lm/W). On the other hand, the visual aspect is highly improved: swarming of the light emission with sinusoidal voltage due to alternate filamentary discharges opposites to a flat uniform light emission for the pulse power supply.
Change to the pulse power supply with standard electrode geometry improves the efficacy of the Planilum DBD lamp slightly, but we get a substantial gain on the uniformity. The lamp uniformity was one of our goals in this work. The next step will be to improve the luminous efficacy by changing the electrode configuration.

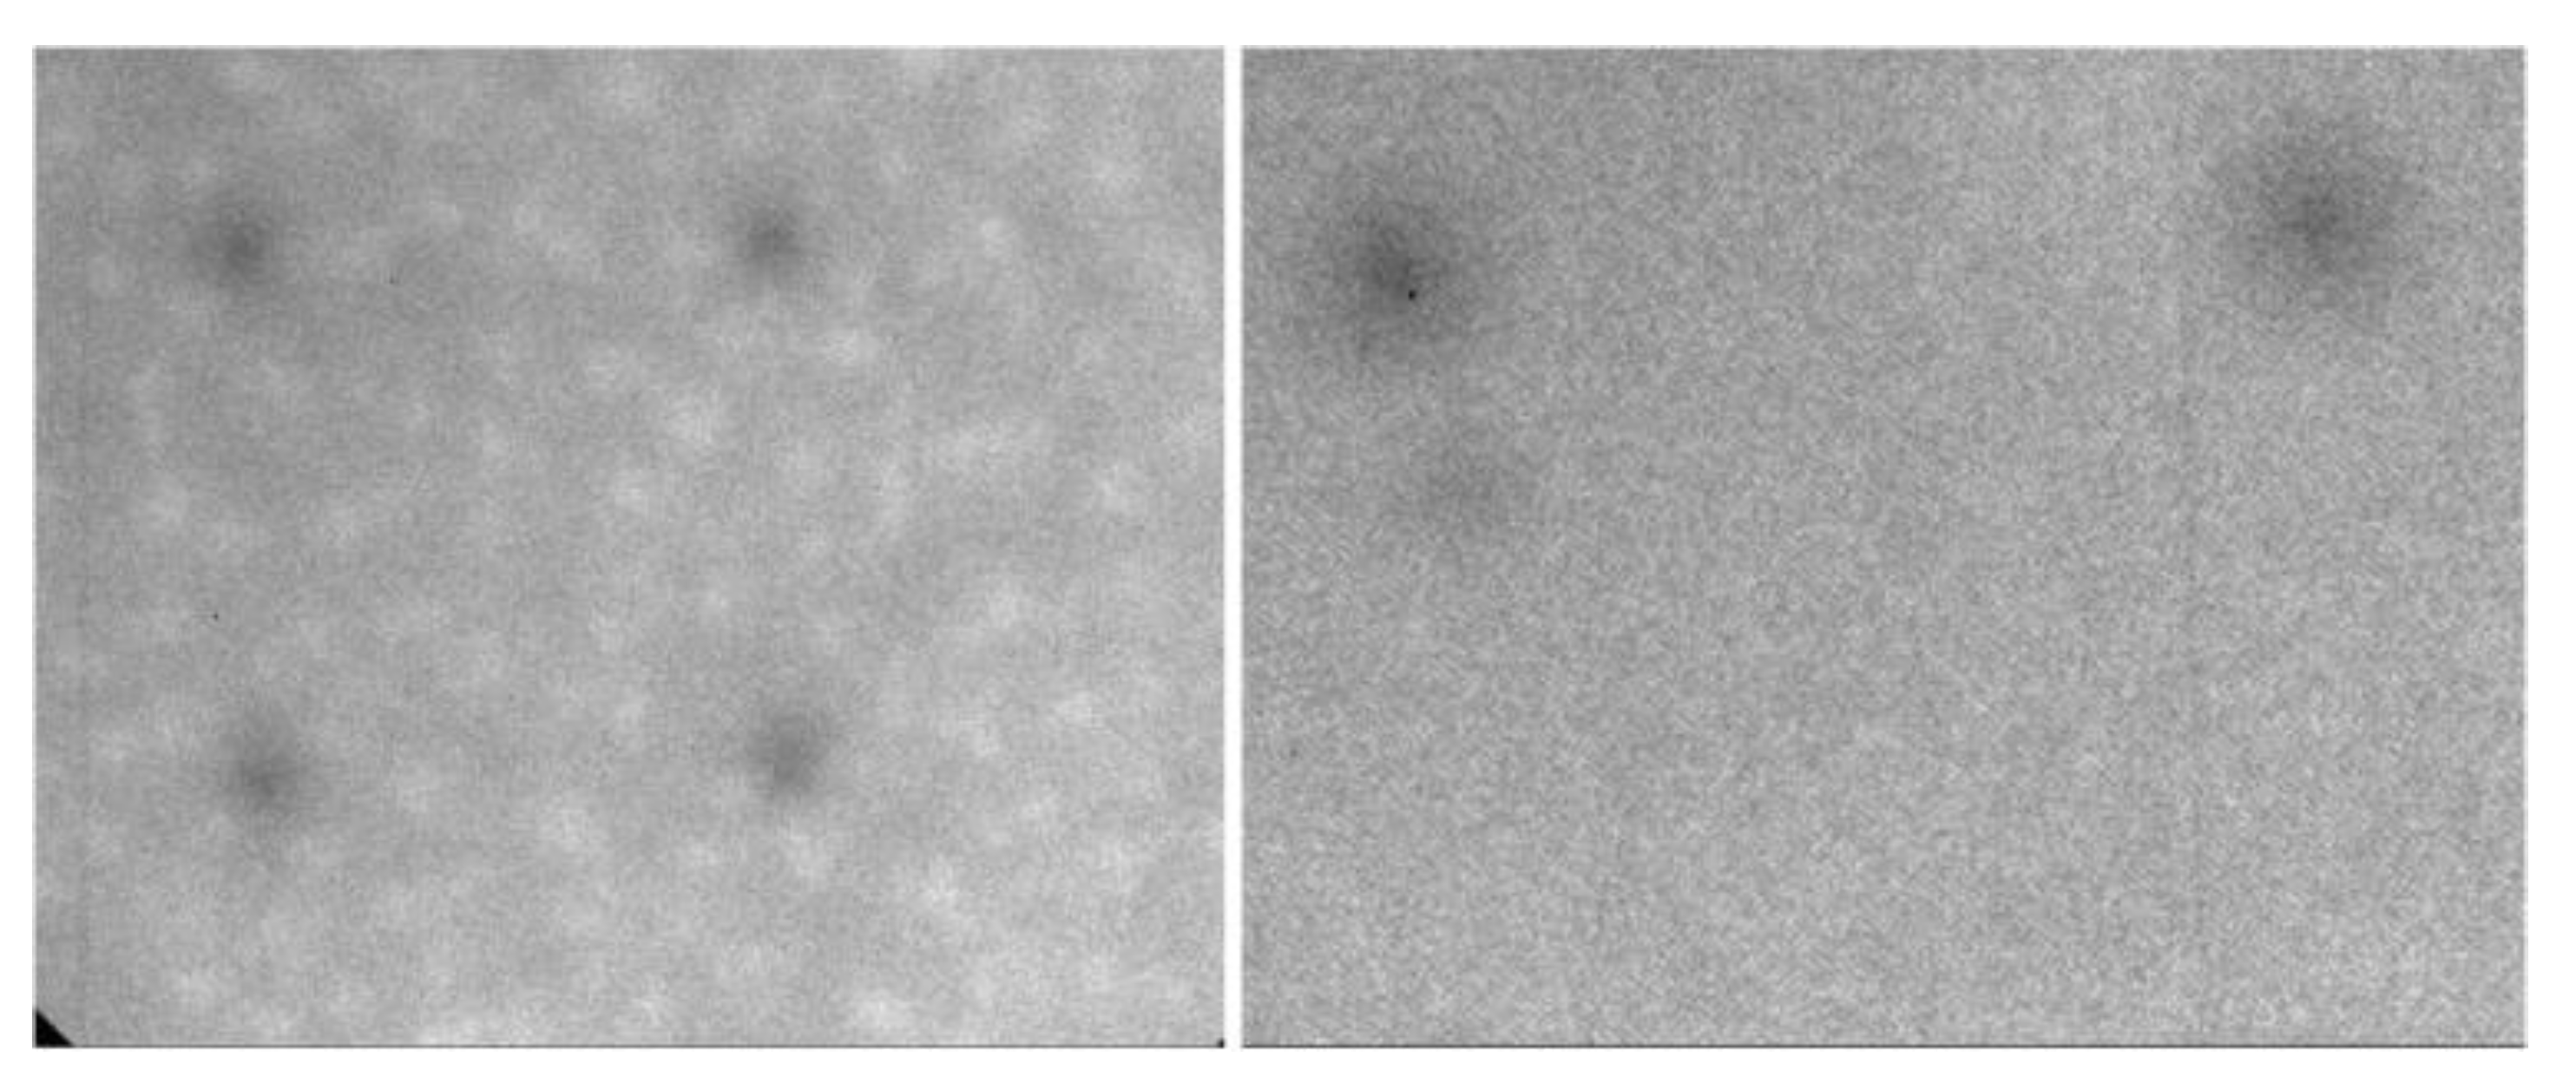
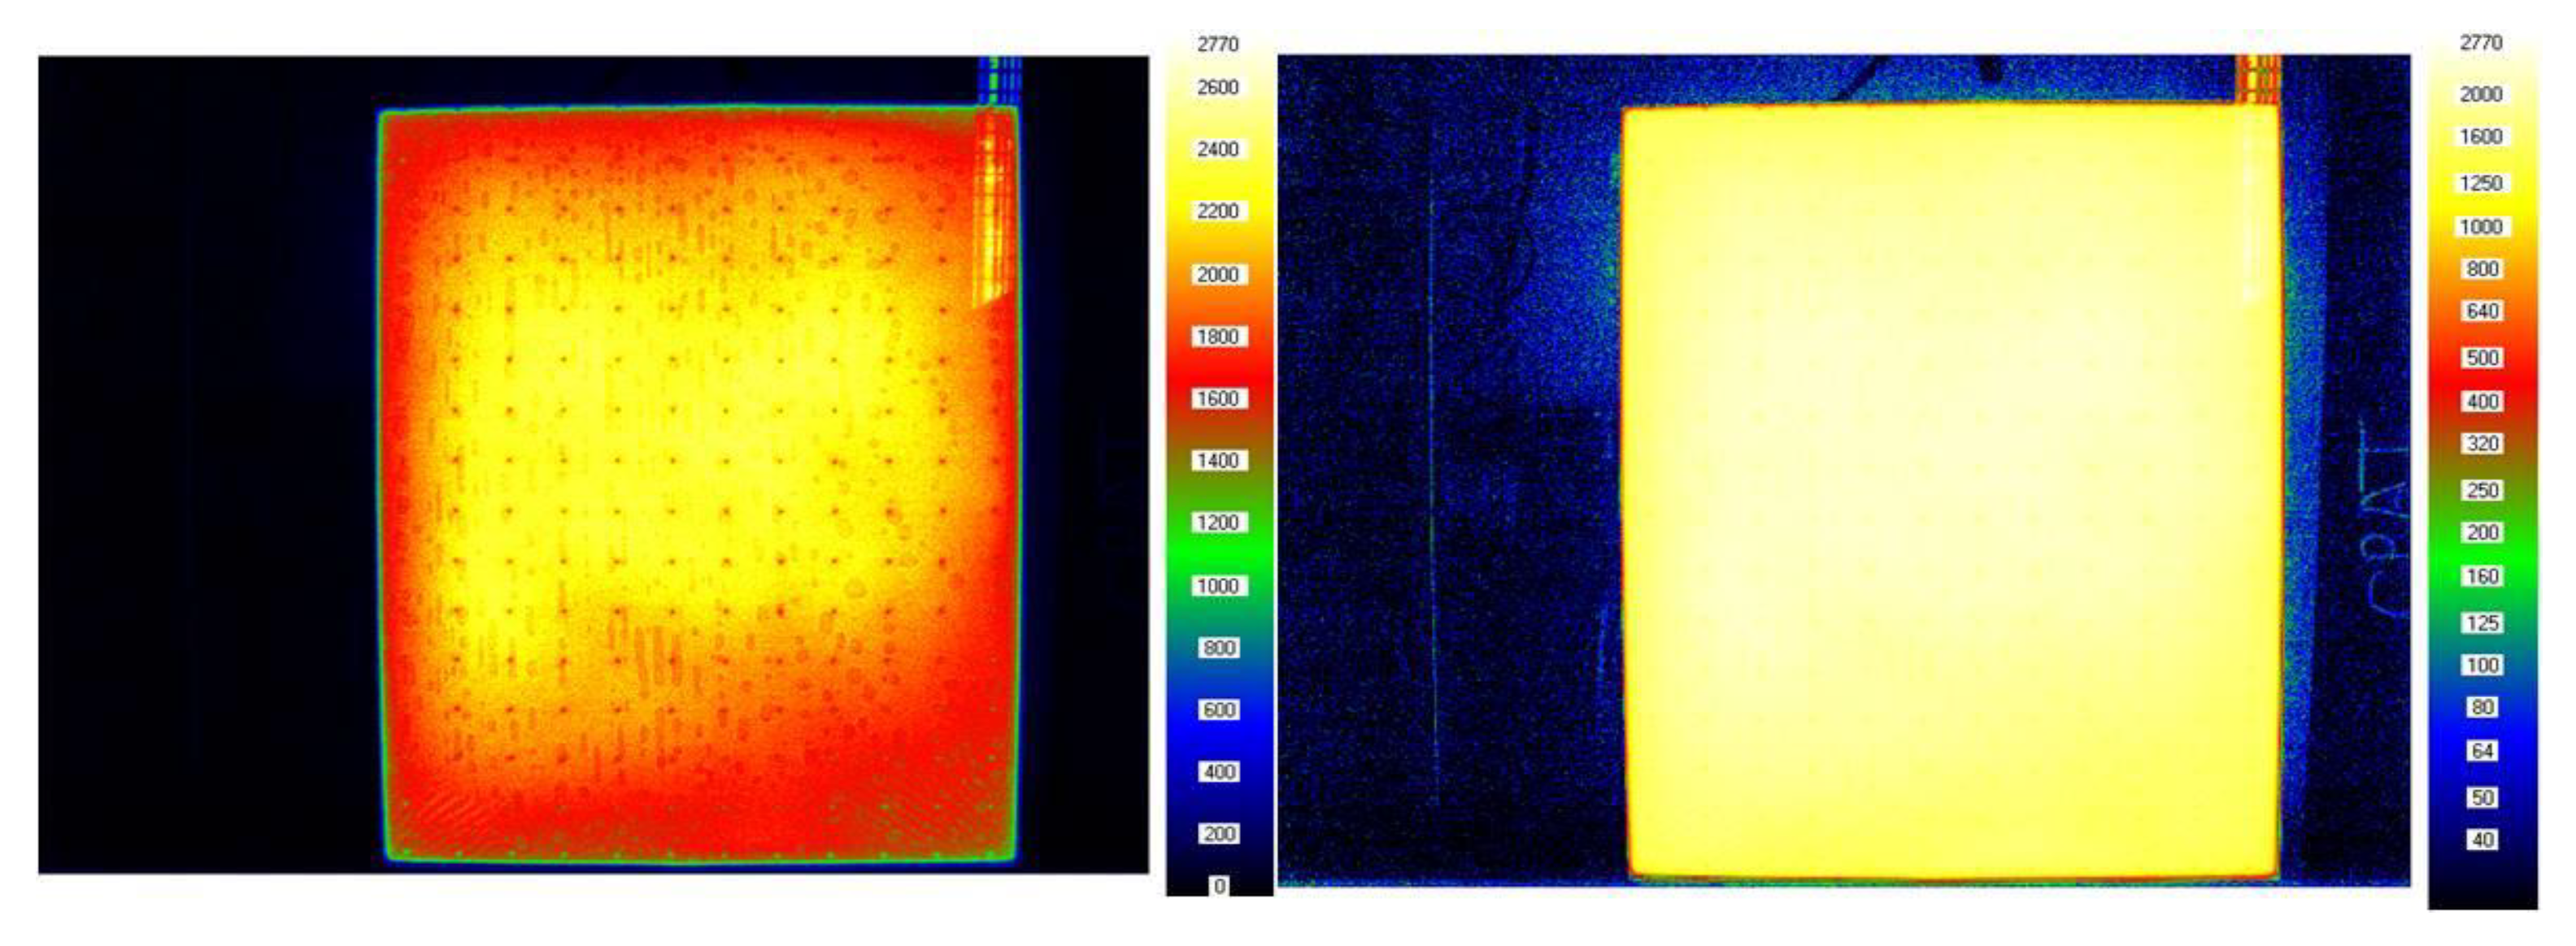
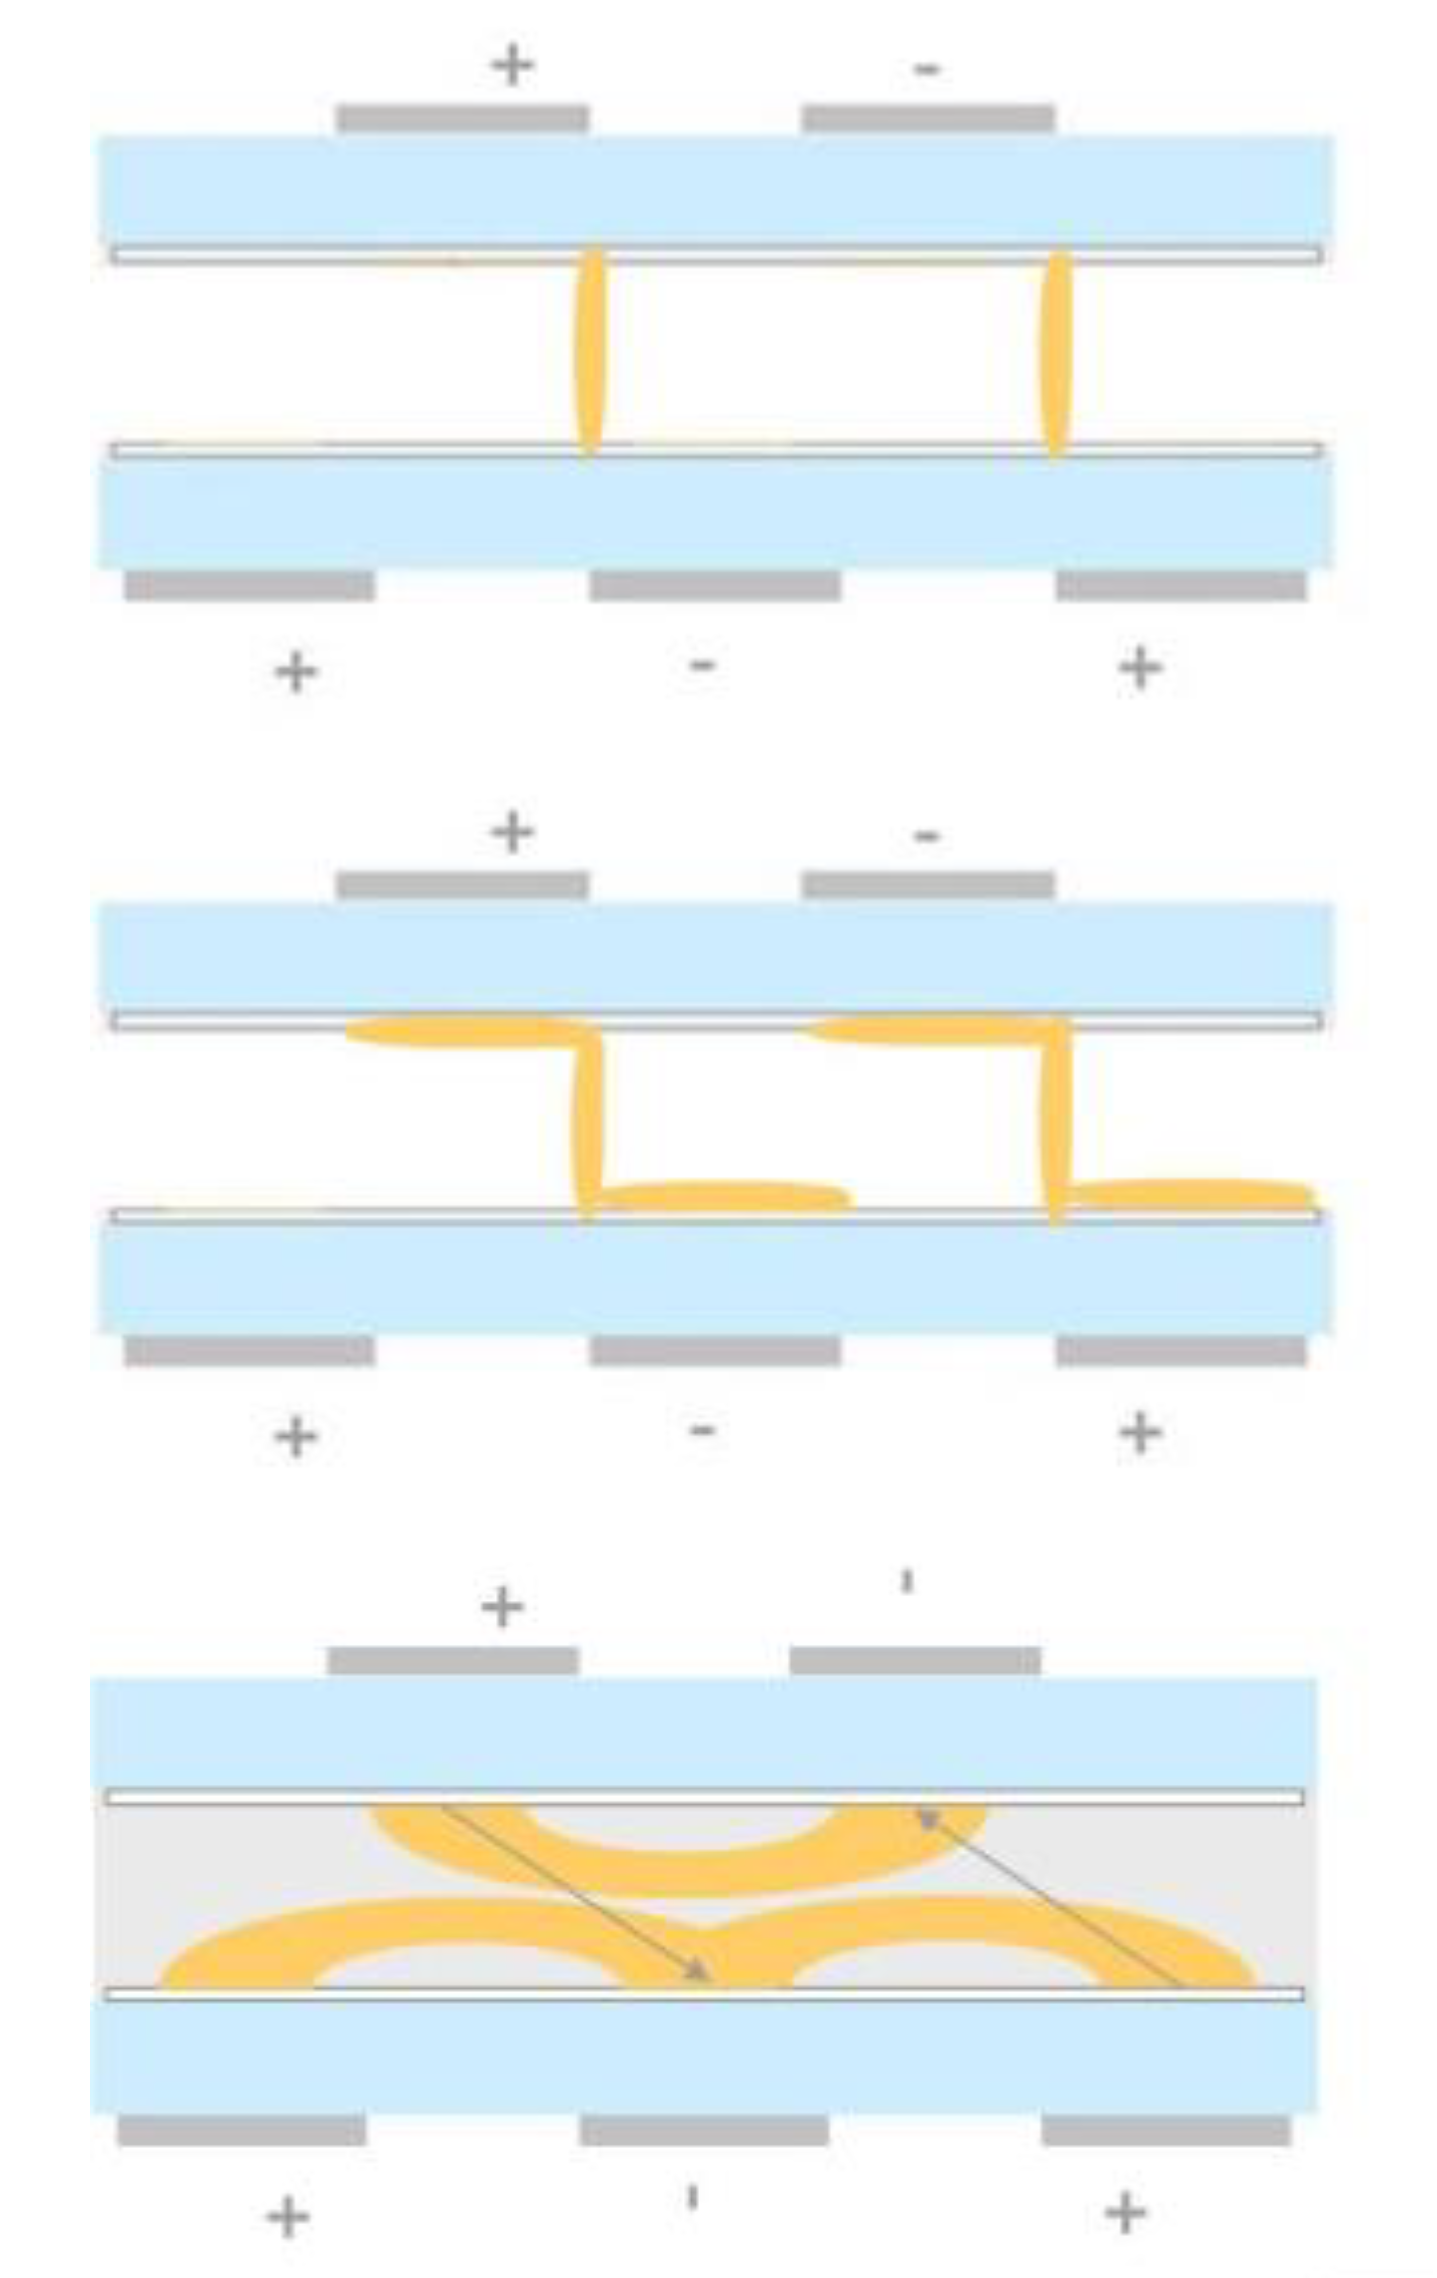
3.3. Geometry Influence

To improve the luminous efficacy, we changed the electrode geometry configuration. The electrode configuration is a structural parameter easily modifiable and acts directly on the discharge characteristic. We developed a complementary coplanar electrode geometry configuration. The aim of this geometry was to improve the luminous production by spreading the discharge over the electrodes and then increase the photon’s production for a given power. The electrode surface is smaller, leading to a lower capacity then decreasing the capacitive current. Our complementary coplanar geometry is composed of coplanar electrode’s band facing themselves shifted by the electrode’s width. In this study, electrodes are powered alternatively to improve the spreading of the discharge. Figure 10 shows the alternate configuration of this geometry: two consecutive electrodes on the same side are powered by opposite polarity. Different possible discharge shapes are represented in Figure 11. The last shape is never obtained in the voltage range of our study. Beyond reducing capacitive losses by removing about half of the surface’s electrodes, this geometry has several advantages to achieve better efficacy:
  • The shifting of the electrodes allows a spreading more important than the size of the 2 mm plan-to-plan gap. This spreading leads to a decrease in the electrical field. Low electrical fields induce a better excimer production [20,21];
  • The surface reduction of the electrode decreases the optical transmission losses through the electrodes, allowing the same output for lower power.
In the following, the complementary coplanar geometry is studied for a lamp with a 36 × 46 cm lighting surface. The width of the electrode bands is 4 cm, as the shifting.

4. Discussion

Light emission with alternate complementary coplanar geometry is a succession of bright and dark lines. The optimal regime is not achieved as dark spaces are observed. In the bright zone, despite the impulse waveform, the regime is not homogeneous: filaments are observed with a fast ICCD camera. In Figure 11, two pictures are presented for high and low voltage (1500 V and 2400 V). The bright surfaces increase gradually with the voltage. The discharge operates in a plane-to-plane state, but neither in a pure coplanar state. Discharges spread on the other side on the electrodes with opposite polarities. Visually, as the voltage increases, dark bands centered on the electrodes gradually narrow.
Figure 12 shows a map of the luminance from a 250 mbar lamp in alternate complementary configuration with pulse voltage. At 2200 V for 20 kHz, some irregularities are visible on the first and the third band due to filaments. Filaments could only be observed with an ICCD camera. The dark bands have a higher luminance than the outside of the lamp. The dark bands correspond to the region where the plasma does not completely spread. Increasing the voltage allows to spread more the plasma on the electrodes; the bright bands are more important. On the left, the scale is linear; on the right logarithmic. The logarithmic scale is closest to the human vision. At 3000 V, the discharge is homogeneous but not uniform all over the surface due to darker bands.
The complementary electrodes configuration induces a stable regime with similar efficacies over the power at a fixed pressure (Figure 13). On the contrary, increasing the pressure allows an increase of the mean efficacy from 12 lm/W to 22 lm/W. Compared to the standard plane-to-plane configuration, the electrode width influences the current density by decreasing the electrode surface and capacity. The discharge current stops quicker with lower current density. The efficacy of 30 lm/W is almost double than the standard case (plane-to-plane and sinusoidal voltage).
Parametric studies as a function of the waveform (sinusoidal or pulse) and pressure are summarized in Table 1. Increasing the pressure with complementary alternate coplanar geometry and with fast rise time pulse power supply leads to an improvement of the lamp efficacy.

5. Conclusions

A commercial Planilum lamp from Saint Gobain Recherche, Paris, France, was studied. Its luminous efficacy in the typical configuration is 12 lm/W. This lamp was commercialized in 2008. The target market was not general lighting but design or architectural lighting. With an impulse voltage instead of a sinusoidal voltage, the luminous efficacy is slightly improved to 14 lm/W. Nevertheless, with pulse waveform, the visual aspect is greatly improved with a uniform aspect rather than a swarming aspect. Changing the electrodes configuration to a complementary coplanar electrode configuration gives a huge efficacy improvement. Coupled with the pulse power supply allowing a uniform aspect and high pressure, the efficacies measured (29–31 lm/W) are double of the commercial case. This electrode’s change could be easily incorporated into the industrial process. Of course, the light emission is no more uniform, and the target market must be changed. The luminance is also a key parameter as the lamp must be watched directly without any glare. Solutions to reduce the high luminance could be dimming as in the Planon lamp [22] or using a diffuse surface as LED [23]. Another field of application for this lamp could be the decontamination of surfaces by changing the phosphor layer and the glass [24].

Author Contributions

Experimental work and diagnostics: B.C., L.T., P.B., and P.G. All authors have read and agreed to the published version of the manuscript.

Funding

This research received no external funding.

Institutional Review Board Statement

Not applicable.

Informed Consent Statement

Not applicable.

Data Availability Statement

The data presented in this study are available on request from the corresponding author. The data are not publicly available because they have not been published elsewhere.

Acknowledgments

We thank Saint Gobain Research, Paris, France, for providing the lamps for this work.

Conflicts of Interest

The authors declare no conflict of interest.

References

  1. Kadam, A.; Nair, G.B.; Dhoble, S. Insights into the extraction of mercury from fluorescent lamps: A review. J. Environ. Chem. Eng. 2019, 7, 4. [Google Scholar] [CrossRef]
  2. Hu, Y.; Cheng, H. Mercury risk from fluorescent lamps in China: Current status and future perspective. Environ. Int. 2012, 44, 141–150. [Google Scholar] [CrossRef]
  3. Zissis, G. Energy Consumption and Environmental and Economic Impact of Lighting: The Current Situation. In Handbook of Ad-vanced Lighting Technology; Karlicek, R., Sun, C.-C., Zissis, G., Ma, R., Eds.; Springer International Publishing: Berlin/Heidelberg, Germany, 2016; pp. 1–13. [Google Scholar]
  4. Li, G.; Fleetham, T.; Li, J. Efficient and Stable White Organic Light-Emitting Diodes Employing a Single Emitter. Adv. Mater. 2014, 26, 2931–2936. [Google Scholar] [CrossRef]
  5. Reineke, S.; Lindner, F.; Schwartz, G.; Seidler, N.; Walzer, K.; Lüssem, B.; Leo, K. White organic light-emitting diodes with fluorescent tube efficiency. Nat. Cell Biol. 2009, 459, 234–238. [Google Scholar] [CrossRef]
  6. Bender, V.C.; Marchesan, T.; Marcos Alonso, J. Solid-State Lighting: A concise Review of the State of the Art on LED and OLED Modeling. IEEE Ind. Electron. Mag. 2015, 9, 6–16. [Google Scholar] [CrossRef]
  7. Kamegaya, T.; Matsuzaki, H.; Yokozawa, M. Basic study on the gas-discharge panel for luminescent color display. IEEE Trans. Electron. Devices 1978, 9, 25. [Google Scholar] [CrossRef]
  8. Meunier, J.; Belenguer, P.; Bœuf, J.P. Numerical model of an ac plasma display panel in neon-xenon mixtures. J. Appl. Phys. 1995, 78, 731–745. [Google Scholar] [CrossRef]
  9. Beaudette, T.; Guillot, P.; Belenguer, P.; Callegari, T.; Auday, G. Experimental characterization of dielectric barrier discharges for mercury-free flat lamps. In Proceedings of the 18th Europhysics Conference on Atomic and Molecular Physics of Ionized Gases, ESCAMPIG XVIII, Lecce, Italy, 12–16 July 2006. [Google Scholar]
  10. Caillier, B.; Beaudette, T.; Guillot, P.; Belenguer, P.; Therese, L. Spatial Emission of a Dielectric Barrier Discharge Lamp Driven by Sinusoidal or Square Voltage Excitation. In Proceedings of the ESCAMPIG, Granada, Spain, 9–13 June 2008; Windholz, L., Ed.; Europhysics Conference Abstracts 32 E. [Google Scholar]
  11. Carman, R.J.; Mildren, R.P. Computer modelling of a short-pulse excited dielectric barrier discharge xenon excimer lamp (172 nm). J. Phys. D Appl. Phys. 2002, 36, 19–33. [Google Scholar] [CrossRef]
  12. Mildren, R.P.; Carman, R.J. Enhanced performance of a dielectric barrier discharge lamp using short-pulsed excitation. J. Phys. D Appl. Phys. 2000, 34, L1–L6. [Google Scholar] [CrossRef]
  13. Kogelschatz, U.; Eliasson, B.; Egli, W. From ozone generators to flat television screens: History and future potential of dielec-tric-barrier discharges. Pure Appl. Chem. 1999, 71, 1819–1828. [Google Scholar] [CrossRef]
  14. Lee, J.; Oh, B.J.; Jung, J.C.; Whang, K.-W. High luminous efficiency mercury-free flat light source for LCD BLU. In IMID 05 Digest; The Korean Information Display Society: Seoul, Korea, 2005; pp. 1161–1164. [Google Scholar]
  15. Urakabe, T.; Harada, S.; Saikatsu, T.; Karino, M. A Flat Fluorescent Lamp with Xe Dielectric Barrier Discharges. J. Light Vis. Environ. 1996, 20, 20–25. [Google Scholar] [CrossRef]
  16. Caillier, B.; Guillot, P.; Therese, L.; Beaudette, T.; Belenguer, P. Spatial emission behaviour of dielectric barrier discharge lamp driven by sinusoidal or pulsed voltage excitation. In Proceedings of the IEEE 35th International Conference on Plasma Science, ICOPS 2008, Karlsruhe, Germany, 15–19 June 2008; p. 1. [Google Scholar]
  17. Shiga, T.; Ikeda, Y.; Mikoshiba, S.; Shinada, S. Mercurey-free Xe flat discharge lamps for lighting. J. Light Vis. Environ. 2001, 25, 10–15. [Google Scholar] [CrossRef] [Green Version]
  18. Shiga, T.; Mikoshiba, S.; Pitchford, L.C.; Boeuf, J.P. Investigation of efficacy in mercury-free flat discharge fluorescent lamp using a ze-ro-dimensional positive column model. In ICPIG 2003; Contributed Paper; Greifswald INP: Greifswald, Germany, 2003. [Google Scholar]
  19. Shiga, T.; Pitchford, L.C.; Boeuf, J.-P.; Mikoshiba, S. Study of efficacy in a mercury-free flat discharge fluorescent lamp using a ze-ro-dimensional positive column model. J. Phys. D Appl. Phys. 2003, 36, 512–521. [Google Scholar] [CrossRef]
  20. Ouyang, J.; Callegari, T.; Caillier, B.; Boeuf, J.-P. Large-gap AC coplanar plasma display cells: Macro-cell experiments and 3-D simulations. IEEE Trans. Plasma Sci. 2003, 31, 422–428. [Google Scholar] [CrossRef]
  21. Caillier, B. Diagnostics et Modélisation D’une Cellule D’écran à Plasma. Ph.D. Thesis, Université Paul Sabatier, Toulouse, France, 2004. [Google Scholar]
  22. Fiegler, M.; Ziemssen, K.; Homberg, B. A high resolution 5 mega pixel LCD display for medical applications with mercury-free flat panel lamp backlighting (PLANON). In SID 03 Digest; Society for Information Display: Baltimore, MD, USA, 2003. [Google Scholar]
  23. Lin, C.-Y.; Chao, R.-C.; Sung, Y.-C. LED Flat Lamp. 7677782. Available online: http://www.google.fr/patents?id=VafNAAAAEBAJ (accessed on 7 May 2012).
  24. Caillier, B.; Caiut, J.M.A.; Muja, C.; Demoucron, J.; Mauricot, R.; Dexpert-Ghys, J.; Guillot, P. Decontamination Efficiency of a DBD Lamp Containing an UV-C Emitting Phosphor. Photochem. Photobiol. 2015, 91, 526–532. [Google Scholar] [CrossRef]
Figure 1. Planilum structure [9].
Plasma 04 00006 g001
Figure 2. (Left) typical current and voltage for Planilum© lamp, Saint Gobain Research, Paris, France (2000 V-20 kHz). (Right) luminance measurement for the same conditions [9,10].
Plasma 04 00006 g002
Figure 3. Typical optical spectrum of Planilum© lamp with standard conditions and commercial ballast (2000 V-20 kHz).
Plasma 04 00006 g003
Figure 4. The CIE 1931 color space chromaticity diagram of the standard lamp.
Plasma 04 00006 g004
Figure 5. Patterns during ignition (A) 1400 V, (B) 1500 V, (C) 1600 V and (D) 2000 V [16]. Camera Dimage A2 Konika Minolta, 1/25 s, F5.6 iso 4000.
Plasma 04 00006 g005
Figure 6. ICCD imaging, on (left) sinusoidal and on (right) pulse. The ICCD camera used is a Princeton Instrument PI MAX; each picture was integrated over 5 periods. Gate is 5 microseconds for a half-period in the positive half-wave. The spacers (dark dots) are separated by 3 cm.
Plasma 04 00006 g006
Figure 7. Mapping of the luminance for the 36 × 46 cm Planilum©, 250 mbar, pulse amplitude 2000 V, 20 kHz, on the right log scale on the left linear scale. 10 replicates, standard deviation 10%.
Plasma 04 00006 g007
Figure 8. Electric measurements on Planilum lamp (20 kHz-2000 V) for pulse power supply.
Plasma 04 00006 g008
Figure 9. Luminance and efficacy as a function of power, frequencies (20–40 kHz) and 2 pressures (100–400 mbar) in plane-to-plane geometry and pulse power supply. Duty cycle 1%. 10 replicates, standard deviation 10%.
Plasma 04 00006 g009
Figure 10. A schematic of the principle of complementary coplanar geometry. The three stages of the development of the discharge in orange. The last case requires higher voltages than those available with our power supply, so this case was never observed. (based on experimental observations).
Plasma 04 00006 g010
Figure 11. Pictures of the lamp with complementary coplanar electrodes for two voltages at 250 mbar and 20 kHz.
Plasma 04 00006 g011
Figure 12. Mapping of the luminance for complementary electrodes configuration on 36 × 46 cm Planilum, 250 mbar, pulse 2200 V up, 3000 V down, 20 kHz, on the right, log scale; on the left, linear scale. 10 replicates, standard deviation 10%.
Plasma 04 00006 g012
Figure 13. Luminance and efficacies for 100 mbar (left) and 400 mbar (right) with complementary coplanar geometry electrodes. 10 replicates, standard deviation 10%.
Plasma 04 00006 g013
Table 1. Summary of the mean efficacy for alternate complementary coplanar configuration for several pressures and waveforms. The plane-to-plane geometry is retained as a reference. Based on the results presented in Figure 13, the standard deviation is 10%.
Pressure Ne–Xe 50%Mean Efficacy (lm/W)
Plane-to-PlaneComplementary Configuration
(mbar)PulseSinusPulse
100121429
150141530
200151528
250171630
30019 30
40022 31
Publisher’s Note: MDPI stays neutral with regard to jurisdictional claims in published maps and institutional affiliations.

