Article

Negative Hydrogen and Deuterium Ion Density in a Low Pressure Plasma in Front of a Converter Surface at Different Work Functions

1
Max-Planck-Institut für Plasmaphysik, Boltzmannstr. 2, 85748 Garching, Germany
2
AG Experimentelle Plasmaphysik, Universität Augsburg, 86135 Augsburg, Germany
*
Author to whom correspondence should be addressed.
Plasma 2021, 4(1), 94-107; https://doi.org/10.3390/plasma4010007
Submission received: 10 December 2020 / Revised: 22 January 2021 / Accepted: 3 February 2021 / Published: 18 February 2021

Abstract

:
Negative ion sources of neutral beam injection (NBI) systems for future fusion devices like ITER (“The Way” in Latin) rely on the surface conversion of hydrogen (or deuterium) atoms and positive ions to negative ions in an inductively coupled plasma (ICP). The efficiency of this process depends on the work function of the converter surface. By introducing caesium into the ion source the work function decreases, enhancing the negative ion yield. In order to study the isotope effect on the negative ion density at different work functions, fundamental investigations are performed in a planar ICP laboratory experiment where the work function and the negative ion density in front of a sample can be simultaneously and absolutely determined. For work functions above 2.7 eV, the main contribution to the negative hydrogen ion density is solely due to volume formation, which can be modeled via the rate balance model YACORA H , while below 2.7 eV the surface conversion become significant and the negative ion density increases. For a work function of 2.1 eV (bulk Cs), the H density increases by at least a factor of 2.8 with respect to a non-caesiated surface. With a deuterium plasma, the D density measured at 2.1 eV is a factor of 2.5 higher with respect to a non-caesiated surface, reaching densities of surface produced negative ions comparable to the hydrogen case.

1. Introduction

The two neutral beam injection (NBI) systems for ITER (“The Way” in Latin) will be based on the acceleration of negative hydrogen or deuterium ions [1,2,3]. The corresponding negative hydrogen ion sources must deliver a homogeneous beam for pulses of up to one hour, with an extracted negative ion current density of 329 A/m 2 for hydrogen and 286 A/m 2 for deuterium, over an ion source area of 1   ×   2 m 2 and with a ratio of co-extracted electron to extracted negative ion current density below unity. The ion source must operate at a filling pressure of 0.3 Pa. To fulfill the strict requirements, the negative ion source for ITER relies on the surface conversion of hydrogen particles into negative ions by electron transfer from a low work function surface [4]. The impinging particles are positive ions and atoms created in an inductively coupled plasma (ICP). The converter surface is the first grid of the multi-grid multi-aperture extraction and acceleration system (i.e., the plasma grid with 1280 apertures) and is made of Mo-coated copper. In order to reduce its work function—around 4.6 eV for Mo [5]—caesium is evaporated in the source [6], since it is the alkali metal with the lowest work function among all stable elements (2.1 eV for bulk Cs [5]). The low surface work function achieved with Cs evaporation and adsorption has a two-fold function. Apart from a significant enhancement of the negative ion formation [4] leading to higher extracted currents [7], the increased density of negative ions in front of the plasma grid furthermore repels the electrons from the converter surface, decreasing consequently the co-extracted electron current.
The test facility ELISE is in operation since 2013 and has the aim to demonstrate the feasibility to fulfill the ITER requirements during long pulse operation with an ion source half of the size of the ITER source [7,8]. The source operation is mainly limited by the unstable co-extracted electron current, which strongly increases during long pulses up to values harmful for the extraction system [9]. This issue can be correlated to a temporal decrease of the Cs flux towards the plasma grid [10], which determines the work function of the surface during long plasma operation [11]. If the surface work function changes during long pulses, the flux of surface created negative ions into the plasma slightly decreases and the electron flux towards the grid system consequently increases. For a well-caesiated source at high performance, the electrons represent the minority species in front of the converter surface [7,12]. Hence, slight changes of the absolute negative ion flux coming from the surface have a large impact on the electrons.
It has been demonstrated at ELISE that the ITER relevant extracted negative ion current density can be achieved for hydrogen while keeping the co-extracted electron to extracted ion current ratio below unity [13]. For deuterium operation, however, the ITER requirements are not yet fulfilled [9] due to a higher amount and a stronger temporal dynamics of the co-extracted electrons with respect to hydrogen operation. This limits the operation of the source (limiting namely the applied radio frequency power and extraction voltage) and consequently the extraction of negative ions both in terms of extracted current and pulse length. The highest extracted D current density achieved so far in a long plasma pulse of 45 min with pulsed extraction is 190 A/m 2 , corresponding to 66% of the current density required by ITER [9] (with co-extracted electron to negative ion density ratio below 1).
The stronger dynamics of the co-extracted electron current in deuterium may be connected to a different flux of surface created negative ions leaving the plasma grid in hydrogen and deuterium plasmas. In the ion sources, a lower flux of surface created negative ion is expected in deuterium since recent measurements of negative ion density measured at 2 cm from the plasma grid show comparable densities in hydrogen and deuterium [14], while the velocity of the outgoing negative ion is lower in deuterium due to the higher mass. As it will be explained in Section 2.2, the flux of negative ions leaving the surface depends on the flux of incoming particles and on the negative ion yield. In the ion sources, the negative ions are mainly converted from atoms created in the plasma [15], and similar atomic fluxes are achieved in hydrogen and deuterium operation [7,16,17], hence a different flux of incoming particles can be excluded. The negative ion yield depends on the energy of the impinging particle, the surface work function, and possibly the isotope (see Section 2.2). Regarding the energy of the hydrogen and deuterium atoms, measurements are currently ongoing at the ion sources, while in-situ work function measurements are difficult to be performed. Experiments carried out in the ICP laboratory experiment ACCesS have shown that it is possible to achieve a surface work function of 2.1 eV both in hydrogen and in deuterium [11,18]. Nonetheless, it is not assured that the measurements of negative ion density taken at the ion sources for a comparison between hydrogen and deuterium are performed at the same work function. In order to have simultaneous measurements of work function and negative ion density in front of a caesiated surface exposed to a plasma, experiments are carried out at ACCesS to investigate the isotopic difference in the negative ion formation on a fundamental level.
Since the formation of negative ions can occur not only via surface processes but also in the plasma volume, an overview of the H formation and destruction mechanisms is given in Section 2. The ICP experiment ACCesS is described in Section 3 together with the diagnostics applied for the current investigations (Section 3.1). Section 3.2 describes the measurement procedure, and the rate balance model YACORA H used to determine the H density via volume formation is introduced in Section 3.3. Finally, the results of the investigations performed in hydrogen and deuterium plasmas are shown and discussed in Section 4.

2. Negative Ion Formation in Low Pressure Plasmas

2.1. Volume Formation

Negative hydrogen ions are formed in the plasma volume via dissociative attachment of an electron to a vibrationally excited hydrogen molecule in the ground state H 2 ( ν ) , characterized by the vibrational quantum number ν , colliding with a slow electron via an unstable negative hydrogen molecular ion:
H 2 ( ν ) + e H 2 H + H .
For the range of typical electron temperatures in ion sources (around 1 eV), the rate coefficient strongly increases with increasing ν and in particular, for ν     5 [4,19] and for highly vibrationally excited states ( ν     8 ) the rate coefficients decrease with increasing electron temperature. In the case of deuterium, the rate coefficients for the dissociative electron attachment are lower than in hydrogen due to lower cross sections [19,20], and become significant for vibrational levels with quantum numbers ν     8 .

2.2. Surface Formation

Atomic hydrogen and positive hydrogen ions generated in the plasma can be converted into negative hydrogen ions via electron transfer from a low work function surface. The probability for this process to happen depends on several factors, such as the work function of the converter surface and the energy and type of the impinging particle (H or H x + , with x = 1 , 2 , or 3).
For impinging atomic hydrogen, the conversion process is the following:
H + e surface H .
Impinging positive ions are neutralized first when approaching the converter surface by Auger neutralization or resonant charge transfer, and the resulting neutral particles are converted into negative ions [21,22]:
H x + + 2 e surface H + H x 1 ( x = 1 , 2 , 3 ) .
The probability to create negative hydrogen ions is given by [23,24,25]
P exp χ E A C v H ,
where χ is the surface work function, the electron affinity E A is 0.75 eV, C is a constant, and v H is the velocity of the escaping negative hydrogen ion perpendicular to the surface, which depends on the energy of the particle impinging onto the surface. From Equation (4) the probability to create negative hydrogen ions is furthermore highly enhanced by lowering the work function χ of the converter surface. Since the work function of most of the metals is above 4 eV [5], in negative hydrogen ion sources based on surface conversion the H production is enhanced by evaporation and adsorption of caesium at the converter surface.
The conversion yield Y is introduced to describe the efficiency of surface formation of negative ions and relates the flux Γ H H (or Γ H x + H ) of the negative ions leaving the surface to the incoming flux Γ H (or Γ H x + ) of impinging atoms (or positive ions) from the plasma:
Γ H H = Y H H Γ H and
Γ H x + H = Y H x + H Γ H x + .
Conversion yields Y H H for atoms and Y H x + H for positive ions at partially caesiated molybdenum surfaces (work function of 1.4–1.5 eV) have been experimentally measured in ultra-high vacuum systems in [22,26,27,28] for atomic hydrogen and in [21,22] for positive ions. It is shown that the conversion yield is not negligible for energies of the impinging particles above a certain value, which corresponds to around 1 eV for partly caesiated surfaces [26].
For the deuterium case, the conversion processes are the same as in hydrogen, as well as the electron affinity. Due to the higher mass of D , the velocity of the ions leaving the surface is expected to be lower, leading presumably to a lower formation probability P and hence to lower conversion yields. To the best of the authors’ knowledge, no measurements of the conversion yields in deuterium are present in the literature.

2.3. Destruction Mechanisms

The negative ion formation is balanced by several destruction processes that can take place in the plasma volume by collisions with electrons (electron detachment):
e + H H + 2 e ( ED ) ,
by collisions with positive ions (mutual neutralization):
H x + + H H + H x ( x = 1 , 2 , 3 ) ( MN ) ,
by collisions with hydrogen atoms (associative and non-associative detachment):
H + H H 2 + e ( AD ) ,
H + H 2 H + e ( nAD ) ,
and by collisions with hydrogen molecules (collisional detachment):
H 2 + H H + H 2 + e ( CD ) .
The rate coefficients for the different destruction mechanisms can be calculated from the cross-sections in [29] and are plotted in Figure 1, where the electron detachment rate coefficient is a function of the electron temperature T e while for the other collisions the rate coefficient is a function of the negative ion temperature T H . The temperature of the other species has been set to 500 K (typical gas temperature at low-pressure ICP hydrogen plasmas) for the solid lines, while for processes where the involved particles have a similar mass (mutual neutralization with H + and non-associative/associative detachment with H) the case with T H = T H + = T H is also shown with dashed lines.
For the case of deuterium, the same destruction processes are present. The cross-sections for the associative detachment and collisional detachment are available in [30,31], respectively: for the first process, the cross-sections for deuterium are comparable with respect to the hydrogen case, while the collisional detachment shows higher cross-sections in deuterium for energies close to the threshold. Unfortunately, no cross-sections are available at present in the literature for the other destruction processes, in particular regarding the mutual neutralization with positive ions, which involves molecular species that have different vibrational and rotational levels with respect to hydrogen.

3. Experimental Setup

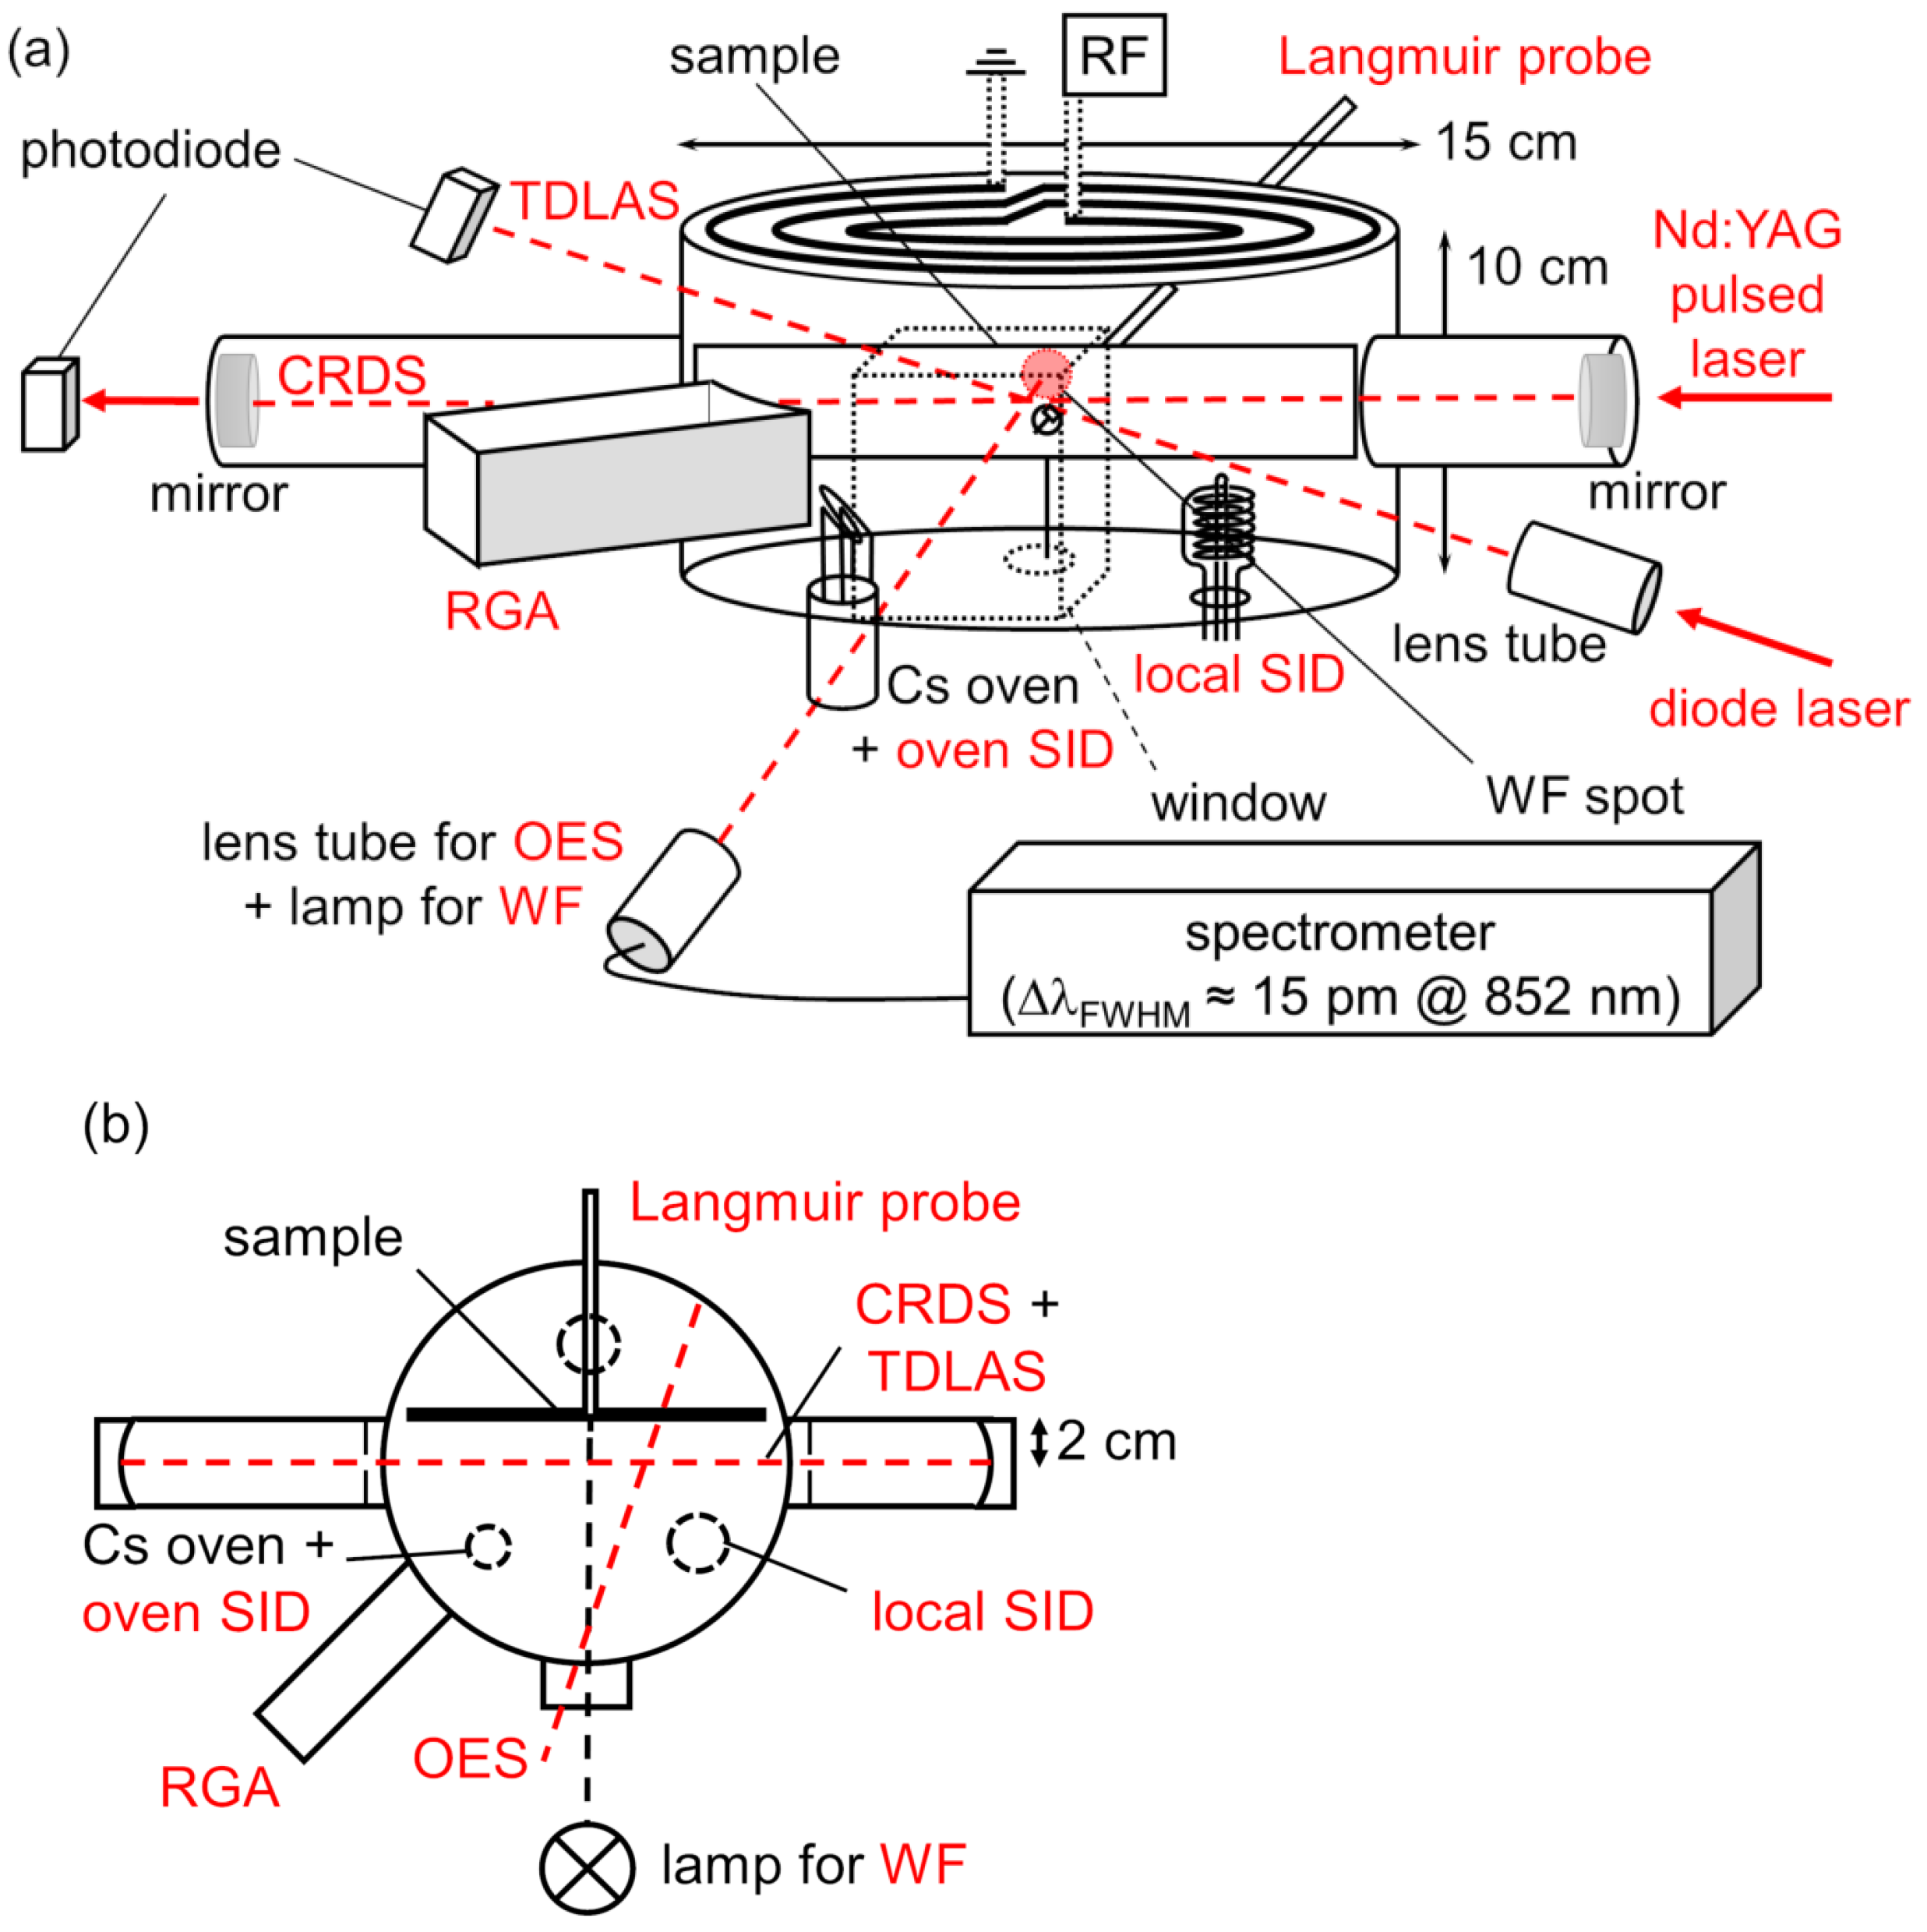
The flexible laboratory experiment ACCesS [11,18] (Augsburg Comprehensive Cesium Setup) is a planar ICP, consisting of a cylindrical stainless steel vessel with a diameter of 15 cm and a height of 10 cm, as shown in Figure 2. The background pressure within the vessel is on the order of 10 6 mbar, obtained by means of a turbomolecular pump and a rotary vane forepump. For the current investigations, the vacuum chamber is filled with hydrogen or deuterium gas at a pressure of 2 Pa (gas flow of 10 sccm), and the plasma is generated via inductive RF coupling (frequency 27.12 MHz, applied RF power 450 W) using a planar coil located on top of the vessel. The vessel walls are temperature controlled by a cooling water circuit to limit the temperature during plasma operation to below 45 °C. Caesium is evaporated into the experiment by heating a liquid Cs reservoir in an oven located at the bottom plate. The sample holder is positioned near the center of the experimental chamber, and it is electrically and thermally insulated from the vessel. A stainless steel sample with a size of 140   ×   24 mm 2 and thickness of 1 mm is clamped to the sample holder with screwable stainless steel clamps, elongated along the vessel diagonal. The temperature of the sample surface is constantly monitored by means of a thermocouple clamped on the front side of the sample. In steady-state plasma operation, the temperature of the sample surface is 320 °C in hydrogen and 430 °C in deuterium.

3.1. Diagnostics

The setup counts several diagnostic systems operating in a vacuum and/or in a plasma environment. Several diagnostic systems for Cs detection surround the sample: two surface ionization detectors (SID) monitor the Cs outflow from the oven and the redistribution in the vessel during vacuum and gas phases [32], while the neutral Cs density is absolutely measured by tunable diode laser absorption spectroscopy (TDLAS) averaged along the diagonal line of sight in vacuum and plasma environment [11]. In order to monitor the impurity content which may affect the conditions of the Cs layer, a residual gas analyzer (RGA) is used during vacuum and plasma operation [33].
During plasma operation, optical emission spectroscopy (OES) is applied for monitoring the Cs emission and the plasma parameters [34], e.g., the gas temperature, the vibrational temperature of the H 2 molecule, and the atomic hydrogen density, averaged along the line of sight crossing the vessel as shown in the top view in Figure 2b [33]. Local measurements of electron density and electron temperature, as well as the electrostatic potentials, are obtained by a movable cylindrical Langmuir probe (100 µm diameter tungsten wire) located at the center of the vessel. The sample and the sample holder have a feedthrough which allows us to insert the probe from the back side [35]. The measurements represent an average over the length of the probe tip (ca. 8 mm). For the present investigations, the maximal distance of the probe tip from the sample surface is around 8 mm.
The work function (WF) of the sample surface is evaluated using the photoelectric effect induced by irradiation and applying the Fowler method [36]. The setup and the analysis are described in detail in [37] with the improvements presented in [11] and are shortly summarized here. A high-pressure mercury lamp (100 W) is applied as a broadband light source, and the light passes through changeable interference filters and is focused on the sample resulting in a spot diameter of about 1.5 cm. The photo-emitted electrons are collected at the vessel walls by applying a bias voltage of 30 V to the sample against the grounded walls. The photocurrents are measured by a Keithley 602 Electrometer, and the sensitivity range is determined by the dark current, which for the present investigations is between 10 10 A in a vacuum before Cs evaporation and 10 6 A after plasma with Cs evaporation. The work function is absolutely determined by measuring the photocurrents for different interference filters. Twenty filters with central transmission wavelengths between 239 and 852 nm and with a nominal FWHM of 10 nm are available for the current investigations, making accessible the mean photon energies in the range between 5.04 and 1.45 eV. The entire setup was calibrated by means of an absolutely calibrated spectrometer and a radiant power meter. The photocurrents cannot be measured during plasma operation, since the plasma electrons contribute to the measured current and it is not possible to discern the low photocurrents from the total current. Hence, the work function is measured within the first minutes (max. 3 min) after switching off the plasma. The plasma is thus pulsed with lengths ranging from one hour up to several hours. The typical error of the evaluated work function is 0.1 eV.
For the evaluation of the negative hydrogen ion density near the sample surface, a cavity ring-down spectroscopy system (CRDS) is installed. A Nd:YAG laser (Continuum Minilite I) emitting at the wavelength of 1064 nm is used as a laser source, with a pulse length of 7 ns and pulse energy below 10 mJ. Two high-reflectivity mirrors (CVI Melles Griot, with a curvature radius of 1 m and a nominal reflectivity of 99.999% at 1064 nm) are located at a distance of 1.2 m from each other to form the cavity. The length of the absorbing medium, i.e., the plasma, is assumed to correspond to the vessel diameter, hence 0.15 m. The detection limit for the line of sight averaged negative ion density is n i     5   ×   10 14 m 3 . The error associated with the measured n i is around ± 30 % for high densities (≥ 10 15 m 3 ), while the error can increase up to 100 % for densities close to the detection limit. Since the CRDS system provides a line of sight averaged measurement of the negative ion density, the sensitivity of the CRDS regarding the detection of negative hydrogen ions created by surface processes is strongly enhanced by using a long sample of 14 cm along the line of sight. The distance of the line of sight from the surface is about 2 cm, while the survival length of the negative ions created by surface conversion is expected to be about few cm.

3.2. Measurement Procedure

The investigations here presented aim to determine the contribution of the surface production of negative ions to the total negative ion density measured in front of a surface at different work functions. The volume production of negative ions represents a detection limit and must be as low as possible. For the current investigations, a plasma at a pressure of 2 Pa and RF power of 450 W is applied since it has shown that the H density in the volume as measured by CRDS for the non-caesiated surface is below the detection limit of 5   ×   10 14 m 3 . The H density is low because of the low density of H 2 molecules. The main destruction mechanism is constituted by the (non-)associative detachment with atomic hydrogen, whose density is around 4   ×   10 18 m 3 . The second channel of H destruction is given by collisions with electrons, which follow a Maxwellian energy distribution with an electron temperature of around 4.6 eV and an electron density of n e 1.1   ×   10 16 m 3 .
As observed in Section 2.2, the surface production of negative ions can be due to impinging atoms and/or positive ions. The fluxes of hydrogen atoms and positive ions (H 2 + is assumed to be the dominant ion species at 2 Pa) are Γ H 3.3   ×   10 21 m 2 s 1 and Γ + 1.6   ×   10 20 m 2 s 1 , respectively. The potential drop at the surface is about 21 V, determining the maximum energy of the impinging positive ions, while the temperature of the atoms is assumed equal to the gas temperature which is around 0.04 eV. Due to the high energy of the positive ions (accelerated towards the sample in the sheath region), the surface conversion of positive ions into negative ions is dominant with respect to the surface conversion of atoms, which is assumed to be negligible due to the low energy of the atoms.
For the investigations in hydrogen and deuterium, the same procedure has been followed. For each measurement, a plasma pulse of at least one hour is performed: the negative ion density is measured at the end of the plasma pulse, while the work function immediately after the end of the pulse. The first measurement is performed with the non-caesiated stainless steel sample (work function of 4.5 eV) to measure the volume produced H density since the surface production is assumed to be negligible. The second measurement is taken at a work function of 2.1 eV, hence with a caesiated surface. The caesiation of the sample is performed during a continuous plasma operation of 5 h (as shown in [11]), where the Cs density is step-wise increased up to 1.8   ×   10 15 m 3 corresponding to a flux of around 10 17 m 2 s 1 . This flux assures a surface work function of 2.1 eV at the end of the plasma operation (plasma and caesium evaporation are switched off simultaneously), and the corresponding H density is measured. In order to vary the work function and collect measurements between 2.1 eV and 4.5 eV, plasma pulses of one hour each are performed without further Cs evaporation in the experiment. In fact, it is known from [11] that the plasma exposure can remove gradually caesium from the surface and consequently change the work function, if no fresh Cs is evaporated into the vessel. In this way, the H density for work function values in between 2.1 and 4.5 eV can be measured. After 5 h of total plasma exposure, the work function of the bare substrate (4.5 eV) is retrieved since the deposited caesium is completely removed from the surface, and the negative ion density is again measured and compared to the very first measurement (prior to the caesiation), finding a full agreement.

3.3. Modelling of the H Volume Processes

Generally, the negative ion density measured by CRDS includes both the contribution of volume and surface created negative ions. Since the investigations aim to study the surface produced H density, the contribution of the volume production must be determined. As already explained, the first measurement is performed with a clean non-caesiated stainless steel sample (at work function of 4.5 eV). At such a high work function, the contribution of the surface created negative ions is assumed to be negligible, hence the negative ion density measured by CRDS is only due to volume processes. However, for the following measurements at a lower work function, the volume production can change due to a variation of the plasma parameters observed by means of OES and Langmuir probe. In order to determine the volume contribution at low work functions, the volume production of negative hydrogen ions is modeled by balancing the different production and destruction rates via the solver YACORA [38] for steady-state conditions. This model is called YACORA H and is described in detail in [39,40]. For the destruction rates, the input parameters are all diagnostically accessible, i.e., the molecular and atomic hydrogen density, the electron and positive ion density, the gas temperature and the electron temperature. A temperature of 0.2 eV is assumed for the H ions created by volume processes since this value was measured in different experimental setups [41,42]. The rate coefficients can be thus determined from Figure 1. For the production rates, the electron density and temperature are diagnostically accessible as already mentioned, while the vibrational population of the hydrogen molecules is considered as a superposition of two Boltzmann distributions [39]: the lower vibrational temperature T vib low (for ν 3 ) is experimentally obtained by means of OES [34], while the higher vibrational temperature T vib high (for ν > 3 ) is a free parameter. To determine this free parameter, the first measurement, taken at 4.5 eV, is considered, since the measured H density is only due to volume processes: a value of T vib high is found by tuning it to adapt the modeled H density to the one measured by CRDS. This value of T vib high can then be used for modeling the volume produced H density at lower work functions. In the case of deuterium, the YACORA H model cannot be applied due to lack of knowledge on the cross-section of the destruction processes, hence the volume negative ion density can only be measured by CRDS at 4.5 eV.

4. Results and Discussion

4.1. Correlation between Work Function and H Density

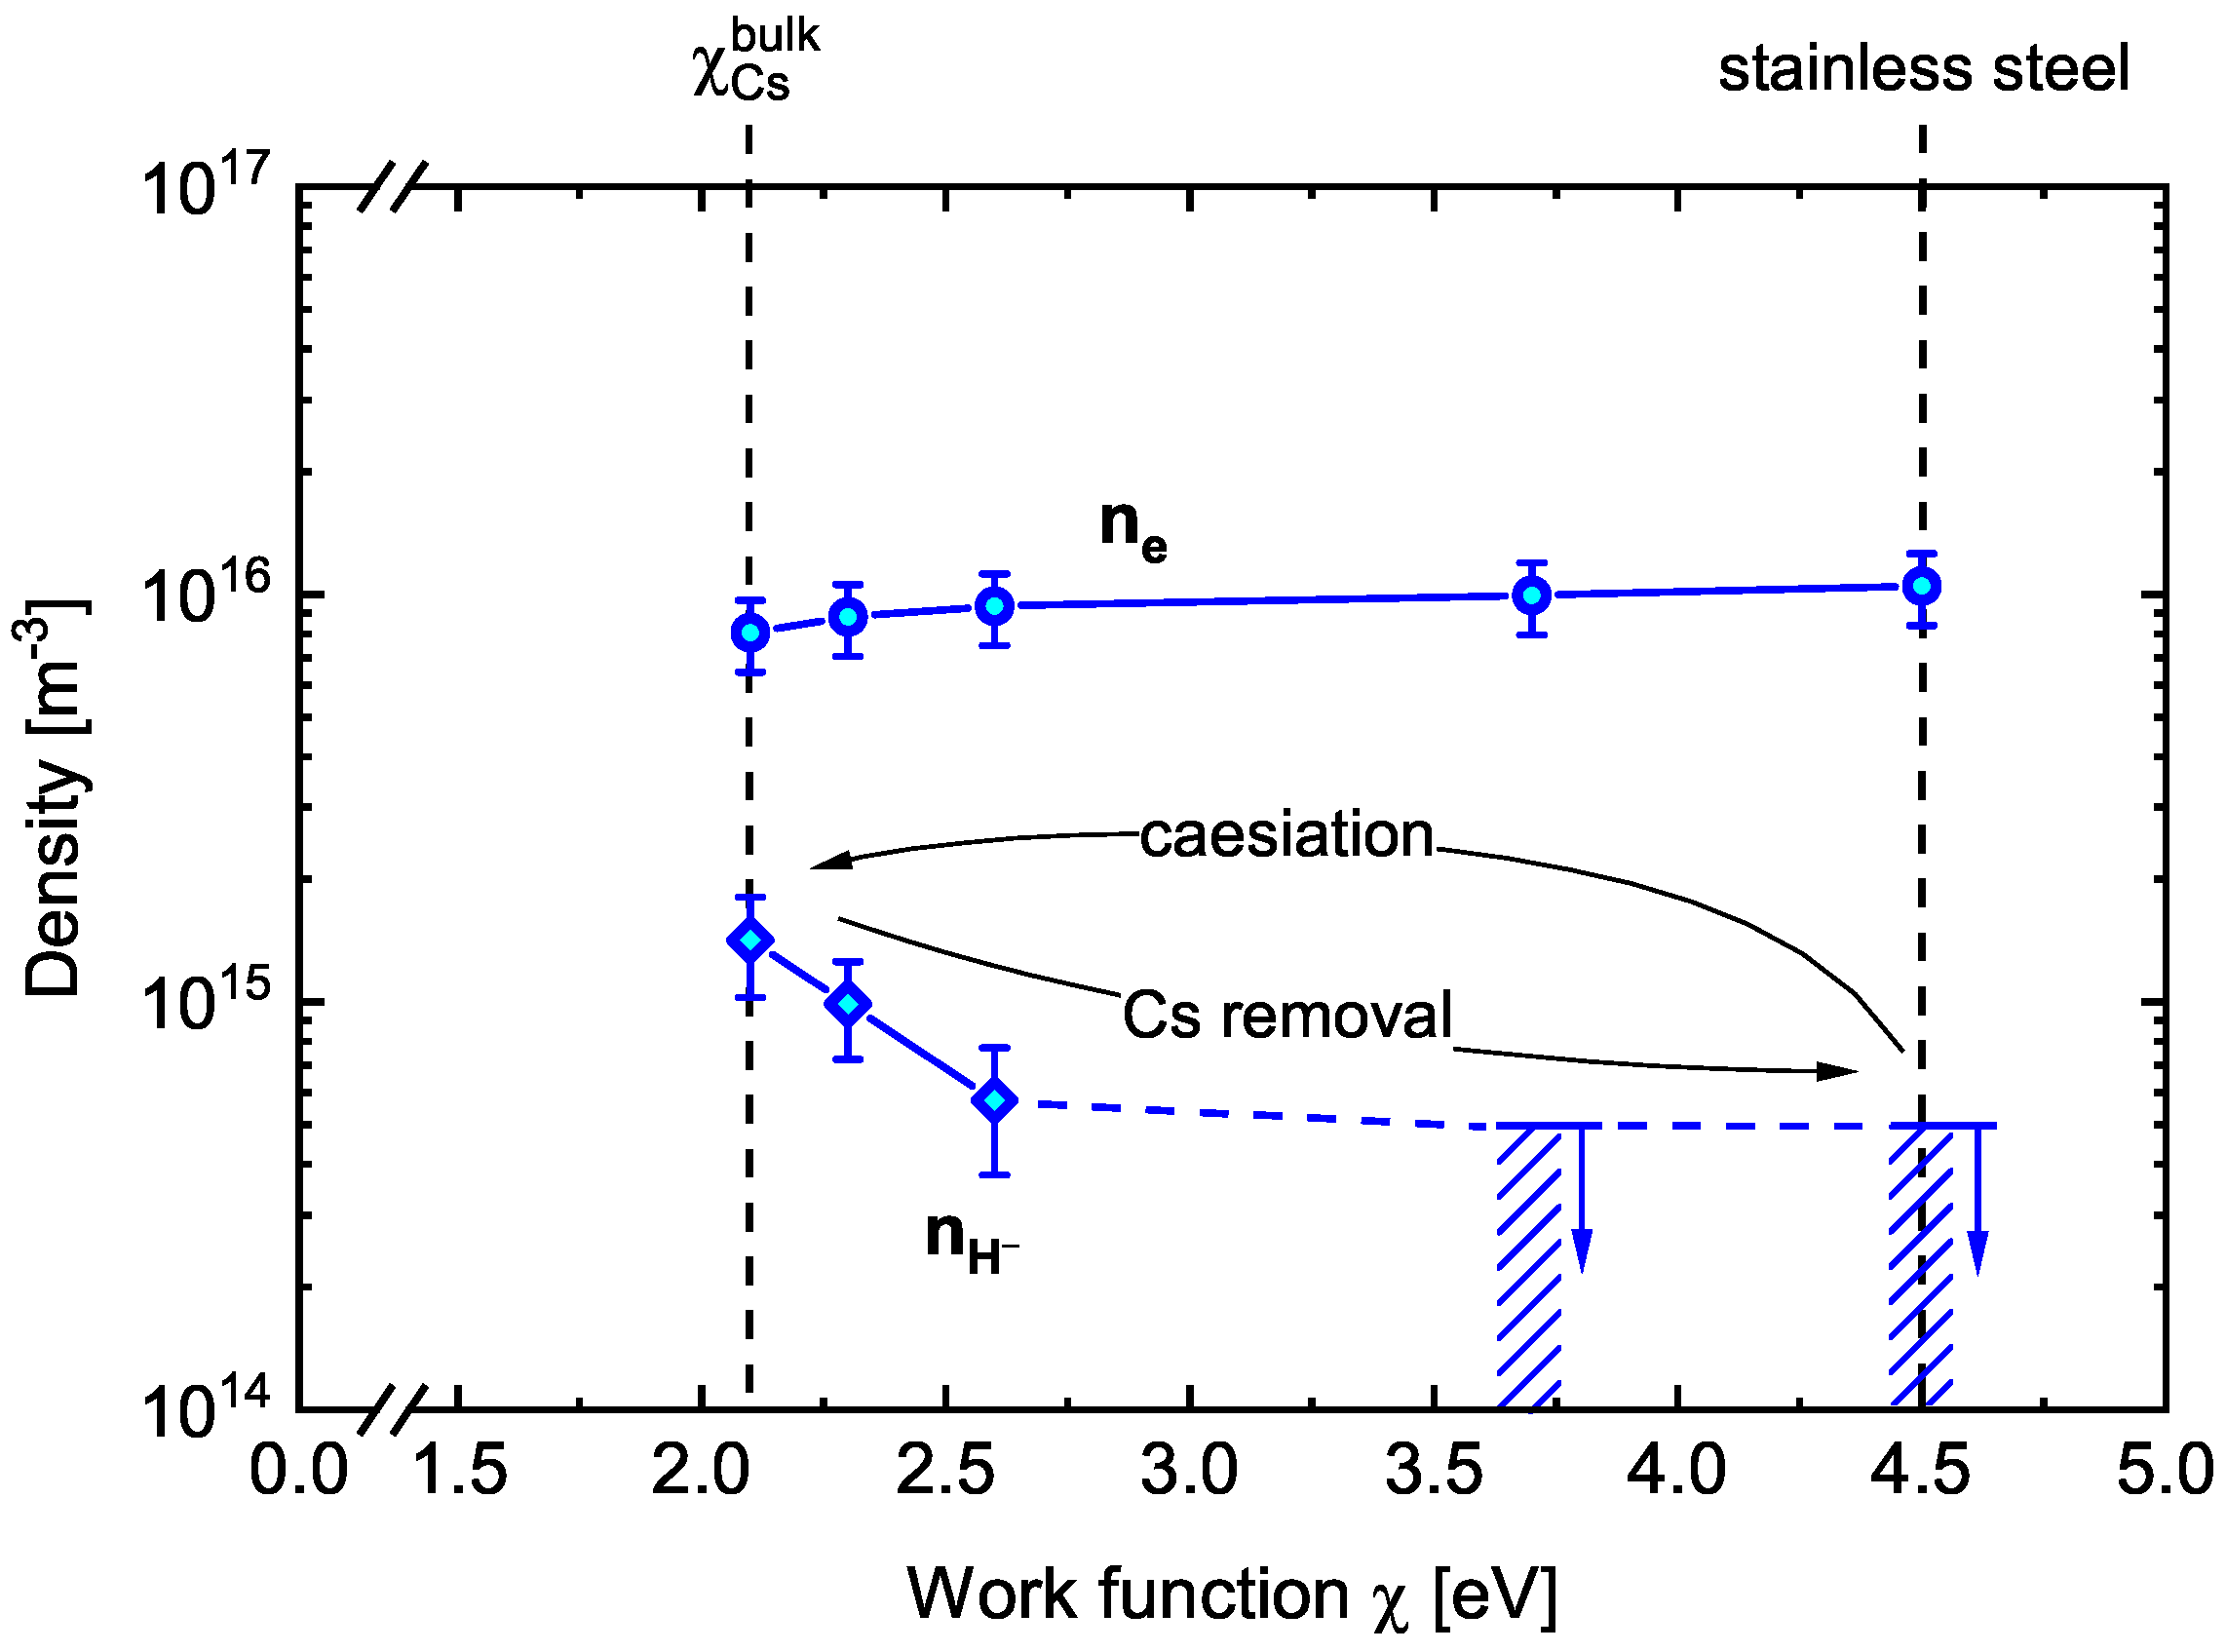
Figure 3 shows the H density and the electron density for different surface work functions χ . For χ equal to 4.5 eV corresponding to the bare substrate before the caesiation, the negative hydrogen ion density is below the detection limit of the CRDS, i.e., below 5   ×   10 14 m 3 , while the electron density is 1.1   ×   10 16 m 3 . When the sample is caesiated and the work function of 2.1 eV ( χ Cs bulk ) is achieved, the negative ion density increases up to 1.4   ×   10 15 m 3 (observing an increase by a factor of at least 2.8 with respect to the non-caesiated surface) and simultaneously the electron density decreases down to 8   ×   10 15 m 3 . A decrease of the atomic hydrogen density is also observed when Cs is applied, from around 4   ×   10 18 m 3 down to 1   ×   10 18 m 3 . A similar effect on the atomic density during caesiation was also observed in [35]. The subsequent plasma pulses lead to the Cs removal and consequent change of the work function, allowing to take measurements at 2.3, 2.6 and 3.7 eV, until the work function of 4.5 eV is reached again. As a result, the negative ion density decreases with increasing work function, while the electron density increases, as a consequence of the quasi neutrality of the plasma. The sum of the negative ion and electron densities must be constant to balance the positive ion density, which corresponds to 1.1   ×   10 16 m 3 .
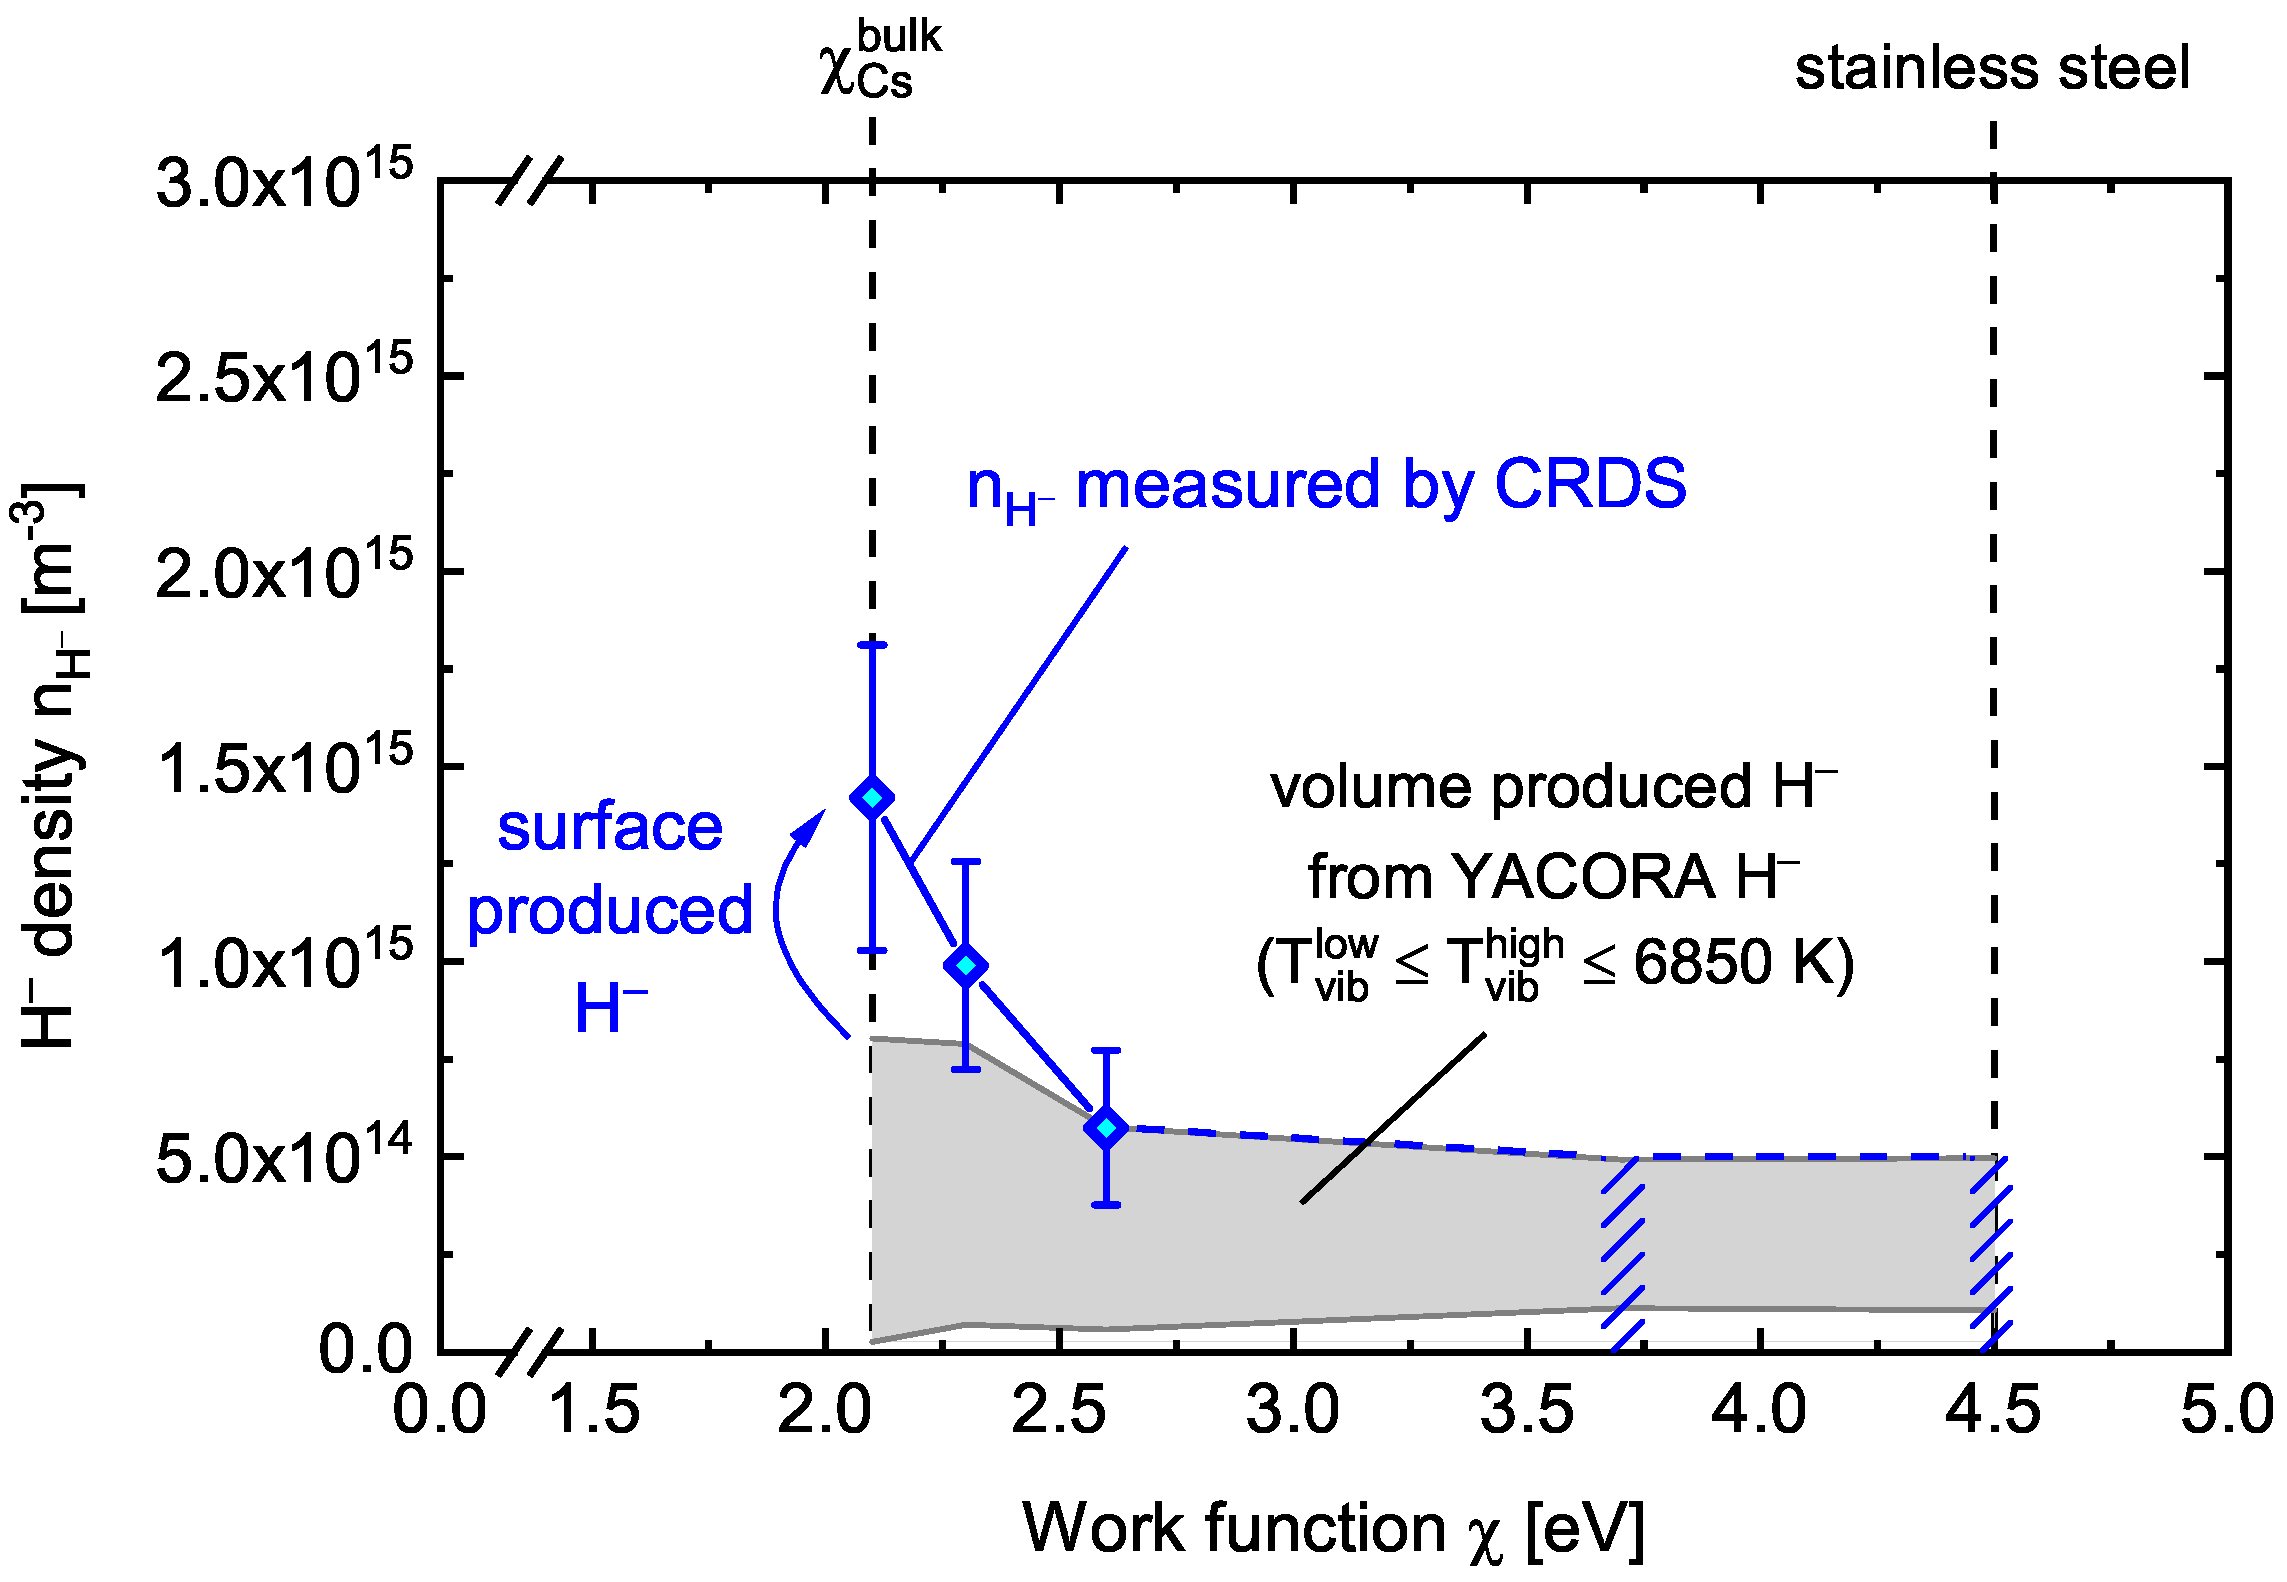
Caesiation, in combination with lowering the surface work function enhancing the surface production of negative ions, changes the plasma boundary in front of the surface, as already observed with the electron density. Thus, the influence of the changed plasma parameters on the H volume production is considered in the following. The volume production of negative ions is investigated with YACORA H for the plasma parameters measured at the different work function values. The different input parameters, such as the particles’ densities, the electron temperature, the gas temperature, and the lower vibrational temperature T vib low , can be estimated by measurements taken for each work function. Only the higher vibrational temperature T vib high is unknown, and this can be assessed via modeling the H volume production at 4.5 eV, where the surface contribution is assumed to be negligible and the measured H density can be matched to the modeled one by tuning T vib high . Since the negative ion density at χ = 4.5 eV is below the CRDS detection limit, an upper limit is given for T vib high using the detection limit of 5   ×   10 14 m 3 as negative ion density, obtaining a high vibrational temperature of 6850 K. In order to take into account the uncertainty of the actual negative ion density, T vib high is assumed to lay in the range between T vib low , which at 4.5 eV is equal to 3500 K, and 6850 K. Taking all the measured plasma parameters with their error bars and the evaluated T vib high range, the volume produced negative ion density is calculated using YACORA H for the plasma parameters at each work function point. The respective range of volume produced negative ion density is shown in Figure 4 as a gray shaded area, including the lowest and the highest possible value for the volume produced H density.
The negative hydrogen ion density expected from volume production might slightly increase for low work functions due to a decrease of the destruction rate of the associative detachment, since a decrease of the atomic hydrogen density is observed when Cs is applied. However, the range of values corresponding to the volume production is lower than the actual H density measured by CRDS at work functions of 2.1 eV and 2.3 eV, assuring that the increase of the H density is mainly due to the contribution of the surface produced negative ions. Since the flux of positive ions and their energy are constant for varying work function, the enhancement of the negative ion density at low work functions is traced back to the enhanced surface conversion probability after Equation (4), which is directly related to the surface work function.

4.2. Comparison between H 2 and D 2 Plasmas

Figure 5 shows the negative ion density n i , measured by CRDS, and the electron density n e , measured by means of the Langmuir probe, for the hydrogen case in blue and for the deuterium case in red. For a work function of 4.5 eV, corresponding to a non-caesiated stainless steel surface, the measured D density is n D = 7   ×   10 14 m 3 , i.e., absolutely measurable above the detection limit. The volume production of negative ions is enhanced in deuterium due to the fact that the electron density is 45% higher in deuterium (around 1.6   ×   10 16 m 3 ). The atom density (mainly responsible for the negative ion destruction in volume) is 17% higher in deuterium with respect to hydrogen, however, the increased destruction rate does not balance the enhanced production, resulting thus in a higher negative ion density in deuterium.
For decreasing work functions down to 2.1 eV, the negative ion density increases reaching 1.8   ×   10 15 m 3 for deuterium. The D density shows an increase by a factor of 2.5 from the value measured at χ = 4.5 eV, comparable with the hydrogen case where at least a factor of 2.8 is observed. A reduction of the electron density as detected during hydrogen operation was not observed in deuterium operation. However, the expected reduction of the electron density—necessary to fulfill the quasi-neutrality principle—would lay within the error bars of the measurements.
Figure 6a shows again the negative ion density measured by CRDS for the hydrogen and deuterium cases including the contribution from the volume production of negative ions (for hydrogen the same as in Figure 4). For deuterium, as for hydrogen, the reference value for the volume produced D density is taken as the density measured at χ = 4.5 eV. However, to determine the volume production at lower work functions, the model YACORA H cannot be applied. A similar trend with respect to hydrogen might be though expected since OES data suggest that a reduction of the atomic deuterium density takes place during caesiation. However, since the volume produced D density at work functions below 4.5 eV cannot be assessed by modeling, eventual variations of the volume production level are considered to occur within the range defined by the error bar at χ = 4.5 eV. This range is shown in Figure 6a as the red shaded area.
Subtracting the range for the volume production as depicted in Figure 6a from the values measured by the CRDS system gives the surface produced negative ion density, which is shown in Figure 6b. The values for the surface produced H and D densities are thus given as a range depicted in blue for hydrogen and in red for deuterium. In both cases, the density is around 1   ×   10 15 m 3 at χ = 2.1 eV.
In order to finally assess that there is no difference between hydrogen and deuterium regarding the surface production of negative ions, a discussion about the flux and energy of the impinging positive ions is needed for the two isotopes. The positive ion density is assessed by the sum of electron density and negative ion density since quasi-neutrality applies within the error bars for both the isotopes: the positive ion density is around 1.1   ×   10 16 m 3 for hydrogen and 1.7   ×   10 16 m 3 for deuterium. However, though the deuterium plasma shows a higher density with respect to the hydrogen plasma, the flux of positive ions towards the surface is comparable for the two isotopes due to the difference in mass, resulting in an ion flux of 1.6   ×   10 20 m 2 s 1 for hydrogen and 1.7   ×   10 20 m 2 s 1 for deuterium.
The plasma potential decreases with caesiation from 22 V to 18 V for hydrogen and from 19 V to 17 V for deuterium. The sample potential decreases as well from + 1 V to 3 V in hydrogen and from + 1 V to 1 V in deuterium. Considering the error bars ( ± 1.5 V), the difference between plasma potential and sample potential is considered constant and around 21 V in hydrogen and 18 V for deuterium. This potential difference determines the energy of the positive ions impinging on the surface, and thus the conversion yield for the process involving the positive ions: for hydrogen, a conversion yield of 32 % is expected from measurements presented in [21], while for deuterium a slightly lower conversion yield is expected ( 29 % ) if only the energy is considered and no further isotopic difference is assumed. Such conversion yields refer to a partially caesiated surface, but they give an indication of the dependence of the conversion yield on the impinging particle energy, and a comparable conversion yield is thus expected for hydrogen and deuterium. This assumption is now confirmed by the present measurements, since the negative ion density related to the surface production at varying work function is similar for the two isotopes, as observed in Figure 6b.
As explained in Section 2.2, the surface production of negative ions from positive ions foresees first the neutralization of the positive ions and then the conversion of the neutral particles into negative ions. Since the neutralization of positive ions impinging on the surface is not dependent on the isotope and essentially all positive ions are neutralized at the surface for ion energies of tens of eV [43], and since from the present measurements there are no indications that there is any isotope effect on the surface conversion of the neutralized particles into negative ions, it can be deduced that for ion sources no isotopic difference should occur also for the conversion of atoms.

5. Summary and Conclusions

The formation of negative hydrogen and deuterium ions in negative ion sources based on surface conversion is strictly depending on the work function of the converter surface. In order to study the isotopic difference in the negative ion surface formation between hydrogen and deuterium plasmas, simultaneous and absolute measurements of negative ion density and work function are performed at a well diagnosed ICP plasma. The work function of the surface is evaluated by means of the photoelectric effect, while the H and D densities are measured by cavity ring-down spectroscopy at 2 cm distance from the sample. The possibility of controlled and reproducible investigations allows us to study the transition from negative ion volume formation to surface formation at low surface work functions. The negative ion density n i shows a steep increase for work functions below 2.7 eV, while above this value the main contribution to the negative ion density is due to volume formation. For a work function of 2.1 eV (bulk Cs), the H density increases by at least a factor of 2.8 with respect to a non-caesiated surface, arising from densities of around 1   ×   10 15 m 3 of the surface produced negative ions. By applying a deuterium plasma, no significant isotopic effect occurs regarding the surface negative ion formation: the D density measured for a work function of 2.1 eV increases by a factor of 2.5 with respect to a non-caesiated surface, achieving densities of the surface produced negative ions comparable to the hydrogen case. Since neutralization of the positive ions at the surface is not isotope dependent and since no isotope effect has been found in the surface conversion of the neutralized particles into negative ions, no isotopic difference is expected also for the conversion of atoms. It can thus be excluded that the isotope dependence of the co-extracted electrons observed in the ion source is due to an isotopic difference in the negative ion formation.

Author Contributions

Conceptualization, S.C., R.F. and U.F.; methodology, S.C.; software, S.C.; validation, S.C.; formal analysis, S.C.; investigation, S.C.; resources, S.C., R.F. and U.F.; data curation, S.C.; writing—original draft preparation, S.C.; writing—review and editing, R.F. and U.F.; visualization, S.C.; supervision, R.F. and U.F.; project administration, S.C., R.F. and U.F.; funding acquisition, U.F. All authors have read and agreed to the published version of the manuscript.

Funding

This work has been carried out within the framework of the EUROfusion Consortium and has received funding from the Euratom research and training programme 2014–2018 and 2019–2020 under grant agreement No 633053. The views and opinions expressed herein do not necessarily reflect those of the European Commission.

Institutional Review Board Statement

Not applicable.

Informed Consent Statement

Not applicable.

Data Availability Statement

The data presented in this study are available on request from the authors.

Conflicts of Interest

The authors declare no conflict of interest. The funders had no role in the design of the study; in the collection, analyses, or interpretation of data; in the writing of the manuscript, or in the decision to publish the results.

References

  1. IAEA. ITER Technical Basis; ITER EDA Documentation Series 24; International Atomic Energy Agency: Vienna, Austria, 2002. [Google Scholar]
  2. Hemsworth, R.; Decamps, H.; Graceffa, J. Status of the ITER heating neutral beam system. Nucl. Fusion 2009, 49, 045006. [Google Scholar] [CrossRef] [Green Version]
  3. Hemsworth, R.S.; Boilson, D.; Blatchford, P. Overview of the design of the ITER heating neutral beam injectors. New J. Phys. 2017, 19, 025005. [Google Scholar] [CrossRef]
  4. Bacal, M.; Wada, M. Negative hydrogen ion production mechanisms. Appl. Phys. Rev. 2015, 2, 021305. [Google Scholar] [CrossRef]
  5. Michaelson, H.B. The work function of the elements and its periodicity. J. Appl. Phys. 1977, 48, 4729. [Google Scholar] [CrossRef] [Green Version]
  6. Dudnikov, V. Forty years of surface plasma source development. Rev. Sci. Instrum. 2012, 83, 02A708. [Google Scholar] [CrossRef]
  7. Heinemann, B.; Fantz, U.; Kraus, W. Towards large and powerful radio frequency driven negative ion sources for fusion. New J. Phys. 2017, 19, 015001. [Google Scholar] [CrossRef]
  8. Fantz, U.; Hopf, C.; Wünderlich, D. Towards powerful negative ion beams at the test facility ELISE for the ITER and DEMO NBI systems. Nucl. Fusion 2017, 57, 116007. [Google Scholar] [CrossRef] [Green Version]
  9. Kraus, W.; Wünderlich, D.; Fantz, U. Deuterium results at the negative ion source test facility ELISE. Rev. Sci. Instrum. 2018, 89, 052102. [Google Scholar] [CrossRef] [Green Version]
  10. Wimmer, C.; Mimo, A.; Lindauer, M. Improved understanding of the Cs dynamics in large H sources by combining TDLAS measurements and modeling. AIP Conf. Proc. 2018, 2011, 060001. [Google Scholar] [CrossRef] [Green Version]
  11. Cristofaro, S.; Friedl, R.; Fantz, U. Correlation of Cs flux and work function of a converter surface during long plasma exposure for negative ion sources in view of ITER. Plasma Res. Express 2020, 2, 035009. [Google Scholar] [CrossRef]
  12. Tsumori, K.; Nakano, H.; Kisaki, M. Spatial distribution of the charged particles and potentials during beam extraction in a negative-ion source. Rev. Sci. Instrum. 2012, 83, 02B116. [Google Scholar] [CrossRef]
  13. Wünderlich, D.; Riedl, R.; Bonomo, F. Achievement of ITER-relevant accelerated negative hydrogen ion current densities over 1000 s at the ELISE test facility. Nucl. Fusion 2019, 59, 084001. [Google Scholar] [CrossRef]
  14. Mimo, A.; Nakano, H.; Wimmer, C.; Wünderlich, D.; Fantz, U.; Tsumori, K. Cavity ring-down spectroscopy system for the evaluation of negative hydrogen ion density at the ELISE test facility. Rev. Sci. Instrum. 2020, 91, 013510. [Google Scholar] [CrossRef]
  15. Wünderlich, D.; Gutser, R.; Fantz, U. PIC code for the plasma sheath in large caesiated RF sources for negative hydrogen ions. Plasma Sources Sci. Technol. 2009, 18, 045031. [Google Scholar] [CrossRef]
  16. Fantz, U.; Schiesko, L.; Wünderlich, D.; the NNBI Team. A comparison of hydrogen and deuterium plasmas in the IPP prototype ion source for fusion. AIP Conf. Proc. 2013, 1515, 187. [Google Scholar] [CrossRef]
  17. Giacomin, M. Application of Collisional Radiative Models for Atomic and Molecular Hydrogen to a Negative Ion Source for Fusion. Master’s Thesis, University of Padova, Padova, Italy, 2017. [Google Scholar]
  18. Friedl, R.; Fantz, U. Influence of H2 and D2 plasmas on the work function of caesiated materials. J. Appl. Phys. 2017, 122, 083304. [Google Scholar] [CrossRef] [Green Version]
  19. Bardsley, J.N.; Wadehra, J.M. Dissociative attachment and vibrational excitation in low-energy collisions of electrons with H2 and D2. Phys. Rev. A 1979, 20, 1398. [Google Scholar] [CrossRef] [Green Version]
  20. Krishnakumar, E.; Denifl, S.; Čadež, I.; Markelj, S.; Mason, N.J. Dissociative Electron Attachment Cross Sections for H2 and D2. Phys. Rev. Lett. 2011, 106, 243201. [Google Scholar] [CrossRef] [PubMed] [Green Version]
  21. Isenberg, J.D.; Kwon, H.J.; Seidl, M. Surface production of H ions by backscattering of H+ and H 2 + ions in the 3–50 eV ion energy range. AIP Conf. Proc. 1992, 287, 38. [Google Scholar] [CrossRef]
  22. Seidl, M.; Cui, H.L.; Isenberg, J.D. Negative surface ionization of hydrogen atoms and molecules. J. Appl. Phys. 1996, 79, 2896. [Google Scholar] [CrossRef]
  23. Rasser, B.; Wunnik, J.N.M.v.; Los, J. Theoretical models of the negative ionization of hydrogen on clean tungsten, cesiated tungsten and cesium surfaces at low energies. Surf. Sci. 1982, 118, 697. [Google Scholar] [CrossRef]
  24. Nørskov, J.K.; Lundqvist, B.I. Secondary-ion emission probability in sputtering. Phys. Rev. B 1979, 19, 5661. [Google Scholar] [CrossRef]
  25. Lang, N.D.; Nørskov, J.K. The Theory of Ionization Probability in Sputtering. Phys. Scr. 1983, T6, 15. [Google Scholar] [CrossRef]
  26. Cui, H.L. Resonant charge transfer in the scattering of hydrogen atoms from a metal surface. J. Vac. Sci. Technol. A 1991, 9, 1823. [Google Scholar] [CrossRef]
  27. Melnychuk, S.T.; Seidl, M. Reflection of hydrogen atoms from alkali and alkaline earth oxide surfaces. J. Vac. Sci. Technol. A 1991, 9, 1650. [Google Scholar] [CrossRef]
  28. Lee, B.S.; Seidl, M. Surface production of H ions by hyperthermal hydrogen atoms. Appl. Phys. Lett. 1992, 61, 2857. [Google Scholar] [CrossRef]
  29. Janev, R.K.; Reiter, D.; Samm, U. Collision Processes in Low-Temperature Hydrogen Plasmas; Berichte des Forschungszentrums Jülich; Forschungszentrum Jülich: Jülich, Germany, 2003; Volume 4105. [Google Scholar]
  30. Miller, K.A.; Bruhns, H.; Cížek, M. Isotope effect for associative detachment: H(D) + H(D) → H2(D2) + e. Phys. Rev. A 2012, 86, 032714. [Google Scholar] [CrossRef] [Green Version]
  31. Huq, M.S.; Doverspike, L.D.; Champion, R.L. Electron detachment for collisions of H and D with hydrogen molecules. Phys. Rev. A 1983, 27, 2831. [Google Scholar] [CrossRef]
  32. Fantz, U.; Friedl, R.; Fröschle, M. Controllable evaporation of cesium from a dispenser oven. Rev. Sci. Instrum. 2012, 83, 123305. [Google Scholar] [CrossRef] [Green Version]
  33. Friedl, R.; Fantz, U. Influence of cesium on the plasma parameters in front of the plasma grid in sources for negative hydrogen ions. AIP Conf. Proc. 2013, 1515, 255. [Google Scholar] [CrossRef]
  34. Fantz, U.; Falter, H.; Franzen, P. Spectroscopy—A powerful diagnostic tool in source development. Nucl. Fusion 2006, 46, S297. [Google Scholar] [CrossRef] [Green Version]
  35. Friedl, R.; Fantz, U. Fundamental studies on the Cs dynamics under ion source conditions. Rev. Sci. Instrum. 2014, 85, 02B109. [Google Scholar] [CrossRef]
  36. Fowler, R.H. The Analysis of Photoelectric Sensitivity Curves for Clean Metals at Various Temperatures. Phys. Rev. 1931, 38, 45. [Google Scholar] [CrossRef]
  37. Friedl, R. Enhancing the accuracy of the Fowler method for monitoring non-constant work functions. Rev. Sci. Instrum. 2016, 87, 043901. [Google Scholar] [CrossRef]
  38. Wünderlich, D.; Fantz, U. Evaluation of State-Resolved Reaction Probabilities and Their Application in Population Models for He, H, and H2. Atoms 2016, 4, 26. [Google Scholar] [CrossRef] [Green Version]
  39. Rauner, D.; Kurutz, U.; Fantz, U. Comparison of measured and modelled negative hydrogen ion densities at the ECR-discharge HOMER. AIP Conf. Proc. 2015, 1655, 020017. [Google Scholar] [CrossRef] [Green Version]
  40. Kurutz, U.; Friedl, R.; Fantz, U. Investigations on Cs-free alternatives for negative ion formation in a low pressure hydrogen discharge at ion source relevant parameters. Plasma Phys. Control. Fusion 2017, 59, 075008. [Google Scholar] [CrossRef] [Green Version]
  41. Bacal, M.; Berlemont, P.; Bruneteau, A.M. Measurement of the H thermal energy in a volume ion source plasma. J. Appl. Phys. 1991, 70, 1212. [Google Scholar] [CrossRef]
  42. Nishiura, M.; Sasao, M.; Bacal, B. H laser photodetachment at 1064, 532, and 355 nm in plasma. J. Appl. Phys. 1998, 83, 2944. [Google Scholar] [CrossRef]
  43. Lieberman, M.A.; Lichtenberg, A.J. Principles of Plasma Discharges and Materials Processing, 2nd ed.; John Wiley & Sons: Hoboken, NJ, USA, 2005. [Google Scholar]
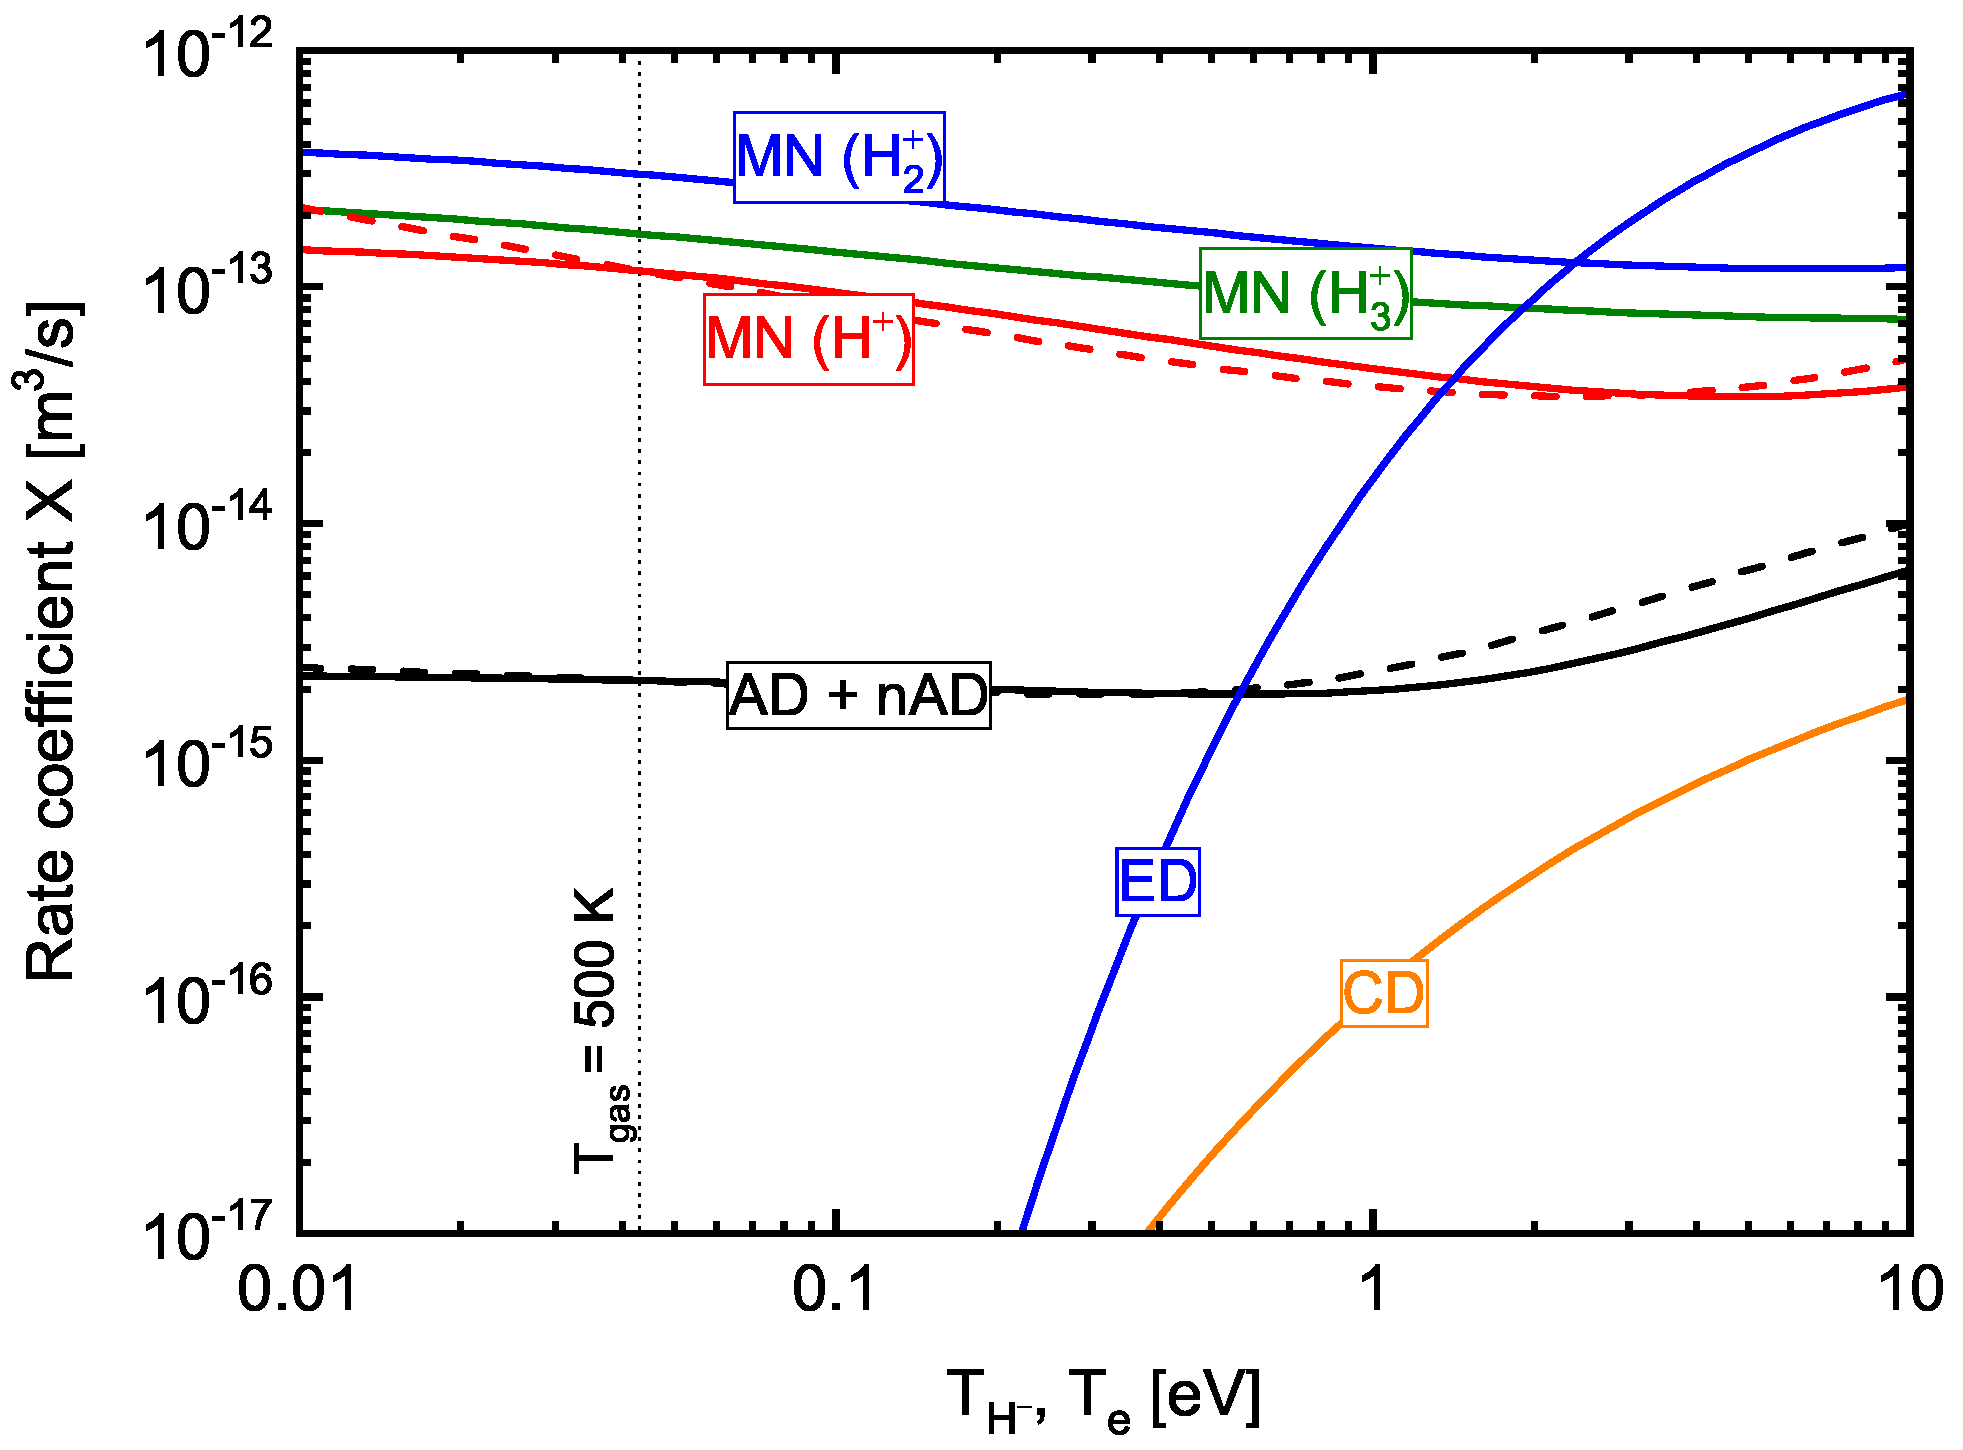
Figure 1. Rate coefficients of the different H destruction processes, calculated from the cross sections in [29] as functions of the electron temperature for the electron detachment process and of the H temperature for the other processes. Solid lines correspond to fixed temperatures for neutral particles and positive ions of 500 K, while the dashed lines correspond to T H = T H + = T H .
Plasma 04 00007 g001
Figure 2. (a) Isometric sketch and (b) top view of the inductively coupled plasma (ICP) experiment ACCesS with an overview of the different diagnostics applied during the current investigations.
Plasma 04 00007 g002
Figure 3. Negative hydrogen ion and electron densities measured for different work functions in a hydrogen plasma at 2 Pa and 450 W. The measurements are taken at 2 cm and 8 mm from the sample surface, respectively.
Plasma 04 00007 g003
Figure 4. The negative hydrogen ion density measured by cavity ring-down spectroscopy system (CRDS) is shown for different work functions. The gray shaded area shows possible values for the density of negative ions created by volume processes and obtained from YACORA H .
Plasma 04 00007 g004
Figure 5. Comparison between deuterium (in red) and hydrogen (in blue) for the negative ion density and the electron density for different work functions.
Plasma 04 00007 g005
Figure 6. Comparison between deuterium (in red) and hydrogen (in blue). In (a), the negative ion density measured by CRDS is shown for different work functions. The expected volume produced negative ion density is illustrated in (a) as a grey shaded area for hydrogen (taken from Figure 4) and as a red shaded area for deuterium. In (b), the calculated negative ion densities coming from surface conversion are shown for different work functions for hydrogen (blue shaded area) and deuterium (red shaded area). These are given as ranges due to the uncertainty of the volume produced negative ion density.
Plasma 04 00007 g006
Publisher’s Note: MDPI stays neutral with regard to jurisdictional claims in published maps and institutional affiliations.