1. Introduction
In experimental studies of laser-plasma interactions, the laser radiation cannot penetrate plasma regions (called “overdense “plasma) of the electron density
Ne >
Nc, where
Nc is the critical density defined by the equation.
Here
ω is the laser/maser frequency and
ωpe(
Nc) is the plasma electron frequency:
ωpe(
Nc) = (4π
e2Nc/me)
1/2. At the so-called “relativistic” laser intensities—typically the intensities exceeding 10
18 W/cm
2, the critical density increases (despite the laser frequency is fixed) [
1,
2,
3]. This is due to the relativistic effects in the plasma—such as the relativistic increase of the electron mass. The increased critical density depends on the laser intensity. It is called the relativistic critical density
Nrc. For the linearly-polarized laser radiation, it becomes [
4].
Below we utilize the term “critical density” in the broader sense—including the relativistic critical density, i.e., the densities defined in Equations (1) or (2).
However, the transverse electromagnetic wave, such as, e.g., the laser radiation, can exist inside plasma regions where the electron density is below the critical density (“underdense” plasma), as well as at the surface of the critical density. The surface of the critical density could exhibit a rich physics. Namely, the incident laser radiation can get converted in transverse electromagnetic waves of significantly higher amplitudes than the incident radiation, due to various nonlinear processes.
Shapes of spectral lines were used for dozens of years for measuring various fields in plasmas—see, e.g., books [
5,
6,
7,
8,
9,
10,
11], published in the last 25 years or so (listed in the reversed chronological order), and references therein. There is also a review of year 2018 [
12] of the latest advances in the analytical theory of Stark broadening of hydrogenic spectral lines in plasmas.
As mentioned in some of the above sources, the laser field (or more generally, the field of the resulting transverse electromagnetic wave) in laser-produced plasmas were measured in experiments by using satellites of dipole-forbidden spectral lines of helium-like ions—see, e.g., papers [
13,
14] and references therein. As for satellites of hydrogenic ions, they were not used for this purpose yet (to the best of our knowledge), despite the underlying theory has been well-developed—see, e.g., papers [
15,
16] and books [
5,
11]. One of the reasons is the following. Typically the laser field would be determined from the experimental ratio of the satellite intensity to the intensity of the main line (the line at the “unperturbed” wavelength or frequency), by comparing it with the corresponding theoretical ratio. However, in very dense plasmas characteristic for laser-plasma interactions (especially, for relativistic laser-plasma interactions), intense hydrogenic lines, such as, e.g., the Ly-alpha and Ly-beta lines, could be optically thick. In this situation, the experimental peak intensity of the main line would be affected by the opacity (while the peak intensity of the satellites would not be affected), so that the existing theory cannot be used for deducing the laser field from the experimental ratio of the satellite intensity to the intensity of the main line.
In the present paper we proposed the method appropriate for the above situation—the method that allows measuring both the laser field and the opacity from experimental spectrum of a hydrogenic line exhibiting satellites. We obtain the necessary theoretical results analytically and show how to use them for this purpose.
2. The Method
Under a linearly-polarized electric field
E0 cos
ωt, a Stark component of a hydrogenic spectral line splits in satellites separated by
pω (
p = ±1, ±2, ±3, …) from the unperturbed frequency
ω0 of the spectral line, as shown by Blochinzew [
15]. Blochinzew’s result was later extended to profiles of multicomponent hydrogenic spectral lines in paper [
16]. In the “reduced frequency” scale, the profile is as follows (presented also in book [
11], Section 3.1):
Here
n, q and
n0, q0 are the principal and electric quantum numbers of the upper and lower energy levels, respectively, involved in the radiative transition (
q = n1 − n2, q0 = n01 − n02, where
n1, n2, n01, and
n02 are the corresponding parabolic quantum numbers);
f0 is the total intensity of all central Stark components,
fk is the intensity of the lateral Stark component with the number
k = 1, 2, …,
kmax;
Jp(
z) are the Bessel functions;
ε is the scaled dimensionless amplitude of the field:
In Equation (4),
Zr is the nuclear charge of the radiating atom or ion;
me and
e are the electron mass and charge, respectively. A practical formula for the scaled dimensionless amplitude of the field is the following:
In the present paper we focus at the situation where ε < 1. (We note that for the validity of Equation (3) it is required that the instantaneous Stark shift ωε is significantly greater than the fine structure splitting). In this situation, the intensities of the first satellite (|p| = 1) and of the second satellite (|p| = 2) are significantly smaller than the intensity of the main line, the latter being the zeroth satellite (p = 0). Therefore, even if the optical depth τ0 at the main line would be significant, the satellites (|p| > 0) typically would be optically thin.
According to Equation (3), the ratio of the intensity of the second satellite to the intensity of the first satellite has the form:
This ratio depends only on the scaled dimensionless amplitude ε of the electric field. Therefore, from the experimental value of the ratio R21 one can determine the value of ε and then (by using Equation (6))—the laser amplitude E0.
As for the ratio of the intensity of the first satellite to the intensity of the main line, at the zero optical depth of the main line it would be
Below we present graphically the dependence of the ratios R21and R10 on the scaled dimensionless laser field ε at τ0 = 0.
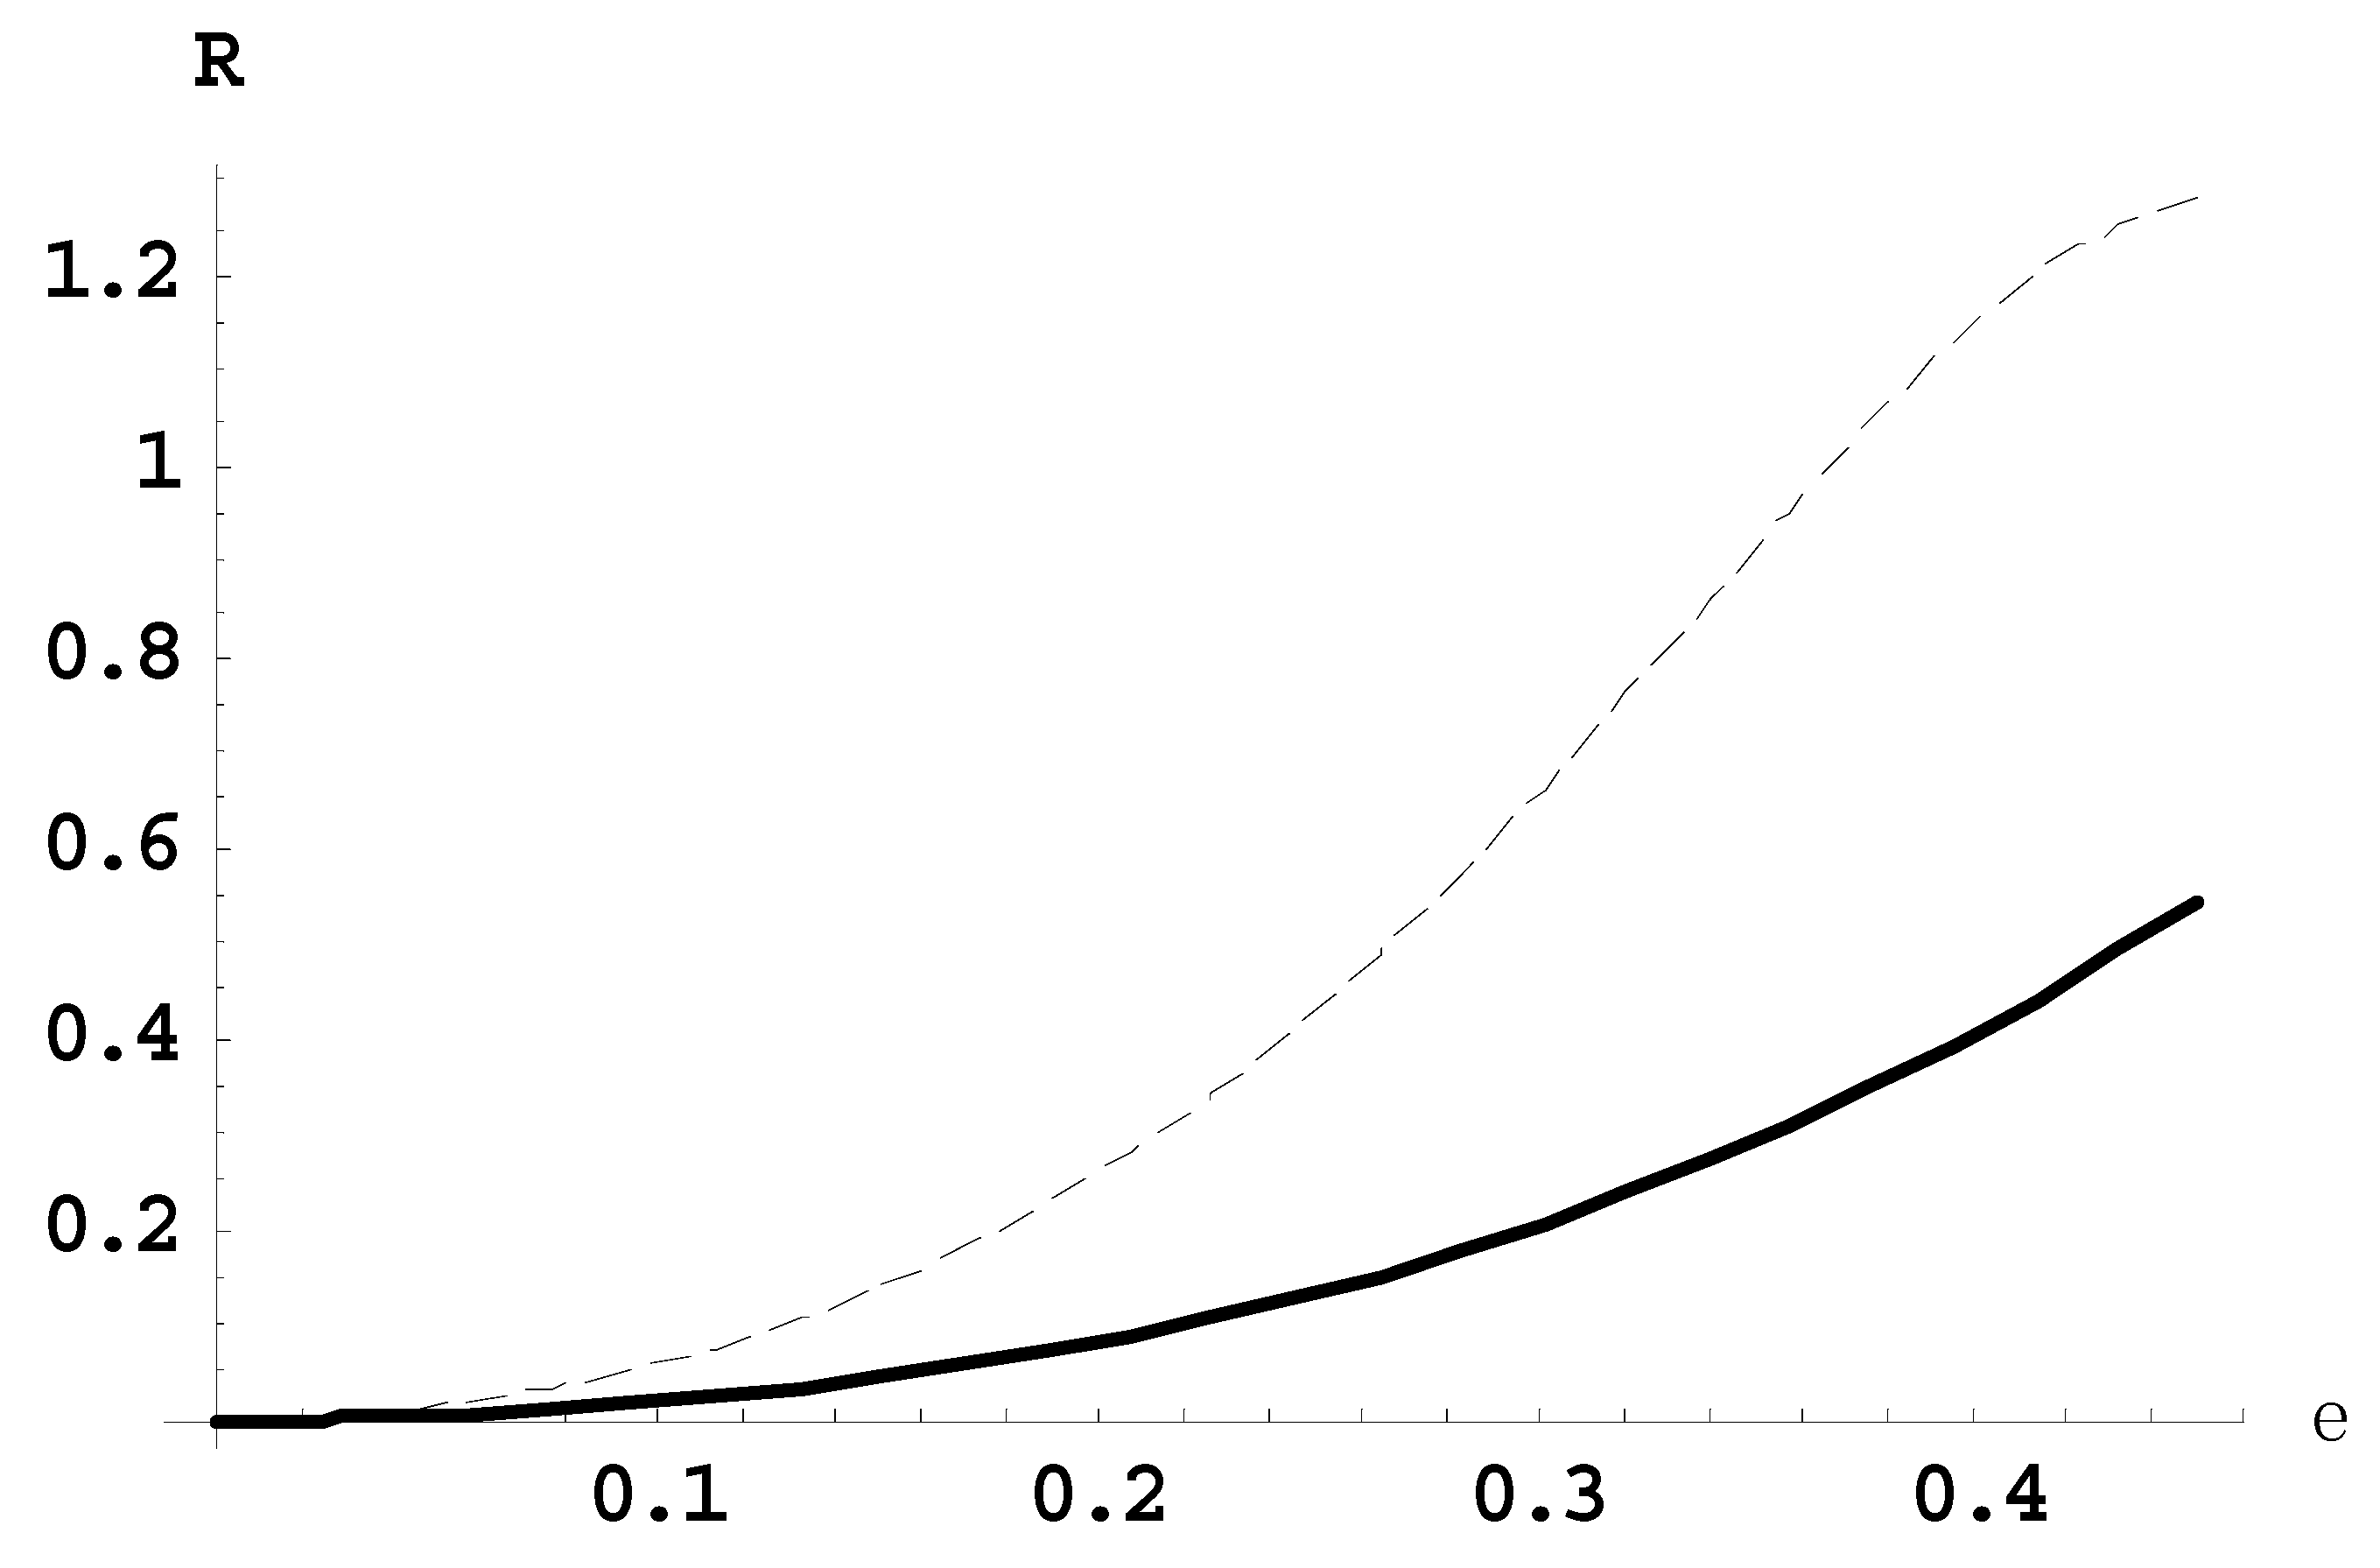
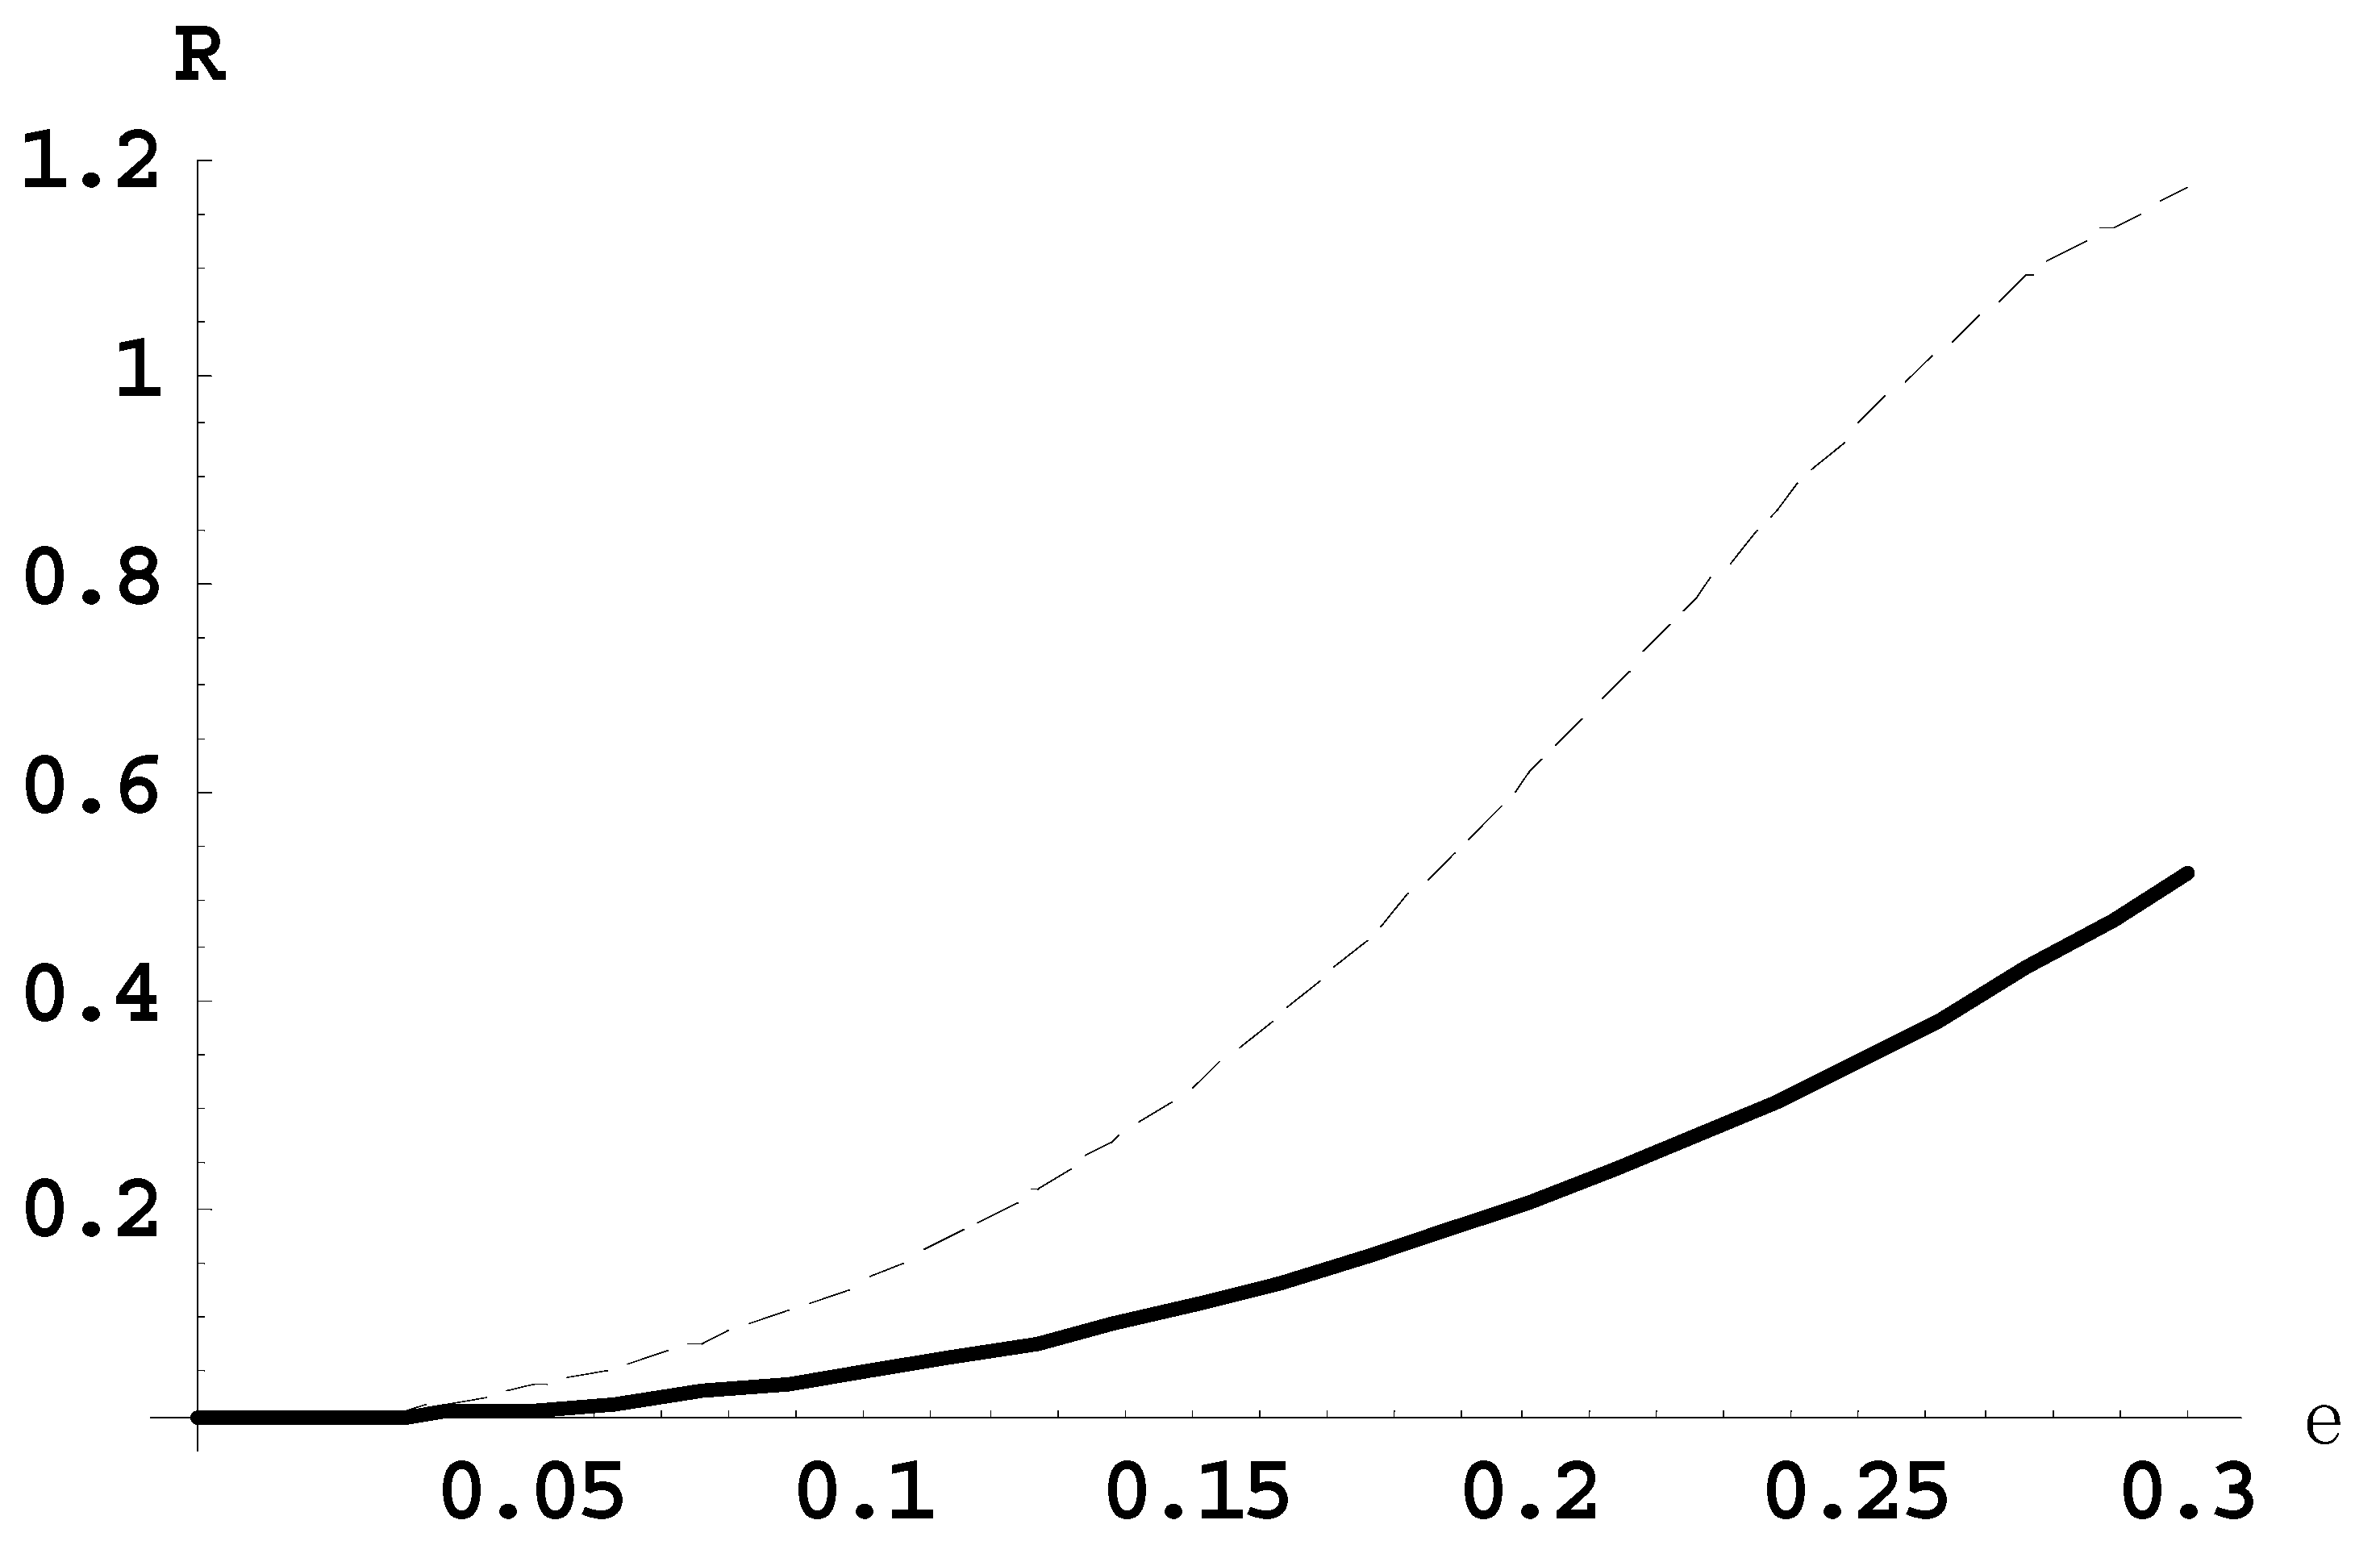
Figure 1 presents the dependence of the ratio
R21(
ε) of the intensity of the second satellite to the intensity of the first satellite (solid line) and the ratio
R10(
ε) of the intensity of the first satellite to the intensity of the main line (dashed line), for the Lyman-beta line for the observation perpendicular to the laser field.
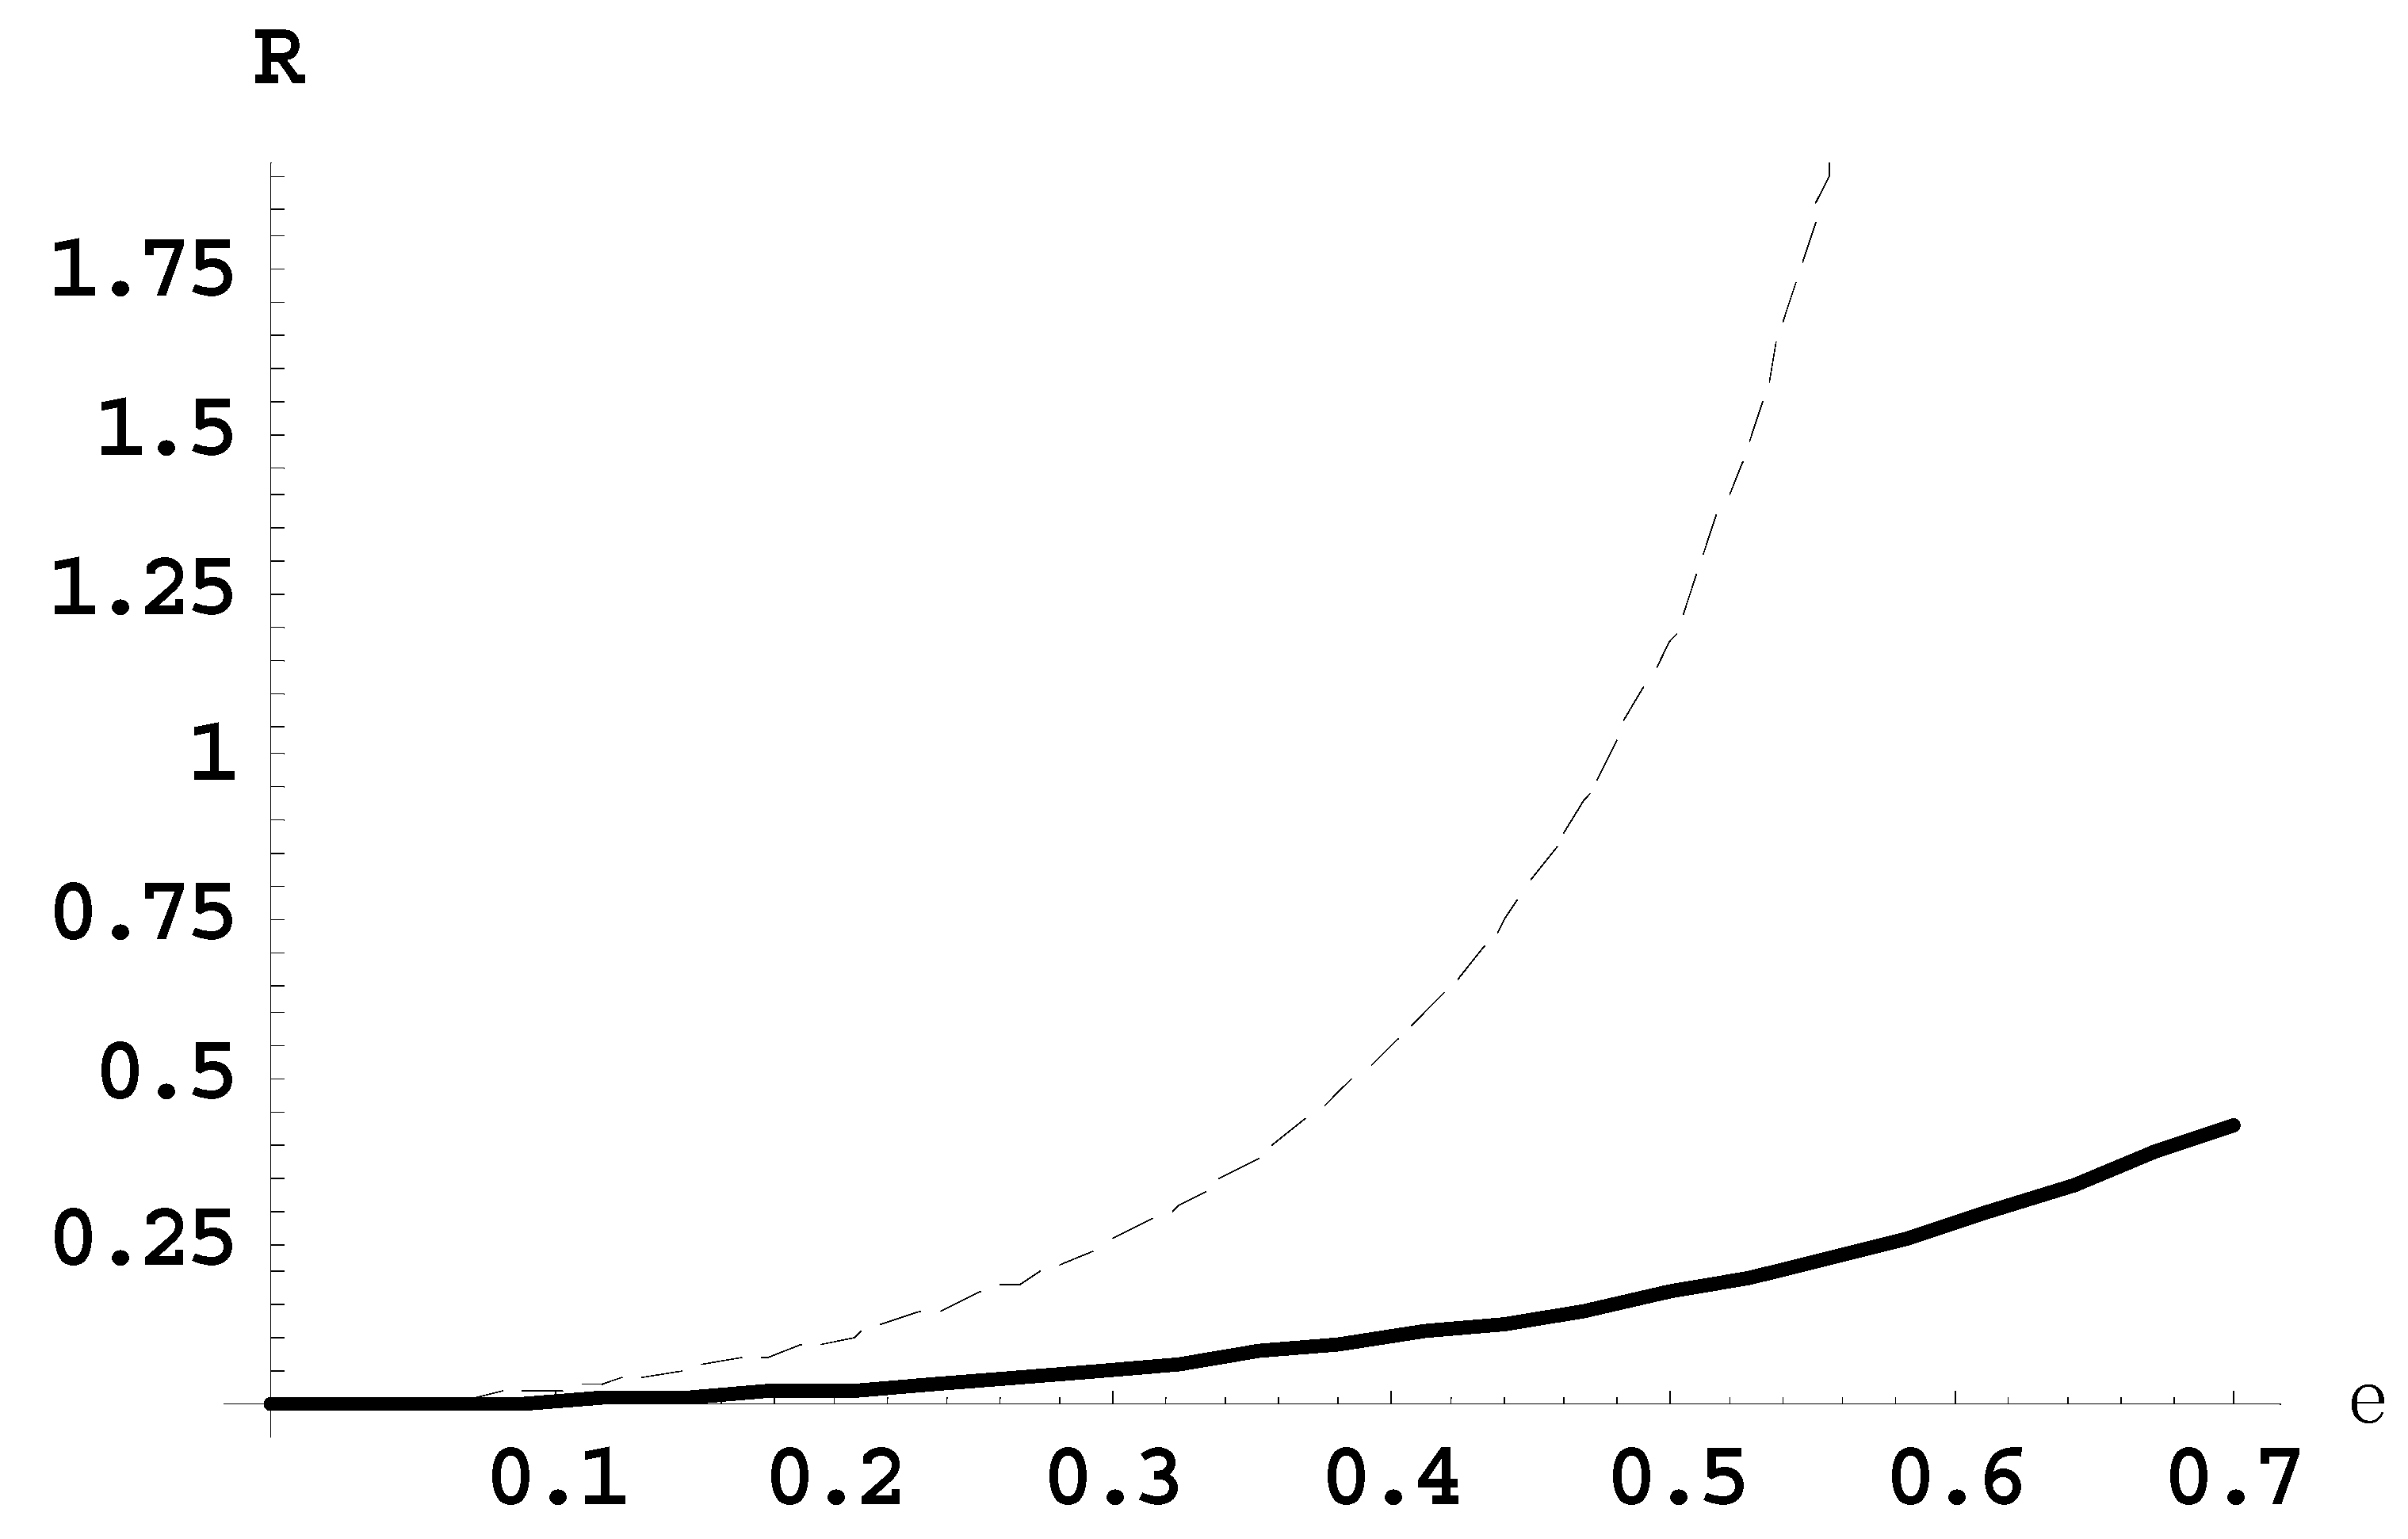
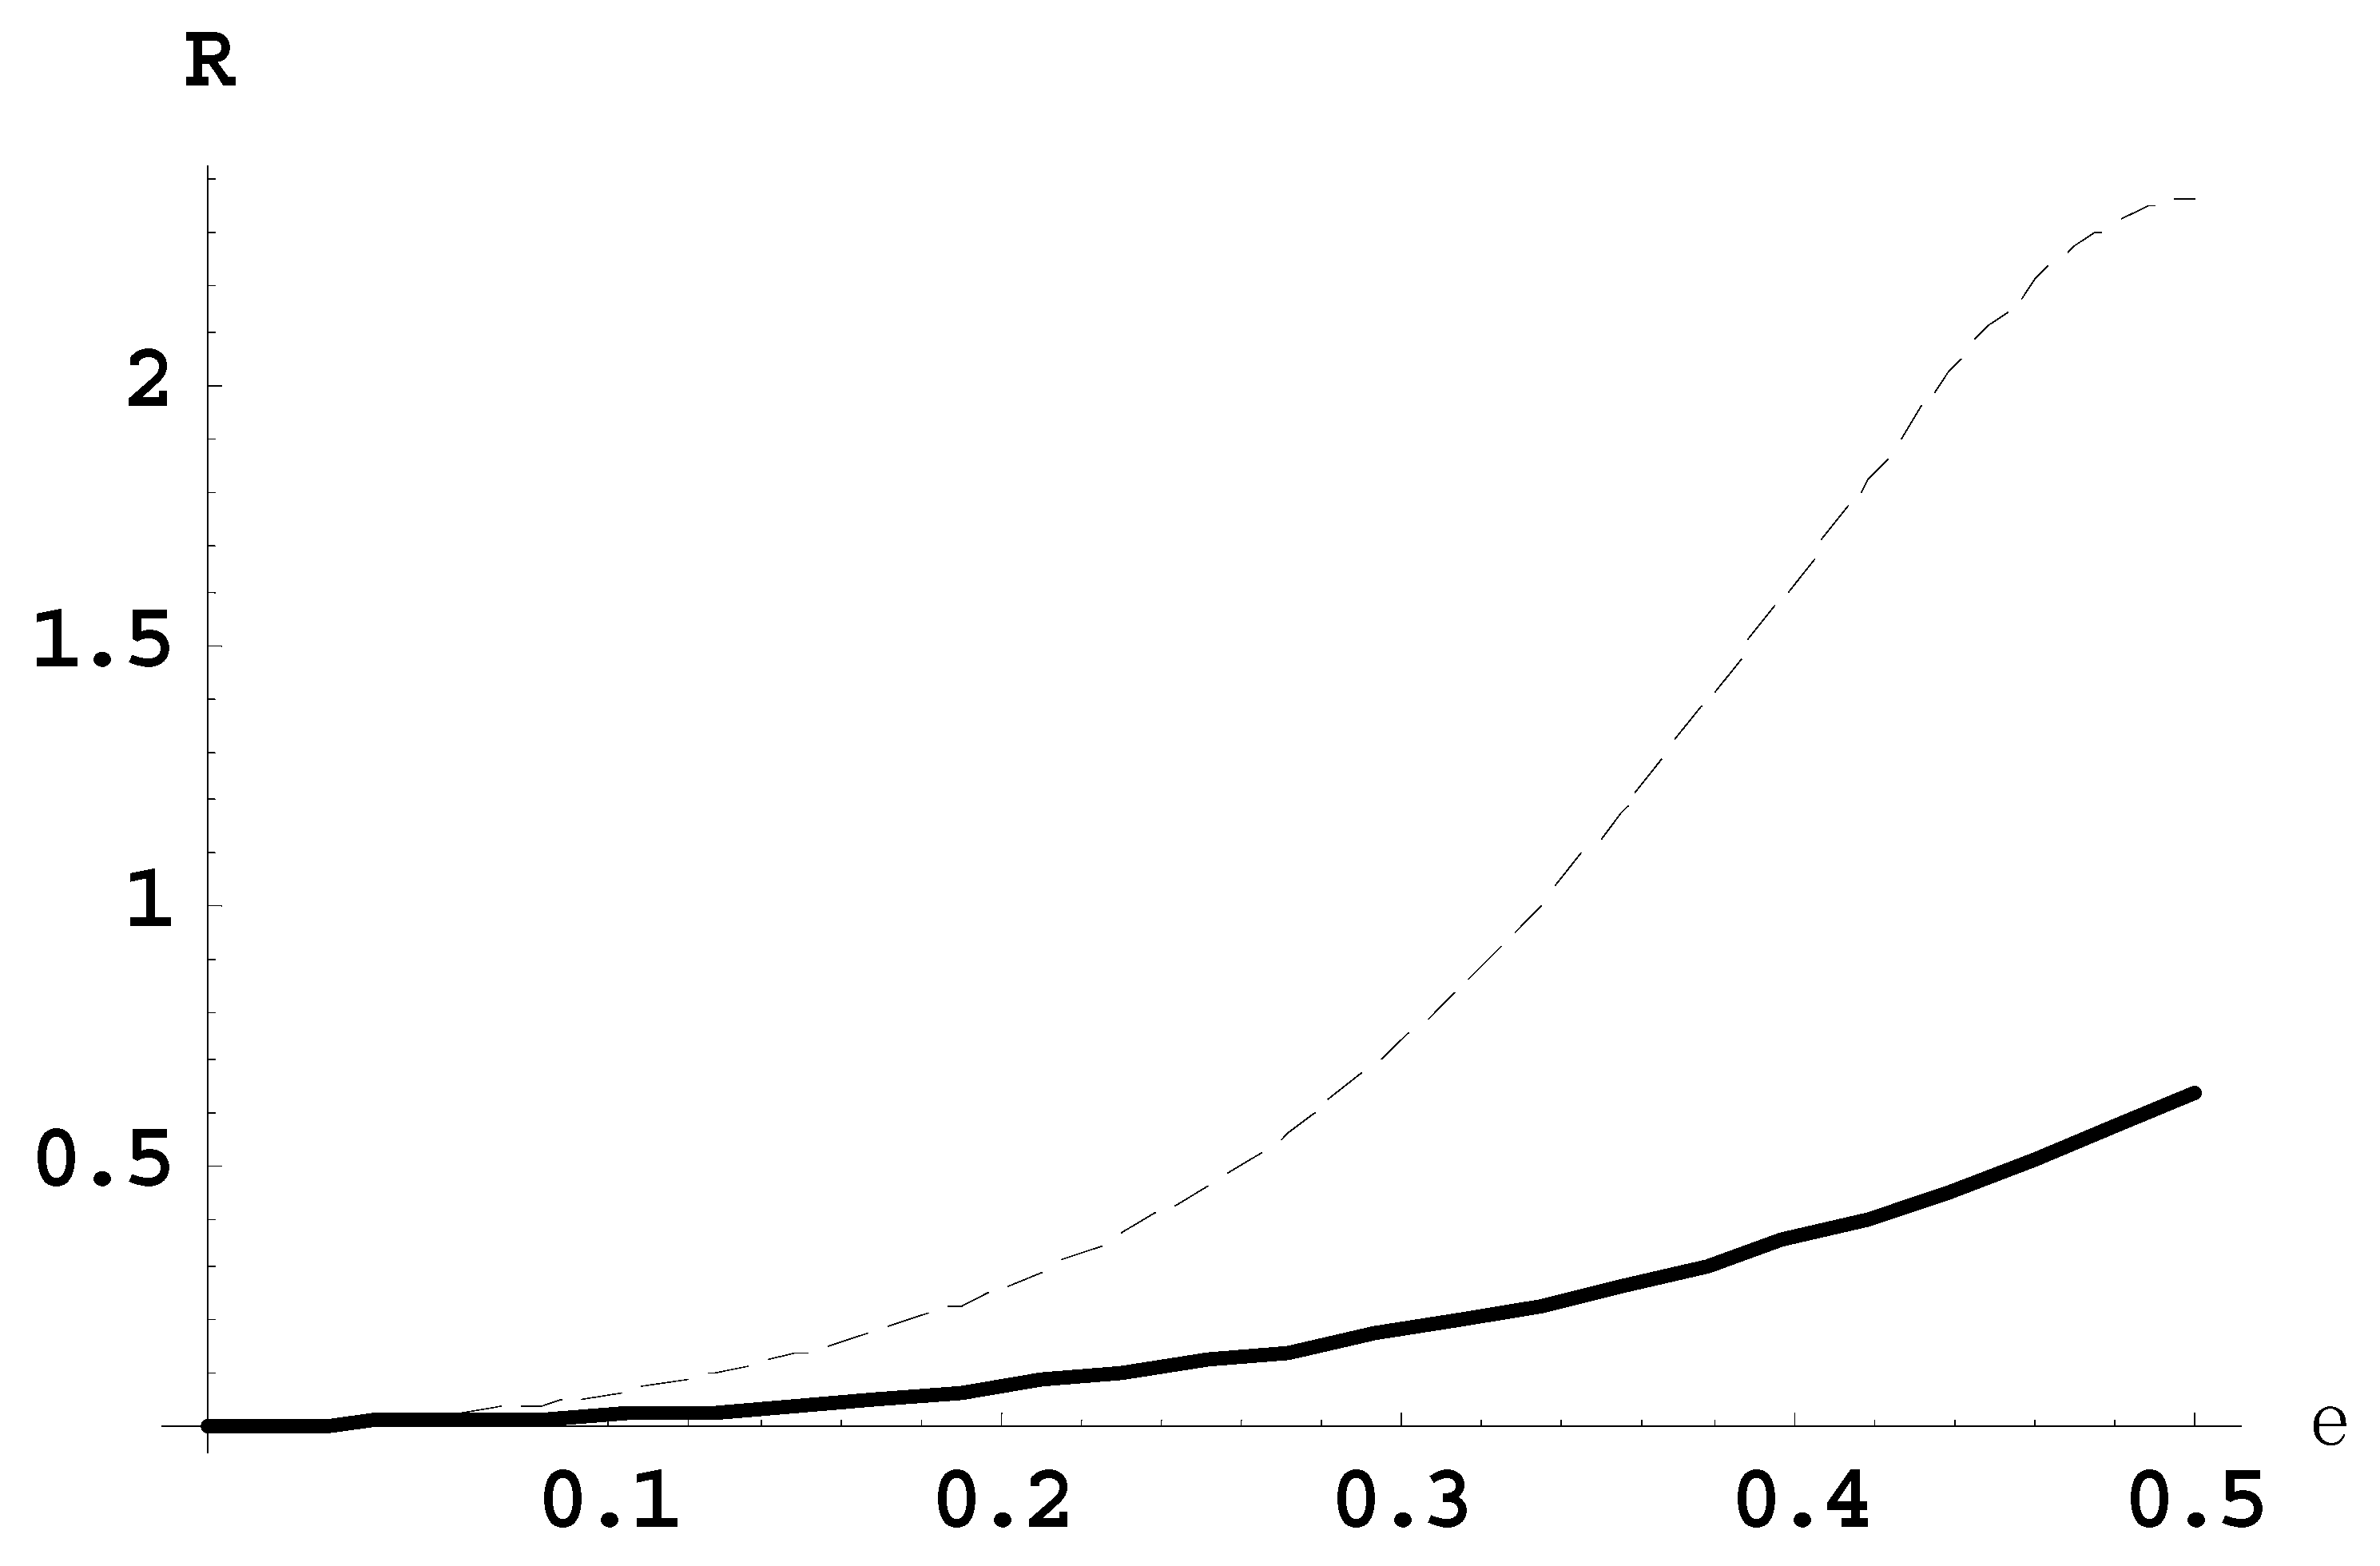
Figure 2 presents the dependence of the ratio
R21(
ε) of the intensity of the second satellite to the intensity of the first satellite (solid line) and the ratio
R10(
ε) of the intensity of the first satellite to the intensity of the main line (dashed line), for the Lyman-beta line for the observation parallel to the laser field.
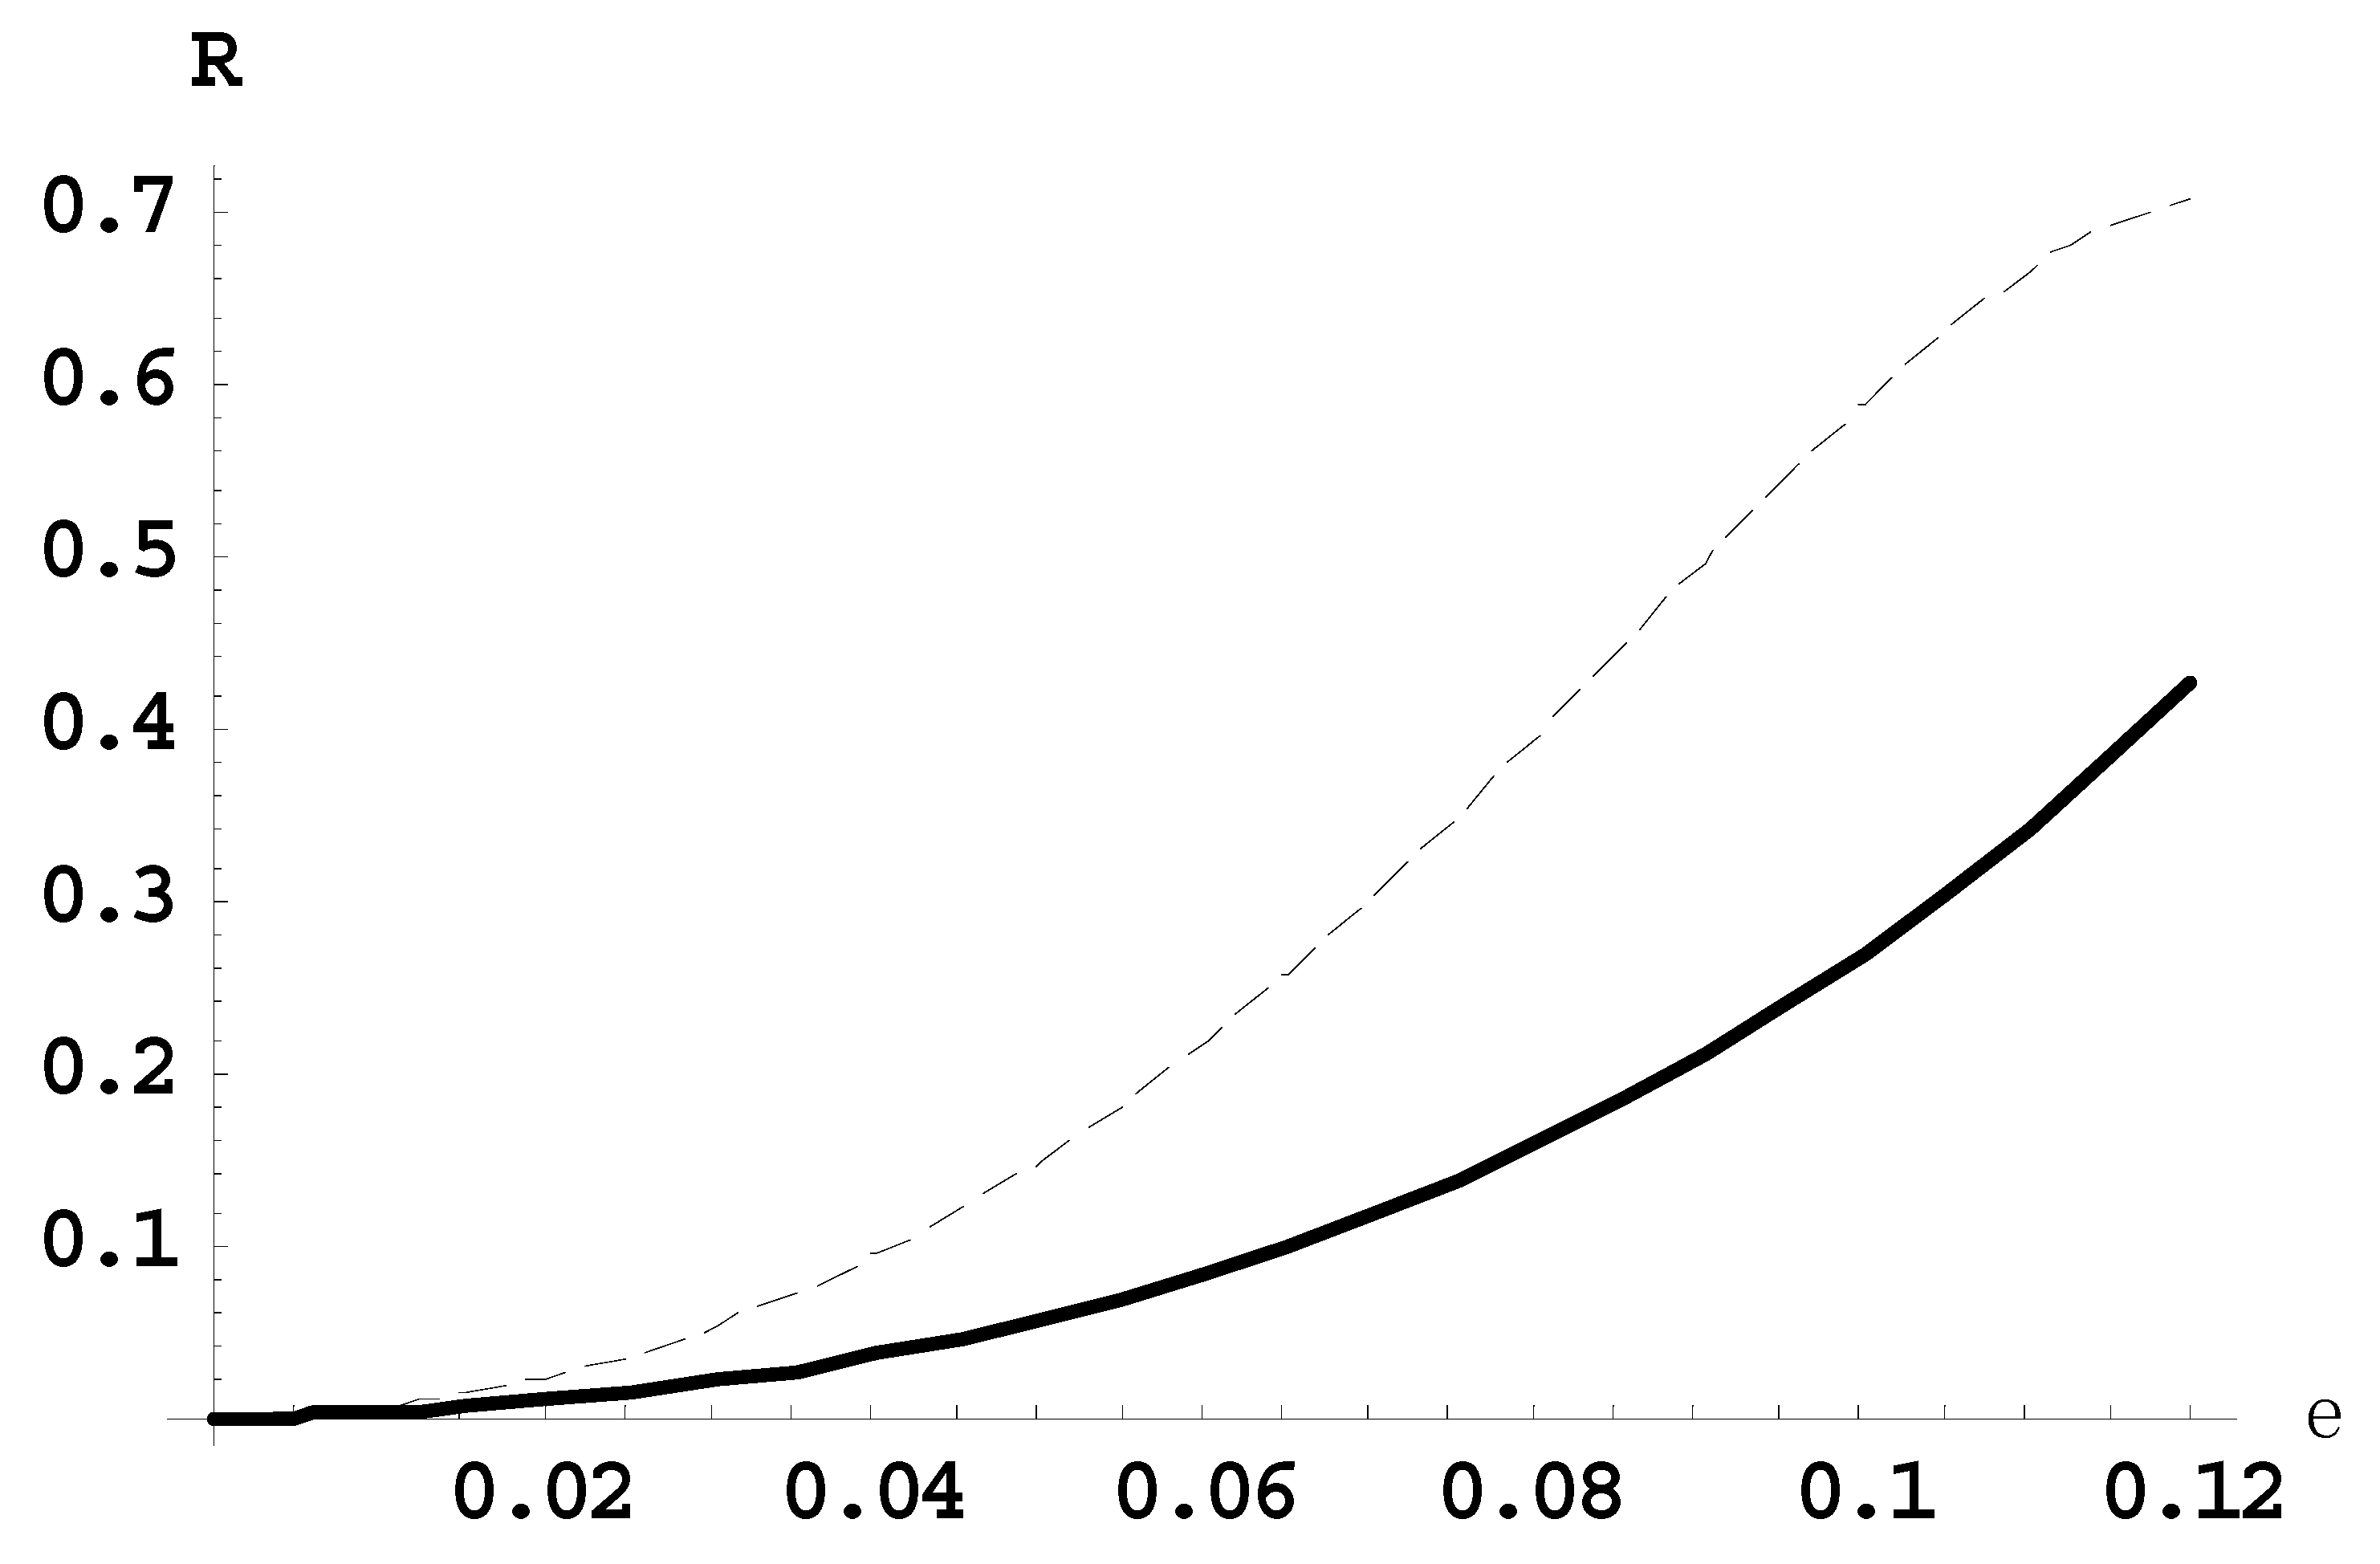
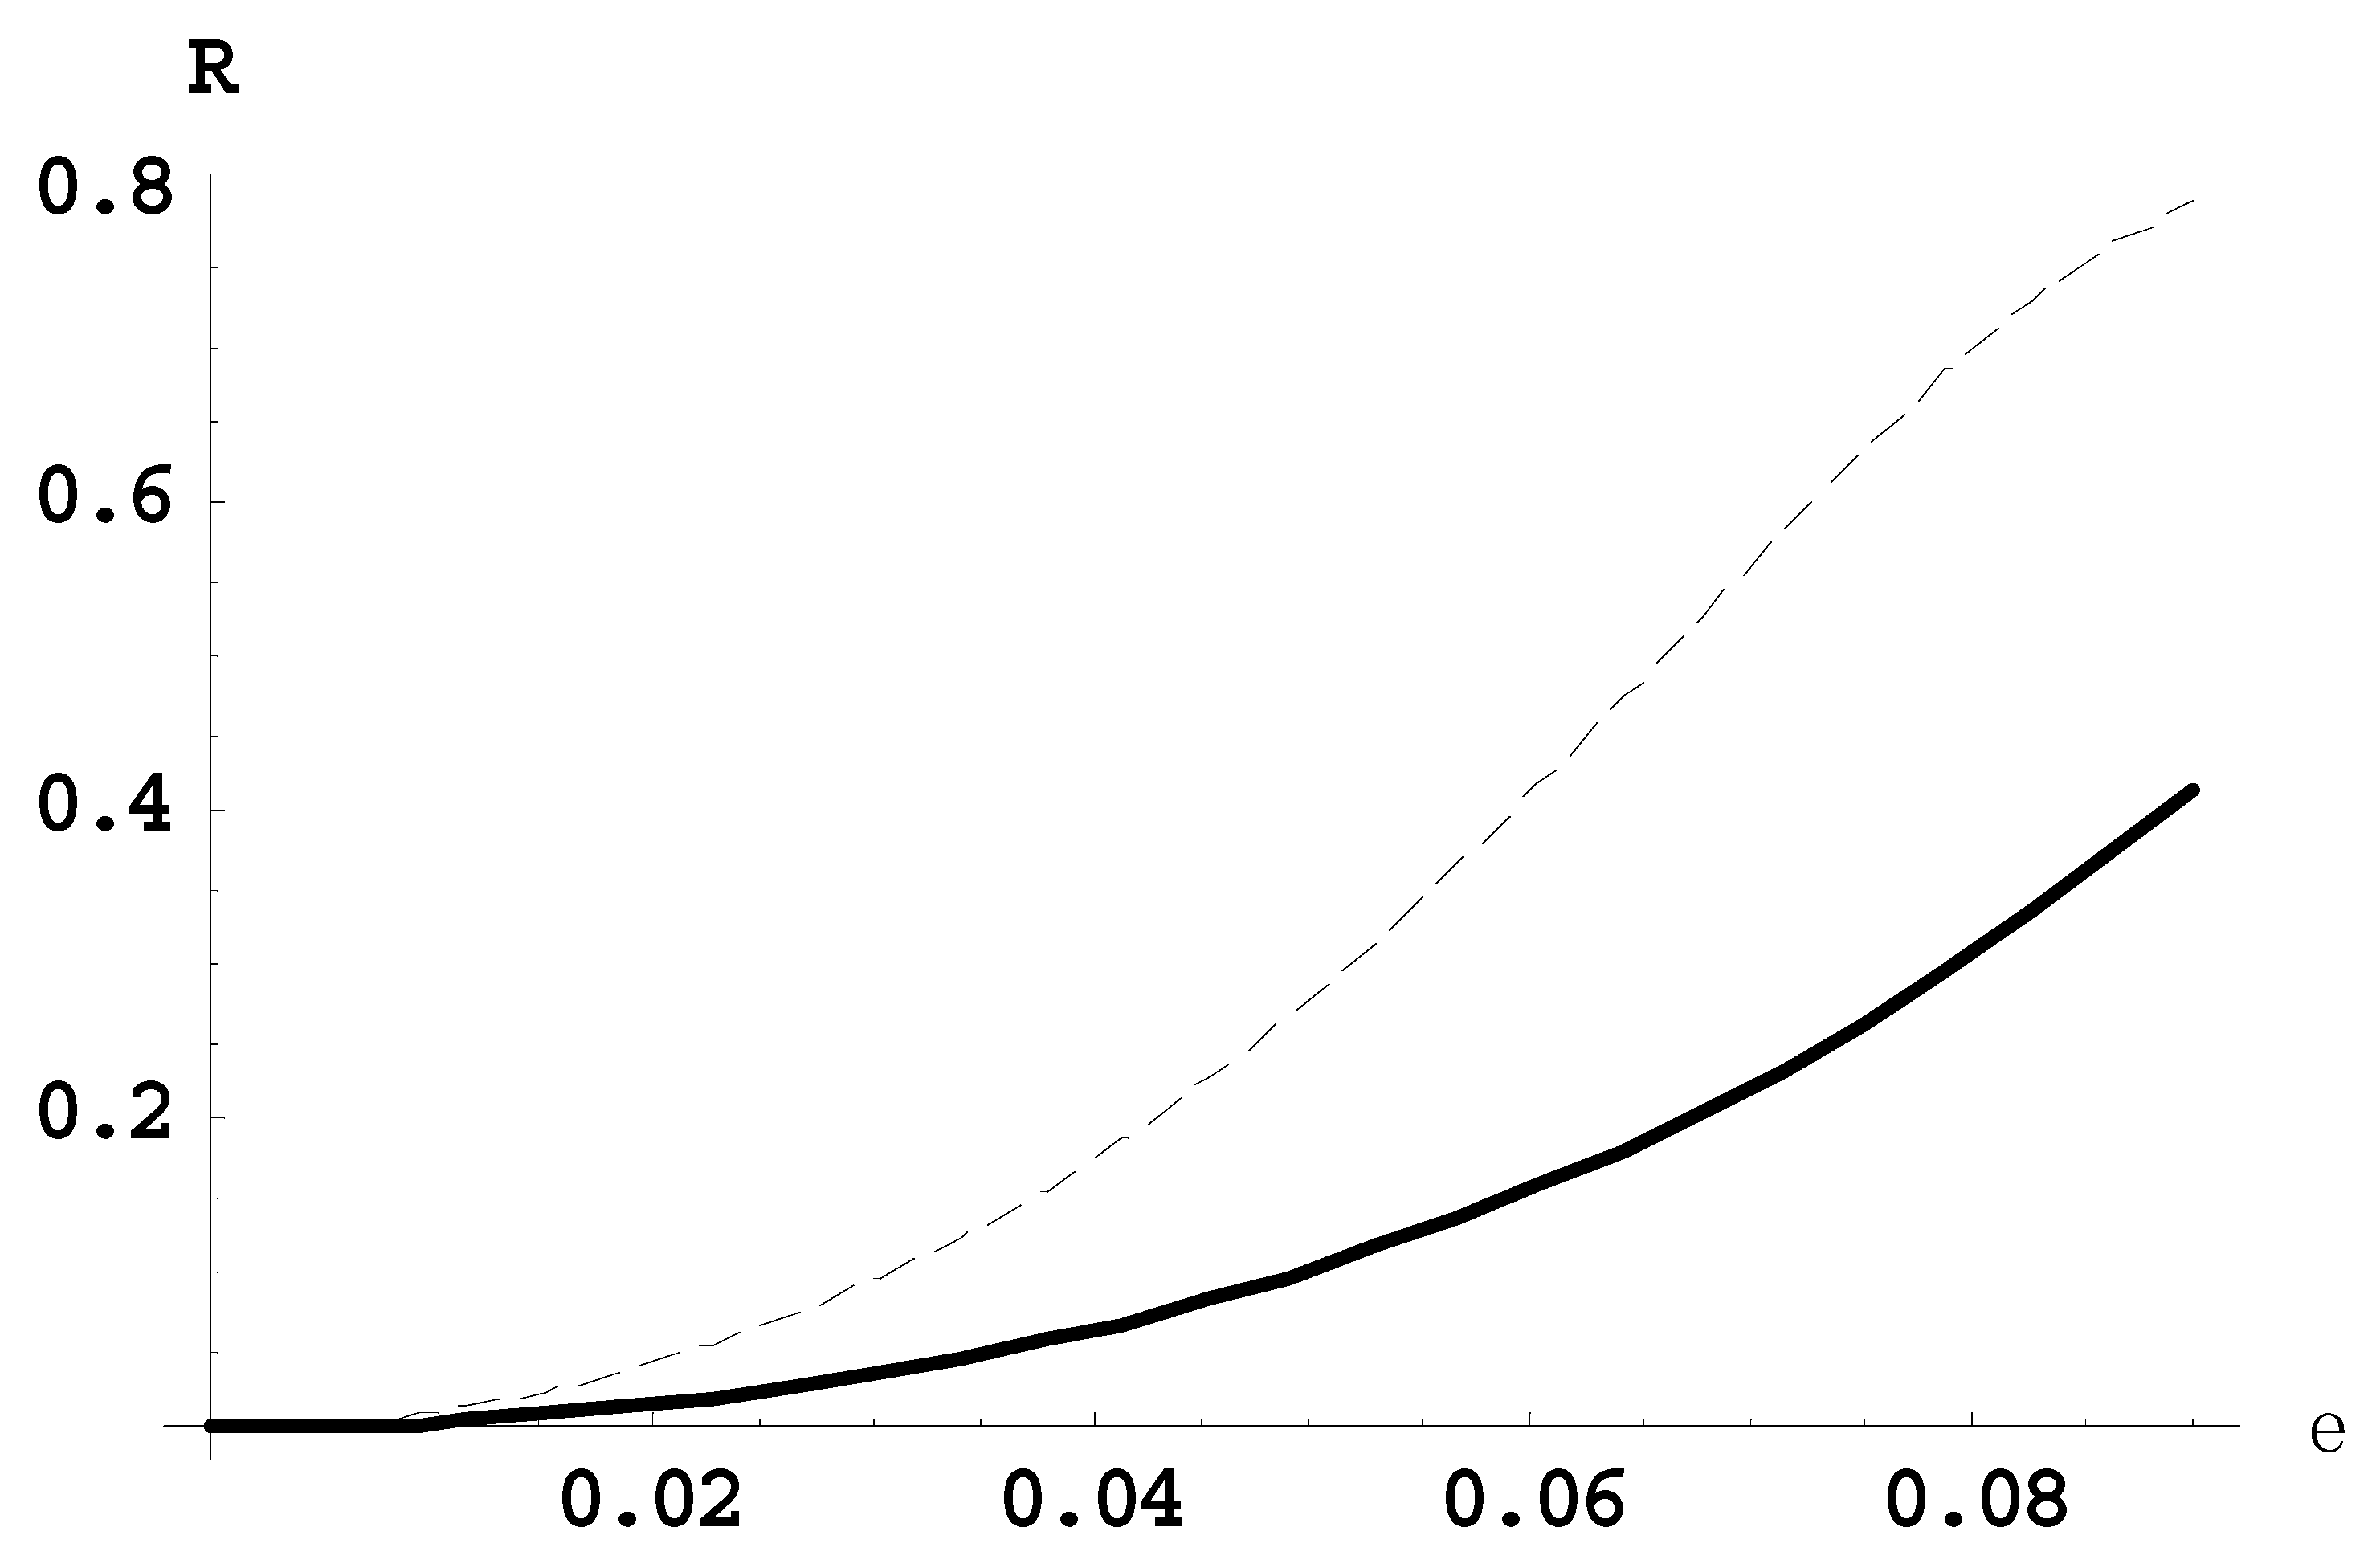
Figure 3 presents the dependence of the ratio
R21(
ε) of the intensity of the second satellite to the intensity of the first satellite (solid line) and the ratio
R10(
ε) of the intensity of the first satellite to the intensity of the main line (dashed line), for the Lyman-delta line for the observation perpendicular to the laser field.
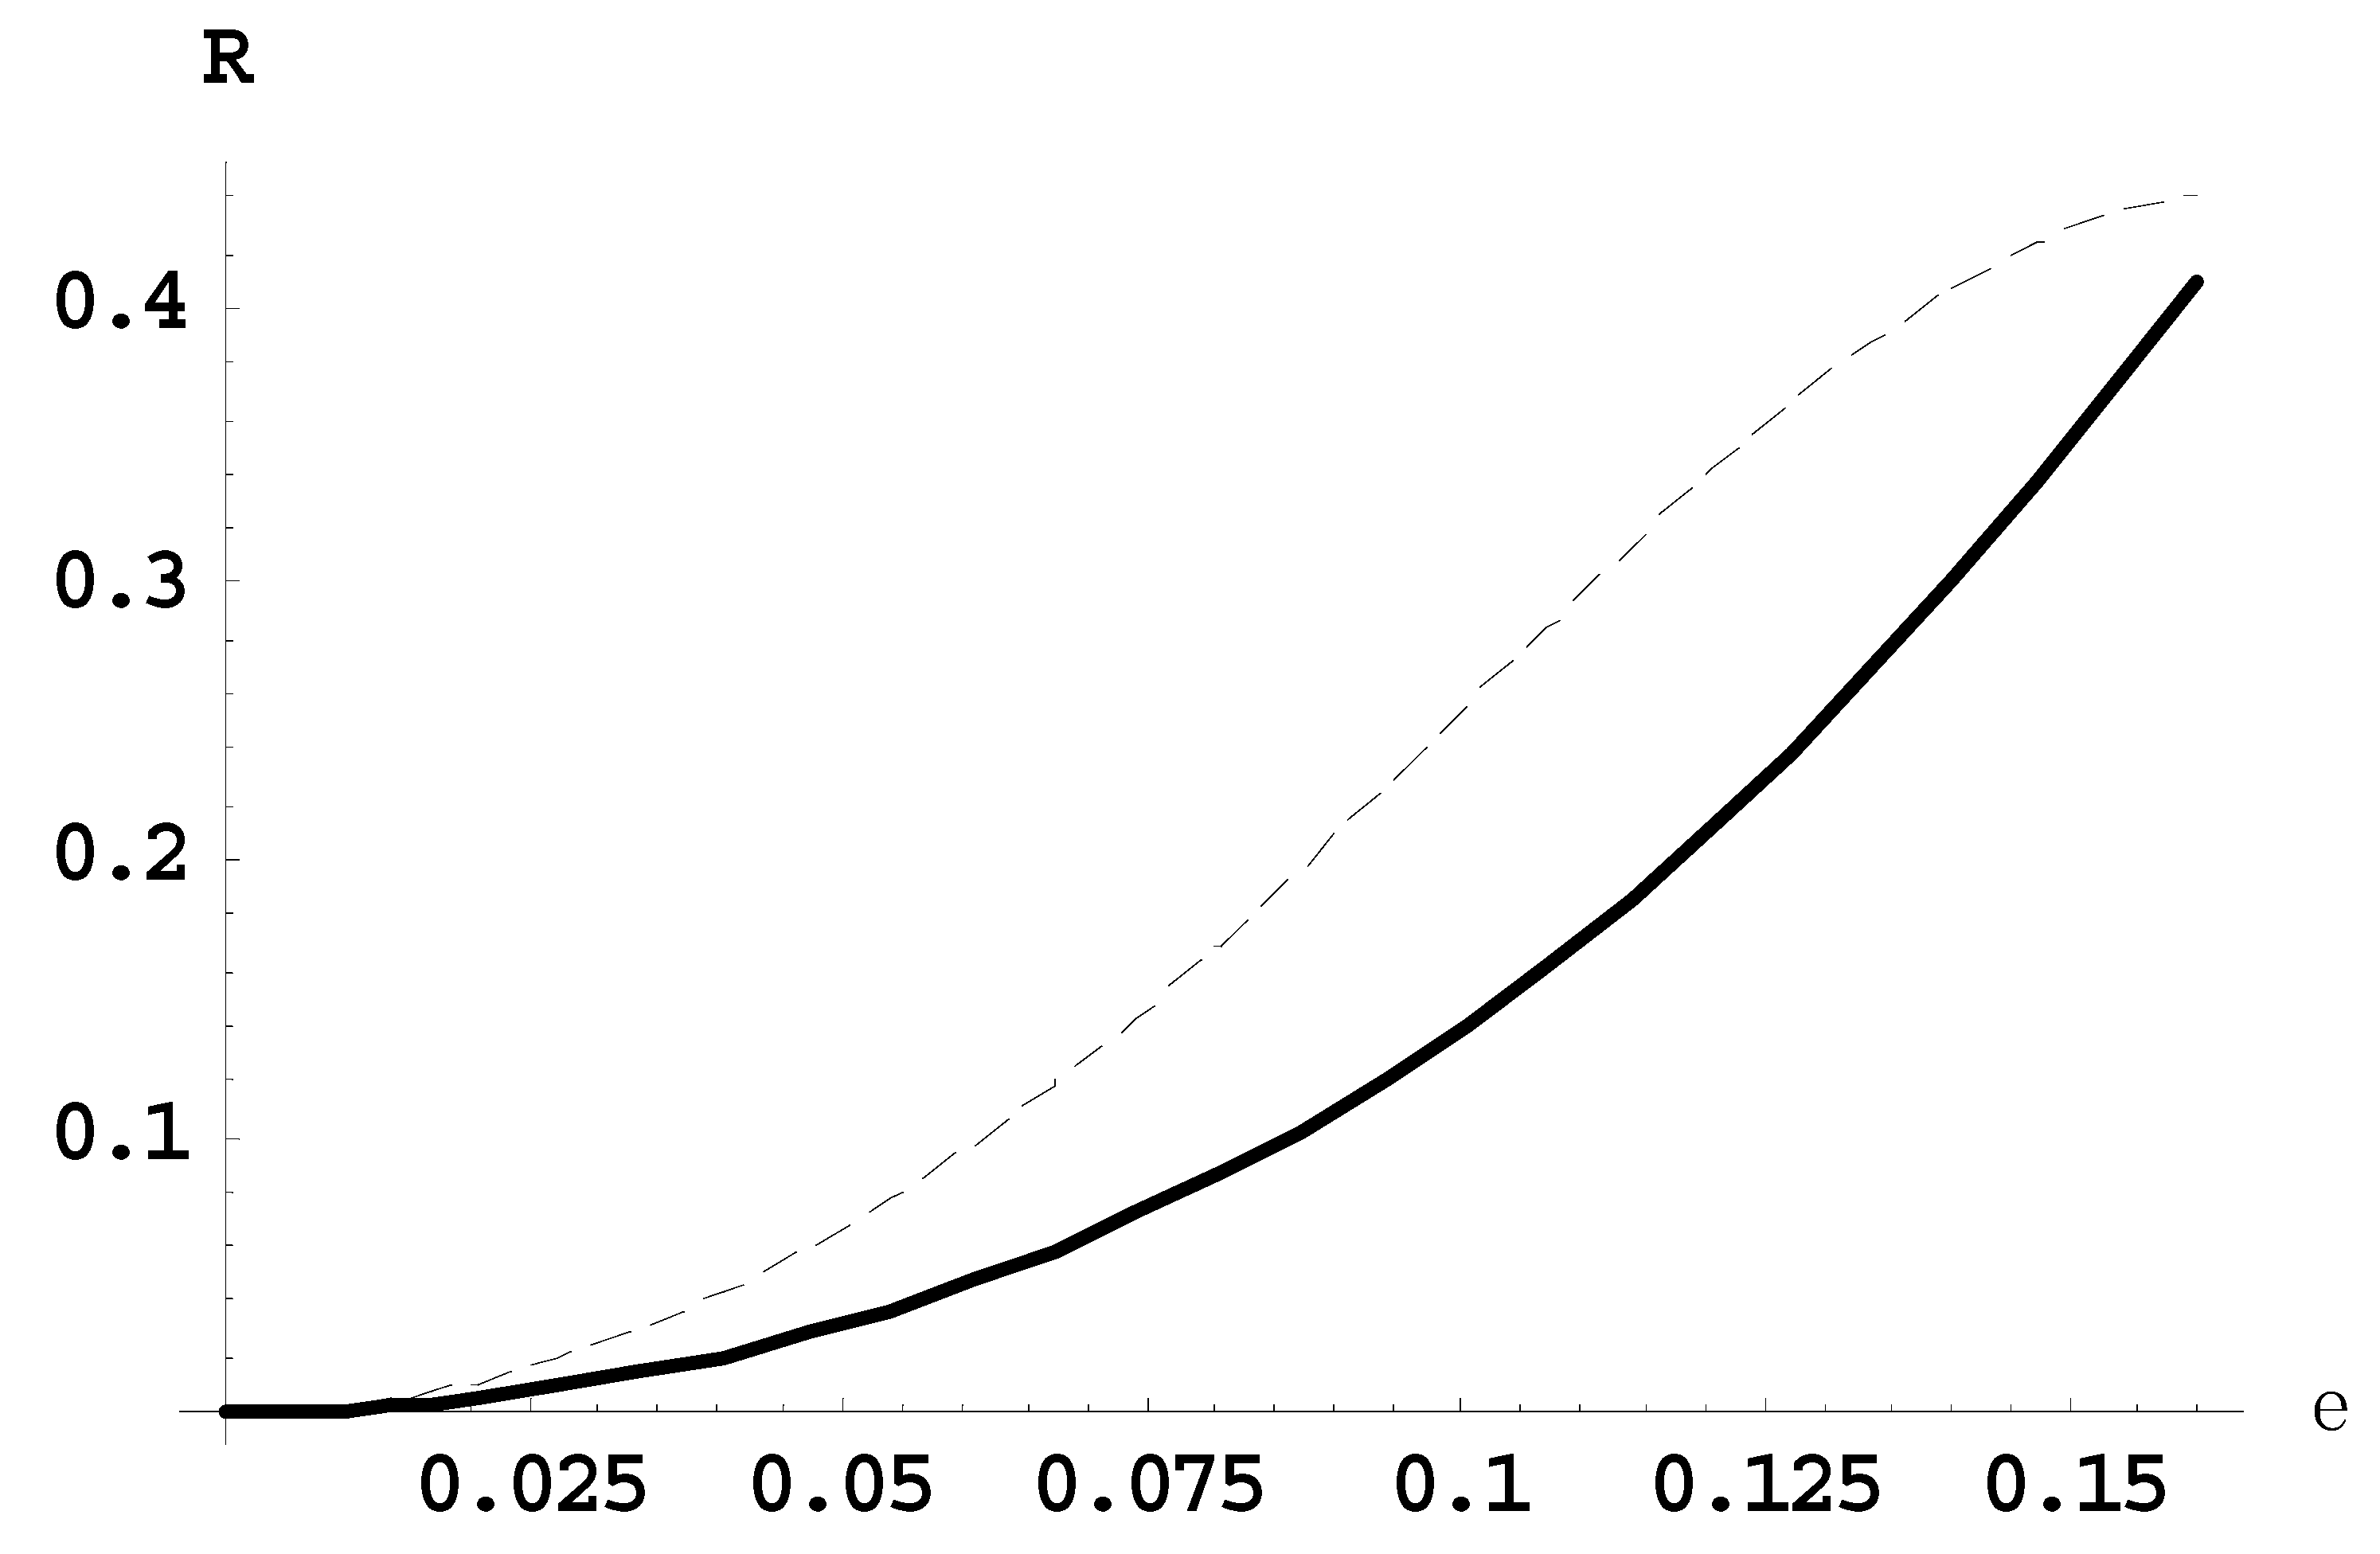
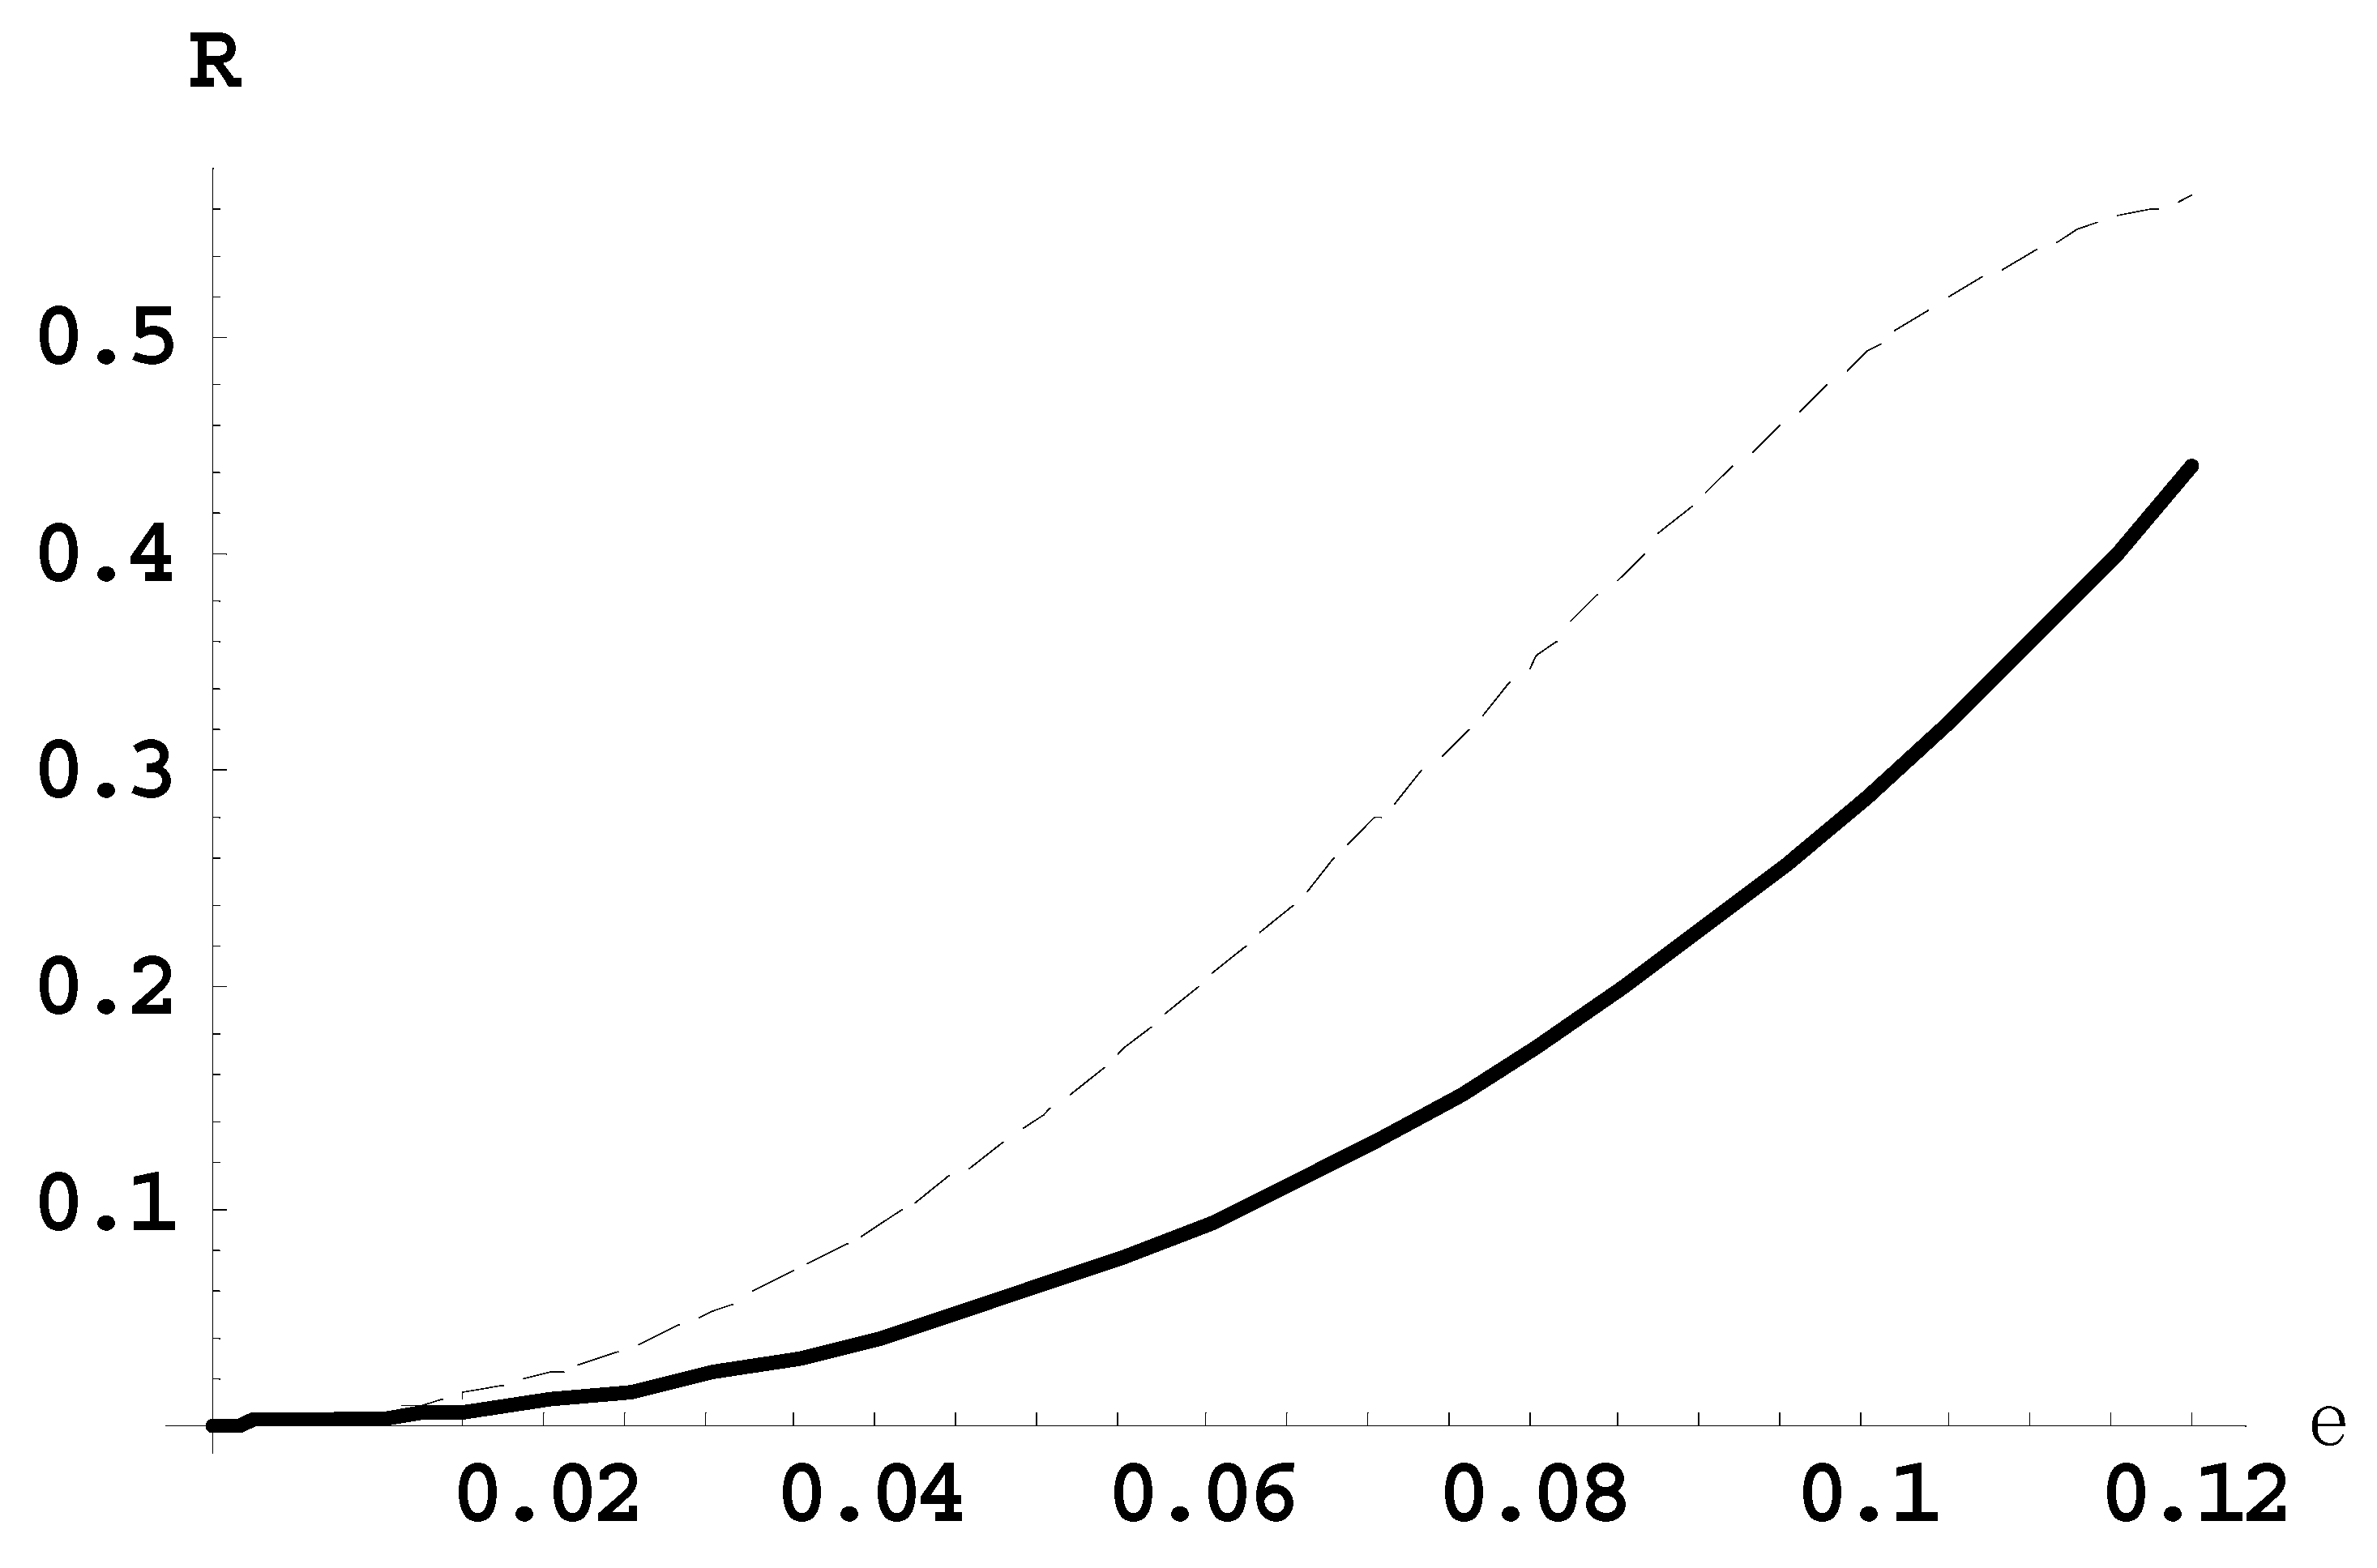
Figure 4 presents the dependence of the ratio
R21(
ε) of the intensity of the second satellite to the intensity of the first satellite (solid line) and the ratio
R10(
ε) of the intensity of the first satellite to the intensity of the main line (dashed line), for the Lyman-delta line for the observation parallel to the laser field.
Figure 5 presents the dependence of the ratio
R21(
ε) of the intensity of the second satellite to the intensity of the first satellite (solid line) and the ratio
R10(
ε) of the intensity of the first satellite to the intensity of the main line (dashed line), for the Balmer-beta line for the observation perpendicular to the laser field.
Figure 6 presents the dependence of the ratio
R21(
ε) of the intensity of the second satellite to the intensity of the first satellite (solid line) and the ratio
R10(
ε) of the intensity of the first satellite to the intensity of the main line (dashed line), for the Balmer-beta line for the observation parallel to the laser field.
Figure 7 presents the dependence of the ratio
R21(
ε) of the intensity of the second satellite to the intensity of the first satellite (solid line) and the ratio
R10(
ε) of the intensity of the first satellite to the intensity of the main line (dashed line), for the Balmer-delta line for the observation perpendicular to the laser field.
Figure 8 presents the dependence of the ratio
R21(
ε) of the intensity of the second satellite to the intensity of the first satellite (solid line) and the ratio
R10(
ε) of the intensity of the first satellite to the intensity of the main line (dashed line), for the Balmer-delta line for the observation parallel to the laser field.
All of the above figures demonstrate, in particular, the following. For relatively small laser fields, there is one-to-one correspondence between the scaled laser field ε and the corresponding ratios of satellite intensities.
Now we present the corresponding analytical results for the cases of the nonzero optical depth. At τ0 > 0 (and especially at τ0 > 1), the ratio R10(τ0) has to be calculated as follows.
In Equation (3) the profiles of each satellite and of the main line are represented by the delta-function. In reality, these profiles are influenced by various broadening mechanisms. Typically, for the experimental ratio of intensities of the satellites (to each other or to the intensity of the main line) one uses the corresponding experimental ratio of the peak intensities.
The profile
P(Δ
ω) of a spectral line affected by the optical thickness can be represented as follows
where
P0(Δ
ω) is the profile of the absorption coefficient normalized such that
P0(0) = 1. At
τ0 = 0, one has
P(0, Δ
ω) =
P0(Δ
ω), so that
P(0, 0) = 1. The peak intensity of the normalized profile is
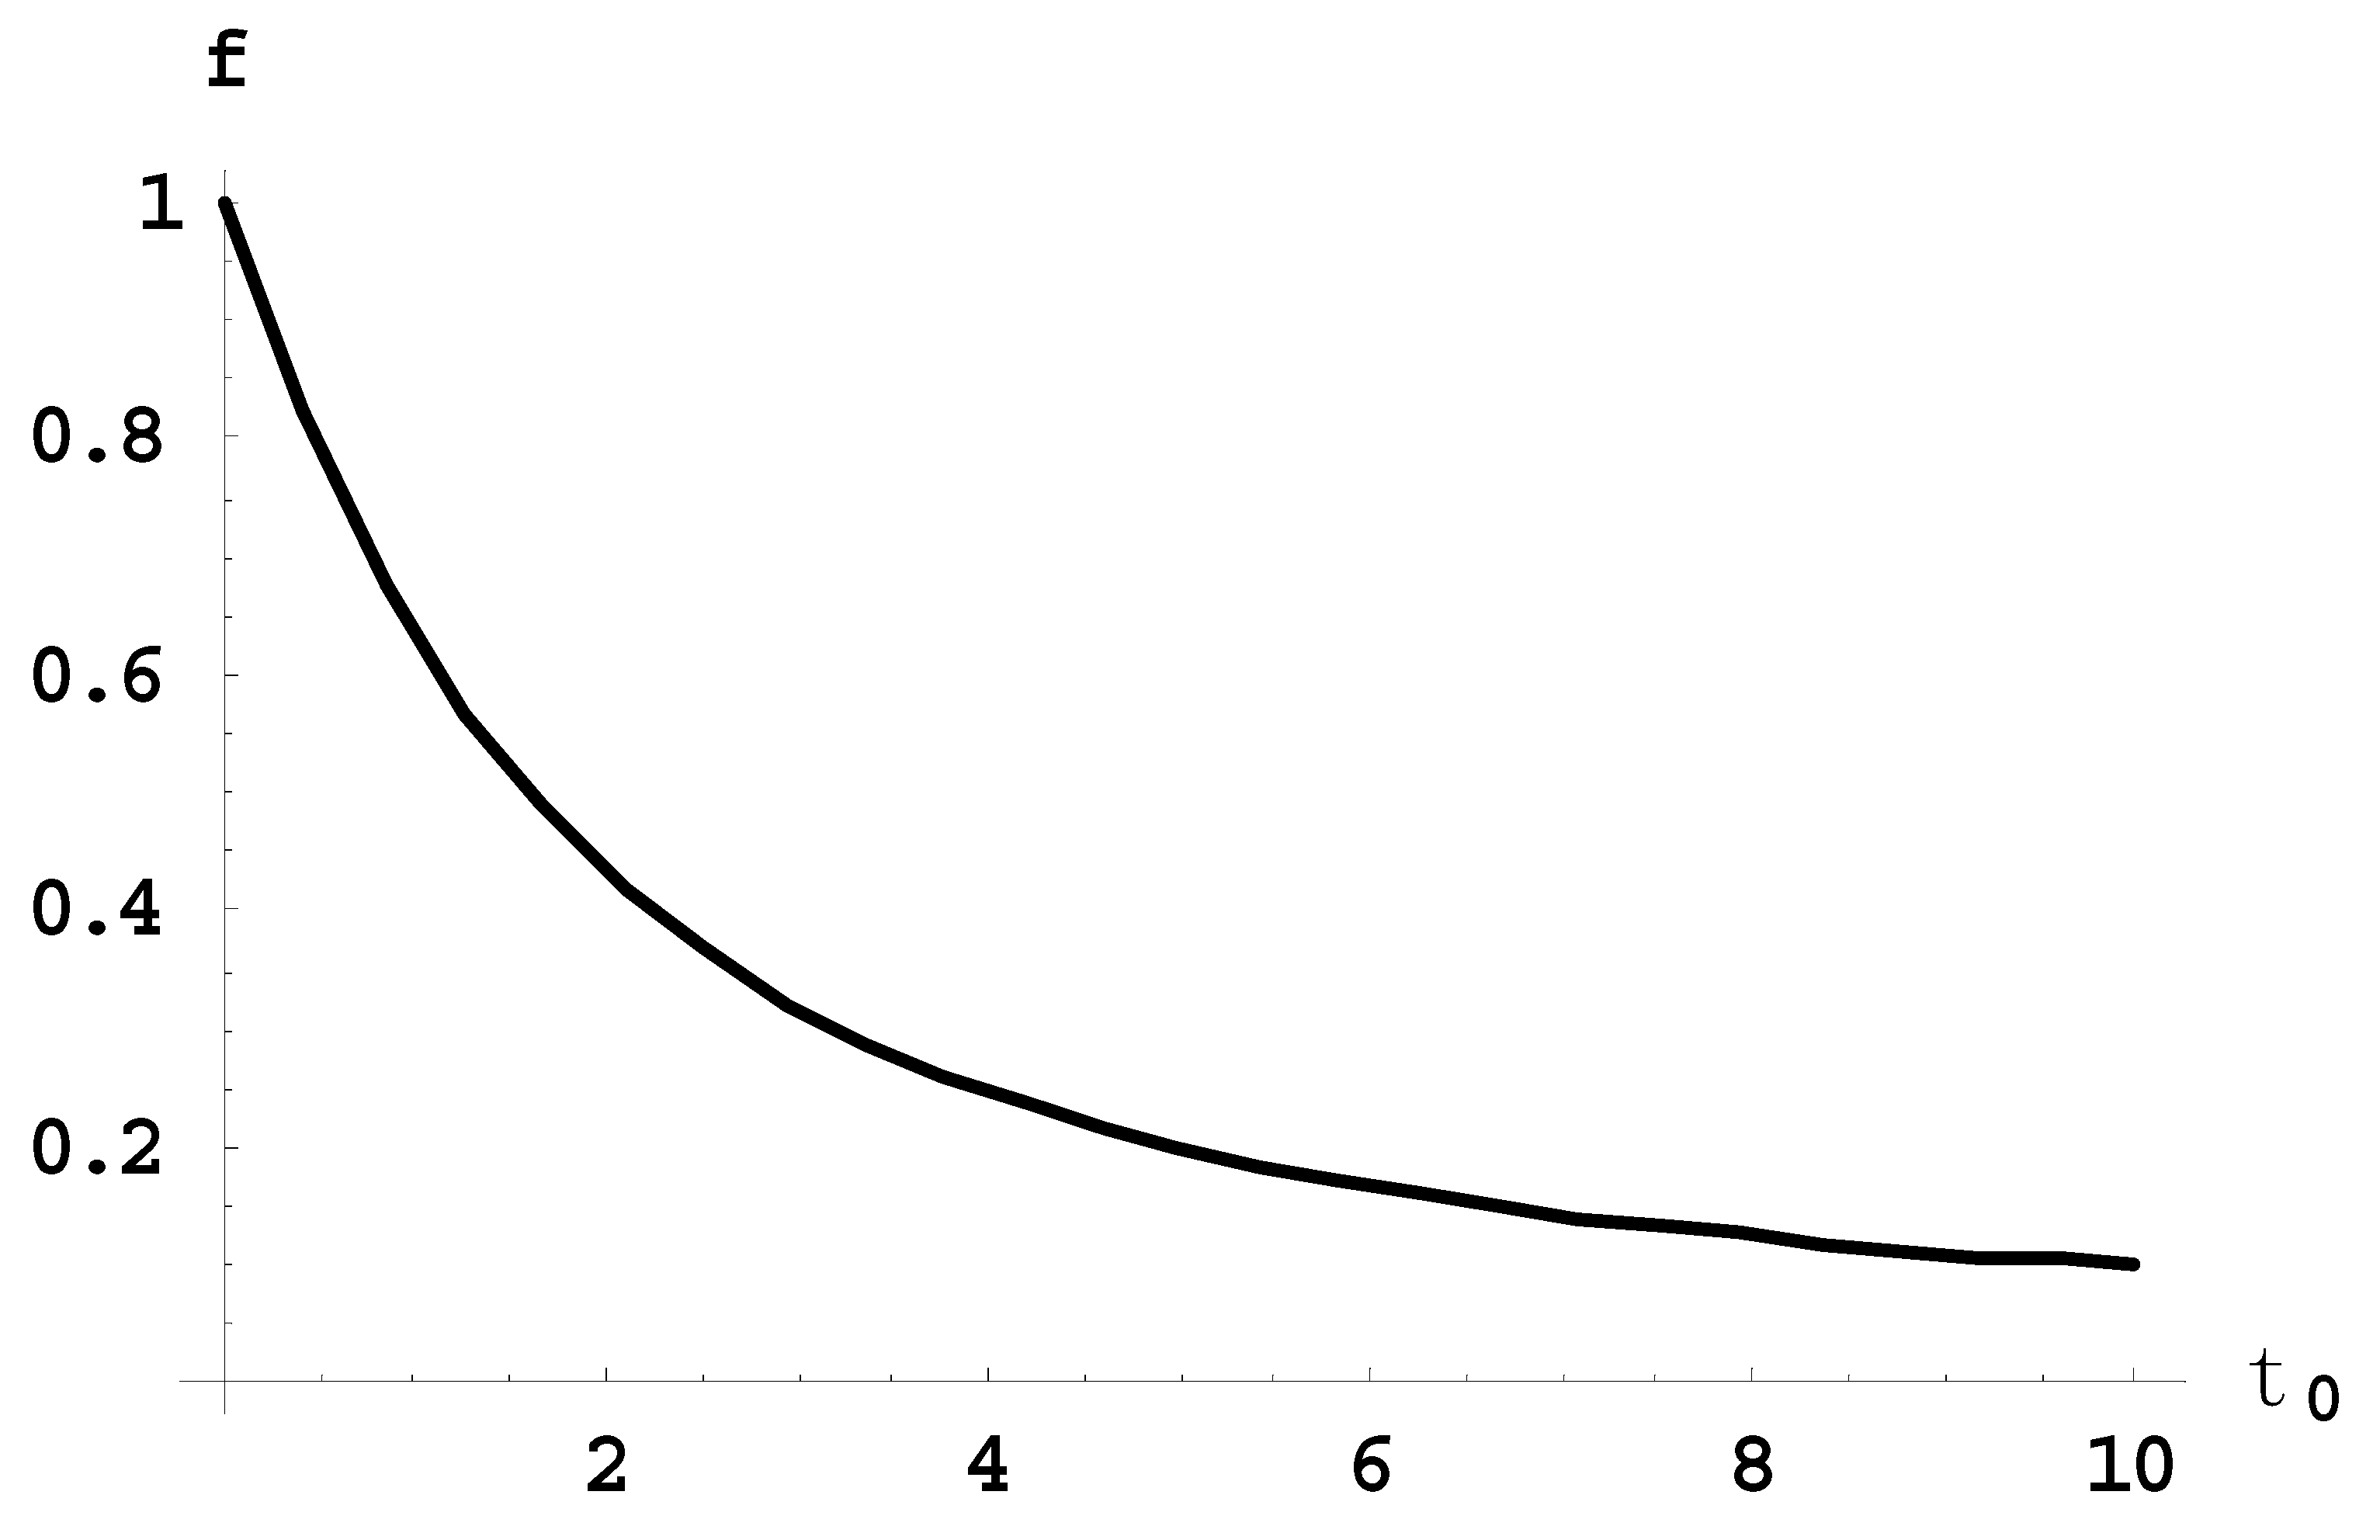
Thus, the factor reducing the peak intensity compared to the case of
τ0 = 0 is
Figure 9 shows the dependence of the reducing factor
f on the optical depth
τ0. It is seen the greater the optical depth, the more significant becomes the reduction of the peak intensity.
Since the satellites are optically thin and
P(0, 0) = 1, the ratio of the peak intensity of the second satellite to the peak intensity of the first satellite is still given by Equation (6). But for the ratio of the peak intensity of the first satellite to the peak intensity of the main line we get
or
Thus, from the experimental ratio
R21 one can determine the scaled amplitude of the laser field
ε (as well as the laser amplitude
E0 by using Equation (6)). Then after substituting the found value of ε and the experimental ratio
R10 in the right side of Equation (12), one can determine the optical depth
τ0 of the main line. For the frequently used spectral lines Lyman-beta, LyFigurean-delta, Balmer-beta, and Balmer-delta, the ratio
I(1,
ε)/
I(0,
ε) entering Equations (11) and (12) can be determined also from
Figure 1,
Figure 2,
Figure 3,
Figure 4,
Figure 5,
Figure 6,
Figure 7 and
Figure 8.
For resolving the satellites, the frequency of the laser field should significantly exceed the characteristic scales of the Stark and Doppler broadenings:
Here Zp is the charge of perturbing ions, ω0 is the unperturbed frequency of the spectral line, T is the ion temperature and M is the reduced mass of the pair “perturbing ion and radiating ion/atom”.
If
ω is the frequency of the Nd laser (1.77 × 10
15 s
−1), then for the Si XIV Ly-beta line (used, e.g., in experiments [
17,
18]), the condition (13) is satisfied for
Ne << 3 × 10
23 cm
−3 and
T << 6 keV. Even in studies of relativistic laser-plasma interactions (such as, e.g., the studies [
17,
18]) both the
Ne and
T are by one or more orders of magnitude lower than the above thresholds, so that the condition (13) is met. In studies of nonrelativistic laser-plasma interactions (i.e., for lower laser intensities), both the
Ne and
T are lower than in the relativistic situation, so that the condition (13) is satisfied with even broader margin. Therefore, the employment of the satellites of hydrogenic spectral lines for the diagnostic presented in this paper should be feasible in experiments like [
13,
14].
