
Article

Structural, Phase, and Optical Changes Induced by High Pressures in HEO Nanoceramics
by
Arseny N. Kiryakov
1,
Yulia A. Kuznetsova
2,
Evgeny A. Buntov
2,*,
Tatyana V. Dyachkova
1 and
Alexander P. Tyutyunnik
1
1
Institute of Solid State Chemistry, Ural Branch of the Russian Academy of Sciences, ul. Pervomaiskaya 91, 620108 Ekaterinburg, Russia
2
Institute of Physics and Technology, Ural Federal University, ul. Mira 19, 620002 Ekaterinburg, Russia
*
Author to whom correspondence should be addressed.
Ceramics 2026, 9(8), 78; https://doi.org/10.3390/ceramics9080078
Submission received: 3 July 2026 / Revised: 25 July 2026 / Accepted: 27 July 2026 / Published: 31 July 2026

Abstract

High-entropy oxide (HEO) nanoceramics based on (Y0.2La0.2Gd0.2Eu0.2Er0.2)2O3 were synthesized at 600 °C for 10 min under pressures of 2, 4, 6, and 8 GPa using High-Pressure–Low-Temperature (HPLT) technology, and the resulting structural, phase, and optical changes were studied as a function of synthesis pressure. X-ray diffraction with Rietveld refinement showed that the initial single-phase cubic nanopowder decomposes under pressure into a mixture of cubic, monoclinic, and orthorhombic high-entropy phases: the cubic fraction falls from 67.3% at 2 GPa to 46.8% at 4 GPa, 42.9% at 6 GPa, and 31.1% at 8 GPa, while low-symmetry monoclinic and orthorhombic inclusions become correspondingly more abundant. Raman spectroscopy validated this evolution, with the 2 GPa sample showing a resolvable doublet near 364 and 353 cm−1 attributable to two coexisting cubic phases, while samples synthesized at 4–8 GPa converge on a single narrow band at 353 cm−1 that broadens with increasing pressure. Photoluminescence measurements revealed that the sample synthesized at 2 GPa exhibits the highest Eu3+ and Er3+ luminescence intensity, with emission and excitation intensities decreasing systematically as synthesis pressure increases. We attribute this decline to the growing fraction of low-symmetry monoclinic phase, whose C2h point-group sites impose parity-forbidden selection rules on the 5D07FJ transitions of Eu3+, combined with an increased probability of nonradiative relaxation at structural defects introduced by pressure. These results establish synthesis pressure as a practical lever for tuning the phase composition and luminescent efficiency of multi-lanthanide HEO nanoceramics and indicate that low pressures (~2 GPa) are preferable for optical applications requiring high luminescence intensity.

1. Introduction

Ceramic materials are widely used in aerospace thermal protection systems, energy conversion and storage devices, electronic and dielectric components, biomedical implants, and catalytic and environmental technologies, owing to their mechanical strength, thermal stability, and chemical inertness [1]. High-entropy oxides (HEOs) represent a relatively new class of ceramic materials that have attracted considerable scientific attention since the pioneering work by Rost et al. demonstrated entropy stabilization in complex oxides [2]. Unlike conventional ceramics based on one or two principal cations, HEOs contain five or more equimolar or near-equimolar cations randomly distributed within a common crystal lattice. This high degree of compositional disorder yields significant configurational entropy, enabling the stabilization of single-phase solid solutions and providing new opportunities for designing materials with enhanced mechanical strength (e.g., through grain boundary engineering), improved thermal conductivity, tailored electrical behavior, and controllable optical characteristics [2,3,4].
Among the various HEO families, rare-earth-based oxides with the bixbyite structure (space group Ia-3, #206) are promising for optical applications because their multicomponent nature allows multiple optically active lanthanide ions to be incorporated within a single crystalline host [5,6,7]. The structural stability and chemical flexibility inherent in these systems, combined with the rich electronic configurations of rare-earth elements, enable multifunctional luminescent materials suitable for phosphors, solid-state lighting, scintillators, optical thermometry, and laser ceramics [6,7,8,9].
Rare-earth sesquioxides are known to undergo pressure-induced structural transformations from the ambient-pressure cubic bixbyite phase towards denser monoclinic and, in some systems, orthorhombic polymorphs. These changes involve substantial alterations in cation coordination and local atomic arrangement [10,11]. Such transformations often significantly modify physical properties, including optical behavior: the photoluminescence of Eu3+ and Er3+ ions is highly sensitive to the local crystal field environment [12,13,14,15], and lattice distortions induced by pressure directly alter crystal field splitting and non-radiative relaxation pathways.
This work focuses on a specific multicomponent system: (Y0.2La0.2Gd0.2Eu0.2Er0.2)2O3 high-entropy oxide nanoceramics. The pressure range of 2–8 GPa was selected based on established phase transitions in analogous single-component rare-earth sesquioxides: Y2O3 and Eu2O3 undergo cubic-to-monoclinic transitions below 3 GPa and complete by 8 GPa [10,11], ensuring comprehensive coverage of structural evolution in this HEO system.
While the pressure-induced phase behavior of binary rare-earth sesquioxides such as Y2O3 and Gd2O3 is well-documented [16,17], the effect of applied pressure on the structure and optical properties of multi-cation high-entropy rare-earth oxides has not been systematically investigated. It is unclear whether the compositional complexity of HEOs suppresses, promotes, or modifies the pressure-induced phase transitions seen in their binary analogues and how any such structural changes translate into changes in luminescent behavior. Addressing this gap is important because HPLT synthesis offers a route to dense, optically active ceramics at temperatures low enough to preserve nanoscale grain structure and luminescent center efficiency [5]. The present work directly addresses this question by systematically varying synthesis pressure from 2 to 8 GPa and characterizing the resulting structural, phase, and optical changes in (Y0.2La0.2Gd0.2Eu0.2Er0.2)2O3 nanoceramics via X-ray diffraction, Raman spectroscopy, and photoluminescence measurements.

2. Materials and Methods

2.1. Synthesis of the Initial Nanopowder

The high-entropy compound (Y0.2Eu0.2Gd0.2La0.2Er0.2)2O3 nanopowder in the cubic phase was synthesized from a mixture of hydroxides of the starting components via precipitation and heating. The grain size of the initial nanopowder ranges from 20 to 30 nm and can be adjusted during synthesis as well as during drying and calcination of the nanopowder.

2.2. Synthesis and Characterization of the Nanoceramics

The nanoceramics were synthesized using HPLT (High-Pressure–Low-Temperature) technology with synthesis parameters of 600 °C, 10 min, and pressures of 2, 4, 6, and 8 GPa. The synthesis temperature of 600 °C was selected based on the results of [5], which showed that above 600 °C, recrystallization of the nanoceramic grains begins, negatively affecting the optical characteristics and leading to a decrease in ceramic transparency. A special toroidal chamber was used, inside which an assembly consisting of CaCO3 and a graphite heater was placed; the HEO green body was enclosed in a platinum capsule positioned inside the heater. An image of the synthesis setup is shown in Figure 1.
At the end of the experiment, the temperature was rapidly decreased, and then the pressure was released over the course of 1 min.

2.3. Powder Diffractometry

The structural and phase characteristics were analyzed using a STADI-P powder diffractometer (STOE & Cie GmbH, Darmstadt, Germany) with CuKα1 radiation in the 2θ range from 5° to 120° with a step of 0.02°. For the analysis of the X-ray diffraction patterns, we used the Rietveld refinement method and the GSAS software package [18,19]. The refinement quality indicators (wRp, Rp, χ2, R(F2)) and the corresponding refinement profiles for all samples are given in the Supplementary Materials (S1–S5); wRp did not exceed 2.5%, supporting the reliability of the multiphase refinements. The lattice parameters, the coherent scattering region (CSR) sizes, and the strain values were determined. The results are presented in Table 1. For the low-symmetry phases, the refinements were started from the published structural models of the corresponding binary sesquioxides [20,21,22]. Accordingly, the atom labels inherited from those reference structures in the Supplementary Tables (e.g., Tb, Bi) denote crystallographic sites of the template model and not the actual chemical species, which are the constituent rare-earth cations of the high-entropy composition.

2.4. HR TEM

The samples for HRTEM were prepared by drop-casting suspensions of the particles in methanol onto a carbon-coated copper grid (400 mesh). The measurements were taken once the solvent had evaporated in a JEM-1011 microscope (JEOL Ltd., Tokyo, Japan) at an accelerating voltage of 200 kV. The nanograin morphology was confirmed using high-resolution scanning electron microscopy (HRSEM) and a JEM-2100+ high-resolution transmission electron microscope (JEOL Ltd., Tokyo, Japan) (HRTEM). The HRTEM analysis was conducted at an accelerating voltage of 200 kV, with a point resolution of 0.194 nm and a lattice resolution of 0.14 nm. The microscope was equipped with a 5-axis eucentric goniometer stage, enabling specimen tilting up to ±60°.

2.5. Raman Spectroscopy

Raman spectra were recorded using a LabRAM HR Evolution confocal spectrometer (HORIBA France SAS, Longjumeau, France) with blue laser excitation at 488 nm. For the analysis of the Raman spectra, we applied a fifth-order polynomial to account for the background signal. Deconvolution of the vibrational modes was performed using Lorentzian functions.

3. Results and Discussion

3.1. XRD

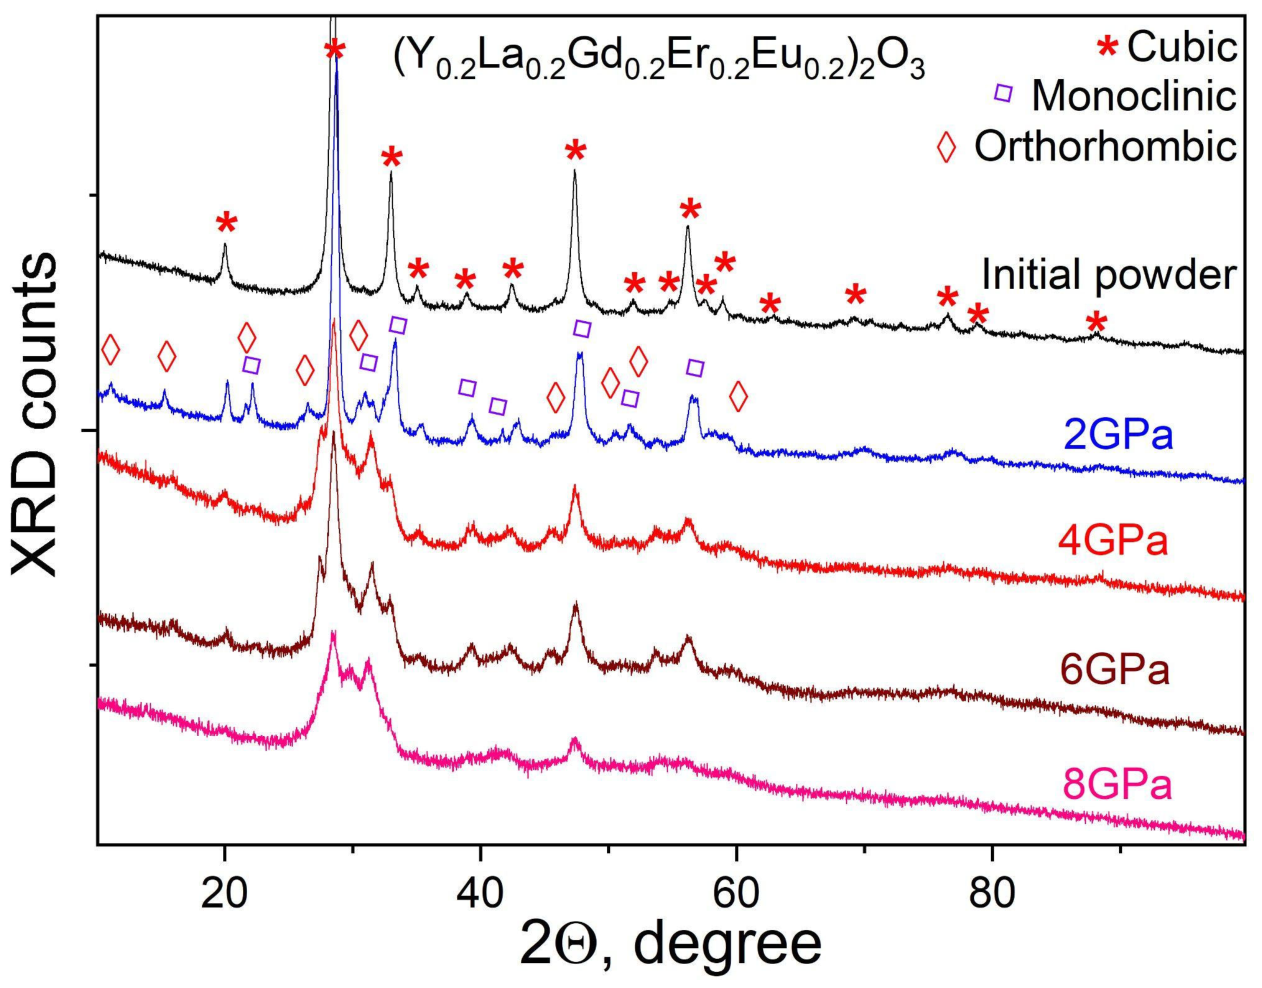
The initial nanopowder is characterized by a cubic lattice with space group I21/a-3. The lattice constant is a = 10.8494 Å. More detailed data are provided in the Supplementary Materials (S1). The XRD pattern of the initial powder is shown in black in Figure 2. It is evident that the reflections are broadened due to the small crystallite size. Synthesis of the nanopowder at 2 GPa significantly changes the structural and phase characteristics. Two types of cubic crystal lattices with space group I21/a-3 are formed. They differ in the lattice constant a (S2). For the first cubic phase, a = 10.7406 Å, and for the second, a = 10.8213 Å. In addition, as a result of pressure, monoclinic (P121/m1) and orthorhombic (Ama2) phase modifications are formed. According to Table 1, these phases correspond to REO(OH) and RE2O2(CO3), respectively. Their most probable source is the hydroxide precursor used for the nanopowder synthesis: residual hydroxide groups and carbonate species captured during precipitation and drying apparently do not decompose completely at 600 °C under a pressure of 2 GPa. At higher synthesis pressures, these phases are not detected, and only high-entropy oxide phases are observed.
HEO synthesis at 4 GPa stimulates the formation of a monoclinic phase with space group C12/m1, in addition to the cubic phase (a = 10.840 Å) (S3). From the diffraction patterns presented in Figure 2 (red curve), it can be seen that broadening of the X-ray reflections occurs, which is apparently due to a change in the size of the coherent scattering regions.
Synthesis at a pressure of 6 GPa stimulates the formation of monoclinic and cubic (a = 10.8422 Å) phase modifications (S4). Together with them, an orthorhombic phase with space group Ccc2 is formed (as a result of the symmetry reduction P-421c → Ccc2). An increase in synthesis pressure to 8 GPa leads to the formation of two stable phase modifications: cubic (a = 10.833 Å) and monoclinic (S5).
Table 1 presents the crystallographic parameters of the initial nanopowder as well as the synthesized nanoceramics. The structural and phase modification of the high-entropy oxide during nanoceramic synthesis is primarily caused by high pressure. Under hydrostatic compression at a pressure of 2 GPa, cations with the smallest ionic radii (erbium, yttrium, and gadolinium) presumably form a cubic high-entropy phase with a reduced lattice constant, a = 10.7406 Å. Quantitatively, the proportion of this phase is 31.3%. The ionic radii of the six-coordinate octahedral cations used for the synthesis of the high-entropy ceramic are Y3+ = 1.04 Å, La3+ = 1.172 Å, Gd3+ = 1.078 Å, Er3+ = 1.03 Å, Eu3+ = 1.087 Å [26]. In addition, a cubic phase is present with a lattice constant of a = 10.8213 Å, a value close to that of the initial nanopowder, for which a = 10.8494 Å. The total proportion of the cubic phase is 67.3%.
At the same time, some of the cations with larger ionic radii form lower-symmetry phase inclusions, such as the monoclinic and orthorhombic phases. It should be noted that the crystalline regions for these phase inclusions correspond in size to the initial nanopowder and are on the order of 20–24 nm. For the cubic phase with the smaller lattice constant parameter, the coherent scattering regions of the X-ray quanta are one and a half times larger than those of the initial nanopowder (Table 1, last column). The growth of the crystallites may provide indirect evidence of atomic diffusion during synthesis, as a result of which cations with smaller ionic radii formed separate inclusions. We emphasize that this cation-segregation scenario remains a hypothesis inferred from the lattice-constant systematics; its direct verification requires local compositional analysis, such as STEM-EDS mapping or site-occupancy refinement, which was not available in the present study.
When the pressure is increased to 4 GPa, a nanoceramic containing two phases, one cubic and one monoclinic, is formed. Each of the resulting phases is a high-entropy compound with a complex cationic sublattice. It should be noted that this assignment assumes that the pressure-induced phases retain the full multi-cation composition of the parent oxide; as noted above, that assumption is not verified by local compositional analysis here and is therefore adopted as a working hypothesis. Notably, for the cubic phase, the crystallographic parameters are close to those of the initial nanopowder, although the crystallite size has decreased by half. The proportion of the cubic phase in this case is 46.8%. The stabilization of only one cubic modification at this pressure, in contrast to the two coexisting cubic phases observed at 2 GPa, may result from an expansion of the solid-solution stability range of the (Y0.2La0.2Gd0.2Eu0.2Er0.2)2O3 compound as a result of the increased pressure. The decrease in the coherent scattering region may be caused either by a phase transition or by amorphization of the crystallite surface.
With a further increase in synthesis pressure to 6 and 8 GPa, a similar trend is observed: a decrease in the coherent scattering region of the nanoceramic particles relative to the initial material, as well as a decrease in the proportion of the cubic phase modification to 42.9% and 31.1%, respectively. The nonmonotonic evolution of the CSR and strain values (Table 1) apparently reflects a competition among several processes occurring under high pressure: pressure-assisted crystallite growth, which dominates at 2 GPa; fragmentation of the grains at higher pressures; and progressive surface amorphization, similar to the behavior reported for MgAl2O4 nanoceramics densified under high pressure [27]. Thus, several key trends in the structural and phase evolution with increasing synthesis pressure can be identified. First, with increasing pressure, in addition to the cubic phase, additional phase inclusions are formed, representing a high-entropy compound with reduced lattice symmetry; second, an increase in synthesis pressure raises the fraction of the low-symmetry phases relative to the cubic phase. These data correlate with the results of a study on the binary oxide Y2O3 under high pressure with simultaneous torsion, in which the authors also recorded phase transitions upon compression at 6 GPa, although a rotating-anvil technique was used to obtain the monoclinic phase [10]. Based on the known behavior of binary sesquioxides under pressure [16,17], two mechanisms are likely to operate in parallel in the present system: a pressure-induced transformation of the cubic bixbyite structure into the denser monoclinic polymorph, which dominates at 4–8 GPa, and diffusion-assisted redistribution of cations between coexisting phases, which is promoted by the synthesis temperature and manifests itself at 2 GPa in the coexistence of two cubic phases with different lattice constants. We therefore regard the pressure-induced phase transition as the primary factor governing the phase composition, with pressure-promoted ion migration playing a secondary, kinetically limited role.
Thus, increasing pressure stimulates a redistribution of the phase composition of the synthesized nanocomposite. Based on the observed dynamics, it may be expected that reducing the pressure to 1 GPa and below would shift the phase distribution of the nanocomposites toward a single cubic modification with space group I21/a-3, characteristic of the original sample. This is, however, an extrapolation beyond the 2–8 GPa interval covered by the present experiments: the lower pressure limit at which a sufficiently dense ceramic can still be obtained remains to be established.

3.2. HRTEM

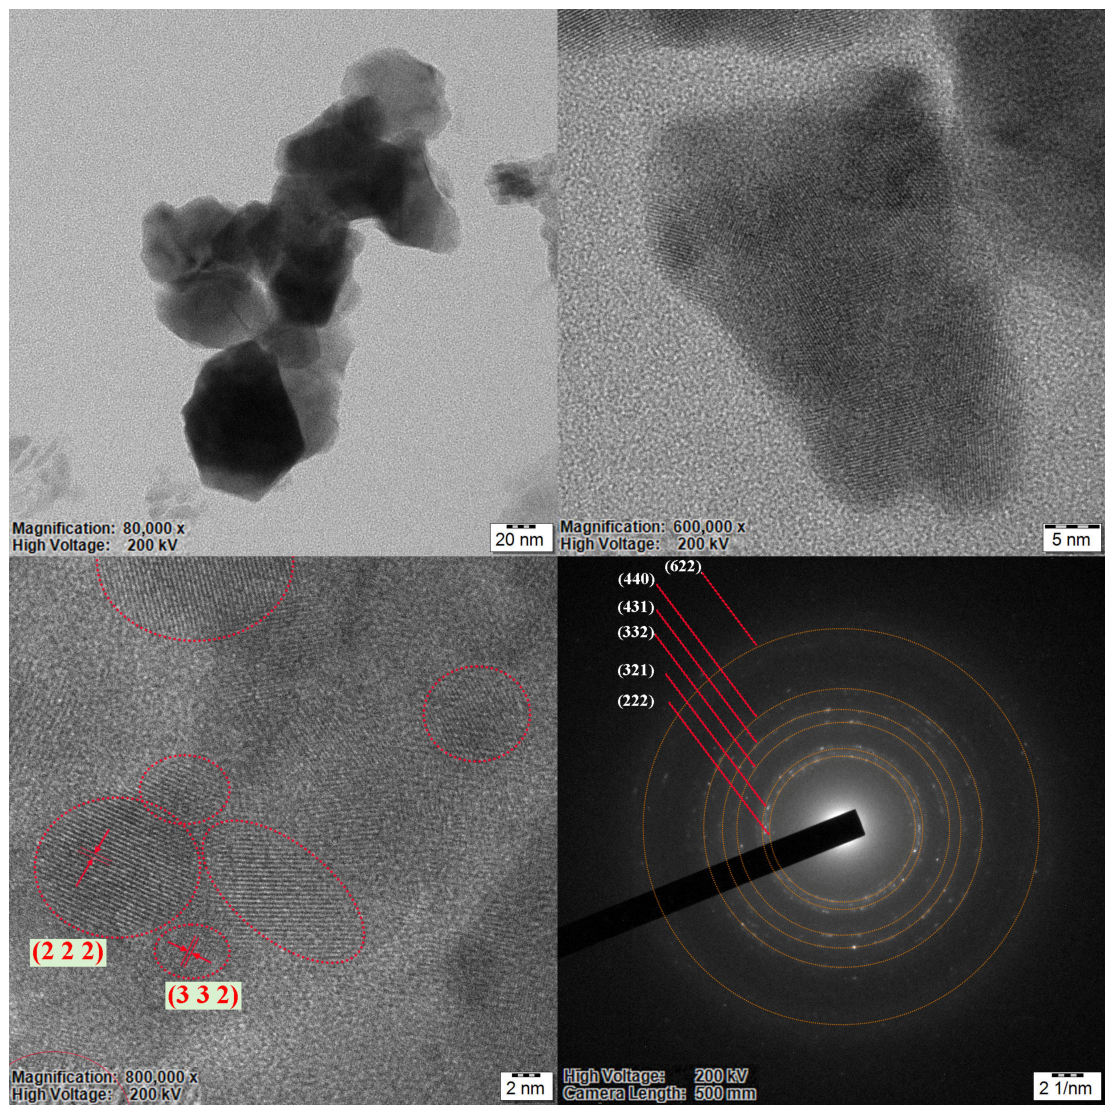
HRTEM images of the 4 GPa sample are shown in Figure 3. The nanoceramic is formed by sintering of individual agglomerates not exceeding 50 nm in size. The pore size is substantially smaller than the crystallite dimensions. At higher magnification, the agglomerates are seen to consist of misoriented nanocrystalline grains. The grain surfaces are amorphized to a depth of up to several atomic layers, forming a core-shell-like structure in which a crystallized grain serves as the core and a disordered layer constitutes the shell. The dimensions of the crystalline cores observed in the images are consistent with the CSR values obtained for this sample from the Rietveld refinement (10–11 nm, Table 1), indicating that the reduction of the CSR relative to the initial powder reflects grain fragmentation together with surface amorphization rather than a change in the agglomerate size. A similar effect has been reported by Zou et al. [27] in their study of the nanosintering mechanism of MgAl2O4 transparent ceramics under high pressure. It has been shown that with the HPLT approach, nanoceramic crystallite sizes range from a few to tens of nanometers, and residual porosity is even lower. Figure 3 shows that, unlike classical ceramic synthesis methods, the HPLT route leaves only isolated residual pores at the triple grain junctions, whose size is much smaller than the crystallite dimensions. This is due to the preferential processes of crystallite compression rather than interboundary diffusion.
The SAED pattern (Figure 3, lower-right inset) displays a set of rings with irregular intensity profiles. The ring profiles are broadened, indicating strong structural disorder in the sample. Table 2 compares the interplanar distances calculated from the SAED pattern with the XRD values for the cubic structure modification. The interplanar spacings d from XRD were obtained from the Bragg relation d = λ/(2 sinθ) for CuKα radiation (λ = 1.5406 Å), whereas the SAED values were determined from the radii of the diffraction rings formed by the low-dimensional crystallites, taking the reciprocal-space geometry and the microscope camera length into account. Note that the d values derived from the SAED rings are systematically smaller than the corresponding XRD values; this discrepancy is most likely instrumental in origin (camera-length calibration) and is amplified by the strong ring broadening caused by structural disorder, so the SAED data are used here only for a qualitative assessment of the retained crystallinity.

3.3. Raman

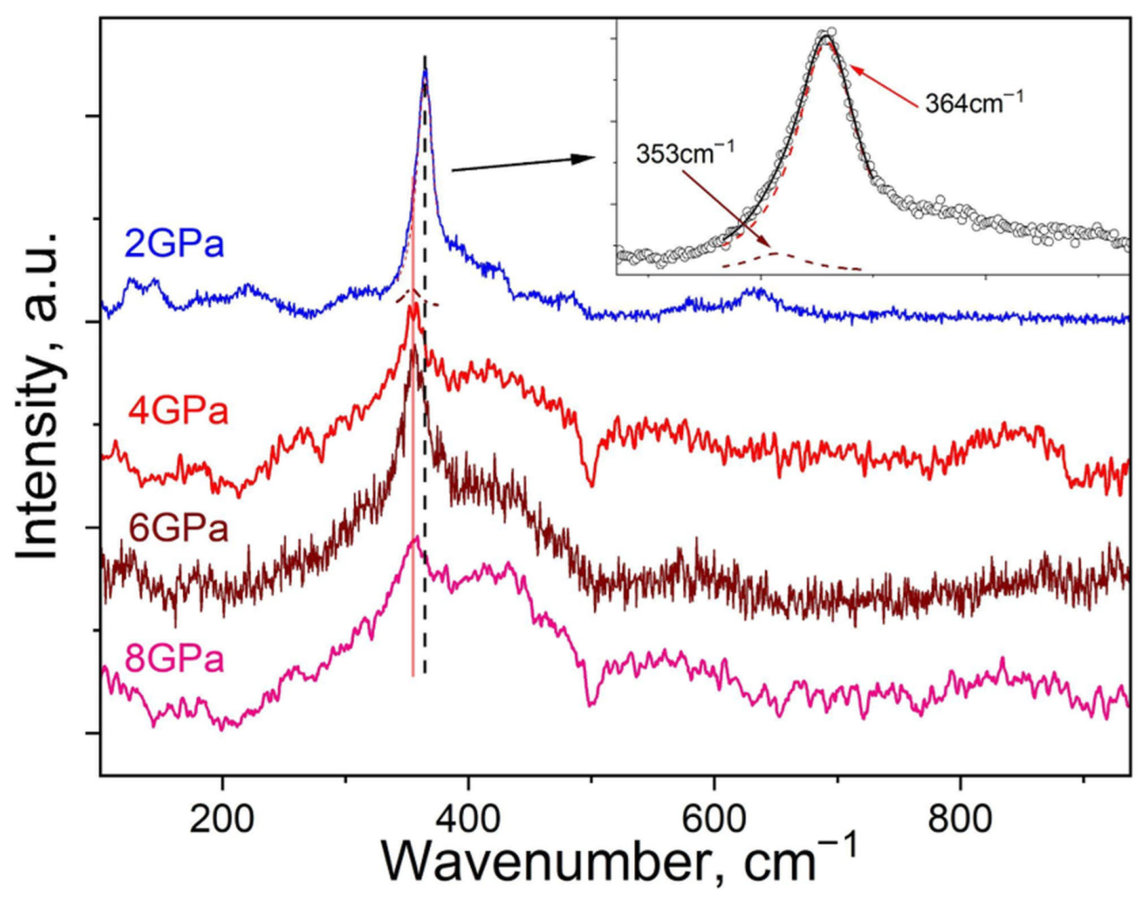
The synthesized ceramics are partially characterized by the cubic crystal lattice of yttrium oxide. Accordingly, vibrational modes characteristic of octahedral coordination were expected in the Raman spectra. Figure 4 shows the Raman spectra recorded using a 488 nm argon laser for the synthesized nanoceramics. The most intense vibrational mode in the 2 GPa sample has a maximum at 364 cm−1. In addition, weak vibrational modes with maxima at 124 cm−1, 146 cm−1, 221 cm−1, 427 cm−1, 484 cm−1, and 632 cm−1 are clearly distinguishable. It is evident that these vibrational modes are broadened, which is due to the nanoscale size of the crystallites. In general, the change in the half-width of vibrational modes along the single crystal–microceramic–nanoceramic series for cubic oxides has been clearly demonstrated in [13].
In the present work, we cannot establish complete correspondence between the extrema observed experimentally and the actual vibrational modes in the high-entropy nanoceramic; however, by comparing the obtained results with the vibrational modes in the Raman spectrum of nanostructured Y2O3 [12], some characteristic features can be highlighted. First, the Raman spectrum of nanostructured Y2O3 in the cubic modification is characterized by an intense band at 377 cm−1, associated with the Fg+Ag vibrational mode. In our samples, the position of this vibrational mode is shifted slightly toward lower energies, to 364 cm−1. This feature is most likely due to the difference in lattice constants. Thus, for the Y2O3 in [12], a = 10.61 Å, whereas in the 2 GPa HEO nanoceramic, this parameter is a = 10.74 Å for one cubic modification and a = 10.82 Å for the second cubic modification. The increase in the lattice constant also leads to an increase in the cation–anion bond length. A longer bond corresponds to a weaker restoring force, that is, to a smaller force constant; since the frequency of a vibrational mode scales as the square root of the force constant divided by the reduced mass of the vibrating pair, this bond weakening lowers the energy of the corresponding modes. Second, the presence of two cubic modifications in the Raman spectra of the HEO 2 GPa sample manifests itself as a broadening of the low-energy shoulder of the band at 364 cm−1. Using Lorentzian deconvolution, it was found that this band is not a single peak but consists of two overlapping vibrational modes (Figure 4, inset). We attribute the second vibrational mode with an energy maximum of 353 cm−1 to the second cubic phase, for which the lattice constant is a = 10.82 Å. The weak vibrational modes may be attributed either to the monoclinic phase modification or to the cubic phase. The parameters of the Lorentzian decomposition of this spectral region, together with the coefficient of determination, are given in Table 3.
As the synthesis pressure increases from 4 to 8 GPa, a single narrow band with an energy maximum of 353 cm−1 dominates the Raman spectrum. We assume that this signal in the Raman spectra is due to the presence of the cubic phase in the samples. The samples obtained at 4, 6, and 8 GPa are characterized by a cubic phase modification with similar lattice parameters (see Table 1). In addition, broadening of the vibrational modes in the 400–500 cm−1 range is observed with increasing pressure. Besides the changes in phase composition, other factors may contribute to the observed broadening and peak shifts, including residual lattice strain, phonon confinement in nanoscale crystallites, and defect-induced disorder; a separation of these contributions is not possible on the basis of the present data alone.

3.4. Photoluminescence

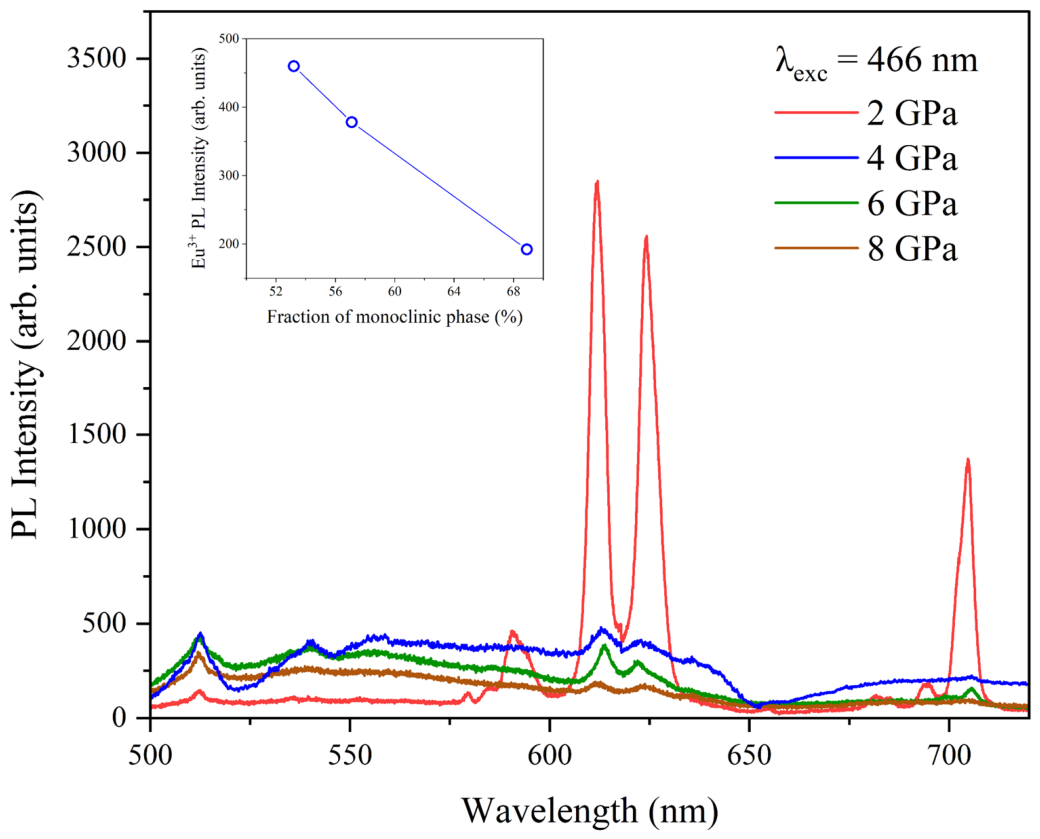
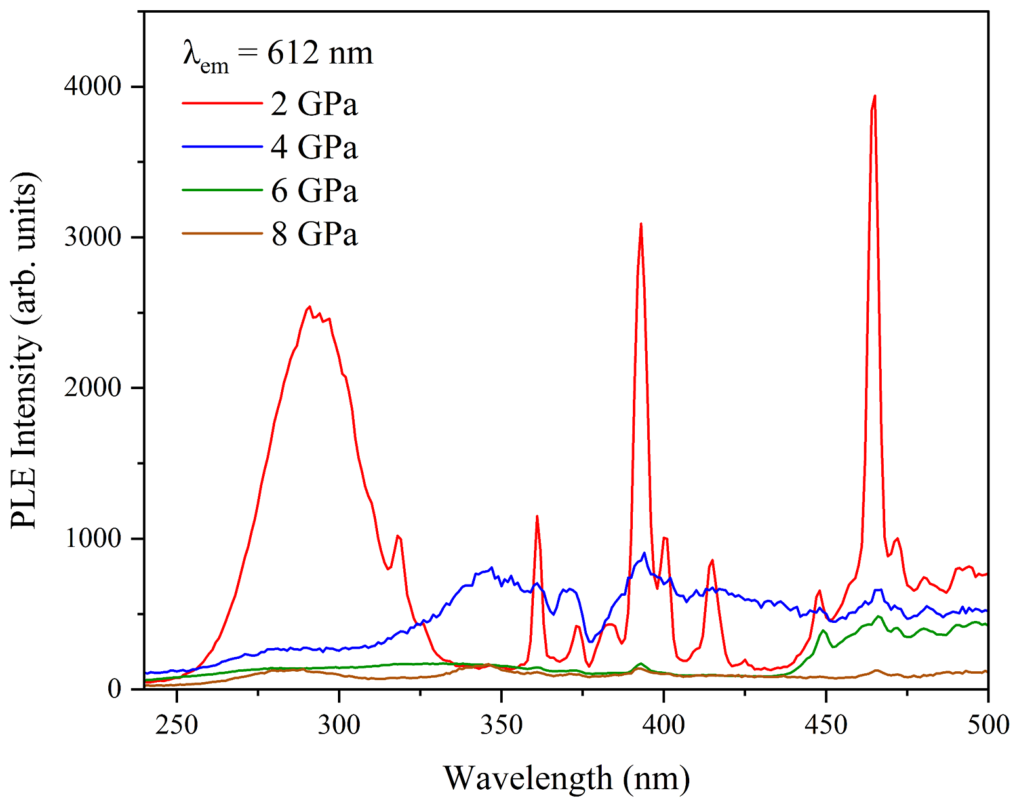
Figure 5 shows the photoluminescence spectra of nanoceramics synthesized at different pressures. The sample synthesized at 2 GPa exhibits the highest luminescence intensity. The emission bands at 579, 590, 612, 624, and 705 nm are attributed to optical transitions in Eu3+ ions from the 5D0 excited state to the 7F0, 7F1, 7F2, and 7F4 multiplets of the ground state, respectively. A relatively weak emission band at 511 nm corresponds to the 4F7/24I15/2 radiative transition in Er3+ ions. The photoluminescence excitation spectra, monitored at an emission wavelength of 612 nm (Figure 6), reveal several narrow bands at 318, 361, 373, 393, 415, and 466 nm. These are assigned to transitions from the 7F0 ground state to the 5L8, 5D4, 5G2, 5L6, 5D3, and 5D2 excited states of Eu3+, respectively. Additionally, a broad band with a maximum at 290 nm is associated with the O2− → Eu3+ charge transfer.
Analysis of the photoluminescence spectra reveals that an increase in synthesis pressure induces significant line broadening and a reduction in luminescence intensity. The broadening of spectral lines is associated with an increase in the degree of structural disorder in the system [14,15]. The formation of low-symmetry monoclinic and orthorhombic phases with increasing synthesis pressure leads to heterogeneity of the local environment of optically active Eu3+ and Er3+ ions. Site-to-site variations in the positions of the energy levels lead to spectral line broadening [28].
The luminescence intensity is determined by the probabilities of radiative and nonradiative transitions. Although intraconfigurational 4f-4f transitions in rare-earth ions are parity forbidden, they can become allowed depending on the local crystal field symmetry. Consequently, the probability of radiative transitions is highly sensitive to the point group symmetry [29]. An increase in synthesis pressure promotes the formation of the monoclinic phase, which correlates with a decrease in luminescence intensity (see inset in Figure 5). The monoclinic structure is characterized by three point groups: C2 and Cs (without an inversion center) and C2h (with an inversion center). In the C2h point group, the 5D07FJ (J = 0, 2, 3, 4) transitions are forbidden [29]. The decrease in luminescence intensity with an increase in the fraction of the monoclinic phase can be attributed to an increase in the number of sites with C2h point group symmetry occupied by Eu3+ ions. An additional contribution to the reduction in luminescence intensity may come from an increased probability of nonradiative relaxation. The structural modification induced by the applied pressure during synthesis may be accompanied by the formation of structural defects that act as luminescence quenchers. Together, these two factors—a decrease in the probability of radiative transitions and an increase in the probability of nonradiative relaxation—lead to the observed decrease in luminescence intensity. In particular, the amorphized surface layers observed by HRTEM (Figure 3) can act as such quenching regions: rare-earth ions located in the disordered shell experience strongly perturbed local crystal fields and enhanced multiphonon relaxation. We note, however, that these interpretations remain qualitative: an unambiguous separation of the radiative and nonradiative contributions requires luminescence lifetime and quantum yield measurements, which will be the subject of future work.

4. Conclusions

High-Pressure–Low-Temperature synthesis at 600 °C provides a single processing parameter, applied pressure, that systematically governs the phase composition and optical performance of (Y0.2La0.2Gd0.2Eu0.2Er0.2)2O3 HEO nanoceramics. Rietveld refinement of the XRD patterns showed that the single-phase cubic starting powder (I21/a-3, a = 10.8494 Å) progressively decomposes into a multiphase mixture of cubic, monoclinic, and orthorhombic high-entropy compounds as synthesis pressure increases from 2 to 8 GPa, with the cubic fraction dropping from 67.3% to 46.8%, 42.9%, and 31.1% at 2, 4, 6, and 8 GPa, respectively. This redistribution is accompanied by a reduction in the coherent scattering regions of the low-symmetry phases relative to the initial nanopowder, consistent with the proposed cation-size-driven segregation scenario: smaller cations (Er3+, Y3+, and Gd3+) preferentially populate the cubic phase, while larger cations are progressively excluded into monoclinic and orthorhombic inclusions as pressure rises. This segregation scenario, however, requires confirmation by local compositional analysis (e.g., STEM-EDS mapping).
Raman spectroscopy supported this picture: the 2 GPa sample displayed a resolvable two-component band near 364 and 353 cm−1, consistent with two coexisting cubic phases of different lattice constants, whereas the 4–8 GPa samples converged on a single, pressure-broadened band at 353 cm−1. Photoluminescence and excitation spectra showed that the 2 GPa sample, with the highest cubic-phase fraction, exhibits the strongest Eu3+ and Er3+ luminescence, with both emission and excitation intensities falling monotonically as pressure and the associated monoclinic-phase fraction increased. We attribute this decline to the increasing occupation of C2h-symmetry sites by Eu3+ ions, which impose parity-forbidden selection rules on the 5D07FJ transitions, compounded by an increased probability of nonradiative relaxation at pressure-induced structural defects. Overall, these results show that synthesis pressure is an effective and practically simple lever for tuning both the phase composition and the luminescent efficiency of multi-lanthanide HEO nanoceramics and that pressures near the lower end of the studied range (~2 GPa) are most favorable for optical applications that require high luminescence intensity from Eu3+ and Er3+ centers. Whether the luminescence can be improved further below 2 GPa remains an open question: extrapolation of the observed trend suggests that a lower synthesis pressure should additionally suppress the formation of the low-symmetry phases, but too low a pressure may not provide sufficient densification of the ceramic; dedicated experiments below 2 GPa are required to verify this prediction.

Supplementary Materials

The following supporting information can be downloaded at: https://www.mdpi.com/article/10.3390/ceramics9080078/s1. Figure S1: Rietveld refinement profile and refined structural parameters of the initial (Y0.2La0.2Gd0.2Eu0.2Er0.2)2O3 nanopowder; Figure S2: Rietveld refinement profile and refined structural parameters of the nanoceramic synthesized at 2 GPa; Figure S3: the same for the nanoceramic synthesized at 4 GPa; Figure S4: the same for the nanoceramic synthesized at 6 GPa; Figure S5: the same for the nanoceramic synthesized at 8 GPa.

Author Contributions

Conceptualization, A.N.K. and E.A.B.; methodology, A.N.K. and T.V.D.; validation, A.P.T., Y.A.K. and E.A.B.; formal analysis, A.P.T. and Y.A.K.; investigation, A.N.K., Y.A.K. and A.P.T.; resources, T.V.D.; data curation, A.P.T.; writing—original draft preparation, A.N.K.; writing—review and editing, E.A.B. and Y.A.K.; visualization, Y.A.K.; supervision, E.A.B.; project administration, T.V.D.; funding acquisition, T.V.D. All authors have read and agreed to the published version of the manuscript.

Funding

This research was funded by the Ministry of Science and Higher Education of the Russian Federation within the state assignment for the Institute of Solid State Chemistry of the Ural Branch of the Russian Academy of Sciences, grant number 124020600024-5.

Institutional Review Board Statement

Not applicable.

Informed Consent Statement

Not applicable.

Data Availability Statement

The raw data supporting the conclusions of this article will be made available by the authors on request.

Conflicts of Interest

The authors declare no conflict of interest.

References

  1. Otitoju, T.A.; Okoye, P.U.; Chen, G.; Li, Y.; Okoye, M.O.; Li, S. Advanced ceramic components: Materials, fabrication, and applications. J. Ind. Eng. Chem. 2020, 85, 34–65. [Google Scholar]
  2. Rost, C.M.; Sachet, E.; Borman, T.; Moballegh, A.; Dickey, E.C.; Hou, D.; Jones, J.L.; Curtarolo, S.; Maria, J.P. Entropy-stabilized oxides. Nat. Commun. 2015, 6, 8485. [Google Scholar] [CrossRef] [Scilit] [PubMed]
  3. Sarkar, A.; Wang, Q.; Schiele, A.; Chellali, M.R.; Bhattacharya, S.S.; Wang, D.; Brezesinski, T.; Hahn, H.; Velasco, L.; Breitung, B. High-entropy oxides: Fundamental aspects and electrochemical properties. Adv. Mater. 2019, 31, 1806236. [Google Scholar]
  4. Oses, C.; Toher, C.; Curtarolo, S. High-entropy ceramics. Nat. Rev. Mater. 2020, 5, 295–309. [Google Scholar]
  5. Kiryakov, A.N.; Kuznetsova, Y.A.; Dyachkova, T.V.; Tyutyunnik, A.P.; Buntov, E.A. High-entropy oxide optical nanoceramics prepared by thermobaric synthesis. J. Eur. Ceram. Soc. 2025, 45, 117268. [Google Scholar] [CrossRef] [Scilit]
  6. Blasse, G.; Grabmaier, B.C. Luminescent Materials; Springer: Berlin/Heidelberg, Germany, 1994. [Google Scholar]
  7. Eliseeva, S.V.; Bünzli, J.-C.G. Lanthanide luminescence for functional materials and bio-sciences. Chem. Soc. Rev. 2010, 39, 189–227. [Google Scholar] [CrossRef] [Scilit] [PubMed]
  8. Kumar, V.; Tiwari, S.P.; Ntwaeaborwa, O.M.; Swart, H.C. Luminescence properties of rare-earth doped oxide materials. In Spectroscopy of Lanthanide-Doped Oxide Materials; Dhoble, S.J., Pawade, V.B., Swart, H.C., Chopra, V., Eds.; Woodhead Publishing: Cambridge, UK, 2020; pp. 345–364. [Google Scholar]
  9. Brites, C.D.S.; Lima, P.P.; Silva, N.J.O.; Millán, A.; Amaral, V.S.; Palacio, F.; Carlos, L.D. Thermometry at the nanoscale. Nanoscale 2012, 4, 4799–4829. [Google Scholar] [CrossRef] [Scilit] [PubMed]
  10. Razavi-Khosroshahi, H.; Edalati, K.; Emadi, H.; Akiba, E.; Horita, Z.; Fuji, M. Optical properties of nanocrystalline monoclinic Y2O3 stabilized by grain size and plastic strain effects via high-pressure torsion. Inorg. Chem. 2017, 56, 2576–2580. [Google Scholar] [CrossRef] [Scilit] [PubMed]
  11. Krishna, R.H.; Nagabhushana, B.M.; Nagabhushana, H.; Murthy, N.S.; Chakradhar, R.P.S. Effect of calcination temperature on structural, photoluminescence, and thermoluminescence properties of Y2O3:Eu3+ nanophosphor. J. Phys. Chem. C 2013, 117, 1915–1924. [Google Scholar] [CrossRef] [Scilit]
  12. Kiryakov, A.; Dyachkova, T.; Tyutyunnik, A.; Baklanova, I.; Reznitskikh, O.; Enyashin, A. Functionalization of transparent MgAl2O4 nanoceramics with carbon quantum dots. J. Alloys Compd. 2025, 1038, 182576. [Google Scholar] [CrossRef] [Scilit]
  13. Bünzli, J.-C.G.; Eliseeva, S.V. Intriguing aspects of lanthanide luminescence. Chem. Sci. 2013, 4, 1939–1949. [Google Scholar] [CrossRef] [Scilit]
  14. Di Bartolo, B. Sharp spectral lines of luminescent centers in solids. In Disordered Solids; Di Bartolo, B., Özen, G., Collins, J.M., Eds.; Springer: Boston, MA, USA, 1989; Volume 46, pp. 73–92. [Google Scholar]
  15. Pązik, R.; Hreniak, D.; Stręk, W.; Speghini, A.; Bettinelli, M. Structural and luminescence properties of Eu3+ doped BaxSr1−xTiO3 (BST) nanocrystalline powders prepared by different methods. Opt. Mater. 2006, 28, 1284–1288. [Google Scholar] [CrossRef] [Scilit]
  16. Jiang, S.; Liu, J.; Li, X.D.; Li, Y.C.; He, S.M.; Zhang, J.C. High-pressure phase transitions of cubic Y2O3 under high pressures by in-situ synchrotron X-ray diffraction. Chin. Phys. Lett. 2019, 36, 046103. [Google Scholar] [CrossRef] [Scilit]
  17. Zhang, F.X.; Lang, M.; Wang, J.W.; Becker, U.; Ewing, R.C. Structural phase transitions of cubic Gd2O3 at high pressures. Phys. Rev. B 2008, 78, 064114. [Google Scholar] [CrossRef] [Scilit]
  18. Larson, A.C.; Von Dreele, R.B. General Structure Analysis System (GSAS); Report LAUR 86-748; Los Alamos National Laboratory: Los Alamos, NM, USA, 1994. [Google Scholar]
  19. Toby, B.H. EXPGUI, a graphical user interface for GSAS. J. Appl. Crystallogr. 2001, 34, 210–213. [Google Scholar] [CrossRef] [Scilit]
  20. Hubbert-Paletta, E.; Mueller-Buschbaum, H.K. Roentgenographische Untersuchung an Einkristallen von monoklinem Tb2O3. Z. Anorg. Allg. Chem. 1968, 363, 145–150. [Google Scholar] [CrossRef] [Scilit]
  21. Artini, C.; Costa, G.A.; Pani, M.; Lausi, A.; Plaisier, J. Structural characterization of the CeO2/Gd2O3 mixed system by synchrotron X-ray diffraction. J. Solid State Chem. 2012, 190, 24–28. [Google Scholar] [CrossRef] [Scilit]
  22. Blower, S.K.; Greaves, C. The structure of beta-Bi2O3 from powder neutron diffraction data. Acta Crystallogr. C 1988, 44, 587–589. [Google Scholar] [CrossRef] [Scilit]
  23. Chang, C.; Zhang, Q.; Mao, D. The hydrothermal preparation, crystal structure and photoluminescent properties of GdOOH nanorods. Nanotechnology 2006, 17, 1981–1985. [Google Scholar] [CrossRef] [Scilit]
  24. Olafsen, A.; Larsson, A.-K.; Fjellvåg, H.; Hauback, B.C. On the crystal structure of Ln2O2CO3 II (Ln = La and Nd). J. Solid State Chem. 2001, 158, 14–24. [Google Scholar] [CrossRef] [Scilit]
  25. Đorđević, V.; Antić, Ž.; Lojpur, V.; Dramićanin, M.D. Europium-doped nanocrystalline Y2O3–La2O3 solid solutions with bixbyite structure. J. Phys. Chem. Solids 2014, 75, 1152–1159. [Google Scholar] [CrossRef] [Scilit]
  26. Pavunny, S.P.; Kumar, A.; Misra, P.; Scott, J.F.; Katiyar, R.S. Properties of the new electronic device material LaGdO3. Phys. Status Solidi B 2014, 251, 131–139. [Google Scholar] [CrossRef] [Scilit]
  27. Zou, Y.; He, D.; Wei, X.; Yu, R.; Lu, T.; Chang, X.; Wang, S.; Lei, L. Nanosintering mechanism of MgAl2O4 transparent ceramics under high pressure. Mater. Chem. Phys. 2010, 123, 529–533. [Google Scholar] [CrossRef] [Scilit]
  28. Seo, H.J. Line broadening and crystallographic sites for Eu3+ in disordered double borate Ca3Gd2(BO3)4. J. Alloys Compd. 2014, 604, 100–105. [Google Scholar] [CrossRef] [Scilit]
  29. Tanner, P.A. Some misconceptions concerning the electronic spectra of tri-positive europium and cerium. Chem. Soc. Rev. 2013, 42, 5090–5101. [Google Scholar] [CrossRef] [Scilit] [PubMed]
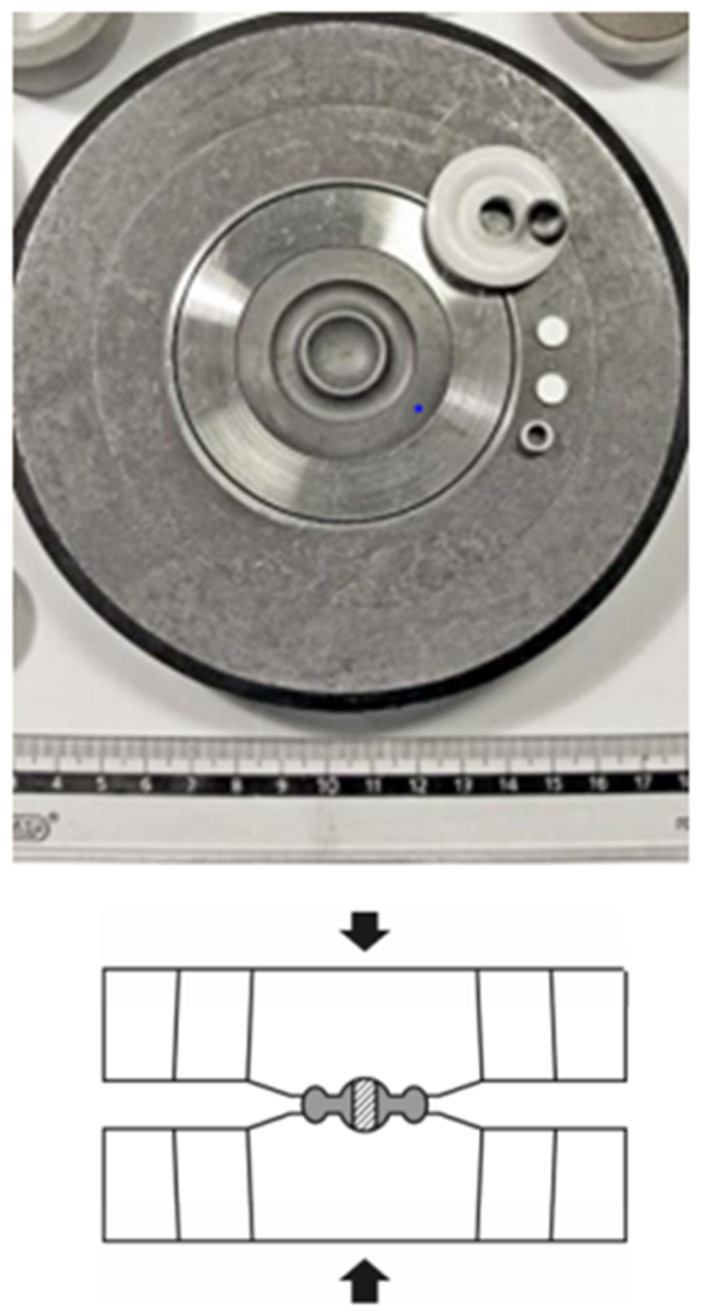
Figure 1. Photograph of the toroidal chamber (top) and schematic cross-sectional view of the assembly (bottom). The arrows indicate the direction of applied pressure.
Ceramics 09 00078 g001
Figure 2. Experimental powder XRD results for the initial nanopowder (black) and for the ceramics synthesized at pressures of 2–8 GPa (blue, red, brown, and pink, respectively). Markers indicate the reflections corresponding to a specific phase modification. More detailed information is provided in Supplementary Materials S1–S5.
Ceramics 09 00078 g002
Figure 3. HRTEM image of the sample synthesized at 4 GPa. Dashed lines indicate grain boundaries of the nanocrystallites. The SAED pattern is shown in the lower-right inset.
Ceramics 09 00078 g003
Figure 4. Raman spectra of the synthesized nanoceramics.
Ceramics 09 00078 g004
Figure 5. Photoluminescence spectra recorded at λexc = 466 nm for nanoceramics synthesized at different pressures.
Ceramics 09 00078 g005
Figure 6. Photoluminescence excitation spectra recorded at λem = 612 nm for nanoceramics synthesized at different pressures.
Ceramics 09 00078 g006
Table 1. Phase and crystallographic parameters of the initial nanopowder and the synthesized nanoceramics after Rietveld refinement.
SamplePhase, %Space GroupLattice Constants, ÅCSR, nm/Strain
Initial powder100% (Y0.2La0.2Gd0.2Eu0.2Er0.2)2O3I 21/a-3a = 10.8494(5); b = A; c = A22.27/0.0008
2 GPa31.3 m.% RE2O3 №1
36.0 m.% RE2O3 №2
20.4 m.% REO(OH) [23]
12.3 m.% RE2O2(CO3) [24]
I 21/a-3;
I 21/a-3;
P 1 21/m 1;
A m a 2.
a = 10.7406(8); b = A; c = A;
a = 10.8213(9); b = A; c = A;
a = 6.1087(14); b = 3.7476(8); c = 4.3406(9);
a = 31.878(11); b = 11.980(5); c = 6.7271(30).
33.4/0.0008;
21.2/0.0013;
24.7/0.0011;
21.2/0.0014.
4 GPa46.8 m.% RE2O3 [25];
53.2 m.% RE2O3 [26].
I 21/a-3;
C 1 2/m 1.
a = 10.840(4); b = A; c = A;
a = 13.880(15); b = 3.6643(18); c = 8.796(10).
11.4/0.0014;
10.1/0.0011.
6 GPa42.9 m.% RE2O3 №1 [21];
35.1 m.% RE2O3 (monoclinic, C12/m1) [20];
22.0 m.% RE2O3 [22].
I 21/a-3;
C 1 2/m 1;
C c c 2.
a = 10.8422(24) b = A c = A;
a = 14.006(6) b = 3.5034(14) c = 8.6816(32);
a = 11.157(5) b = 11.209(5) c = 5.6661(21).
13.4/0.0007;
9.4/0.0021;
20.5/0.0005.
8 GPa31.1 m.% RE2O3 [25];
68.9 m.% RE2O3 [26];
I 21/a-3;
C 1 2/m 1
a = 10.833(9) b = A c = A;
a = 14.083(17) b = 3.649(4) c = 8.807(10)
10.3/0.0011;
7.2/0.0003.
Table 2. Comparison of the interplanar spacings (d) of the HEO obtained from XRD and HRTEM.
XRD Peaks, 2Θ, Degreehkld, from XRD, Åd, HR TEM, Å
28.492223.132.19
33.014002.711.97
39.393322.301.50
42.264312.141.32
47.384401.921.13
56.26221.640.80
Table 3. Parameters of the Lorentzian decomposition of the Raman spectral region of the nanoceramic synthesized at 2 GPa.
Peak Position, cm−1FWHM, cm−1R2
364.6 ± 0.1516.7 ± 0.50.997
353.6 ± 1.515.7 ± 2
Disclaimer/Publisher’s Note: The statements, opinions and data contained in all publications are solely those of the individual author(s) and contributor(s) and not of MDPI and/or the editor(s). MDPI and/or the editor(s) disclaim responsibility for any injury to people or property resulting from any ideas, methods, instructions or products referred to in the content.