1. Introduction
Low-Temperature Cofired Ceramics (LTCC) is a well-known family of materials used in microelectronic devices across various domains, including telecommunications, space technology, healthcare, microwave technology, radar systems, sensors, and microfluidic systems.
LTCC tapes are created by a process called tape casting, where a slurry is created by mixing ceramic powder with solvents, dispersants, binders and plasticizers. In order to maintain a high quality and high volume production, the solvents are most of the time fast-evaporating, such as methyl-ethyl-ketone, xylenes, toluene or acetone, and the binders are vinyl-based, acrylics or other products issued from the petrochemical industry [
1]. Environmental and health concerns have raised an interest in aqueous tape casting as proposed in several scientific publications such as [
2] treating Al
2O
3-BBSZ materials, [
3] where BaTiO
3 films are cast for multilayered capacitors, and in [
4] where Borosilicate glass combined with Al
2O
3 is proposed for LTCC. The solvent used in aqueous tape casting is, as the name suggests, water which is non-hazardous to health and environment. As such, a change from solvent-based to aqueous tape casting would contribute to goal 12: responsible consumption and production, which is one of the 17 sustainable development goals adopted by all United Nations member states in 2015.
In 2023, Zhou et al. presented work on environmentally friendly LTCC [
5]. This work discusses the production of a powder made from recycled soda-lime glass combined with naturally abundant volcanic ash. The soda-lime glass reduces the sintering temperature, and the volcanic ash doped with 2.5 wt% of Ba
2+ enables a material with a low dielectric constant of 4.86 at 1 MHz, a loss tangent of 6.32 × 10
−3, a TCE of 8.72 ppm/°C, and a thermal conductivity of 1.04 W/(m·K). In this study, cylindrical pellets were created by uniaxial lamination and no tape casting was performed. The material composition of waste glass and volcanic ashes is given in their publication; see
Table 1.
Soda-lime glass can also be produced from other waste products, such as foundry sands and oyster shells as proposed by [
6]. In [
6], the characteristics of these two materials collected from a metal casting foundry and from oyster production (pearls and food) were analyzed. Two main compounds needed to produce soda-lime glass were found: silicium and calcium.
One well-known commercially available LTCC tape is the A6M-E from Vibrantz Technologies, Houston, TX, USA [
7]. This material has a relative permittivity of approximately 5.7 ± 0.15 and a loss tangent inferior of 0.0015 at 10 GHz [
8]. An analysis of the main constituents of an earlier version of this material called A-6, (Ferro Corp, Cleveland, Ohio) can be found in [
9], where they are given to be calcium oxide (CaO), silicone dioxide (SiO
2) and boron trioxide (B
2O
3). From [
10] A6, DuPont 951, DuPont 943 Heraeus CT800, Heraeus CT700 and Motorola T2000 (commercially known as Heraeus CT2000) after-firing atomic%-composition from Energy-Dispersive X-ray spectroscopy (EDX) analysis is presented. These data are given in
Table 2.
This information gives us the starting point for our creation of bio-sourced ceramic powder to be used with aqueous tape casting. Hence, the main constituents in commercially available LTCC materials are SiO2 and Al2O3 or CaO (or Ca2O3).
2. Materials and Methods
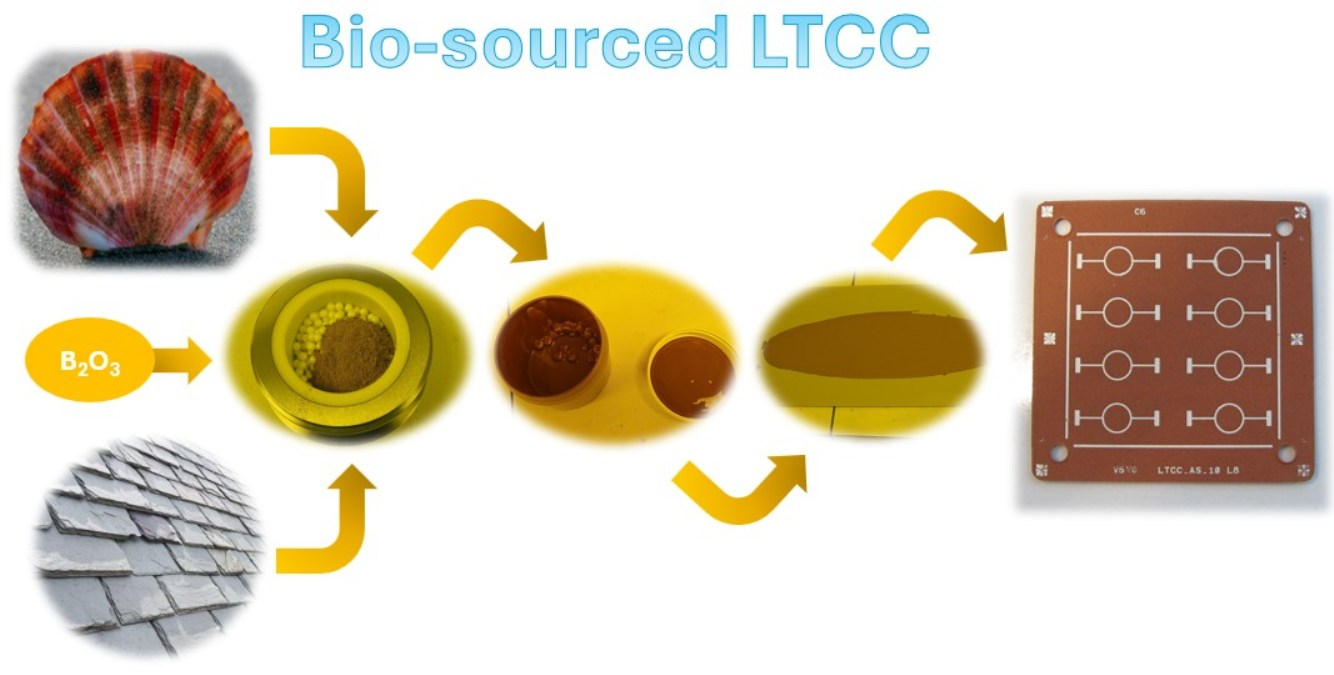
Inspired by the information in [
5,
6] and by the composition presented for the LTCC tape in [
9,
10], we aim at creating our own LTCC material based on bio-sourced materials available locally. As well as oyster shells, other seashells are known to be similar in composition, containing mainly calcium oxide (CaO) and calcium carbonate (CaCO
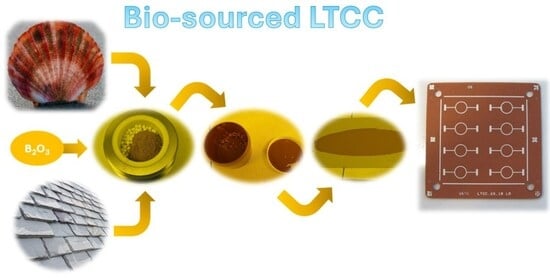
3). This led us to analyze Saint Jacques shells that are abundantly available at the French Brittany coast. Samples from the external shell as well as the internal mother-of-pearl were tested (
Figure 1). The samples were prepared by removing all organic materials, washing and air drying them.
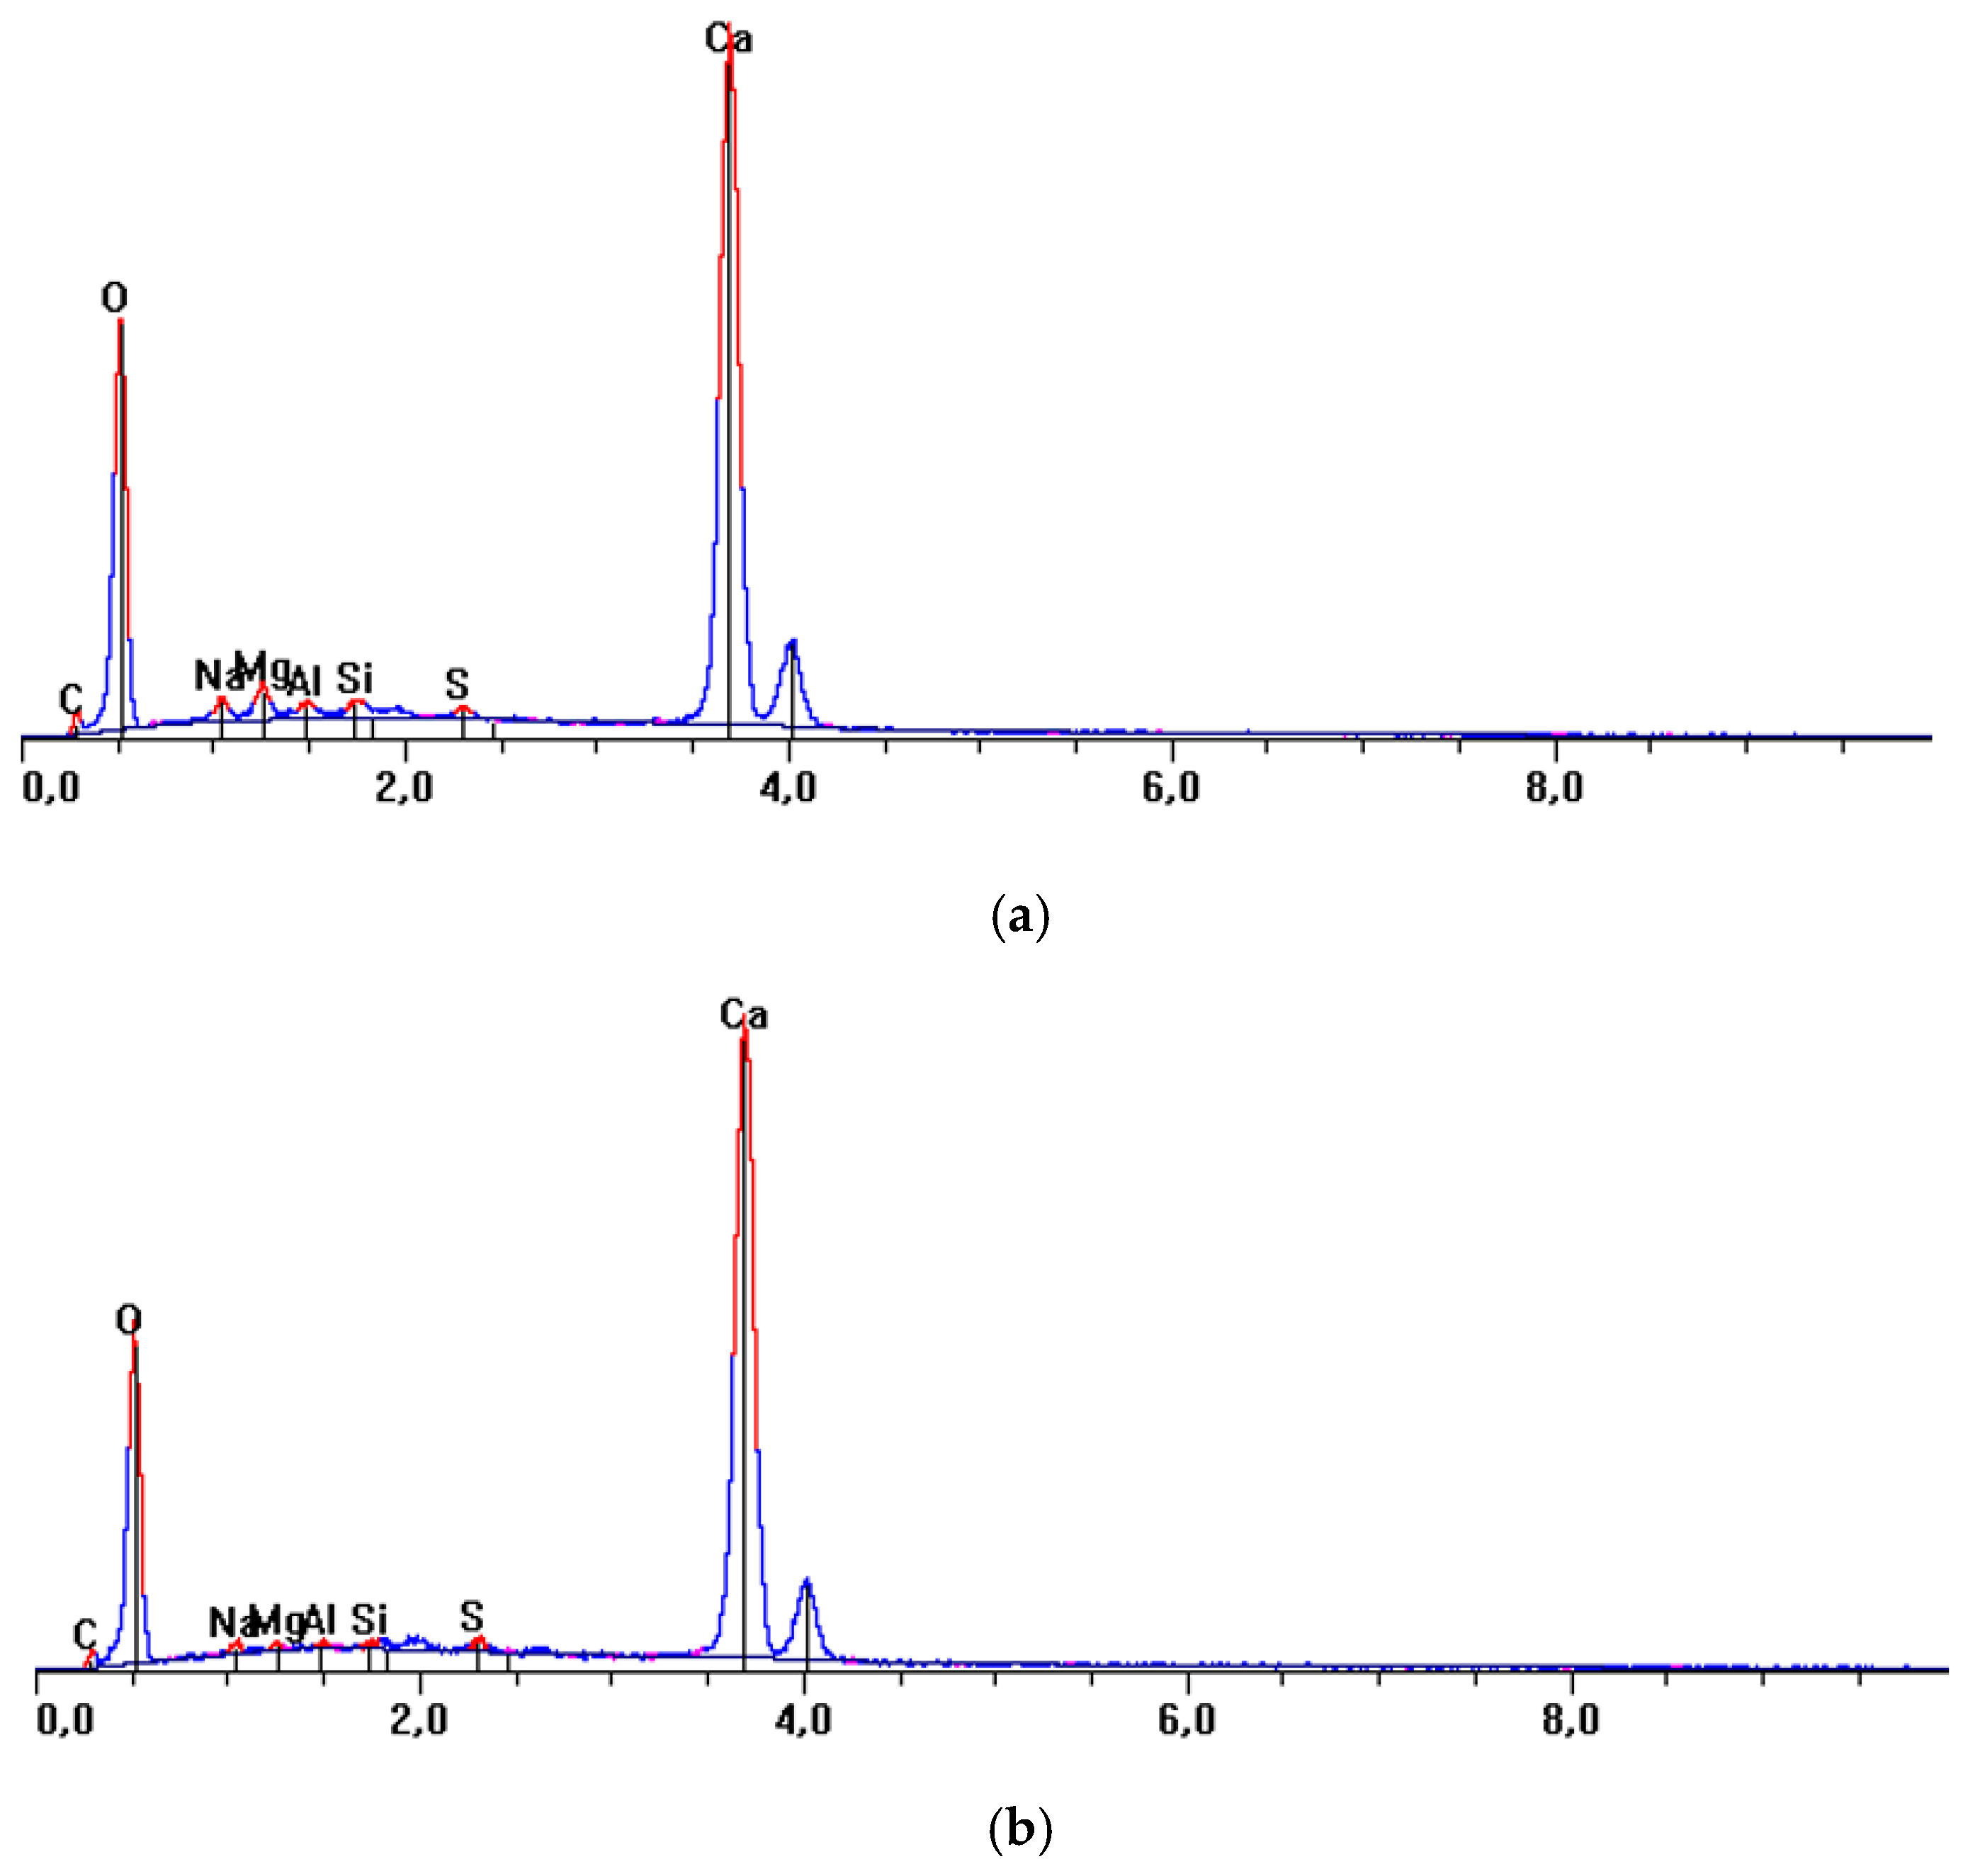
The elemental analysis, (SEM-EDX from Princeton Gamma-Tech Inc., Rocky Hill, NJ, USA) confirms the expected composition of the material. The two samples of the Saint Jacques shell contain the same chemical components (
Table 3) even though there is some variation in weight percentage. While both samples have a high content of calcium oxide (CaO) and calcium carbonate (CaCO
3), the outer part of the shell contains higher amounts of sodium oxide (Na
2O), magnesium oxide (MgO) and aluminum oxide (Al
2O
3) than the inner mother-of-pearl sample, which has a higher content of carbon dioxide (CO
2). Upon comparison with the constituents of
Table 1, it is evident that the Saint Jacques shell can serve as a bio-source to provide some of the materials needed, particularly calcium oxide (CaO) and calcium carbonate (CaCO
3). From [
5], we know that introducing small amounts (2.5 wt%) of Mg, Ca, Ba or B
2O
3 into the material lowers the dielectric constant and the dielectric losses, which is why the presence of MgO and CaCO
3 in the Saint Jacques shells is advantageous.
To advance further, following [
9,
10], silicone dioxide (SiO
2) is also required. It is a well-known material used in glass and in ceramic materials, where it forms the vitreous phase. Although the Saint Jacques shell contains some SiO
2, the quantity is insufficient for the creation of our LTCC material.
However, SiO
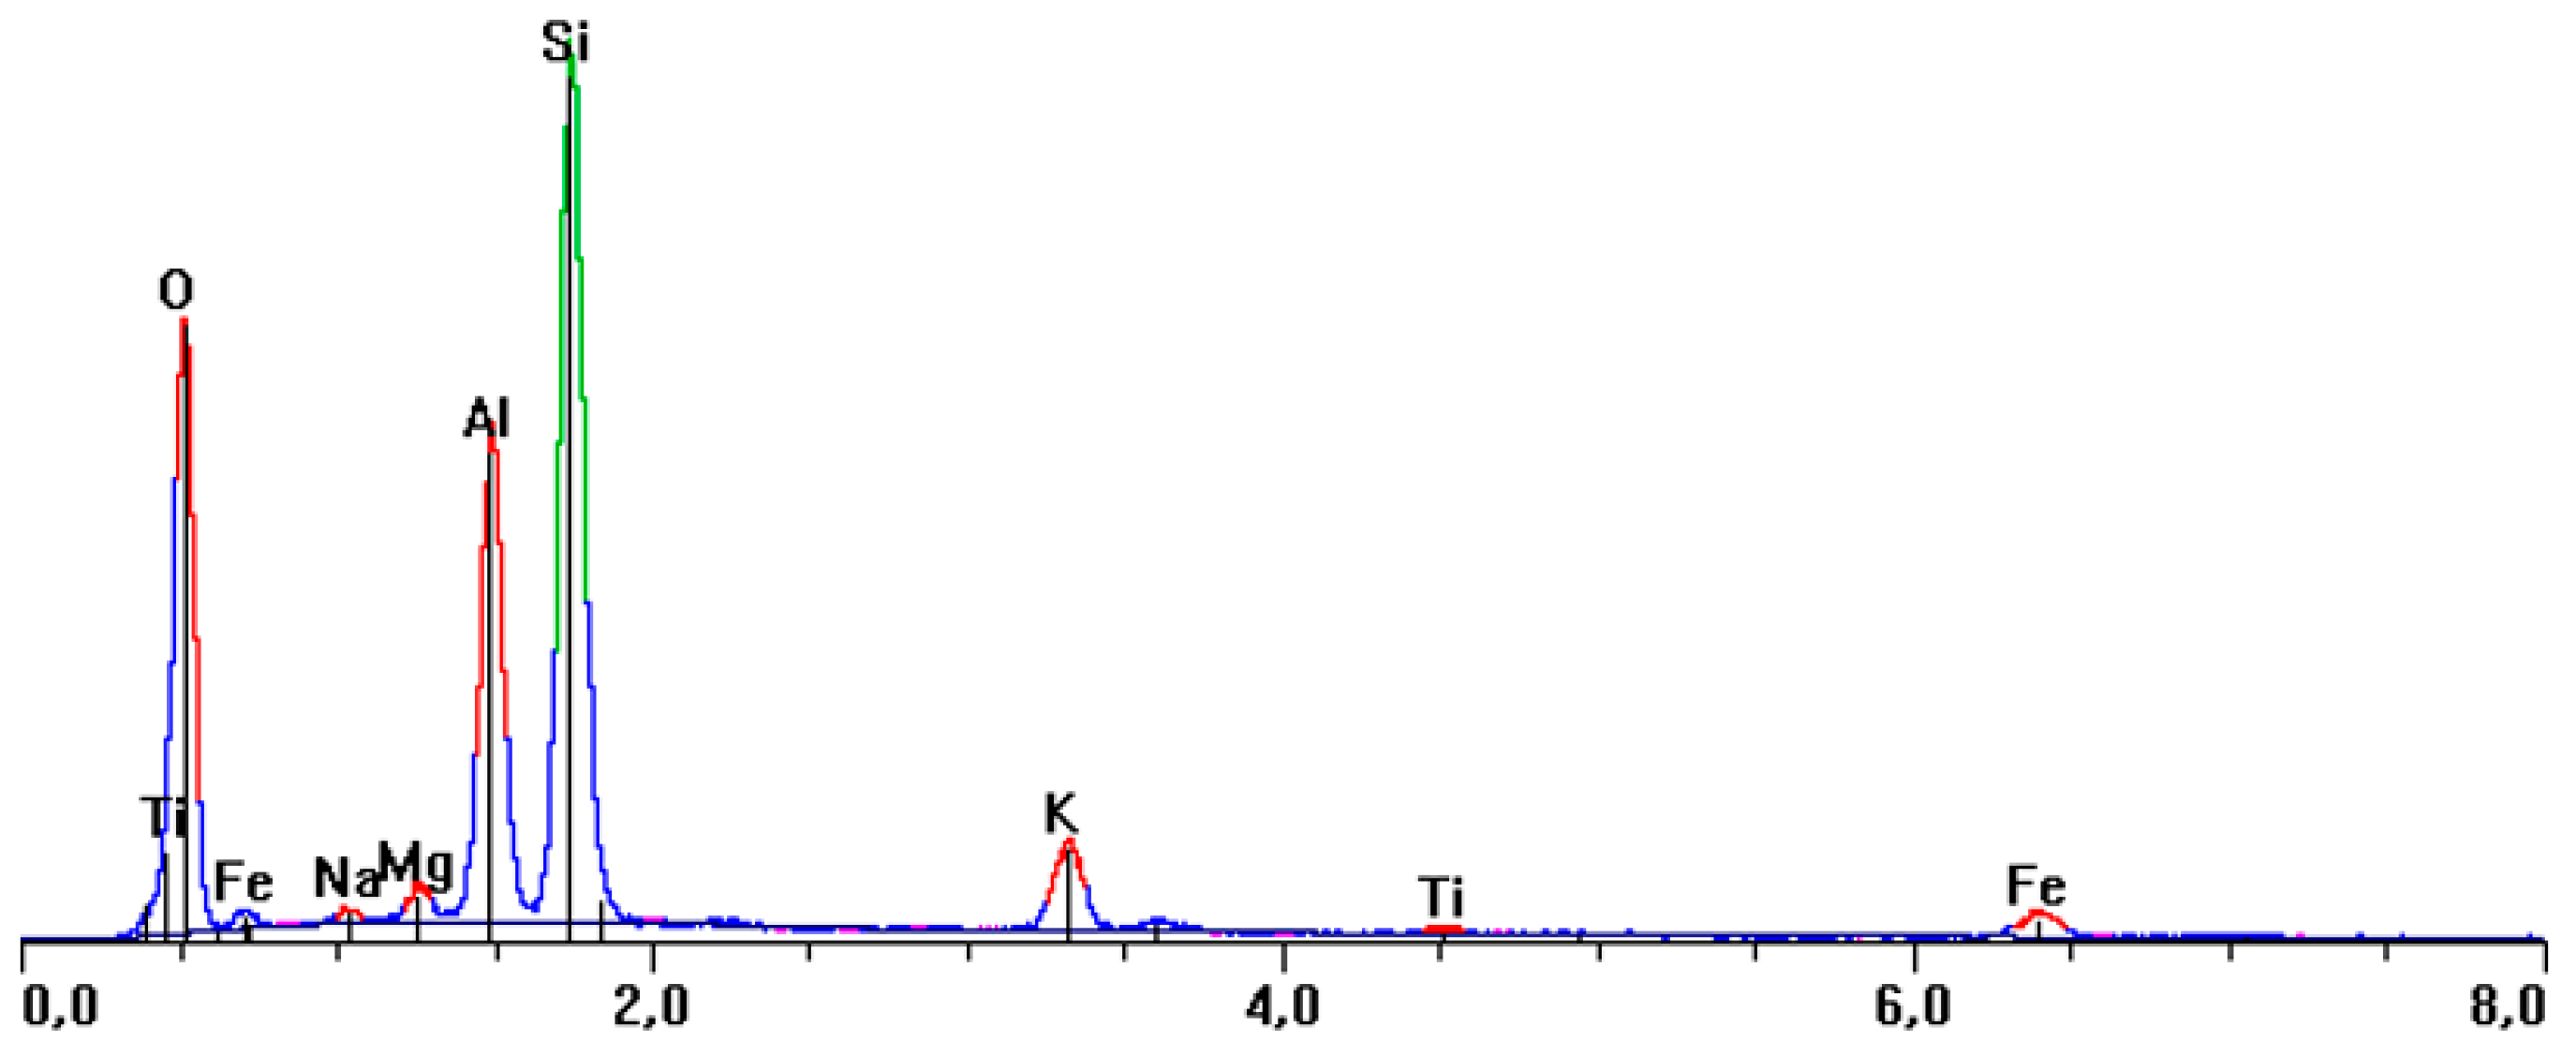
2 is abundant in quartz, sand and agate. Our second bio-sourced candidate, slate, is made up of quartz, mica and feldspathoid. This material is used for roof tiles throughout the French Brittany region. The local quarries have been closed for some years, so slate tiles are now imported, mainly from Spain and Portugal. Nevertheless, slate tiles need to be replaced every 50–80 years, so there is an abundant supply of waste slate due to the renovation and isolation of buildings. The elemental composition of slate has been obtained from EDX analysis (
Figure 2 and
Table 4).
Clearly, the slate mainly contains silicon dioxide (SiO2) and aluminum oxide (Al2O3), as well as smaller amounts of potassium oxide (K2O), iron oxide (Fe2O3 or FeO), magnesium oxide (MgO), sodium oxide (Na2O) and titanium oxide (TiO2). It is the main constituent, SiO2, that we need to form the ceramic material. The relatively high presence of Al2O3 is also positive. The same goes for titanium oxide and the presence of magnesium should also be beneficial (as it lowers the dielectric constant and losses).
The third main constituent from [
9] is the boron trioxide (B
2O
3). This element was not detected in [
10]. Nevertheless, this compound can be useful for LTCC compositions as it lowers the sintering temperature. This same effect is achieved by calcium trioxide when it releases carbon dioxide (CO
2) and transforms into calcium oxide (CaO) during firing. Boron trioxide occurs naturally in the form of borax, colemanite and ulexite. As it is not a material that can easily be found in bio-sourced or waste materials, we decided to buy this compound (di-Bore trioxide ≥ 97.5%, Thermo Fisher Scientific, Waltham, MA, USA).
From [
10], a typical LTCC powder contains silica (SiO
2), alumina (Al
2O
3), calcium carbonate (CaCO
3), and calcium oxide (CaO), as well as additives. Each component plays a specific role in the formulation: SiO
2 allows the formation of the necessary glass phase for LTCC while at the same time fragilizing the material’s mechanical characteristics. Al
2O
3 is a good electrical insulator that increases mechanical strength and improves thermal stability, CaCO
3 acts as a fluxing agent that lowers the sintering temperature as it decomposes into CaO, which also promotes densification and improves mechanical strength. Additives, such as B
2O
3, lower the sintering temperature and relative permittivity while improving mechanical resistance. These oxides have different relative permittivities (ε
r), as presented in
Table 5.
Currently, we are not targeting a specific value for the relative permittivity. The purpose of this first experiment is to prove that the slate and Saint Jacques shells can be used to create an LTCC material. Based on previous information, our goal is to create a material with the following composition: 60 wt% SiO
2, 10 wt% Al
2O
3, 20 wt% CaO, and 10 wt% B
2O
3. This should be possible by using a mixture of 70 wt% slate, 20 wt% Saint Jacques shell fragments, and 10 wt% B
2O
3 powder. Using the percentages with the dielectric constants in
Table 1, we arrive at an estimated low frequency relative permittivity of 3.63.
2.1. Powder Preparation
Fragments prepared by manual breaking of the slate and Saint Jacques shell were first dry-milled separately in a planetary ball mill (Retsch PM100, Retsch GmbH, Haan, Germany) for ten minutes at 400 rpm using ten 15 mm zirconia balls in an 80 mL zirconia bowl. The powders obtained were mixed together with the boron oxide at the intended wt% to form 9 g of powder. The powder was then calcinated at 700 °C for two hours to remove any organic residues from the bio-sourced ingredients. The mixed powder was dry-milled once more in the planetary ball mill with 250 pieces of 5-mm zirconia balls for three minutes at 300 rpm.
2.2. Slurry Preparation and Tape Casting
The slurry was prepared according to the following procedure: First, 9.0 g of powder is placed in a pot. Then, 4.5 g of deionized water, 4.4 g of dispersant 2% (wt), 8.0 g of binder solution 30% (wt), and 0.5 g of foam master are added. The last three products are from Fiaxell SOFC Technologies in Lausanne, Switzerland. Twenty-five zirconia balls were added, and the pot was sealed and rolled at 80 rpm on a Fisherbrand roller bench (from Fisher Scientific) for 24 h. After rolling, the zirconia balls were removed, the pot was resealed, and the slurry was kept at 5 rpm for another two hours to remove any bubbles. Then, the slurry was passed through a nylon cloth (150 µm mesh) to filter out agglomerates and any remaining bubbles. Once filtered, the slurry was cast onto a polypropylene (PP) sheet placed on a tape caster bench glass surface. To improve tape release, the PP sheet’s surface was treated in advance with a 50:50 wt% rapeseed oil–isopropanol mixture. The slurry viscosity was 2.9 Pa.s. The tape casting was done manually with a doctor blade set to a height of 0.7 mm and a speed of approximately 150 mm/s. Drying took place during 24 h at room temperature without any additional heating.
3. Results
Several analyses were performed to judge the material’s performance in the context of a standard LTCC manufacturing process. Layer thickness, dried density, elongation and tensile break force (TA1, Lloyd Material tester from Amtek, Largo, FL, USA), visual inspection (50X Moticam optical microscope from Motic, Universal City, TX, USA) and surface profiling (White light optical profilometer) were completed as initial tests followed by a complete LTCC prototype production covering laser cutting, screen printing, uniaxial lamination, isostatic lamination and sintering.
3.1. Initial Tests
The layer thickness was measured with a regular micrometer to be 180 ± 20 µm. The dried density was found to be 1442 kg/m3. Elongation measured at 72 h, 144 h and 268 h were 6.5%, 7.8% and to 7.55%, respectively, while tensile break force, tested at the same occasions, were found to be 0.87 N, 0.51 N and 0.98 N. The elongation values are quite acceptable when compared to commercially available tapes as we have found that the A6M-E elongates to 5%. However, the tensile break force for the A6M-E material is found to be 2.32 N, which is more than double our values.
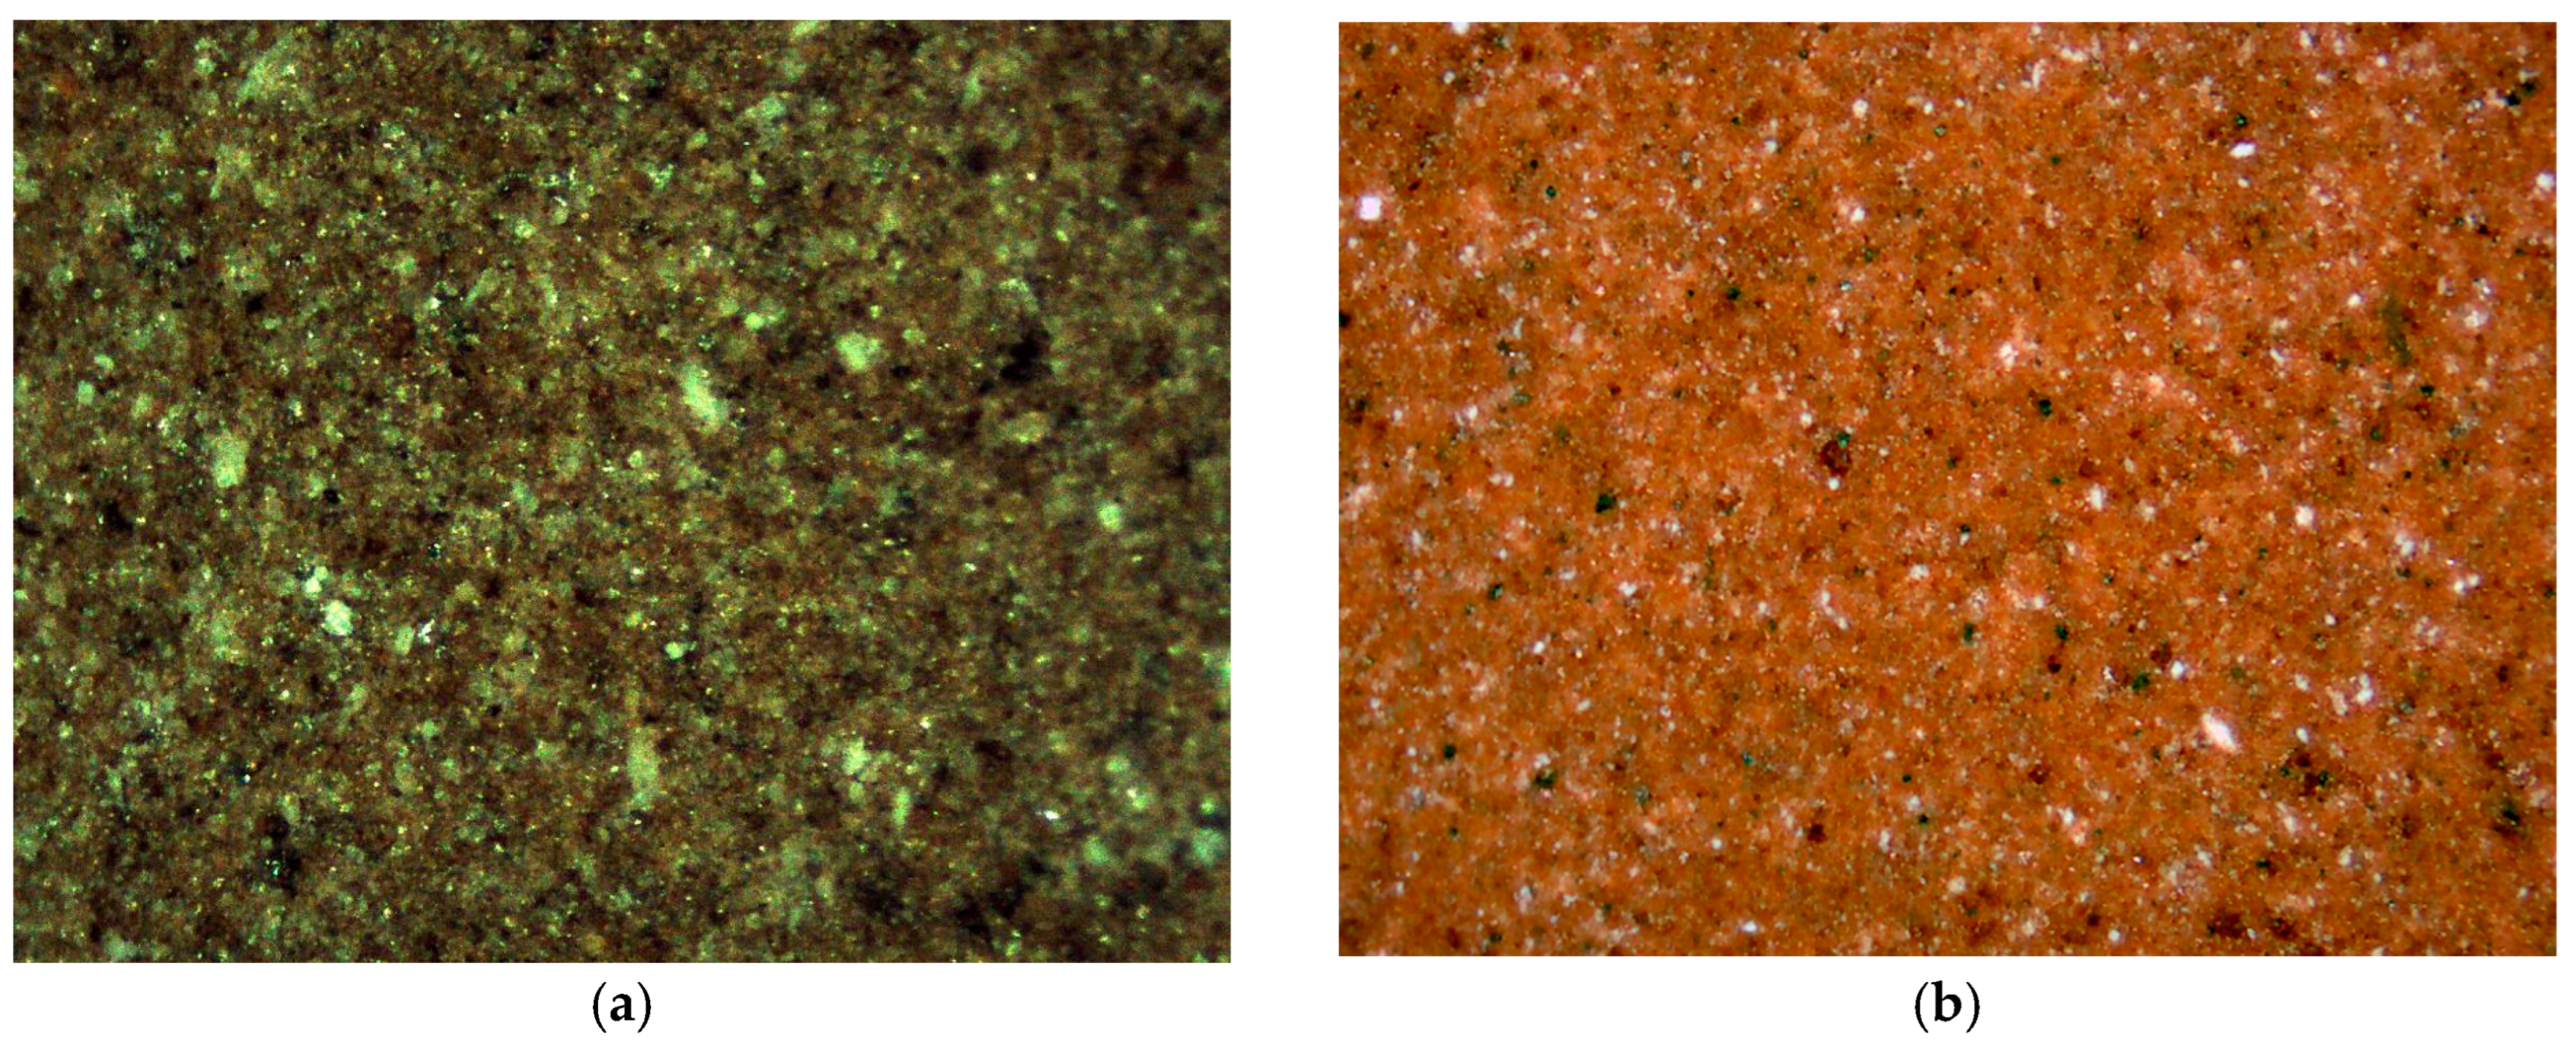
The visual inspection using a 50X microscope shows that the tape is not homogenous (
Figure 3). Evidently the ball milling procedure needs to be improved to make the particles smaller and allow for a homogenous tape and ceramic material.
The red/brown color is not usually what you expect for a ceramic material based on SiO
2, Al
2O
3 and CaO. Most likely the iron oxide contained in the slate generates this color. This agrees with [
5], where the volcanic ash contained Fe
2O
3 and all the presented samples have a brown color.
3.2. LTCC Prototyping
LTCC fabrication is usually made by slitting and blanking, via and cavity creation, via filling, layer screen printing, stacking, lamination and cofiring. To analyze our material, we have followed the same procedure, first by making an empty device (no via holes or cavities, no printing) and then by preparing a real functional device.
3.2.1. Ceramic-Only Prototype
The first device was prepared by cutting layers of the tape into 50.8 mm × 50.8 mm squares with alignment holes present in the corners for stacking. The micromachine equipment is a fibered laser with a 1064 nm wavelength (LEM2 from Laser Cheval, Marnay, France). The successful parameters were pulse duration 20 ns, power 60%, galvanometric speed 100 mm/s and frequency 20 kHz repeating 12 times to cut through the 180 µm thick tape.
A stack with eleven layers was prepared for isostatic lamination in the PTC LT04001 (Pacific Trinetics Corporation, San Jose, CA, USA). This sample underwent a lamination at 70 °C, 21 MPa with a 5 min soak time followed by 5 min of lamination. As can be seen in
Figure 4, the result is positive as the individual layers cannot be perceived.
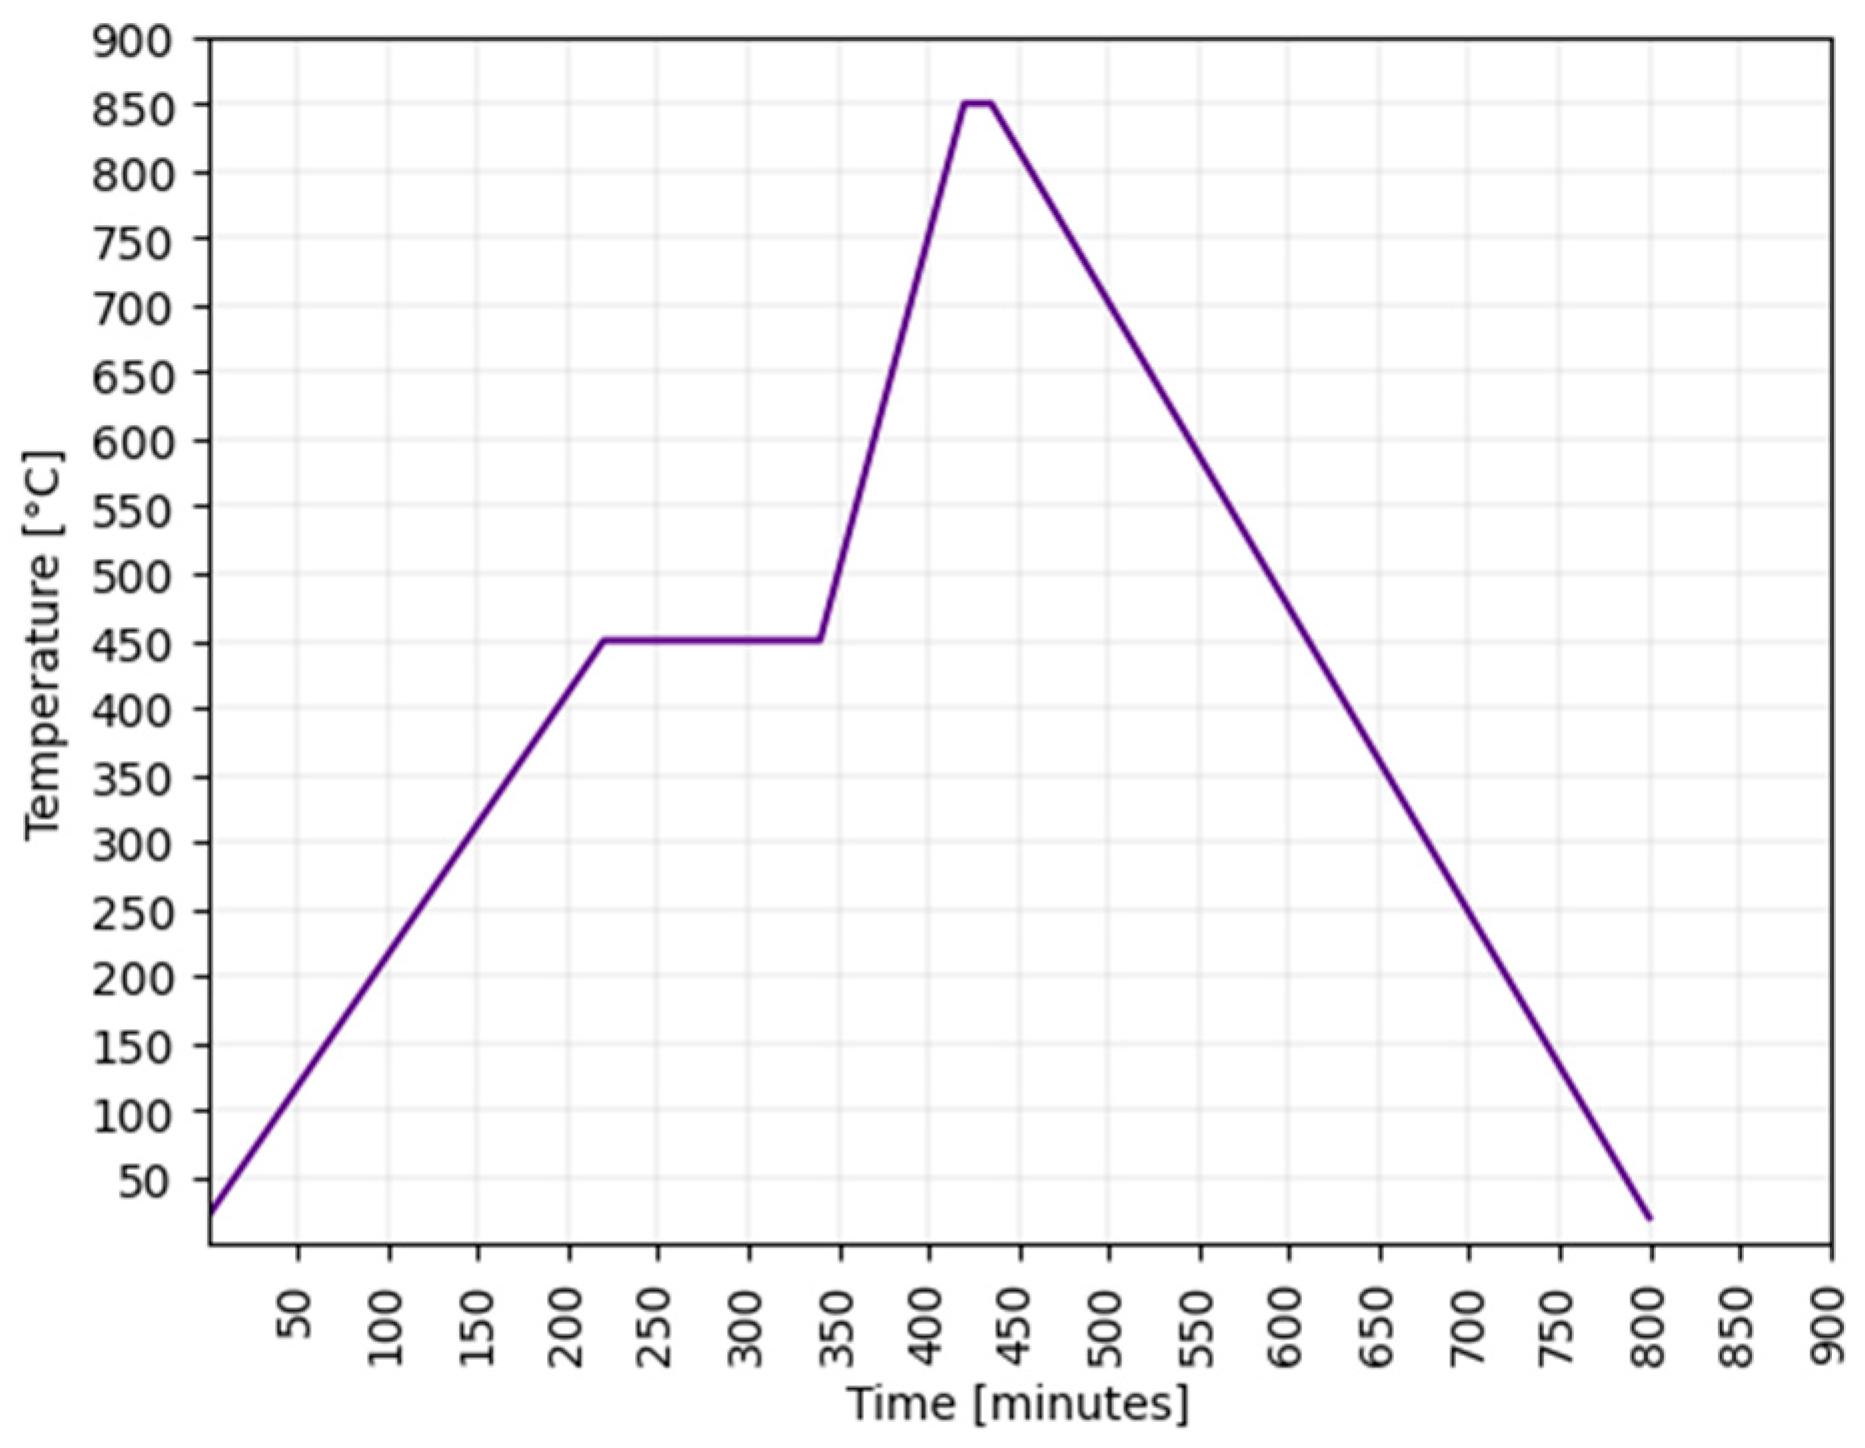
Finally, the sample was fired using the same profile as is proposed for the A6M-E material with a sintering peak at 850 °C for 15 min, see
Figure 5. The shrinkage was 6% in the X- and Y-direction and 27% in the Z-direction.
The surface profiling, performed using an in-house built white light optical profilometer, indicates that the surface is not smooth as a height variation of 40.7 to 70.1 µm is found (
Figure 6).
3.2.2. Relative Permittivity Analysis
As discussed before, the relative permittivity is an important characteristic for materials intended for microwave devices. Given our available fabrication and measurement equipment, we have chosen to use the “two microstrip line method” as proposed by [
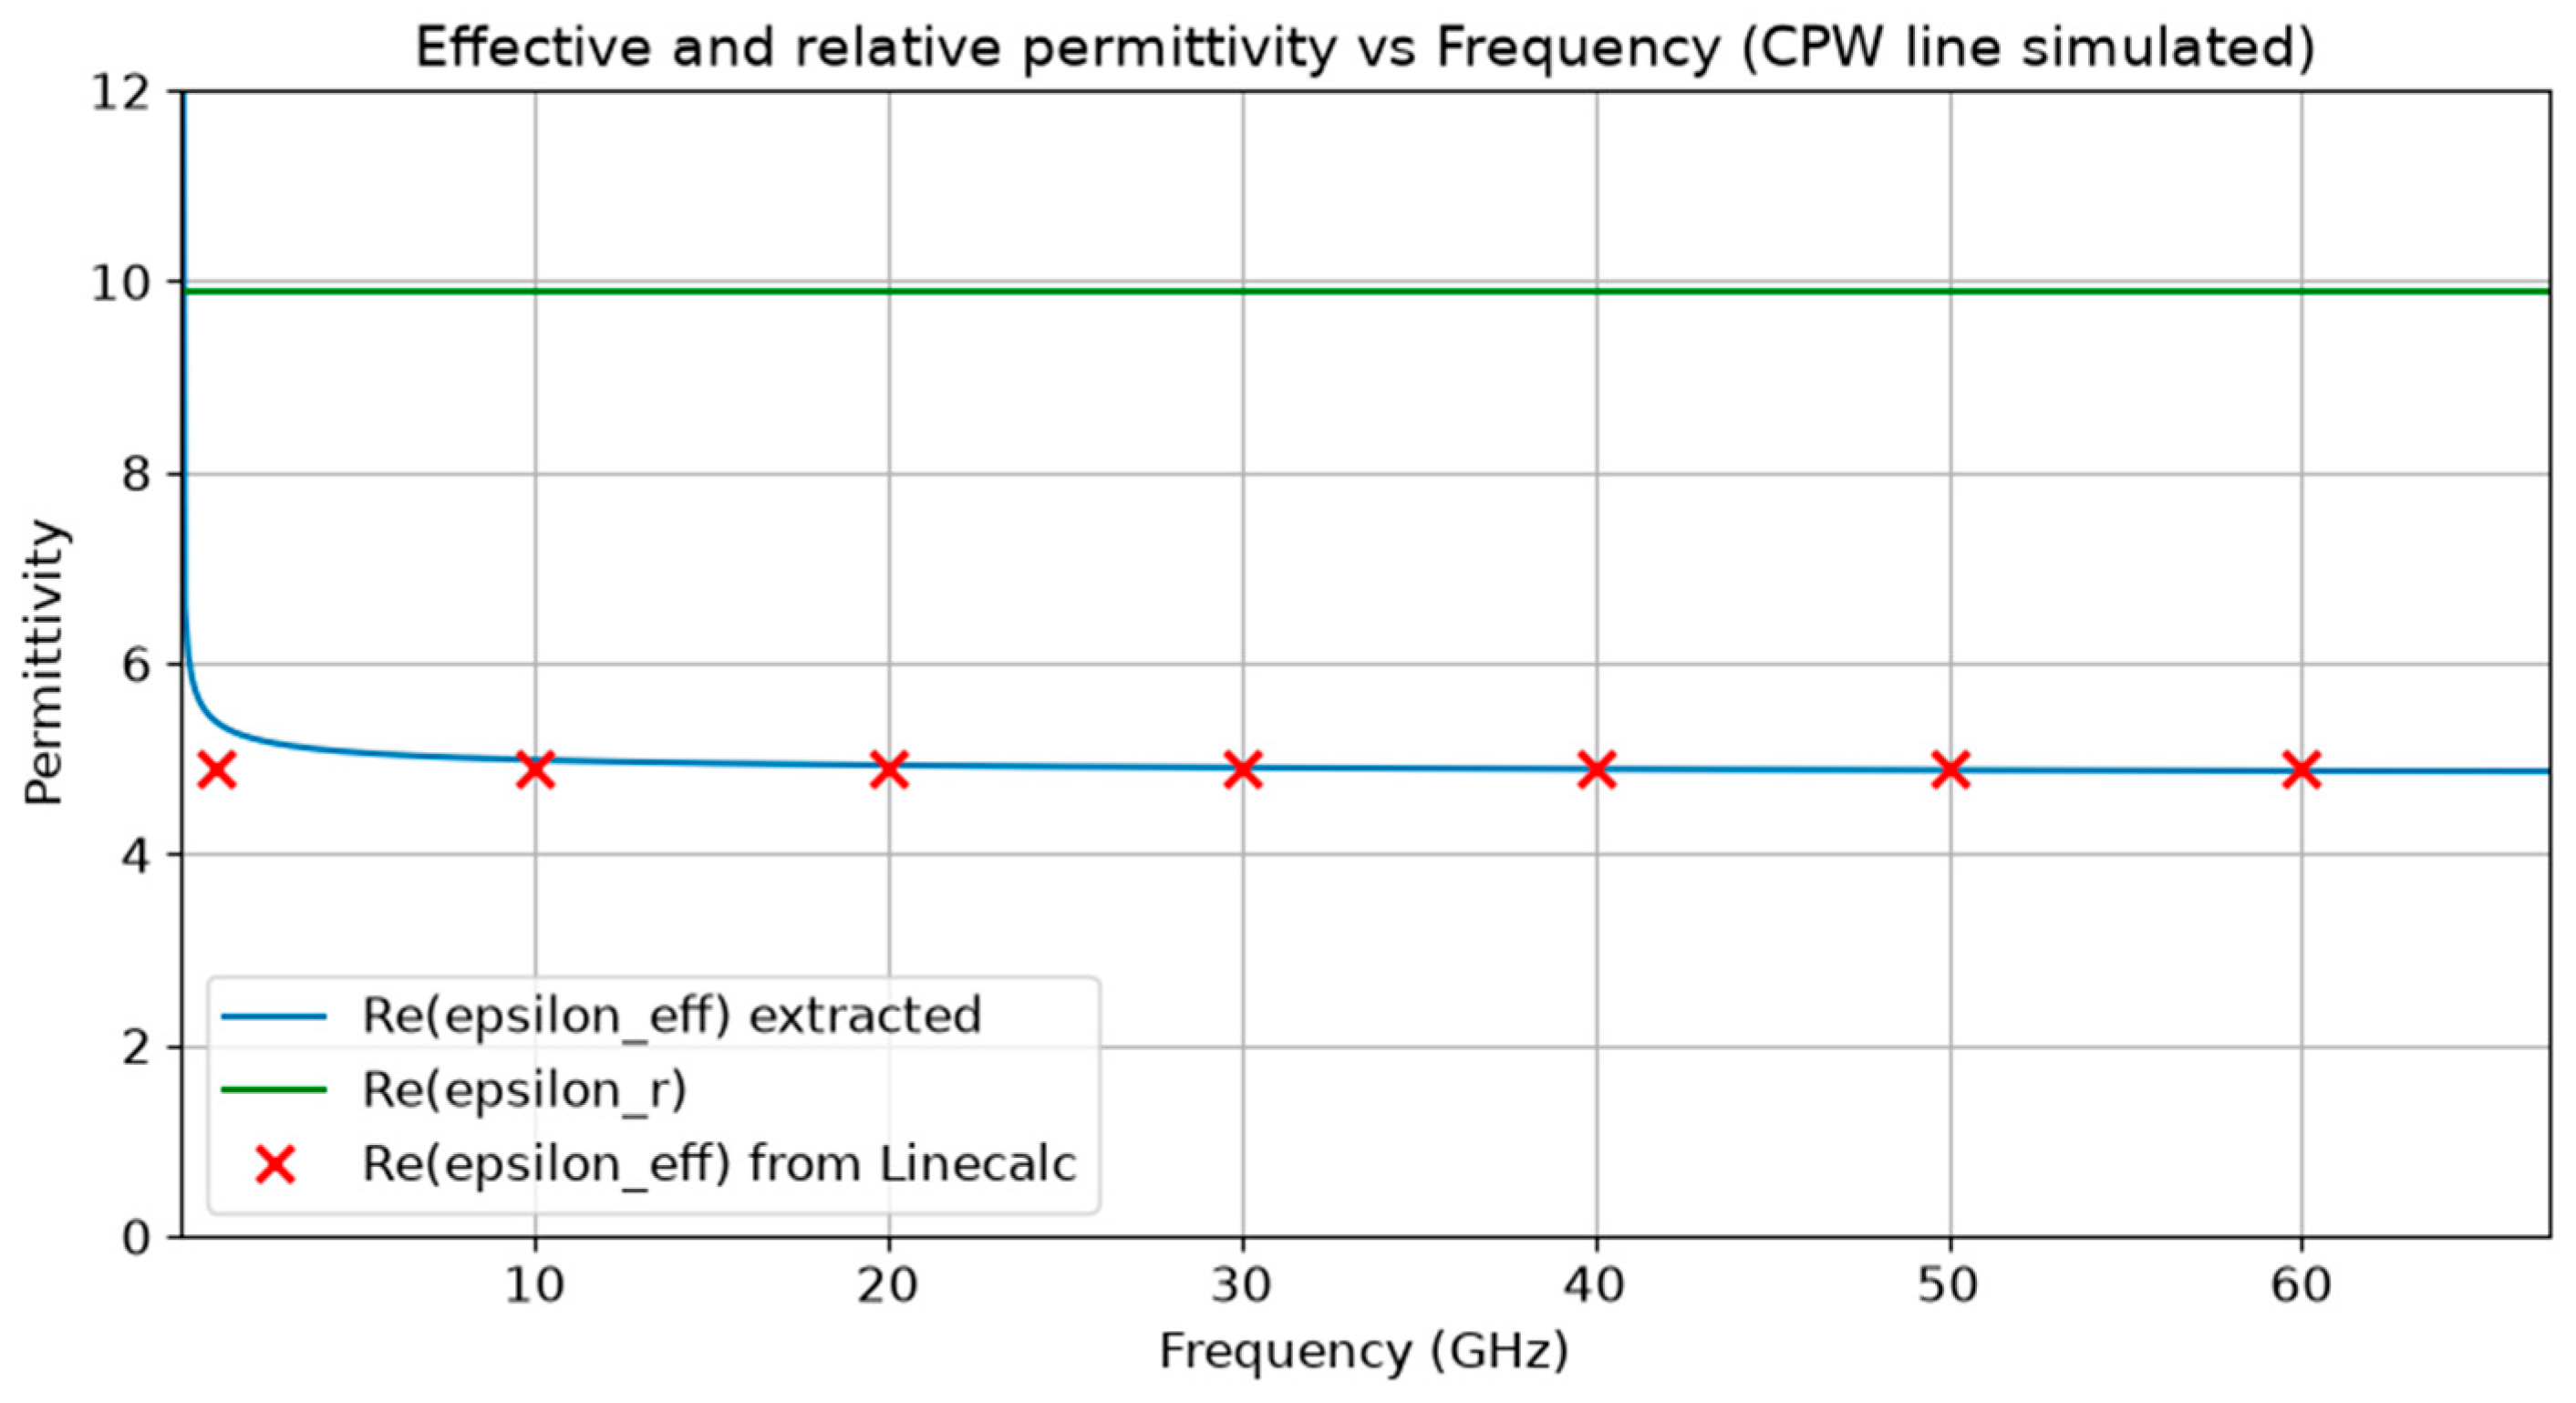
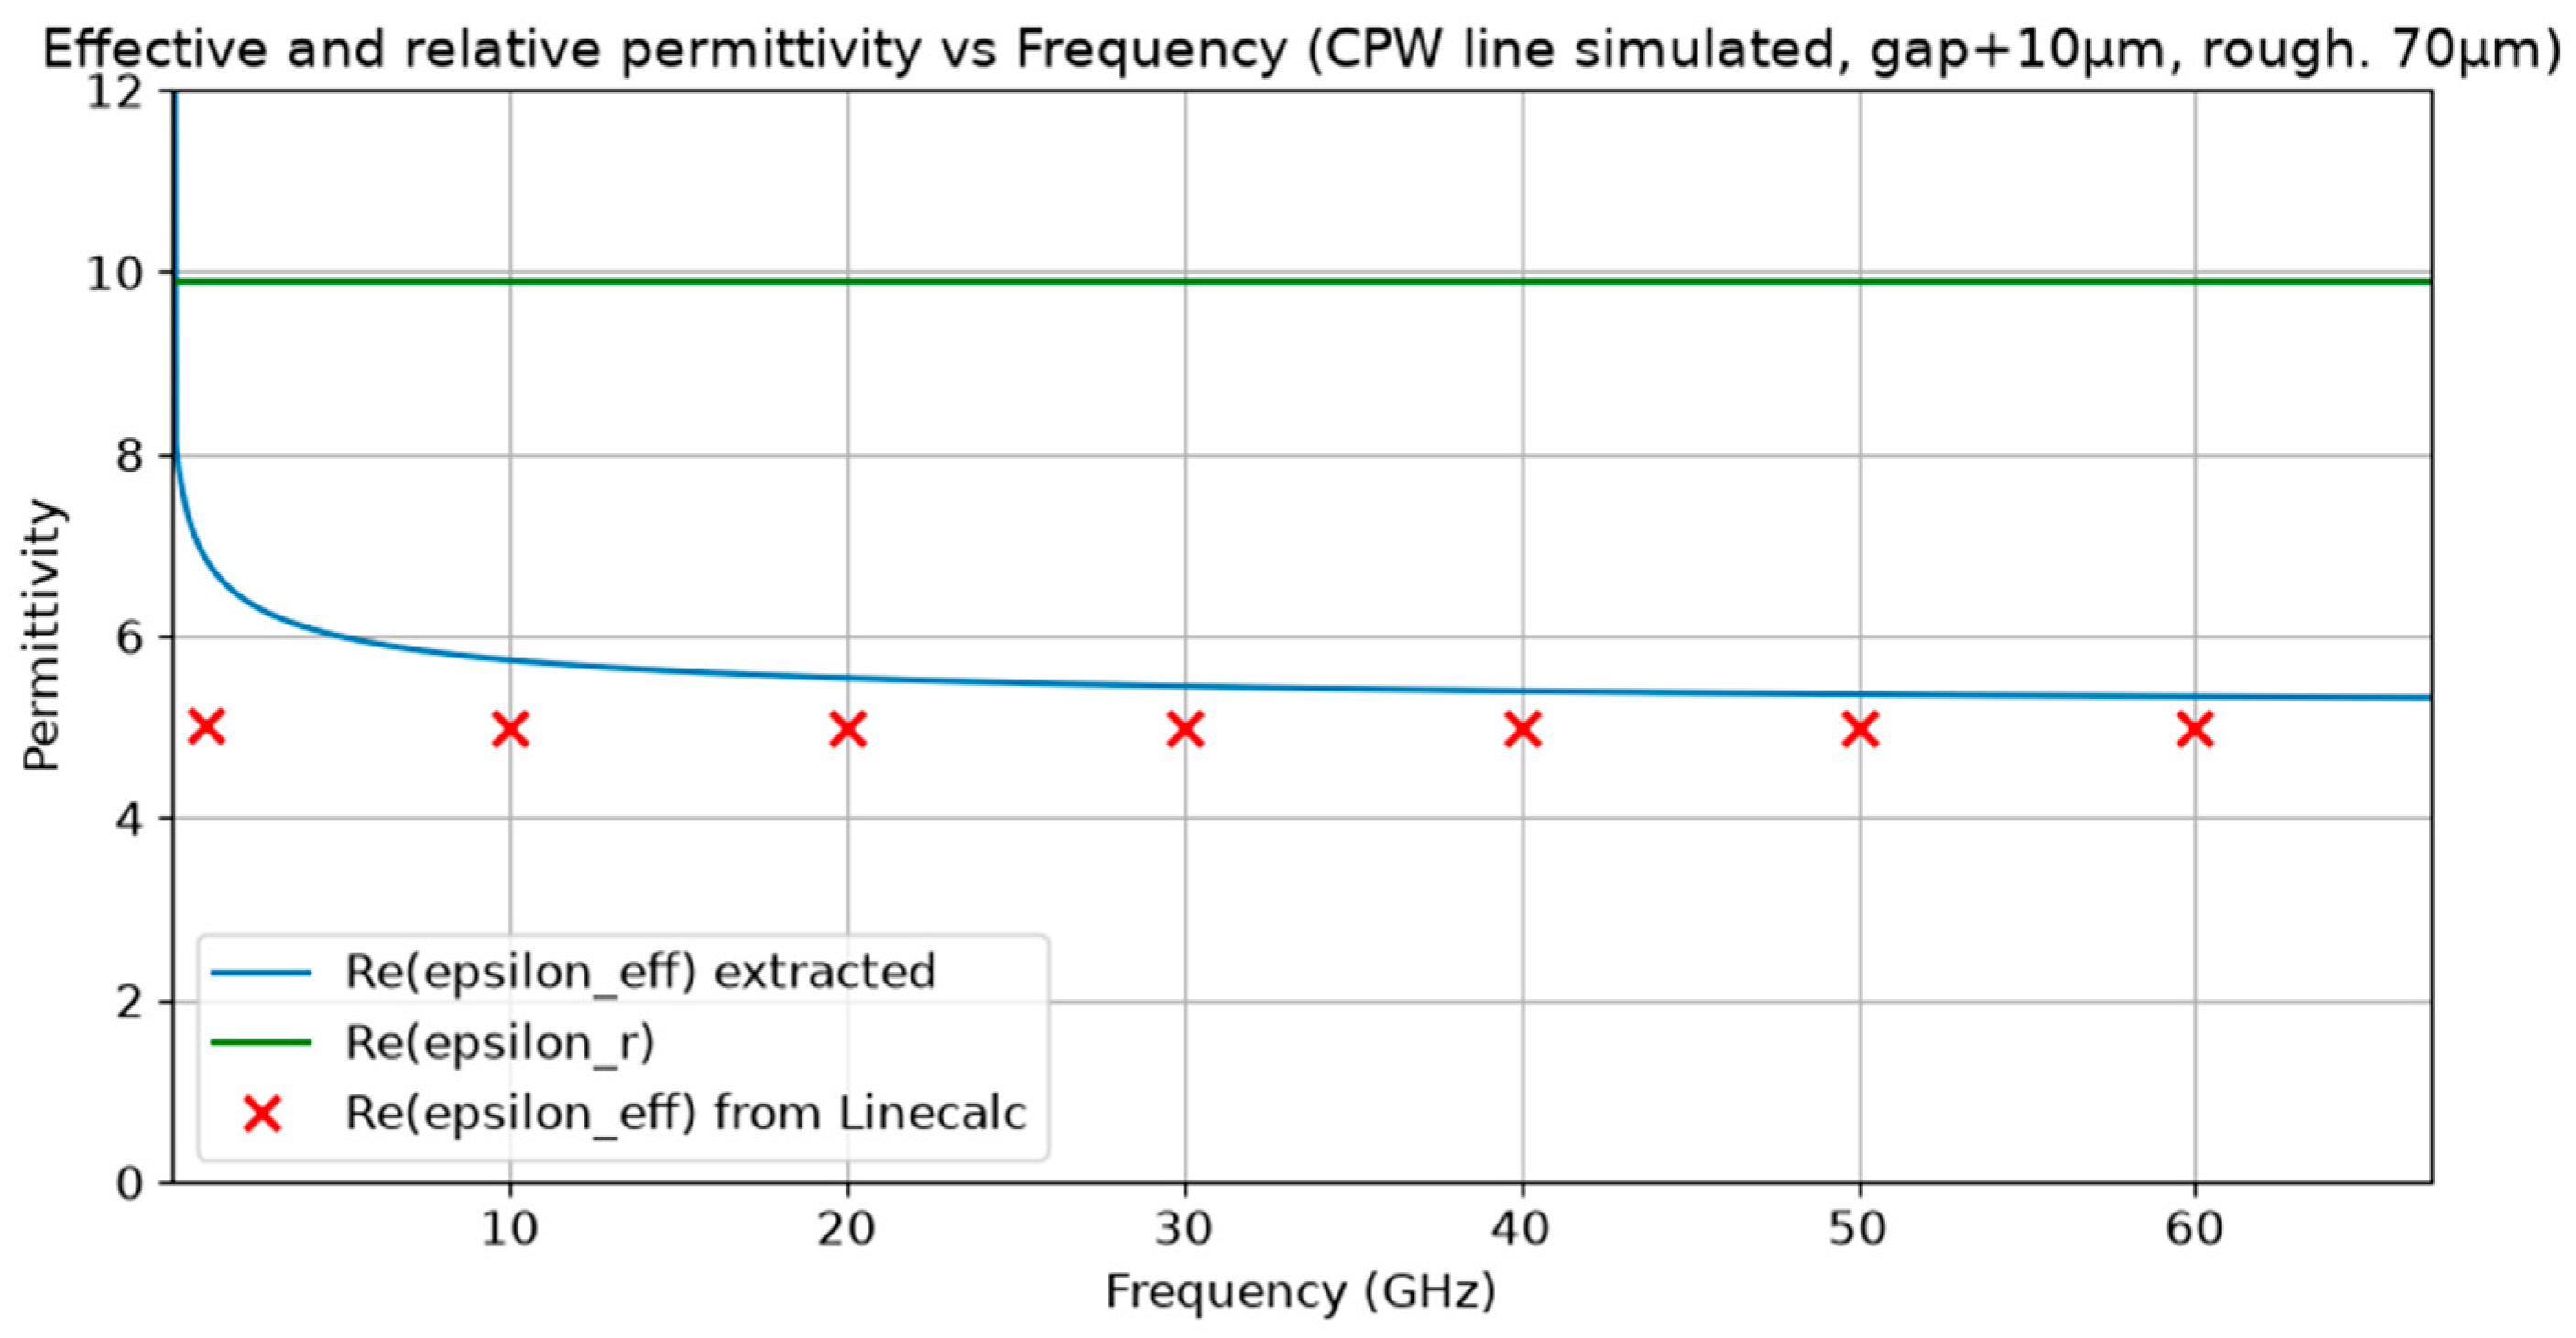
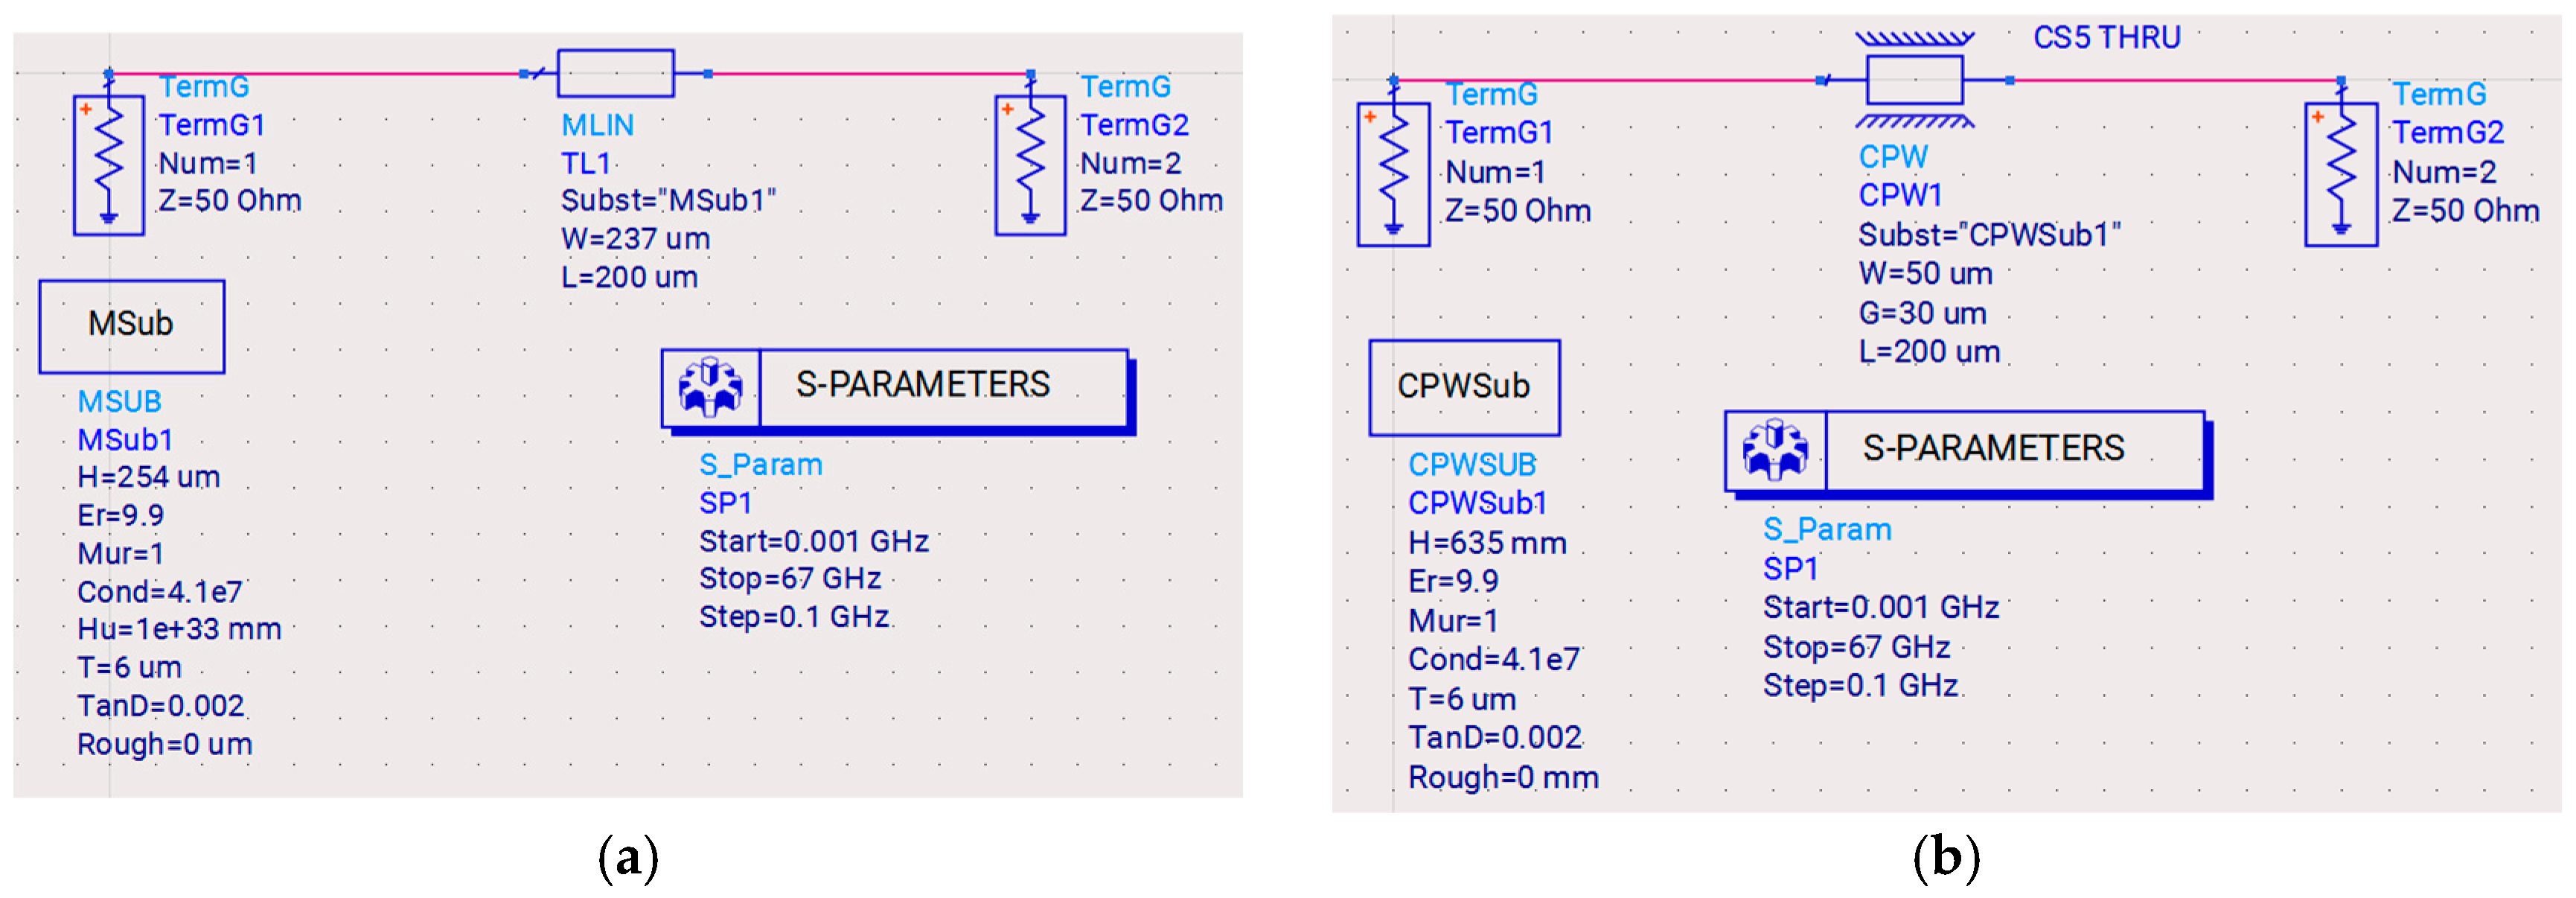
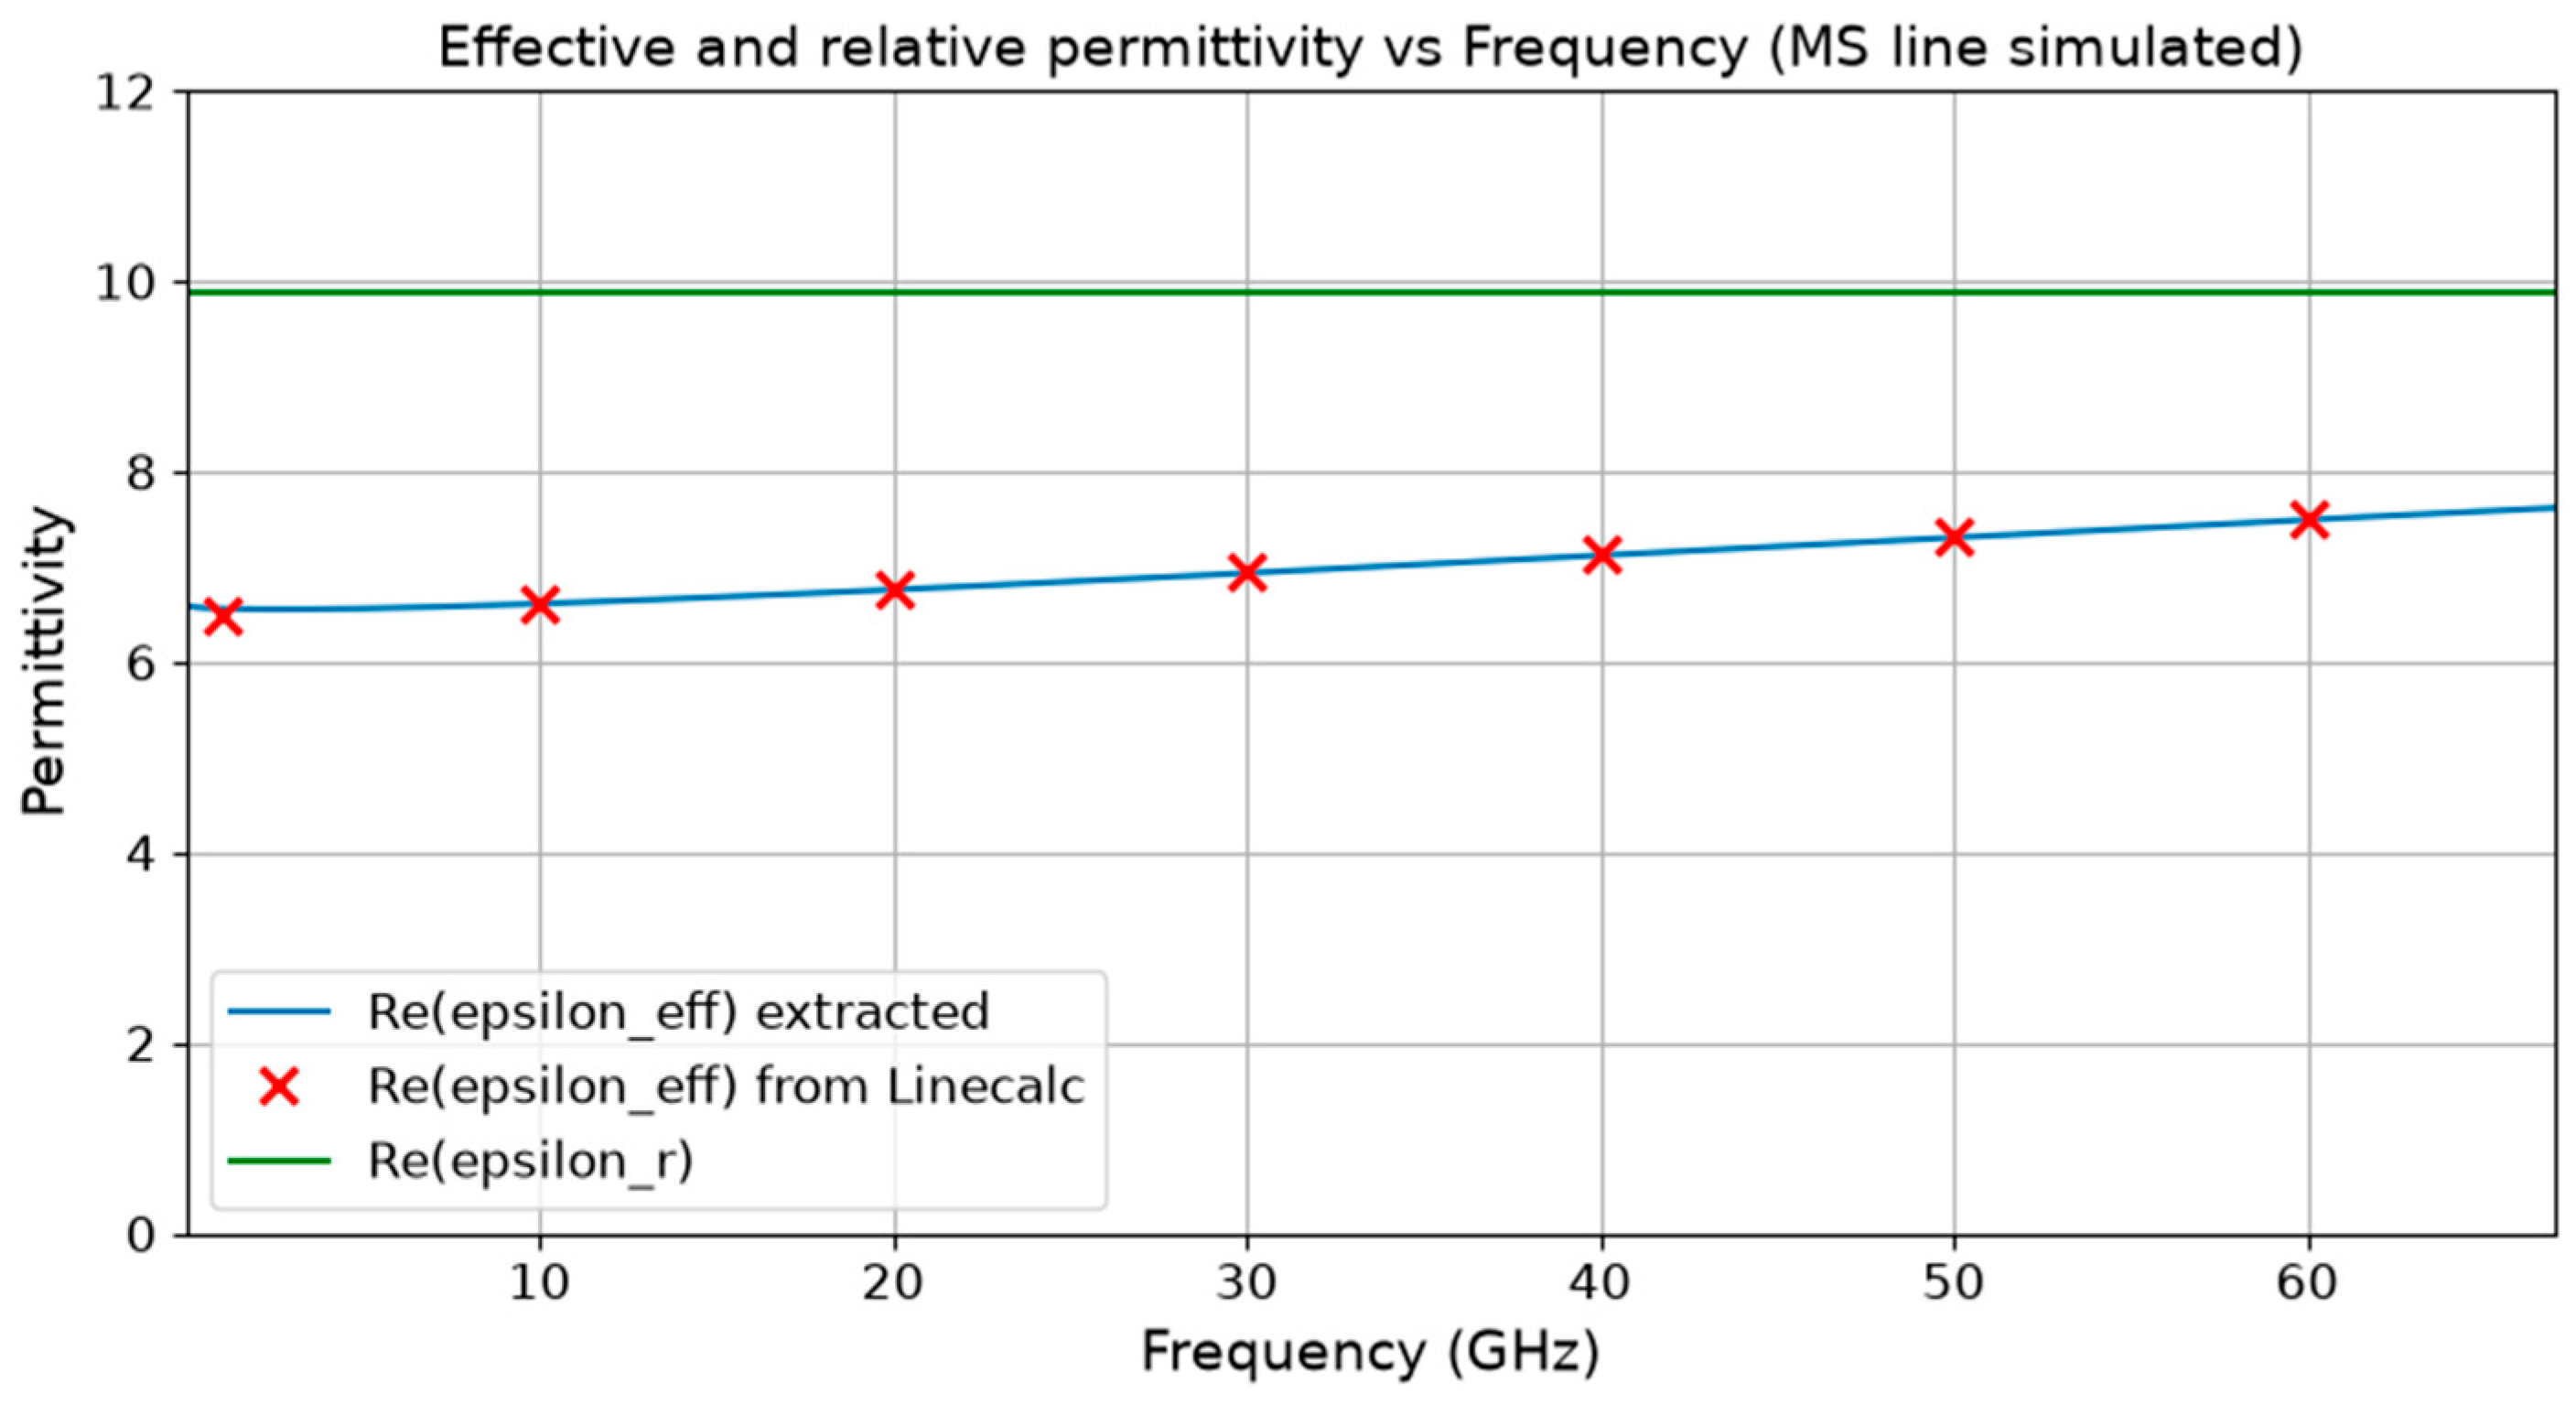
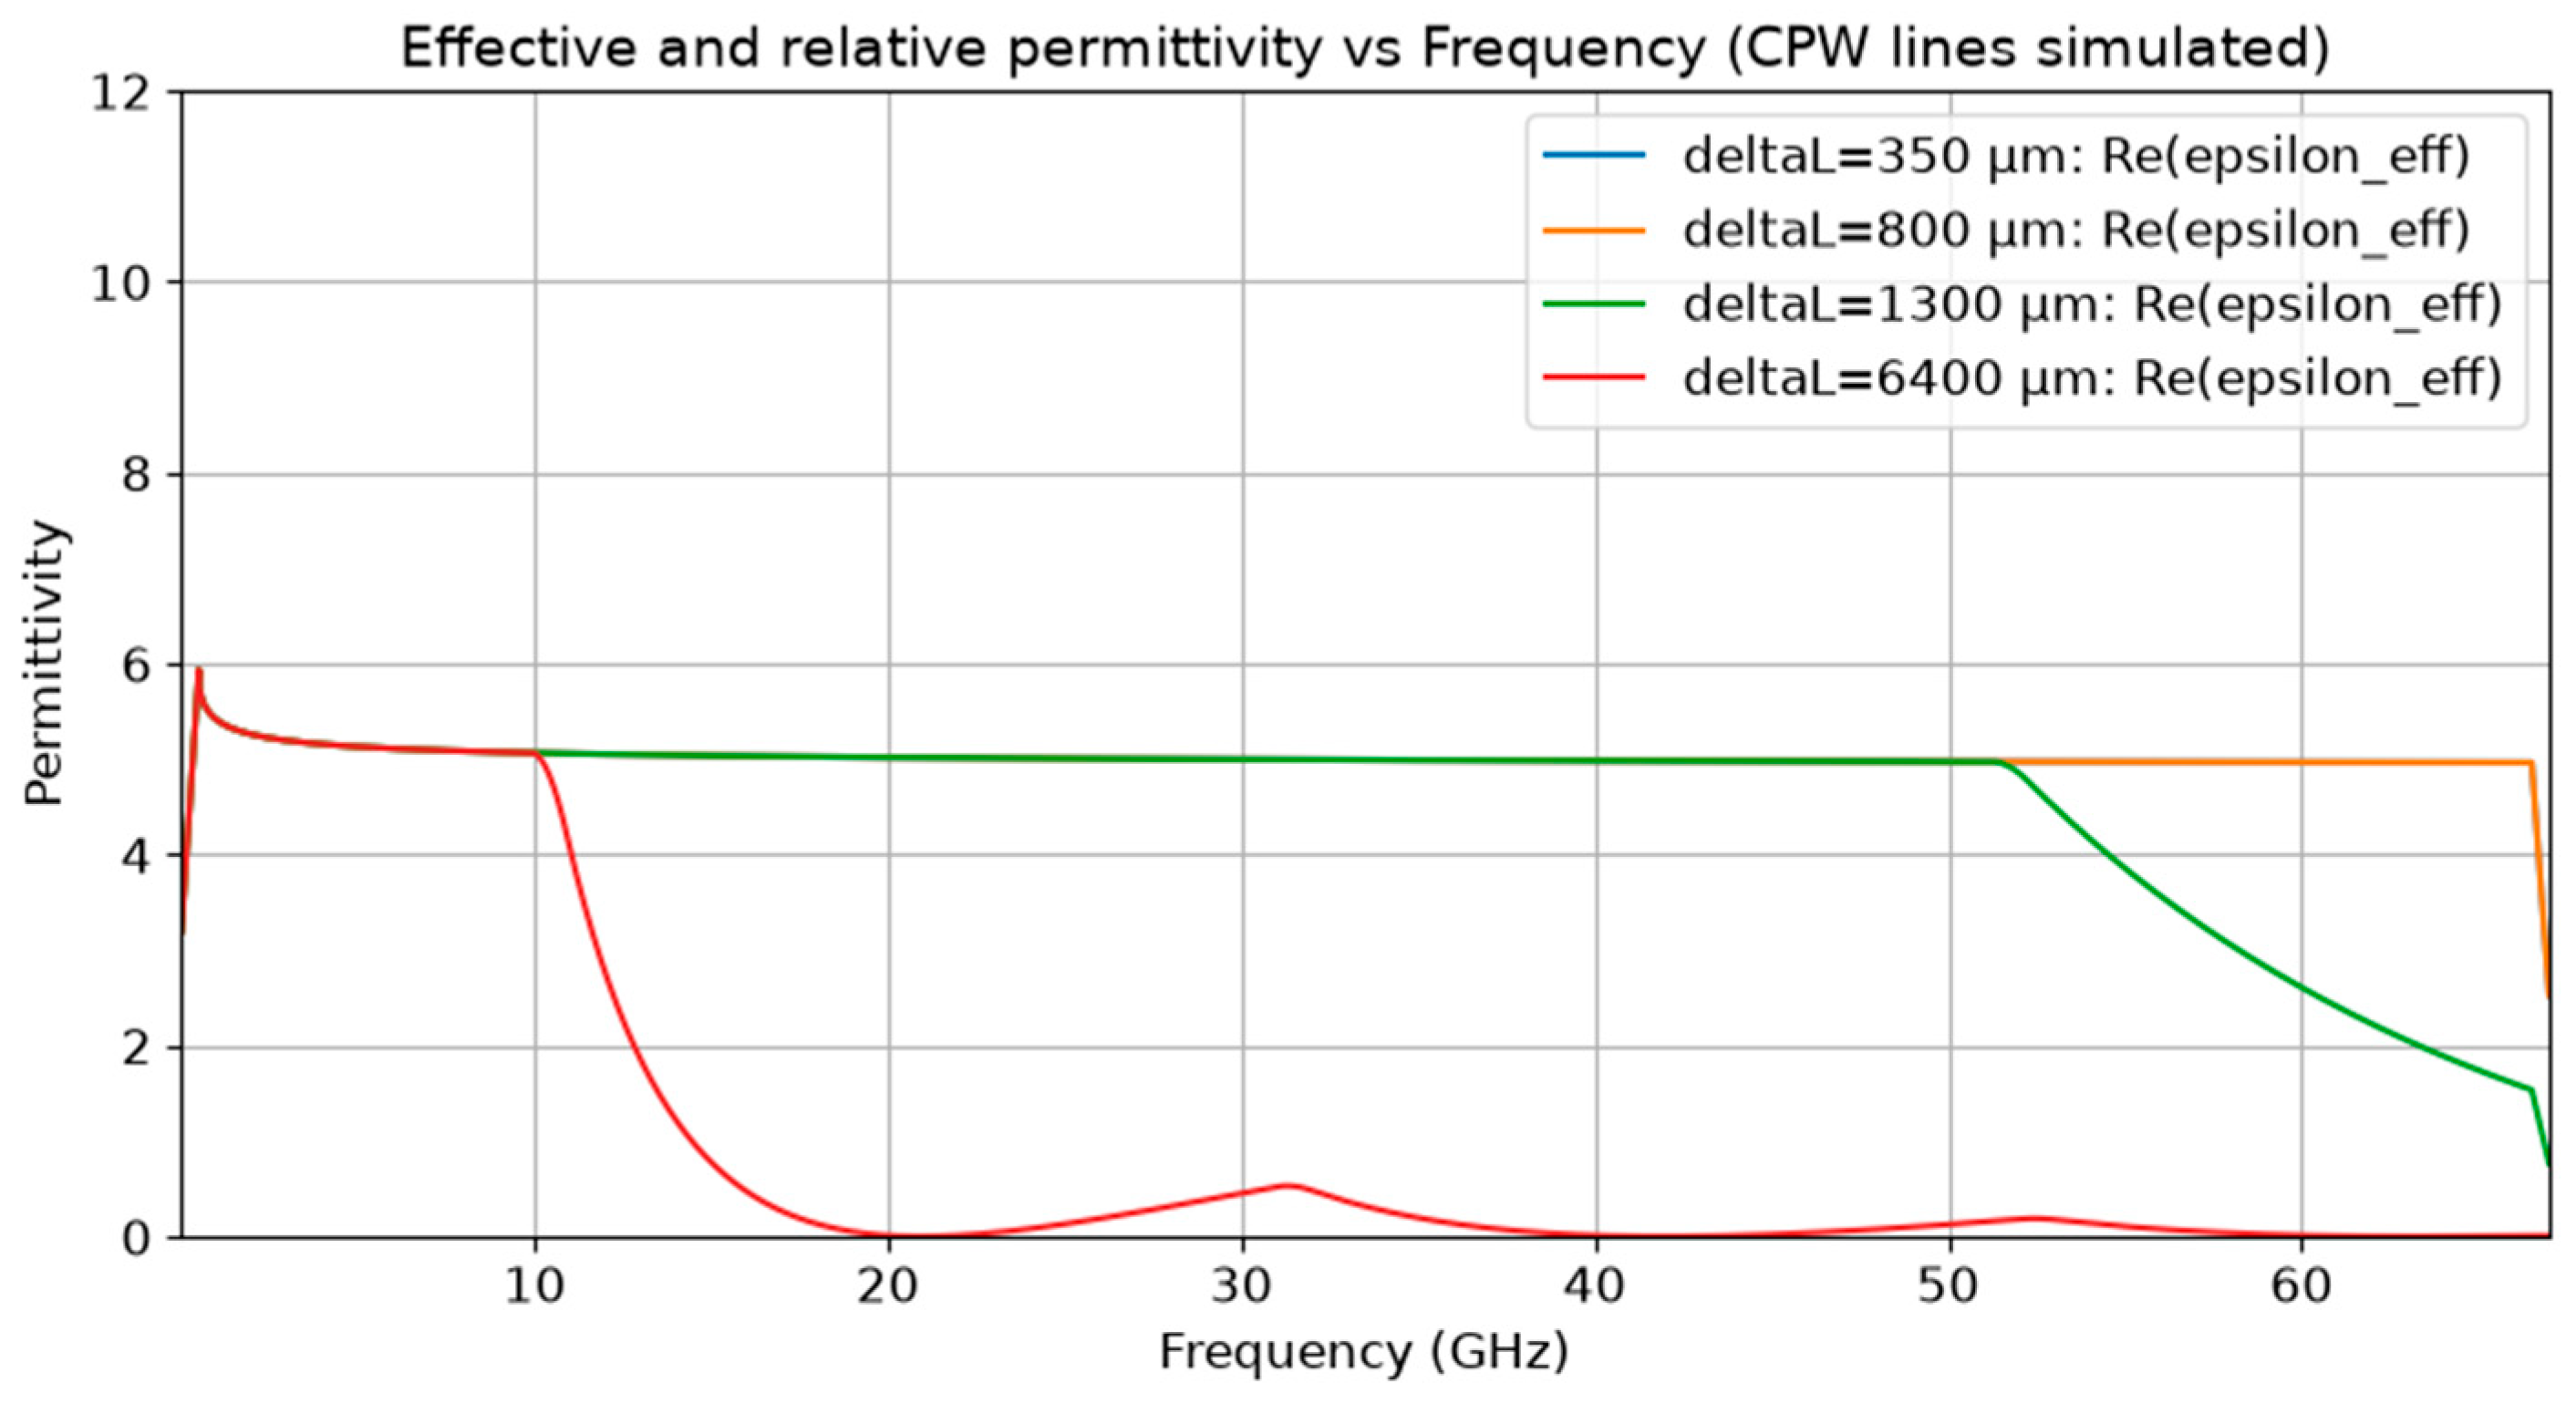
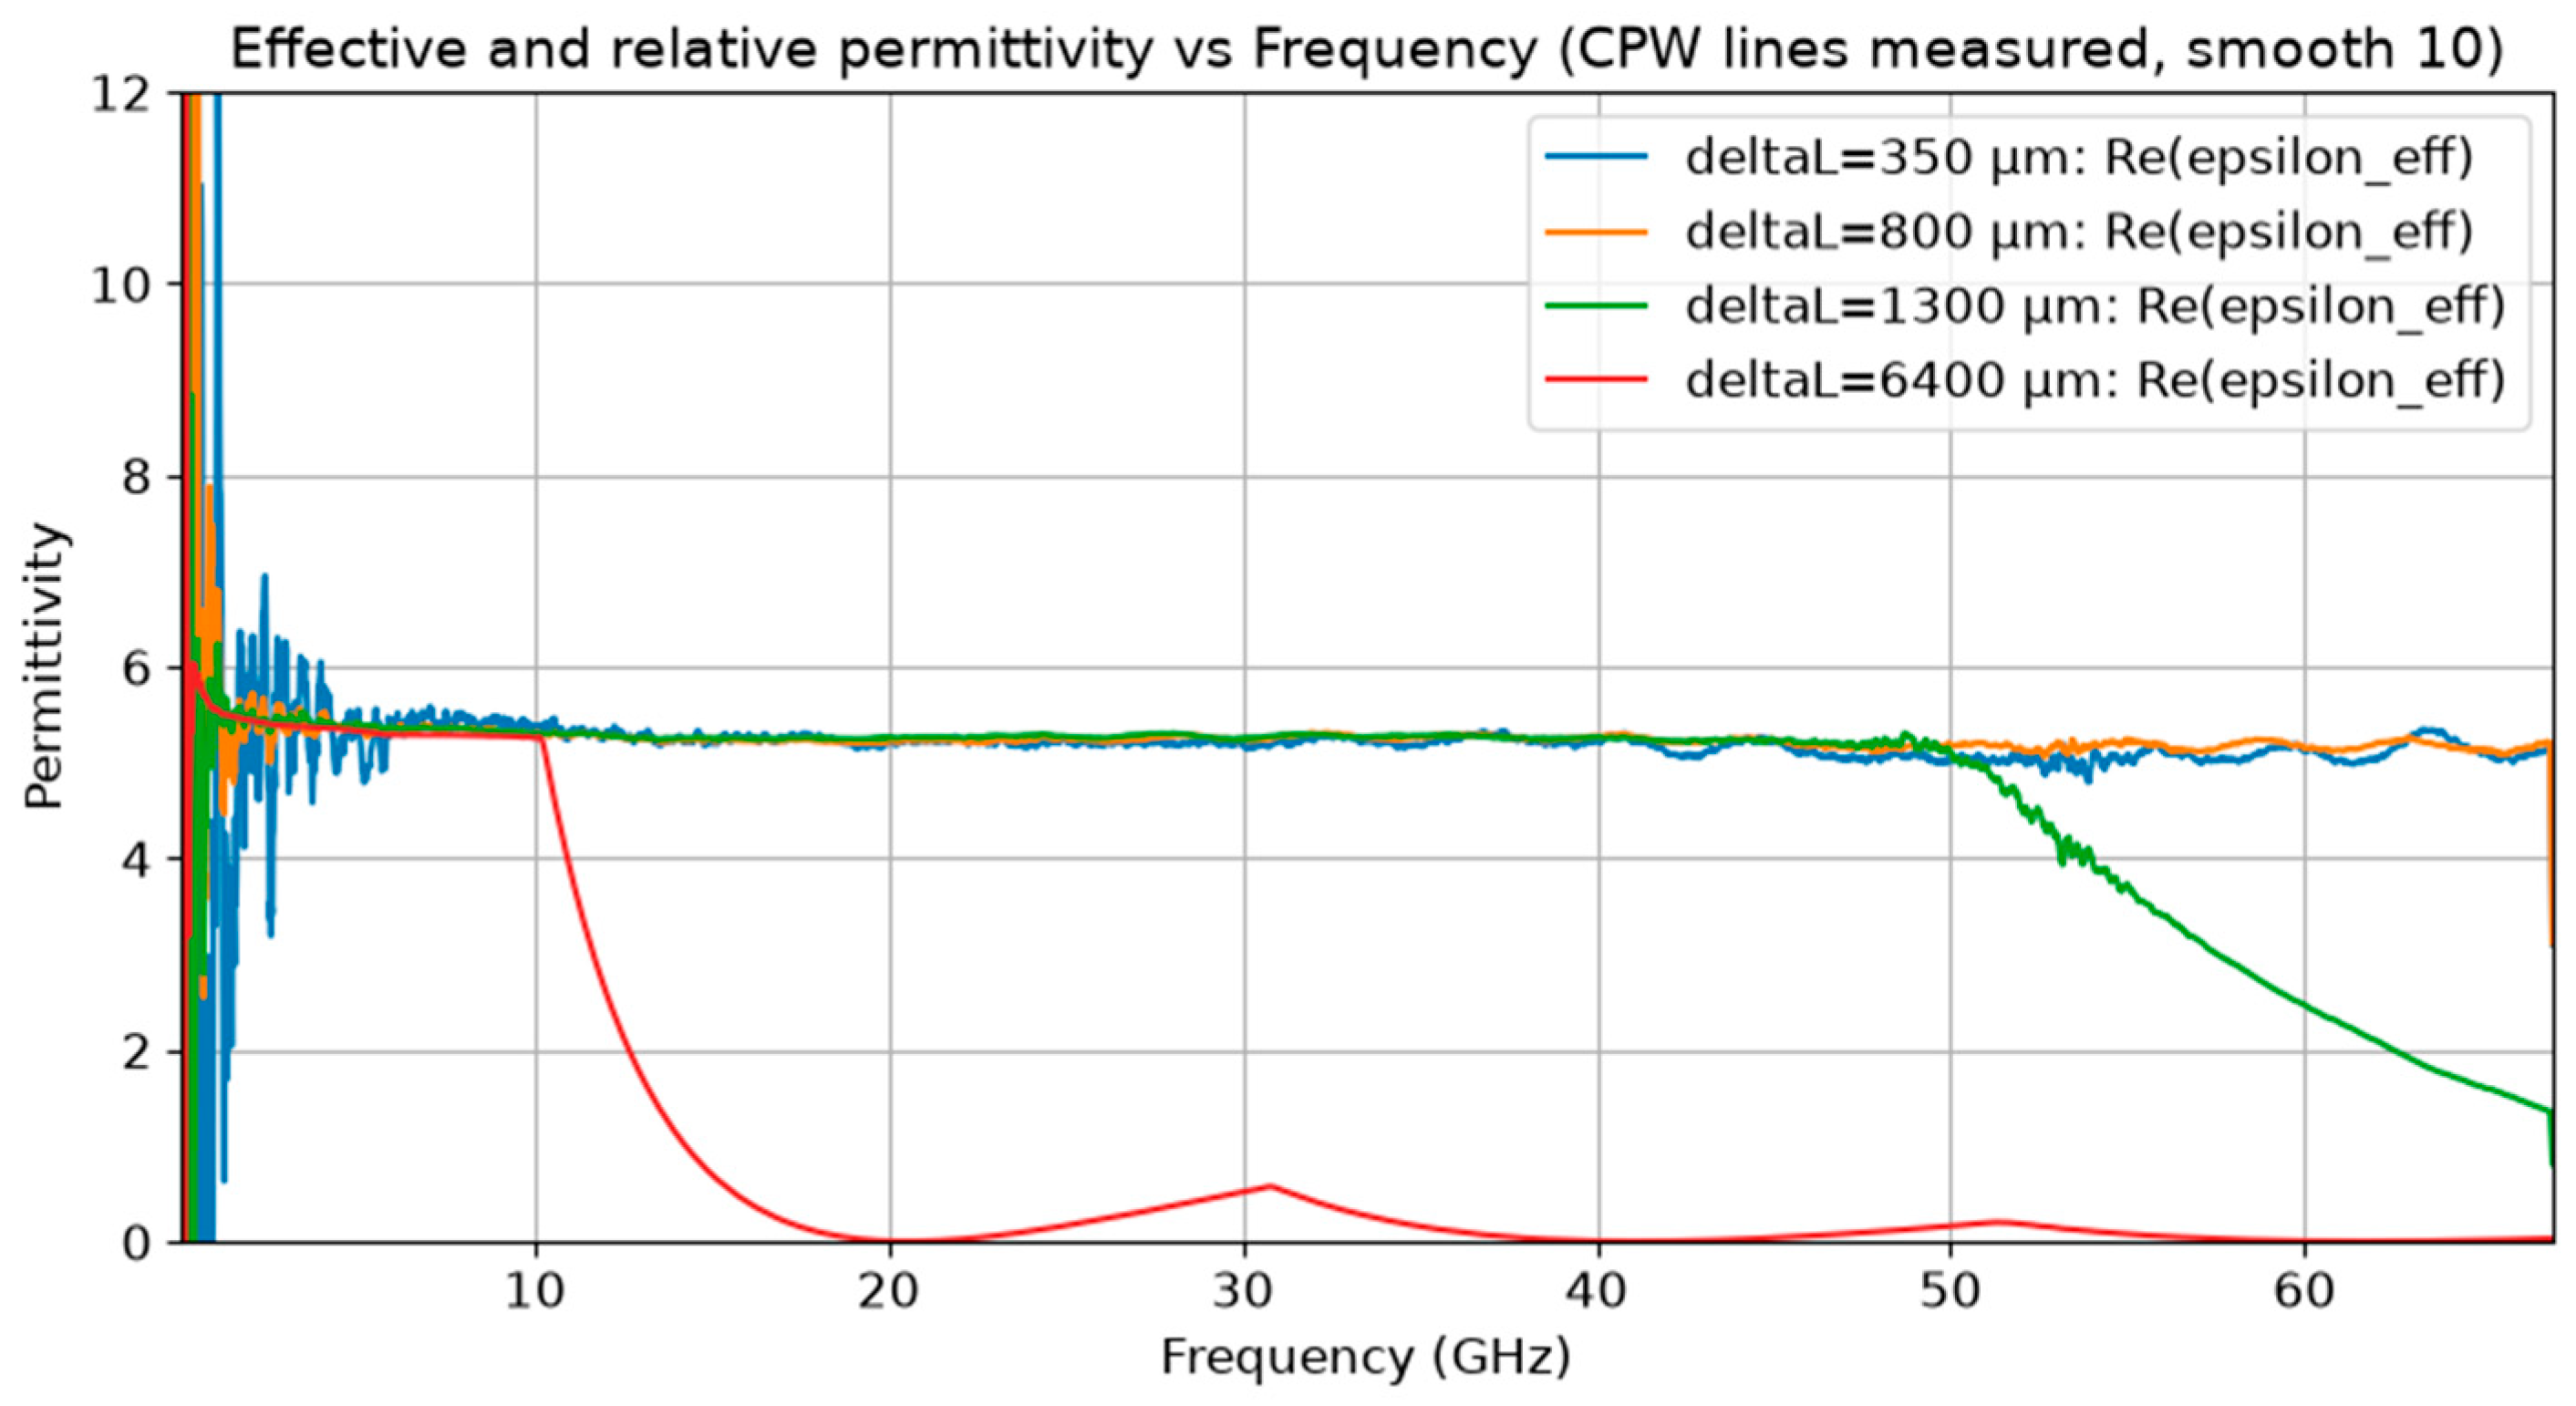
12]. However, we have used it with Coplanar non-grounded Waveguides (CPWs) instead of microstrip lines to make the fabrication easier. The verification of the validity of this model for CPW transmission lines is presented in
Appendix A. All that is needed is the creation of two different-length CPWs on the substrate material.
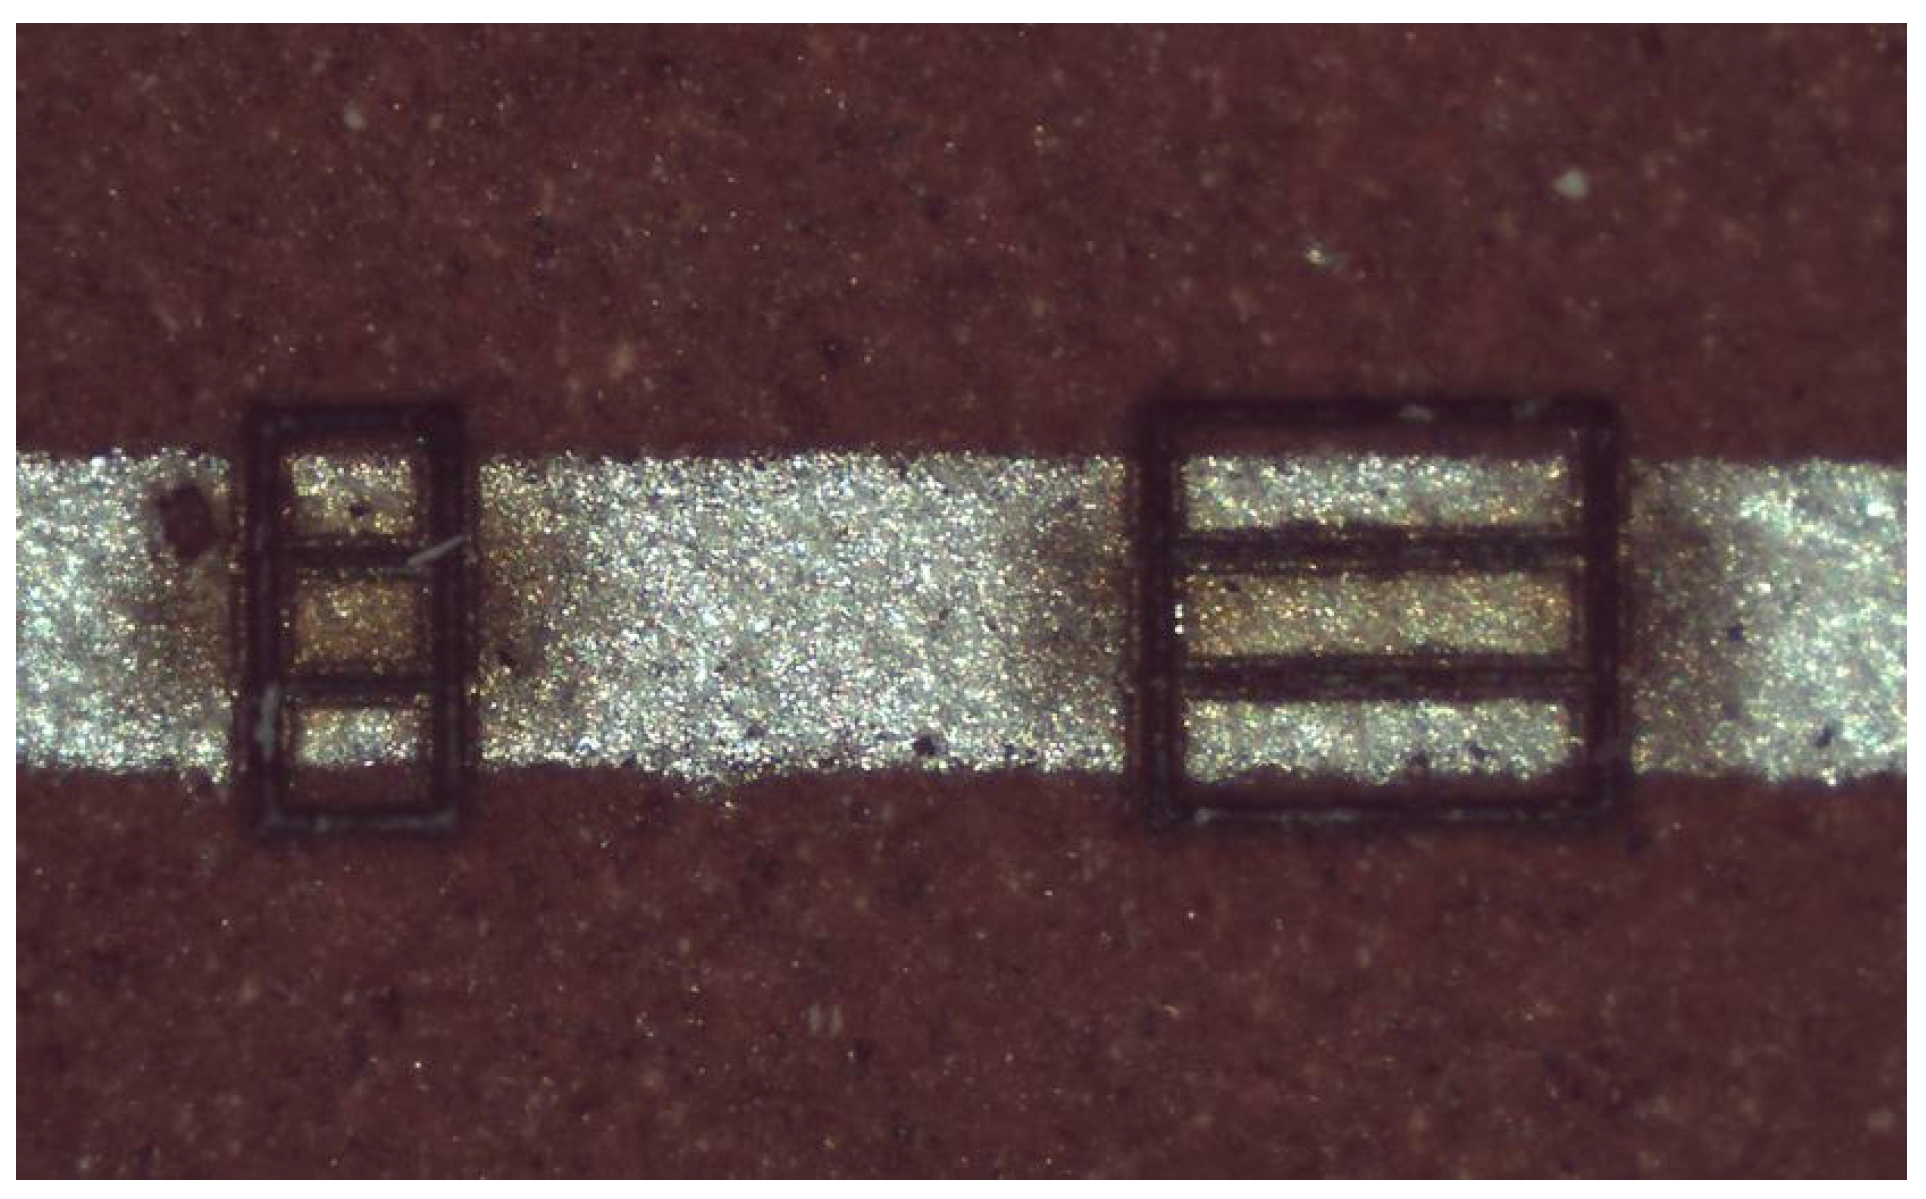
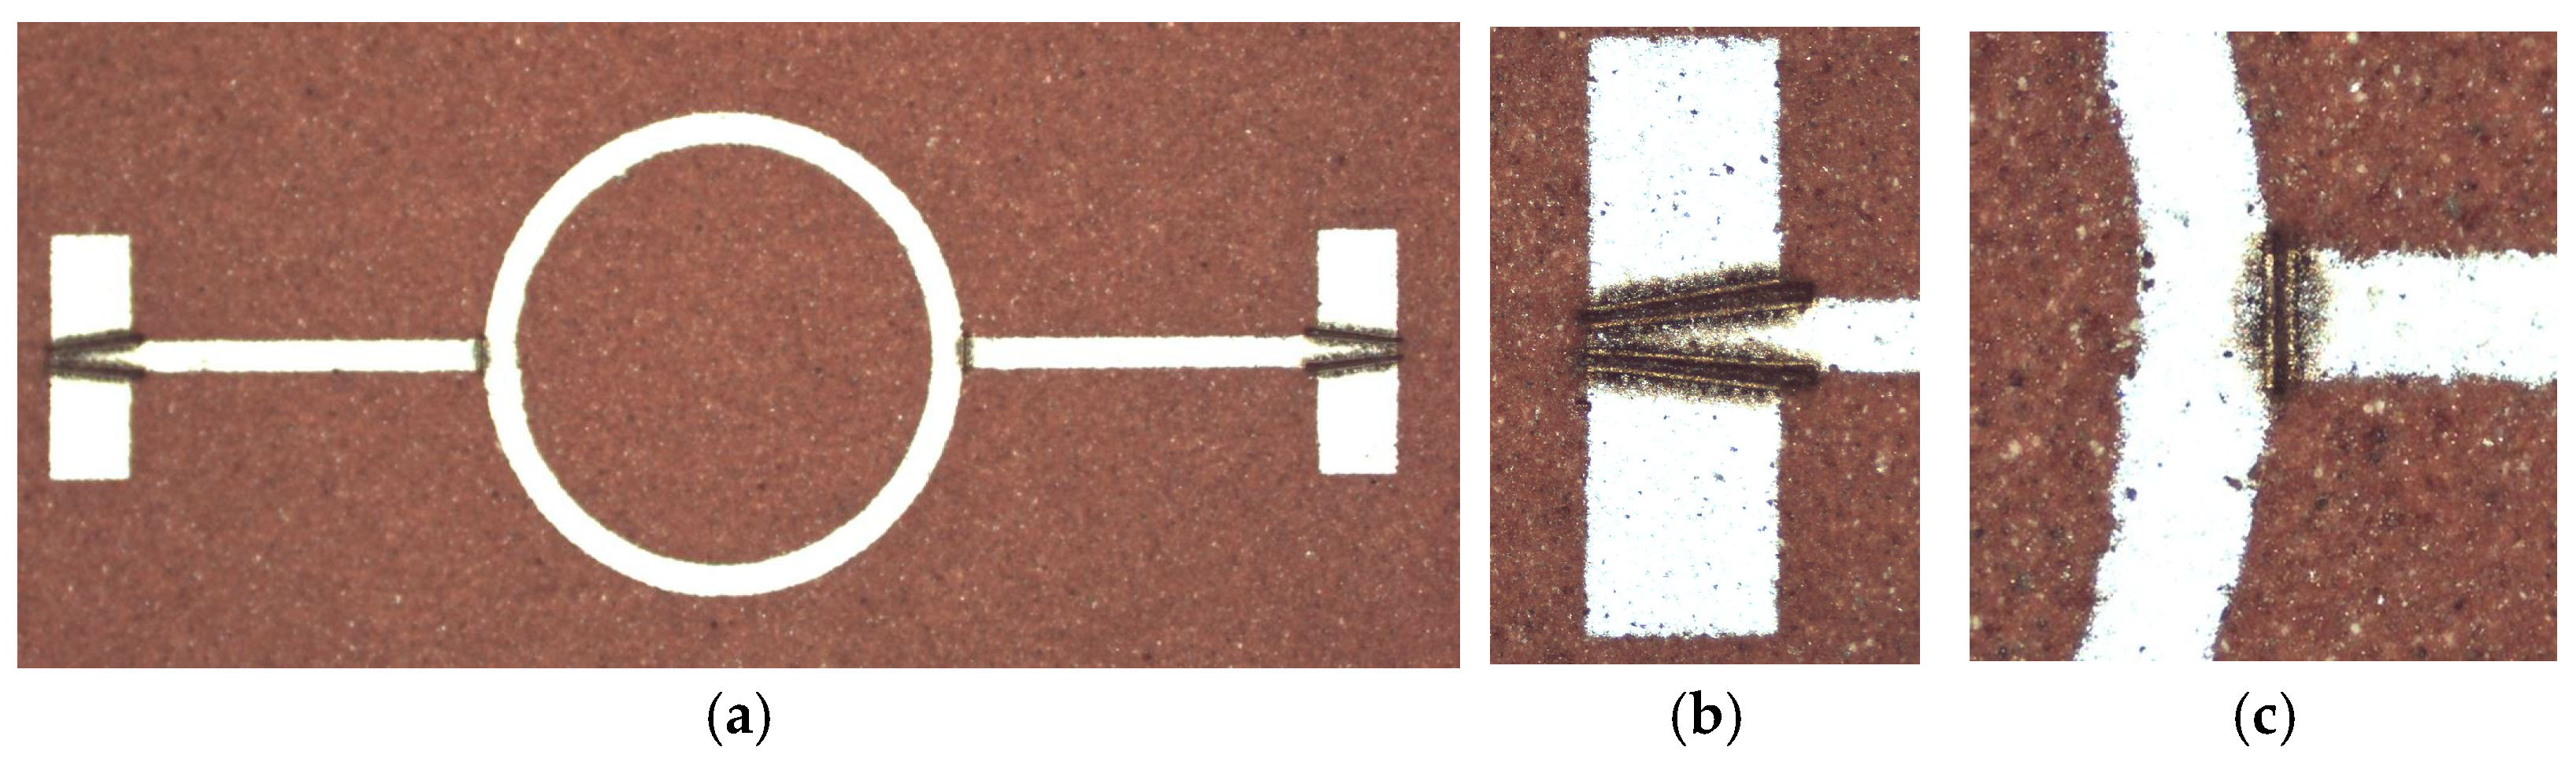
The lines are created by laser ablation on a top layer screen-printed silver with dimensions that should give a line impedance of 50 ohms. L1 is 536 µm, and L2 is 184 µm long, the central line width, w, is 133 µm, and the gaps, s, are 37 µm. These measures all have tolerances of ±10 µm. The two lines are presented in
Figure 7. Their creation is achieved with the use of the fibered laser (LEM2 from Laser Cheval, Marnay, France).
The two lines are measured using a 10 MHz to 67 GHz VNA (ZVA 67 GHz, from Rohde & Schwartz, Gmbh, Munchen, Germany), a probe station (WL170 from Signatone Corp, Gilroy, CA, USA) with 150 µm pitch GSG Picoprobes (67A-GSG-150-EDP from GGB Industries Inc., Naples, FL, USA). Before measuring these devices, a short, open, load and thru (SOLT) calibration was performed with the help of a CS5-calibration kit (GGB Industries Inc. Naples, FL, USA), with input power of 0 dBm and an averaging factor equal to 10 by 4001 points. Due to dispersion not being taken into account by the calibration procedure, the CS5 substrate will not allow correct measurement at frequencies below 5 GHz [
13].
After measurement, the effective permittivity, ε
eff, is first obtained following the steps indicated in [
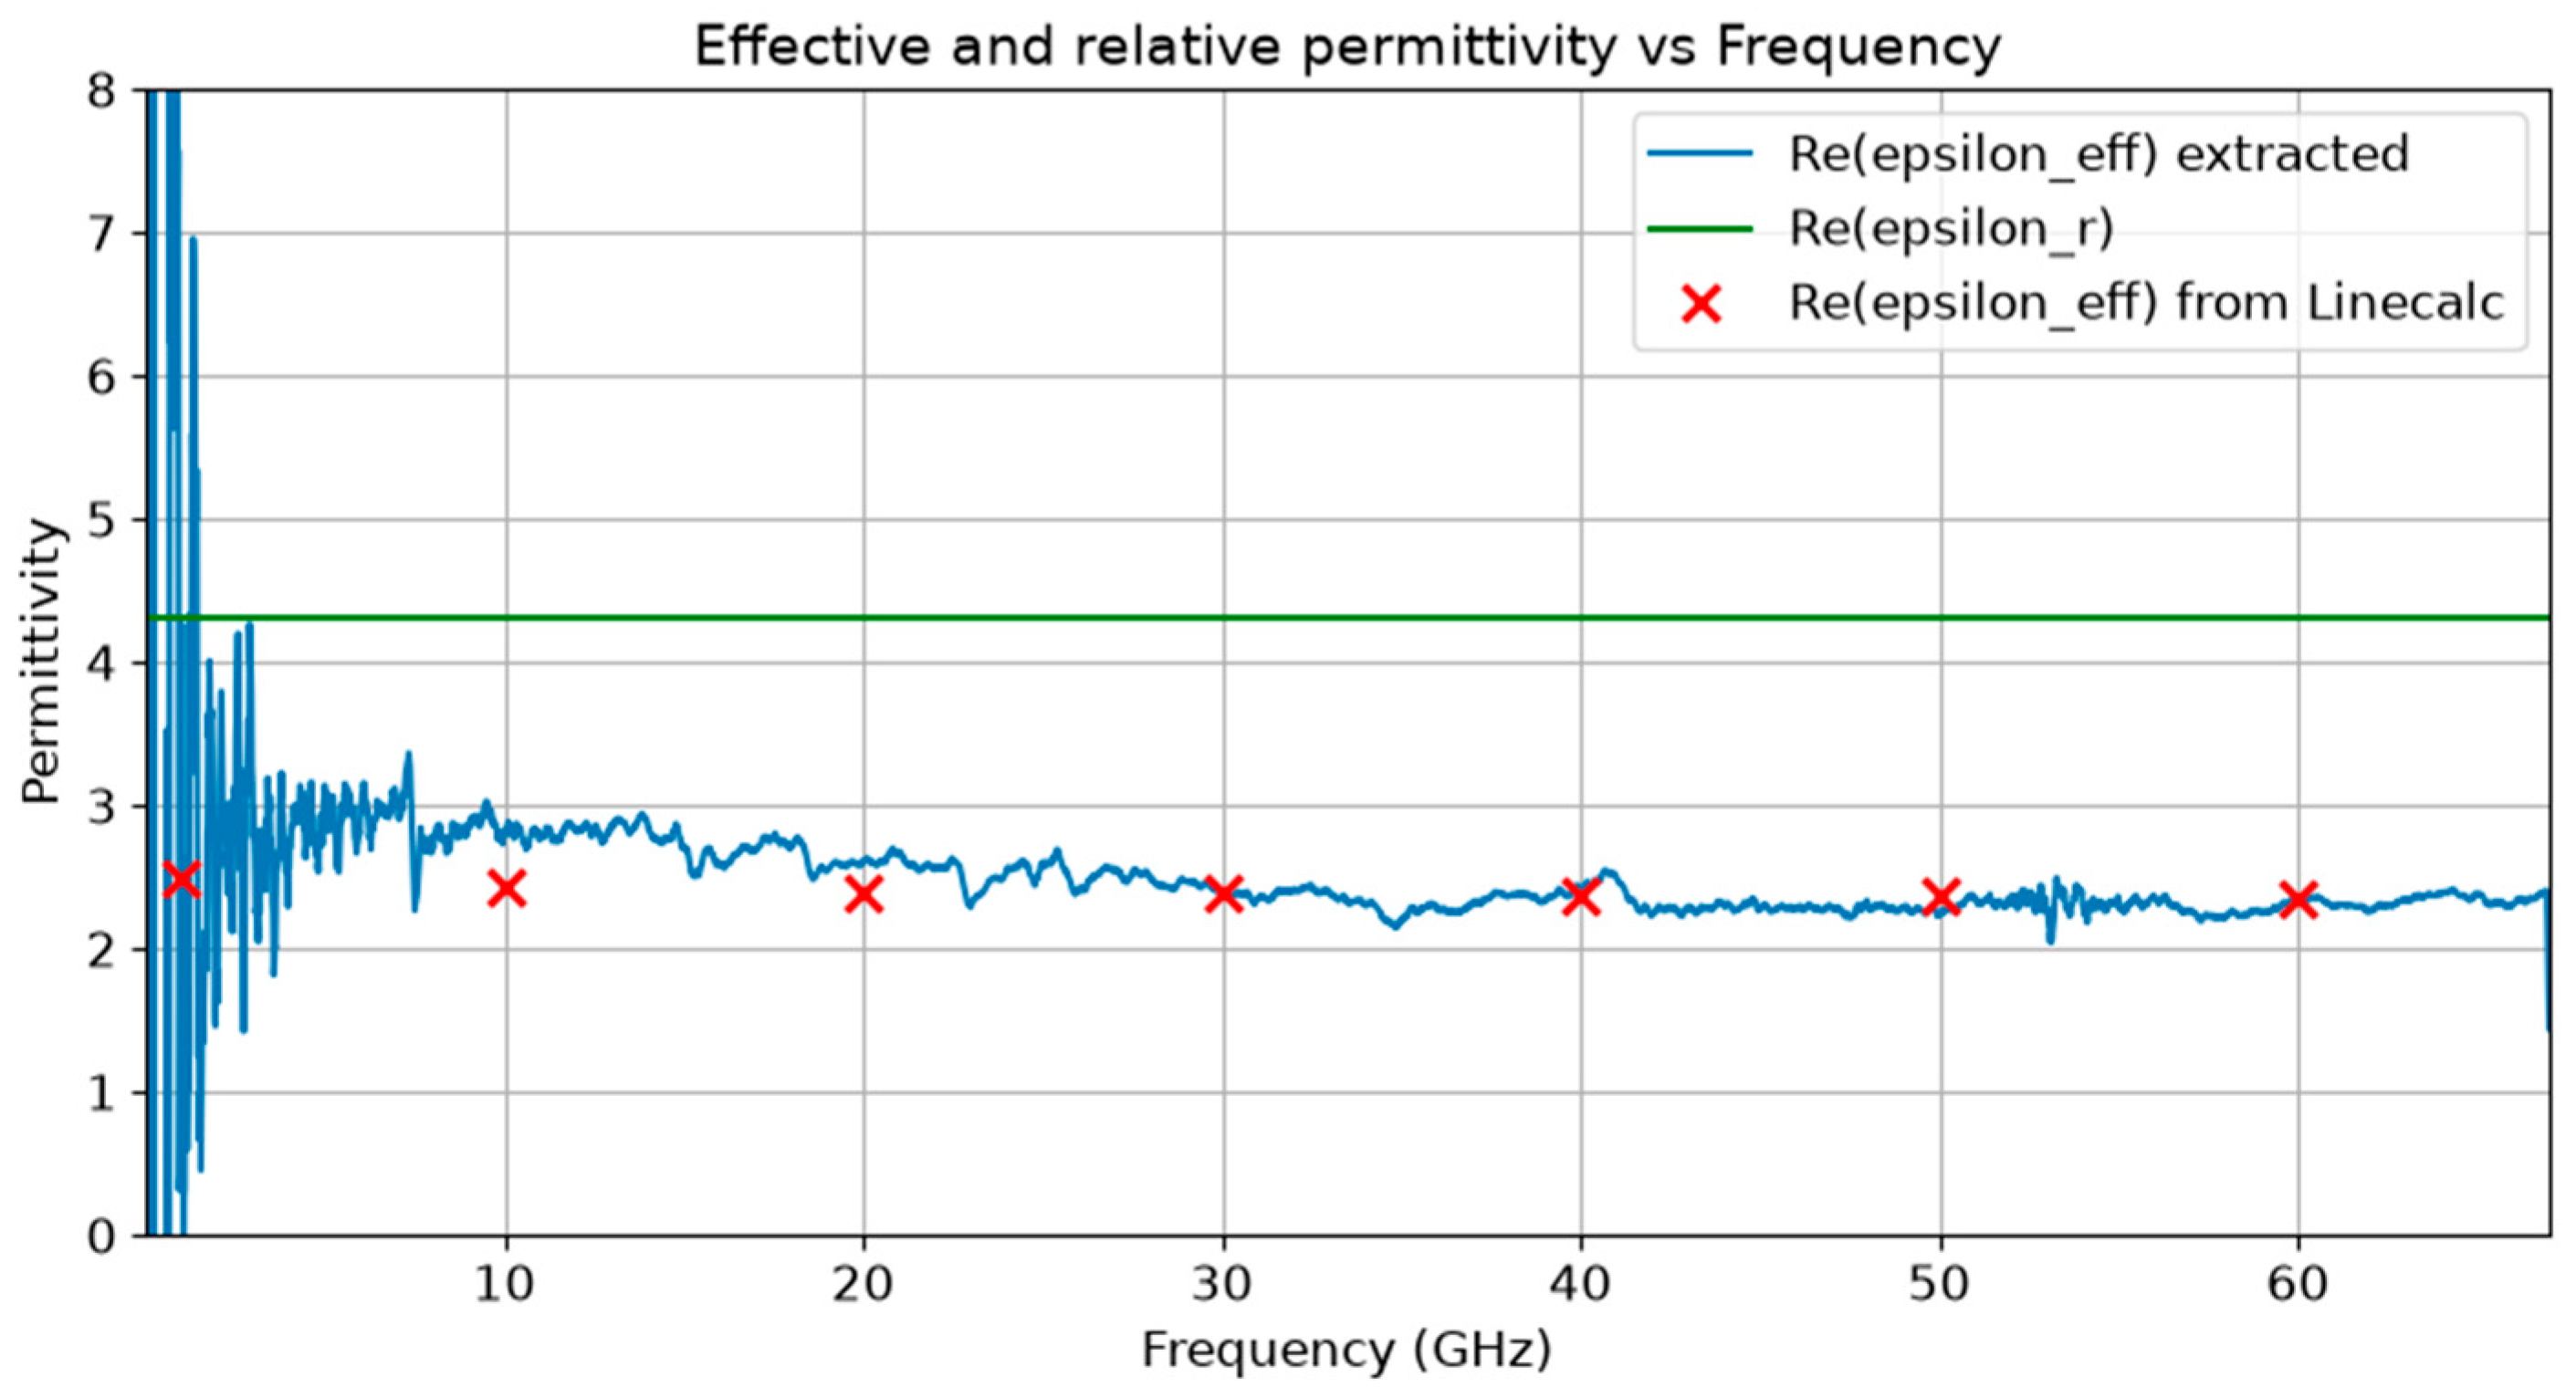
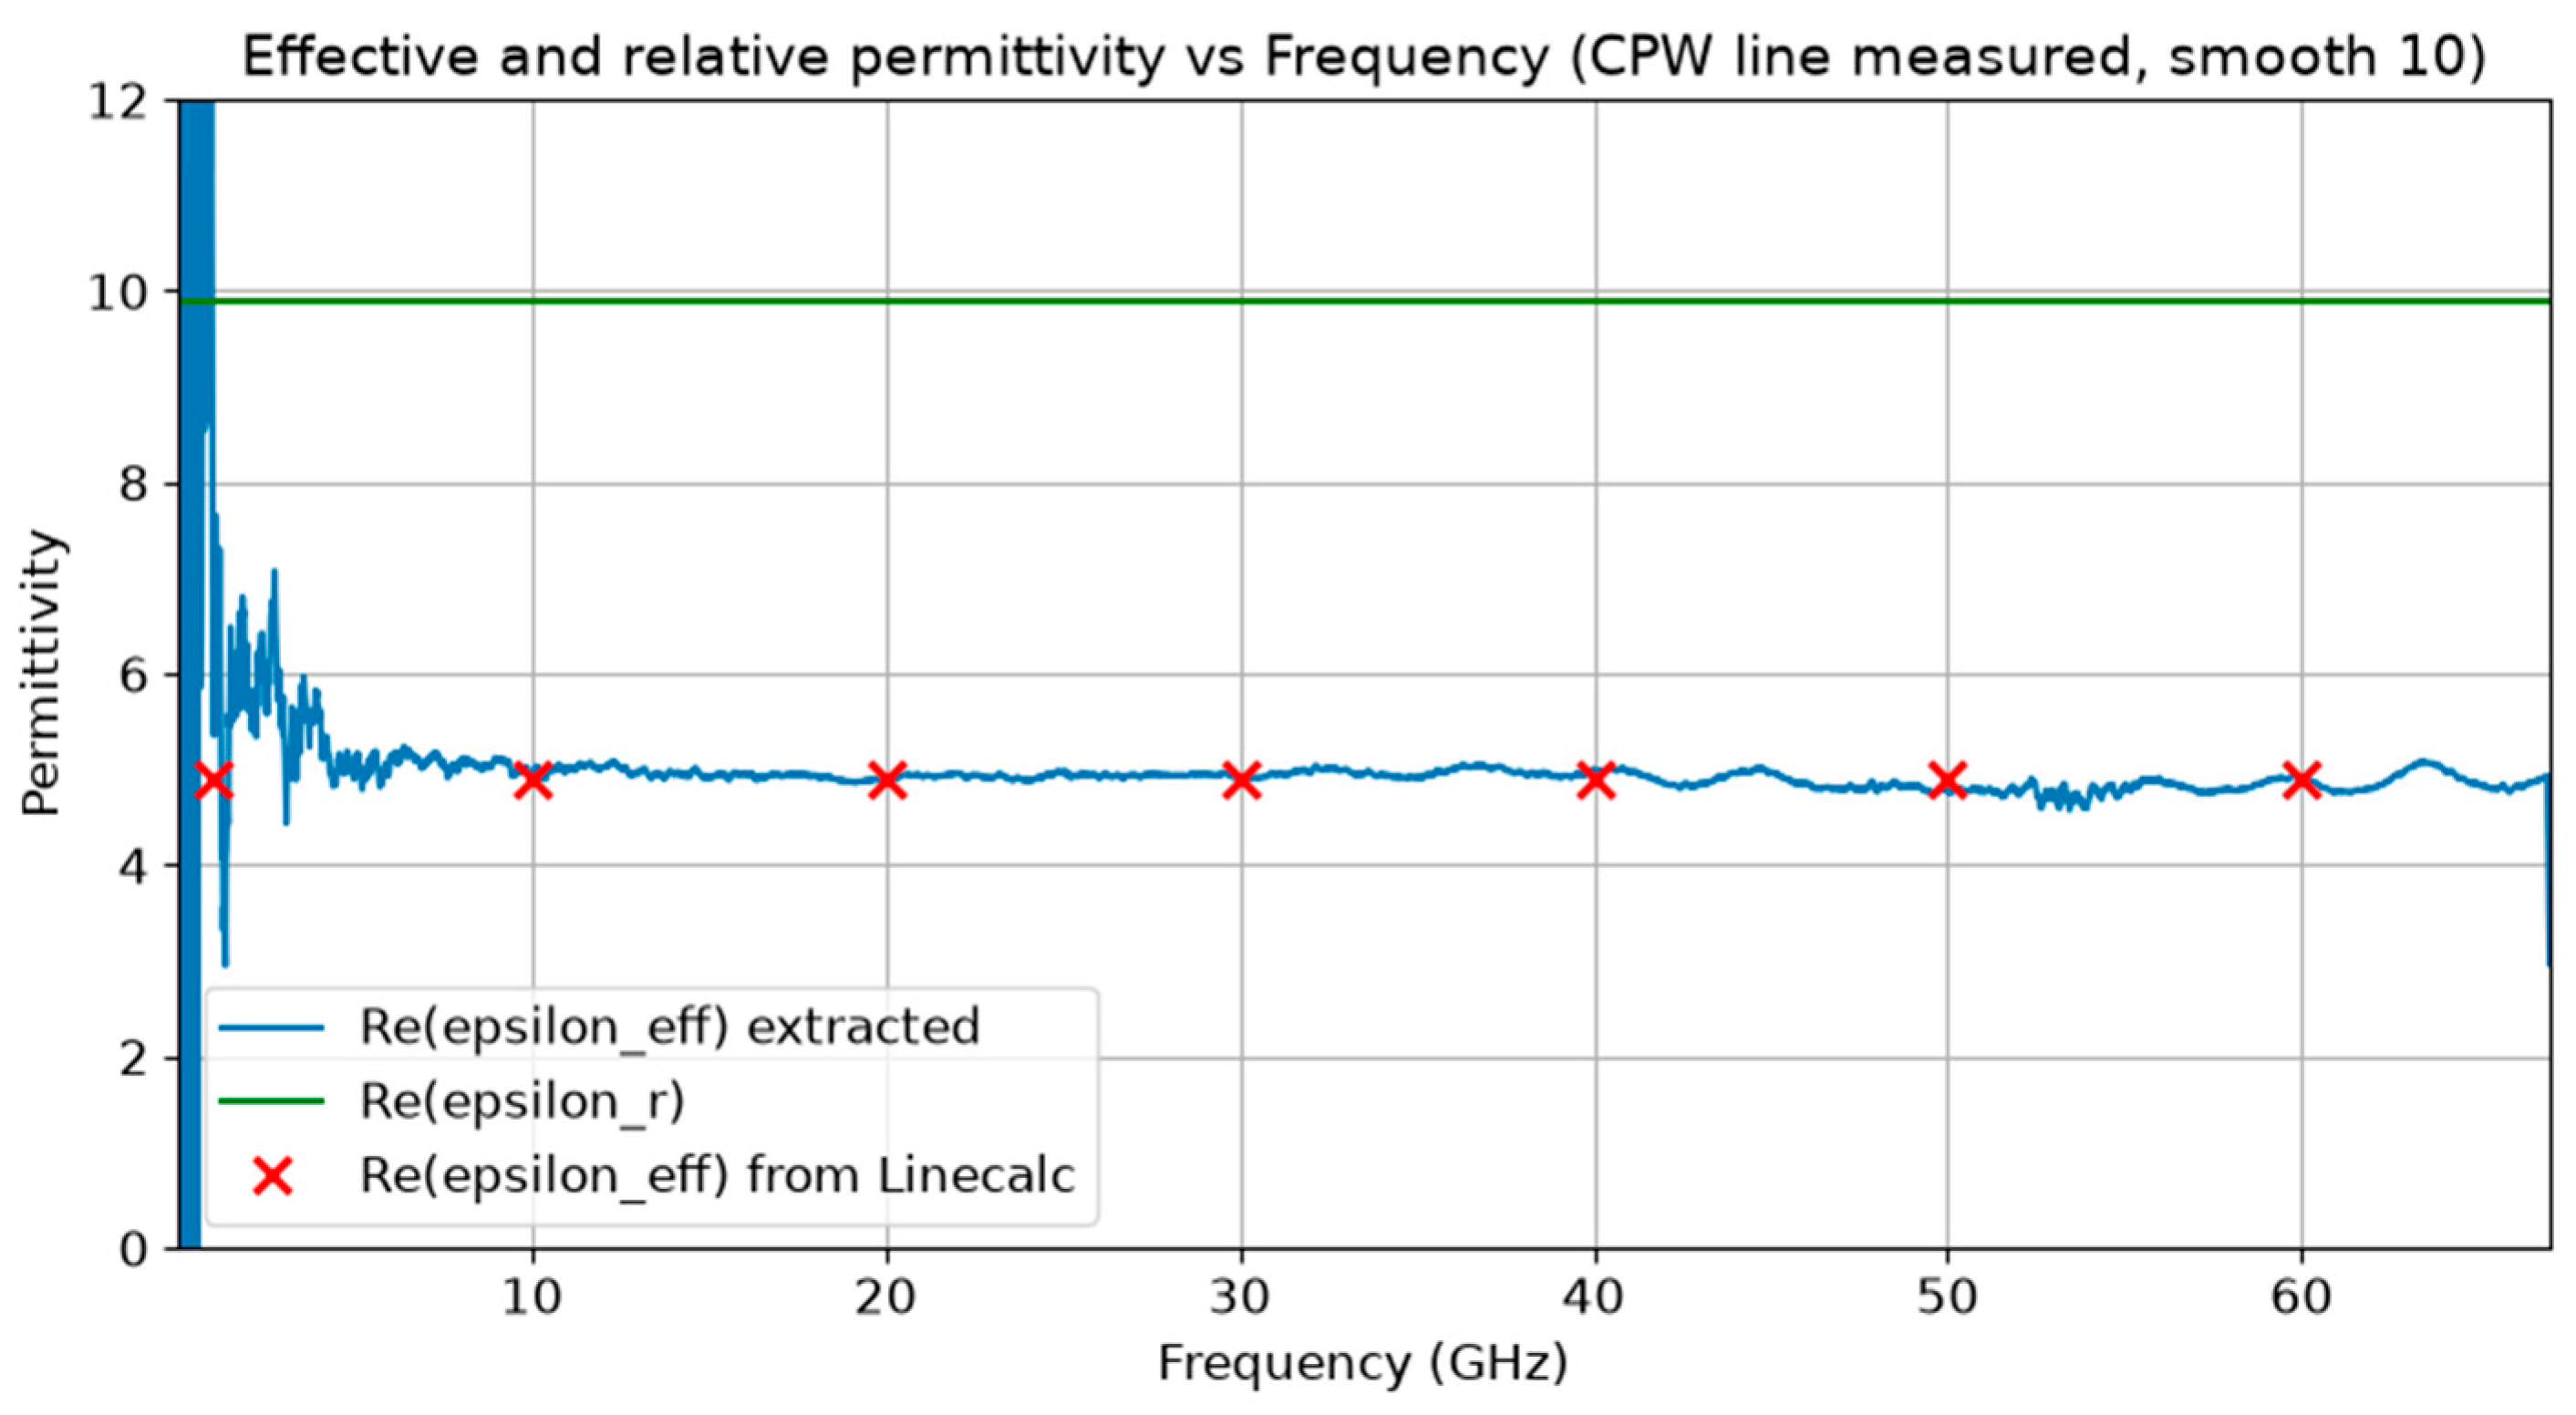
12]. The resulting values are presented in
Figure 8. Smoothing with a moving average of 10 was applied for better readability. The ε
eff is found to have a mean value of 2.46 and a standard deviation of 0.20, calculating from 5 GHz and upwards. From this value, an ε
r of 4.3 can be estimated using the LineCalc tool from Advanced Design Systems (641.update2.1 29 April 2026, ADS2026 Update2.1, Keysight Technologies, Santa Rosa, CA, USA). In comparison with the relative permittivity estimated from the weight percent ratio to be 3.63, the results seem quite plausible, even though somewhat higher. From the tolerance and roughness analysis performed in
Appendix A, this value should be correct within a 10% limit. Nevertheless, the method used gives a first indication, which is valuable.
3.2.3. Full Prototype
A second prototype including a microwave ring resonator for test was also fabricated based on tape created from two slurry preparations using basically the same recipe. In this run, added fabrication procedures such as via hole cutting, via filling and screen-printing were performed. The same laser (LEM2 from Laser Cheval, Marnay, France) was used with parameters as set previously. An M2H screen printer from EKRA (Asys group, Dornstadt, Germany) was used together with 325 meshed inox screens (with 18 µm diameter wires in the mesh) for via hole filling and screen printing of the motives. The paste used was Ferro CN33-493 for the via holes and Ferro CN33-498G for the ring resonator and the ground plane.
The via screen printing was performed on the top fourth layer only. The ground plane was positioned on top of the third layer and the ring resonator structure on the top fourth layer, with each layer being 180 µm thick before firing and 130 µm after firing.
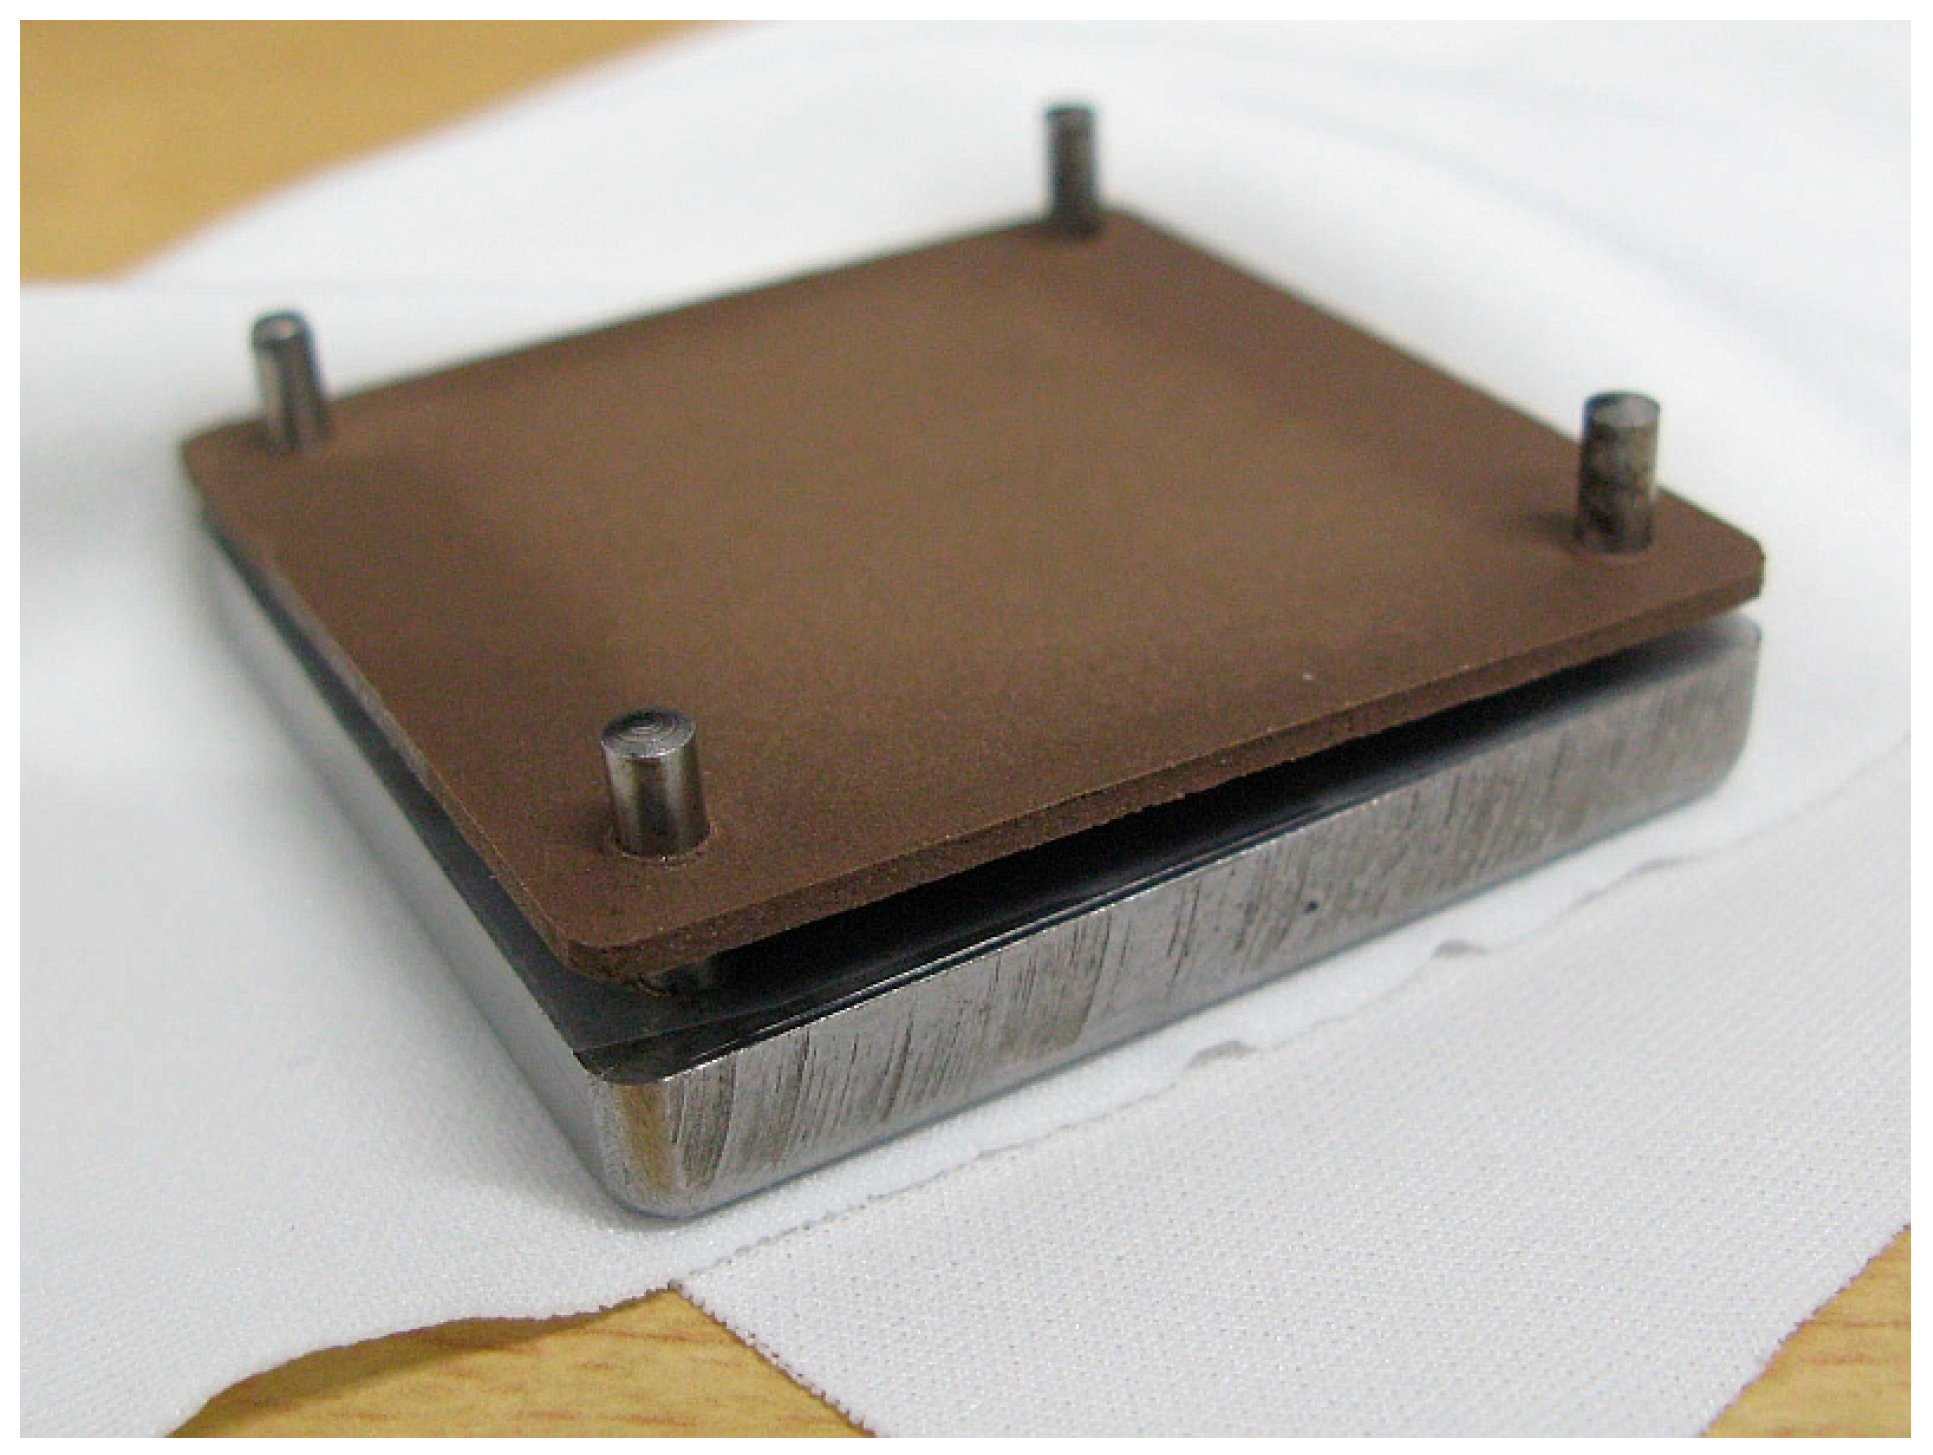
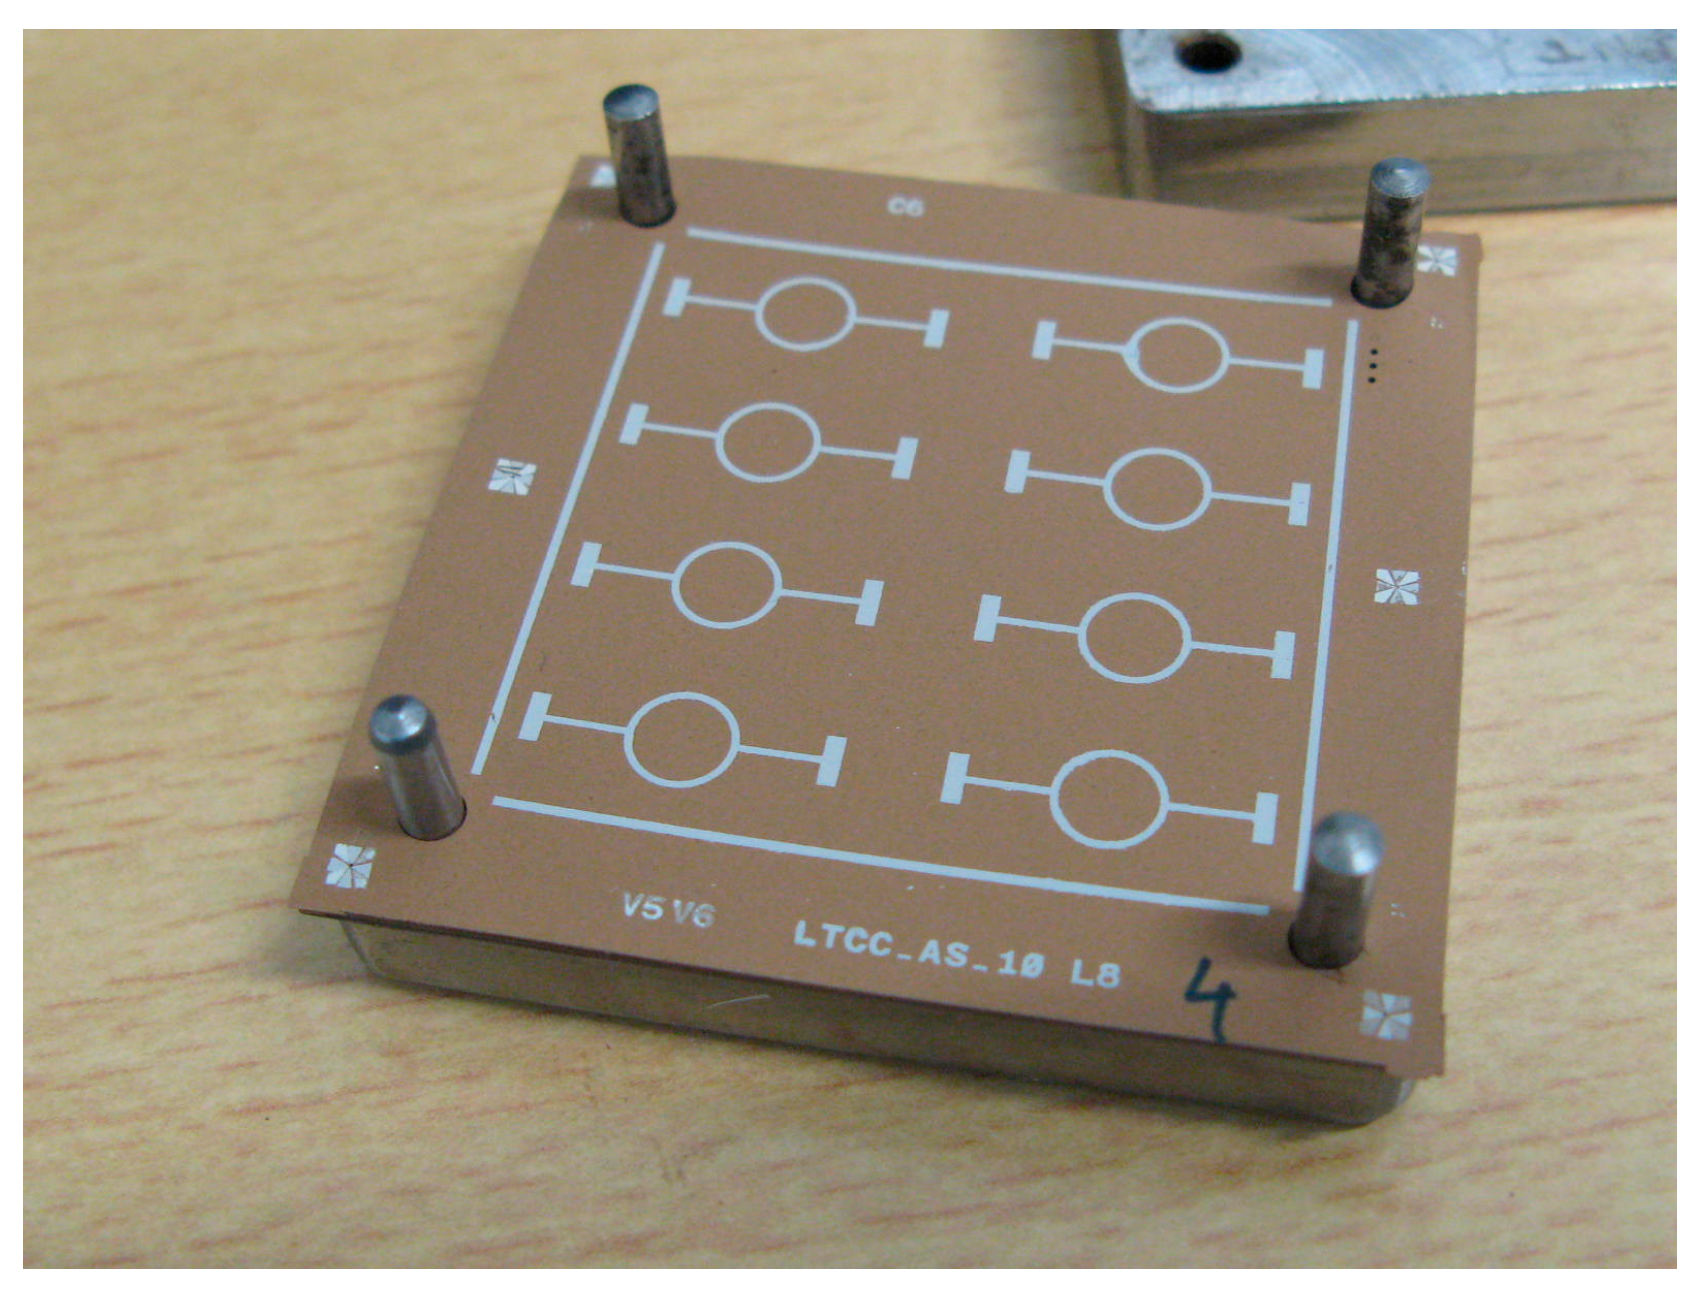
After stacking (
Figure 9), a lamination nonstick film was placed on the tape before closing the fixture with the top plate. The unit, placed in a vacuum-sealed bag, was isostatically laminated before firing.
Before measurement, laser ablation was carried out to create the openings in the coplanar probe pads and the coupling gap between the ring and the microstrip transmission lines; see
Figure 10. The created gaps are 30 µm wide, which is too small for screen printing and why this operation is necessary to create the resonators. The laser ablation not only opened up the metal but also created a certain groove depth in the ceramic structure.
S-parameter measurements were performed using the 67 GHz VNA (Rohde & Schwartz, Gmbh, Munchen, Germany) together with 150 µm pitch GSG probes (67A-GSG-150-EDP from GGB Industries Inc. Naples, FL, USA). SOLT calibration was performed with the help of a CS5-calibration kit (GGB Industries Inc. Naples, FL, USA), using 0 dBm input power and a 10 MHz step over the 0–30 GHz frequency range, with an averaging factor of 4.
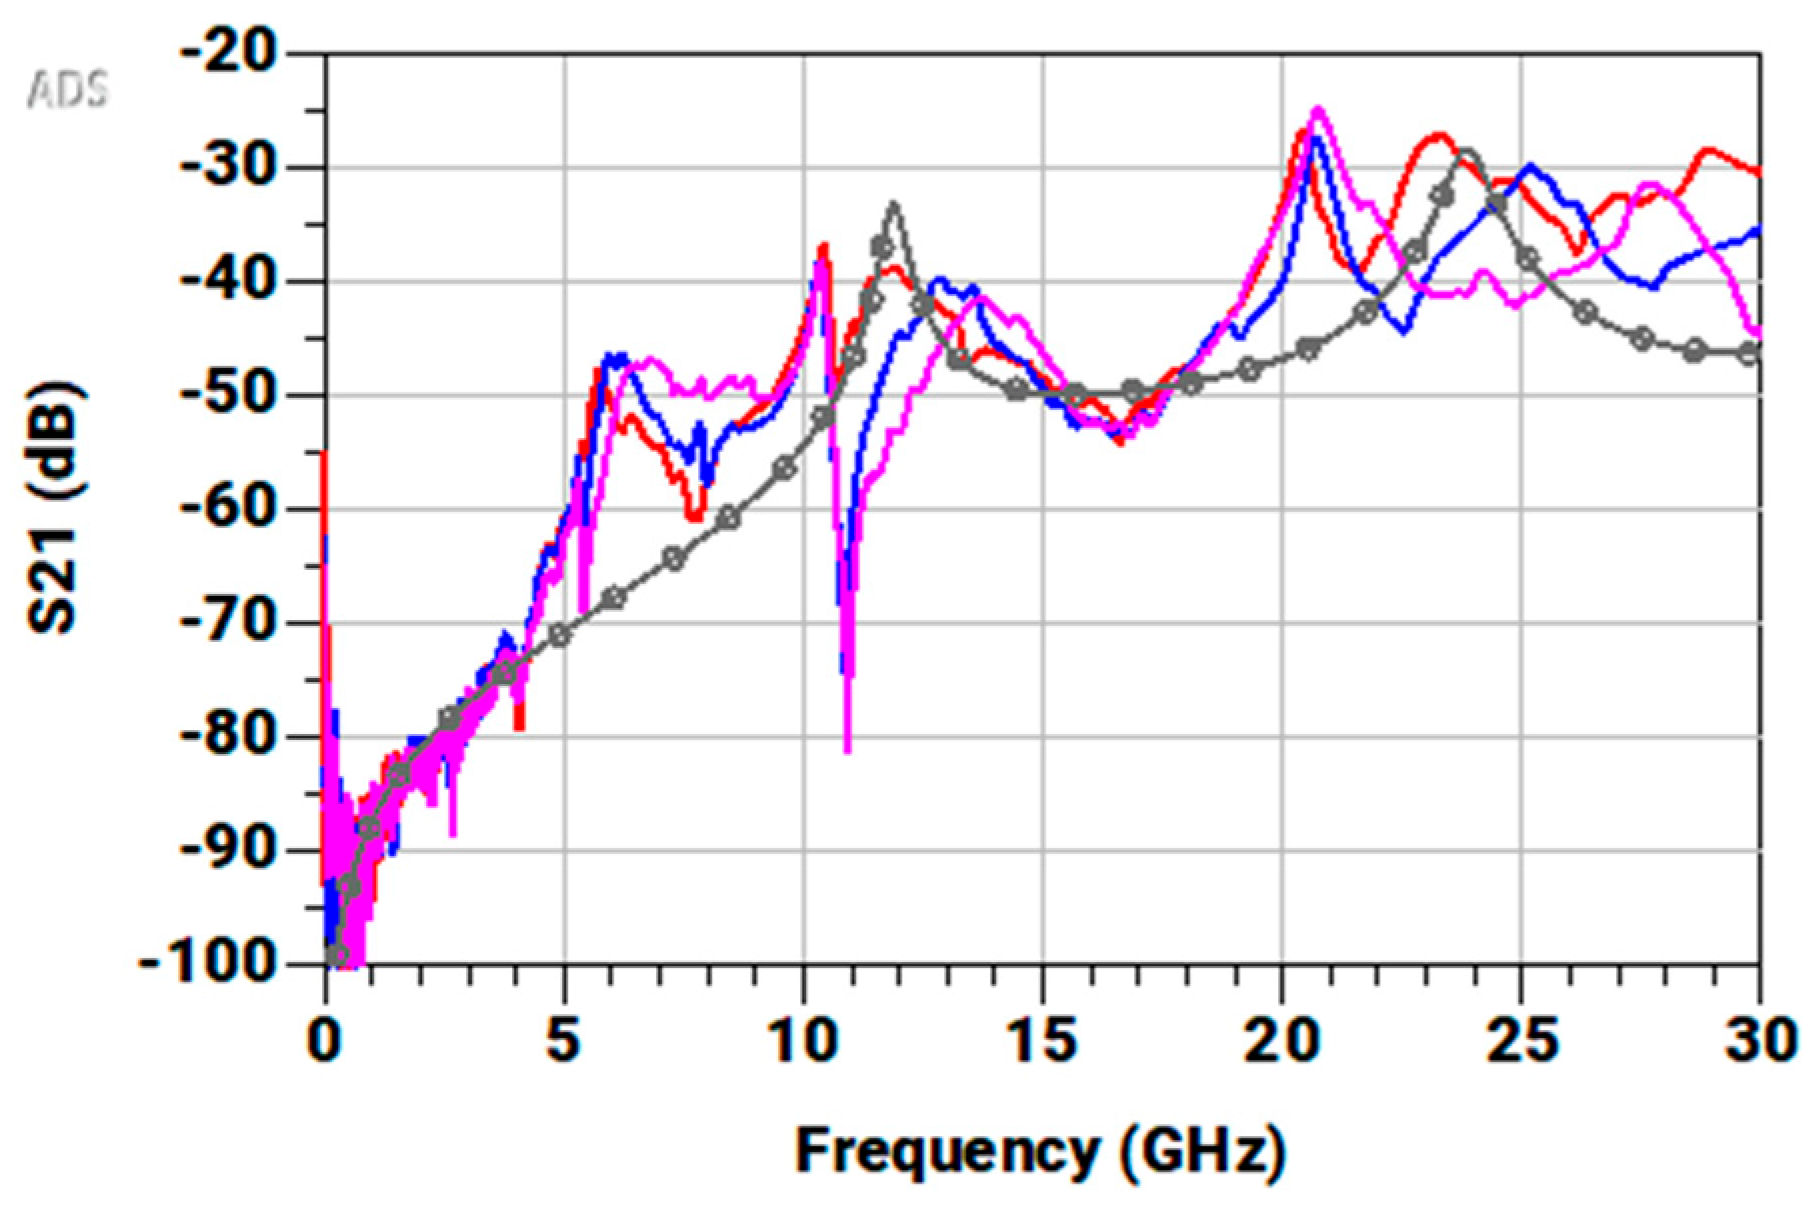
The results of the S21 transmission parameter are presented in
Figure 11 together with retro-simulation results. Retro-simulation means creating an electromagnetic simulation correcting dimensional values for what is obtained after firing and tuning relative permittivity and loss tangent until a descent match between simulation results and the measured ones is obtained. The resonant peaks are not very clear from the measurements but are good enough to match quite well with the simulation results where the relative permittivity is set to 4.0. From the retro-simulation, we can also estimate the loss tangent to be approximately 0.03. This value is high compared to commercial LTCC materials and excludes it in its present state from being used for any industrial product.
4. Discussion
This work presents the very first results of a bio-sourced LTCC material created from slate and Saint Jacques shells. The material mix and fabrication procedure led to a ceramic material with some interesting and encouraging features. Slurry preparation and tape casting based on an aqueous solvent was successful, and the obtained tapes were easily processed with standard LTCC fabrication procedures. Compared to the A6M-E material, the tensile break force is low, while the elongation is higher. Even if the break force is low, the tapes were easily handled and required no additional care as compared to commercial materials. Lamination using a standard profile in an isostatic press worked very well. The surface roughness is indeed high, and the grains are visible at 50X visual inspection. This suggests that the grinding of the powder did not diminish the individual grains enough, something that should be better controlled in a future run. The shrinkage of only 6% in a lateral direction is less than the A6M-E material even though a vertical shrinkage of 27% is normal. The small lateral shrinkage may suggest that full densification did not take place during firing. An enlarged study of the sintering profile and thermogravimetric analysis would enhance the information to improve the densification.
Comparing it with the expected relative permittivity of 3.63 calculated from the compounds comprising the material, the relative permittivity value of 4.3 obtained using the two-line method falls within the same range. This value is lower than most available LTCC tape materials, which is advantageous for high-frequency devices given that the dimensions of transmission lines can be relaxed, as the guided wavelength scales with the inversed square root of the effective permittivity. On the other hand, the losses seem to be high, with a tan δ of 0.03, which makes this material, in its present form, undesirable for high-frequency devices where dielectric loss should be minimized. Nevertheless, this fact does not exclude the possibility of using this material in other applications. The high losses suggest that the material contains a large vitreous phase and is porous and inhomogeneous in structure. The B2O3 is known to form a vitreous phase, which will increase the relaxation losses, while CaO and MgO tend to modify the structure to create vacancies, interstitials and point defects that favor ionic mobility, which in turn increases the losses.
Even so, the outcome of this first attempt to create a bio-sourced LTCC material based on aqueous tape casting is quite positive, even if there are several improvements to be made.
On the positive side:
The chosen bio-sourced materials result in a ceramic material;
Aqueous tape casting has been developed with correct results;
Laser-cutting procedure work well;
Screen printing with commercial LTCC silver paste worked out fine;
The tape withstands isostatic lamination using standard parameters;
The tensile force and elongation values for the green tape are correct;
Sintering resulted in flat prototype samples with limited shrinkage;
A low relative permittivity is obtained.
On the negative side:
The material seems to be vitreous and porous;
The surface roughness is high;
The loss tangent is high.
From these results, it may be worth leaving out or at least diminishing the amount of boron trioxide in a future powder creation. The visual inspection and roughness measurement indicates that the grain size is large, which is why the planetary ball mill procedure should be prolonged and better supervised; possibly wet milling would enable a smaller grain size. To better understand the material, grain-size control, EDX final material composition, thermogravimetric analysis, flexibility, elongation, thermal conductivity and relative permittivity measurements at different frequencies may be useful for the next run. Different mixes of the two main components may also be helpful. Further efforts will also focus on developing a fully bio-sourced material including the slurry constituents.