Article

The Influence of Parameters on Surface Properties and the Optimization of HVOF-Sprayed NiCr/WC-Co Coatings

College of Arts and Design, Jimei University, 185 Yinjiang Rd., Jimei District, Xiamen 361021, China
*
Author to whom correspondence should be addressed.
Ceramics 2026, 9(5), 51; https://doi.org/10.3390/ceramics9050051

Submission received: 8 April 2026 / Revised: 13 May 2026 / Accepted: 15 May 2026 / Published: 17 May 2026

Abstract

This study centred on the parametric optimisation and performance prediction of NiCr/WC-Co coatings produced by high-velocity oxygen fuel (HVOF) spraying. An L18 orthogonal experimental design based on the Taguchi method and the response surface method (RSM) was adopted to examine how key process parameters affect the microstructure, phase composition and hardness of the coatings. The results revealed that analysis of variance (ANOVA) indicated that travel speed, methane flow rate, powder feed rate, and stand-off distance were the primary parameters affecting coating hardness, collectively accounting for 76.25% of the total variance. Also, the RSM model established in this study demonstrates remarkably high predictive accuracy, with a coefficient of determination (R2) of 0.985 and an average prediction error of just 1.16%. Verification experiments were also conducted under optimal conditions. The measured hardness was 1352.7 ± 75 HV, in close agreement with the predicted value of 1365 HV. The coating, which was applied using HVOF spraying, had a dense layered structure and low porosity, and the decarburisation of the tungsten carbide was extremely minimal. In addition, interfacial bonding is improved and structural defects are reduced by the addition of a NiCr intermediate layer. It is demonstrated by the results that the Taguchi-RSM method is reliable for the optimization of HVOF spraying parameters and the prediction of coating hardness.

1. Introduction

Thermal spraying technology is a vital part of surface engineering. It can impart various functional properties to component surfaces, such as wear resistance, corrosion resistance, high-temperature resistance, oxidation resistance, electrical conductivity, electrical insulation and self-lubrication [1]. Consequently, it improves product quality and reliability, extends service life and plays an increasingly important role in remanufacturing for industrial components [2,3]. This technology encompasses various processes, including flame spraying, detonation spraying, high-velocity oxy-fuel (HVOF) spraying, arc spraying, plasma spraying and laser spraying [4,5,6]. HVOF spraying is a high-performance thermal spraying process that markedly improves the bonding strength, density and hardness of coatings, and reduces or even eliminates internal oxide content [7,8,9]. Its outstanding cooling rate (103–1010 K/s) is far superior to that of conventional casting (less than 102 K/s) [10]. Due to these unique cooling conditions, undercooling and non-equilibrium phase transformations are induced, which suppresses equilibrium phases and promotes metastable phases, nanostructures and amorphous phases. This results in a refined microstructure and outstanding properties [11]. The microstructure of the aforementioned type confers excellent mechanical, physical, and chemical properties on the material surface, including enhanced hardness, strength, and corrosion resistance [12]. Therefore, HVOF spraying technology can be used to achieve various coating functions on surfaces, such as wear resistance, corrosion resistance, thermal insulation, and electrical insulation [13,14]. However, HVOF coatings offer superior bonding strength and a higher density than those achieved with conventional flame coating techniques. Recent reports have shown how HVOF spraying technology can create protective coatings that can withstand harsh environments by putting ceramic, metal, and composite coatings on surfaces, thereby improving how well low-grade materials work [15,16,17]. Tungsten carbide composite coatings (WC/10Ni, WC/10Co, and WC/10Co4Cr) in particular have been found to exhibit exceptional wear and corrosion resistance [18]. This preserves the wear resistance of WC and produces highly durable, wear-resistant coatings for a variety of industrial applications [19,20,21]. Extensive studies have been conducted to characterise the thermal conductivity, hardness, wear resistance and other key properties of HVOF -sprayed WC-Co coatings [22,23,24]. As described in the above literature, the properties of coatings prepared by HVOF spraying are already well understood. However, the majority of studies on HVOF-sprayed WC-Co coatings have centred on their mechanical properties, while models correlating parameters with performance have received little attention [25,26,27,28]. As a result, it is still unclear which parameters are the most useful for predicting the best coatings [29,30,31,32,33,34]. The process and variability of its parameters make developing multivariate response models extremely challenging for HVOF-deposited WC-Co coatings. In any case, it is widely recognised that the model of mechanical behaviour of HVOF-sprayed WC-Co coatings is not fully understood [35,36]. This has limited their widespread application in industrial environments. Consequently, there is an urgent necessity for the industry to develop new methodologies for HVOF deposits that can satisfy highly diverse functional requirements.
RSM consists of a group of techniques used in the empirical study of the relationship between a response and several input variables. Recently, many studies on response surface methodology in thermal barrier coatings have been undertaken. Lin et al. conducted a factorial experiment employing response surface methodology to investigate the feasibility of using partially stabilised zirconia coatings by plasma spraying. The study employed a quadratic response surface model combined with a proposed two-stage design strategy. Several response plots were generated in the optimisation model to examine the effects of various parameters on the hardness distribution of the coatings [37,38,39]. The erosion behaviour of HVOF-sprayed VC-TiC coatings was investigated by Singh et al. An empirical relationship between parameters and erosion-induced mass loss was established using the response surface method (RSM) in combination with a face-centred composite design. They also performed mathematical modelling and optimised the performance of the erosion resistance of the coating [40]. Vignesh et al. conducted 32 experimental trials and used response surface methodology (RSM) to optimise HVOF spraying parameters. They constructed empirical regression models to maximise hardness and minimise porosity in iron-based amorphous coatings [41,42]. Rannetbauer et al. used statistical experimental design to evaluate the performance of six models in predicting the properties of HVOF coatings. An innovative modelling framework that combines statistical experimental design with linear models was proposed. This approach can accurately elucidate the relationship between HVOF process parameters and coating deposition rates [43,44,45]. As demonstrated by the application examples cited in the literature, RSM is a powerful tool in engineering, science, and industry due to its versatility and flexibility in optimization processes [46,47]. However, the industry has adopted the RSM method, which has led to the addressing of issues such as multi-parameter optimization, nonlinear modelling, and the prediction of process and product performance [48,49,50]. Although researchers widely use it in fields such as biomedicine, environmental engineering, food processing and agricultural science, they still limit its application in the field of high-velocity oxygen fuel (HVOF) spraying [51]. Accordingly, this paper puts forward a statistical method based on RSM and Taguchi design to more effectively address the mechanical properties of WC-Co coatings produced by HVOF spraying.
In this study, we applied RSM to develop a suitable approximation of the true functional relationship between the independent and response variables, which could help to characterise the nature of the coatings. Also, this work focused on exploring the microstructural evolution, phase constitution and microhardness of WC/Co with NiCr additives, as well as the surface properties of the coatings. In addition, the study employed graphical methods to analyze the response of the HVOF coating process, which helps predict the coating hardness at any location within the experimental area.

2. Experiments and Design

2.1. Materials and Preparation

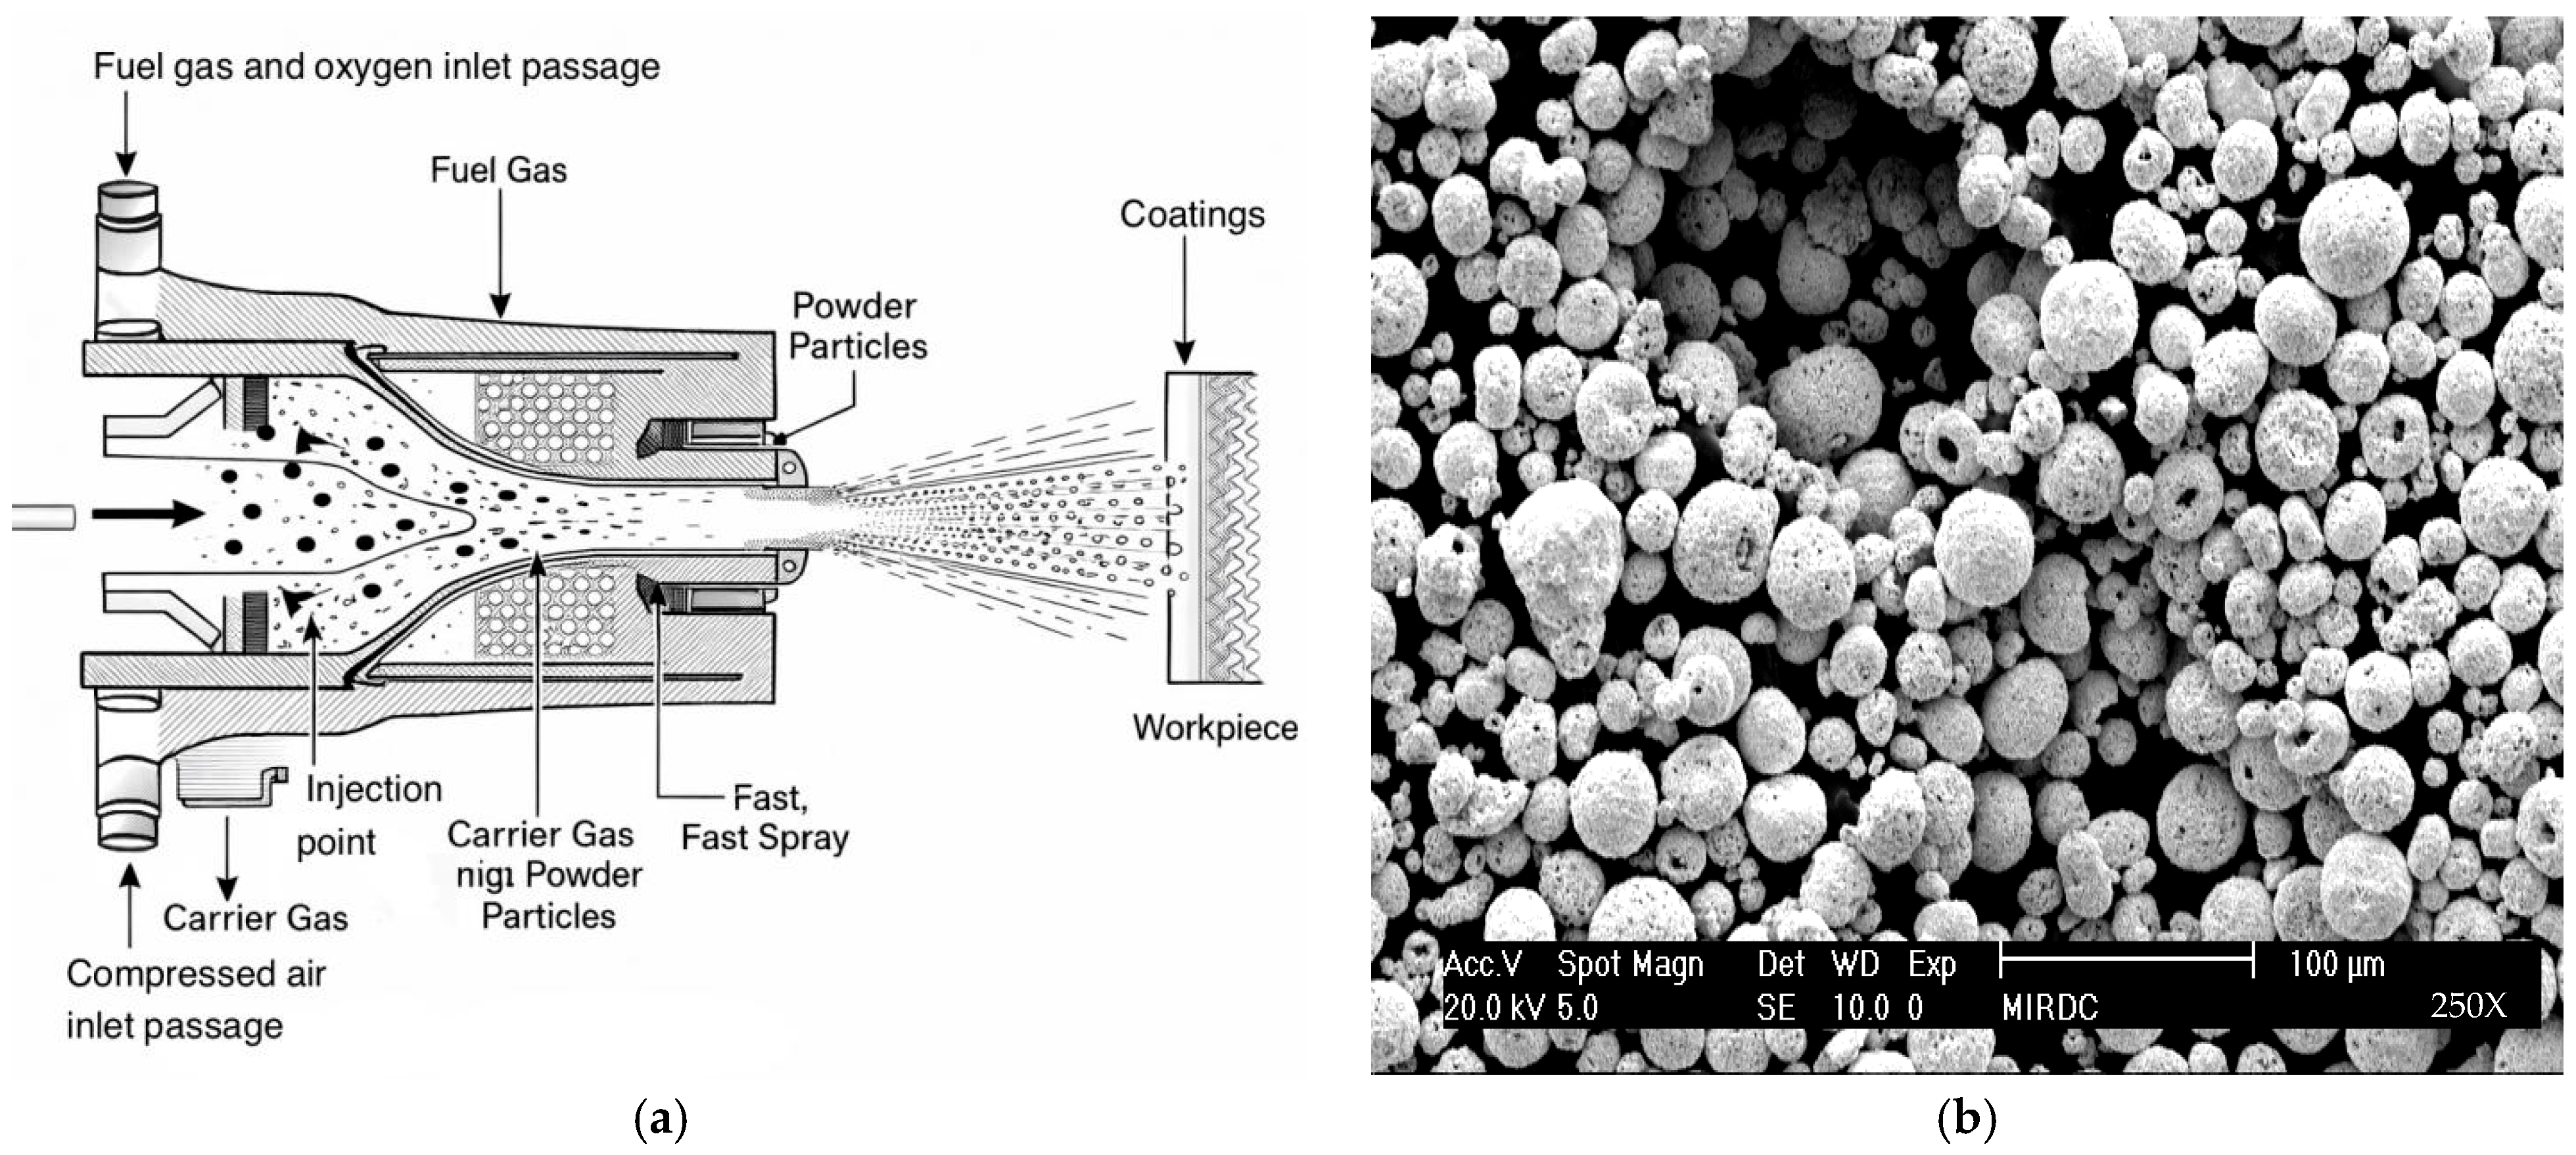
In this study, a technique called high-velocity oxygen-fuel (HVOF) spraying was used to prepare a NiCr interface layer and a WC/Co coating. The spraying of WC/Co powders was done using an HVOF system (DJ gun, Sulzer-Metco Inc., Houston, TX, USA). The schematic diagram of the HVOF gun in Figure 1a illustrates how HVOF works and the flow paths of the gas and powder. The experiment involved using a WC/Co coatings and NiCr blinders, which were carried by a carrier gas and injected into a supersonic flame stream at the injection point. It is quickly heated to a semi-liquid or liquid state in the flame, where it goes very fast to hit the surface of the workpiece. This makes the plastic change shape, which makes a thin, flat film that quickly becomes hard, and sticks to the surface. The result of this layer-by-layer process is high-hardness, wear-resistant coatings that are characterised by high density, good bond strength and low porosity. Figure 1b shows the SEM morphology of the thermally sprayed WC-Co powder at 250× magnification. The powder particles are predominantly spherical, with sizes falling within the range of about 10 μm to 80 μm. The high sphericity ensures good flowability during powder feeding. The materials used in this study were WC/Co powders containing 7.8% cobalt, 5.3% carbon, and 0.06% iron by weight, which were employed in all L18 experiments. In this study, NiCr powder (Ni balance, Cr 18.9 wt.%, C 0.013 wt.%, Fe 0.064 wt.%, Si 0.83 wt.%, Mn 0.034 wt.%) was used in full factorial experiments, wherein 9 out of 18 test groups served as an interfacial layer between the substrate and the WC/Co coating. The dimensions of the coated substrate are 40 mm × 40 mm × 10 mm, and it is made from ASTM mild-carbon steel. The NiCr/WC-Co coating was deposited onto its surface by HVOF spraying. To ensure surface roughness (Ra) of between 4 and 5 µm, the substrate was sandblasted with aluminium oxide grit and then ultrasonically cleaned with acetone. The microstructure of the coatings was investigated using a Hitachi S-2600H scanning electron microscope (Hitachi, Tokyo, Japan), which included cross-sectional images obtained using an etchant (209 mL HNO3, 3 mL HF and 80 mL water). The hardness profiles of the coatings were measured on the cross-sectional specimens using a Vickers hardness tester with a load of 300 g and a dwell time of 15 s (HVS-1000Z, Huazheng Baoding, Baoding, China). This data represents the average of five readings. It was recorded in the orthogonal experimental array. In addition, the X-ray diffraction (XRD) experiment was carried out using Cu Ka radiation in a Siemens D8A diffractometer (Karlsruhe, Germany) that was operated at 40 kV and 25 mA. The surfaces of the coatings were scanned from 200 to 1000 in steps of 0.05.

2.2. Control Parameters and Their Levels

The Taguchi method uses orthogonal arrays to investigate the entire parameter space using only a fraction of the experiments required for a full factorial design. Using the Taguchi method with these arrays can significantly reduce the time and cost associated with experimental trials [33]. The entire parameter space is explored with only a fraction of the number of experiments required by a full factorial design using orthogonal arrays by the Taguchi method. These arrays provide a set of well-balanced experimental plans that account for multiple design factors simultaneously. Additionally, the signal-to-noise ratio (SNR) was used to evaluate process quality by minimising performance variation. Process parameter selection was based on expert recommendations and the literature [3,35]. A total of eight operating variables were investigated, as detailed in Table 1. With the exception of coating type, which had two levels, all other parameters were tested at three levels. The experiment described in Table 2 used an orthogonal design comprising 18 experiments. It lists the parameters and their respective levels that were used in the experiment. Additionally, it presents the results of hard-facing hardness tests for HVOF-sprayed coatings, including five repeated tests and their respective mean values and standard deviations.

2.3. Building Model

Response surface methodology (RSM) is specifically designed to quantify the functional relationship between the response and multiple variables, while primarily aiming to optimise the response. It is an extremely effective experimental method for determining the optimal operating conditions for multivariate systems [36]. As the hardness properties of HVOF-sprayed coatings are influenced by several factors, a statistical model is proposed as an alternative approach. The response surface method (RSM) was employed to analyse how parameters influence the properties of the hardened layer and predict these properties. The process parameters Xi were normalized to coded variables xi. A Taguchi-based RSM design was used. This is detailed in Table 2. The following standard linear transformation was used:
x i = X i X i 0 Δ X i
The actual value of the ith process parameter (i = 1, 2, …, 4) is denoted by Xi, and the centre (zero-coded) value of the ith parameter is denoted by Xi0. The half-interval of the ith parameter range is denoted by ΔXi. Because of the noise and the complicated system, we do not know what the process parameters and the response are really linked to. As a result, low-order polynomial models are extensively used to estimate this relationship. In this study, a second-order model is used within the experimental domain because it can capture both main and interactive/quadratic effects. The expression of the predicted second-order function is as follows:
Y = β 0 + X T b + X T B X + ε
By minimizing the sum of squared errors, the vector of least-squares estimators, β, is derived, and the regression coefficients are subsequently determined. Furthermore, the fitted regression model, y ^ i , is evaluated, and the least-squares fit of the model is established.
The first-order model is formulated as:
y ^ i = β ^ 0 + i = 1 k β ^ i x i           i = 1,2 , 3 , , n
The second-order model is expressed as:
y ^ i = β ^ 0 + i = 1 k β ^ i x i + i = 1 k β ^ i i x i 2 + i j β ^ i j x i x j ,           i = 1 , 2 , 3 , , n
To optimize the predicted response in Equation (4), the partial derivatives must be set to zero. The resulting point, denoted as x0 = (x10, x20, …, xk0), is defined as the stationary point, which can be classified as a maximum, minimum, or saddle point of the response surface.

2.4. Evaluation of the RSM Model

The predictive results derived from the RSM model have been validated using statistical methods. Also, this was done to evaluate the predictive results of the three models. More specifically, the analysis involved calculating not only the coefficient of determination (R2), but also the root mean square error, (RSME). The coefficient of determination R2 and root mean square error (RSME) are employed to evaluate the predictive performance of the RSM model, defined as:
R 2 = 1 I = 1 n ( S Exp S Pre ) 2 i = 1 n ( S Exp S Pre ¯ ) 2
RSME = 1 M i = 1 M ( S Exp   S Pre ) 2
where SExp denotes the experimental measurement, SPre represents the RSM prediction, and M denotes the number of experiments. The R2 value, which ranges from 0 to 1, indicates the strength of the predictive power of the model in explaining the variation in the data. A lower RSME indicates better agreement between the predicted and experimental results. Furthermore, based on standard statistical criteria, An absolute standardized residual value of less than 2 falls within the acceptable statistical range, indicating that the data point is not an outlier and the model’s prediction error for this point is within normal variation.

3. Experimental Results and Discussion

3.1. Hardness Analysis of Coatings

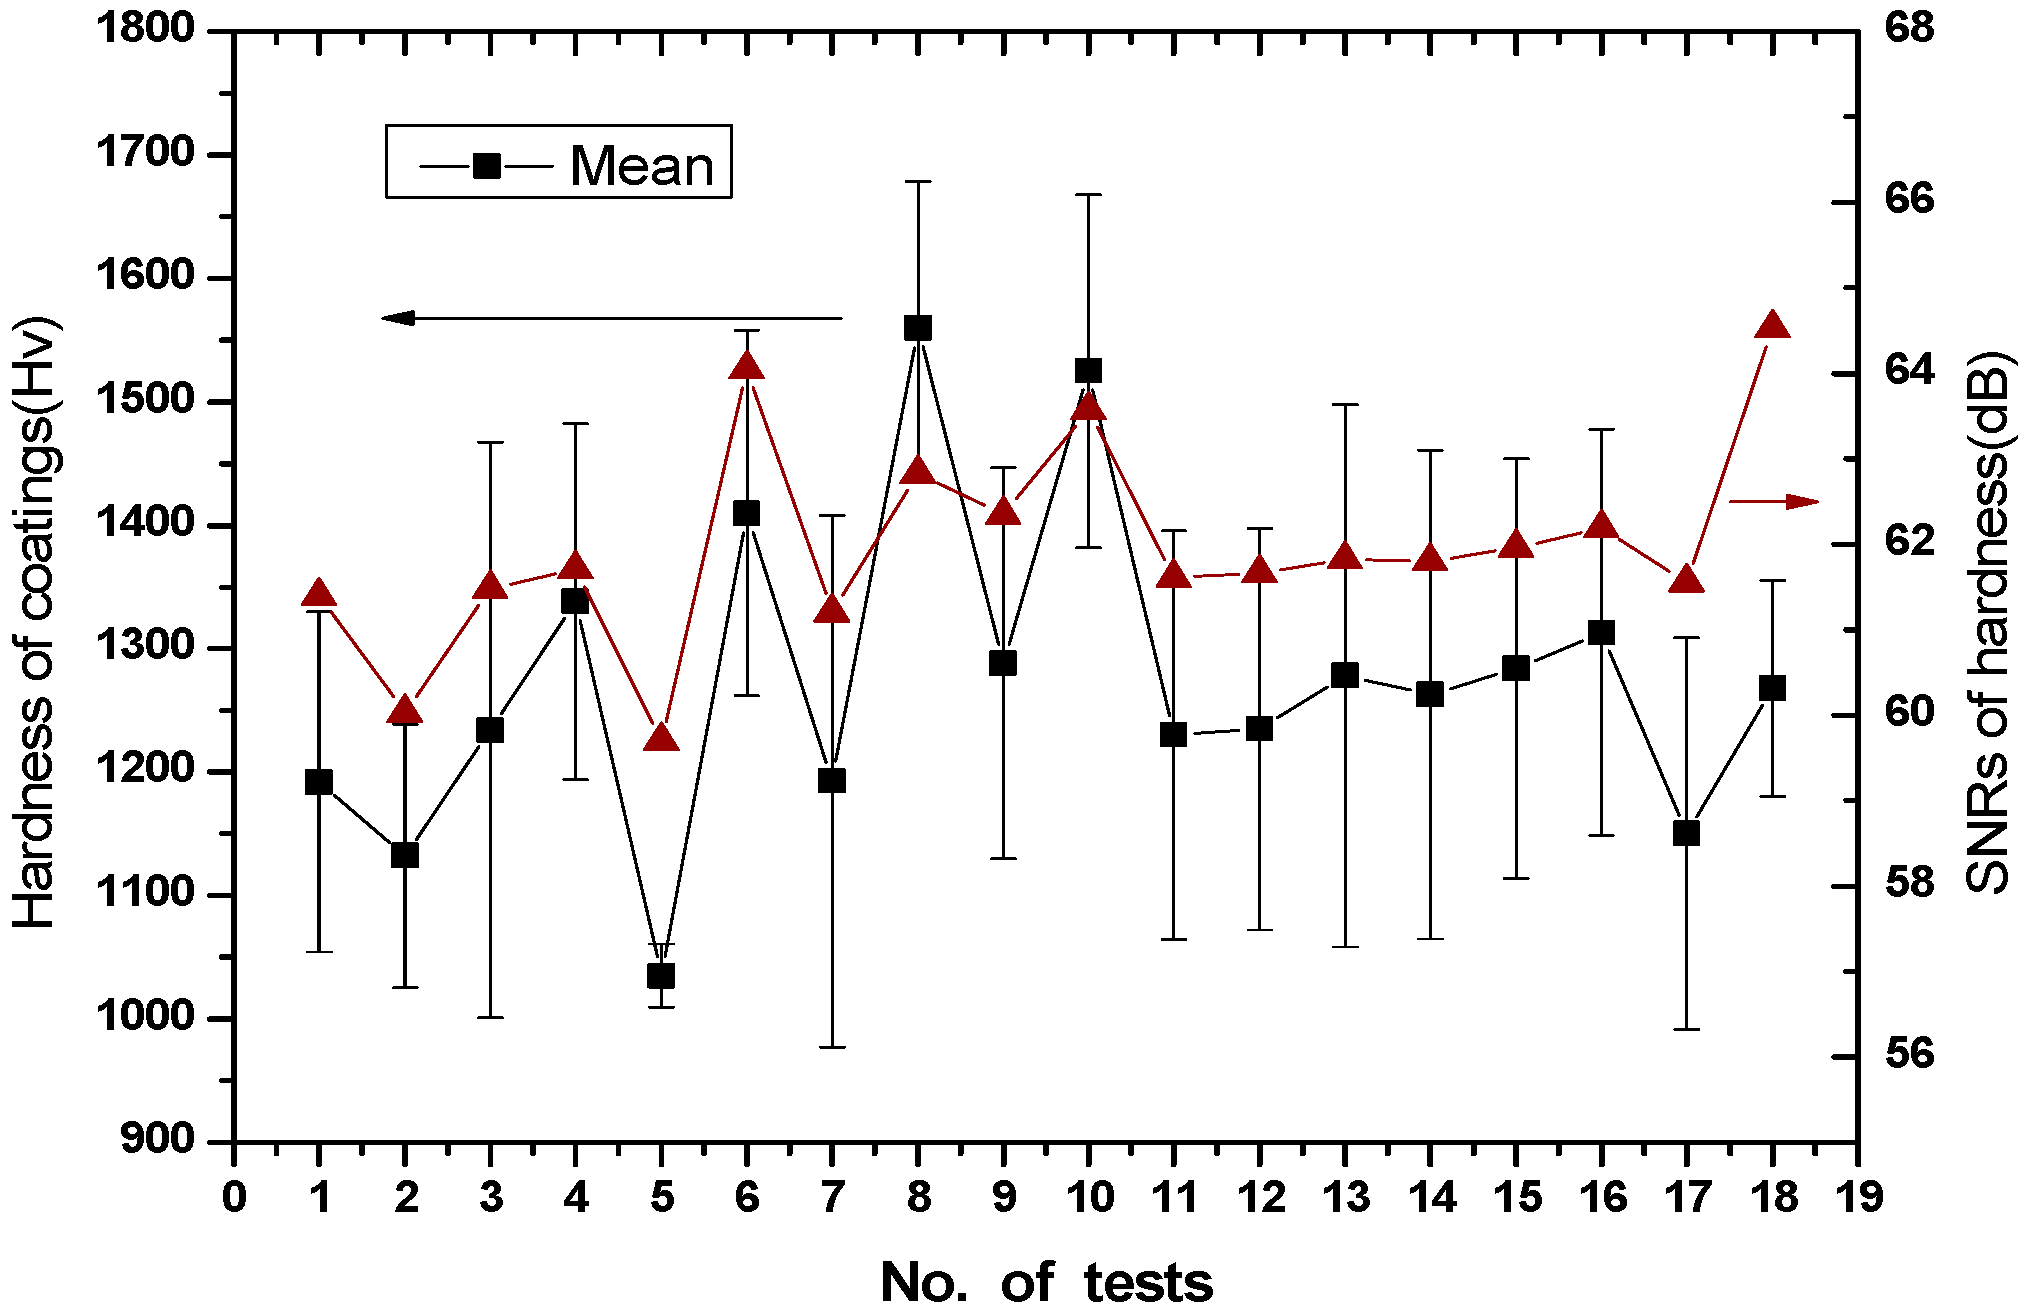
As shown in the cross-section of the coating in Figure 1, the hardness distribution exhibits three distinct regions: the coating, the intermediate layer, and the substrate. This reveals a curve showing how hardness varies with distance from the coating to the substrate. The WC-Co coating zone is characterised by a hardness ranging from 1000 to 1500 HV, classifying it as a high-hardness carbide coating. The layer in the middle is made of NiCr bond coat, which is 450–600 HV hard. This layer holds the other layers together. The substrate is formed by the bottom layer, which is mild steel with a hardness of 200–300 HV. As can be seen from the curve above, hardness decreases progressively with distance from the coating to the substrate. In addition, the hardness values close to the coating surface in the cross-section were obtained by measuring the Vickers hardness indentation. This was achieved by applying a load of 300 g to the area of the coating surface. As shown in Table 2, the experimental results for HVOF-sprayed WC-Co coatings obtained using the L18 orthogonal array are summarised, including eight control factors, five replicate hardness measurements, mean hardness, standard deviation and signal-to-noise ratio (SNR). Mean hardness ranges from 967 HV (test 5) to 1690 HV (test 18), while SNR ranges from 59.70 dB (test 5) to 64.53 dB (test 18). Additionally, Figure 2 shows the mean hardness and signal-to-noise ratio (SNR) of 18 groups of HVOF-sprayed WC-Co coatings, with error bars representing the standard deviation of hardness measurements. The black squares (mean values) represent the average hardness values for each test group, which consists of five replicate tests. The red triangles (SNR) represent the SNR for each test, reflecting the stability and robustness of the measurements. The black vertical bars represent the range of hardness errors, indicating the degree of data dispersion. The correlation between hardness and SNR is shown by the figure. The high SNR group (e.g., Tests 6, 8, 10 and 18) generally corresponds to higher, more consistent hardness values, which indicates good robustness of the process parameters and minimal fluctuations in hardness. By contrast, the low SNR group (e.g., Tests 2, 5 and 17) corresponds to lower hardness values, with greater variability and wider error bars. This indicates unstable process parameters and poor hardness repeatability. The most robust test group was Test 18, which had the highest hardness and the best stability (average hardness ≈ 1270 HV, SNR ≈ 64.5 dB). Test 8 (average hardness ≈ 1550 HV) was the hardest, but with an SNR of ≈ 63 dB, it showed significant dispersion, meaning that parameter optimisation is needed to improve stability. Test 5 (average hardness ≈ 1030 HV, SNR ≈ 59.5 dB) exhibited low hardness and significant fluctuations, which corresponded to an imbalance in process parameters, such as a low methane flow rate and a long spraying distance. However, a microhardness value of 1273 ± 153 HV was obtained from the cross-section of the WC-Co coating produced by HVOF spraying, which is 3 to 4 times the hardness of the substrate. The results indicate that the WC-Co coating produced by HVOF exhibits excellent hardening properties. The findings are presented in Table 2. The average hardness of the WC-Co coating prepared via HVOF spraying without a NiCr interlayer was 1245 ± 143 HV. This value is quite close to the average hardness of 1284 ± 172 HV for the coating with a NiCr interlayer. Furthermore, the hardness values of all HVOF-sprayed WC-Co coating samples without a NiCr interface layer ranged from 97 to 1256 HV, exhibiting marked variability. The high hardness of this coating is due to WC particles fracturing and refining during high-speed impact or rapid solidification. As a result, submicron- to micron-sized, fine-grained WC particles are uniformly embedded in the Co matrix. Not only does this significantly enhance hardness, but the uniform distribution of WC particles also effectively counteracts the work-hardening effect caused by plastic deformation.

3.2. Metallography of HVOF Sprayed NiCr/WC-Co Coatings

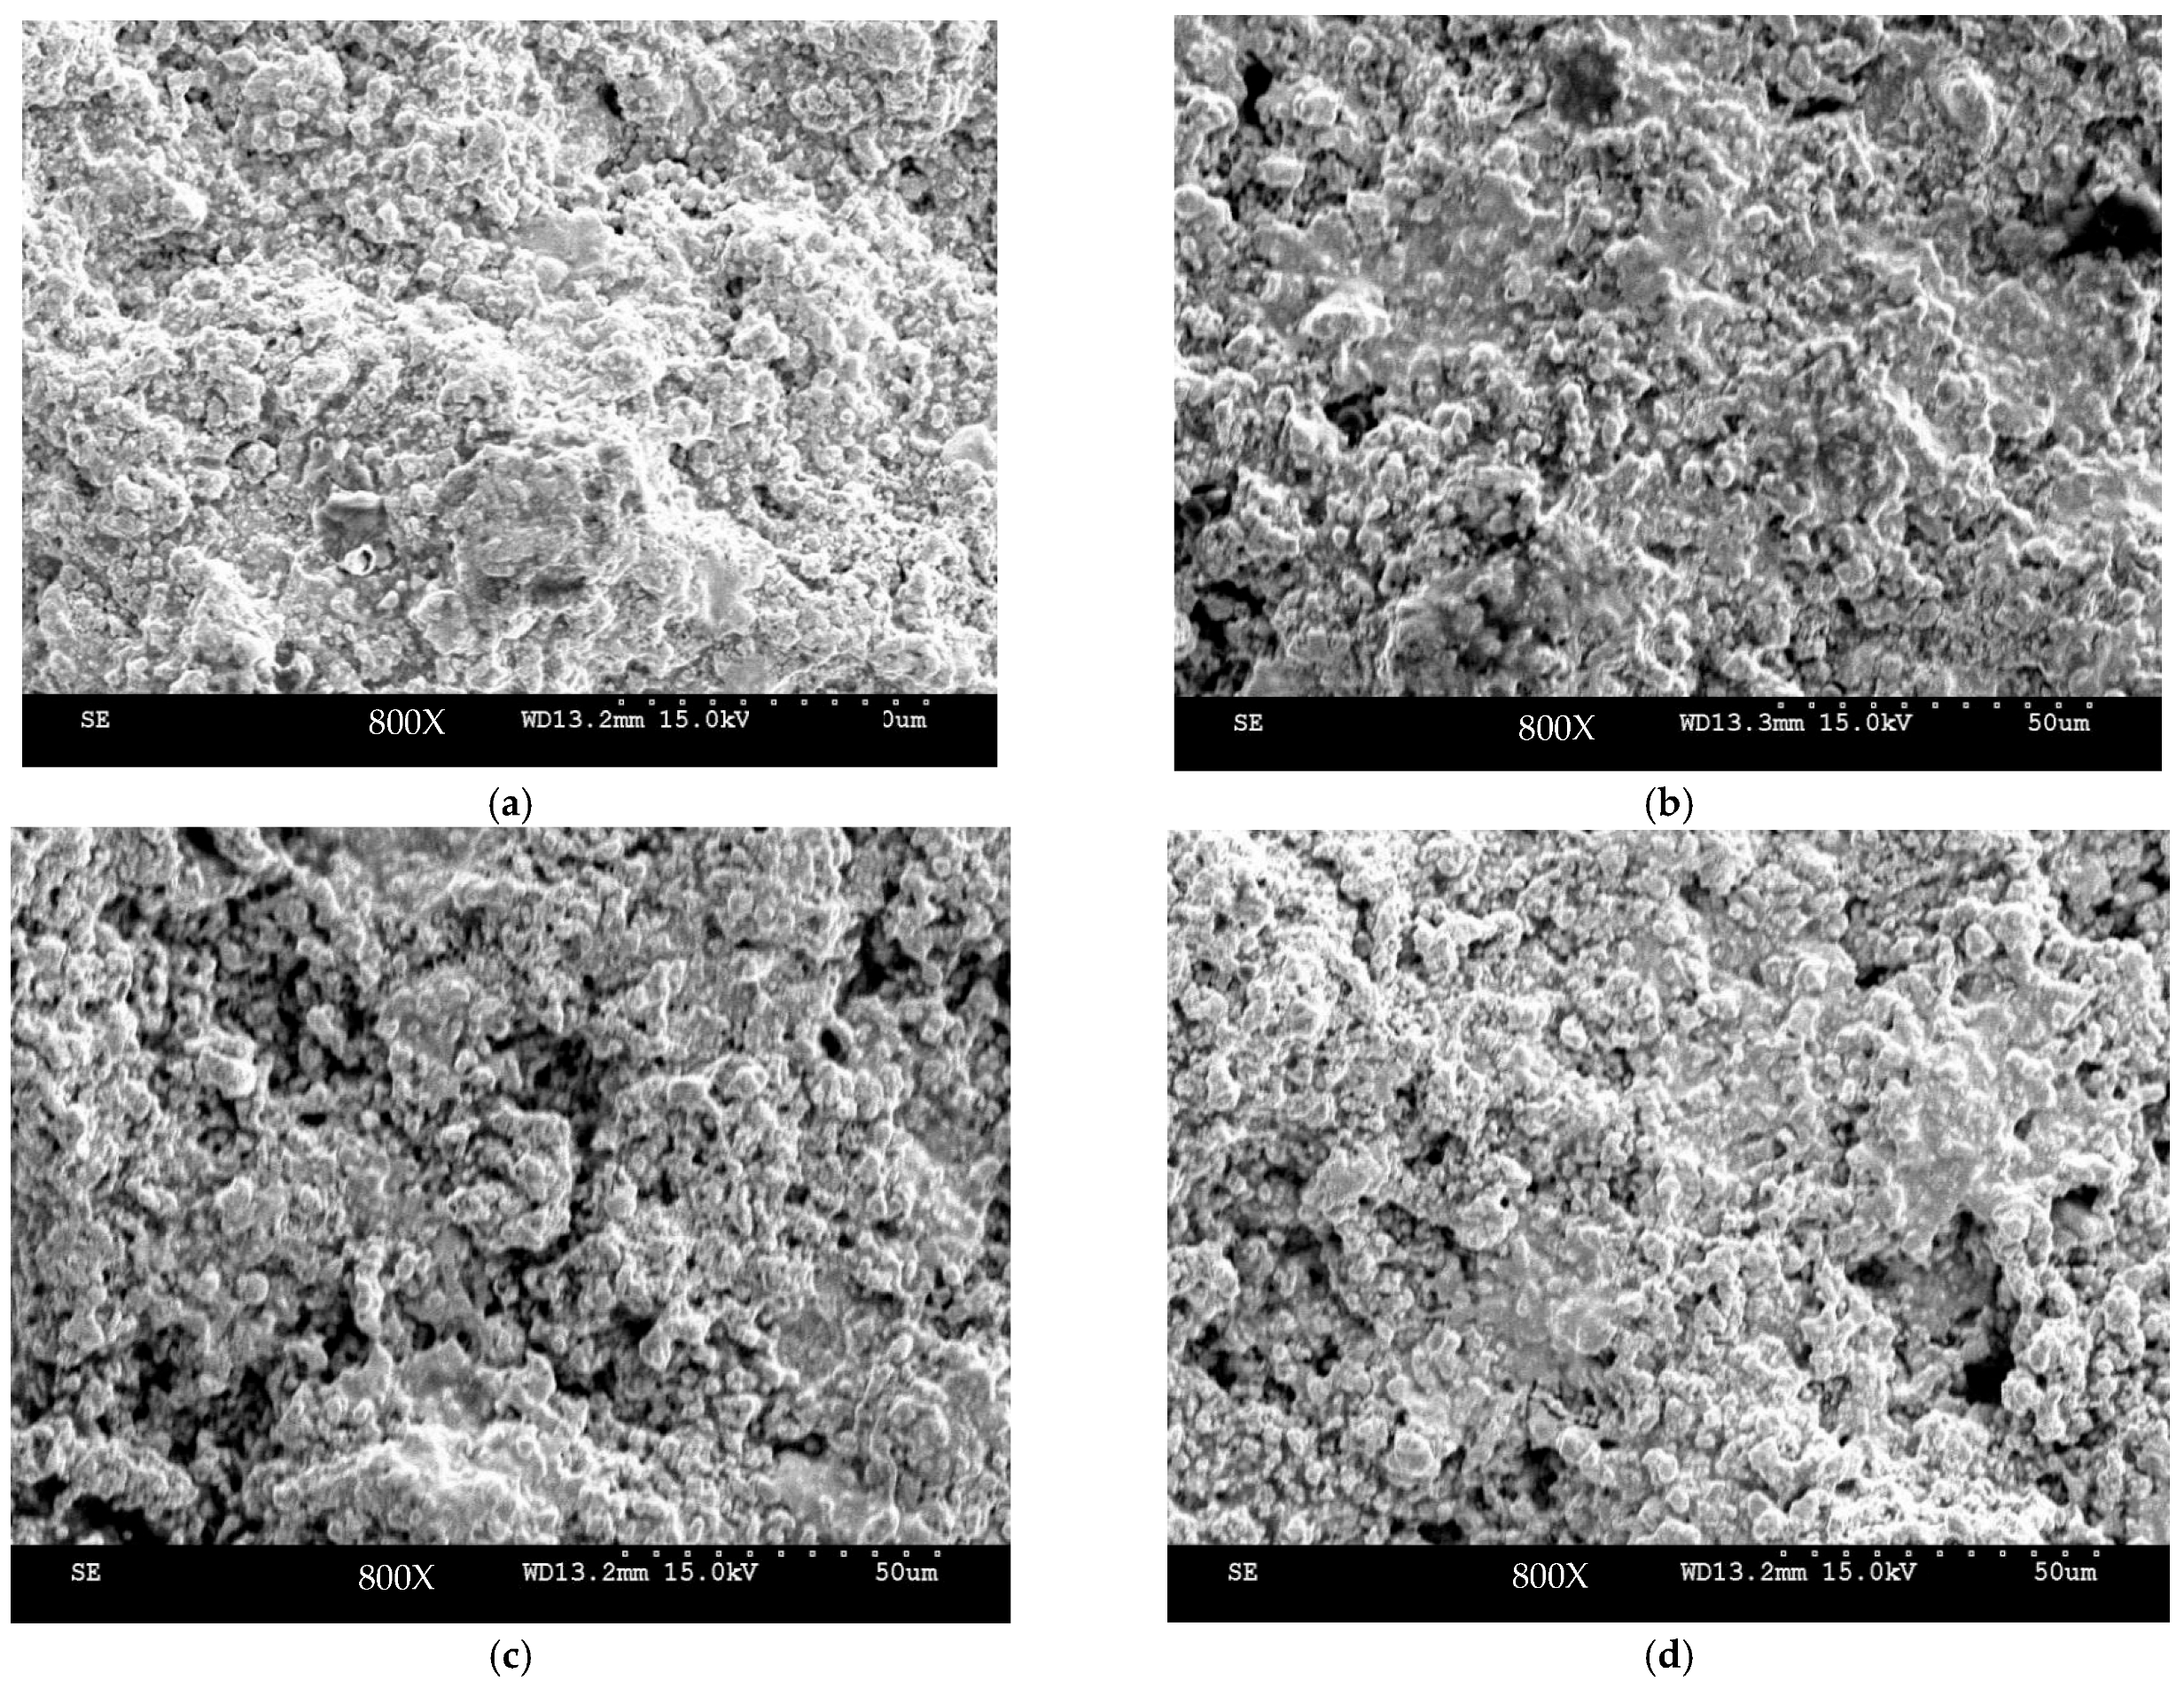
Figure 3a illustrates the typical pattern of granular agglomeration and molten flattening that is characteristic of the coated surface. This surface texture is formed by numerous irregular, cluster-like particles that overlap and weld together. The distribution of particle sizes is broad, with large particles (20–30 μm) coexisting with fine secondary particles (5–10 μm). Locally, there are visible signs of incompletely flattened particles, such as the cluster slightly to the left of centre. This indicates that some of the powder was insufficiently melted in the plasma stream, or that it had limited impact kinetic energy. Figure 3b shows that the coated surface consists of a large number of irregular, cluster-like particles, which have a distribution of sizes ranging from 5 to 30 μm. The particles retain the near-spherical shape of the original powder in some cases, while in others, they exhibit clear signs of flattening and remelting, with smooth edges and intermingling. As can be seen from a comparison of Figure 3a,b, the low porosity of 1.82% ± 0.31% in Figure 3a, combined with complete melting, yields a higher hardness (≥1400 HV). In contrast, the higher porosity of 3.15% ± 0.42% in Figure 3b yields a slightly lower hardness (1100–1300 HV). In addition, the low porosity and uniform particle distribution in Figure 3a can effectively suppress abrasive wear and fatigue spalling. This results in a lower wear rate. In contrast, the porosity and unfused particles in Figure 3b act as crack initiation sites. This leads to a higher wear rate. The wear resistance of the coating is significantly correlated with the hardness values mentioned above. These findings have been discussed and confirmed in many studies [28,31]. A large number of particles are predominantly clustered and spherical in shape, with very little flattening on the coating surface, as shown in Figure 3c. Many particles retain the spherical contours of the original powder and show almost no signs of melting and re-solidification along their edges. This suggests that the powder did not melt sufficiently in the plasma stream and lacked the necessary kinetic energy upon impact with the substrate to flatten adequately. The micrograph reveals a large number of relatively large, micron-scale pores and voids (black areas), with pore sizes ranging from approximately 5 to 15 μm. These pores are widely distributed and interconnected, and the porosity is visually estimated to be between 3% and 5%. The particles pack loosely together, with large clusters and distinct loose regions where unmelted particles can be found. A clustered, semi-molten structure is exhibited by the coating surface in Figure 3d. The edges of some particles are slightly flattened with traces of melting and re-solidification visible. It is indicated by this that a semi-molten state was reached by the powder in the flame jet and that some degree of flattening was undergone upon impact with the substrate; however, a near-spherical shape was retained by some particles, suggesting that the powder did not fully melt. The image reveals a large number of micron-sized pores (black areas), with pore sizes ranging from approximately 2 to 10 μm. These holes are located within the spaces between the layered particles, and the porosity is visually estimated to be around 2–3%. None of the pores is large or interconnected. Most of the structure of coatings is stacked quite densely, and the gaps between clusters are visible, but they do not form extensive networks. Also, there is a small number of unmelted particles that are found in localised areas. A comparison of Figure 3c,d shows that, in Figure 3c, the particles have hardly flattened at all, with much of the original powder’s spherical shape being retained. There are almost no signs of melting or recrystallisation between agglomerates, and the proportion of unmelted particles is extremely high. On the other hand, Figure 3d shows that the structure of the grains exhibits a certain degree of flattening. Traces of melting and deformation are visible along the edges of some grains, and there is slight bonding between clusters. The proportion of unmelted particles is significantly lower than in Figure 3c. As discussed above, it is evident that the denser the structure, the more completely the particles melt and the fewer pores there are. This results in higher hardness and better wear resistance [22]. Conversely, there is a significant decrease in hardness and an increase in wear when there are many unmelted particles, numerous pores and a loose structure. To sum up, the microstructure of the coating is closely linked to its hardness and wear resistance.

3.3. Structure of Cross-Section for HVOF Sprayed NiCr/WC-Co Coatings

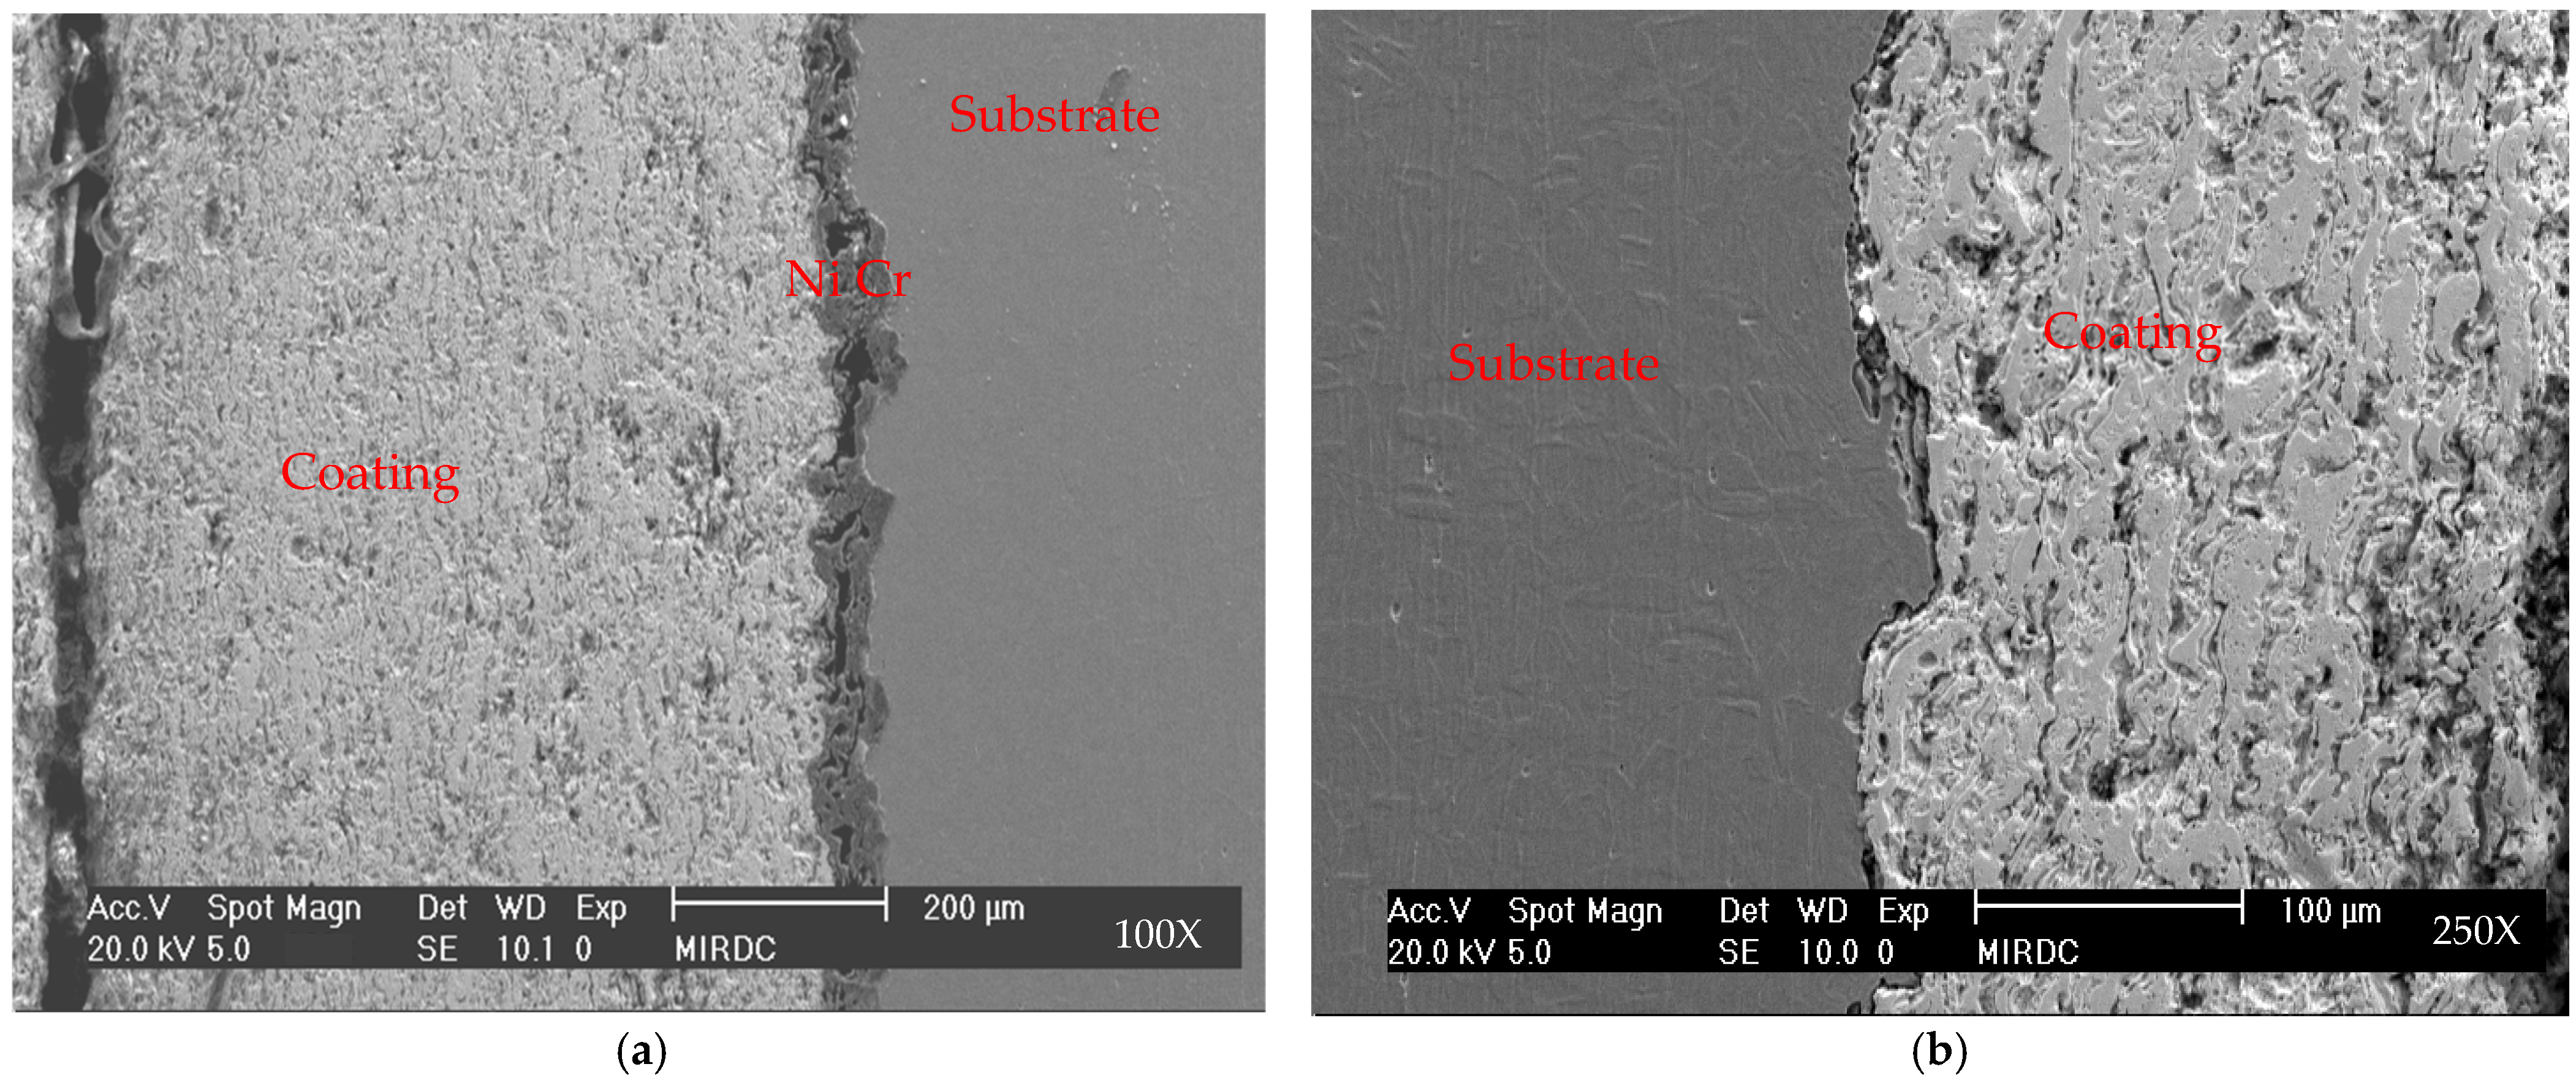
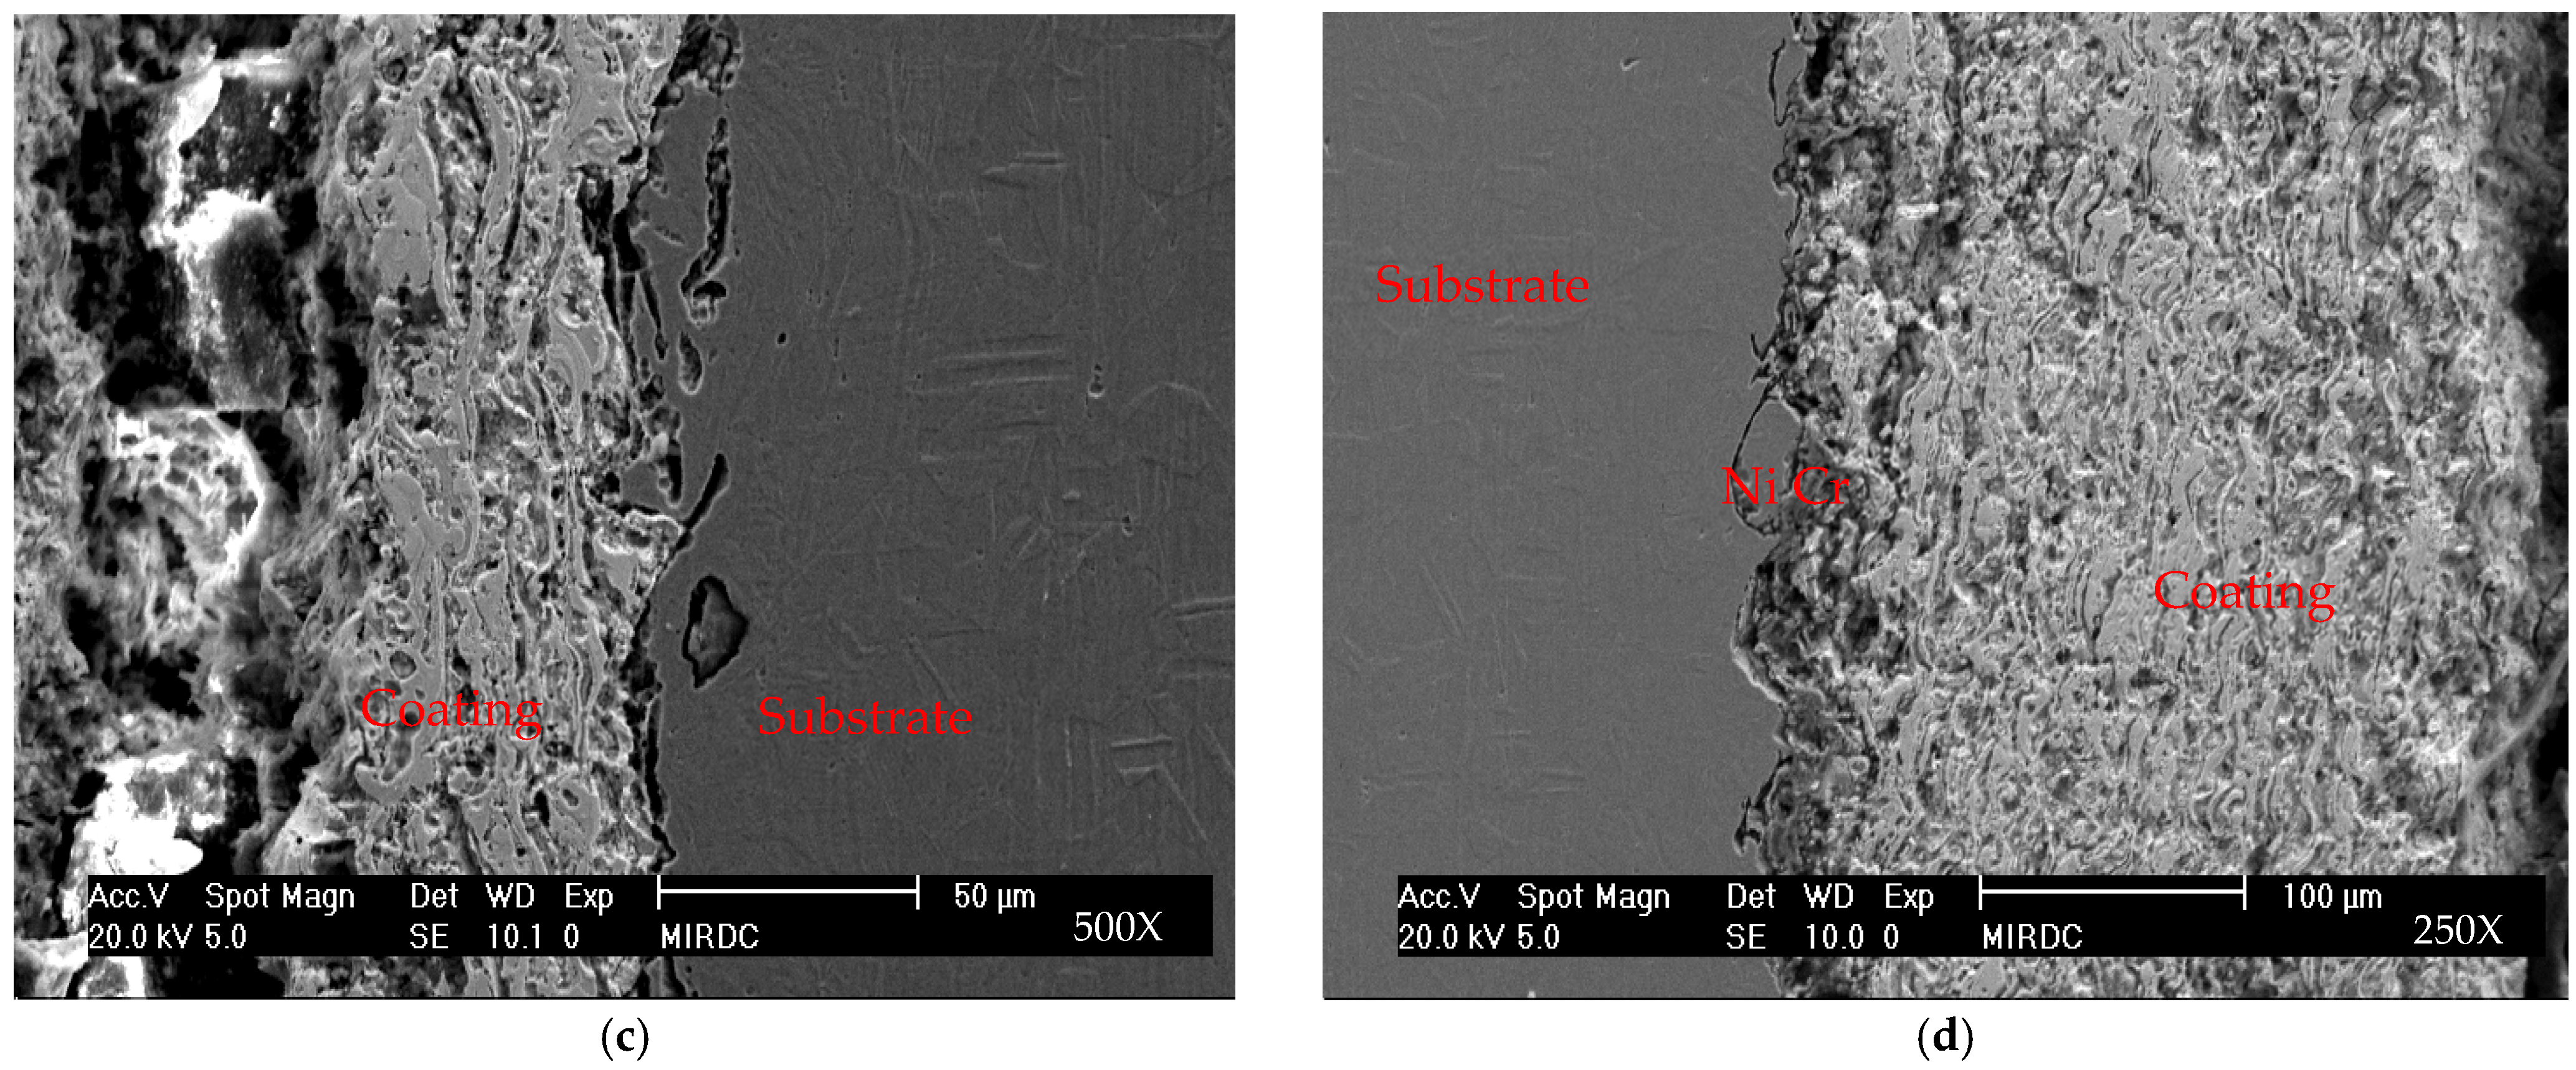
Figure 4 shows a cross-sectional image taken by SEM of a WC-Co-based thermal spray coating that has been etched. The image clearly reveals that the cobalt (Co) binder phase has been preferentially etched away, which has exposed the tungsten carbide (WC) hard phase along with the microstructure of the coating. As shown in Figure 4a, the cross-sectional morphology of the coating consists of flat, semi-molten particles that are tightly stacked together with smooth, clearly visible interlayers. The NiCr layer may be approximately 80 μm thick in localized areas, while the WC-Co layer is approximately 480 μm thick. The dark black region in the middle layer contains a molten NiCr structure that has fused with the dense WC-Co matrix, which is free from micro-pores, cracks and unmelted regions. The NiCr layer acts as a buffer to reduce thermal stress. No significant pores or unfused zones were observed within the layered stacking structure. As can be seen in Figure 4b, the cross-sectional morphology of the coating consists of tightly stacked layers of fused cobalt (Co) and partially fused tungsten carbide (WC) particles, with a surface undulation of 10–30 μm. The plate-like features measure approximately 5–20 μm in thickness and 20–50 μm in length and are oriented along the direction of spraying. The pores, ranging from approximately 0.5 to 5 μm in size, are distributed between layers, at particle boundaries, and in localized unfused regions, and their shapes are predominantly circular or irregular. The WC-Co layer, measuring 250–300 μm in thickness, consists of fused WC lamellar grains, along with microstructures such as corrosion pores, cracks, and Co fusion structures. The coating surface displays a morphology defined by a multitude of holes, depressions and fractured particles that are layered on top of each other. Voids and pores are present at the interface between the coating and the substrate, and the primary bonding mechanism is mechanical interlocking with no metallurgical bonding. This contributes to enhance density, hardness and bond strength of the coating. The cross-sectional morphology of the coating, as shown in Figure 4c, consists of layers of heavily fused cobalt (Co) and partially fused tungsten carbide (WC) particles stacked on top of each other, with distinct interlayer boundaries clearly visible. The WC-Co layer, which is approximately 50 μm thick, contains partially unfused WC lamellar grains, as well as microstructures such as etching pores, cracks, and fusion formations. The coating surface exhibits a morphology characterised by numerous pores, depressions and fractured particles in a stacked arrangement. The interface of the coating is uneven and irregular, with cracks in the substrate caused by impact, as well as localised gaps and unbound regions, present. Such features are typical of mechanical bonding. After etching treatment, this area reveals micro-pores, cracks and unfused interfaces more clearly. All of these features reflect the brittle fracture of the substrate, which is caused by high-speed particles of unmelted powder that impact the substrate. As shown in Figure 4d, the cross-sectional morphology of the coating consists of numerous layers. These layers of fused and partially fused particles are stacked on top of one another. Clearly visible interlayer boundaries are present. The dark part of the middle layer (NiCr) has some grains that have been joined together, as well as tiny holes, cracks and bits that have not been joined. The interface is uneven, with gaps and unfused areas, which is typical of mechanical bonding. The process of etching makes the micro-pores, cracks and unfused interfaces easier to see. This is because the brittle fracture is caused by high-speed unmelted particles hitting the substrate. Overall, there are visible microscopic pores, cracks and unfused interfaces at interlayer and particle boundaries and in localised areas. These reduce the density, hardness and bond strength of the coating. As a result, the coating does not do as well in resisting spalling, and its bond strength is lower than that of systems with a NiCr transition layer. This makes it more likely to fail under alternating loads or in high-temperature environments.

3.4. Variance Analysis

A variance analysis was conducted in this study based on the signal-to-noise ratio (S/N) at different surface hardness values of the coatings. The effects of various control factors on the hardness of HVOF-applied tungsten carbide-cobalt coatings were evaluated. This approach successfully identified the factors that most influence the quality of HVOF-applied coatings. Table 3 shows the results of the analysis of variance (ANOVA) for the hardness of HVOF-sprayed WC-Co coatings. The percentage contribution shows that factor C is the most significant parameter (28.43%), followed by factor D (22.08%). Together, these two factors account for over 50% of the total variation in hardness. Factors E and H have the least influence (contribution < 3.5%), with F-values close to 1 indicating that they are non-significant. The error term contributes only 3.16%, which confirms the high repeatability of the experimental data. Based on an analysis of variance (ANOVA), the relative importance of each parameter on hardness was determined as detailed in Table 3. The contribution percentages in Table 3 can be used to identify the control factors that exhibit significant influence. It can be seen that factors C, D, F, and G are the most important impact, while factors A, B, E, and H exhibit relatively minor influence on the hardness of the surface coating in the HVOF-spraying process. On the other hand, The results indicate that factors C, D, F, and G together account for nearly 76.25% of the variability in coating hardness. These results identify the key parameters for process optimisation and validate the response surface model. Furthermore, these significant factors were then incorporated into the RSM model for the HVOF spraying process.

3.5. Computing Analysis of Empirical Model

The regression models for the RSM design in this experiment were simulated based on the Taguchi experimental results, and the parameters for the regression models were selected based on the results of the analysis of variance. Table 4 presents the regression coefficients, standard errors, t-statistics, and p-values for the first-order, interaction, and second-order RSM models of coating hardness. The results of the analysis of variance (ANOVA) for fitting linear, interaction and quadratic models to the data obtained from the Taguchi experiments are shown. As shown in Table 4, the findings revealed that the second-order model exhibited a significance F-value of 0.030 (p > 0.05) and an R2 value of approximately 0.986. In contrast, the first-order model demonstrated a significance F-value of 0.099 (p > 0.05), with an R2 value approaching 0.789. Additionally, the interaction model showed a significance F-value of 0.106 (p > 0.05) and an R2 value close to 0.429, suggesting an inadequate fit, a conclusion that is further substantiated by the RMSE values. Overall, the ANOVA table shows that the ‘Prob > F’ values for the three models, as determined by the least squares method, were 0.099, 0.106 and 0.024 respectively. The corresponding quadratic model was confirmed to be statistically significant because its ‘Prob > F’ value was less than 0.05. Also, the coefficients of determination (R2) for both the first-order model and the interaction model were lower than that of the quadratic model. Therefore, the quadratic model in RSM is highly effective in predicting hardness properties. In this experiment, based on analysis of variance (ANOVA), the vector of least-squares estimates is obtained by minimizing the sum of squared errors. The regression coefficients can then be determined using a second-order model. Furthermore, the fitted regression model is evaluated, and the least-squares fit of the model is calculated according to Equations (3) and (4). The second-order regression model for coating hardness is derived using the least-squares method, with the coefficient vector β = (XTX)−1XTy. The predicted second-order function is calculated as follows:
β = β ^ 0 β ^ 1 β ^ 2 β ^ 3 β ^ 4 β ^ 1 2 β ^ 2 2 β ^ 3 2 β ^ 4 2 β ^ 1 β ^ 2 β ^ 1 β ^ 3 β ^ 1 β ^ 4 β ^ 2 β ^ 3 β ^ 2 β ^ 4 β ^ 3 β ^ 4 = ( X T X ) 1 X T y =   1118.50 46.93 105.79 64.92 117.15 129.39 35.13 11.56 33.82 8.91 135.75 116.71 76.01 15.90 55.84
where
X = 1 1 1 1 1 1 1 1 1 1 1 1 1 1 1 1 0 0 0 0 0 0 0 0 0 0 0 0 0 0 1 1 1 1 1 1 1 1 1 1 1 1 1 1 1 1 1 1 0 1 1 0 1 1 0 0 1 1 0 1 1 1 0 1 1 0 1 1 0 0 1 1 0 1 1 1 0 1 1 0 0 0 0 0 0 0 0 1 1 0 1 1 0 1 0 0 1 0 0 0 0 1 0 1 0 1 0 1 1 1 0 0 0 0 0 0 0 1 1 1 1 1 1 0 1 1 0 1 1 0 0 1 1 0 1 1 1 1 0 0 1 0 0 1 0 0 1 1 0 0 1 0 1 1 1 0 0 0 0 0 0 0 1 1 1 1 1 0 1 1 0 1 1 0 0 1 1 0 1 1 1 1 0 1 1 0 1 1 0 0 1 1 0 1 1 1 0 1 0 1 0 0 0 0 0 0 0 1 0 1 1 1 1 1 0 1 1 0 1 1 0 1 1 1 0 1 1 1 1 1 1 1 1 1 1 1 1 1 1 1 1 0 1 1 0 0 0 0 0 0 0 0 1 1 0 1 1 0 0 1 0 0 1 0 0 0 1 0 0 1 y = 1192 1132 1234 1237 967 1410 1193 1560 1288 1525 1230 1235 1278 1263 1284 1313 1150 1435
To evaluate the influencing factors/variables in the first-order, interaction, and second-order models, a stepwise approach was used to reduce the number of variables further. Table 5 shows the full set of coefficients for the first-order, interaction and second-order models. As indicated by the “p-value”, values greater than 0.05 suggest that a given factor has a relatively small influence, leading to its removal. An analysis of variance (ANOVA) table was generated based on the quadratic regression function. The statistically significant factors in the ANOVA table were retained when the p-value was less than 0.05. in addition, Figure 5 shows the results of the regression analysis for the prediction model of the hardness of HVOF-sprayed WC-Co coatings, including coefficient estimates, standard errors, t-statistics, and p-values for three regression models including the first-order model, the interaction model, and the second-order model. The results show that in the first-order model, only the methane flow rate (D) is a significant term; this model cannot fully describe the nonlinear relationship between process parameters and coating hardness. Furthermore, the influence of interaction terms on hardness is weaker than that of main effects, while the model still lacks adequate fit. Thus, second-order terms must be introduced into the model. The second-order model exhibits a high R2 value of 0.985 for the fit, which enables precise prediction of coating hardness. Consequently, the quadratic regression function for hardness of coatings by HVOF-spraying was established as shown in Equation (7). The findings demonstrate that the model is of great significance. This is the case whenever the “Prob > F” approach is employed for decision-making purposes. The effects of the second-order of X12, X22 and the first-order of X2, X3, X4, and the pair-order of X1X2, X3X4 on surface hardness in the WC/Co coating are revealed. The equation for the fitted quadratic regression model for the hardness of coatings by HVOF spraying is as follows:
y ^ = 1118.5 + 46.93 X 1 + 105.79 X 2 64.92 X 3 + 117.15 X 4 129.39 X 1 X 2 33.82 X 2 X 3 135.75 X 3 X 4 35.13 X 1 X 3 11.56 X 1 X 4 8.91 X 2 X 4 + 116.71 X 1 2 + 76.01 X 2 2 + 15.9 X 3 2 + 55.84 X 4 2
A value of R2 of 0.985 for the above model (7) indicates that approximately 98% of the total variation in coating hardness can be explained by the quadratic terms of these four significant control factors. Clearly, this model is a far superior fit to the linear and interaction models. Later in Table 6, we also use first-order and interactive models to compare their error percentages and RMSE with those of the second-order model.

3.6. Diffraction Phase Analysis of the XRD Patterns

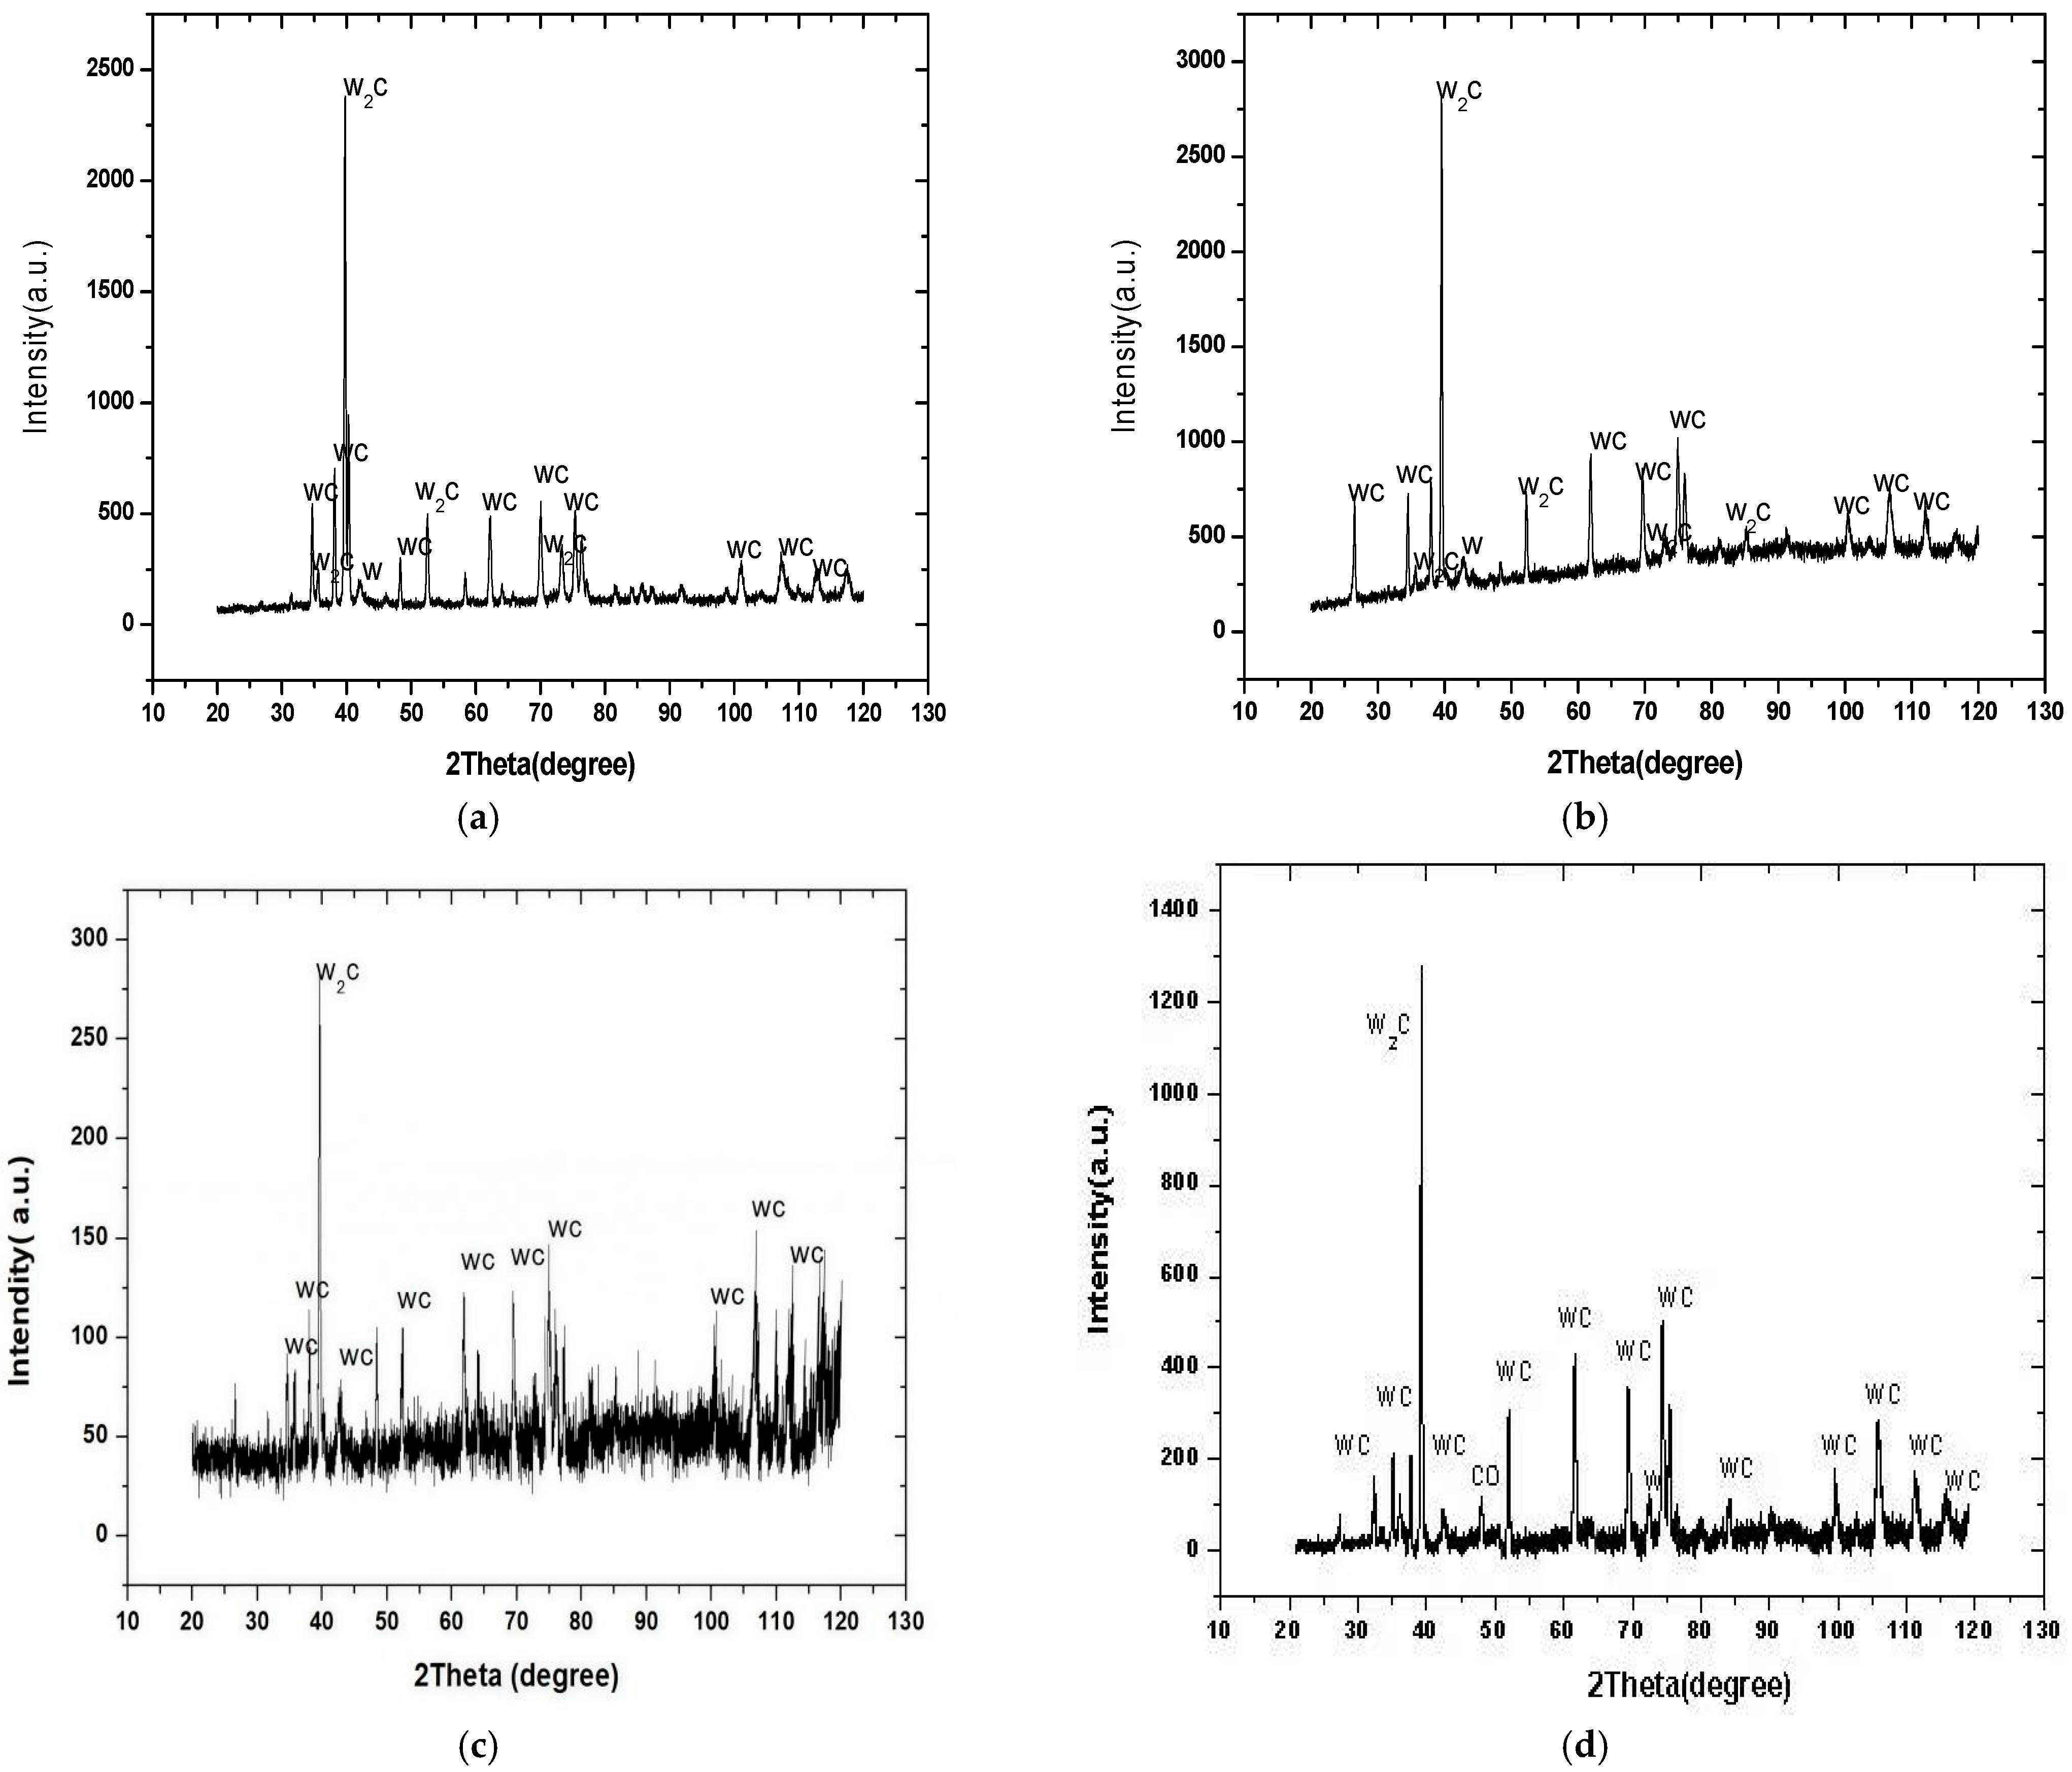
The XRD pattern in Figure 5a shows an extremely intense W2C(100) peak at approximately 2400 a.u., with a maximum texture coefficient (TC) value of 1.83, which is the strongest peak in the pattern, indicating that a remarkable decarburization phenomenon occurred in the coating (WC → W2C + C). Meanwhile, the WC(101) peak, which has a TC value of 1.62, is clearly present within the 30–120° range. This suggests that some of the original WC phase remains, indicating that it has not completely decomposed. This suggests that some of the original WC phase remains, having not completely decomposed. In contrast, the weak W peak indicates localized over-decarburization (W2C → W + C), but its contribution is minimal. In conjunction with the XRD results, the microstructure of the coating shown in Figure 3a exhibits a dense, lamellar structure. In this structure, the Co(111) particles, which has a TC value of 1.72, form a continuous ceramic matrix. These particles are fully melted, flattened and closely stacked within this matrix. The matrix has low porosity (approximately 2–3%) and no obvious microcracks. This is primarily due to the high W2C content, which is the result of the high energy input of the HVOF flame. This causes the WC particles to melt thoroughly as well as undergo decarburisation, thereby promoting particle flattening and dense stacking. Similar to Figure 5a,b shows XRD patterns with an extremely high W2C(102) peak intensity (2500 a.u.), which is the strongest peak with TC values of 2.17 in the entire spectrum, while WC(101) and Co(111) also show obvious preferred orientation. This indicates significant decarburization of the WC matrix, the most pronounced among the four sets of patterns, though it did not reach the point of excessive decarburization. Although decarburization causes the WC matrix to fracture, generating soft metallic W, and simultaneously increases porosity and microcracks, thereby reducing structural integrity, there is no decrease in hardness. This may be attributed to stress concentration leading to structural defects, a sharp drop in load transfer efficiency, and increased coating brittleness. As shown in Figure 5a,b, excessive decarburization has not occurred in any of the cases; therefore, the increased intensity of the W2C peak directly corresponds to a significant improvement in coating hardness. Figure 5c shows that the XRD pattern is characterized by the weakest W2C peak intensity (800 a.u.), a lower and broader main WC peak, and the absence of W or Co phases. This indicates that the degree of decarburization of WC is extremely low and that the ceramic phase has undergone insufficient recrystallization. This suggests that the HVOF-sprayed WC-Co coating was subjected to insufficient heat input during the spraying process. The XRD patterns and corresponding microstructures reveal that most powder particles were not fully melted or flattened, retaining their near-spherical original shapes. This results in a loose, stacked structure containing a large number of interconnected micron-scale pores (3–5%) and unmelted coarse particles. The interface between the coating and the substrate exhibits only mechanical interlocking, with microcracks and localized delamination caused by the impact of unmelted particles. This phase-structure correlation is rooted in insufficient heat input during the HVOF process, which not only inhibits the decarburization reaction of WC but also hinders the plastic deformation and metallurgical bonding of the powder particles. Consequently, this coating exhibits the lowest microhardness (967 HV) and a lower SNR (SNR = 59.70 dB) among all experimental groups, resulting in insufficient structural stability. Figure 5d shows that the W2C peak in the XRD pattern (1400 a.u.) is sharp in shape; its WC peak is sharp and well-defined without broadening; a faint peak of the Co binder phase is detectable; and no peaks of metallic W or oxide phases are observed, indicating mild decarburization of WC (only the WC → W2C reaction occurred), partial melting and recrystallization of Co, and that all phases exhibit complete crystallinity without phase degradation. These phase characteristics fully correspond to a mixed microstructure of local densification and overall heterogeneity: some powder particles are in a semi-melted state and have flattened, forming layered regions including W2C and crystalline Co, while the remaining particles retain a near-spherical, unmelted morphology, resulting in the misaligned stacking of these two types of particles without the formation of a continuous layered structure. The coating exhibits a moderate porosity of approximately 2–3%, consisting of isolated micron-sized pores (2–10 μm) distributed in the gaps between flattened and spherical particles, with no interconnected channels. The interface between the coating and the substrate exhibits tighter mechanical interlocking accompanied by slight local metallurgical bonding, with no impact microcracks or extensive delamination observed. Unfused particles account for 10–15% of the coating volume, most of which are enveloped by the molten cobalt phase, resulting in no significant stress concentration. In summary, the heterogeneous phase evolution observed in XRD is a macroscopic manifestation of the heterogeneous melting and stacking phenomena in the microstructure.

3.7. Predictions of RSM

As shown in Table 6, the results of the evaluation of the standard residuals, estimation of the percentage error and root mean square error (RMSE) for the three models were obtained using the RSM model. Clearly, the standard residual values for all 18 groups of HVOF spraying experiments were less than 2.5 in absolute value, with no significant outliers observed. This suggests that the quadratic regression model established by RSM accurately describes the relationship between process parameters and coating hardness, and that the predictions made by the model are highly consistent with the actual experimental results. Additionally, the RMSE represents the root mean square error, which reflects the overall deviation between the model’s predicted values and the actual experimental values. A lower value indicates higher fitting accuracy. To evaluate the fitting accuracy of the first-order, interaction and second-order models for hardness of the coating, the RMSE and error % were used. The RMSE for the first-order, interaction, and second-order models of coating hardness was calculated as 6.68 HV, 4.52 HV, and 1.89 HV, respectively. The results showed that the second-order model had the smallest RMSE, which was 71.7% and 58.3% lower than the RMSE of the first-order and interaction models, respectively. Additionally, the average error percentages for the first-, interaction-, and second-order models of the surface hardness of coatings were calculated to be 6.83%, 3.84%, and 1.16%, respectively. The findings indicate that the second-order model exhibited the lowest average percentage error, with a reduction of 83% and 69.7% compared to the first-order and interaction models, respectively. This suggests that the second-order regression model is better suited to describing the nonlinear relationship between HVOF process parameters and the hardness of the coating.
Table 6. The findings pertaining to the hardness of HVOF-sprayed WC-Co coatings, as ascertained by three types of RSM models, including first-order, interactive, and second-order.
No. of TrialsHardness of Coatings
TestsFirst-Order FunctionInteraction FunctionSecond-Order Function
ExperimentalPredictorError%Standard ResidualPredictorError%Standard ResidualPredictorError%Standard Residual
1119211751.430.1611334.990.9211800.970.68
21132127412.51−1.32127312.50−2.1811191.190.79
31234137211.21−1.2911705.150.9812330.050.04
4123712440.57−0.0711953.380.6412470.85−0.61
5967116420.34−1.84110314.08−2.1010084.26−2.41
6141014130.24−0.0314110.10−0.0214261.11−0.91
7119312111.51−0.1711513.560.6511741.561.09
8156014616.370.9315510.580.1415540.380.35
91288114910.771.3011748.881.7612980.79−0.60
101525133812.241.7414812.860.6715330.54−0.49
11123012061.950.2212300.03−0.0112131.411.01
12123512773.37−0.3912211.120.2112131.811.31
13127813717.30−0.8713142.85−0.5612830.37−0.28
14126312912.22−0.2612630.04−0.0112391.901.41
15128411599.761.1712971.02−0.2012730.880.66
16131312286.450.7912941.410.2913200.51−0.39
17115012478.43−0.9112206.05−1.0711701.70−1.15
18143513466.230.8414430.54−0.1214440.60−0.50
RMSE6.68 HV5.82 HV1.89 HV
Error%6.833.841.16

3.8. The Operating Parameters of Influence on HVOF Spraying Coatings

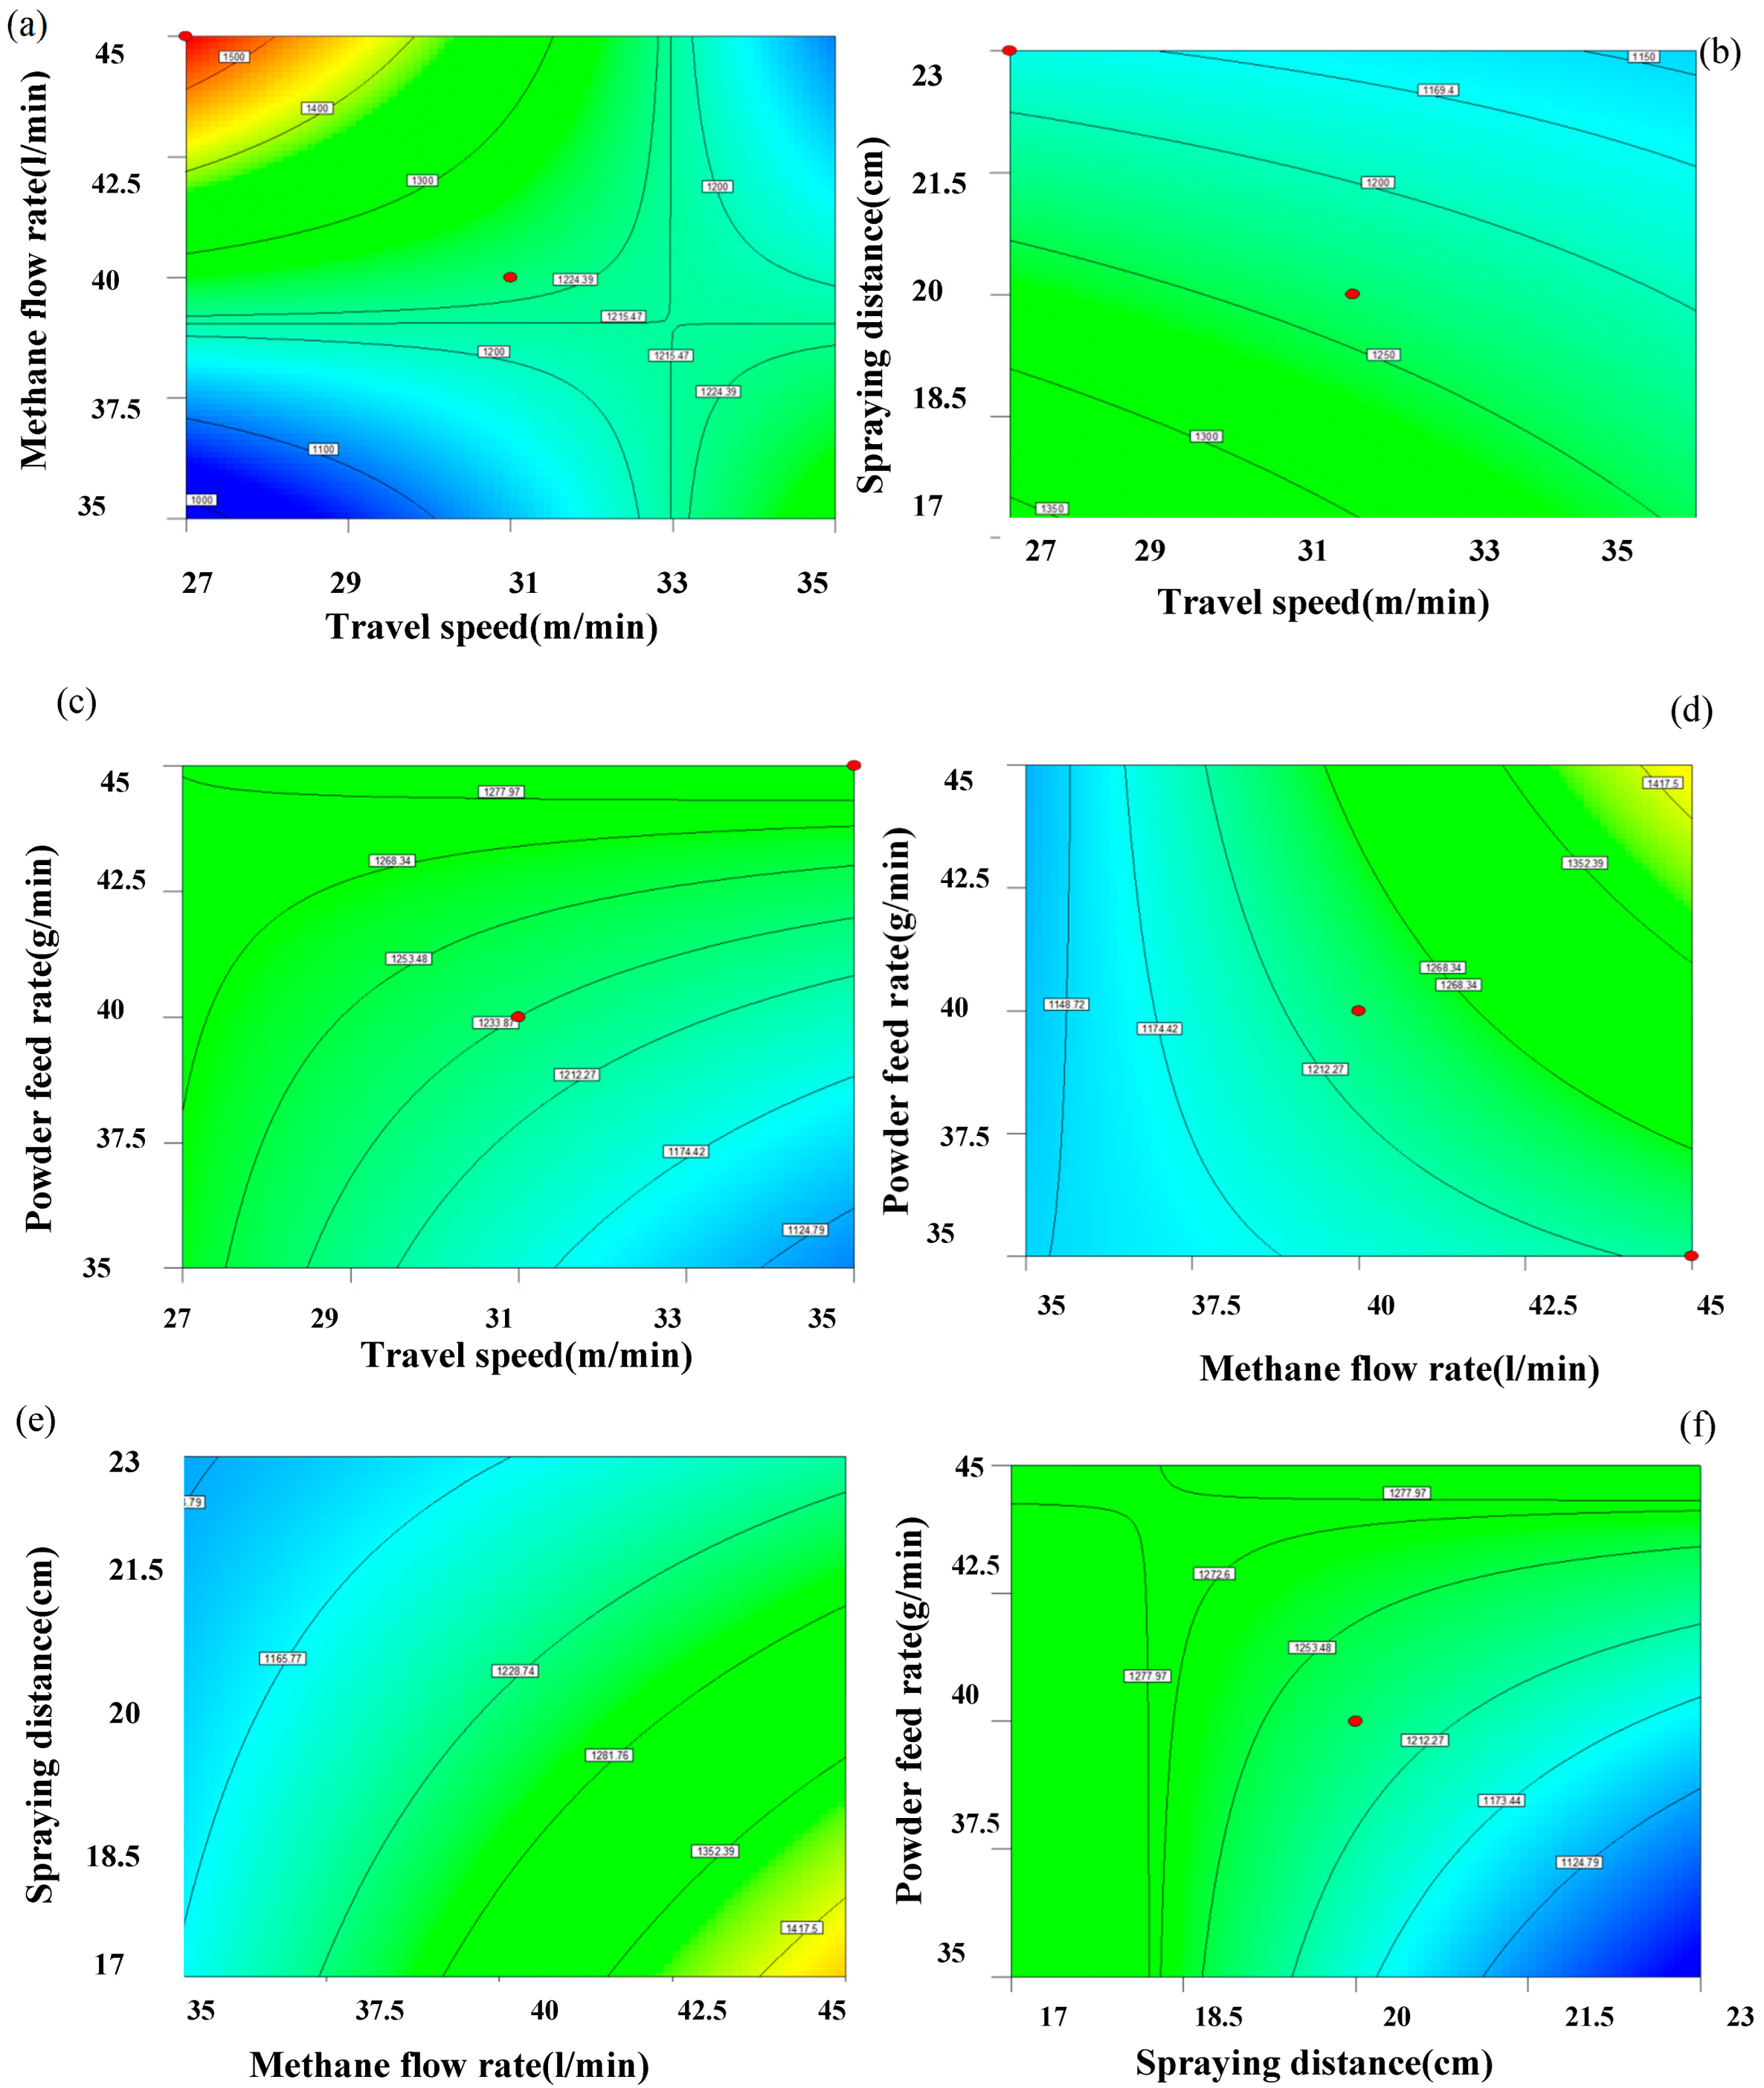
A contour plot of coating hardness is shown in Figure 6a. This was generated using the RSM, which demonstrates the interactive effects of travel speed and methane flow rate on coating hardness. The curved pattern of the contour lines indicates a nonlinear interaction between the two process parameters and hardness. The colours of the contour lines transition from blue (1000–1100 HV) to green (1200–1300 HV), and lastly to yellow/orange (1400–1500 HV). This clearly demonstrates that a high hardness of 1400–1500 HV can be achieved when the travel speed process parameter approaches 27 m/min and the methane flow rate approaches 45 L/min, which falls within the range of process optimisation. The influence of the process parameters (travel speed and spraying distance) on hardness is illustrated by the curved distribution of the contour lines, as shown in Figure 6b, which is derived from a second-order model. The colour gradient indicates a hardness range from 1150 HV (blue) to 1350 HV (yellow-green). The curved contour lines reveal the nonlinear interaction between the two parameters. This indicates that the high-hardness region in the lower left corner (1300–1350 HV) is the optimal range for both parameters when the travel speed is close to 27 mm/s and the spraying distance is close to 17 mm. Figure 6c shows a contour plot of coating hardness generated using the RSM, which illustrates the influence of travel speed and powder feed rate on coating hardness. This colour-coded map illustrates the variation in hardness, ranging from 1124 HV (blue) to 1278 HV (bright green). The curved contour lines reveal the non-linear interaction between the two parameters. As can be seen, higher powder feed rates (42.5–45 g/min) combined with higher travel speeds (31–35 m/min) yield the highest hardness (1268–1278 HV). In contrast, a low powder feed rate (35–37.5 g/min) combined with a high travel speed (33–35 m/min) results in a significant decrease in hardness (1124–1174 HV). However, it is possible to achieve a high hardness of 1268–1278 HV by using a high powder feed rate with a low/medium travel speed (27–31 m/min) or the maximum travel speed (35 m/min) with the maximum powder feed rate (45 g/min). This represents the optimised range for these two process parameters. Figure 6d illustrates the contour plot of the response surface for coating hardness with methane flow rate and powder feed rate. The contour lines rise sharply toward the high-methane region on the right, indicating that the effect of methane flow rate on hardness is the most significant. Figure 6d shows the response surface plot of coating hardness as a function of the methane and powder feed rates. The contour lines rise sharply towards the region of high methane flow rate on the top right, indicating that this has the most significant effect on hardness. It is only possible to significantly increase hardness by raising the powder feed rate under high methane flow conditions. The region of optimal hardness is located in the top right-hand corner of the figure, where a methane flow rate of 42.5–45 L/min and a powder feed rate of 42.5–45 g/min can achieve a hardness of 1417.5 HV. Figure 6d shows a contour plot illustrating the effects of methane flow rate and spraying distance on coating hardness. The colour gradient illustrates the variation in hardness from 1165 Hv (blue) to 1417 HV (yellow-green). The curved contour lines show that there is a high methane flow rate (42.5–45 L/min) when the spraying distance is short (17–18.5 cm), which results in the highest hardness (1352–1417 HV). In contrast, a low methane flow rate (35–37.5 L/min) coupled with a long spraying distance (21.5–23 cm) means that the hardness is significantly reduced (1165–1179 HV). This indicates that the methane flow rate is the dominant factor due to the contour lines clearly tilting towards the bottom right of the diagram, and that a short spraying distance can only enhance hardness under high methane flow conditions. This can be explained by analyzing the microscopic mechanisms of the coating. A high methane flow rate provides sufficient thermal input from the flame, while the short spraying distance minimizes heat loss during particle flight, thereby enabling the WC particles to melt fully and flatten, leading to the formation of a dense coating and a significant increase in hardness. The effect of spray distance and powder feed rate on the coating hardness contour plot, derived from the second-order RSM model, is shown in Figure 6e. The colour gradient illustrates the range of hardness values, from 1124 HV (blue) to 1278 HV (bright green). The contour lines indicate that a short spray distance (17–18.5 cm) combined with a high powder feed rate (42.5–45 g/min) leads to the highest hardness (1272–1278 HV), while a long spray distance (21.5–23 cm) coupled with a low powder feed rate (35–37.5 g/min) results in a substantial reduction in hardness (1124–1173 HV) as shown in Figure 6f. This indicates that spray distance is the dominant factor, as evidenced by the distinct sloping distribution of the contours. Additionally, the hardness of the material is only increased by a high powder feed rate when the distance from the nozzle is short. Based on interactive response surface analysis of the effects of methane flow rate, powder feed rate, spraying distance and travel speed on the hardness of HVOF-sprayed WC-Co coatings, the optimal region for maximum hardness is located where methane flow rate, powder feed rate are high, spraying distance is short, and travel speed is moderate. In other words, the multi-parameter optimization identified the best process conditions as follows: methane flow rate of 43 L/min, powder feed rate of 43 g/min, spraying distance of 18 cm, and traverse speed of 30 m/min, under which the coating can reach 1350–1400 HV with a dense microstructure and low porosity. The short spraying distance and high methane flow rate ensure sufficient particle melting and low porosity, while the high powder feed rate and medium travel speed achieve optimised coating density and uniformity. Microstructural examinations and tests of performance verify that this combination of parameters can significantly improve coating hardness, making it the optimal solution within the limits of this study. In short, there is no need to conduct numerous experiments. Instead, researchers can identify the range with the highest hardness directly based on the colour of the contour lines. This enables them to swiftly determine the optimal parameters in experimental domains, thereby significantly reducing both costs and time.

3.9. Confirmation Experiments

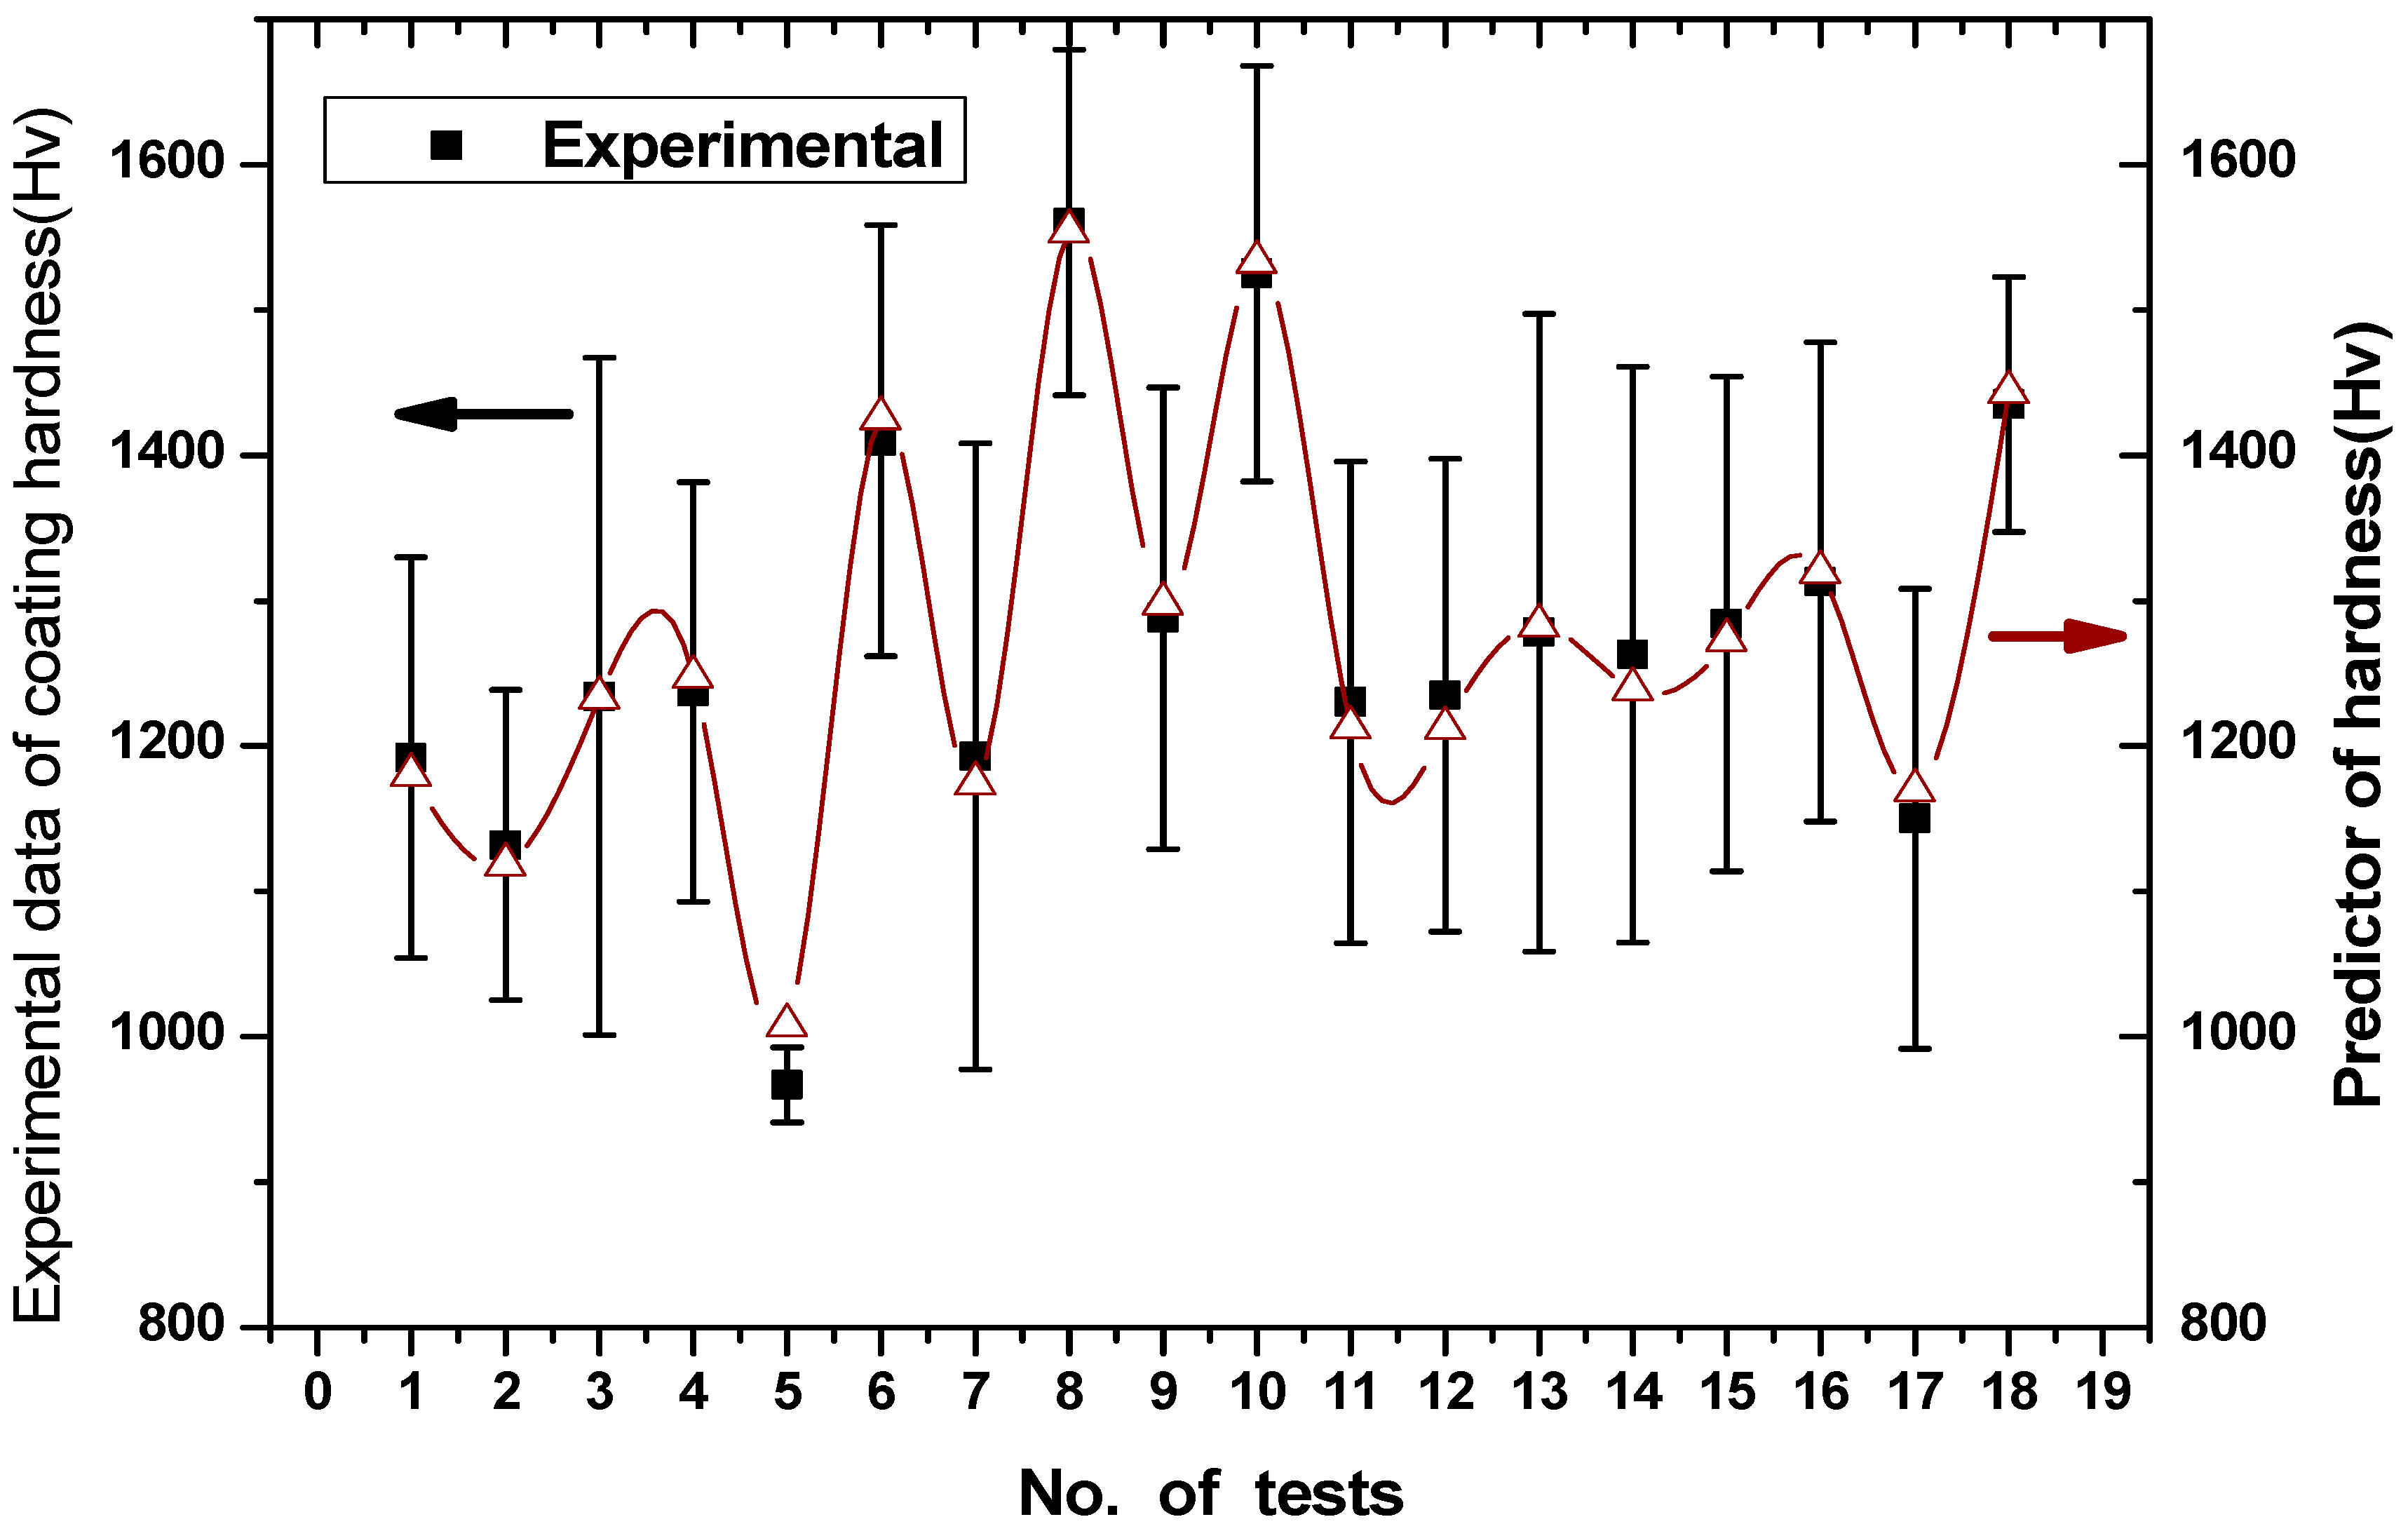
To validate the statistical model more effectively and further understand the hardness properties of the coating, the contour lines of the RSM model are presented in Equation (7). Figure 7 illustrates a comparative analysis of experimental values and model-predicted microhardness values for 18 sets of HVOF-sprayed NiCr/WC-Co coatings, where the error bars represent the standard deviation of the experimental measurements, and the trend line indicates the overall trend. As illustrated, the predicted hardness values exhibit an excellent correlation with the experimental results across the entire domain of the experiment, with an average percentage error of just 1.16%. The predicted trend line lies within the margin of error of the measured data points, with the exception of the fifth group. As seen above, Figure 6 clearly shows the response surface plot of deposit hardness behavior, which varies with different factor settings. The figures illustrate the relationship between the response and the control variables, as defined by Equation (6). The calculated results of the contour plots within the experimental region are presented graphically. Based on the figure above, response contour lines containing saddle points and central elliptical patterns can be obtained. By examining the contour plots of the fitted model, we can now understand the response surface of the hardness properties of the coating. Verification experiments were conducted under optimal conditions. The measured hardness was 1352.7 ± 75 HV when repeated three times, which was in close agreement with the predicted value of 1365.89 HV. This result had a relative error of 0.98%, which validates the reliability of the second-order model. This high similarity shows that the model is reliable, and tests done with the best settings show that it works well. Therefore, it can be concluded that the quadratic regression models perform satisfactorily. Furthermore, the microstructure and phase composition of the optimized coating were characterized by SEM and XRD, which revealed a dense lamellar structure with less decarburization, further confirming the excellent mechanical properties of the coating.
Figure 6. The contour plot illustrates the influence of the interactions between four key parameters on coating hardness by HVOF spraying process (a) spraying distance = 20 mm and powder feed rate = 40 g/min, methane flow rate and travel speed, (b) methane flow rate = 40 L/min, powder feed rate = 40 g/min, spraying distance and travel speed, (c) methane flow rate = 40 L/min, spraying distance = 20 cm, powder feed rate and travel speed, (d) spraying distance = 20 cm, travel speed = 31 m/min, powder feed rate and methane flow rate, (e) powder feed rate = 40 g/min, travel speed = 31 m/min, spraying distance and methane flow rate and (f) methane flow rate = 40 L/min, travel speed = 31 m/min, powder feed rate and spraying distance. The colors range from blue (low hardness) to red (high hardness), with the red point representing the current optimal combination of parameters. The red dots on the contour plot highlight the optimal parameter combinations predicted by the RSM model.
Ceramics 09 00051 g006
Figure 7. A comparison of the hardness values predicted by the model and those obtained experimentally for 18 groups of HVOF-sprayed NiCr/WC-Co coatings with error bars and trend lines, with the squares and triangles representing the experimental and predicted hardness values, respectively.
Ceramics 09 00051 g007

4. Conclusions

It has been shown through experimentation that the response surface method (RSM), based on Taguchi experiments, is an effective way of predicting the hardness of NiCr/WC-Co coatings produced by HVOF spraying. The findings from the coating structure analysis revealed that well-fused coatings exhibit a dense, layered microstructure with fine, flat spatter particles, while partially fused coatings exhibit a fragmented surface characterised by open pores, intergranular voids and residual coarse powder particles. In addition, microstructural observations of the etched cross-sections reveal that regions containing a NiCr interlayer exhibit excellent interfacial adhesion. Conversely, regions without a NiCr layer exhibit significant porosity, unfused particles, microcracks and poor interfacial bonding, resulting in easy delamination of the coating. An in-depth analysis using ANOVA revealed that four parameters were significantly associated with the response. These main factors collectively accounted for 76.25% of the total variance. Additionally, the second-order response surface model demonstrated strong predictive power, explaining 98.5% of the total variance observed in the experiment. The predictions of the model were validated through three replicate measurements under optimal conditions, which yielded a hardness value of 1352.7 ± 75 HV. This is very close to the predicted value of 1365.89 HV. The relative error of this result is just 0.98%, which further confirms the reliability of the second-order model. In addition, graphical analysis methods were used to investigate the behavior of the HVOF coatings, thereby enabling the prediction of hardness values within the experimental range. Overall, the predicted values from the model are in very good agreement with the experimental results.

Author Contributions

Data curation, formal analysis, software (optimization), validation, writing, and proofreading- original draft, W.L.; conceptualization, resources, supervision, project administration, data curation, formal analysis, validation, writing, proofreading -original draft, and review and editing, M.J. All authors have read and agreed to the published version of the manuscript.

Funding

The authors gratefully acknowledge financial support from the Fujian Social Sciences Association, 2025 (No. FJ2025B217); Research on the Sustainable Development of Fujian Rural Landscape under the Concept of Green and Low Carbon Research Project of Fujian Province (No. LJZX2024-D004).

Data Availability Statement

The raw data supporting the conclusions of this article will be made available by the authors on request.

Conflicts of Interest

The authors declare no conflicts of interest.

References

  1. Guilemany, J.; Dosta, S.; Nin, J.; Miguel, J.R. Study of the properties of WC-Co nanostructured coatings sprayed by high-velocity oxyfuel. J. Therm. Spray Technol. 2005, 14, 405–413. [Google Scholar] [CrossRef]
  2. Jia, K.; Fischer, T.E.; Gallois, B. Microstructure, hardness and toughness of nanostructured and conventional WC-Co composites. Nanostruct. Mater. 1998, 10, 875–891. [Google Scholar] [CrossRef]
  3. Wurl, R.C.; Albin, S.L. A comparison of multiresponse optimization sensitivity to parameter selection. Qual. Eng. 1999, 11, 405–415. [Google Scholar] [CrossRef]
  4. Karimi, A.; Verdon, C.; Barbezat, G. Microstructure and hydroabrasive wear behaviour of high velocity oxy-fuel thermally sprayed WC Co (Cr) coatings. Surf. Coat. Technol. 1993, 57, 81–89. [Google Scholar] [CrossRef]
  5. Bolelli, G.; Berger, L.-M.; Börner, T.; Koivuluoto, H.; Lusvarghi, L.; Lyphout, C.; Markocsan, N.; Matikainen, V.; Nylén, P.; Sassatelli, P. Tribology of HVOF-and HVAF-sprayed WC–10Co4Cr hardmetal coatings: A comparative assessment. Surf. Coat. Technol. 2015, 265, 125–144. [Google Scholar] [CrossRef]
  6. Vashishtha, N.; Sapate, S.; Gahlot, J.; Bagde, P. Effect of tribo-oxidation on friction and wear behaviour of HVOF sprayed WC–10Co–4Cr coating. Tribol. Lett. 2018, 66, 56. [Google Scholar] [CrossRef]
  7. Picas, J.A.; Punset, M.; Baile, M.T.; Martín, E.; Forn, A. Effect of oxygen/fuel ratio on the in-flight particle parameters and properties of HVOF WC-CoCr coatings. Surf. Coat. Technol. 2011, 205, S364–S368. [Google Scholar] [CrossRef]
  8. Shipway, P.H.; McCartney, D.G.; Sudaprasert, T. Sliding wear behaviour of conventional and nanostructured HVOF sprayed WC–Co coatings. Wear 2005, 259, 820–827. [Google Scholar] [CrossRef]
  9. Kawakita, J.; Kuroda, S.; Kodama, T. Evaluation of through-porosity of HVOF sprayed coating. Surf. Coat. Technol. 2003, 166, 17–23. [Google Scholar] [CrossRef]
  10. Yang, Z.Q.; Liu, D.X.; Zhou, K.; Gao, F.; Liu, Y.J.; Li, M.Y.; Wu, J.N.; Fan, K.F.; Zhang, X.H. Preparation of NiAlW coating by APS and HVOF spraying: Microstructure evolution, mechanical properties, and high-temperature tribological behavior. Surf. Coat. Technol. 2025, 508, 132164. [Google Scholar] [CrossRef]
  11. Prasanna, N.D.; Siddaraju, C.; Shetty, G.; Ramesh, M.R.; Reddy, M. Studies on the role of HVOF coatings to combat erosion in turbine alloys. Mater. Today Proc. 2018, 5, 3130–3136. [Google Scholar] [CrossRef]
  12. Sauter, M.; Roth, A.; Grebhardt, A.; Killinger, A. High velocity flame spraying of highly-filled ceramic—Polymer filaments (F-HVOF). Surf. Coat. Technol. 2023, 458, 129324. [Google Scholar] [CrossRef]
  13. Babu, P.S.; Basu, B.; Sundararajan, G. Processing–structure–property correlation and decarburization phenomenon in detonation sprayed WC–12Co coatings. Acta Mater. 2008, 56, 5012–5026. [Google Scholar] [CrossRef]
  14. Yang, Z.Q.; Luo, C.Y.; Zan, X.J.; Zhang, J.; Liu, W.D.; Wang, W. Effect of pre-oxidation on the moderate-temperature hot corrosion behavior of CoNiCrAlY-YSZ thermal barrier coatings. Surf. Coat. Technol. 2023, 473, 129947. [Google Scholar] [CrossRef]
  15. Bolelli, G.; Berger, L.-M.; Bonetti, M.; Lusvarghi, L. Comparative study of the dry sliding wear behaviour of HVOF-sprayed WC–(W, Cr) 2C–Ni and WC–CoCr hardmetal coatings. Wear 2014, 309, 96–111. [Google Scholar] [CrossRef]
  16. de Villiers Lovelock, H.; Richter, P.W.; Benson, J.M.; Young, P.M. Parameter study of HP/HVOF deposited WC-Co coatings. J. Therm. Spray Technol. 1998, 7, 97–107. [Google Scholar] [CrossRef]
  17. Sauter, M.; Semmler, C.; Nies, T.; Poppi, G.; Bortolotti, L.; Ottani, F.; Bolelli, G.; Lusvarghi, L.; Killinger, A. High temperature properties of nichrome resistant heaters–A systematic comparison of APS, suspension and filament HVOF sprayed coatings. Surf. Coat. Technol. 2025, 496, 131594. [Google Scholar] [CrossRef]
  18. Vashishtha, N.; Sapate, S. Abrasive wear maps for High Velocity Oxy Fuel (HVOF) sprayed WC-12Co and Cr3C2−25NiCr coatings. Tribol. Int. 2017, 114, 290–305. [Google Scholar] [CrossRef]
  19. Pukasiewicz, A.; De Boer, H.E.; Sucharski, G.B.; Vaz, R.F.; Procopiak, L. The influence of HVOF spraying parameters on the microstructure, residual stress and cavitation resistance of FeMnCrSi coatings. Surf. Coat. Technol. 2017, 327, 158–166. [Google Scholar] [CrossRef]
  20. Ruiz-Luna, H.; Lozano-Mandujano, D.; Alvarado-Orozco, J.M.; Valarezo, A.; Poblano-Salas, C.; Trápaga-Martínez, L.; Espinoza-Beltrán, F.; Muñoz-Saldaña, J. Effect of HVOF processing parameters on the properties of NiCoCrAlY coatings by design of experiments. J. Therm. Spray Technol. 2014, 23, 950–961. [Google Scholar] [CrossRef]
  21. Dangi, S.; Chaudhary, S.; Walia, R.S.; Karloopia, J.; Katiyar, J.K. Tribo-corrosion, mechanical and morphological performance of multilayer ceramic deposited on cast iron via HVOF thermal spray. Tribol. Int. 2025, 212, 110999. [Google Scholar] [CrossRef]
  22. Hastak, V.; Gildersleeve, E.J.; Batna, S.; Gandhi, A.S.; Sampath, S. On the oxygen vacancy annealing in air plasma sprayed yttria-stabilized zirconia thermal barrier coatings. J. Am. Ceram. Soc. 2024, 107, 920–932. [Google Scholar] [CrossRef]
  23. Bolelli, G.; Colella, A.; Forlin, E.; Gehlen, L.R.; Lusvarghi, L.; Miconi, L.; Pintaude, G.; Puddu, P. Tribological performance of NbC-based hardmetal HVOF coatings with Fe-Cr-Mo matrix. Wear 2025, 564, 205680. [Google Scholar] [CrossRef]
  24. Al-Abboodi, H.; Fan, H.Q.; Mhmood, I.A.; Al-Bahrani, M. The dry sliding wear rate of a Fe-based amorphous coating prepared on mild steel by HVOF thermal spraying. J. Mater. Res. Technol. 2022, 18, 1682–1691. [Google Scholar] [CrossRef]
  25. Li, Z.Q.; Zhang, H.H.; Xu, M.L.; He, W.F.; Shao, S.B.; Song, S.Y.; Zhang, G.A.; Lu, Z.B. Tribological behavior of a novel Si-and WC-co-reinforced aC multilayer coating at 25–500 °C. Surf. Coat. Technol. 2023, 468, 129775. [Google Scholar] [CrossRef]
  26. Sharma, A.; Verma, R.; Sharma, V. Thermal spraying of MPEA coatings: Techniques, properties, and biomedical applications. Mater. Today Commun. 2025, 46, 112482. [Google Scholar] [CrossRef]
  27. Zhu, S.S.; Wu, Y.P.; Hong, S.; Cheng, J.B.; Wei, Z.; Zhang, B.S. Microstructure, mechanical properties and tribological behaviors of (Co0.33Ni0.33Cr0.23Mo0.1)80−xNbx (B0.3Si0.7)20 high entropy amorphous alloy coatings. J. Alloys Compd. 2023, 942, 169055. [Google Scholar] [CrossRef]
  28. Daram, P.; Banjongprasert, C. The influence of post treatments on the microstructure and corrosion behavior of thermally sprayed NiCrMoAl alloy coating. Surf. Coat. Technol. 2020, 384, 125166. [Google Scholar] [CrossRef]
  29. Liang, D.D.; Ma, J.; Cai, Y.F.; Liu, X.D.; Xie, S.D.; Wei, X.S.; Xu, G.; Shen, J. Characterization and elevated-temperature tribological performance of AC–HVAF-sprayed Fe-based amorphous coating. Surf. Coat. Technol. 2020, 387, 125535. [Google Scholar] [CrossRef]
  30. Zhu, B.D.; Shang, L.L.; Bian, Y.; Li, W.S.; Shao, L.; Zhang, G.G. Enhancement mechanism of HVOF interlayers on ta-C film load-bearing and wear resistance. Surf. Coat. Technol. 2025, 508, 132158. [Google Scholar] [CrossRef]
  31. Liu, L.; Shao, L.; Li, W.S.; Shang, L.L.; Zhu, B.D.; Wang, C.M.; Song, Q.; Zhang, C.Z. Effect of different HVOF coatings on the tribological behavior of PVD/HVOF duplex coatings. Tribol. Int. 2024, 198, 109873. [Google Scholar] [CrossRef]
  32. Wu, Y.; Wu, A. Taguchi Methods for Robust Design; ASME: New York, NY, USA, 2000. [Google Scholar]
  33. Tyagi, A.; Murtaza, Q.; Walia, R.S. Evaluation of the residual stress of HVOF sprayed carbon coating after wear testing conditions using ANN coupled Taguchi approach. Surf. Topogr. Metrol. Prop. 2021, 9, 035027. [Google Scholar] [CrossRef]
  34. Guilemany, J.M.; Dosta, S.; Miguel, J.R. The enhancement of the properties of WC-Co HVOF coatings through the use of nanostructured and microstructured feedstock powders. Surf. Coat. Technol. 2006, 201, 1180–1190. [Google Scholar] [CrossRef]
  35. Myers, R.H.; Montgomery, D.C. Response Surface Methodology: Process and Product Optimization Using Design Experiments; John-Wiley & Sons: Hoboken, NJ, USA, 2006. [Google Scholar]
  36. Baik, K.H.; Kim, J.H.; Seong, B.G. Improvements in hardness and wear resistance of thermally sprayed WC-Co nanocomposite coatings. Mater. Sci. Eng. A 2007, 449, 846–849. [Google Scholar] [CrossRef]
  37. Lin, B.T.; Jean, M.D.; Chou, J.H. Using response surface methodology for optimizing deposited partially stabilized zirconia in plasma spraying. Appl. Surf. Sci. 2007, 253, 3254–3262. [Google Scholar] [CrossRef]
  38. Azizpour, M.J.; Salehi, M. The fracture toughness of hvof thermally sprayed WC-12Co coating in optimized particle temperature. Int. J. Adv. Des. Manuf. Technol. 2017, 10, 109. [Google Scholar]
  39. Singh, V.; Bansal, A.; Singla, A.K. Response surface methodology (RSM) based analysis on slurry erosion behavior of laser textured and PTFE sprayed VC+TiC coating deposited via HVOF. Mater. Today Commun. 2023, 36, 106843. [Google Scholar] [CrossRef]
  40. Sahu, A.; Narayanan, V.; Ravi, K.R. Novel one-step approach using HVOF thermal spray process for rapid fabrication of superhydrophobic stainless steel coating. Surf. Coat. Technol. 2025, 511, 132295. [Google Scholar] [CrossRef]
  41. Singh, V.; Bansal, A.; Singla, A.K. Slurry erosion behaviour of HVOF sprayed VC+TiC based novel coatings: Characterization and optimization studies. Tribol. Int. 2023, 180, 108289. [Google Scholar] [CrossRef]
  42. Zhang, C.W.; Li, Q.; Xiong, B.L.; Zhang, G.; Ma, X.; Guo, S.F.; Xu, Z.D.; Lu, F.; Zhu, J.X.; Yu, S.B. Optimization of HVOF spraying parameters for enhanced Fe-based amorphous coatings: A taguchi approach. Intermetallics 2024, 173, 108419. [Google Scholar] [CrossRef]
  43. Li, M.H.; Christofides, P.D. Modeling and control of high-velocity oxygen-fuel (HVOF) thermal spray: A tutorial review. J. Therm. Spray Technol. 2009, 18, 753–768. [Google Scholar] [CrossRef]
  44. Vignesh, S.; Shanmugam, K.; Balasubramanian, V.; Sridhar, K. Identifying the optimal HVOF spray parameters to attain minimum porosity and maximum hardness in iron based amorphous metallic coatings. Def. Technol. 2017, 13, 101–110. [Google Scholar] [CrossRef]
  45. Rannetbauer, W.; Hambrock, C.; Hubmer, S.; Ramlau, R. Enhancing predictive quality in HVOF coating technology: A comparative analysis of machine learning techniques. Procedia Comput. Sci. 2024, 232, 1377–1387. [Google Scholar] [CrossRef]
  46. Tillmann, W.; Kuhnt, S.; Baumann, I.T.; Kalka, A.; Becker-Emden, E.-C.; Brinkhoff, A. Statistical comparison of processing different powder feedstock in an HVOF thermal spray process. J. Therm. Spray Technol. 2022, 31, 1476–1489. [Google Scholar] [CrossRef]
  47. Pan, J.J.; Hu, S.S.; Yang, L.J.; Ding, K.Y.; Ma, B.Q. Numerical analysis of flame and particle behavior in an HVOF thermal spray process. Mater. Des. 2016, 96, 370–376. [Google Scholar] [CrossRef]
  48. Palanisamy, K.; Gangolu, S.; Antony, J.M. Effects of HVOF spray parameters on porosity and hardness of 316L SS coated Mg AZ80 alloy. Surf. Coat. Technol. 2022, 448, 128898. [Google Scholar] [CrossRef]
  49. Rannetbauer, W.; Hubmer, S.; Hambrock, C.; Ramlau, R. Predictive modelling of critical variables for improving HVOF coating using gamma regression models. J. Math. Ind. 2024, 14, 7. [Google Scholar] [CrossRef]
  50. Zhao, L.D.; Maurer, M.; Fischer, F.; Dicks, R.; Lugscheider, E. Influence of spray parameters on the particle in-flight properties and the properties of HVOF coating of WC-CoCr. Wear 2004, 257, 41–46. [Google Scholar] [CrossRef]
  51. Thirumalvalavan, S.; Perumal, G.; Senthilkumar, N.; Selvarasu, S. Enhancing tribological characteristics of titanium grade-5 alloy through HVOF thermal-sprayed WC-Co nano coatings by TOPSIS and golden jack optimization algorithm. Recent Pat. Nanotechnol. 2025, 19, 544–567. [Google Scholar] [CrossRef]
Figure 1. (a) The schematic diagram of high-speed oxygen-fuel spraying. (b) The morphology of spherical powders for HVOF spraying WC-Co coatings, as observed by SEM.
Ceramics 09 00051 g001
Figure 2. A diagram showing the mean hardness and standard deviation of the L18 experiments, with the squares and triangles representing the respective averages.
Ceramics 09 00051 g002
Figure 3. The surface morphology of Scanning electron microscopy of HVOF-sprayed NiCr/WC-Co metal-ceramic coatings (a) trial 18 (b) trial 6 (c) trial 5 and (d) trial 17.
Ceramics 09 00051 g003
Figure 4. The SEM images of the etched tests showing the microstructure at the interface between the WC-Co coating and the substrate, with and without a NiCr interlayer (a) Trial 18, (b) Trial 6, (c) Trial 5 and (d) Trial 17.
Ceramics 09 00051 g004aCeramics 09 00051 g004b
Figure 5. XRD patterns illustrating the phase composition and crystalline structure of HVOF-sprayed NiCr/WC-Co coatings for (a) trial 18, (b) trial 8, (c) trial 5 and (d) trial 17, respectively, with diffraction peaks corresponding to the phases WC, W2C, W and Co.
Ceramics 09 00051 g005
Table 1. The eight controllable factors and their corresponding levels for the L18 orthogonal experimental design for the HVOF sprayed WC-Co experiment.
SymbolControllable Factors123
ACoating typeWCNiCr/WC-
BSurface Roughness (Ra)81012
CTravel speed (m/min)273135
DMethane flow rate (L/min)354045
EOxygen flow rate (L/min)354045
FSpraying distance (cm)172023
GPowder feed rate (g/min)354045
HCarrier gas flow rate (L/min)242934
Table 2. The L18 orthogonal array experimental results for HVOF-sprayed coatings, including eight control factors, five replicate hardness measurements, mean hardness, standard deviation, and signal-to-noise ratio (SNR).
No. of
Tests
Control FactorsHardness of Coatings (HV)Performance Estimate
ABCDEFGHTrial1Trial2Trial3Trial4Trial5MeanSt. DevSNRs
111111111110512391091111014131192137.5861.40
211222222119796594610259441016106.7560.03
31133333311631589112097713201234232.9761.48
412112233110811891424111013521237144.3861.71
51222331199696592996298596725.6459.70
612331122178917121452146716311610148.2964.05
71312132310021314977148911841193215.4161.21
813232131134016051362135613141395118.8162.83
913313212118712061274154814491333158.6462.35
1021133221172114781516158013301525143.0363.57
1121211332141010521396118911031230165.4861.61
1221322113120011151063134314561235162.5861.66
1322123132151611251231149310251278219.5161.82
1422231213124811841239105415891263197.9861.80
1522312321128913271017129614891284170.0661.96
1623132312148613721427117611051313164.6562.19
1723213123134613861112101012601223158.4361.56
182332123116401584173016841814169087.5864.53
Table 3. The analysis of variance in the Taguchi design.
Control
Factors
Sum of
Squares
Degrees of
Freedom
Mean
Square
F-ValuePercent
Contribution
A1.8111.01.8115.1898.21
B1.3482.00.6741.9326.11
C6.2722.03.1368.98628.43
D4.8712.02.4366.97922.08
E0.7002.00.3501.0033.17
F2.2262.01.1133.18910.09
G3.4532.01.7264.94715.65
H0.6822.00.3410.9773.09
Error0.6982.00.3491.0003.16
Total22.06117.01.298 100.00
Table 4. ANOVA table of RSM models for hardness of HVOF-sprayed WC-Co coatings, comparing the fitting effects of three regression models: first-order, interaction, and second-order.
Model dfSSMSF-ValueSignificance FR Square
First-order functionRegression analysis4146,09636,52420.0990.429
Residual error13194,57014,967
Total17340,666
Interaction functionRegression analysis10268,98526,89830.1060.789
residual error771,68110,240
Total17340,666
Second order functionRegression analysis14335,71923,980150.0240.985
Residual error349471649
Total17340,666
Table 5. Regression coefficients, standard errors, t-statistics, and p-values for first-order, interaction, and second-order terms, indicating the significance of the effects of each factor and interaction term on the hardness.
Model CoefficientsStandard Errort-Statp-Value
Intercept1273.6728.3444.9360.000
C28.2937.110.7620.460
First-order function D84.0735.932.3400.036
F−50.3334.71−1.4500.171
G52.6035.931.4640.167
Intercept1285.5124.9551.5320.000
C80.2239.232.0450.080
D118.8931.993.7170.007
F−15.0032.07−0.4680.654
G80.1031.422.5490.038
Interaction functionCD−83.7344.06−1.9000.099
CF24.0040.330.5950.571
CG−45.0736.54−1.2330.257
DF−95.2167.18−1.4170.199
DG−55.8272.96−0.7650.469
FG−86.4045.29−1.9080.098
Intercept1118.5033.0133.880.00
C;X146.9327.791.690.19
D;X2105.7918.415.750.01
F;X3−64.9216.33−3.980.03
G;X4117.1514.448.120.00
CD;X1X2−129.3919.20−6.740.01
CF;X1X3−35.1319.82−1.770.17
Second-order function CG;X1X4−11.5624.43−0.470.67
DF;X2X3−33.8236.96−0.910.43
DG;X2X4−8.9129.76−0.300.78
FG;X3X4−135.7534.20−3.970.03
C2;X12116.7124.194.820.02
D2;X2276.0122.213.420.04
F2;X3215.9029.970.530.63
G2;X4255.8425.682.170.12
Disclaimer/Publisher’s Note: The statements, opinions and data contained in all publications are solely those of the individual author(s) and contributor(s) and not of MDPI and/or the editor(s). MDPI and/or the editor(s) disclaim responsibility for any injury to people or property resulting from any ideas, methods, instructions or products referred to in the content.