Article

Luminescence Features of Eu2O3-Doped Antimony Borate Glasses with High Quantum Efficiency

by
Hadjer Youcef
1,
Mohamed Toufik Soltani
1,* and
Dominique de Ligny
2,*
1
Laboratory of Photonic Physics and Multifunctional Nanomaterials University of Mohamed Khider, BP 145 RP, Biskra 07000, Algeria
2
Department Materials Science, Institute for Glass and Ceramics, Friedrich-Alexander-Universität Erlangen-Nürnberg (FAU), Martenstrasse 5, 91058 Erlangen, Germany
*
Authors to whom correspondence should be addressed.
Ceramics 2026, 9(2), 12; https://doi.org/10.3390/ceramics9020012
Submission received: 10 December 2025 / Revised: 16 January 2026 / Accepted: 17 January 2026 / Published: 23 January 2026
(This article belongs to the Special Issue Preparation and Application of Transparent Ceramics)

Abstract

Boro-antimonite glasses doped with Eu3+ and having the general composition (90-x) Sb2O3–xB2O3–10Li2O-0.5Eu2O3 (x = 0 to 60 in 10 mol. % increment) were prepared using the melt quenching method. The influence of B2O3/Sb2O3 substitution on the spectroscopy and photoluminescence of Eu3+ ions was analyzed by studying the measured and calculated properties of these glasses. The relative value of a given property was shown to increase or decrease by up to 26% with the addition of up to 60 mol. % B2O3, while the number of Eu3+ ions per unit volume increased by approximately 32%. Strong emissions were obtained in association with the transitions of Eu3+ (5D07Fj, j = 1–4). A weak, broad emission centered at 450 nm was also detected. This emission is clearly linked to the glass composition. It originates from a potential presence of Eu2+ ions. This enhances 5D0 level emission via charge transfer. The radiative and experimental lifetimes of the 5D0 level increase linearly with B2O3 content. This results in high quantum efficiency (η) ranging from 74 to nearly 84%. Tunable chromaticity, as defined by the CIE 1931 standard, was achieved, resulting in a warm orange-red color with high brightness. These new glasses have a variety of potential laser-related applications.

1. Introduction

Luminescent materials such as Rare Earth (RE)-doped phosphors or glasses are of great interest due to their applications in various fields such as telecommunications, photovoltaics, display devices, modern lighting technology, optical fibers, mid-infrared lasers, and solid-state lasers [1,2,3,4,5]. The optical properties of RE ions in glasses are strongly influenced by the chemical composition, the structure, and the nature of the bonds in the host matrix [6,7]. Among rare earth ions, europium oxide is one of the most used ions due to its strong red emission originating from the 5D07F2 transition [8,9,10]. In addition, the 5D07Fj (j = 1–5) line emissions can be adjusted to produce a combination of green, orange and red light, which has long been used in glasses and phosphors [11,12]. In addition, blue emission can usually be produced by Eu2+ from the reduction of Eu3+, resulting in a broad emission band extending from ultraviolet to blue, which corresponds to 4f65d→4f7 transition [13,14,15], enabling a tunable white emission in LED display devices.
Due to its unique characteristics, Eu3+ exhibits intense emission and excitation lines, as well as hypersensitivity of the 5D07F2 electric dipole. This provides more information about the local symmetry of the site than the absorption spectrum. Furthermore, the 5D07F1 magnetic dipole transition is independent of the Eu3+ ion environment and is used to calculate the asymmetric ratio (R) in order to interpret the covalence and local symmetry of the ligand surrounding Eu3+ ions [16,17,18,19].
Among traditional oxide glasses, borate glass is a suitable host for RE elements, particularly Eu3+, due to its high transparency in the UV-Vis region, low melting point, high thermal stability, and good solubility of RE ions, but it has high phonon energy [20,21].
On the other hand, Sb2O3, an unconventional glass former [22] with low phonon energy (600 cm−1) [23], as evidenced by its wide transmission window (approximately 0.35–7.5 µm) [24], is an emerging glass of great interest due to its high density, high refractive index [25], low melting and glass transition temperature, high linear thermal expansion, and high nonlinear refractive index [26,27]. Several studies have considered Sb2O3 as a promising host for RE elements [6,28,29,30].
This paper presents the results of a systematic study of mixed antimony borate glasses modified with lithium oxide and doped with europium. Combining the two glass formers yields different phonon energies and a bonding environment that significantly influences the radiative and non-radiative processes of the europium ions. This study focuses on the optical properties of (90-x) Sb2O3-xB2O3-10Li2O doped with 0.5 (mol. %) of Eu3+ ions. Specifically, the study examines how B2O3 substitution influences optical absorption, excitation, emission, fluorescence decay lifetime, and Eu3+ quantum efficiency. The results are promising for a versatile, tunable laser light emitter.

2. Materials and Methods

Ternary oxide glasses in the chemical composition (90-x) Sb2O3–xB2O3–10Li2O doped with 0.5 (mol. %) of Eu3+ ions were prepared by the melt-quenching technique, where x = 0, 10 to 60 by a step of 10 (mol. %). The seven glasses are referred to as SLB0, SLB1 …, as mentioned in Table 1. The starting materials used in the preparation of these glasses are analytical purity grades: Sb2O3 (supplied by Aldrich (Aldrich Chimie, St. Quentin Fallavier, France), 99.9%), B2O3, Li2CO3 (supplied by Biochem (Biochem chemopharma, Cosne Sur Loire, France), 99%), and Eu2O3 (provided by Sigma-Aldrich, Darmstadt, Germany, 99.5%). Moreover, 8 g of mixed powders were thoroughly mixed in an agate mortar and melted in borosilicate glass tubes with a diameter of 15 mm. The tubes were then flame-heated between 750 and 1000 °C for 10 to 15 min until a clear homogeneous liquid formed. The melted liquid is poured into a preheated brass mold below its glass transition temperature (Tg) at Tg-20 °C and then placed in an electric oven for 5 h to release the thermal stresses introduced by the quenching process. The glass is then gradually cooled to room temperature. Glasses containing concentrations greater than 60% B2O3 have high viscosities and could not be produced in this way. Finally, the samples were polished to a thickness of about 1 mm suitable for optical measurements. XRD scans of the produced glasses were collected using a Bruker D8 Advance diffractometer (Bruker, Karlsruhe, Germany) with Cu radiation (wavelength 1.5418 Å). The characteristic temperatures of these glasses are, namely, the temperature of glass transition (Tg), the temperature of onset of crystallization (Tx), and the temperature of the peak of crystallization (Tp). They were determined using alumina pans from room temperature to 500 °C using differential scanning calorimetry (DSC) (SETARAM, LABSYS evo, Sophia Antipolis, France). The absorption spectra of the glasses were measured using a Perkin Elmer Lambda 35 UV-Vis spectrophotometer (PerkinElmer, Waltham, MA, USA) with 1 nm resolution in the 200–1100 nm range. The Perkin Elmer Spectrum Two (PerkinElmer, Shelton, CT, USA) was used to measure both the absorption spectra with 1 nm resolution in the 1.8–10 µm near infrared red (NIR) range as well as the ATR/FTIR spectra for the structural analysis within the range [4000–400 cm−1]. The density (ρ) of the glass was measured using Archimedes’ principle with an Ohaus Adventurer AX type microbalance (OHAUS Europe GmbH, Nänikon, Switzerland). (ρ) is measured with an accuracy of ±0.002 g/cm−3. The refractive index was measured using a METRICON Model 2010/M (Metricon Corporation, Pennington, NJ, USA) at 632.8 nm wavelength. Photoluminescence spectra were collected using a Horiba FLUROMAX-4 spectrofluorometer (Horiba, Piscataway, NJ, USA). A 150 W, Ozone-free xenon arc lamp is used as an excitation source within the 250–850 nm range. Emission is detected within the 350–850 nm range. Excitation and emission spectra were acquired using a 2 nm slit width and a1 nm interval for both signals. The fluorescence decay curves were measured by monitoring the emission at 612 nm with an excitation wavelength of 361 nm. The chromaticity coordinates and color parameters of the emitted light were determined using the 1931 Commission Internationale de l’éclairage (CIE 1931) standard with freely available software “LED Color Calculator” version 7.23 edited by OSRAM, Premstaetten, Austria.

3. Results and Discussion

3.1. Thermal Properties

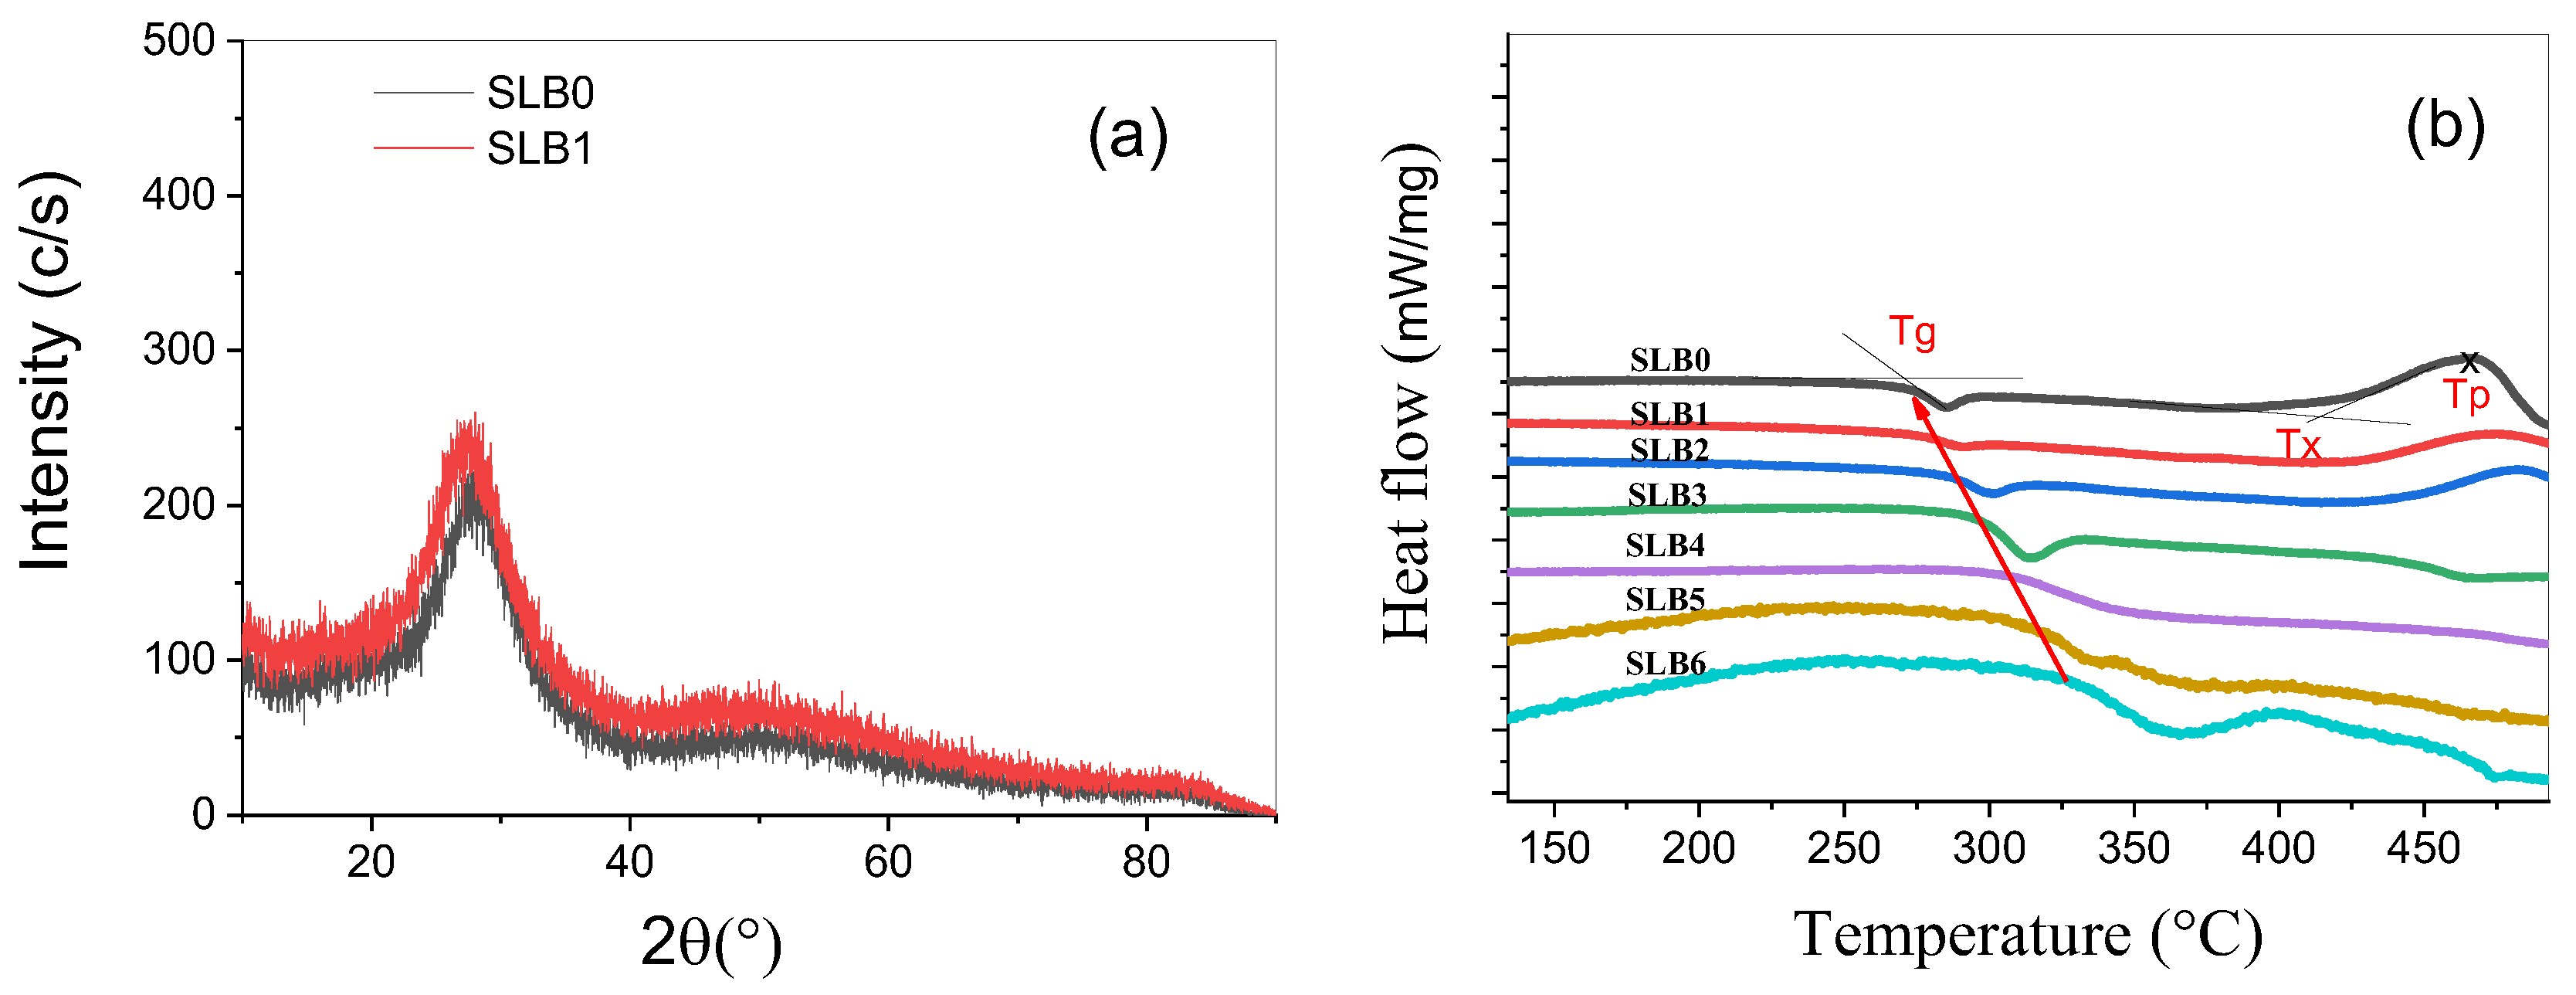
The prepared glasses are pure vitreous. Figure 1a shows the XRD scan of SLB0 and SLB1 glass, for example. These scans reveal an absence of crystalline peaks and show only a halo at 2θ = 30°, characteristic of a vitreous structure. The DSC scans of SLB glasses are illustrated in Figure 1b. The characteristic temperatures Tg, Tx and Tp are measured with accuracies of ± 2, ± 2, and ±1 °C, respectively. They are listed in Table 1. Depending on the glass composition, Tg and the thermal glass stability factor ΔT of SLB glasses increase linearly with increasing B2O3. Replacing Sb2O3 with B2O3 gradually increases the stability factor of the glass. This factor increases from 146 °C for borate-free glass to more than 160 °C for glasses with a higher B2O3 content. This is evident in the broadening and subsequent disappearance of the crystallization peak in glasses containing more than 20 (mol. %) B2O3. This indicates that crystallization does not occur, meaning the glass is thermally stable and can be used for drawing optical fibers [24].

3.2. Physical Properties

3.2.1. Optical Properties

In addition to the measured physical properties of density (ρ) and molar volume (Vm), some other important physical parameters of these glasses are also calculated using well-known appropriate expressions [23]. The number of Eu3+ ions per unit volume (ions.cm−3) is calculated using the following equation:
N = N a × ρ × x × E u 3 + / M
where Na is Avogadro’s number, ρ is the density of the glass, M is its average molecular weight, and x is the Eu3+ concentration. N was used to calculate the polaron radius (rp), using the relation
r p = 1 / 2 ( π / 6 N ) 1 / 3 .
The average separation of Eu3+ ions (ri) is derived from the expression
r i = N 1 / 3 ,
And the field strength F is calculated using the relation
F = Z / r 2
where Z is the charge of the ion and r is the Eu3 radius. Table 2 summarizes all the calculated values for these parameters.
An increase in the content of boron oxide results in a reduction in both density and molar volume. The density is governed by the addition of either light or heavy elements; the density of B2O3 is 1.797 (g·cm−3) is lower than that of B2O3 5.054 (g·cm−3) [27]. More boron oxide decreases density. The decrease in molar volume can similarly be related to the decrease in the ionic radius between Sb and B. Furthermore, a decrease in the molar volume implies proportional reductions in bond length, the interatomic distance between atoms, the polaron radius, and the interionic distance. Consequently, replacing antimony oxide with boron oxide should increase compactness as boron oxide is a strong glass-former that creates strong atomic bonds. It also generates more bridging oxygen (BO) which increase the glass rigidity and the glass transition temperature Tg [27]. As a result, a considerable increase in the glass viscosity is observed during the melting of boron-rich samples.
According to the glass composition, the molar concentration of europium oxide is 0.5 (mol. %) for all glasses. Increasing the amount of boron oxide instead of antimony oxide reduces the molar volume of the glass, allowing more Eu3+ ions to be incorporated into the glass per unit volume. Consequently, the number of Eu3+ ions increases from 1.128 to 1.491 (ions/cm3). Furthermore, as rare earth ions generally occupy interstitial sites in the glass structure, the decrease in average distance between rare earth and oxygen corresponds to an increase in Eu-O bond strength and leads to an increase in the field strength around Eu3+ ions [31]. In summary, the change involved in the gradual replacement of Sb2O3 by up to 60 (mol. %) of B2O3 led to a decrease in the relative value of all properties up to nearly 24%, while the number per unit volume of Eu3+ ions increased by about 32% and by 20% for the field strength F.

3.2.2. Structural Analysis

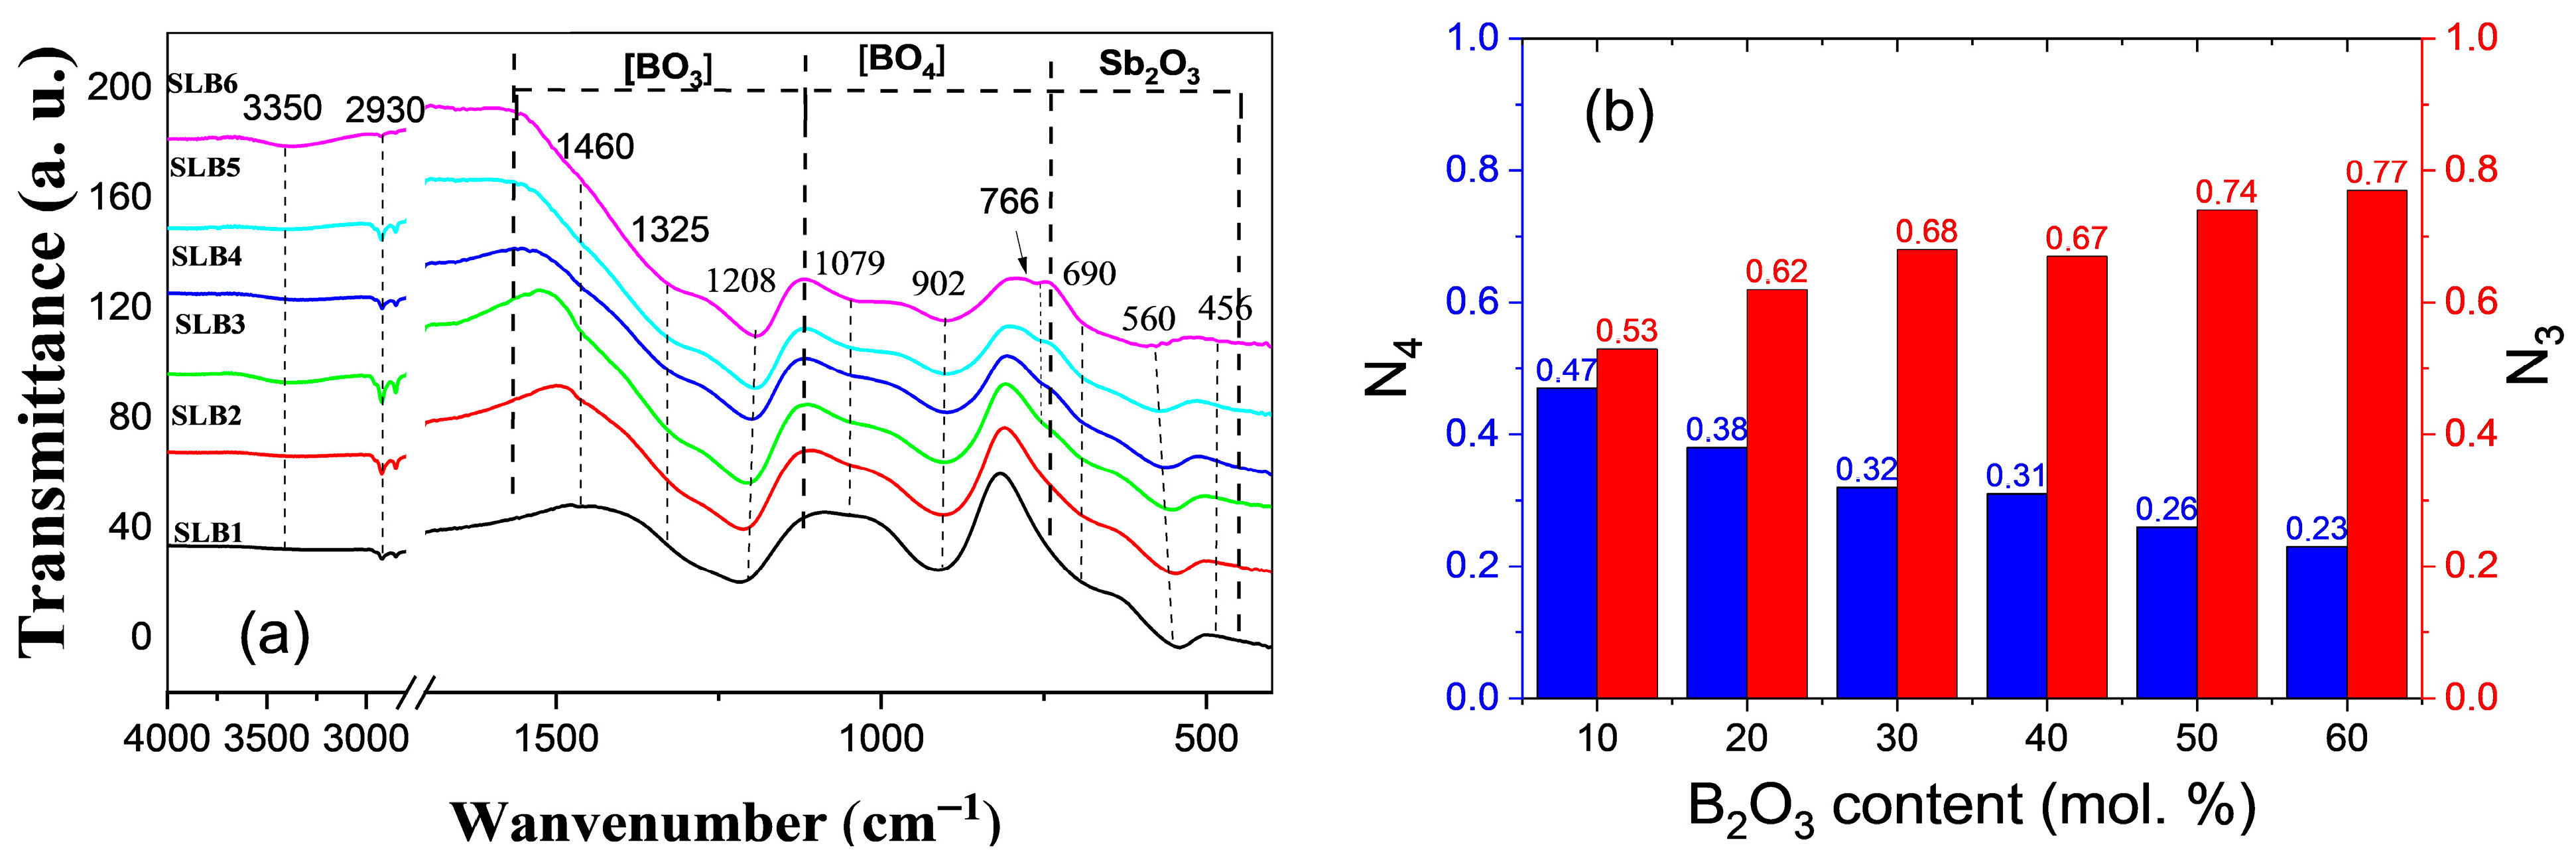
Figure 2a shows the ATR-FTIR transmittance spectra of Eu3+-doped Sb2O3-B2O3-Li2O glasses within the 4000–400 cm−1 range. Boron oxide-based glasses consist of three-coordinated boron atoms that form triangular units [BO3] as well as four-fold coordinated [BO4] tetragonal units. Three [BO3] bonded by bridging O (BO) form boroxol rings. However, in the negatively charged [BO4] unit, the fourth oxygen atom (non-bonded oxygen or NBO) is shared with a modifier element, such as an alkaline element, to fully balance its charge. The spectra of SLB glasses can be divided into three regions [32]. The first region between 1500 cm−1 and 1150 cm−1 is due to the B–O vibrational modes of [BO3] units. The second region between 1150 cm−1 and 800 cm−1 is attributed to the B–O vibrations of [BO4] units. The third region between 800 and 400 cm−1 relates to the vibrational modes of Sb2O3 according to Terashima et al. [27]. The vibrational spectra of vitreous antimony oxide exhibit four absorption bands that correspond to the vibration mode of the [SbEO3] trigonal pyramid in Cs, or C1 symmetry. Here, E denotes the lone pair of electrons of Sb2O3. This configuration is characteristic of the valentinite form of Sb2O3. The four bands are positioned at: 590 cm−1 ν3 (asymmetric stretching), 470 cm−1 ν4 (asymmetric bending), 690 cm−1 ν1 (symmetric stretching), and 540 cm−1 ν2 (symmetric bending) [27]. In SLB glasses, the first two observed vibrational bands at 456 and 560 cm−1, and the two shoulders at 600 (not clearly observed) and 700 cm−1 correspond well to the vibration modes of the [SbEO3] unit.
As the B2O3 content increases, the bands related to Sb2O3 decrease progressively while B2O3-new related bands emerge in the first and second regions. The short band within 763 to 770 cm−1 is due to the asymmetric bending vibrations of BO3-O–BO4 [32]. This band appears when the B2O3 content exceeds 20 (mol. %). In region two, the band at 902 cm−1, results from the asymmetric stretching vibration of B-O-B in [BO4] [32]. The band at 1079 cm−1 is assigned to the vibration of pyroborate and the B–O bond in [BO4]. The large band around 1208 cm−1 is related to the B-O stretching vibrations of [BO3] units in boroxol rings, and the band at 1314 cm−1 is related to the B-O stretching vibrations of [BO3] units in metaborate, pyroborate, and ortoborate groups. Finally, the bands at 2930 cm−1 and 3350 cm−1 are related to the CO2 of the atmosphere and the OH vibration of the raw materials, respectively [32]. Analysis using ATR-FTIR reveals that the Eu3+-doped SLB glass structure consists of [SbEO3], [BO3], and [BO4] units.
The following equations are often used to quantify the number of [BO4] and [BO3] structural units in Eu3+-doped SLB glasses [12]: N4 = A4/(A4 + A3) and N3 = A4/(A4 + A3). A3 represents the fraction of the relative area of the vibrational bands of [BO3] within the 1150–1500 cm−1 region, and A4 represents the fraction of the relative area of the vibrational bands assigned to [BO4] within the 1150–800 cm−1 region. The results of this analysis are illustrated in Figure 2b. There are always more [BO3] units than [BO4] units. As the B2O3 content in the glasses increases, the number of [BO3] units rises linearly from 0.53 to 0.77. Conversely, the number of [BO4] unit decreases from 0.47 to 0.23.

3.2.3. Transmission Spectra

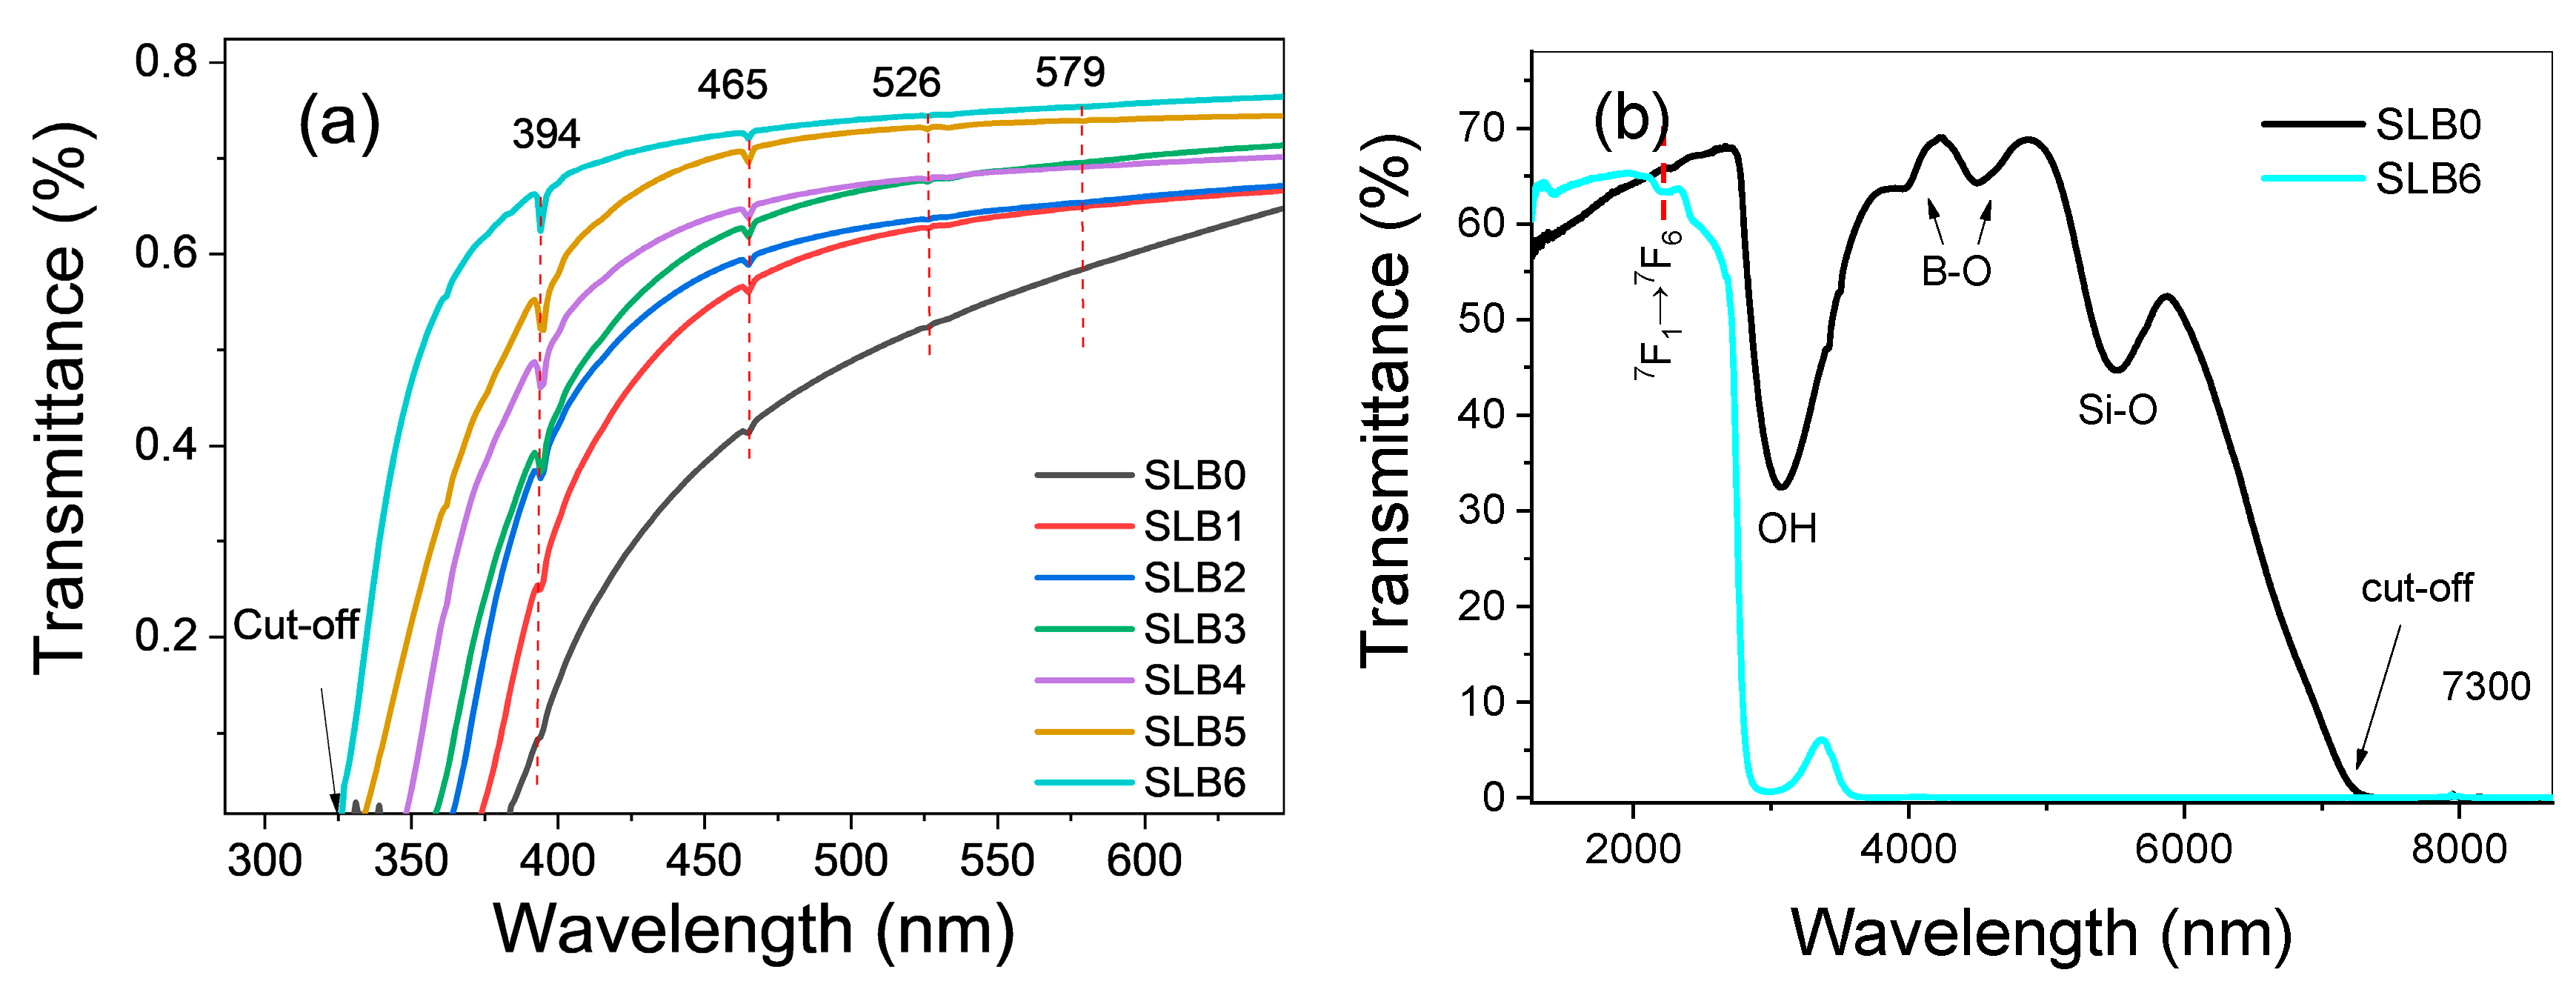
The transmission spectra of SLB glasses doped with 0.5 (mol. %) Eu2O3 are measured in the UV-VIS region and are shown in Figure 3a. It is clear that the addition of boron oxide, a good traditional glass former, significantly increases the transparency of the antimony-based glass [8]. Thus, the cut-off value shifts from 384 nm for SLB0 glass to 325 nm in the UV region for SLB6 glass. Furthermore, the intensity of transmitted light of all glasses increases to 85% for higher B2O3 content across the entire range [400–1100 nm]. This is mainly due to a decrease in the reflection losses of the glasses caused by the decrease in the refractive index. The spectra reveal a few weak absorption bands in the visible range at 394, 465, 526, and 579 nm, related to the band transitions of Eu3+ ions well dissolved in these glasses. As shown in Figure 3b, the transmission cut-off, also known as multiphonon cut-off, moves from around 7.3 µm for SLB0 glass to around 2.4 µm for SLB6 glass in the infrared spectrum. The OH vibration band occurs at 3 µm for SLB0 glass. However, when boron oxide is added, it overlaps with B-O vibration bands. This overlap is clearly observed in SLB6 glass. The B-O vibrational band at 3960 and 4570 nm is caused by the borosilicate crucible that was used to make SLB0 glass. They are attributed to the overtone of [BO3] and [BO4] structural units, which occur at 1292 and 1094 (cm−1) respectively [32]. However, the band at around 5500 nm is related to the second overtone of the Si-O vibration (910 cm−1) of the dissolved silica (SiO2) in the glass from the crucible [22].

3.2.4. Absorption Spectra

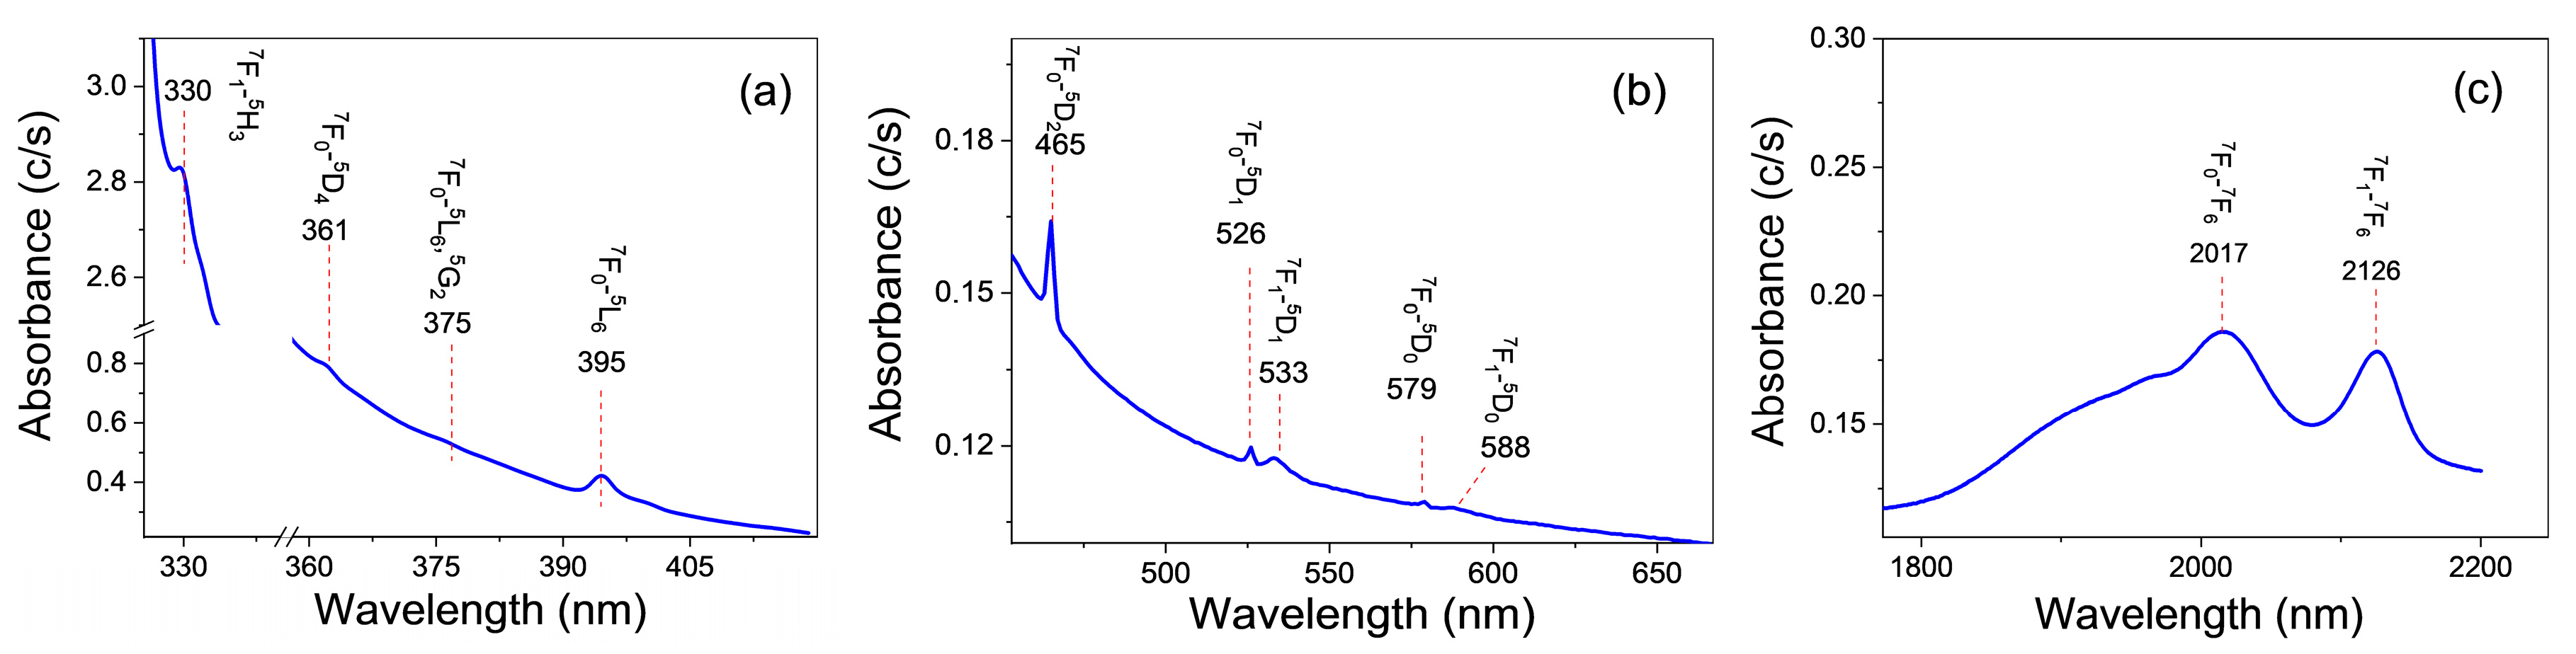
Important optical parameters are quantified by measuring the absorption spectrum in the UV-Vis-NIR range at room temperature. Figure 4a–c, for example, show the absorption spectra of SLB6 glass in different optical regions. Several absorption bands that are associated with the electronic transitions of Eu3+ can be seen [33]. They are clearly very narrow and appear with very low intensities, particularly at low B2O3 content. The absorption bands observed are related to the transitions from the ground state 7F0 and the first thermally populated excited state and 7F1 to the following higher excited states: 7F0 to 5D4 (361 nm), 5G2 (375 nm), 5L6 (395 nm), 5D2 (465 nm), 5D1 (526 nm) and 5D0 (579 nm) and from 7F1 to 5D1 (533 nm) and 5D0 (588 nm). Additionally, SLB6 glass exhibits a very weak band at 330 nm due to its high transparency in the UV range. This is attributed to 7F15H3 transition. All these transitions are spin-forbidden and therefore very weak. In the NIR regions, two other bands are clearly observed and are assigned to 7F07F6 and 7F17F6 transitions. They are spin-allowed and much stronger, as seen in Figure 4c. When the concentration of B2O3 is less than 40 (mol. %), the optical absorption edge of the host glass increases rapidly, and all absorption bands below 380 nm are masked. The appearance of all these bands confirms an effective absorption of Eu3+ ions in these glasses [33,34]. All bands in the spectrum show absolutely no apparent shift of less than 1 nm in the positions of the absorption peaks, but a clear increase in their intensity directly related to the increase in the number of Eu3+ ions per unit volume in each glass as the B2O3 content increases.

3.2.5. Optical Parameters

At high absorption levels (greater than 104 cm−1), the optical band gap (Eg) is often estimated from UV-Vis absorption spectra using the Tauc relation [8]. This relation plots (αhυ) against energy () in a linear manner:
( α h υ ) = A ( h υ E g ) r / h υ
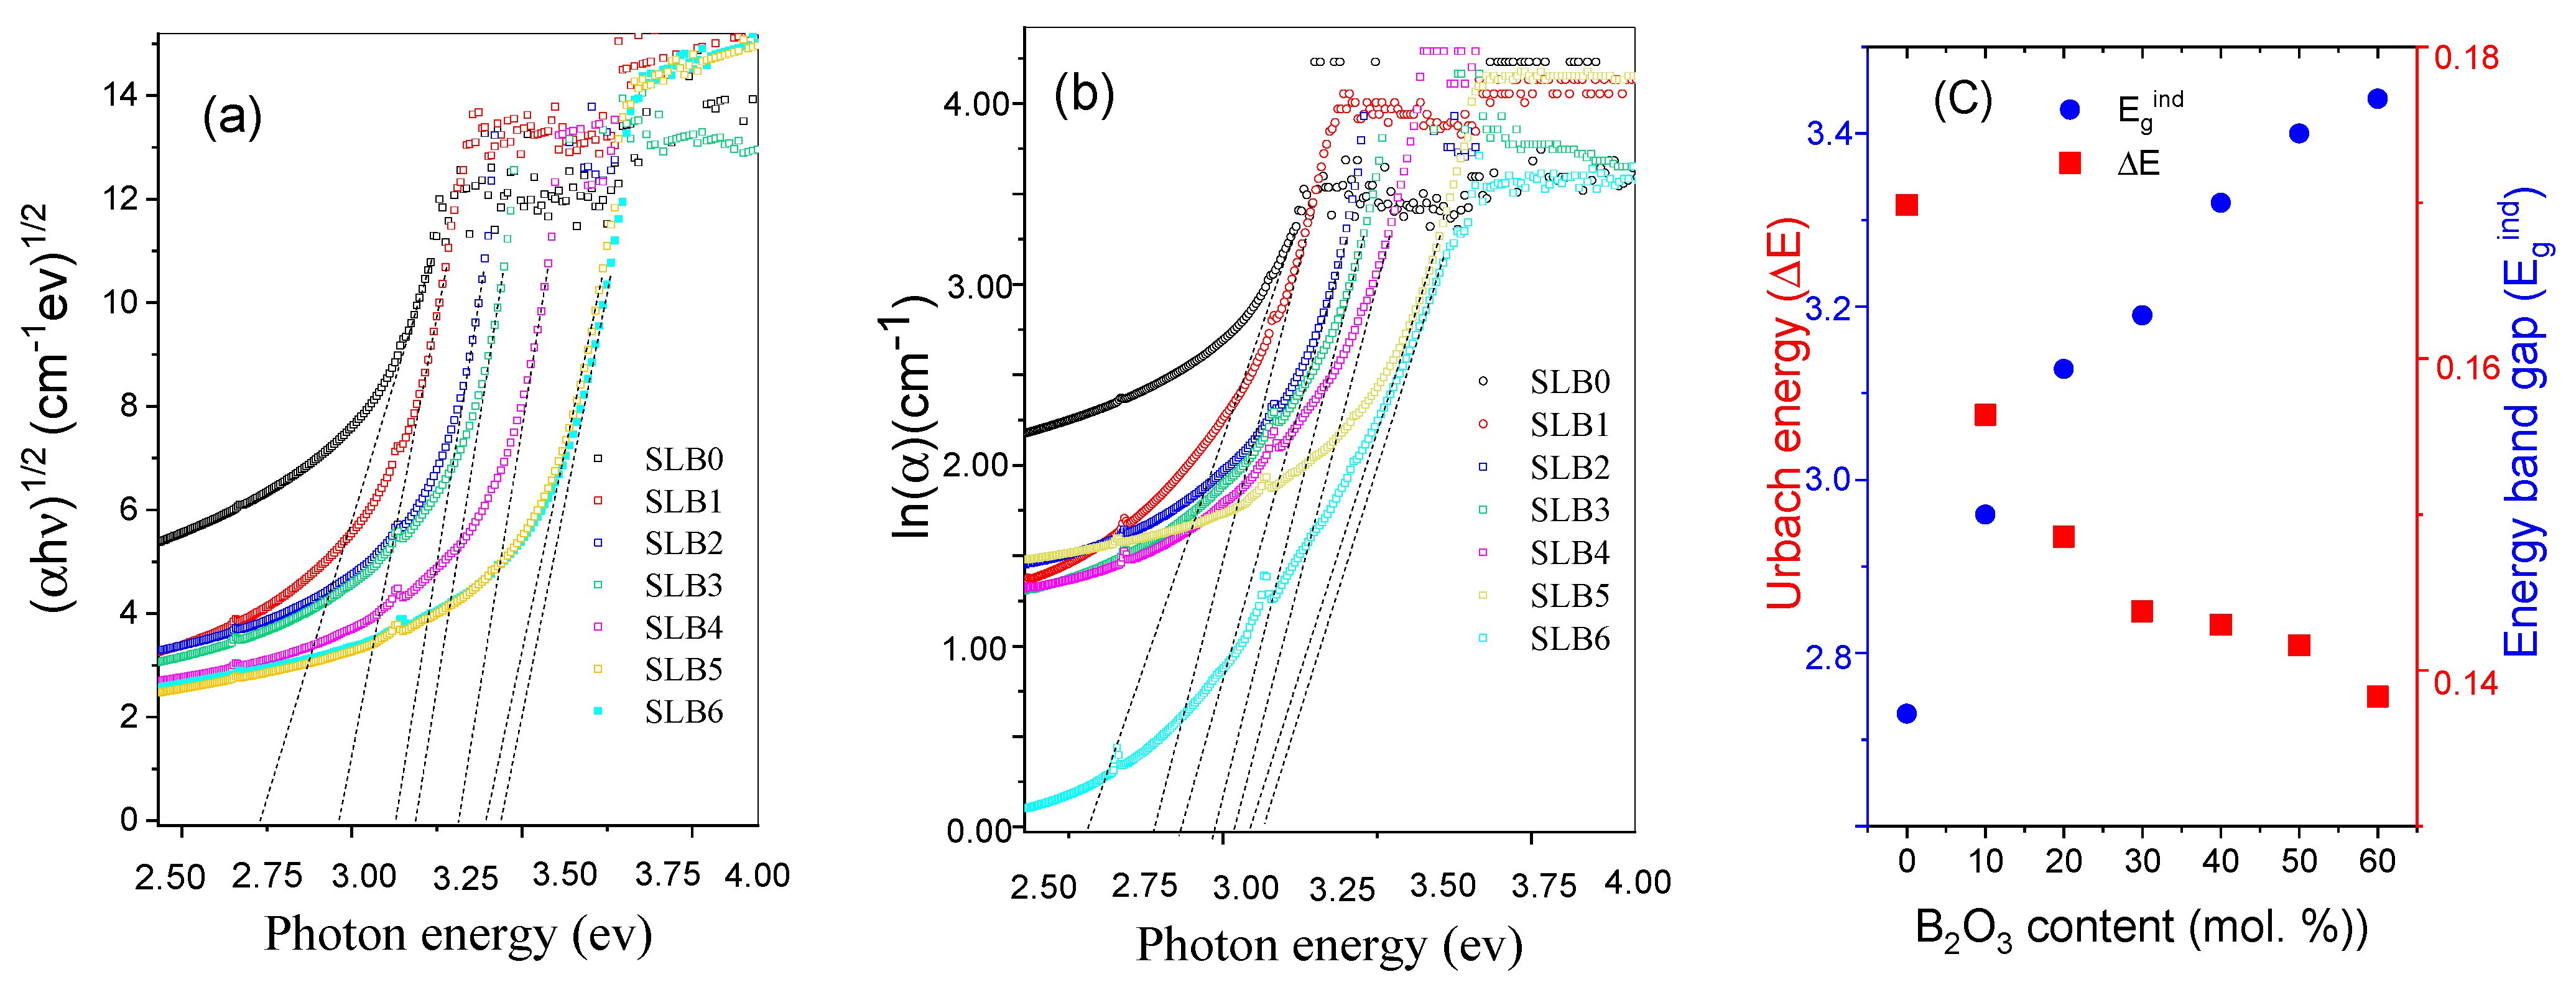
where α is the absorption coefficient, is the photon energy, A is an energy-independent constant, and Egind is the optical band gap. r = 1/2 for an allowed direct transition, generally used for semiconductor materials. Indirect transitions in amorphous and glassy materials require momentum conservation, necessitating the presence of both a photon and a phonon. This results in a more gradual absorption front. Therefore, r = 2 is used and Eg = Egind. Figure 5a plots the indirect energy band gap (α h ν ) versus energy . The presence of a linear shape indicates an indirect optical transition. Then, linear extrapolation is used to determine Egind by fitting the linear part to α = 0 with a 0.01 fitting accuracy. The fundamental absorption edge generally follows the Urbach rule at absorption levels below 104 cm−1. This can be estimated by the following equation [8]:
A ( υ ) = B exp ( h υ / Δ E ) .
where ∆E is the Urbach energy and B is the band tailing factor, which is considered constant. ∆E is calculated using log ( A ( υ ) . As illustrated in Figure 5b, the inverse of the linear slope extrapolated to υ = 0 g divided by ln(e) gives the Urbach energy. An average of 0.008 eV was used to fit a linear extrapolation.
According to Brik et al. [35] and to Chialanza et al. [36], the optimal range for extracting data from each spectrum’s absorption edge was selected to improve accuracy. The Egind values presented in Table 3 and illustrated in Figure 5c were found to increase from 2.73 to 3.44 eV. This is consistent with the values observed for borate glasses [12,35]. An increase in Egind value as B2O3 replaces Sb2O3 indicates a change in the glass structure in the present ternary system. This results in greater separation between the valence and the conduction bands, indicating a more rigid, less polarizable glass structure. This change involves shifting from non-bridging oxygen (NBO) to bridging oxygen (BO). This shift is associated with an increase in [BO3] units at the expense of [BO4] units, thereby enhancing network connectivity and shifting the UV-Vis transmission cut-off toward lower wavelengths. This is in accordance with the previous optical and structural study. Conversely, as illustrated in Figure 5c, the ∆E decreases from 0.169 to 0.140 ev. This indicates variation of the band tail with B2O3 content. Replacing Sb2O3 by B2O3 in Eu3+-doped SLB glasses, decreases the Urbach energy, indicating a more ordered glass lattice with fewer localized states. This improvement in order results in better optical quality and thermal stability. Boron oxide forms rigid and more connected networks than antimony oxide. A regular increase in B2O3 forms more [BO3] units than [BO4] units. This reduces the non-bonded oxygen and increases polymerization. The result is a sharper absorption threshold and lower ∆E [8,35].
According to [37], the refraction index (n) of oxide compounds can be estimated based on Egind values following the relation:
n 2 1 n 2 + 2 = 20 E g i n d .
Several other parameters are also calculated, including the reflection losses percentage R (%), the dielectric constant ε, the optical electronegativity (∆χ*), and the optical basicity (Λth). These parameters had previously been described using standard formulas [31]. As shown in Table 3, the decrease in refractive index and optical basicity (Λth) with increasing B2O3 is due to a reduction in the number of large and highly polarizable Sb3+ ions, being replaced by less polarizable boron ions. Consequently, reflection losses and the dielectric constant, which depends on the refractive index, exhibit a similar trend.
The magnitude of optical electronegativity (∆χ*) is a direct indicator of the nature of chemical bonds in materials. Optical electronegativity is high in an ionic medium and decreases as the covalence of the glass increases [31]. Examining Table 3, the various optical parameters reveal that gradually replacing up to 60 (mol. %) of Sb2O3 with B2O3 increases Egind by 26% and ∆χ* by 15.6%. Conversely, all other properties decreased between 7% and 15%, and the Urbach energy is reduced in SLB6 glass to 22%. ∆E from 0.177 to 0.138 ev.
As previously reported [26,27], the relatively high refractive index and polarisability of antimony borate glasses intensify the effect in nonlinear optics. These glasses show great promise for use in all-optical switching and nonlinear optical devices when combined with Eu3+ emissions.

3.3. Photoluminescence Study

3.3.1. Excitation Spectra

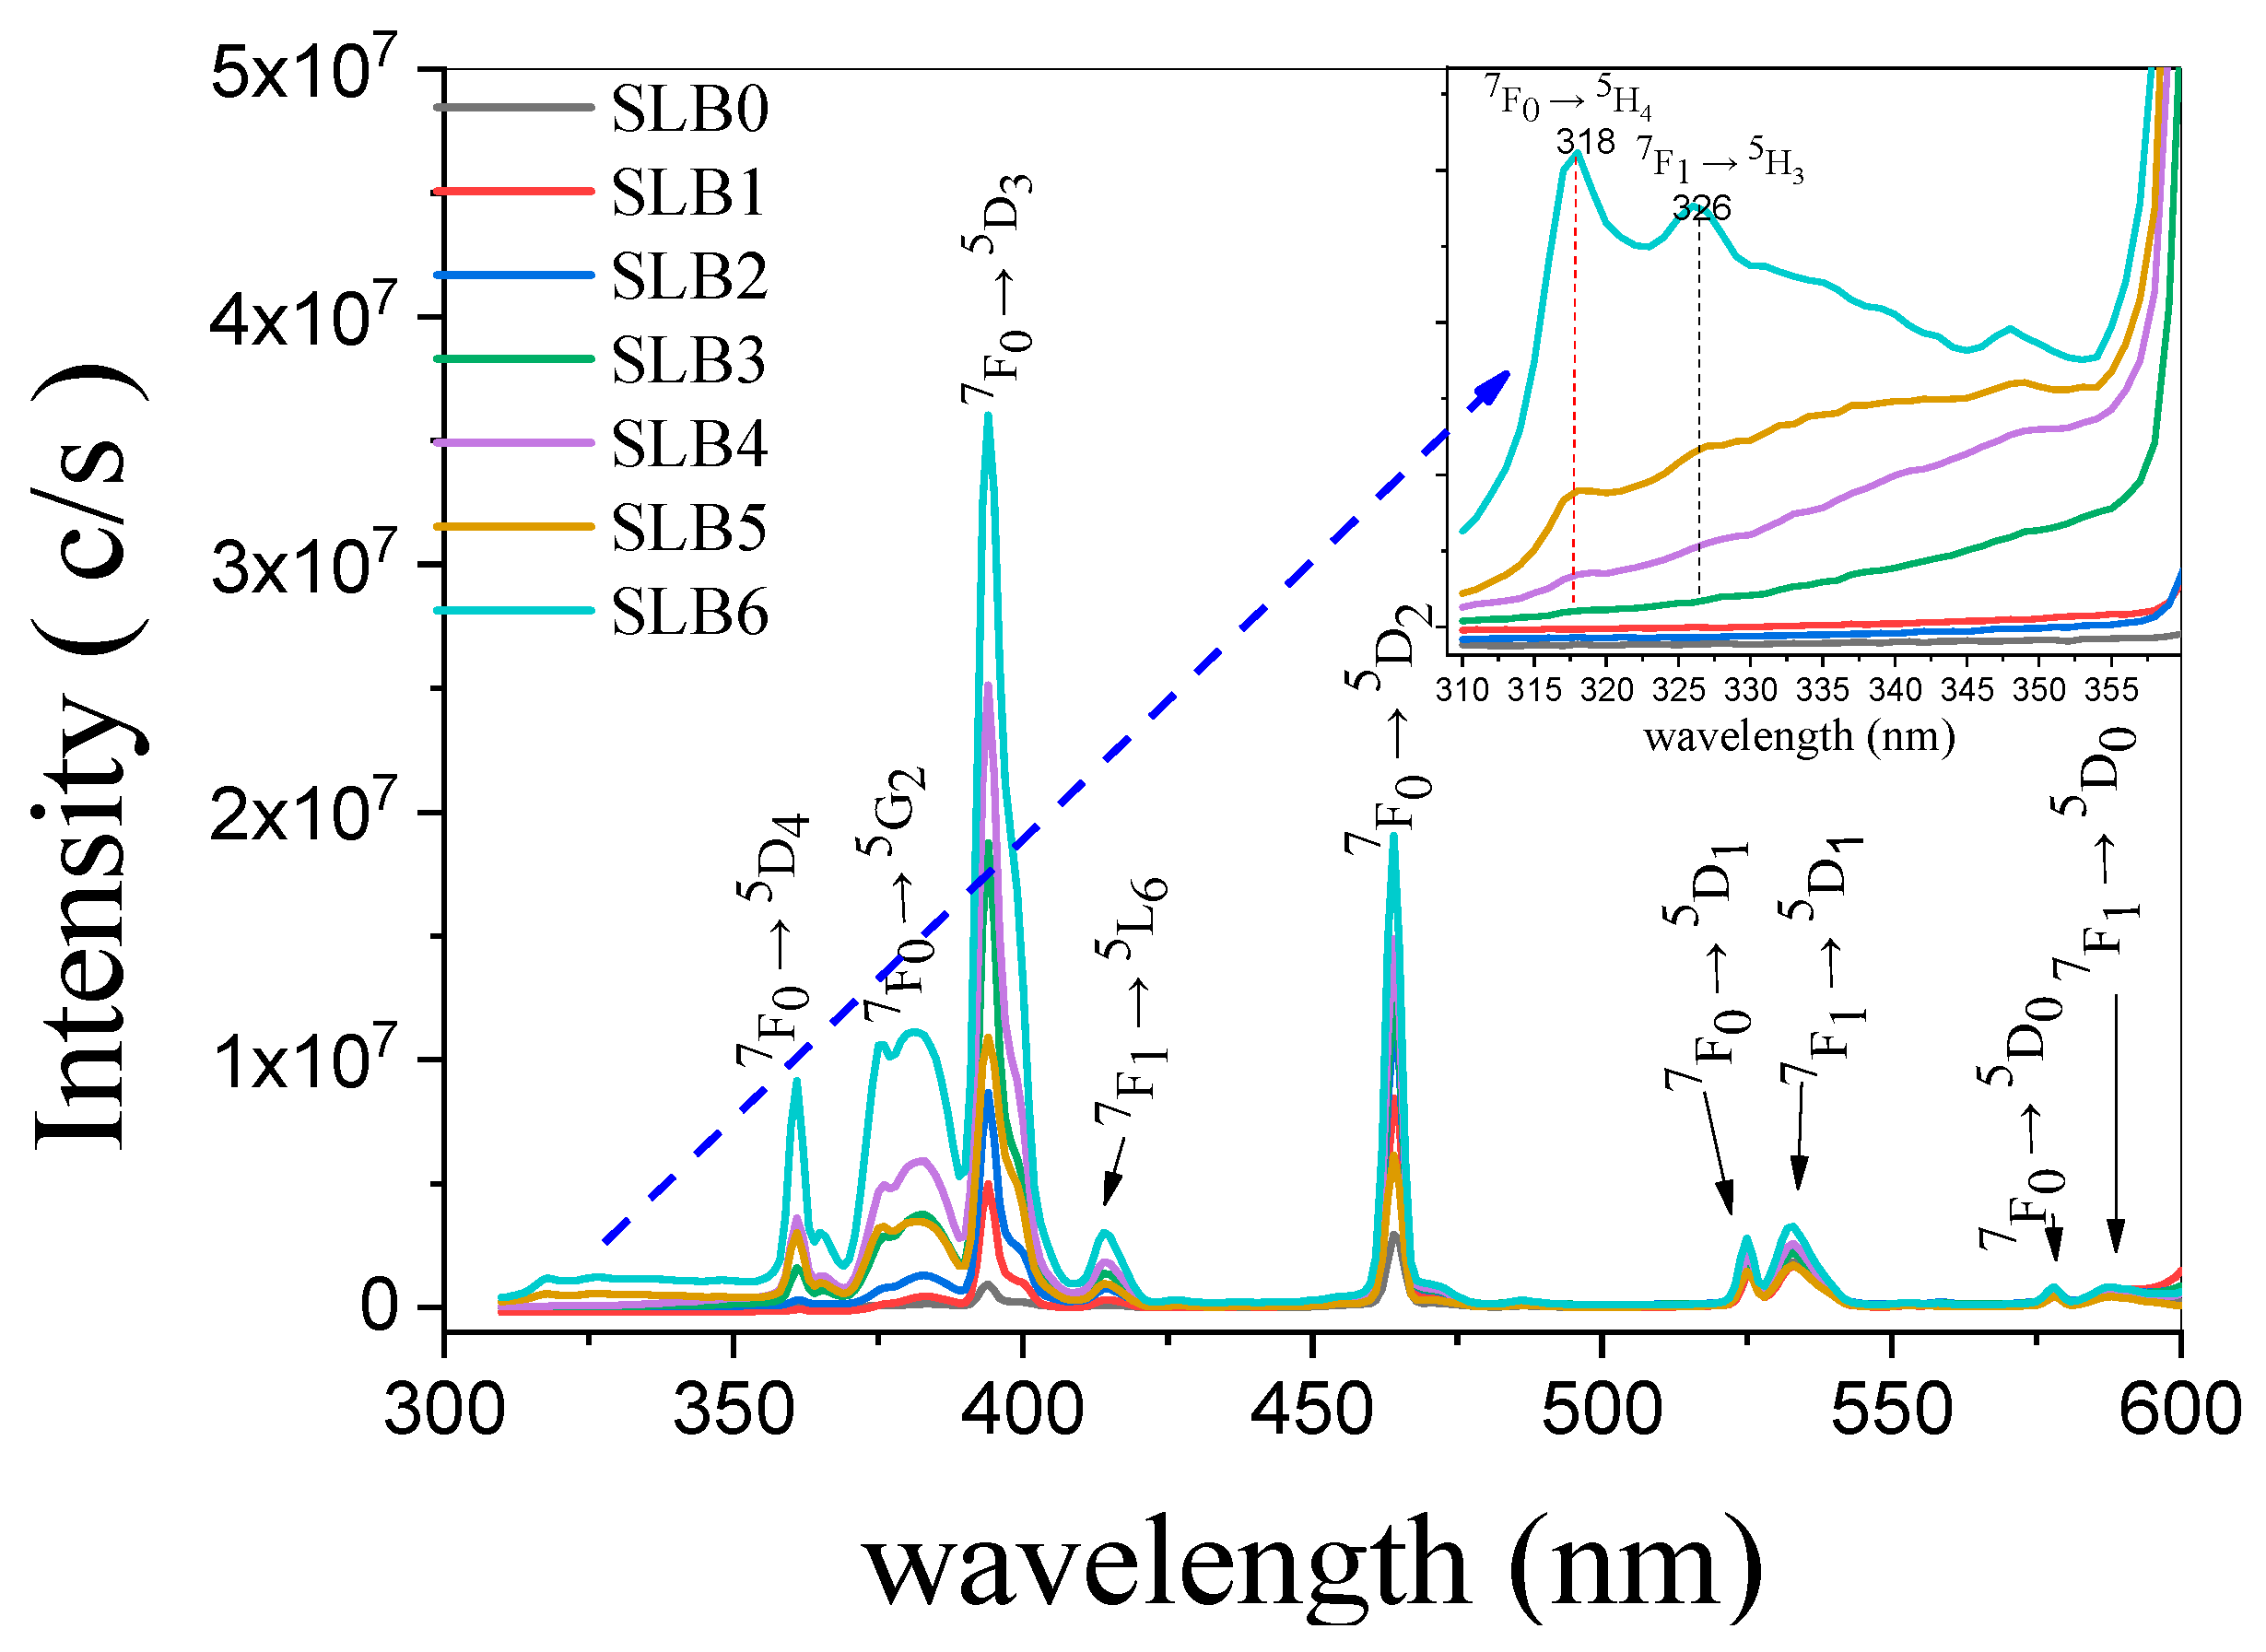
The excitation spectra of Eu3+-doped SLB glasses measured in the range [300–600 nm] by monitoring the emission signal at 612 nm are illustrated in Figure 6. All observed bands correspond well with the typical excitation lines of Eu3+ [33,34]. They are listed in the following order: 361, 381, 394, 414, 464, 525, 533, 578, and 588 nm and assigned respectively to the transitions 7F05D4, 7F05G2, 7F15L6, 7F05D3, 7F05D2, 7F15D1, 7F05D1, 7F15D0, and 7F05D0. As seen in the inset of Figure 6, SLB glasses (4–6) exhibit additional excited state levels in the form of a broad band containing two visible but very weak bands at 318 and 326 nm corresponding to the 7F05H4 and 7F15H3 transitions, respectively. Further interpretations will be discussed in the following sections. Clearly, the position of the different bands remains practically unchanged as B2O3 concentration increases; no shift is observed. Conversely, a gradual increase in the intensity of all peaks is evident. It is suggested that the addition of B2O3 alters the luminescent properties of the Eu3+ ions, potentially by modifying their environment or emission-level population rather than their electronic structure [38].
The most intense bands are observed at 394 and 464 nm due to the relatively strong electric dipolar nature, which is permitted at asymmetric sites. These wavelengths are generally considered to be the most efficient for exciting Eu3+ ions and are frequently used in photoluminescence studies of europium-doped materials [16]. As we will see later, the excitation spectra clearly show very low intensity levels alongside higher excited state levels of Eu3+ (5L6 and 5D1,2,3). They are uncommon and are typically only found in low phonon glasses, such as fluoride and germanate glasses [33,34]. Their presence at room temperature confirms the radiative efficiency of Eu3+ ions in these glasses.
To acquire emission spectra across the entire visible range [400–780 nm], a pumping wavelength of 361 nm in the NUV region was chosen. This avoided the need for chromatic filter accessories, which would have limited the measured wavelength range. From an experimental point of view, it is important to note the following: as shown in Table 4, the 361 nm wavelength has the highest relative intensity (A) of the entire wavelength listed. (A) is given by the ratio A = ISLBx/ISLB0, where x represents the samples (1 to 6). Surprisingly, this ratio increases drastically when x is greater than 2. The SLB (3, 4, 5, and 6) glasses become highly excited. This indicates that an increase in the B2O3 content in the glass leads to a considerable rise in the population of Eu3+ levels at wavelengths below 465 nm in response to excitation at 361. This effect is less pronounced at 394 and 465 nm.

3.3.2. Emission Spectra

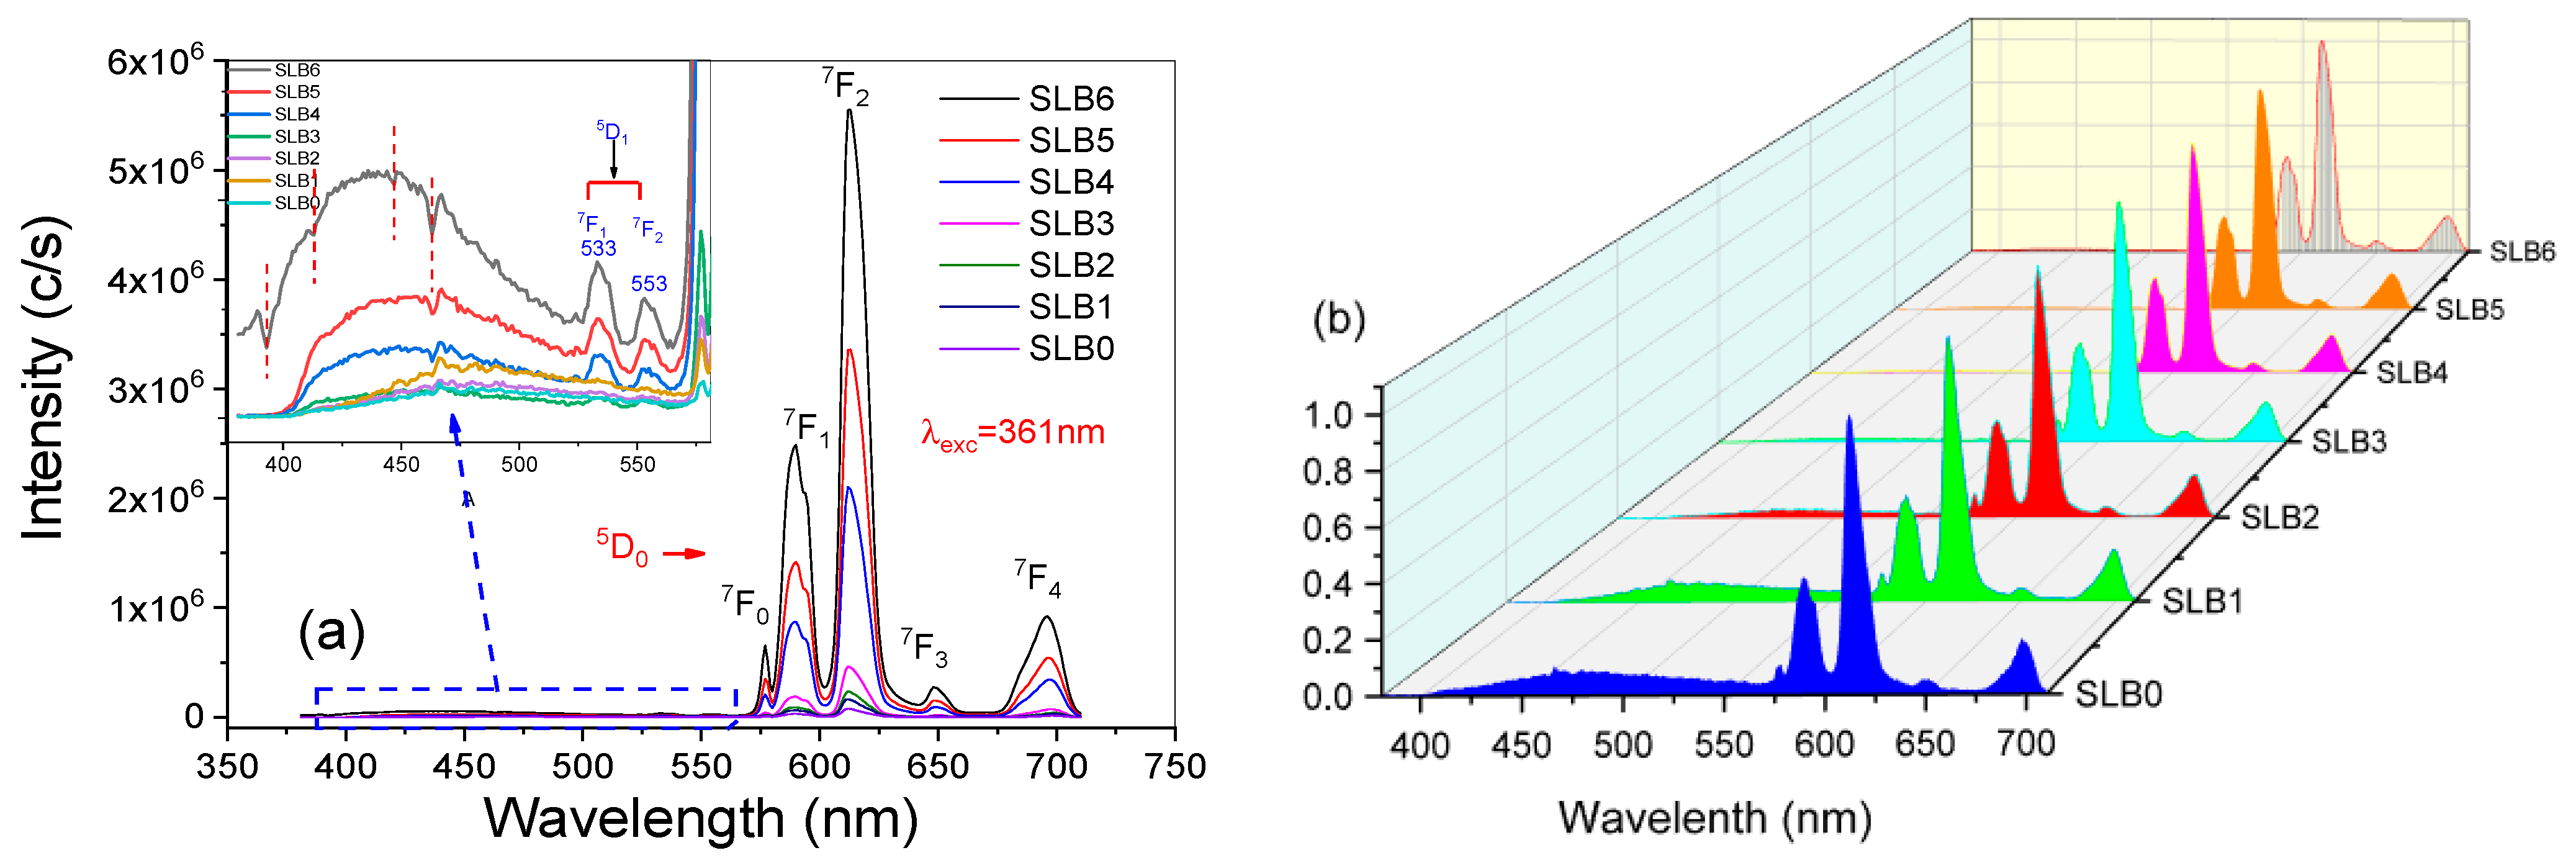
Figure 7a shows the emission spectra of SLB glasses when excited at a wavelength of 361 nm within the range of 400–730 nm. Five clear peaks are visible at 577 (yellow), 590 (orange), 612 (red), 648 (dark red), and 697 (dark red) nm. These peaks are generated by intra-configurational transitions from the excited 5D0 state to the 7Fj (j = 0 to 4) ground states. This is a characteristic feature of Eu3+ ions in low symmetry [16,39]. Additionally, two weak bands in the green region are observable at 533 and 553 nm, which are associated with5D1→ (7F1 and 7F2) transitions, respectively. Furthermore, emissions from the 5D07F5 transitions at 740 nm and the 5D07F6 transition at 810 nm produce very faint emissions. This feature is uncommon, but it has been observed in low-phonon fluoride, germinate, and the present glasses [33,34,39]. Finally, a very weak, broad emission was observed in the blue region (420–520 nm) as shown in the inset of Figure 7a. The position of all observed emission bands does not change with composition.
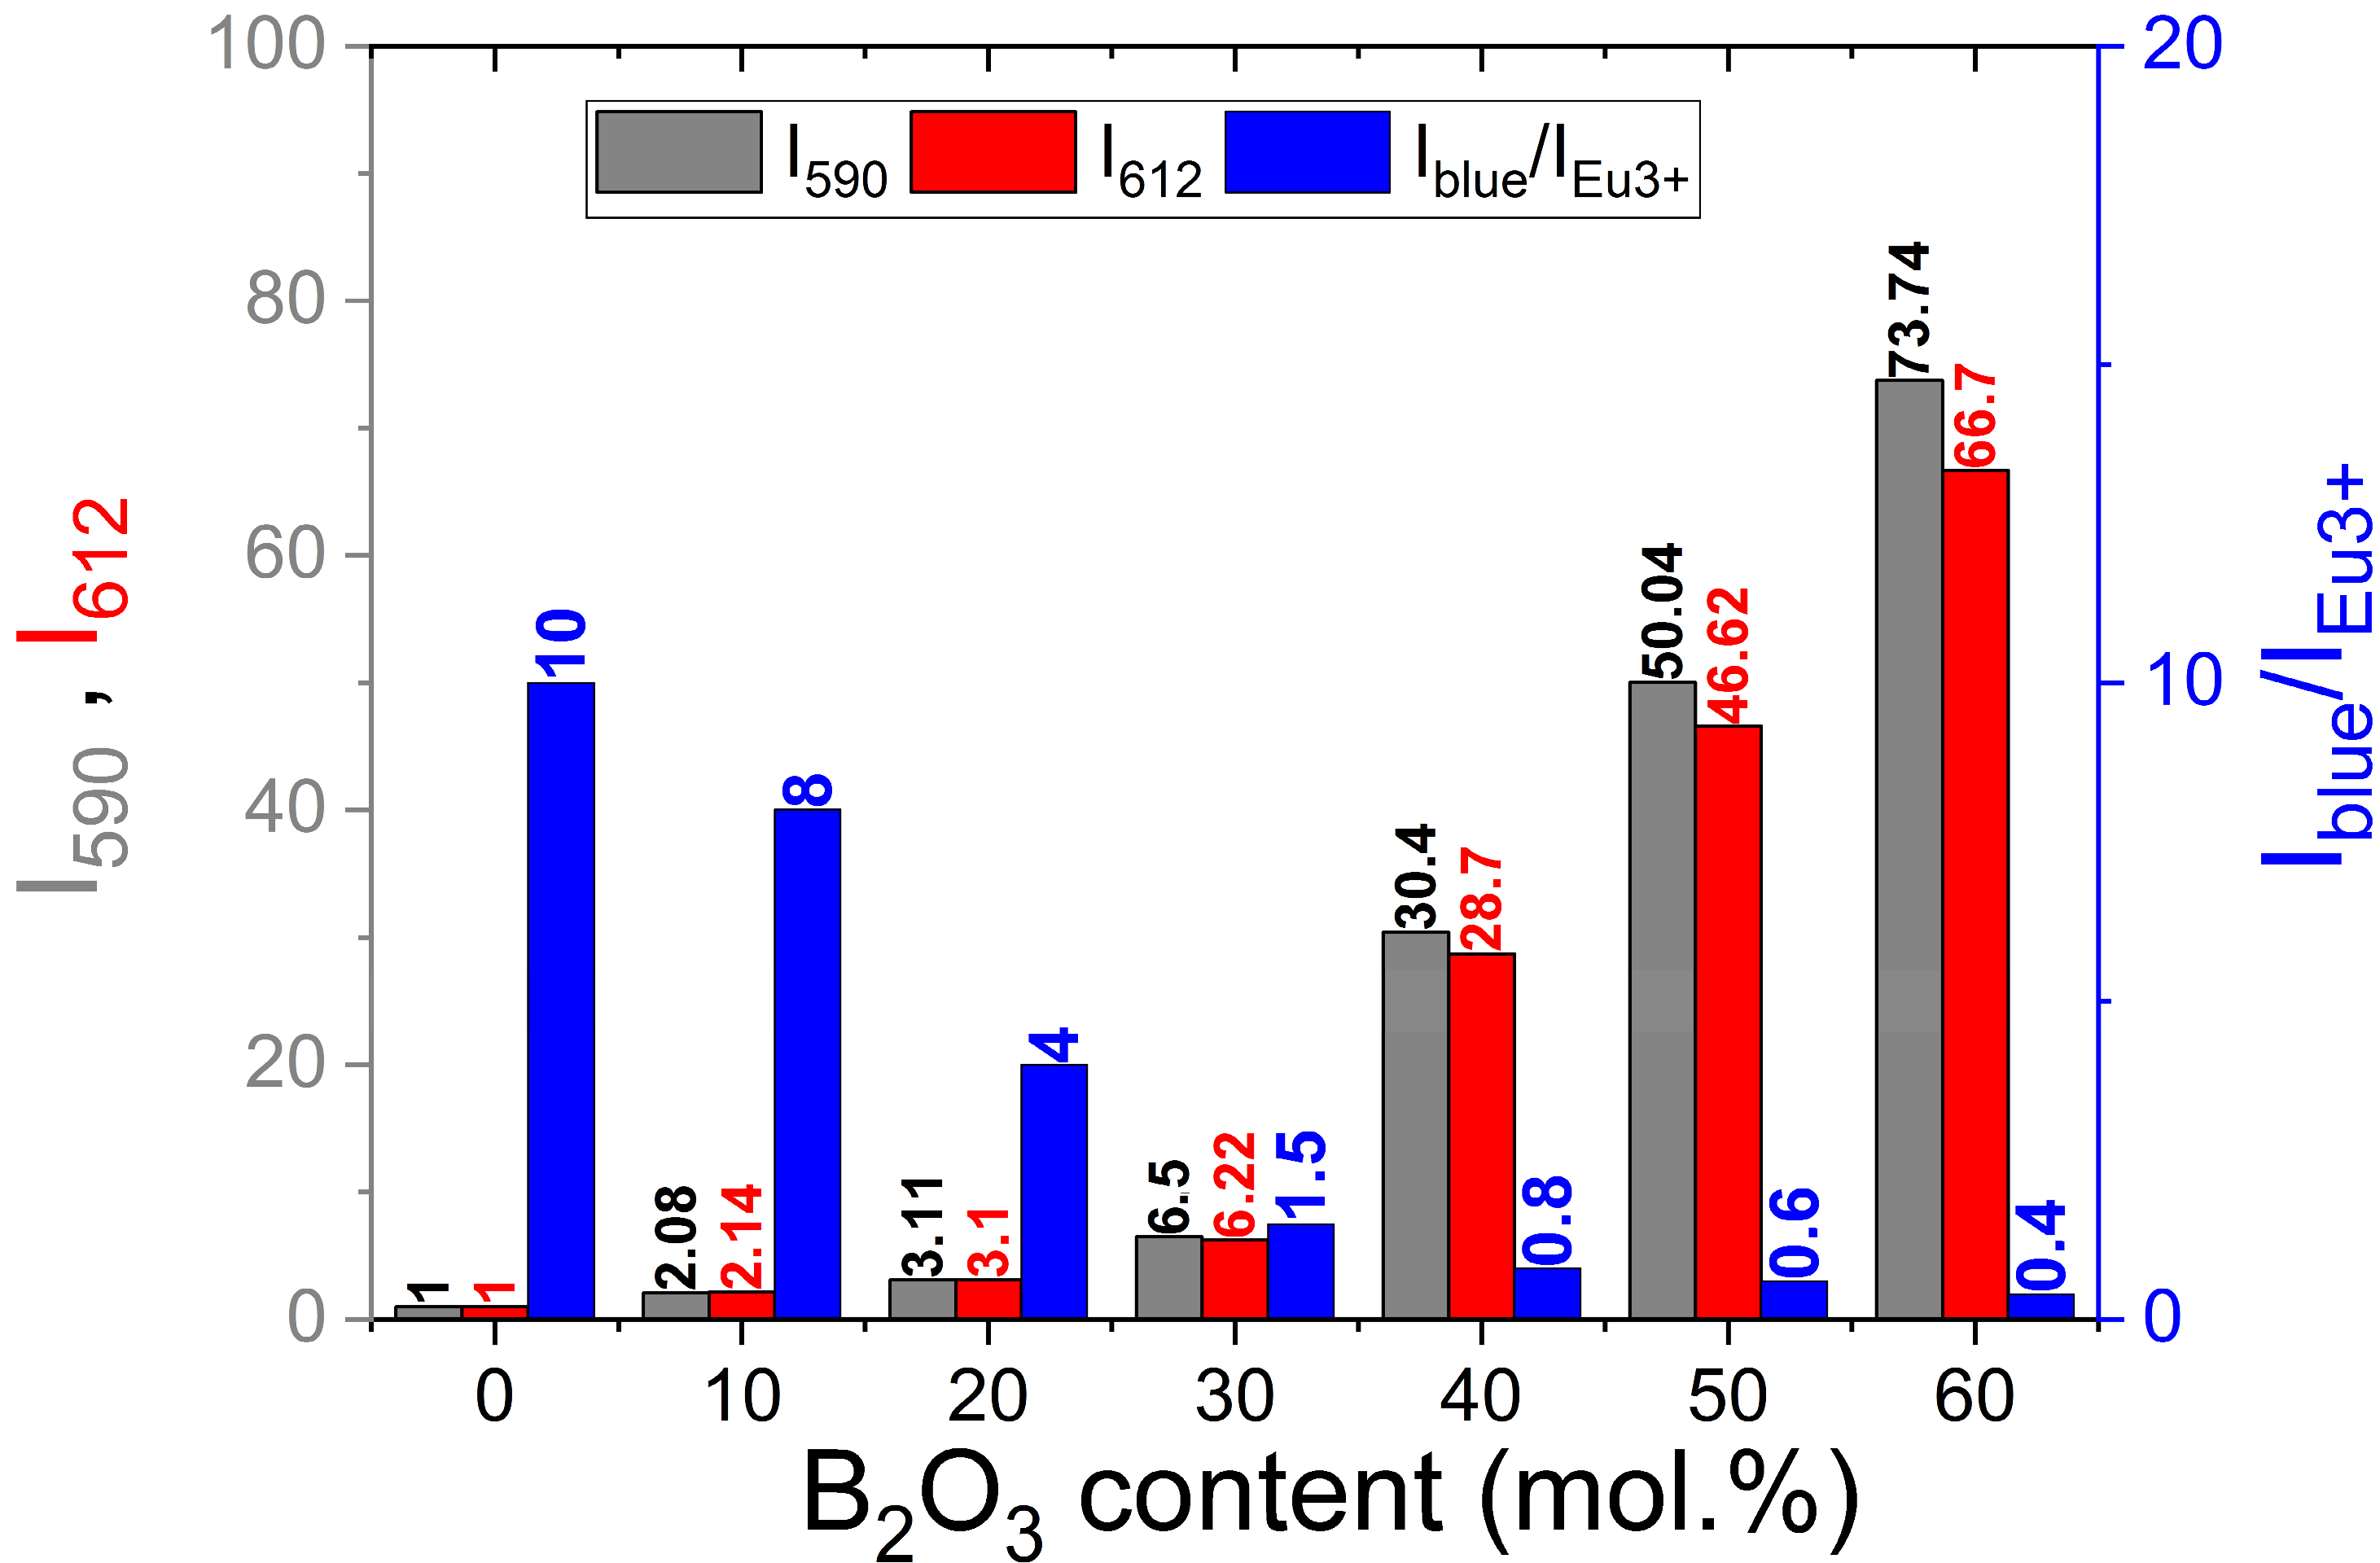
As seen in Figure 7b, the normalized emission spectra are similar for all glasses except for the blue emission, which decreases as the concentration of B2O3 increases. However, as seen in Figure 7a, the intensity of the Eu3+ emission lines increases considerably with B2O3 concentration. The total intensity of Eu3+ emissions in SLBx glasses increases when the B2O3 content is higher than x = 30 (mol. %). Figure 8 shows that the integrated intensity of the ED (612 nm) and MD (590 nm) emissions increased simultaneously by a factor of two, three, and six for SLB (1–3) samples and 30, 50, and 70 times for SLB (4–6) compared to the SLB0 sample. As the B2O3 concentration increased, the intensity (Iblue) of the blue emission increased more slowly than that of the f-f lines emission of Eu3+. Conversely, the integrated emission Iblue/I612 ratio was found to decrease progressively: 0.1, 0.08, 0.04, and 0.015 for SLB (0–3) glasses and 0.008, 0.006, and 0.004 for SLB (4–6) glasses. Figure 8 shows the ratio of this.
As reported previously [16,39], the 5D07FJ emission lines provide insight into the asymmetry, local environment, and field strength surrounding Eu3+ ions in various hosts. The low intensity 5D07F0 and 5D07F3 lines are forbidden electric dipole transitions that occur via J mixing and only appear in a strong local field. The 5D0→7F0 line occurs only in weak Cn, Cnv, or Cs symmetry, meaning it cannot be split by the crystal field into more than one peak. The 5D07F1 line is a magnetic dipole transition that is largely independent of the surrounding Eu3+ ions; however, it becomes dominant in a high-symmetry environment. The splitting of the 5D07F1 emission lines into three lines suggests that Eu3+ ions occupy a single site. Conversely, the hypersensitive electric dipole transition 5D07F2 dominates the 5D07F1 line when Eu3+ occupies an inversion symmetric site under high field strength. The 5D07F4 emission, which occurs at 697 nm, is environment-dependent, but not hypersensitive.

3.3.3. Asymmetric Ratio

The asymmetric ratio defined as R = 5D07F2/5D07F1 can provide valuable information about the covalence and local symmetry of the ligands surrounding Eu3+ ions [16]. While it can typically be calculated using the respective emission intensity ratios. The integrated intensity line ratio is preferable for greater accuracy as it considers the additional intensity contributions arising from the splitting of the two emission lines in an asymmetric environment [16].
R values were found in the range 3.224–3.024. This corresponds to a scale of 1 to 7 in an asymmetric oxide glass environment [17,39]. These are summarized in Table 5.
This indicates that the environment of Eu3+ in these glasses is asymmetrical [33]. The increase of R with respect to B2O3 content (from 0 to 10 (mol.%) is most likely due to environmental changes resulting from [BO4] and [BO3] structural units being incorporated into the glass alongside existing Li+ and Sb3+ ions. Any Further increase in B2O3 content alters the [BO3]/[BO4] ratio. This occurs through a decrease in [BO4] units and an increase in [BO3] units. This increases the rigidity of the glass by replacing weaker SbO3 units with stronger [BO3] units. Consequently, above 10 (mol. %) of B2O3, the R ratio slightly decreases to 3.024. This non-monotonic behavior indicates the stabilization of an asymmetric local environment characterized by strong dominant covalent bonds as well as a structural crossover within the borate-antimonate lattice.

3.3.4. Origin of the Blue Emission

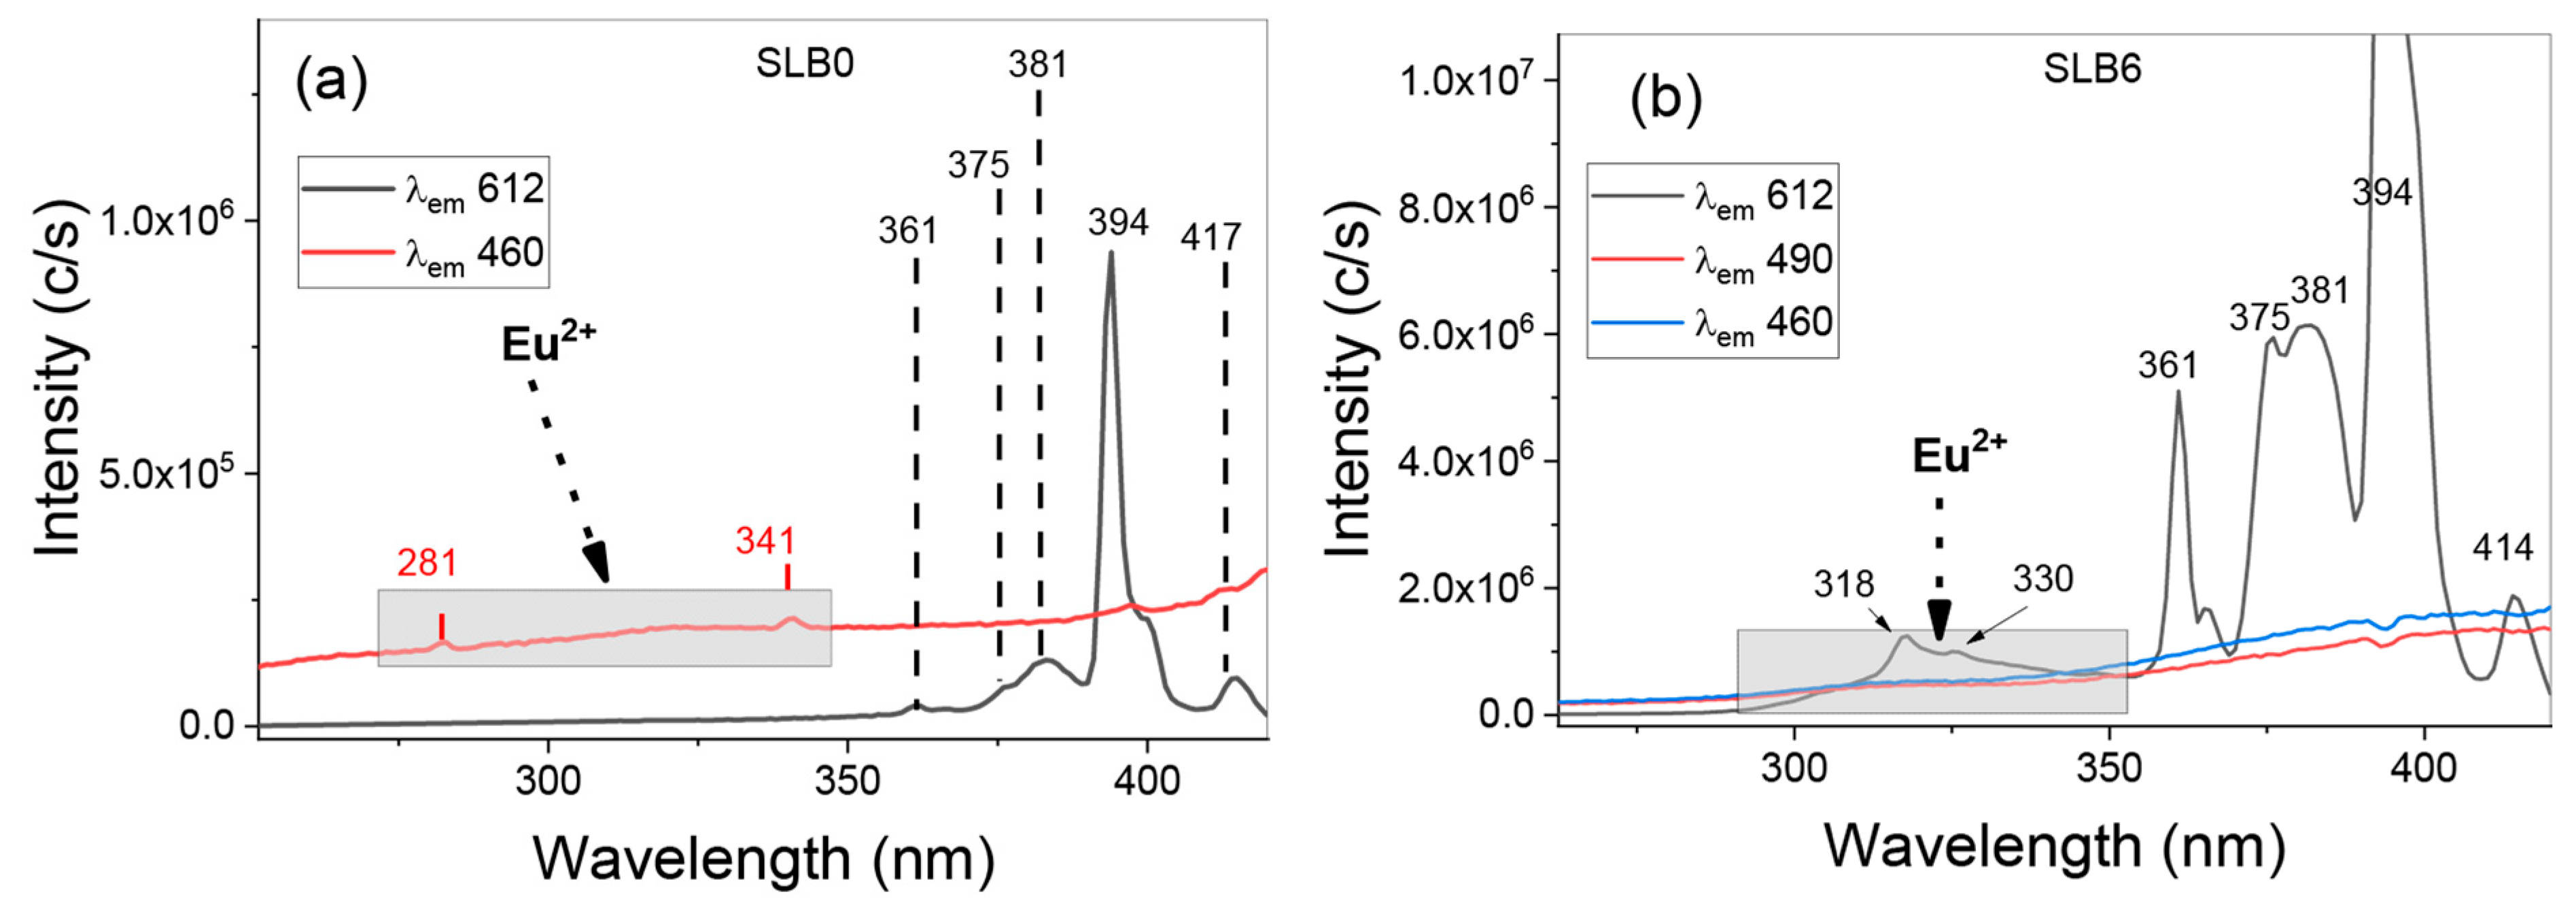
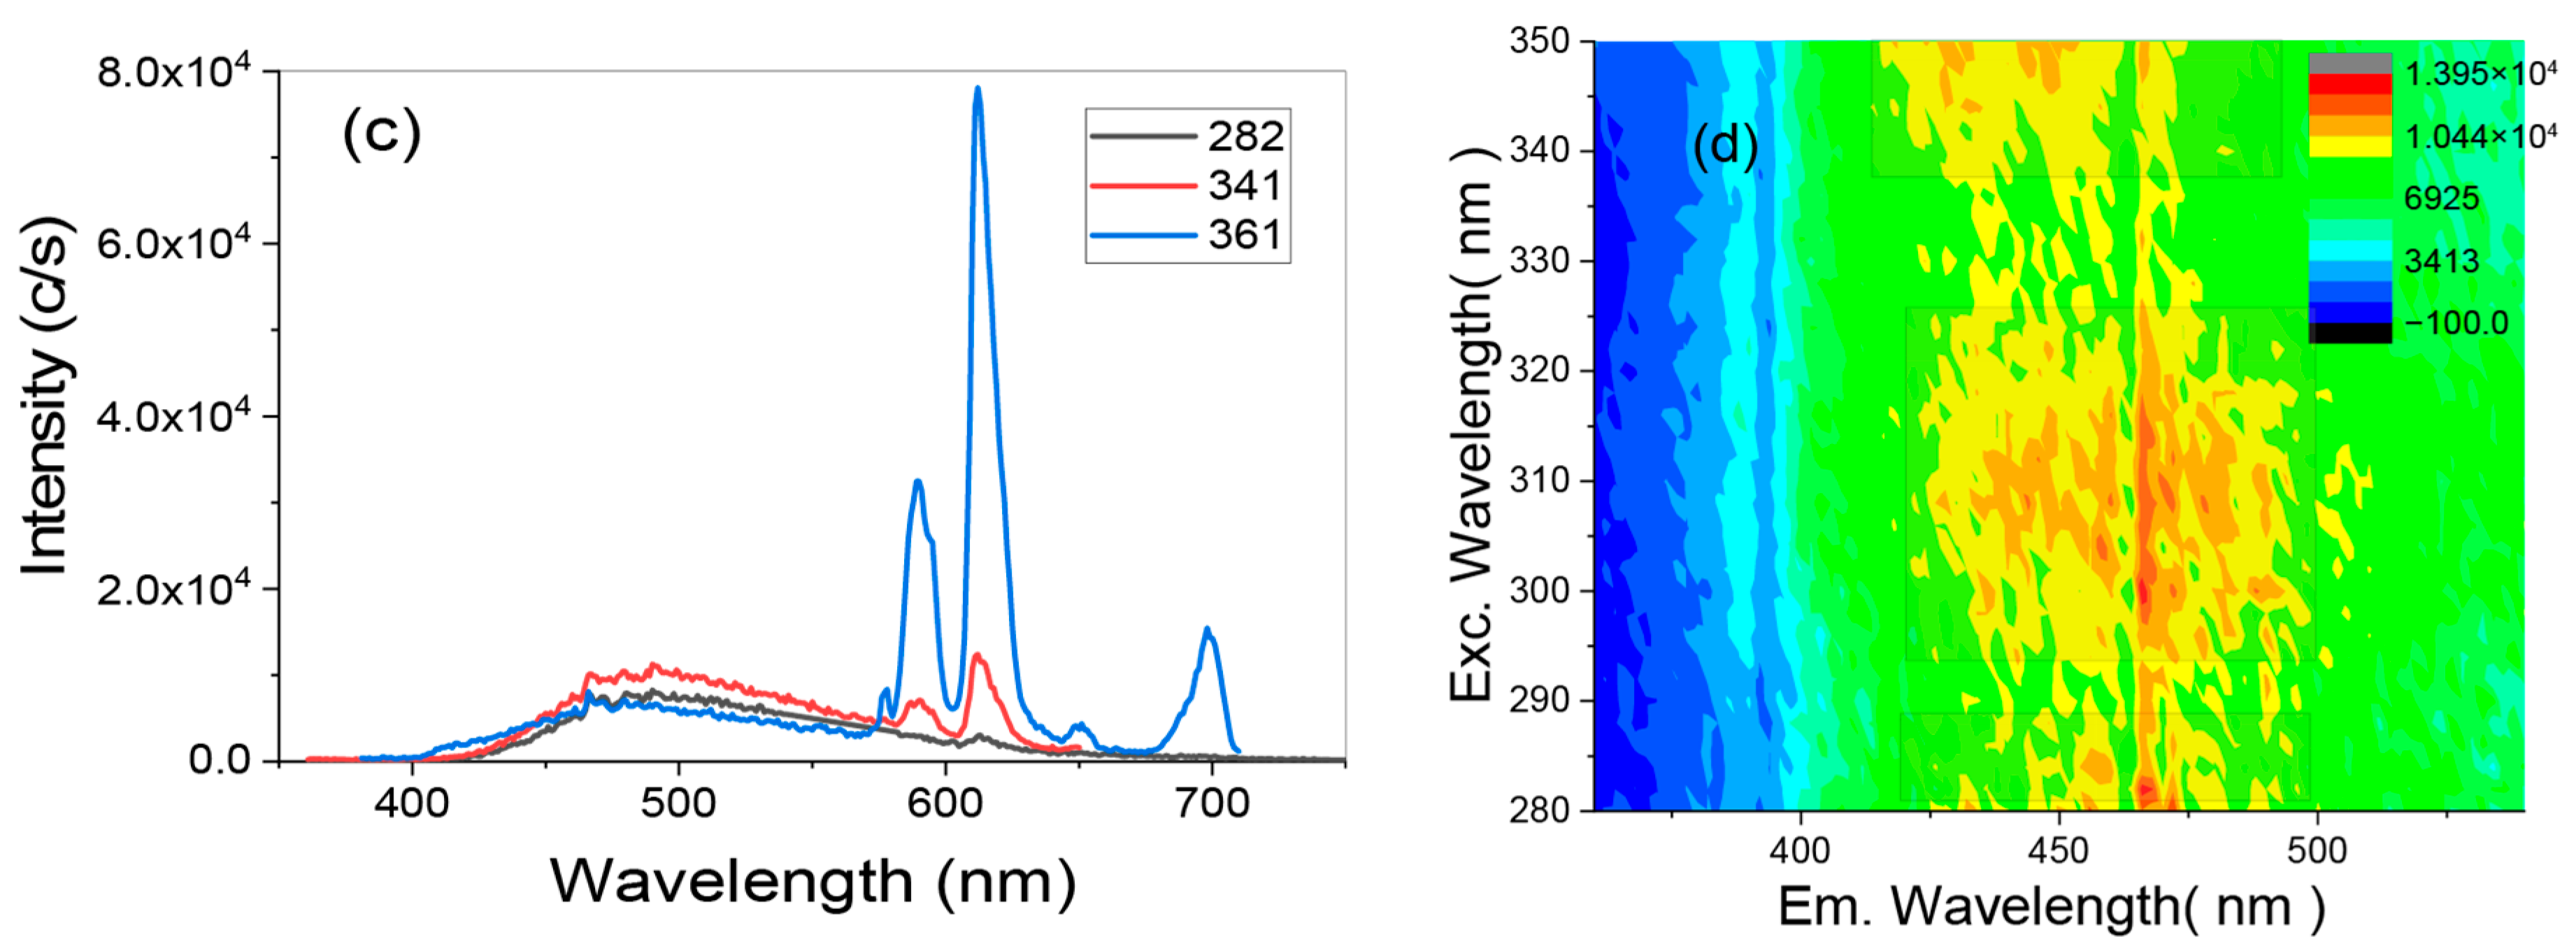
The high optical basicity of these air-synthesized glasses coupled with the strong oxidizing property of Sb2O3 and its low temperature melting (below 1000 °C) should stabilize the third trivalent state of europium, Eu3+, rather than allowing it to be reduced to the divalent state, Eu2+. This typically manifests as a broad excitation band located in the region [250–350 nm]. Figure 9a,b shows the excitation spectra of SLB0 and SLB6 glasses, respectively. Spectra were monitored at 460 and 490 nm within the blue emission range. Then, these spectra were compared to those monitored at 612 nm. Monitoring the emission at 460 nm for SLB0 glass reveals a broad, weak band extending from 250 to over 430 nm in the excitation spectrum. Two weak red peaks were present at 281 and 341 nm. These peaks are not attributed to Eu3+ but rather to the 4f65d→4f7 transition of Eu2+ [15]. While monitoring the emission spectrum at 460 nm and 490 nm in SLB6 glass, we observed a weak but large band extending from 250 to over 430 nm. This large band has also been observed in Eu-doped CABAL glasses containing 50 (mol. %) of B2O3 that were synthesized in a reduced atmosphere [15]. This band has been associated with Eu2+. However, no evident peaks are observed. Conversely, a large intense band is observed from 300 to 350 nm, which is clearly seen when the emission spectra is monitored at 612 nm. Two peaks related to Eu3+ are observed within this large band. These large bands can also be attributed to the 4f65d→4f7 transition of Eu2+. It can be concluded that the blue emission band is primarily caused by the low concentration of reduced Eu2+. As shown in Figure 9c, the emission spectra confirm that blue and 5D0 emission lines can be obtained when the glass is excited at 341 nm. However, when excited at 282 nm, the 5D0 emission lines decrease significantly, whereas the intensity of the blue emission remains unchanged. The results suggest that energy transfer may occur from Eu2+ to Eu3+. Additionally, blue emission can be produced in SLB0 glass with a tunable excitation wavelength between 280 and 350 nm. Figure 9d shows that blue emission from SLP0 glass occurs within the 280–350 nm excitation wavelength range. This is evident in the 3D image. Intense emissions are observed at the following wavelengths: 281, 310, and 341 nm.

3.3.5. Fluorescence Decay Analysis

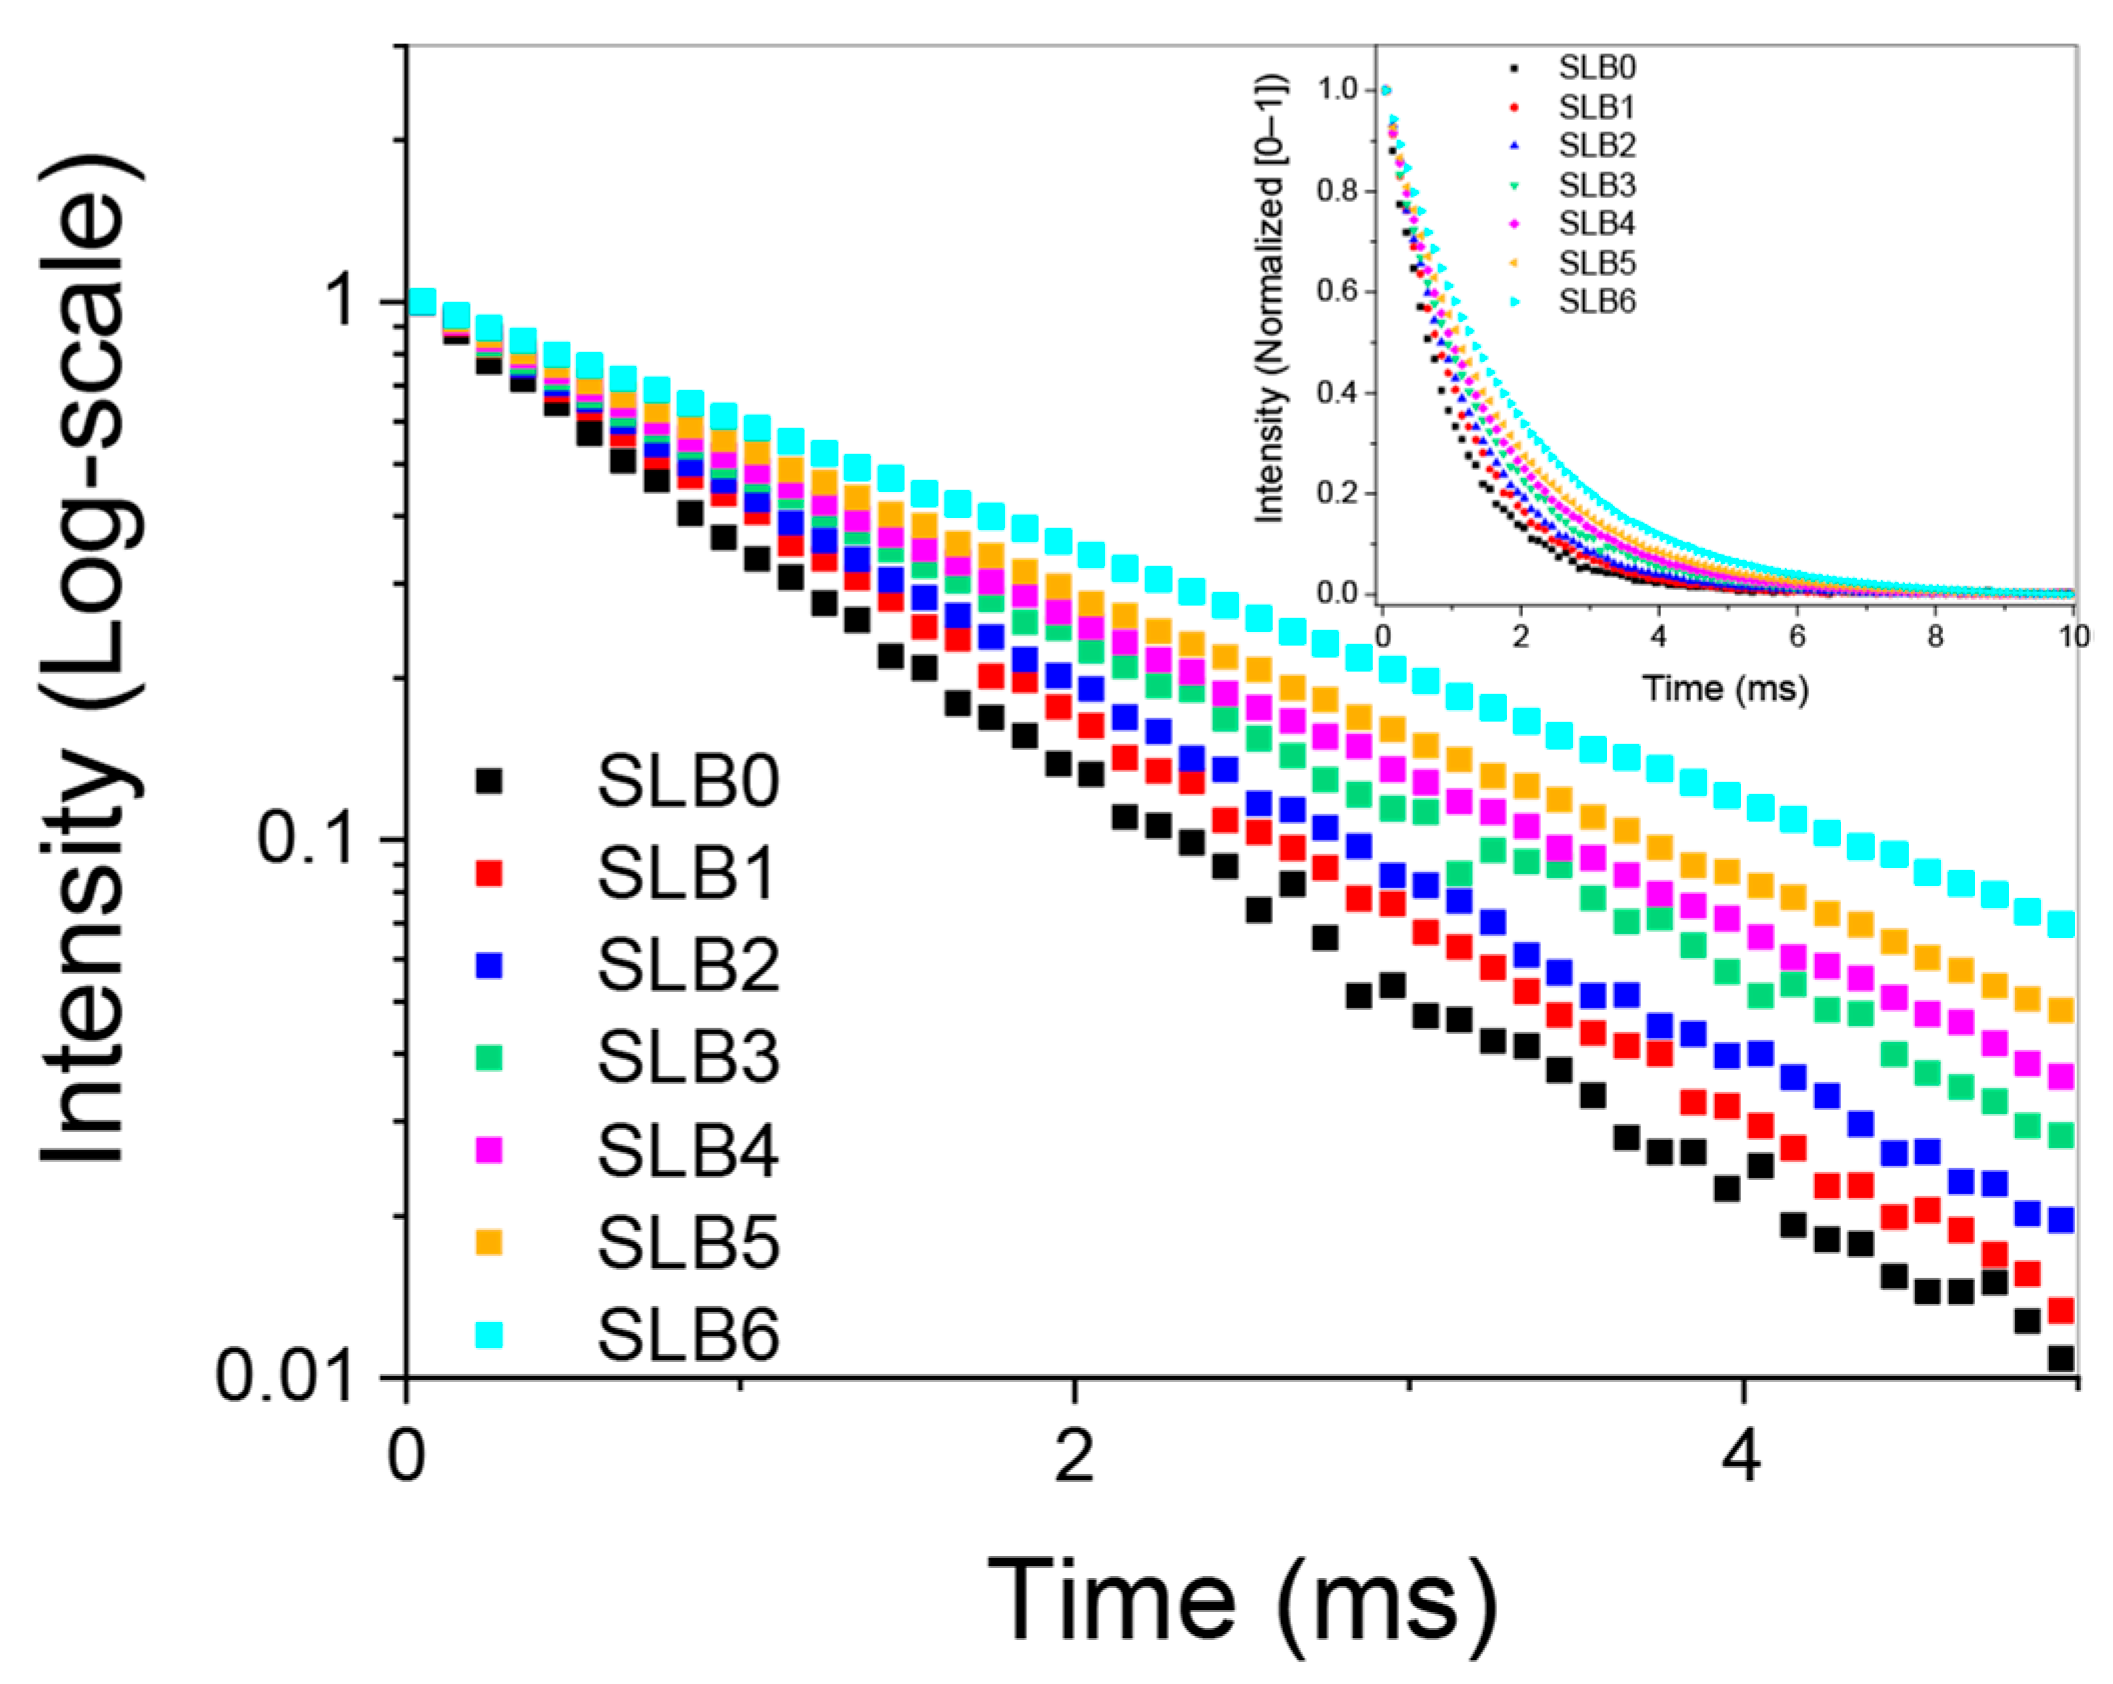
The fluorescence decay profiles of the 5D0 level were obtained by analyzing the emission line of the 5D07F2 transition. This transition corresponds to the most intense emission, which occurs at 612 nm when the glass is excited at 361 nm. Figure 10 (inset) shows the decay profiles of SLB glasses. Examining these profiles on a logarithmic scale reveals that they all align with a single exponential law as depicted in Figure 10. The experimental lifetime (τExp) is determined by fitting an exponential profile to the curves. In contrast, the radiative lifetime (τrad) of the 5D0 level of Eu3+; ions can be easily calculated from emission spectra using the Judd-Ofelt (JO) method [18,19]. This is based on the following formula [40].
( 1 / τ r a d ) = 14.65 × n 3 × I ( D 0 5 F j 7 ) / I ( D 0 5 F 1 7 ) .
where n is the refractive index. I(5D07FJ) represents the total integrated emission from the 5D07FJ manifold (J = 0–4), and I(5D07F1) represents the integrated intensity of the transition 5D07F1. The luminescence quantum efficiency ( η ) is defined as the ratio of experimental lifetime to the radiative lifetime [33]. Also known as the internal quantum efficiency, it is the measure of the number of photons emitted by an excited ion. It expresses the ratio of non-radiative losses to radiative decay processes. This can be expressed using the following equation [40]:
η ( % ) = τ E x p τ r a d × 100 %
Table 5 summarizes the results of τrad, τExp and η. The results are summarized in Table 5. Τhe experimental lifetime of the 5D0 level of Eu3+-doped SLB glasses increases linearly when boron oxide is added, ranging from 1.01 to 1.87 ms. The increase in the lifetime in parallel with the increase in 612 nm emission is related to the following points: Reduced non-radiative de-excitation, greater symmetry surrounding Eu3+ ions, and more efficient energy transfer. These factors result in more intense and longer-lasting red emissions, which often indicate suitability for use in red phosphors in LED or displays. Similarly, as the boron oxide content increased from 0 to 60 mol. %, the radiative lifetime increased linearly from 1.17 to 1.65 ms; this resulted in values that were almost higher than those of τExp for all the prepared glasses. The calculated values of η were found to be already very high for SLB (0 to 2) glasses at around 80%. These values increased rapidly for boron oxide-rich glasses, reaching 92, 98, and 113% for SLB (3 to 6) glasses, respectively.
The obtained quantum efficiency values are high, with SLB6 glass exceeding 100%. This is related to the high refraction index values calculated using the relation based on the band gap energy. To address this anomaly, we measured the refractive index using METRICON Model 2010/M at a 632.8 wavelength. The results are displayed in Table 5. The measured refractive index (n2) values are lower than the calculated values (n1). As the B2O3 content increases, the deviation in refractive values also increases, reaching a maximum deviation of 0.2. Consequently, the deviation in radiative lifetime relative to the measured and calculated refractive indices also follows this trend. The quantum efficiencies obtained for the SLB0, SLB1, and SLB2 glasses are 78.44, 76.02, and 74.42, respectively. For the SLB3, SLB4, SLB5, and SLB6 glasses, the increase is from 77.96 to 83.96. These values are very high compared to other glasses [41,42,43,44,45].
Table 5. Refractive indice n1 and n2, asymmetric ratio R, radiative lifetime τrad(n1) and τrad(n2), experimental lifetime τExp and quantum efficiency η(n1) and η(n2) of Eu3+-doped SLB glasses.
Glass IDn1n2Rτrad(n1)τrad(n2)τExpη(n1)η(n2)
(±0.04)(±0.001)(ms)(ms)(ms)(%)(%)
SLB02.102.0423.221.171.281.0180.1578.44
SLB 12.051.9883.361.381.491.1379.1676.02
SLB 22.011.9533.211.461.631.2279.9874.42
SLB 32.001.9033.161.511.751.3789.4277.96
SLB 41.971.8633.181.571.881.5091.5879.68
SLB 51.961.8193.071.611.941.6198.2982.59
SLB 61.951.7743.021.652.221.87113.3883.96
PKAlCaFEu1 [41] 2.45 2.4198
LLiFB [42] 1.75 1.3477
PKSAEu [43] 2.87 2.5063
ZnF2-WO3-TeO2-Eu [44] 2.90 1.2744
1EBT [45] 2.87 2.5039
As previously indicated, there has been significant improvement in the radiative behavior of Eu3+ ions in borate-rich regions. Increasing the effective population of emission levels boosted the total intensity of Eu3+ emission. This resulted in notable increases in the radiative and experimental lifetime. The higher quantum efficiency values, by adding B2O3, can have several origins, which we will review here. First, it could be related to a decrease in non-radiative relaxations. However, this theory is not really supported here because the absorption increases in the Infrared Region with B2O3 content, as can be seen here. Second, it could be related to a suppression of the quenching effect between Eu3+ ion pairs. Indeed, a decrease in the asymmetry ratio R is observed with the addition of B2O3. The possible charge transfer (CT) related to a small amount of Eu2+ that appears in the excitation spectra of Figure 4, as well as the CT involving defects, could be the third origin. This will be discussed in the next section.

3.3.6. Phonon Side Bands and Non-Radiative Transitions

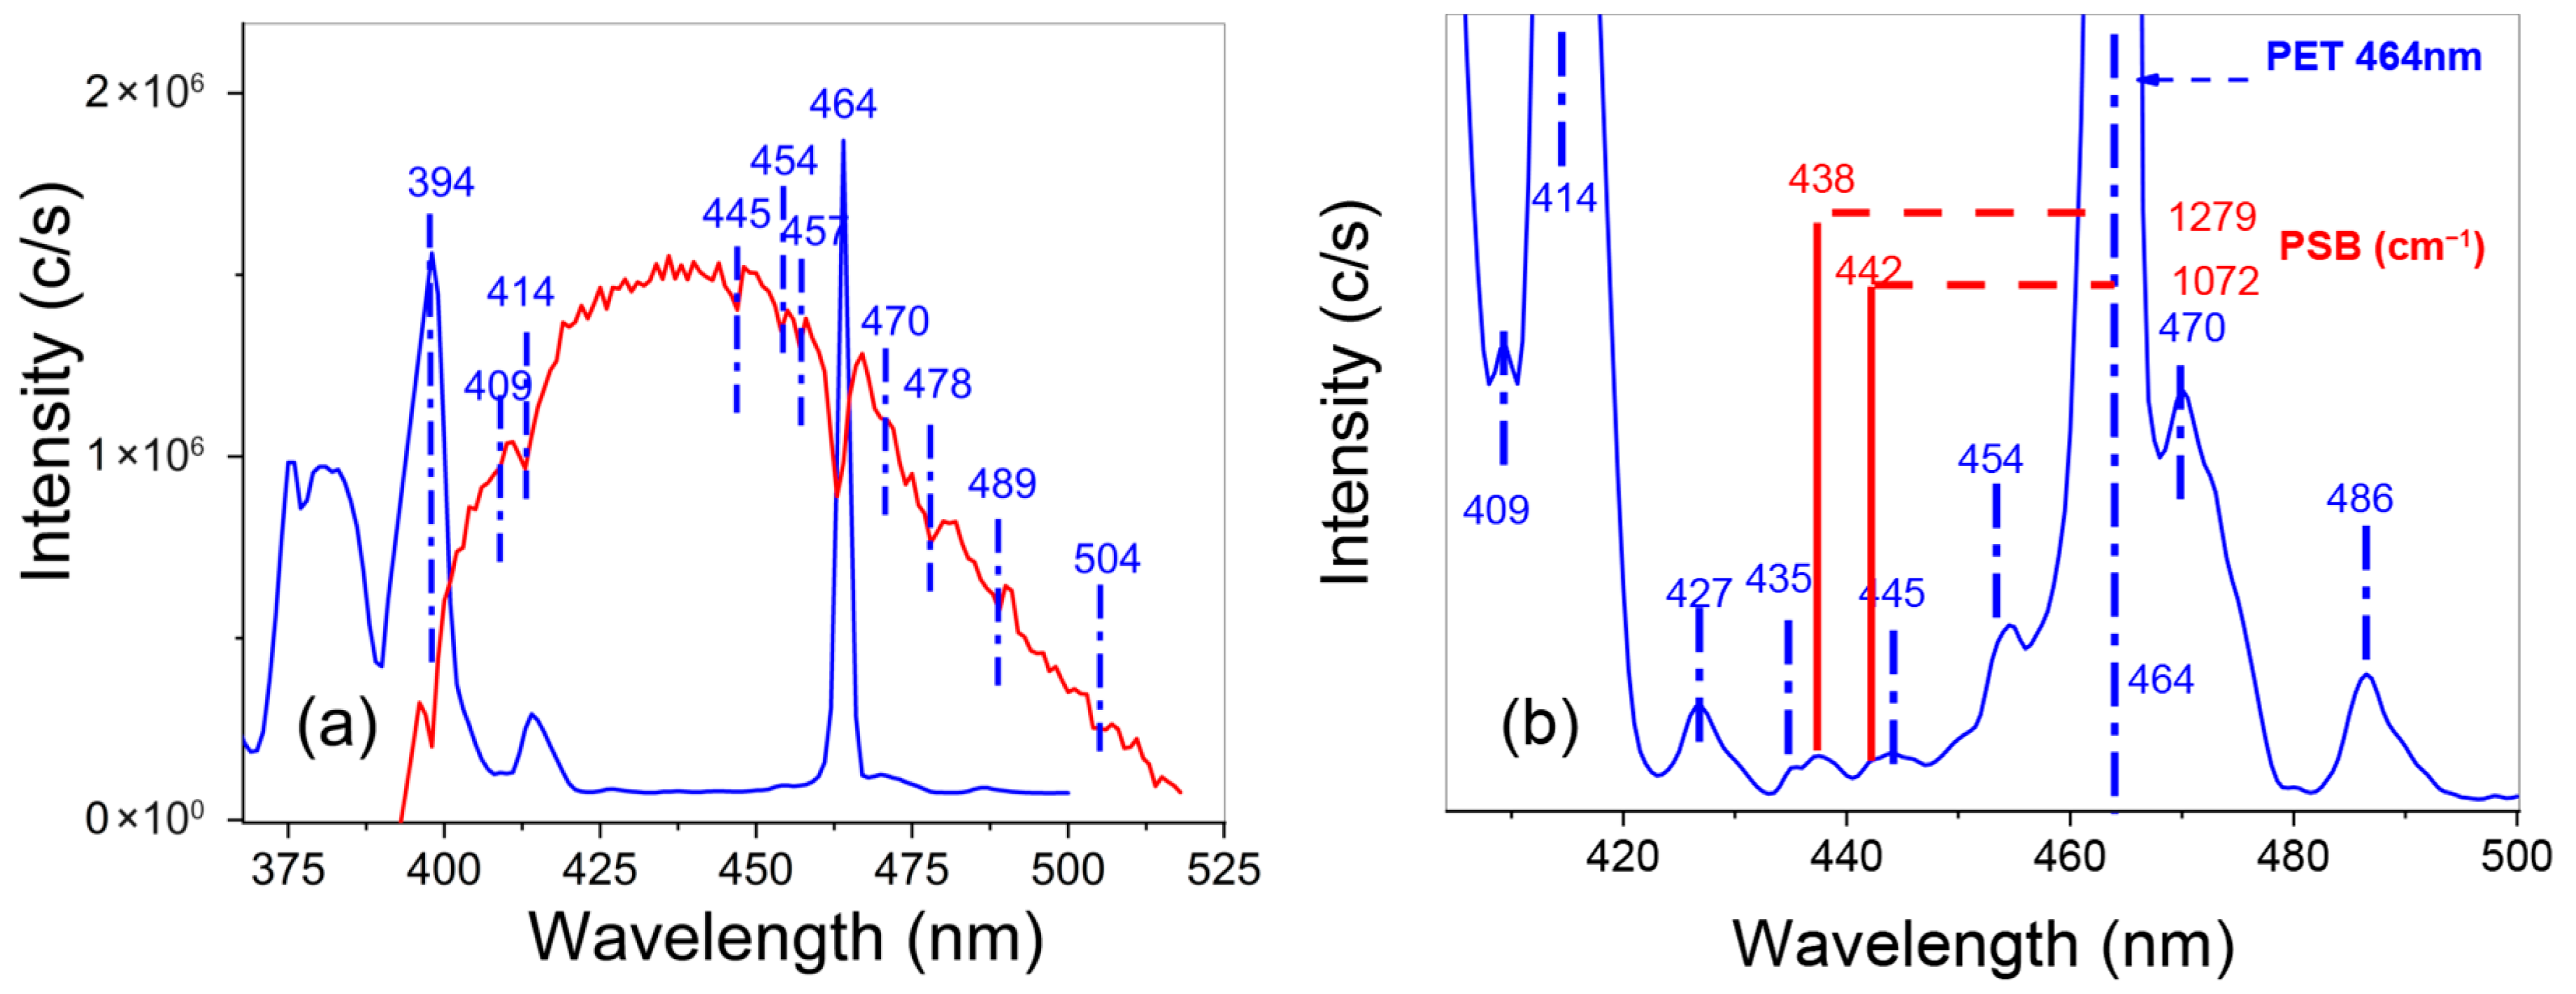
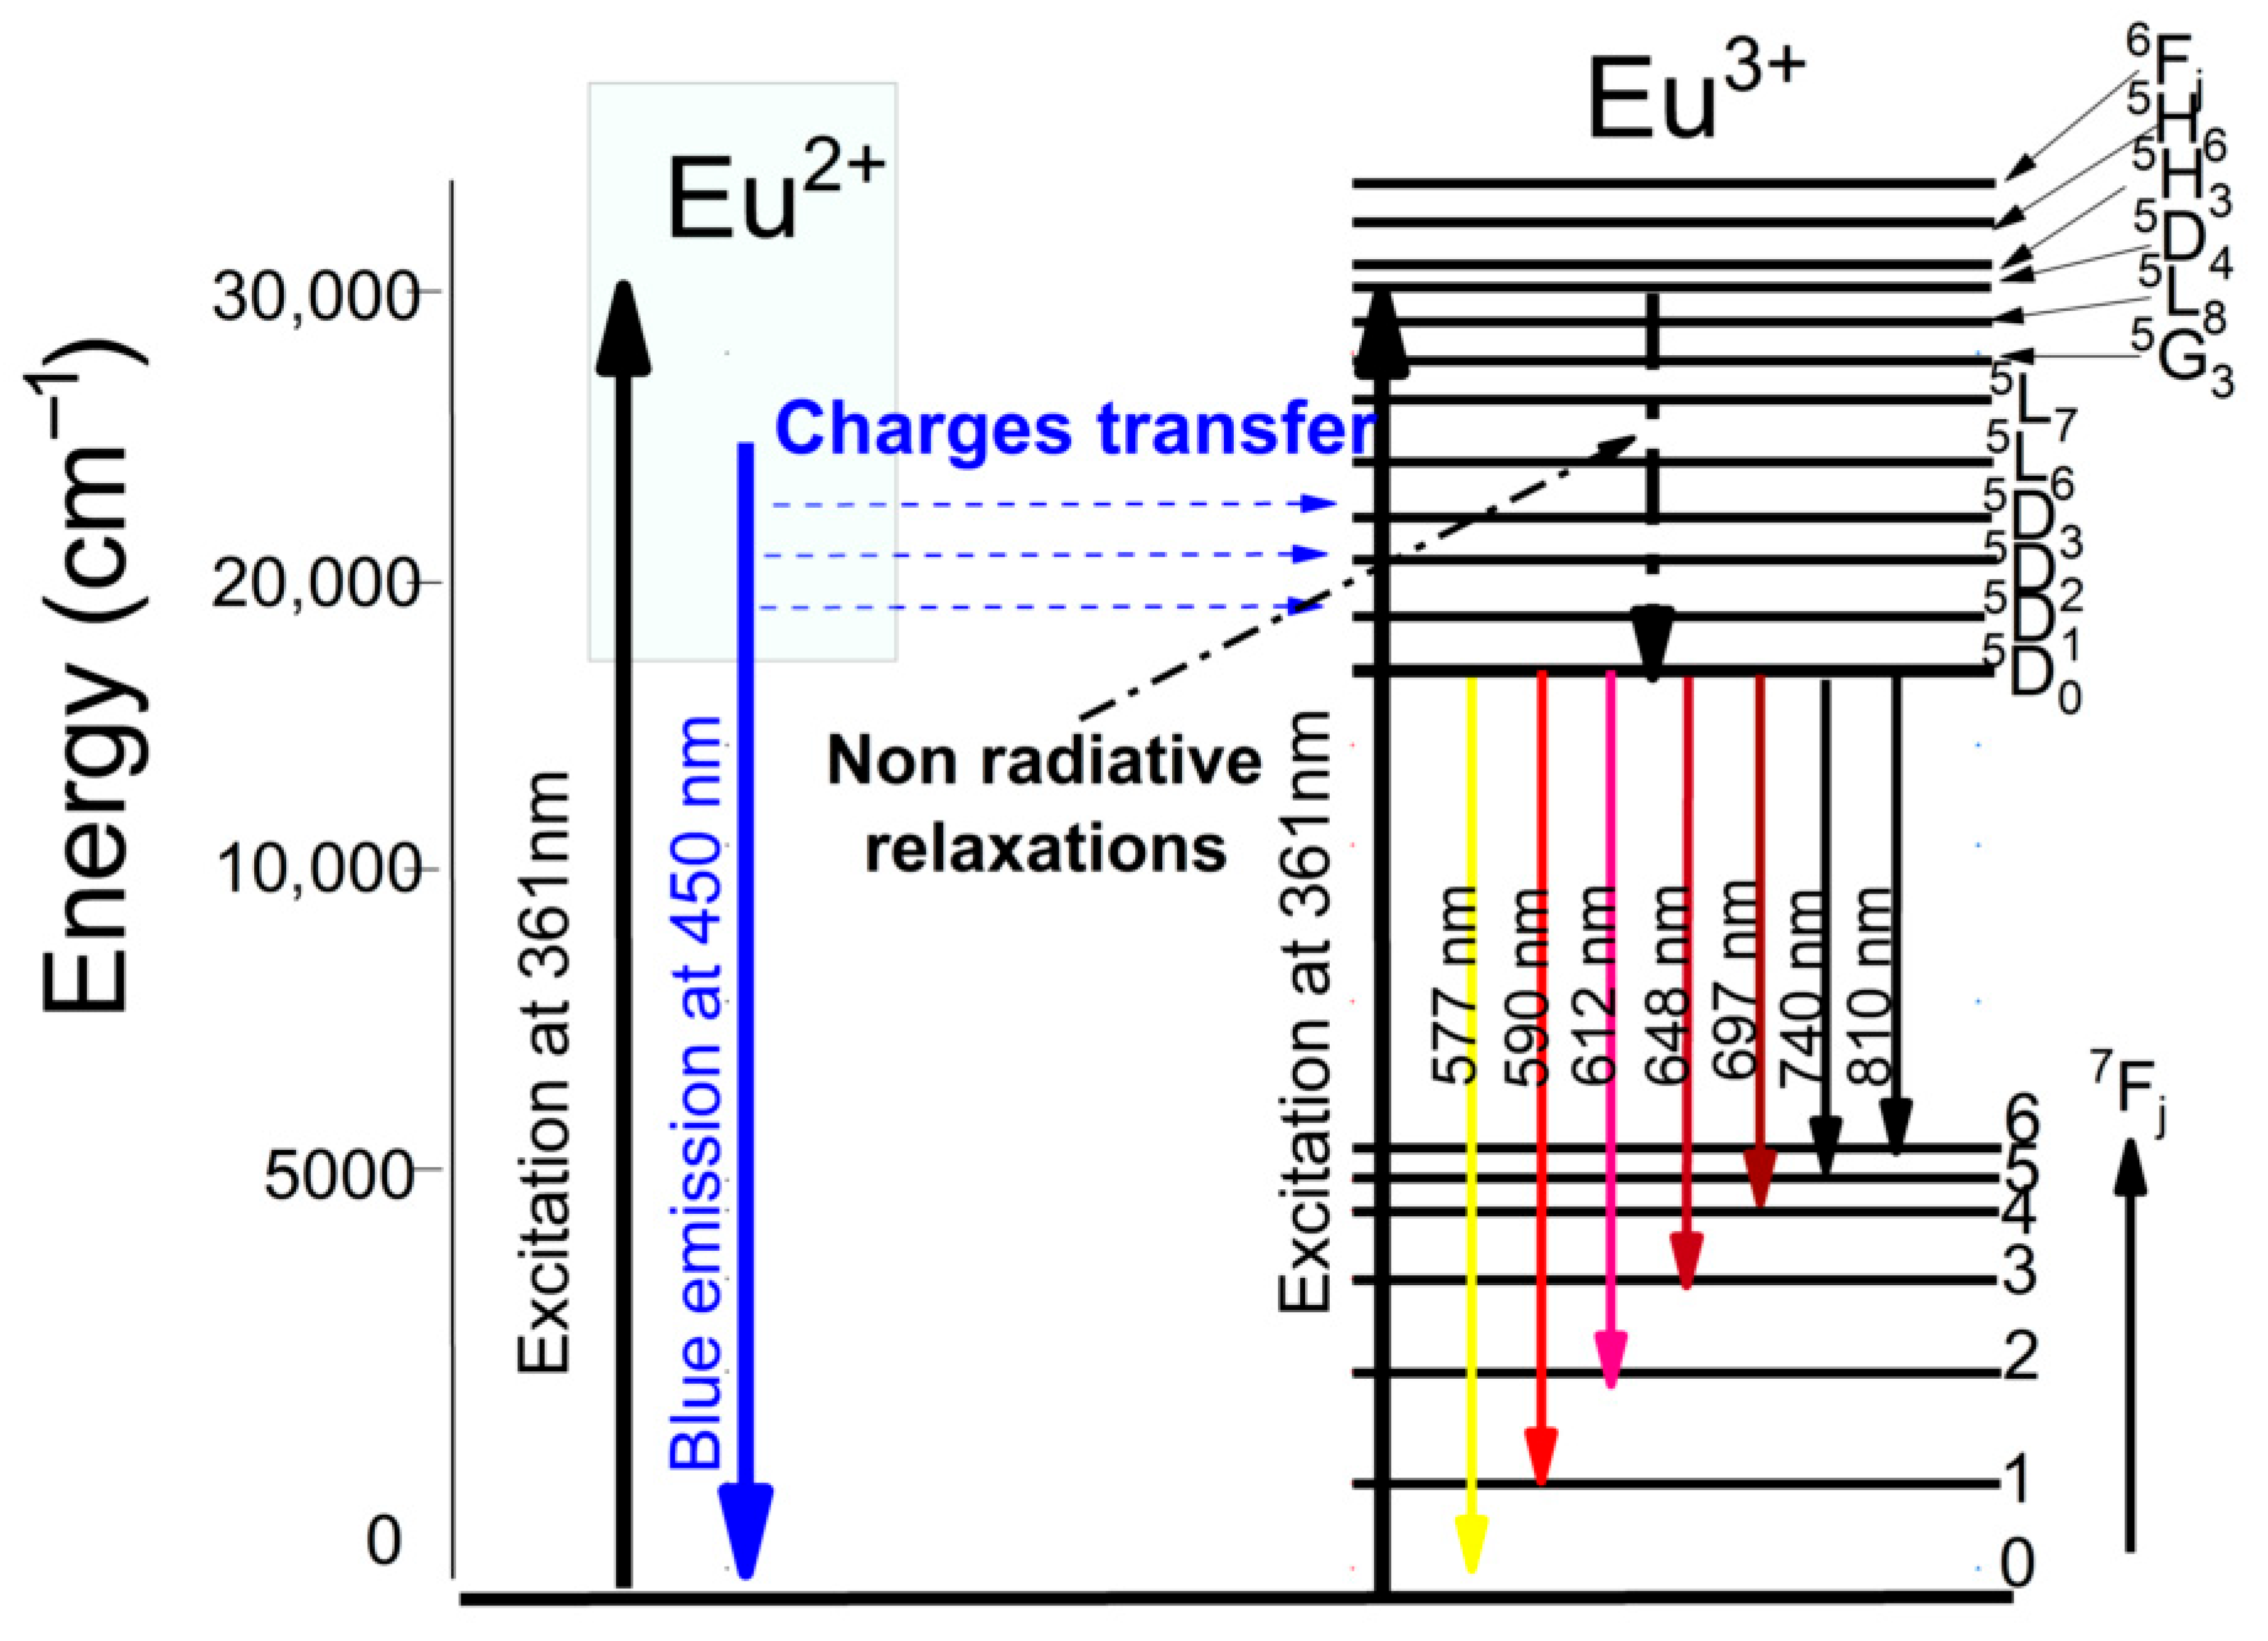
Upon inspecting Figure 11a more closely, discontinuous dips in the form of absorption bands on the broad blue emission can be clearly seen (highlighted by vertical blue dashed lines). These absorption bands have been observed in Eu2+-doped glasses and phosphors. However, their origin remains unclear, with no attempt having been made to explain them [46,47]. As illustrated in the inset of Figure 11b, this study confirms that these absorption bands (dips) correspond precisely to the f–f transitions line (highlighted by vertical blue dashed lines) observed in the excitation spectra of Eu3+ located at 409 (5D37F0), 414 (5D37F1), 427 (5L67F3), 437 (5L67F3), 445 (5L67F3), 454 (5D27F0), 464 (5L67F4), 470 (5D27F1) and 486 nm (5L67F5). The bands exhibit higher intensities at the 464 and 394 nm wavelengths. These are the most efficient excitation levels of Eu3+. When NUV excitation at 361 nm is applied and the concentration of B2O3 rises, the produced broad blue emission is partially quenched by the high level f–f of Eu3+ ions (absorption dips) and ensures an energy transfer to 5L6 and 5D(2, 3). These levels then de-excite rapidly to the 5D0 state, which increases the intensity of all 5D07Fj emission lines (where j = 0, 1, 2, 3, and 4), thereby contributing to the formation of other emission pathways from the 7Fj levels. Figure 12 shows the partial energy level diagram of Eu3+-doped SLB glasses as well as the possible charge transfer mechanism from the blue emission of Eu2+ to the 5D0 levels of Eu3+.
The non-radiative transitions caused by electron-phonon coupling are governed by the phonon side band (PSB). PSBs are produced when electrons are excited or emitted at the same time as phonons are created or annihilated. They are undesirable due to the fact that they generate additional non-radiative relaxation channels. However, they provide information on the effective phonon energy and the strength of electron-phonon coupling near the Eu3+ sites. As seen in the inset of Figure 11b, the zero phonon line (PZL) of Eu3+ ions is identified at a wavelength of 464 nm (highlighted by a vertical blue dashed line). The PSB line spacing is estimated based on the difference in wavenumber between the PZL and PSB (in cm−1) [39]. The only bands at 438 and 442 nm (highlighted by vertical red lines) have not been identified as Eu3+ excitation lines; rather, they are thought to be possible phonon side bands (PSB). The corresponding energies were found to be 1279 and 1072 (cm−1). These correspond to the stretching modes of the B-O bonds within the triangular units [BO3] and tetragonal [BO4] vibration units [48]. These energies are similar to those of the same units identified in the transmission spectrum of SLB6 glass within the NIR range.
The strength (g) of electron-phonon coupling can be used to quantify phonon-assisted non-radiative transition. This can be calculated from the intensity ratio of PSBs and PET. The g-values are 0.003 and 0.005 for PSBs at 438 and 442 nm, respectively. SLB6 glass was found to have the highest g-values of all the SLB glasses. However, these values are much lower than those reported in other papers, suggesting that phonon coupling alone cannot be the cause of non-radiative quenching in SLB glasses [33,47]. The presence of hydroxyl (OH) groups in these glasses is most likely a possible cause of non-radiative relaxation.
In summary, the integrated intensities of the five strong Eu3+ emission lines increase as the B2O3 content rises, which is possibly due to increased energy transfer from the possible Eu2+ fraction to the 5D0 emitted levels of Eu3+ions. Consequently, these glasses are therefore ideal for use in red lasers due to the sharp red emission lines of 5D07F2 (from 605 to 630 nm) and of 5D07F4 (from 678 to 710 nm). Furthermore, their high transparency and wide transmission window make them suitable for use in solid-state laser applications, including photonics, luminescent materials, nonlinear optical devices, and multicolor display systems.

3.4. CIE Color Coordinates

The CIE 1931 (Commission Internationale d’Eclairage) diagram [16] is a universal method used by designers to create LED lighting solutions based on emission spectra. It uses the three primary colors -red, green, and blue (RGB) to represent the entire color spectrum. The color of a single light is designed per its coordinates (x, y) in a diagram showing the combination of red, green, and blue light that comprise the color. The standard coordinates (x = 0.33, y = 0.33) correspond to white light emission at the center of the diagram. This study provides information on two important light parameters: Correlated color temperature (CCT) and lumens.
CCT is the temperature of an ideal black body that emits light or a similar color to the being measured. Lumens or brightness refers to the intensity of light perceived by the human eye. It depends on color, distance, and the environment. It is expressed as a subjective visual sensation.
The CCT values can be calculated using the following relation [49]:
C C T = 449 n 3 + 3525 n 2 6823 n + 5520.33
where n is defined by; n = (x − xe)/(y − ye) and xe = 0.3320, ye = 0.1858. We used free software provided by OSRAM (color calculator version 7.23) to measure the CIE diagram and CCT of the SLB glasses. To evaluate the brightness expressed by Lumens efficacy (LE) of these glasses, the following equation is often used [50]:
L E ( L m / W o p t ) = 683 ( L m / o p t ) . I ( λ ) . V ( λ ) . d λ I ( λ ) . d λ
where I(λ) is the spectrum of the emission and V(λ) is the sensitivity curve of the human eye. The human eye is most sensitive to the visible spectrum at 555 nm; it achieves a maximum luminous efficacy of (683 Lm/Wopt).
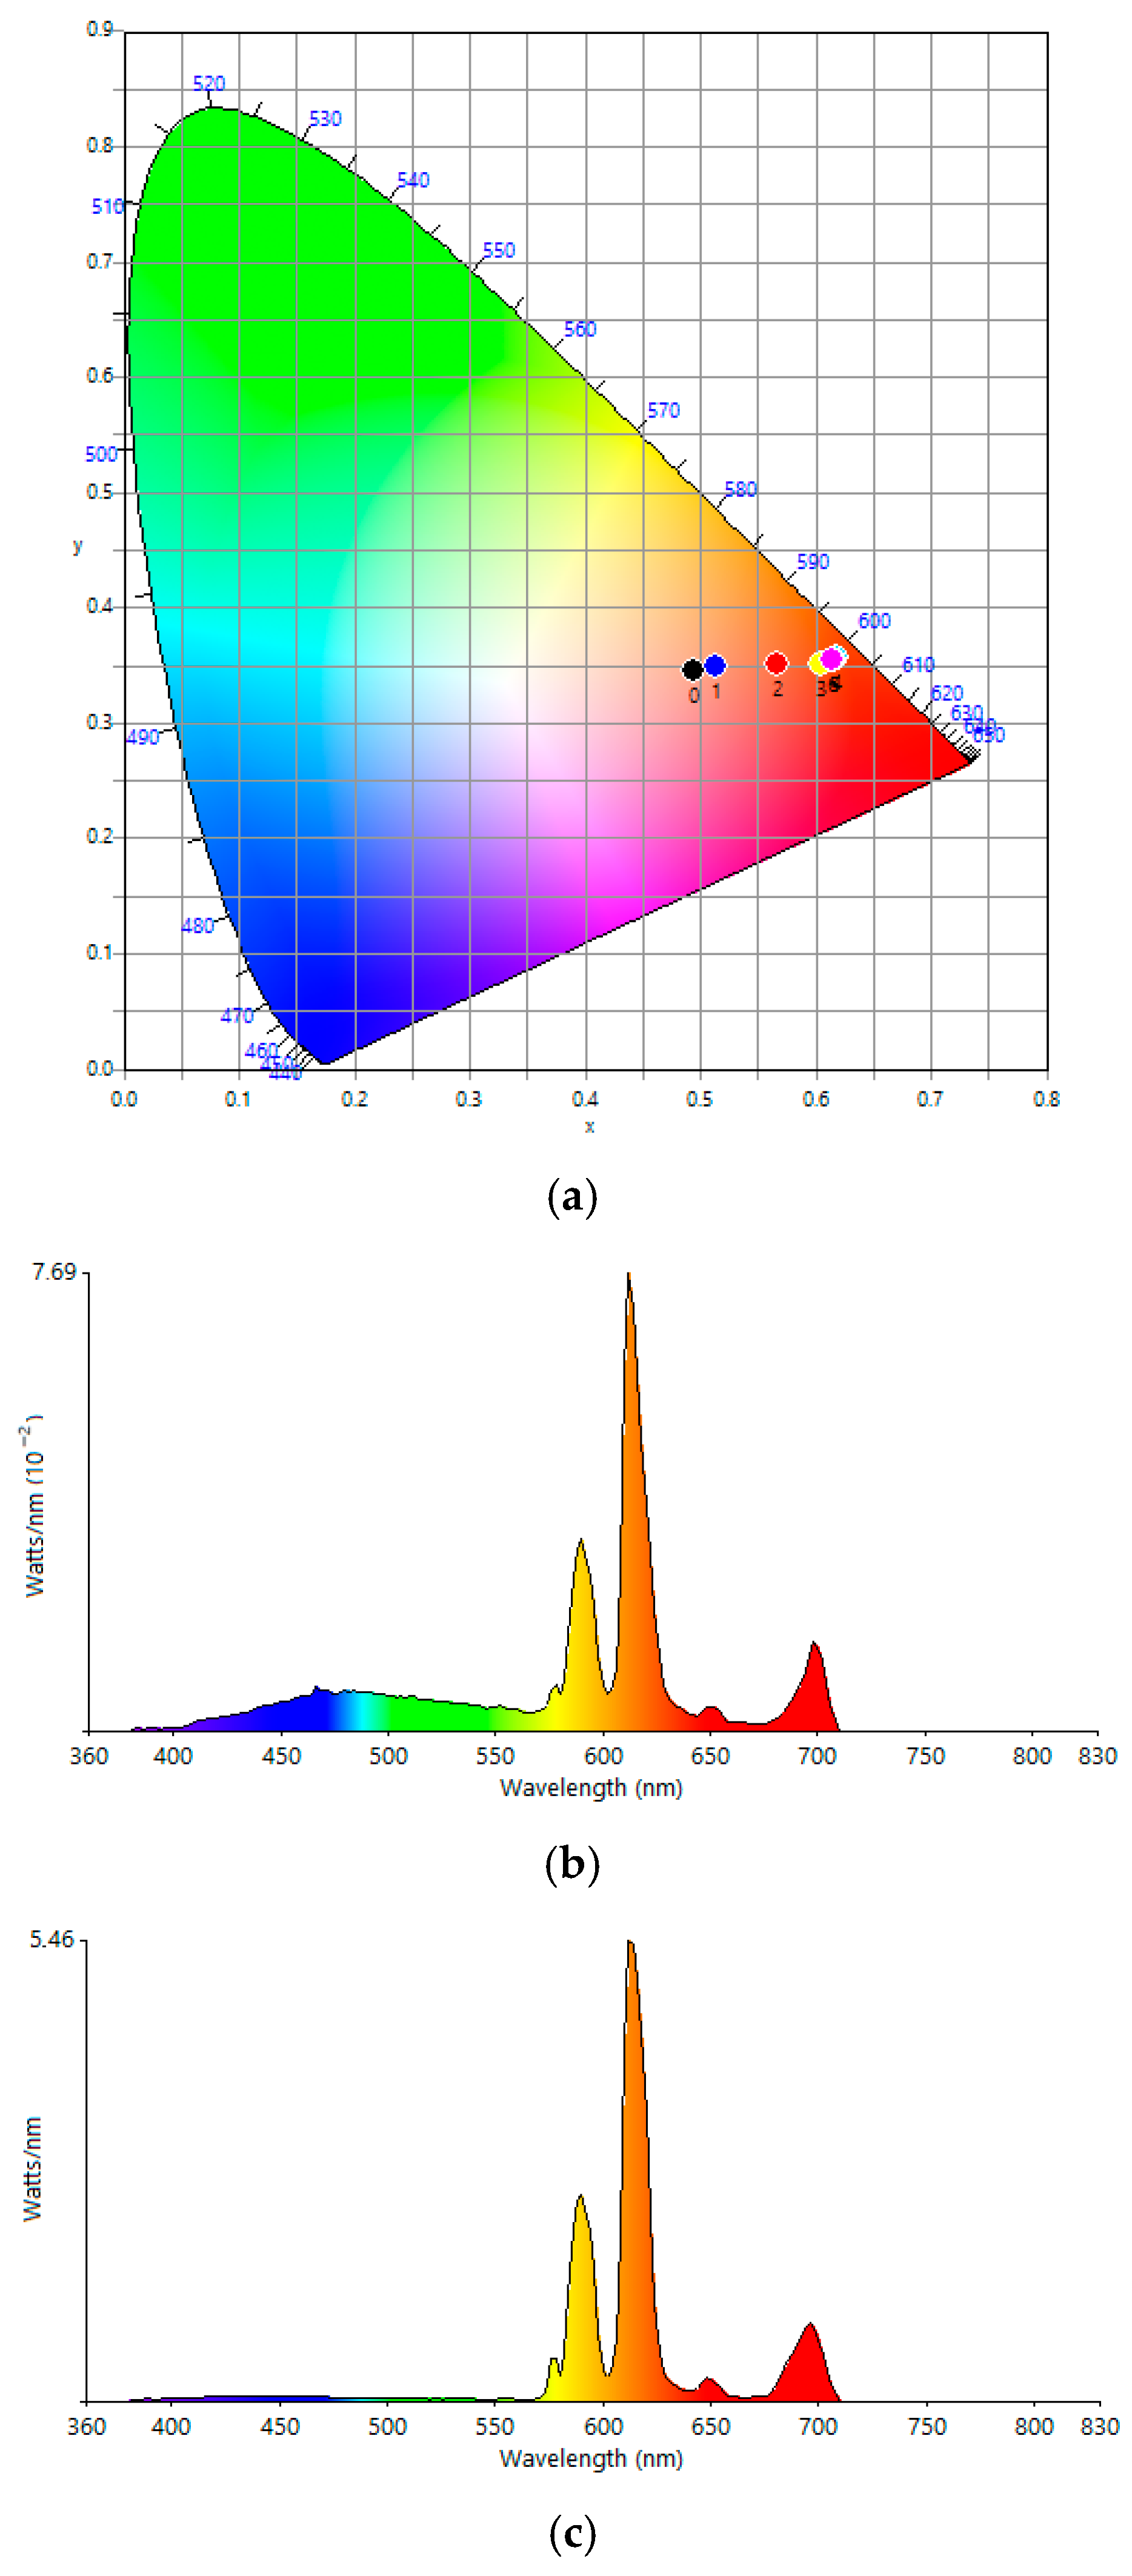
Figure 13a shows the CIE diagram for the SLB glass’s chromatic light coordinates (x, y). The chromaticity coordinates (x, y) have a y-value close to 0.35, whereas the x-value ranges linearly from 0.494 to 0.614. Figure 13b,c show the emission spectrum corresponding to the CIE colors of the SLB0 and SLB6 glasses, respectively. Table 6 summarizes the CIE color coordinates, CCT and lumen values for Eu-doped SLB glasses. The CCT values range from 1836 to 1187, corresponding to an orange-red color. Therefore, a low kelvin number indicates a warm, yellowish light, whereas a high kelvin number indicates a cool, bluish color. Warmer CCTs are often used for indoor lighting to create a calm natural atmosphere, whereas cooler CCTs are used for security lighting to improve visibility. It was found that an increase in B2O3 leads to a rapid increase in lumen values. Since lumen expresses brightness, this significant increase is fully justified by the rise in emission observed in the previous section. The lumen values obtained at the light-sensitive wavelength of 583 nm are higher than those of the phosphors shown in Table 6.

4. Conclusions

Glasses that are free of crystalline defects and have the specified composition are synthesized using the melt quenching method, in which Sb2O3 can be substituted with 0 to 60 (mol.%) of B2O3. These glasses were found to have very high thermal stability associated with a decrease in density and molar volume. Meanwhile, the transparency cut-off shifts from 385 to 344 nm. Consequently, the energy band gap increased, and the Urbach energy values decreased. The change involved in the gradual replacement of Sb2O3 by up to 60 (mol. %) of B2O3 led to a decrease in the relative value of the density, the molar volume, the polaron radius, the average separation of Eu3+ ion ri, and the field strength F up to nearly 24%, while the concentrations per unit volume of Eu3+ ions increased by about 32% and by 20% for the field strength F. Additionally, Egind increases by 26% and by 15.6%. Conversely, Urbach energy, refraction index, reflection losses, and optical basicity decreased by between 7% and 22%. Analysis using ATR-FTIR reveals that the Eu3+-doped SLB glass structure consists of [SbEO3], [BO3], and [BO4] units. By monitoring the emission spectra at 612 nm, we found that as the B2O3 content in the glass increases, the population of Eu3+ levels increases considerably in response to excitation at 361 nm. This effect is less pronounced at 394 nm than at 465 nm. Consequently, this study has confirmed the presence of all possible excited Eu3+ levels in glasses with low phonon energy, and the total intensity of Eu3+ emissions in SLBx glasses increases considerably when the B2O3 content is higher than x = 30 (mol. %). Five distinct peaks were visible at the following wavelengths: 577 (yellow), 590 (orange), 612 (red), 648 (dark red), and 697 (dark red) nm. A very weak, broad emission was also observed in the blue region at 420–520 nm. Its origin is probably related to the possible presence of Eu2+. The enhancement of 5D07Fj emission may result from charge transfer from the Eu2+ to the 5D0 emitted levels of Eu3+ ions. Τhe experimental lifetime of the 5D0 level of Eu3+-doped SLB glasses increases linearly when boron oxide is added. Similarly, the radiative lifetime also increases, leading to a higher quantum efficiency ranging from 74 to 84 in borate-rich glasses. This very significant increase in the luminescence and quantum efficiency can be explained by a reduction in non-radiative processes. The presence of OH hydroxyl groups in these glasses is the main cause of non-radiative relaxation. The chromaticity coordinates (x, y) have an x-value close to 0.35, whereas the y-value ranges linearly from 0.494 to 0.614. The CCT values range from 1836 to 1187, corresponding to a warm orange-red color. As lumen expresses brightness, the significant increase in lumen can be entirely explained by the rise in emission in these glasses.

Author Contributions

H.Y.: Formal analysis, investigation, writing original draft, writing-review and editing. M.T.S.: Curating data process, resources, analysis of the results; formal analysis, supervision, review, and editing. D.d.L.: Formal analysis, review, and editing. All authors have read and agreed to the published version of the manuscript.

Funding

The authors would like to thank the DGRSDT (Ministry of higher education and scientific research of Algeria) of Algeria for their financial support of the project under the following Number: B00L02UN070120230005.

Data Availability Statement

The original contributions presented in this study are included in the article. Further inquiries can be directed to the corresponding authors.

Conflicts of Interest

The authors declare that they have no known competing financial interests or personal relationships that could have appeared to influence the work reported in this paper.

References

  1. Adeleye, S.O.; Adeleke, A.A.; Nzerem, P.; Olosho, A.I.; Anosike-Francis, E.N.; Ogedengbe, T.S.; Ikubanni, P.P.; Saleh, R.A.; Okolie, J.A. A Review of Rare Earth Ion-Doped Glasses: Physical, Optical, and Photoluminescence Properties. Trends Sci. 2024, 21, 8759. [Google Scholar] [CrossRef]
  2. Pisarski, W.A. Rare Earth Doped Glasses/Ceramics: Synthesis, Structure, Properties and Their Optical Applications. Materials 2022, 15, 8099. [Google Scholar] [CrossRef]
  3. Fuks-Janczarek, I.; Miedzinski, R.; Kassab, L.R.P. Optical characterization and thermal analysis of rare earth-doped PbO-GeO2-Ga2O3 glasses embedded with gold nanoparticles. J. Alloys Compd. 2024, 1002, 175221. [Google Scholar] [CrossRef]
  4. Kenyon, A.J. Recent developments in rare-earth doped materials for optoelectronics. Prog. Quantum Electron. 2002, 26, 225–284. [Google Scholar] [CrossRef]
  5. Mesaros, A. Luminescent Materials: Synthesis, Characterization and Application. Appl. Sci. 2023, 13, 11221. [Google Scholar] [CrossRef]
  6. Tioua, B.; Soltani, M.T.; Khechekhouche, A.; Wondraczek, L. Physical properties and luminescence of highly stable erbium-doped antimony glasses for NIR broadband amplification. Opt. Laser Technol. 2022, 152, 108152. [Google Scholar] [CrossRef]
  7. Pisarski, W.A.; Zur, L.; Kowal, M.; Pisarska, J. Enhancement and quenching photoluminescence effects for rare earth—Doped lead bismuth gallate glasses. J. Alloys Compd. 2015, 651, 565–570. [Google Scholar] [CrossRef]
  8. Rezgui, S.; Soltani, M.T. Structural and optical properties of europium-doped sodium-lead-antimony glasses. Mater. Today Commun. 2023, 37, 106916. [Google Scholar] [CrossRef]
  9. Kumar, M.; Seshagiri, T.K.; Godbole, S.V. Fluorescence lifetime and Judd-Ofelt parameters of Eu3+ doped SrBPO5. Phys. B Condens. Matter 2013, 410, 141–146. [Google Scholar] [CrossRef]
  10. Zhang, Q.; Hu, Y.; Ju, G.; Zhang, S.; Xue, F. Photoluminescence of a novel Na3Y(VO4)2:Eu3+ red phosphor for near ultraviolet light emitting diodes application. J. Mater. Sci. Mater. Electron. 2017, 28, 2529–2537. [Google Scholar] [CrossRef]
  11. Altowyan, A.S.; Kaynar, S.C.; Aydin, H.; Kaynar, U.; Coban, M.; Hakami, J.; Canimoglu, A.; Ozcan, Y.; Can, N. Anomalous 5D0 → 7F4 transition induced by alkali ion co-doping in Eu3+-activated K7SrY2(B5O10)3 borates: A Judd–Ofelt and photoluminescence analysis for pc-WLEDs. Spectrochim. Acta Part A Mol. Biomol. Spectrosc. 2026, 346, 126870. [Google Scholar] [CrossRef]
  12. Adamu, S.B.; Halimah, M.K.; Chan, K.T.; Muhammad, F.D.; Nazrin, S.N.; Tafida, R.A. Eu3+ ions doped zinc borotellurite glass system for white light laser application: Structural, physical, optical properties, and Judd-Ofelt theory. J. Lumin. 2022, 250, 119099. [Google Scholar] [CrossRef]
  13. Wu, Y.; Li, P.; Guan, M.; Guo, Y.; Xu, S.; Zhang, J. Observation of tunable persistent luminescence in XAl2O4: Eu2+ (X=Ca, Sr) doped borate glass for efficient optical information storage. Ceram. Int. 2023, 49, 30461–30470. [Google Scholar] [CrossRef]
  14. Cui, J.; Wen, Y.; Chen, R.; Cheng, X.; Yu, M.; Liu, J.; Hu, Z.; He, J.; Xiao, Z.; Sun, X.Y. Bright cyan emission from Eu-Doped borosilicate glasses by optimizing reduction of Eu3+ to Eu2+ in ambient atmosphere. Chem. Eng. J. 2024, 489, 151416. [Google Scholar] [CrossRef]
  15. Gomes, B.R.A.; Gomes, J.F.; Steimacher, A.; Pedrochi, F.; Reis, R.D.D.; Barboza, M.J. Optical and spectroscopic properties of Eu2+/Eu3+-doped Calcium Boroaluminate glasses. Opt. Mater. 2021, 122, 111727. [Google Scholar] [CrossRef]
  16. Serna-Gallén, P.; Beltrán-Mir, H.; Cordoncillo, E. Practical guidance for easily interpreting the emission and physicochemical parameters of Eu3+ in solid-state hosts. Ceram. Int. 2023, 49, 41078–41089. [Google Scholar] [CrossRef]
  17. Kumar, A.; Rai, D.K.; Rai, S.B. Optical studies of Eu3+ ions doped in tellurite glass. Spectrochim. Acta Part A Mol. Biomol. Spectrosc. 2002, 58, 2115–2125. [Google Scholar] [CrossRef]
  18. Judd, B.R. Optical Absorption Intensities of Rare-Earth Ions. Phys. Rev. 1962, 197, 750–761. [Google Scholar] [CrossRef]
  19. Ofelt, G.S. Intensities of crystal spectra of rare-earth ions. J. Chem. Phys. 1962, 37, 511–520. [Google Scholar] [CrossRef]
  20. Soga, N.; Hirao, K.; Yoshimoto, M.; Yamamoto, H. Effects of densification on fluorescence spectra and glass structure of Eu3+-doped borate glasses. J. Appl. Phys. 1988, 63, 4451–4454. [Google Scholar] [CrossRef]
  21. Yorgun, N.Y. Gamma-ray shielding parameters of Li2B4O7 glasses: Undoped and doped with magnetite, siderite and Zinc-Borate minerals cases. Radiochim. Acta 2019, 107, 755–765. [Google Scholar] [CrossRef]
  22. Soltani, M.T.; Boutarfaia, A.; Makhloufi, R.; Poulain, M. New alkali antimonate glasses. J. Phys. Chem. Solids 2003, 64, 2307–2312. [Google Scholar] [CrossRef]
  23. Som, T.; Karmakar, B. Structure and properties of low phonon antimony glasses in the K2O-B2O3-Sb2O3-ZnO system. J. Am. Ceram. Soc. 2009, 92, 2230–2236. [Google Scholar] [CrossRef]
  24. Baazouzi, M.; Soltani, M.T.; Hamzaoui, M.; Poulain, M.; Troles, J. Optical properties of alkali-antimonite glasses and purified processes for fiber drawing. Opt. Mater. 2013, 36, 500–504. [Google Scholar] [CrossRef][Green Version]
  25. Ersundu, A.E.; Çelikbilek, M.; Baazouzi, M.; Soltani, M.T.; Troles, J.; Aydin, S. Characterization of new Sb2O3-based multicomponent heavy metal oxide glasses. J. Alloys Compd. 2014, 615, 712–718. [Google Scholar] [CrossRef]
  26. Topper, B.; Tagiara, N.S.; Palles, D.; Lind, F.; Baazouzi, M.; Soltani, M.T.; Wondraczek, L.; Möncke, D.; Kamitsos, E.I. Second-harmonic generation and structural rearrangements in multicomponent antimonite glasses by electrothermal poling. J. Am. Ceram. Soc. 2023, 106, 4163–4180. [Google Scholar] [CrossRef]
  27. Terashima, K.; Hashimoto, T.; Uchino, T.; Kim, S.H.; Yoko, T. Structure and nonlinear optical properties of Sb2O3-B2O3 binary glasses. J. Ceram. Soc. Jpn. 1996, 104, 1008–1014. [Google Scholar] [CrossRef]
  28. Ouannes, K.; Soltani, M.; Poulain, M.; Boulon, G.; Alombert-Goget, G.; Guyot, Y.; Pillonnet, A.; Lebbou, K. Spectroscopic properties of Er3+-doped antimony oxide glass. J. Alloys Compd. 2014, 603, 132–135. [Google Scholar] [CrossRef]
  29. Zavadil, J.; Ivanova, Z.G.; Kostka, P.; Hamzaoui, M.; Soltani, M.T. Photoluminescence study of Er-doped zinc-sodium-antimonite glasses. J. Alloys Compd. 2014, 611, 111–116. [Google Scholar] [CrossRef]
  30. Hamzaoui, M.; Soltani, M.T.; Baazouzi, M.; Tioua, B.; Ivanova, Z.G.; Lebullenger, R.; Poulain, M.; Zavadil, J. Optical properties of erbium doped antimony based glasses: Promising visible and infrared amplifiers materials. Phys. Status Solidi Basic. Res. 2012, 249, 2213–2221. [Google Scholar] [CrossRef]
  31. Wagh, A.; Raviprakash, Y.; Upadhyaya, V.; Kamath, S.D. Composition dependent structural and optical properties of PbF2-TeO2-B2O3-Eu2O3 glasses. Spectrochim. Acta Part A Mol. Biomol. Spectrosc. 2015, 151, 696–706. [Google Scholar] [CrossRef]
  32. Rani, M.V.; Pallati, N.; Vuradi, R.K.; Chary, A.S.; Reddy, S.N. A study of the structural, electrical and bioactivity properties of antimony zinc borate glasses with Na2O added for a variety of applications. J. Non. Cryst. Solids 2024, 629, 122862. [Google Scholar] [CrossRef]
  33. Dejneka, M.; Snitzer, E.; Riman, R.E. Blue, green and red fluorescence and energy transfer of Eu3+ in fluoride glasses. J. Lumin. 1995, 65, 227–245. [Google Scholar] [CrossRef]
  34. Reisfeld, R.; Lieblich, N. Optical spectra and relaxation of Eu+3 in germanate glasses. J. Phys. Chem. Solids 1973, 34, 1467–1476. [Google Scholar] [CrossRef]
  35. Chialanza, M.R.; Faccio, R.; Pereira, H.B.; Marotti, R. The non-direct band gap in borate glasses; a brief discussion on analysis methodologies and its interpretation. Opt. Mater. 2022, 123, 111890. [Google Scholar] [CrossRef]
  36. Brik, M.G.; Srivastava, A.M.; Popov, A.I. A few common misconceptions in the interpretation of experimentalspectroscopic data. Opt. Mater. 2022, 127, 112276. [Google Scholar] [CrossRef]
  37. Dimitrov, V.; Sakka, S. Linear and nonlinear optical properties of simple oxides. II. J. Appl. Phys. 1996, 79, 1741–1745. [Google Scholar] [CrossRef]
  38. Binnemans, K. Interpretation of europium(III) spectra. Coord. Chem. Rev. 2015, 295, 1–45. [Google Scholar] [CrossRef]
  39. Topper, B.; Ballato, J. Phonon side band spectroscopy of Eu3+ in binary Sb2O3-GeO2 glasses. J. Non-Crystalline Solids 2025, 652, 123405. [Google Scholar] [CrossRef]
  40. Enrichi, F.; Mastantuoni, G.; Cassetta, M.; Sambugaro, A.; Daldosso, N.; Martucci, A.; Vomiero, A.; Cattaruzza, E.; Righini, G.C. Structural and optical properties of Eu3+-doped sol–gel silica–soda glasses. Eur. Phys. J. Plus 2024, 139, 1–10. [Google Scholar] [CrossRef]
  41. Rasool, S.N.; Moorthy, L.R.; Jayasankar, C.K. Optical and luminescence properties of Eu3+-doped phosphate based glasses. Mater. Express 2013, 3, 231–240. [Google Scholar] [CrossRef]
  42. Prasad, B.D.; Reddy, C.M. Structural and optical investigations of Eu3+ ions in lead containing alkali fluoroborate glasses. Opt. Mater. 2012, 34, 1251–1260. [Google Scholar] [CrossRef]
  43. Gandhi, Y.; Kityk, I.V.; Brik, M.G.; Rao, P.R.; Veeraiah, N. Influence of tungsten on the emission features of Nd3+, Sm3+ and Eu3+ ions in ZnF2—WO3—TeO2 glasses. J. Alloys Compd. 2010, 508, 278–291. [Google Scholar] [CrossRef]
  44. Herrmann, A.; Fibikar, S.; Ehrt, D. Time-resolved fluorescence measurements on Eu3+- and Eu2+-doped glasses. J. Non. Cryst. Solids 2009, 355, 2093–2101. [Google Scholar] [CrossRef]
  45. Maheshvaran, K.; Marimuthu, K. Concentration dependent Eu3+ doped boro-tellurite glasses—Structural and optical investigations. Luminescence 2012, 132, 2259–2267. [Google Scholar] [CrossRef]
  46. Zhu, C.; Yang, Y.; Liang, X.; Yuan, S.; Chen, G. Composition induced reducing effects on Eu ions in borophosphate glasses. J. Am. Ceram. Soc. 2007, 90, 2984–2986. [Google Scholar] [CrossRef]
  47. Lien, N.T.Q.; Trac, N.N.; Van Do, P.; Van Tuyen, H. Judd-Ofelt analysis of Eu3+ and adjustable emission in Eu3+/Eu2+ co-doped sodium aluminosilicate glasses. J. Phys. Chem. Solids 2022, 164, 110637. [Google Scholar] [CrossRef]
  48. Boroica, L.; Radu, D.; Medianu, R. FTIR spectra of glasses from BaO-B2O3-TiO2 system. J. Optoelectron. Adv. Mater. 2008, 10, 3217–3220. [Google Scholar]
  49. Ahemen, I.; De, D.K.; Dejene, F.B.; Viana, B. White light tunable emissions from ZnS: Eu3+ nanophosphors over 330–465 nm excitation range for white LED applications. Mater. Res. Express 2016, 3, 045016. [Google Scholar] [CrossRef]
  50. Grigorjevaite, J.; Ezerskyte, E.; Minderyte, A.; Stanionyte, S.; Juskenas, R.; Sakirzanovas, S.; Katelnikovas, A. Optical Properties of Red-Emitting Rb2Bi(PO4)(MoO4):Eu3+ Powders and Ceramics with High Quantum E ffi ciency for White LEDs. Material 2019, 12, 3275. [Google Scholar] [CrossRef]
Figure 1. (a) XRD patterns of SLB0 and SLB1 glasses. (b) DSC curves of SLB glasses. The curves have been rearranged vertically for better visualization. Tg, Tx, Tp are reported as example for SL B0.
Ceramics 09 00012 g001
Figure 2. (a) ATR-FTIR spectra of Eu3+-doped SLB glasses. (b) N4 and N3 fraction in Eu3+-doped SLB glasses.
Ceramics 09 00012 g002
Figure 3. (a) Transmittance spectra of Eu3+-doped SLB glasses in the UV-Vis region; (b) in the NIR region for SLB0 and SLB6.
Ceramics 09 00012 g003
Figure 4. (a) Absorbance spectra of SLB6 glass in UV region; (b) Vis region; (c) NIR region.
Ceramics 09 00012 g004
Figure 5. (a) Indirect energy band gap plot. (b) Urbach energy plot. (c) Compositional dependence of Egind and ΔE of SLBglasses.
Ceramics 09 00012 g005
Figure 6. Excitation Spectra of SLB glasses by monitoring the emission signal at 612 nm.
Ceramics 09 00012 g006
Figure 7. (a) Emission spectra of SLBglasses under excitation at 361 nm. Inset: Magnified blue emission with dips highlighted by red dotted lines. (b) Normalized emission spectra of SLBglasses.
Ceramics 09 00012 g007
Figure 8. Integrated intensity ratio of the SLBx/SLB0 of the ED (612 nm) and MD (590 nm) emission lines. Intensity of the ratio of blue emission to 5D0 emission in SLB glasses.
Ceramics 09 00012 g008
Figure 9. (a) Excitation spectra of SLB0 glass monitored at 460 and 612 nm. (b) Excitation spectra of SLB6 glasses monitored at 460, 490 nm, and 612 nm. (c) Emission spectra of SLB0 glass excited at 282, 341, and 361 nm. (d) 3D picture of the emission spectra when excited within the [280–350 nm] range for SLP0 glass.
Ceramics 09 00012 g009aCeramics 09 00012 g009b
Figure 10. Normalized fluorescence decay curves for the 5D0 level measured at 612 nm with excitation under 361 nm of SLB glasses. Inset: Using log scale.
Ceramics 09 00012 g010
Figure 11. (a) Overlap between the blue emission and excitation spectra of SLB6 glass. (b) A magnified view of the excitation spectrum and PSB bands. The vertical blue dashed lines correspond precisely to the f–f transitions absorption bands (dips in the excitation spectra).
Ceramics 09 00012 g011
Figure 12. Partial energy level diagram of Eu3+-doped SLBglasses.
Ceramics 09 00012 g012
Figure 13. (a) The CIE 1931 chromaticity diagram shows theSLB-Eu glasses when excited at 361 nm. Emission spectrum corresponding to the CIE colors for SLB0 glass (b) and SLB6 glass (c).
Ceramics 09 00012 g013
Table 1. Glass ID, characteristic temperatures Tg, Tx, Tp and glass stability ΔT of SLB glasses.
Glass IDComposition (mol%)TgTxTpΔT
Sb2O3B2O3Li2OEu2O3(°C)
SLB089.50100.5268414467146
SLB179.510100.5275434473159
SLB269.520100.5279439484160
SLB359.530100.5293---
SLB449.540100.5302---
SLB539.550100.5316---
SLB629.560100.5327---
Table 2. Physical properties of SLB glasses and their relative ratio Δ = SLB6/SLB0.
Physical PropertiesSLB0SLB1SLB2SLB3SLB4SLB5SLB6Δ (%)
d (g/cm−3)4.9764.8334.6264.3834.1383.8223.816−23.31
Vm (cm3 mol−1)53.38851.41949.74448.22046.54945.57340.394−24.33
N × 1020 (ions cm−3) 1.1281.1711.2111.2491.2941.3221.49132.18
rp (Å)8.3398.2368.1448.0617.9667.9107.599−8.87
ri (Å)20.69720.44020.21220.00519.77119.63018.859−8.88
F × 1014 (cm−2)4.3144.4234.5234.6174.7284.7955.19520.42
Table 3. Optical properties of SLB glasses and their relative ratio Δ = SLB6/SLB0.
Optical PropertiesSLB0SLB1SLB2SLB3SLB4SLB5SLB6Δ (%)
Cut off ±1384375363358349334325−15.36
Energy band gap E g i n d (eV) ± 0.012.732.963.193.193.313.403.4425.93
Urbach energy (eV) ± 0.0080.1770.1560.1510.1460.1430.1400.138−22.00
Refraction index (n) ± 0.042.102.052.012.001.971.961.95−6.94
Reflection losses R (%)12.3011.8311.3111.1510.7810.5610.4415.12
Dielectric constant ε4.4144.1984.0564.0123.9133.8533.822−13.41
Optical electronegativity (∆χ*)1.1991.2631.3081.3221.3561.3761.38715.67
Optical basicity (Λth)1.1011.0691.0461.0391.0221.0121.007−8.53
Table 4. Relative intensity ratios SLBx/SLB0 (%) at different excitation wavelengths.
λExc (nm) SLB1/SLB0SLB2/SLB0SLB3/SLB0SLB4/SLB0SLB5/SLB0SLB6/SLB0
361274089130227
3945920263038
465234556
Table 6. CIE chromaticity parameters of Eu3+-doped SLB glasses.
SLBx GlassesCIE IDxyLumensCCT (K)
000.4940.3452951836
1010.5130.352991713
2020.5660.3523031399
3030.6040.3523071220
4040.6180.3563091178
5050.6170.3542871176
6060.6140.3543061187
Rb2Bi(PO4)(MoO4):1% Eu3+ λem =395 nm [50]-0.6490.350210-
Li3Ba2Eu3(MoO4)8 λem = 615.5 nm [50]---312-
Y2Mo4O15:75%Eu3+ λem = 613 nm [50] 242
Disclaimer/Publisher’s Note: The statements, opinions and data contained in all publications are solely those of the individual author(s) and contributor(s) and not of MDPI and/or the editor(s). MDPI and/or the editor(s) disclaim responsibility for any injury to people or property resulting from any ideas, methods, instructions or products referred to in the content.