1. Introduction
The exceptional performance profiles of silicon carbide (SiC), titanium diboride (TiB
2), and titanium carbide (TiC) make them highly suitable for demanding engineering applications. SiC stands out for its excellent thermal shock resistance, high thermal conductivity, superior strength and hardness, and notable resistance to oxidation and corrosion, all while maintaining a low density. TiC, an ultra-high-temperature ceramic, is distinguished by its extreme hardness, exceptional thermal and chemical stability, and favorable electrical and thermal conductivity [
1,
2,
3,
4,
5]. The outstanding physical, mechanical, and chemical properties of TiB
2—such as high thermal and electrical conductivities, wear and corrosion resistance, and exceptional hardness—make it an attractive reinforcement material for ceramic composites.
Due to the combination of properties of these ceramic phases, the ceramic composites based in the ternary system SiC-TiB
2-TiC are of great interest due to their excellent mechanical properties, such as high tensile strength, chemical resistance and creep resistance, as well as their good corrosion resistance and electrical conductivity [
6,
7,
8].
As various research groups report, the properties of ceramic composites (such as mechanical, tribological, electrical, thermal, etc.) can be improved by introducing graphene into them [
9,
10,
11,
12,
13,
14,
15,
16]. In these studies, various methods to synthesize graphene, produce graphene–ceramic compounds and sinter them were used. As is well known, graphene in a liquid medium tends to form agglomerates and re-stack due to van der Waals forces [
9,
17]. Therefore, it is very difficult to distribute it uniformly in a ceramic matrix, where the graphene agglomerates become defects that worsen the material’s properties.
The most common method for introducing the two-dimensional form of carbon between the compounds of a ceramic composite is the use of graphene oxide (GO). GO is a derivative of graphene that has functional groups (epoxy, hydroxyl and carboxyl) attached to its surfaces as well as its edges. The presence of these functional groups makes it hydrophilic, which allows GO to dissolve easily in water and polar organic solvents, thus facilitating the process of obtaining homogeneous graphene-reinforced ceramic compounds [
18,
19,
20]. At temperatures above 1500 °C and in a vacuum, graphene oxide is completely reduced and its structure becomes reduced graphene oxide (rGO), which is much closer to that of pristine graphene [
21,
22].
A comparative study by Belmonte et al. [
23] on graphene additives for SiC found rGO to be more effective than graphene nanoplatelets (GNPs). The addition of 5 vol% rGO resulted in a dramatic 162% increase in fracture toughness to 8.3 MPa·m
1/2, whereas a larger amount of GNP (10 vol%) yielded a more modest increase to 5.9 MPa·m
1/2; both composites maintained a strength of approximately 600 MPa.
Using SPS, Miranzo et al. [
24] achieved the in situ growth of graphene sheets (~4 vol%) within a SiC matrix. This in situ-formed graphene was responsible for a ~55% improvement in the ceramic’s fracture toughness.
Li et al. [
25], in their study on pressure-less sintering, determined that a sample with 1.0 wt.% graphene content, sintered at 2130 °C for 1 h in Ar, exhibited the highest fracture toughness of 5.65 MPa·m
1/2. This value was 22% greater than that of graphene-free SiC ceramics.
In our previous work [
26], zirconia-toughened alumina composites reinforced with different concentrations of rGO of 0.28, 0.52 and 6.1 wt.% were obtained by spark plasma sintering (SPS) and their mechanical properties were studied. The results showed that the introduction of a low GO content into the ceramic matrix (0.28 wt.%) allows an increase in hardness (17.6 GPa), fracture toughness (6.8 MPa∙m
1/2) and strength (876 MPa). On the other hand, it was determined that the inclusion of more than 0.28 wt.% of GO leads to a decrease in mechanical properties.
The purpose of this work is to determine how effective the addition of graphene to the SiC-TiB2-TiC composite is, as well as to determine the rational amount of graphene capable of improving the physico-mechanical and tribological characteristics of the ceramic composite based in the ternary system SiC-TiB2-TiC.
2. Materials and Methods
Commercially available SiC (purity 96–99.9%), TiB
2 (purity 99.9%) and TiC (purity 99.5%) powders by manufacturer “Plasmotherm” Ltd., Moscow, Russia were used as raw materials in this study. Graphene oxide was obtained by the modified Hummers method from commercial graphite powder (“Plasmotherm”, Ltd., Moscow, Russia) with an average particle size of d
50 = 3 microns. The process of its preparation is described in detail in [
27]. The previous study successfully determined the optimal composition (60 vol.% SiC-15 vol.% TiC-25 vol.% TiB
2) for the ceramic matrix [
5]. Raw powders were mechanically mixed in an ML1 ball mill (Zapadpribor, Kaluga, Russia) for 36 h in a 250 mL polyethylene jar with SiC balls (∅3 mm) at a rotation speed of 250 rpm in liquid media. After drying (70 °C for 12 h) a prepared suspensions in a vacuum, it was sieved through a 63 μm sieve. The resulting mixtures of ceramic powders with 0.15 vol.%, 0.25 vol.% and 0.5 vol.% graphene oxide were labeled as 60SiC-0.15G, 60SiC-0.25G and 60SiC-0.5G, respectively (
Table 1).
The rule of mixtures was applied to calculate the theoretical density of the composites. The densities of the constituent materials—3.21 g/cm3 for SiC, 4.52 g/cm3 for TiB2, 4.93 g/cm3 for TiC, and 2.2 g/cm3 for graphene—were ascertained using a AccuPyc II 1340 (Micromeritics, Norcross, GA, USA) helium pycnometer. The relative density was derived by dividing the experimental bulk density by the calculated theoretical density.
Sintering of ceramic powders was carried out in a spark plasma sintering machine (model H-HP D 25 SD, FCT Systeme GmbH, Rauenstein, Germany) at 1870 °C with a heating rate of 100 °C/min, an applied pressure of 80 MPa, and a dwell time of 5 min. Afterwards, sintering disk samples (diameter of 45 mm and height of 5 mm) were obtained. Then, disk samples were polished, and in the final stage a diamond suspension of 1 μm was used.
Vickers hardness (Hv) was determined on polished surface using a Qness microhardness tester (Salzburg, Austria) equipped with a diamond pyramid indenter. A 98 N load was applied for a dwell time of 10 s. Hardness was determined as the average of three samples, with 10 measurements taken from each sample. The direction of the force applied during the hardness measurement was parallel to the direction of the axial compressive force during sintering.
Fracture toughness was evaluated on the same polished surfaces using the microindentation method [
19,
28] under identical loading conditions (98 N, 10 s).
Before examining the samples in a VEGA 3 LMH scanning electron microscope (Tescan, Brno, Czech Republic), they were cleaned in an isopropanol ultrasonic bath to remove debris. SEM was equipped with an X-Act EDS detector (Oxford Instruments, Abingdon, UK) for elemental mapping.
Flexural strength was determined using the three-point bending test configuration following the standard ASTM C1161-13 [
29] using rectangular bars with a dimension of 3 mm × 4 mm × 40 mm, span of 30 mm, and displacement rate of 0.5 mm/min in an ElectroPuls E10000 (Instron, High Wycombe, UK) universal testing machine. From each sintered disk 5 bars were obtained, and flexural strength was determined as the average of them. The direction of the force applied during the bending test was perpendicular to the direction of the axial compressive force during sintering.
The dry sliding wear resistance of samples was carried out at room temperature using a ball-on-disc configuration on a Ducom POD 4.0 tribometer (Ducom Instruments, Bangalore, India), following the ASTM G99 [
30] standard. Tests were conducted for a sliding distance of 10 km at a rotational speed of 360 rpm, employing a 6 mm diameter silicon nitride (Si
3N
4) ball as the counterface. The orientation of the surface used for tribological experiments was the same relative to the direction of application of the axial compressive force during sintering. Two normal loads of 10 N and 30 N were applied, resulting in initial Hertzian contact pressures of 2.0 GPa and 2.8 GPa, respectively. Prior to testing, all samples were ultrasonically cleaned in ethanol for 15 min and dried using compressed air.
The equation used for the specific wear rate (I
W) calculation was:
where ∆V—loss of material volume after testing (mm
3), F
N—applied load (N) and S—sliding distance (m).
Quantification of volume loss was performed by analyzing three-dimensional surface profiles acquired with a Talysurf CLI 500 profilometer (Taylor Hobson, Leicester, UK). Microstructural analysis, including examination of fracture surfaces and indentation-induced cracks, was conducted using SEM-EDS. Furthermore, phase identification of sintered composites was achieved by X-ray diffraction (XRD) on Empyrean diffractometer (PANalytical, Almelo, The Netherlands) utilizing Cu–Kα radiation (λ = 1.5406 Å), scanning a 2θ range from 20° to 120°. More information about the research methods is described in our previous work [
5].
3. Results and Discussion
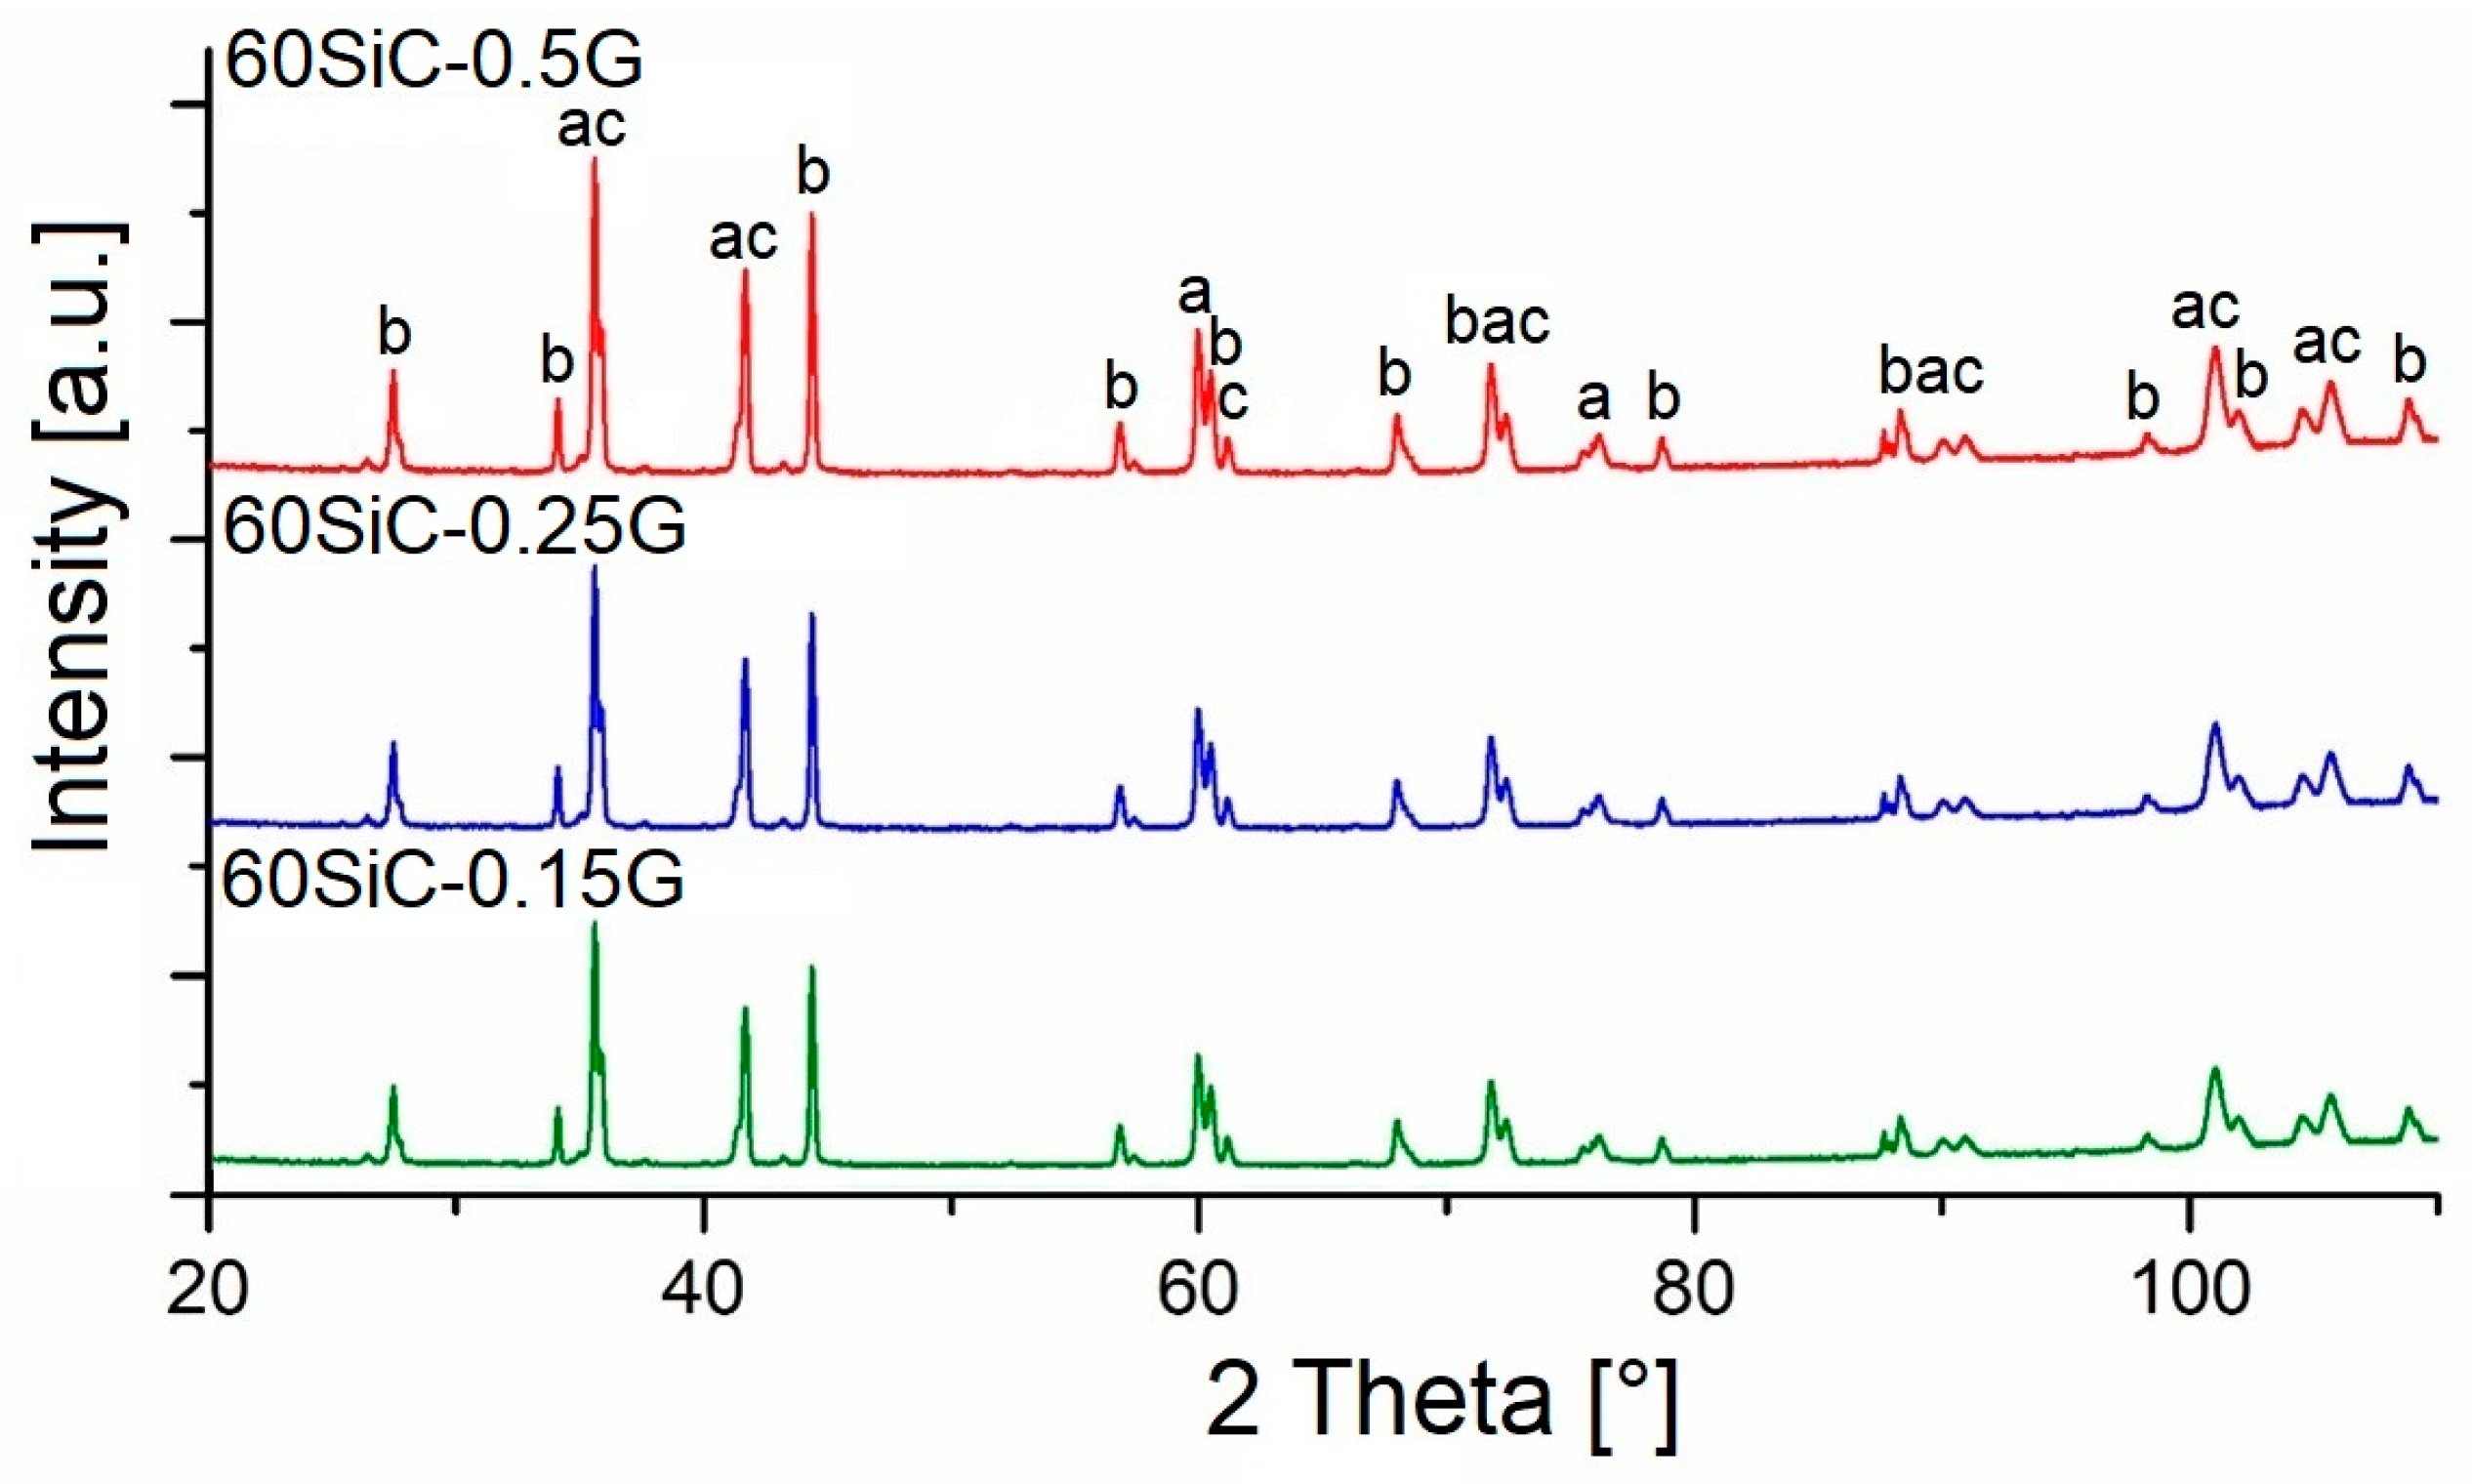
Figure 1 shows the XRD patterns of sintered composites. Only the SiC, TiB
2, and TiC phases were detected in the sintered samples, without the presence of any new impurities and phases.
The absence of peaks characteristic of SiO, SiO2, and B2O3 on the X-ray diffraction patterns in sintered samples may be due to the low concentration of these oxides in the samples, as well as the formation of an amorphous structure. On the other hand, it can be assumed that the temperature of 1870 °C is not sufficient to ensure rapid high-temperature chemical reactions in the 60SiC-G system.
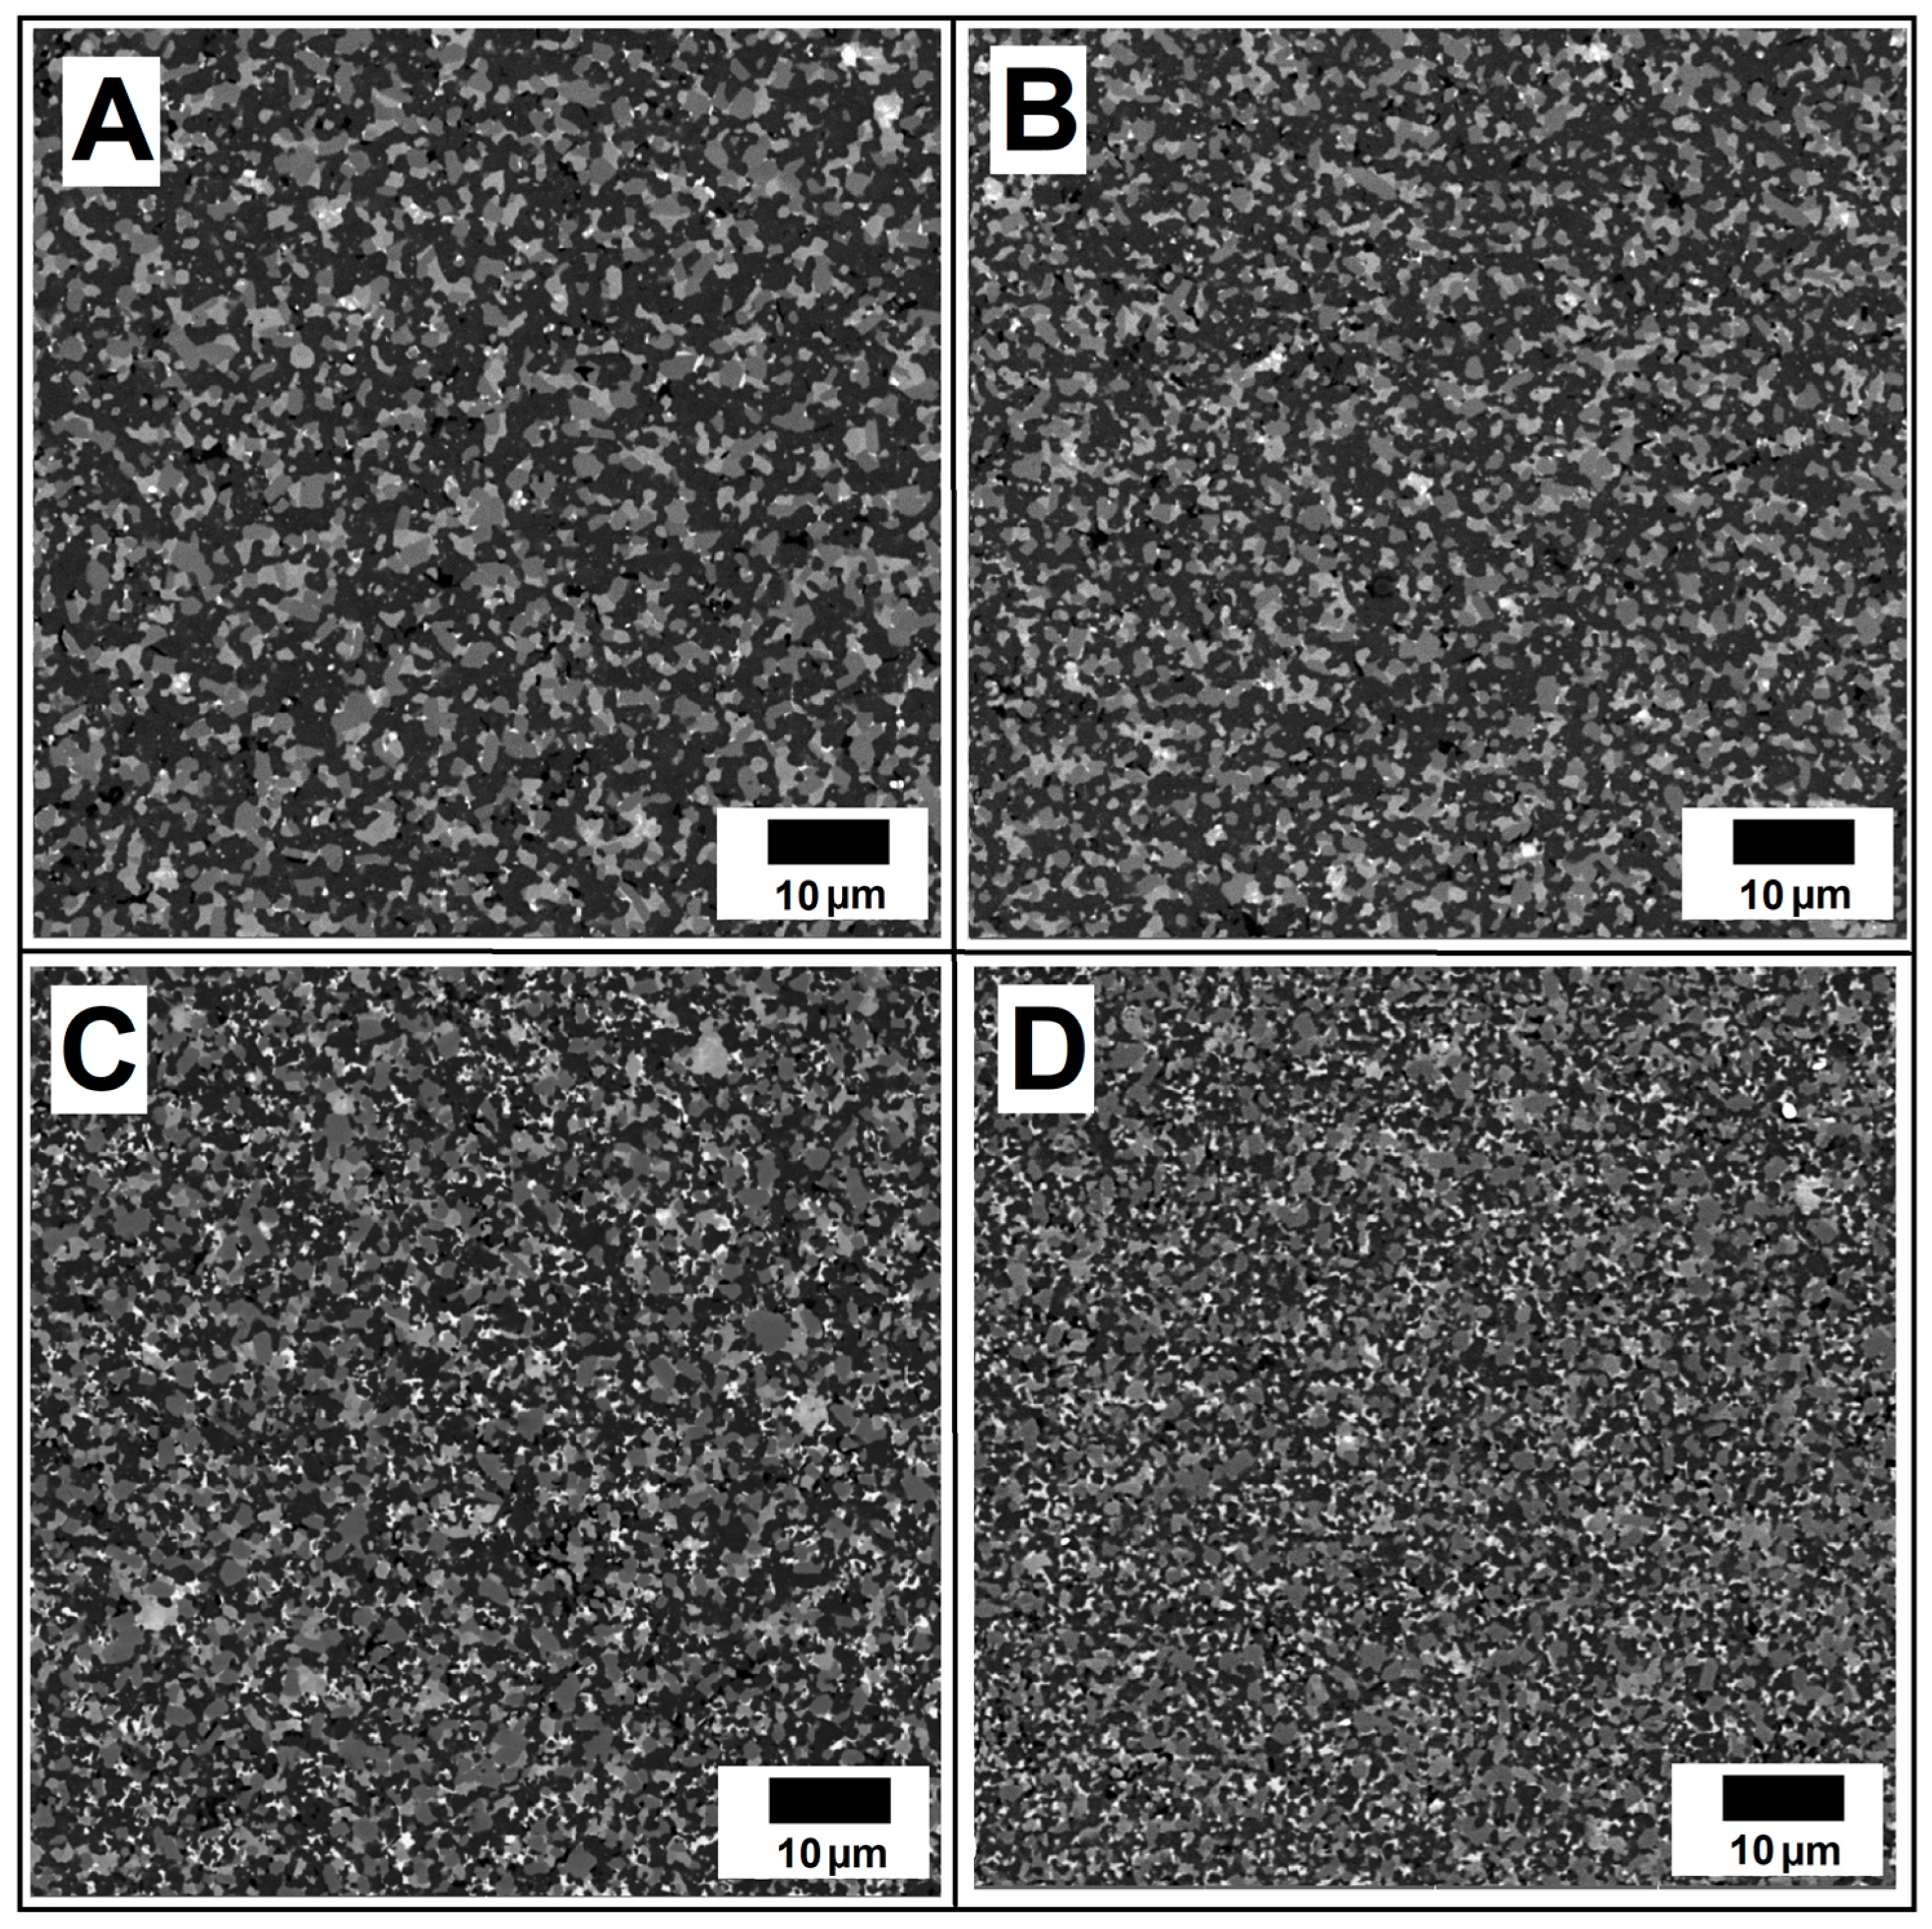
Figure 2 shows the microstructures of sintered samples without rGO and with 0.15, 0.25, and 0.5 vol.% of rGO, on which the dark gray, light gray, and gray phases are SiC, TiB
2, and TiC, respectively.
Regardless of the rGO content in the matrix, all phases are evenly distributed over the volume. The grain size of the phases for 60SiC sample is within 2.6 microns for SiC, 1.5 microns for TiB
2, and 1.4 microns for TiC. The grain size of the phases for ceramic-rGO samples is in the range of 2.4–1.9 microns for SiC, 1.1–0.7 microns for TiB
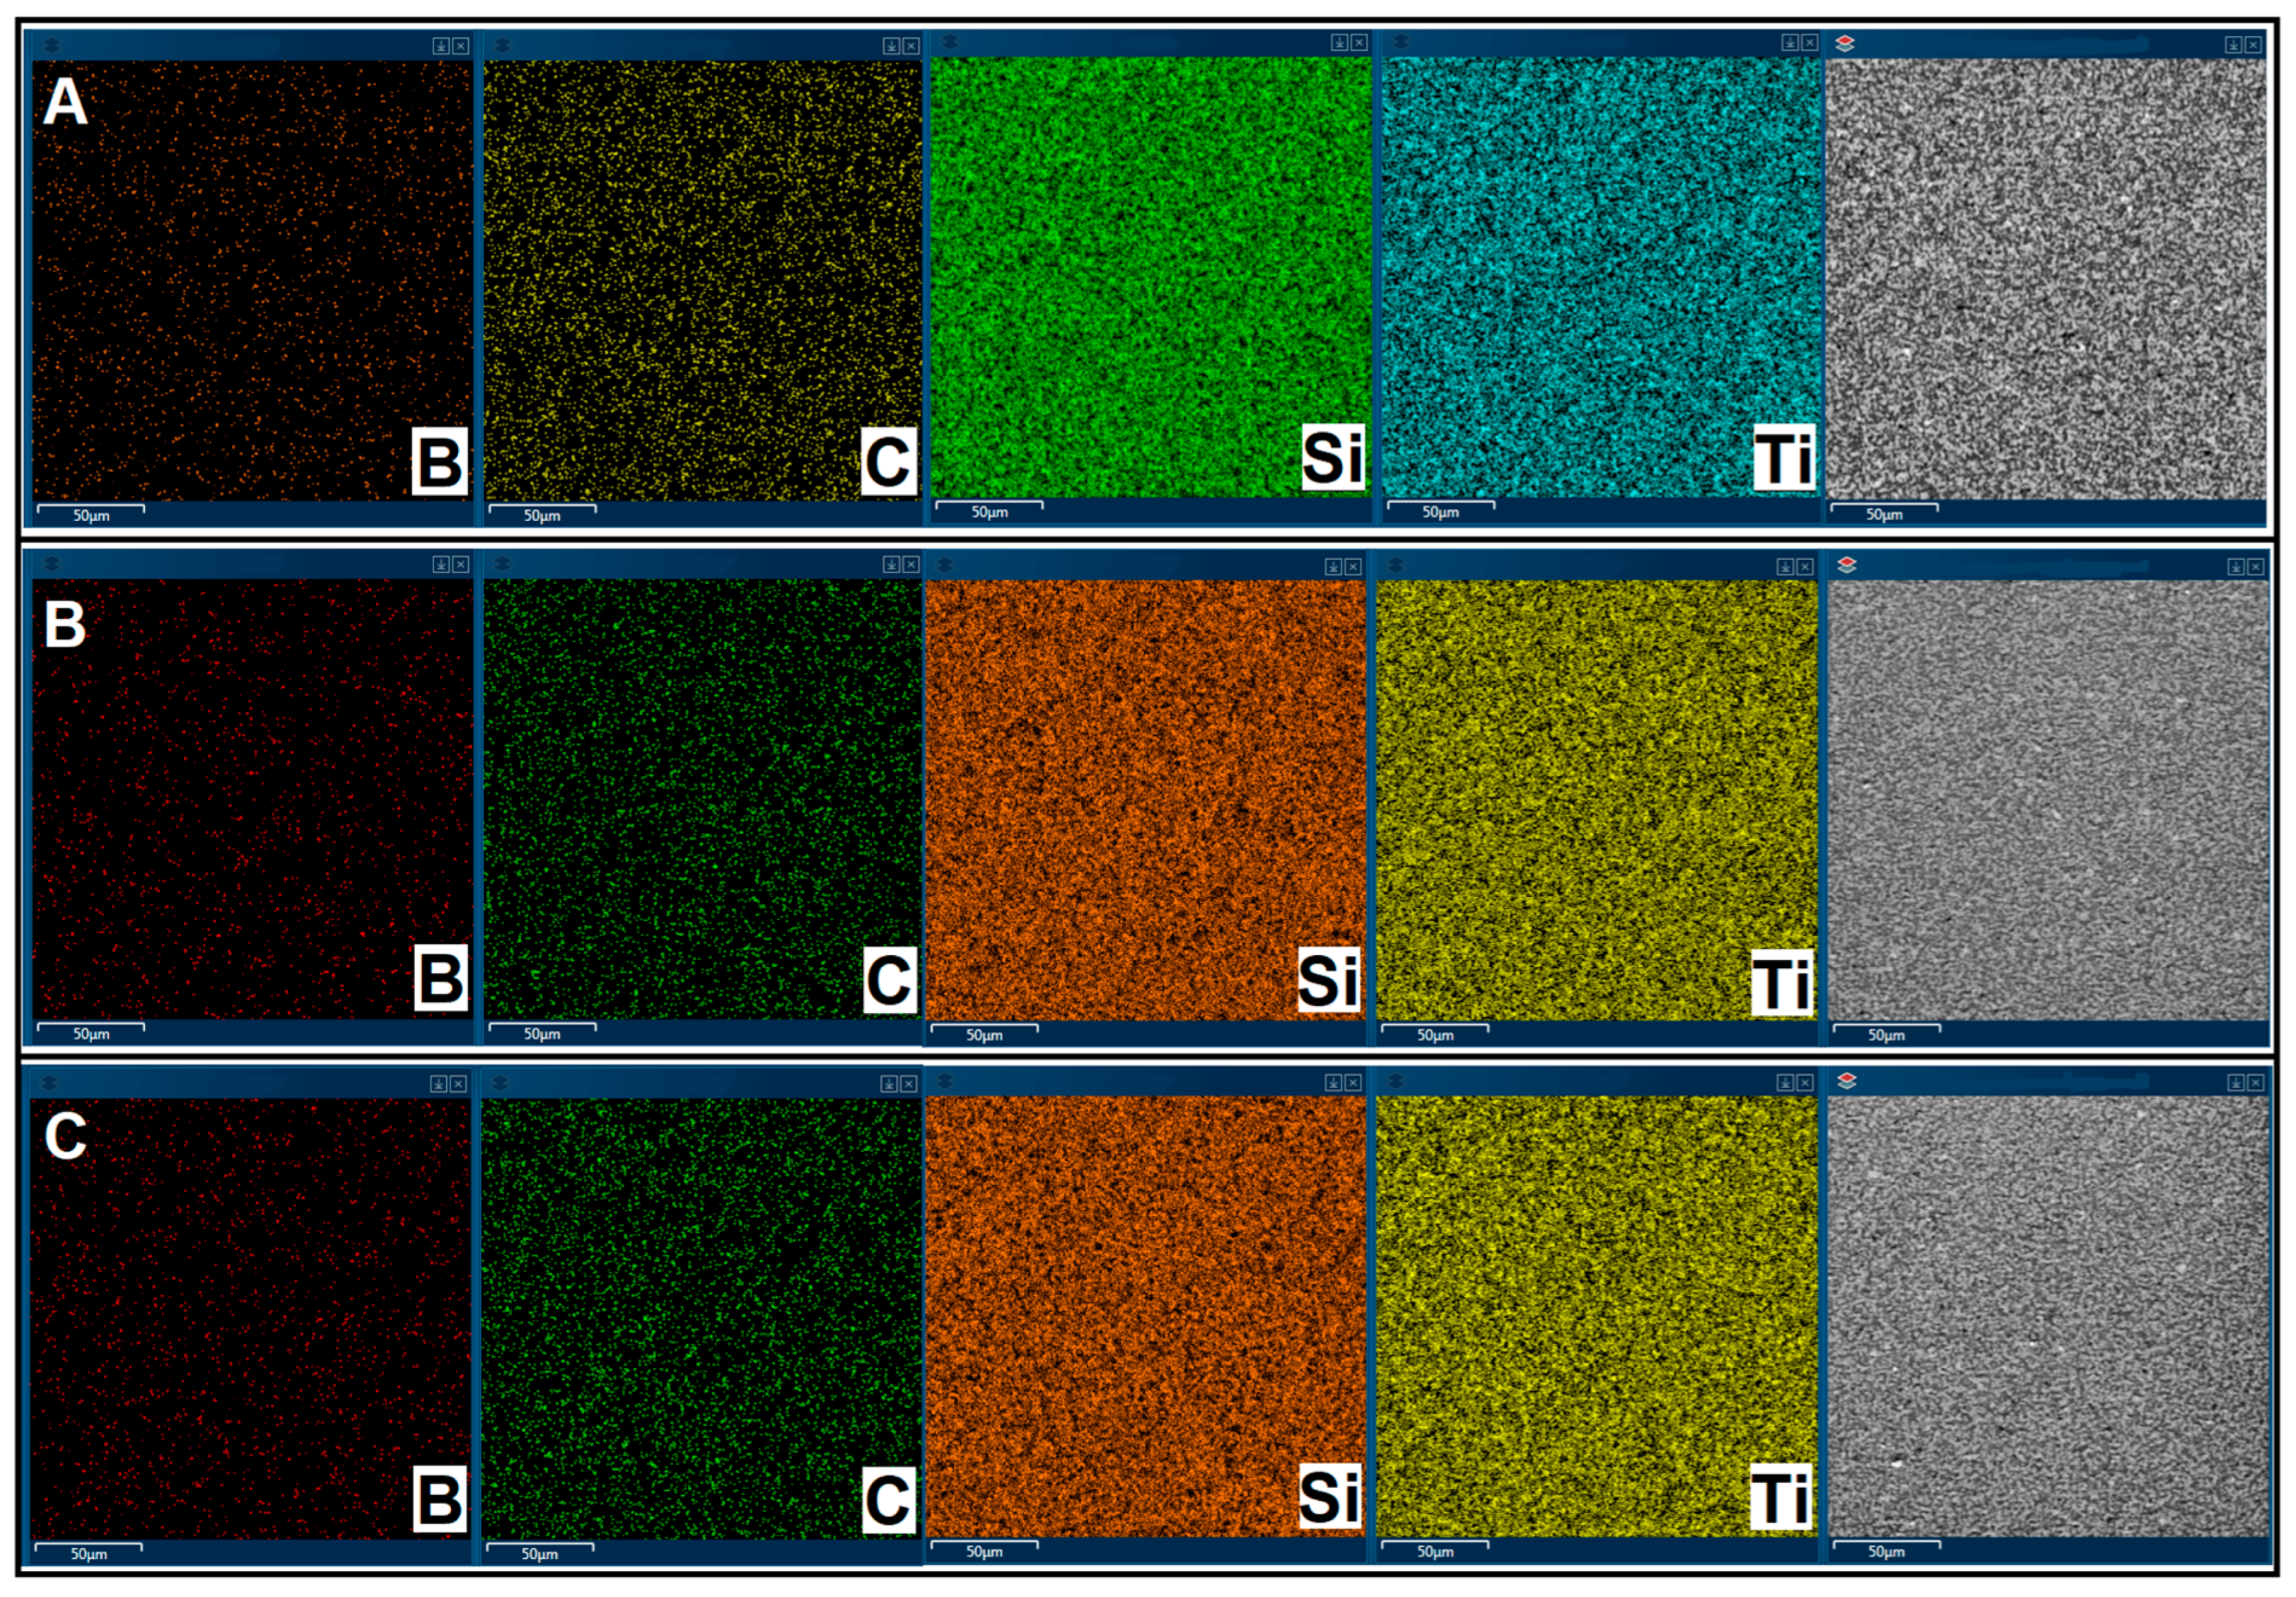
2, and 1.1–0.9 microns for TiC. Therefore, the presence of rGO in the compositions slows down the process of grain growth of the ceramic phases during sintering. The chemical composition of the sintered samples is shown in
Figure 3 in the form of element distribution maps. The figure shows that the following elements were found in the sintered samples: boron, carbon, silicon and titanium. It can also be observed that these elements are evenly distributed over the entire volume of the samples.
Table 2 shows data on the content of elements in sintered composites.
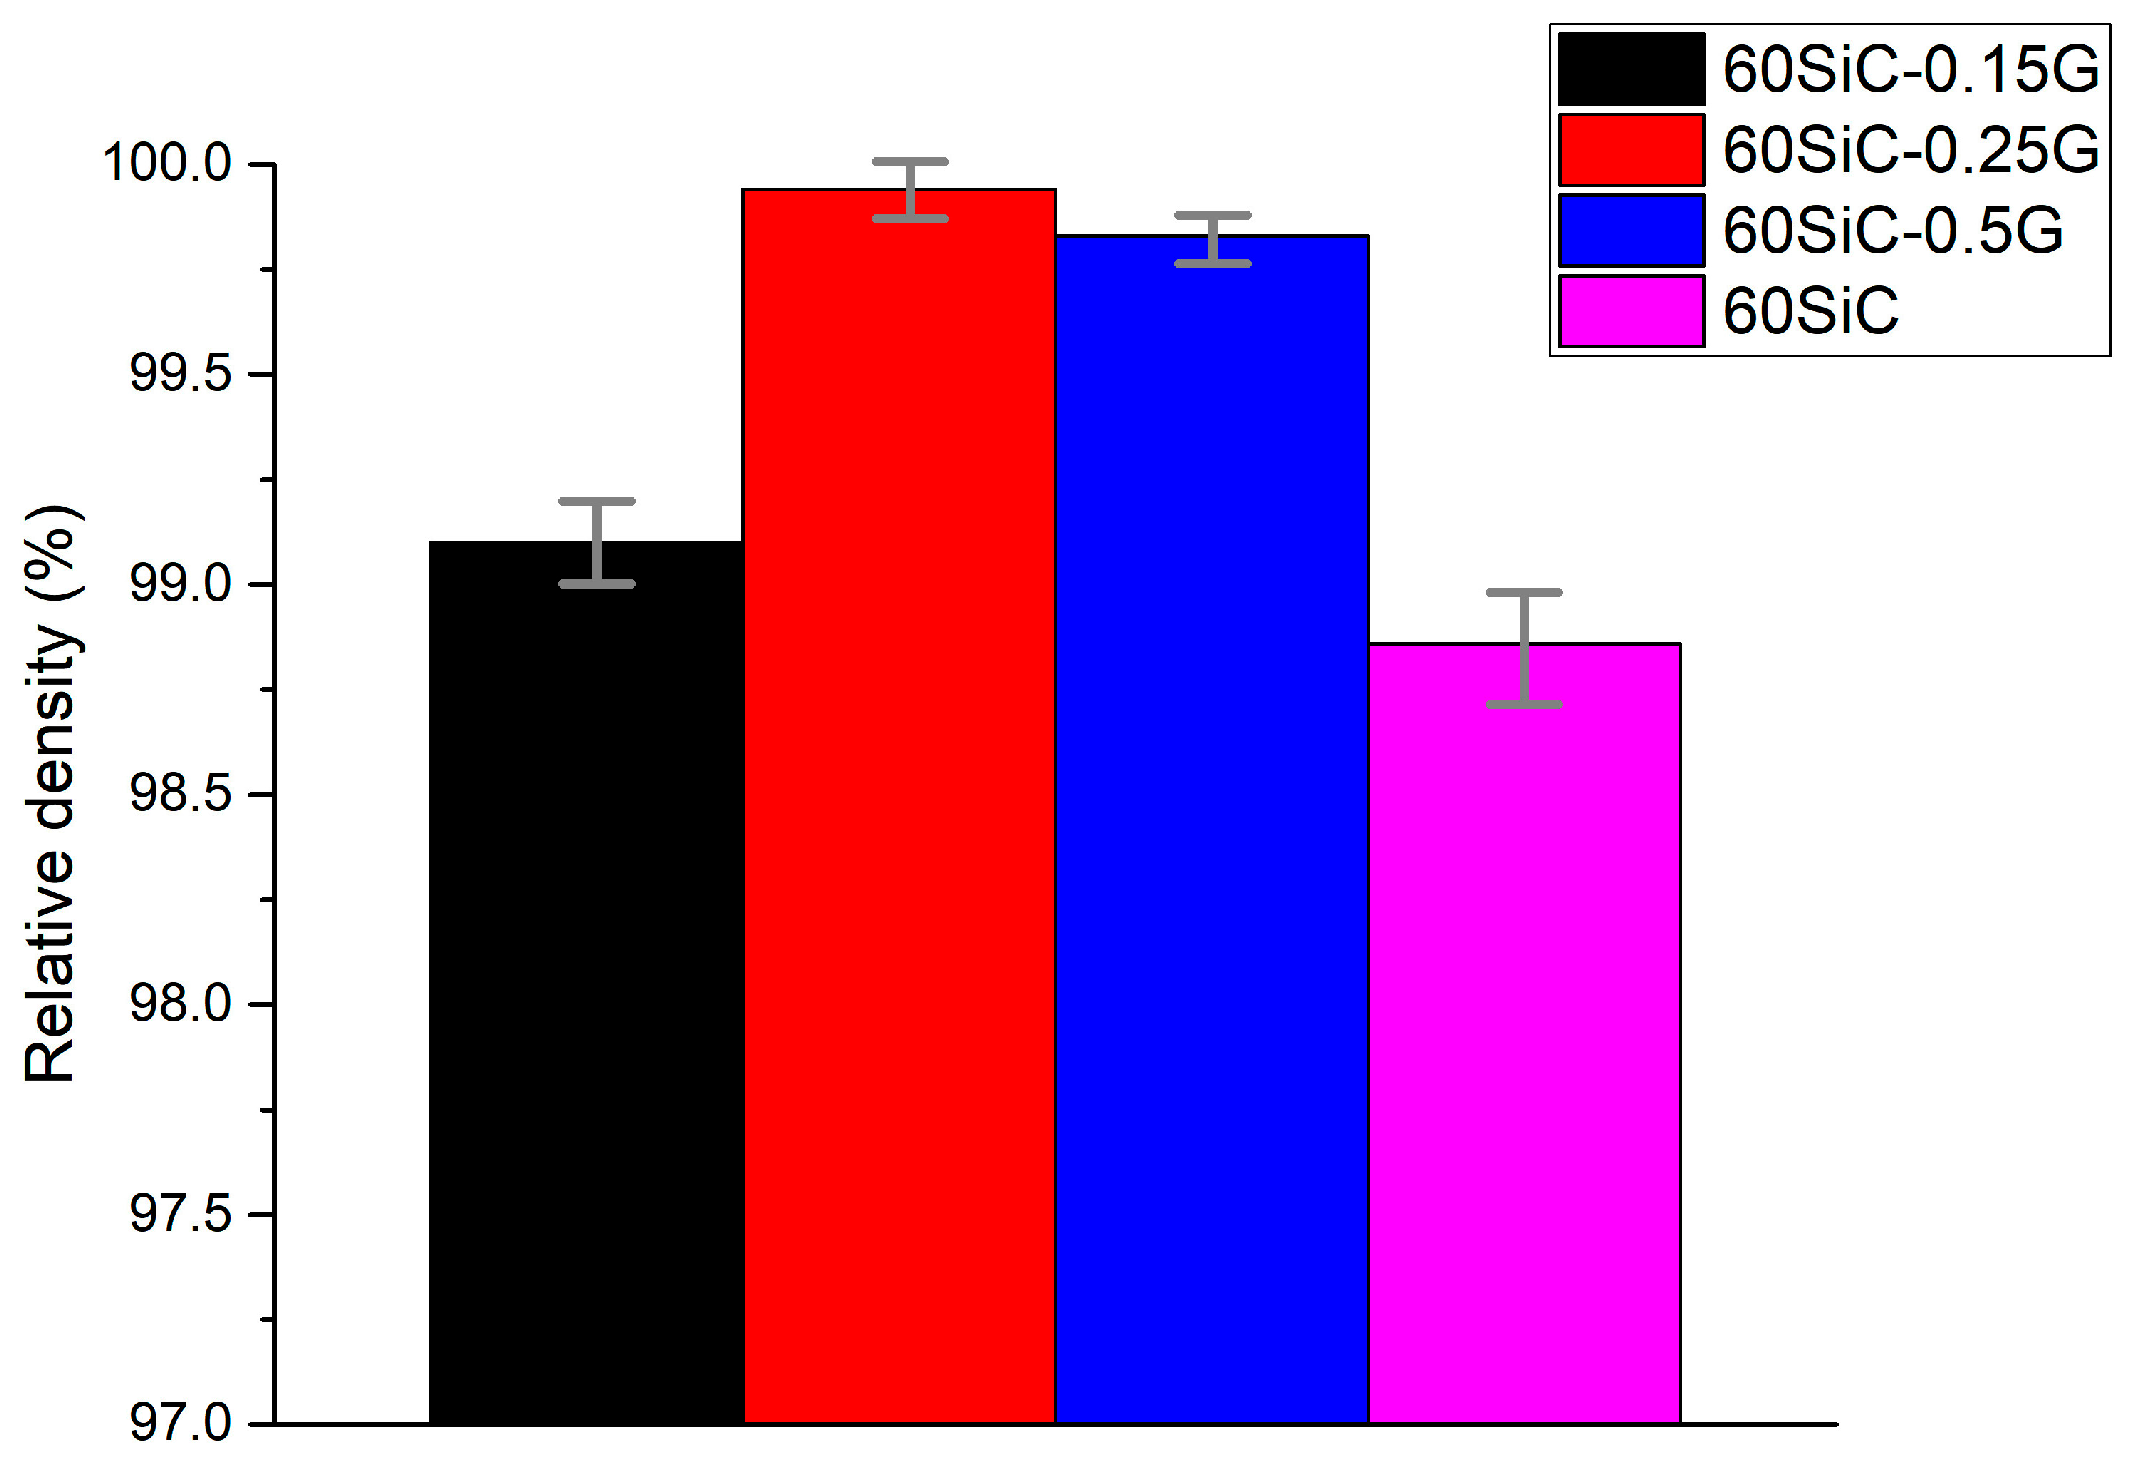
Figure 4 shows a diagram of the results of measuring the relative density of the obtained composites. It can be seen that the addition of 0.15 vol.% rGO has no significant effect in increasing the relative density. Thus, the following relationship should be noted; with an increase in the graphene oxide content in 60SiC samples, the relative density increases. The maximum value of 99.93 ± 0.05% is observed in the 60SiC-0.25G, which is 0.94% more than in the sample without rGO. A decrease in relative density is observed with an increase in rGO content from 0.25 to 0.5% vol. This may be due to the fact that rGO located at grain boundaries and triple junctions creates a physical barrier to atomic diffusion and mass transfer, which is the driving force behind sintering. In addition, they limit the movement of grain boundaries, effectively suppressing the compaction process and resulting in higher residual porosity [
31].
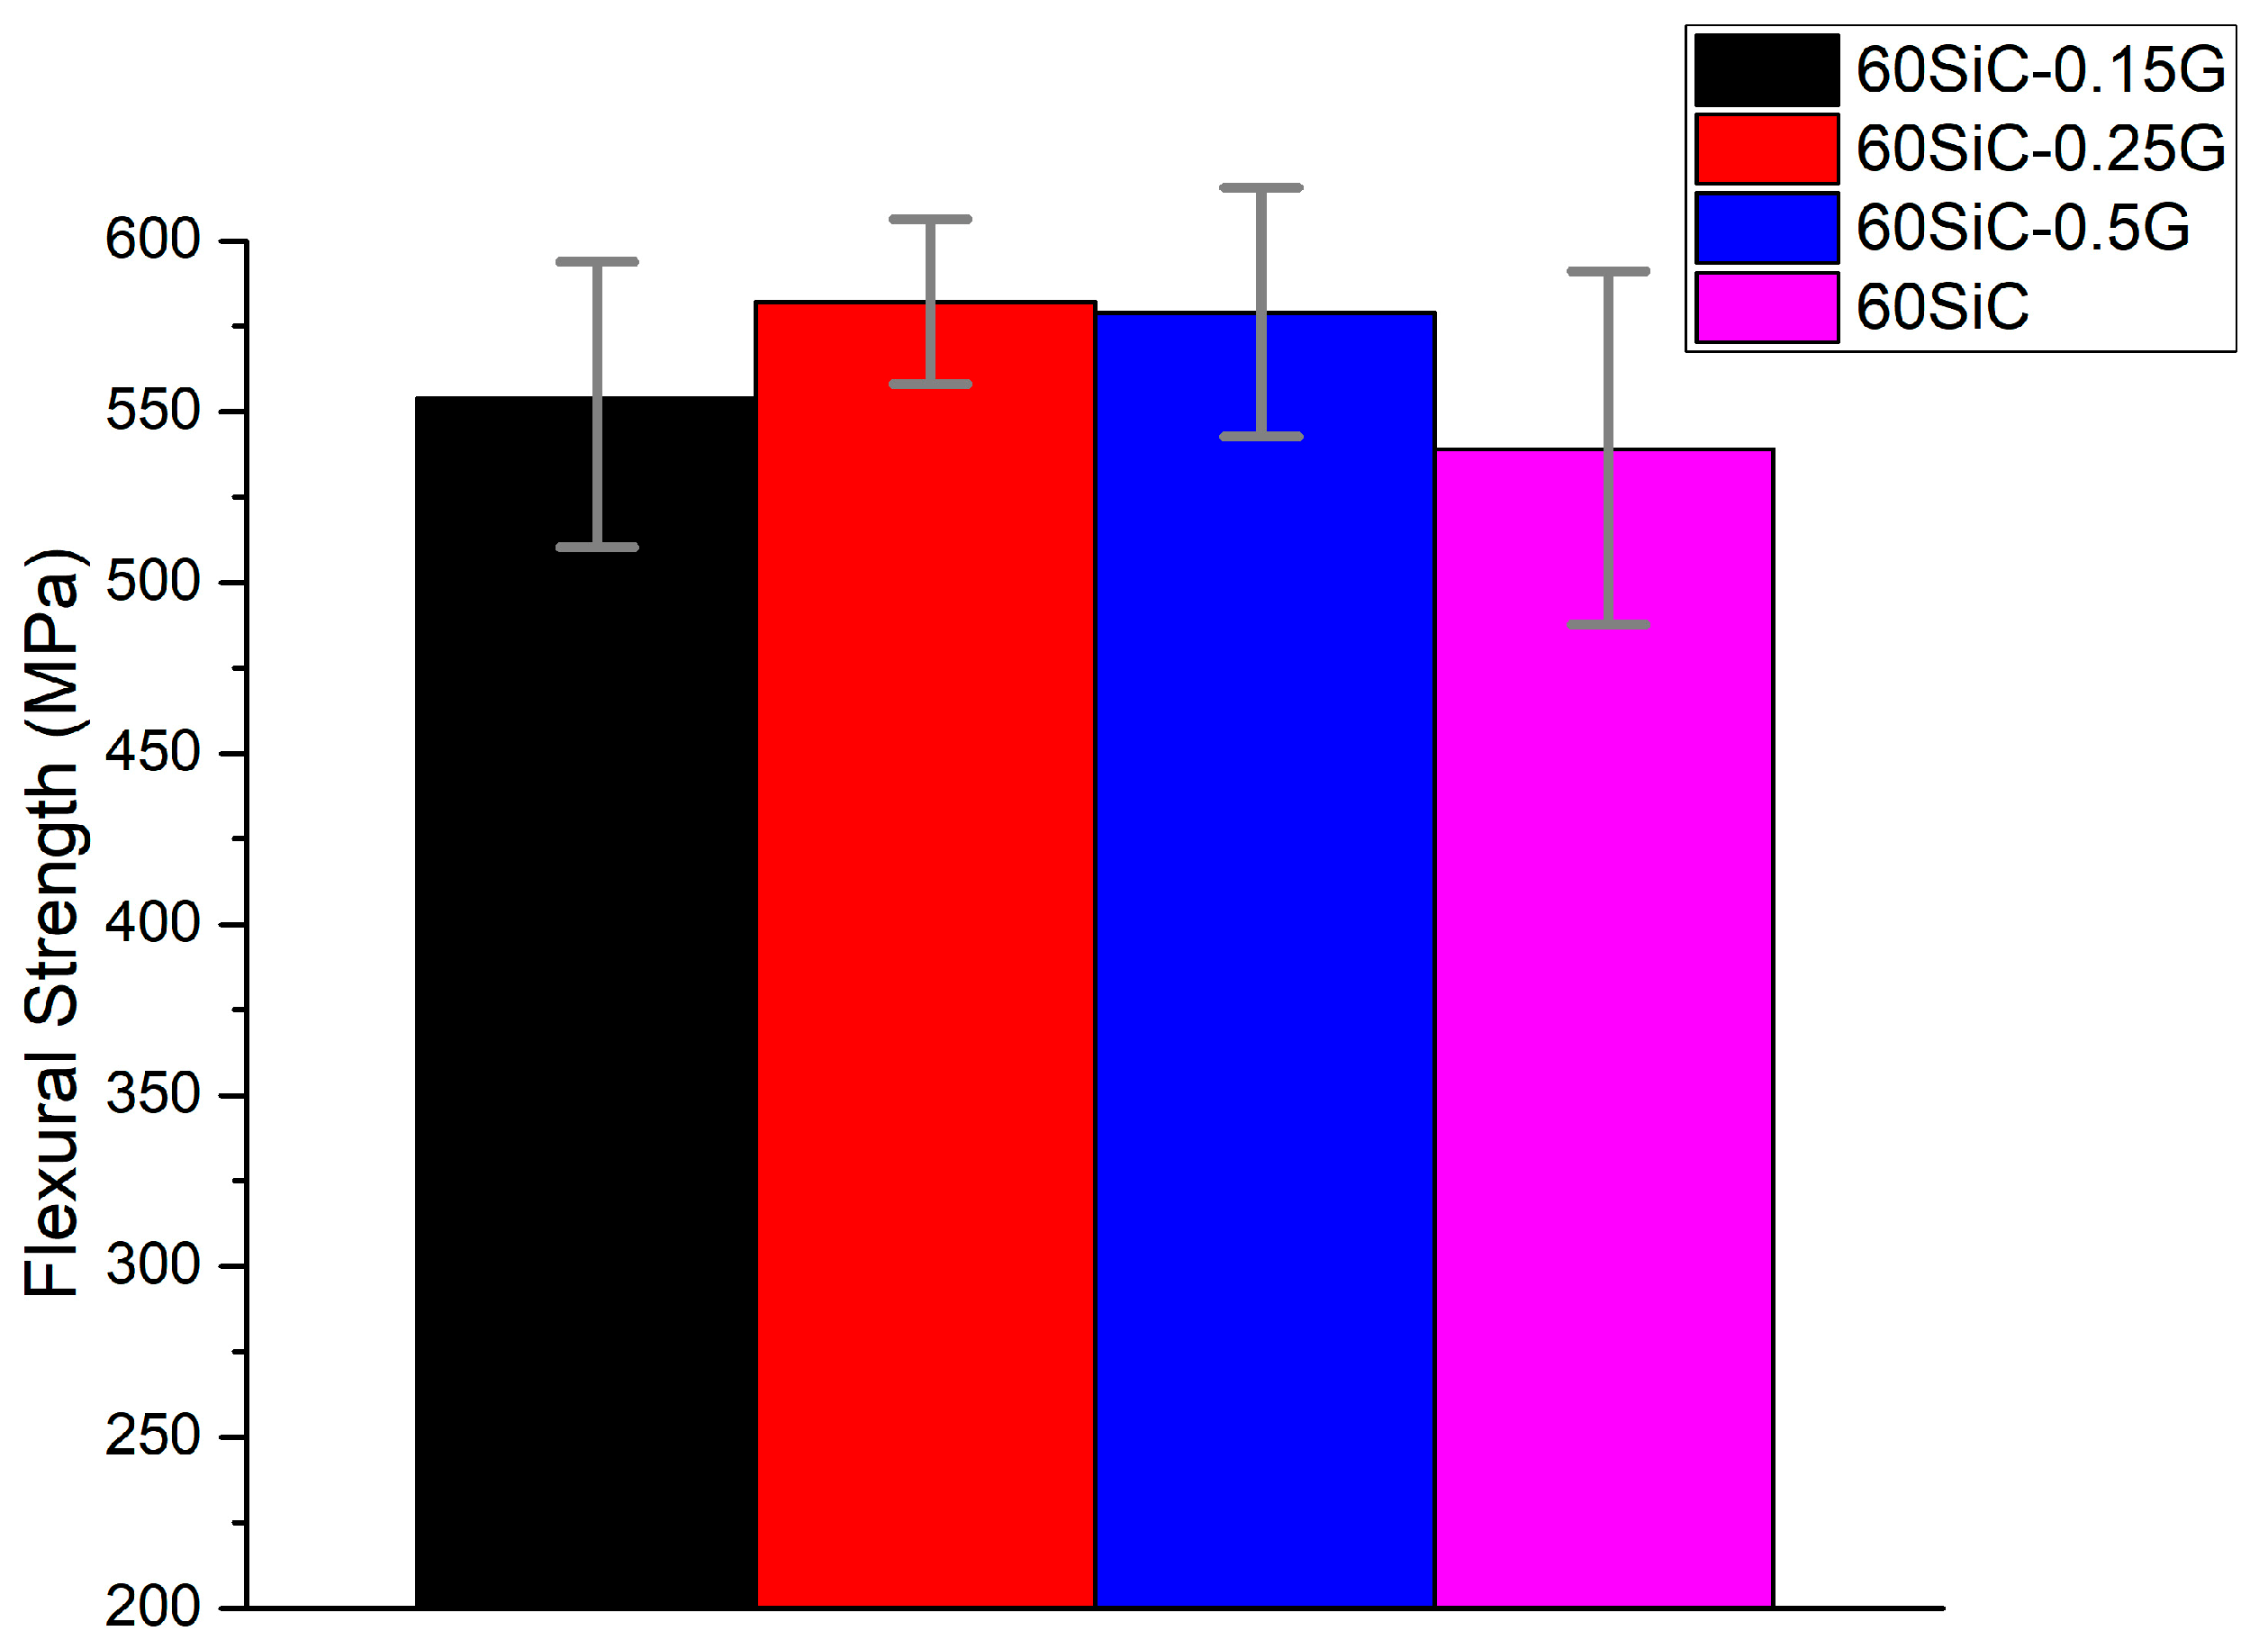
Figure 5 shows the results of measurements of the flexural strength of the obtained composites.
It is worth noting that the bending strength has a similar behavior to the relative density of samples, where samples with a high rGO content (0.25 and 0.5 vol.%) show the best results (582.8 ± 27.6 MPa and 578.4 ± 37.5 MPa, respectively). The maximum bending strength of the 60SiC sample is 0.25G, which is 7.9% higher than that of the non-graphene sample. A similar behavior of bending strength is observed in [
22]. The strength increases with the addition of rGO, reaching a maximum value of 582.8 ± 27.6 MPa for the composite with 0.25 vol % rGO, which represents an improvement of 26% compared to the pure SiC. A further increase in the rGO content up to 0.5 vol % leads to a gradual decrease in the strength.
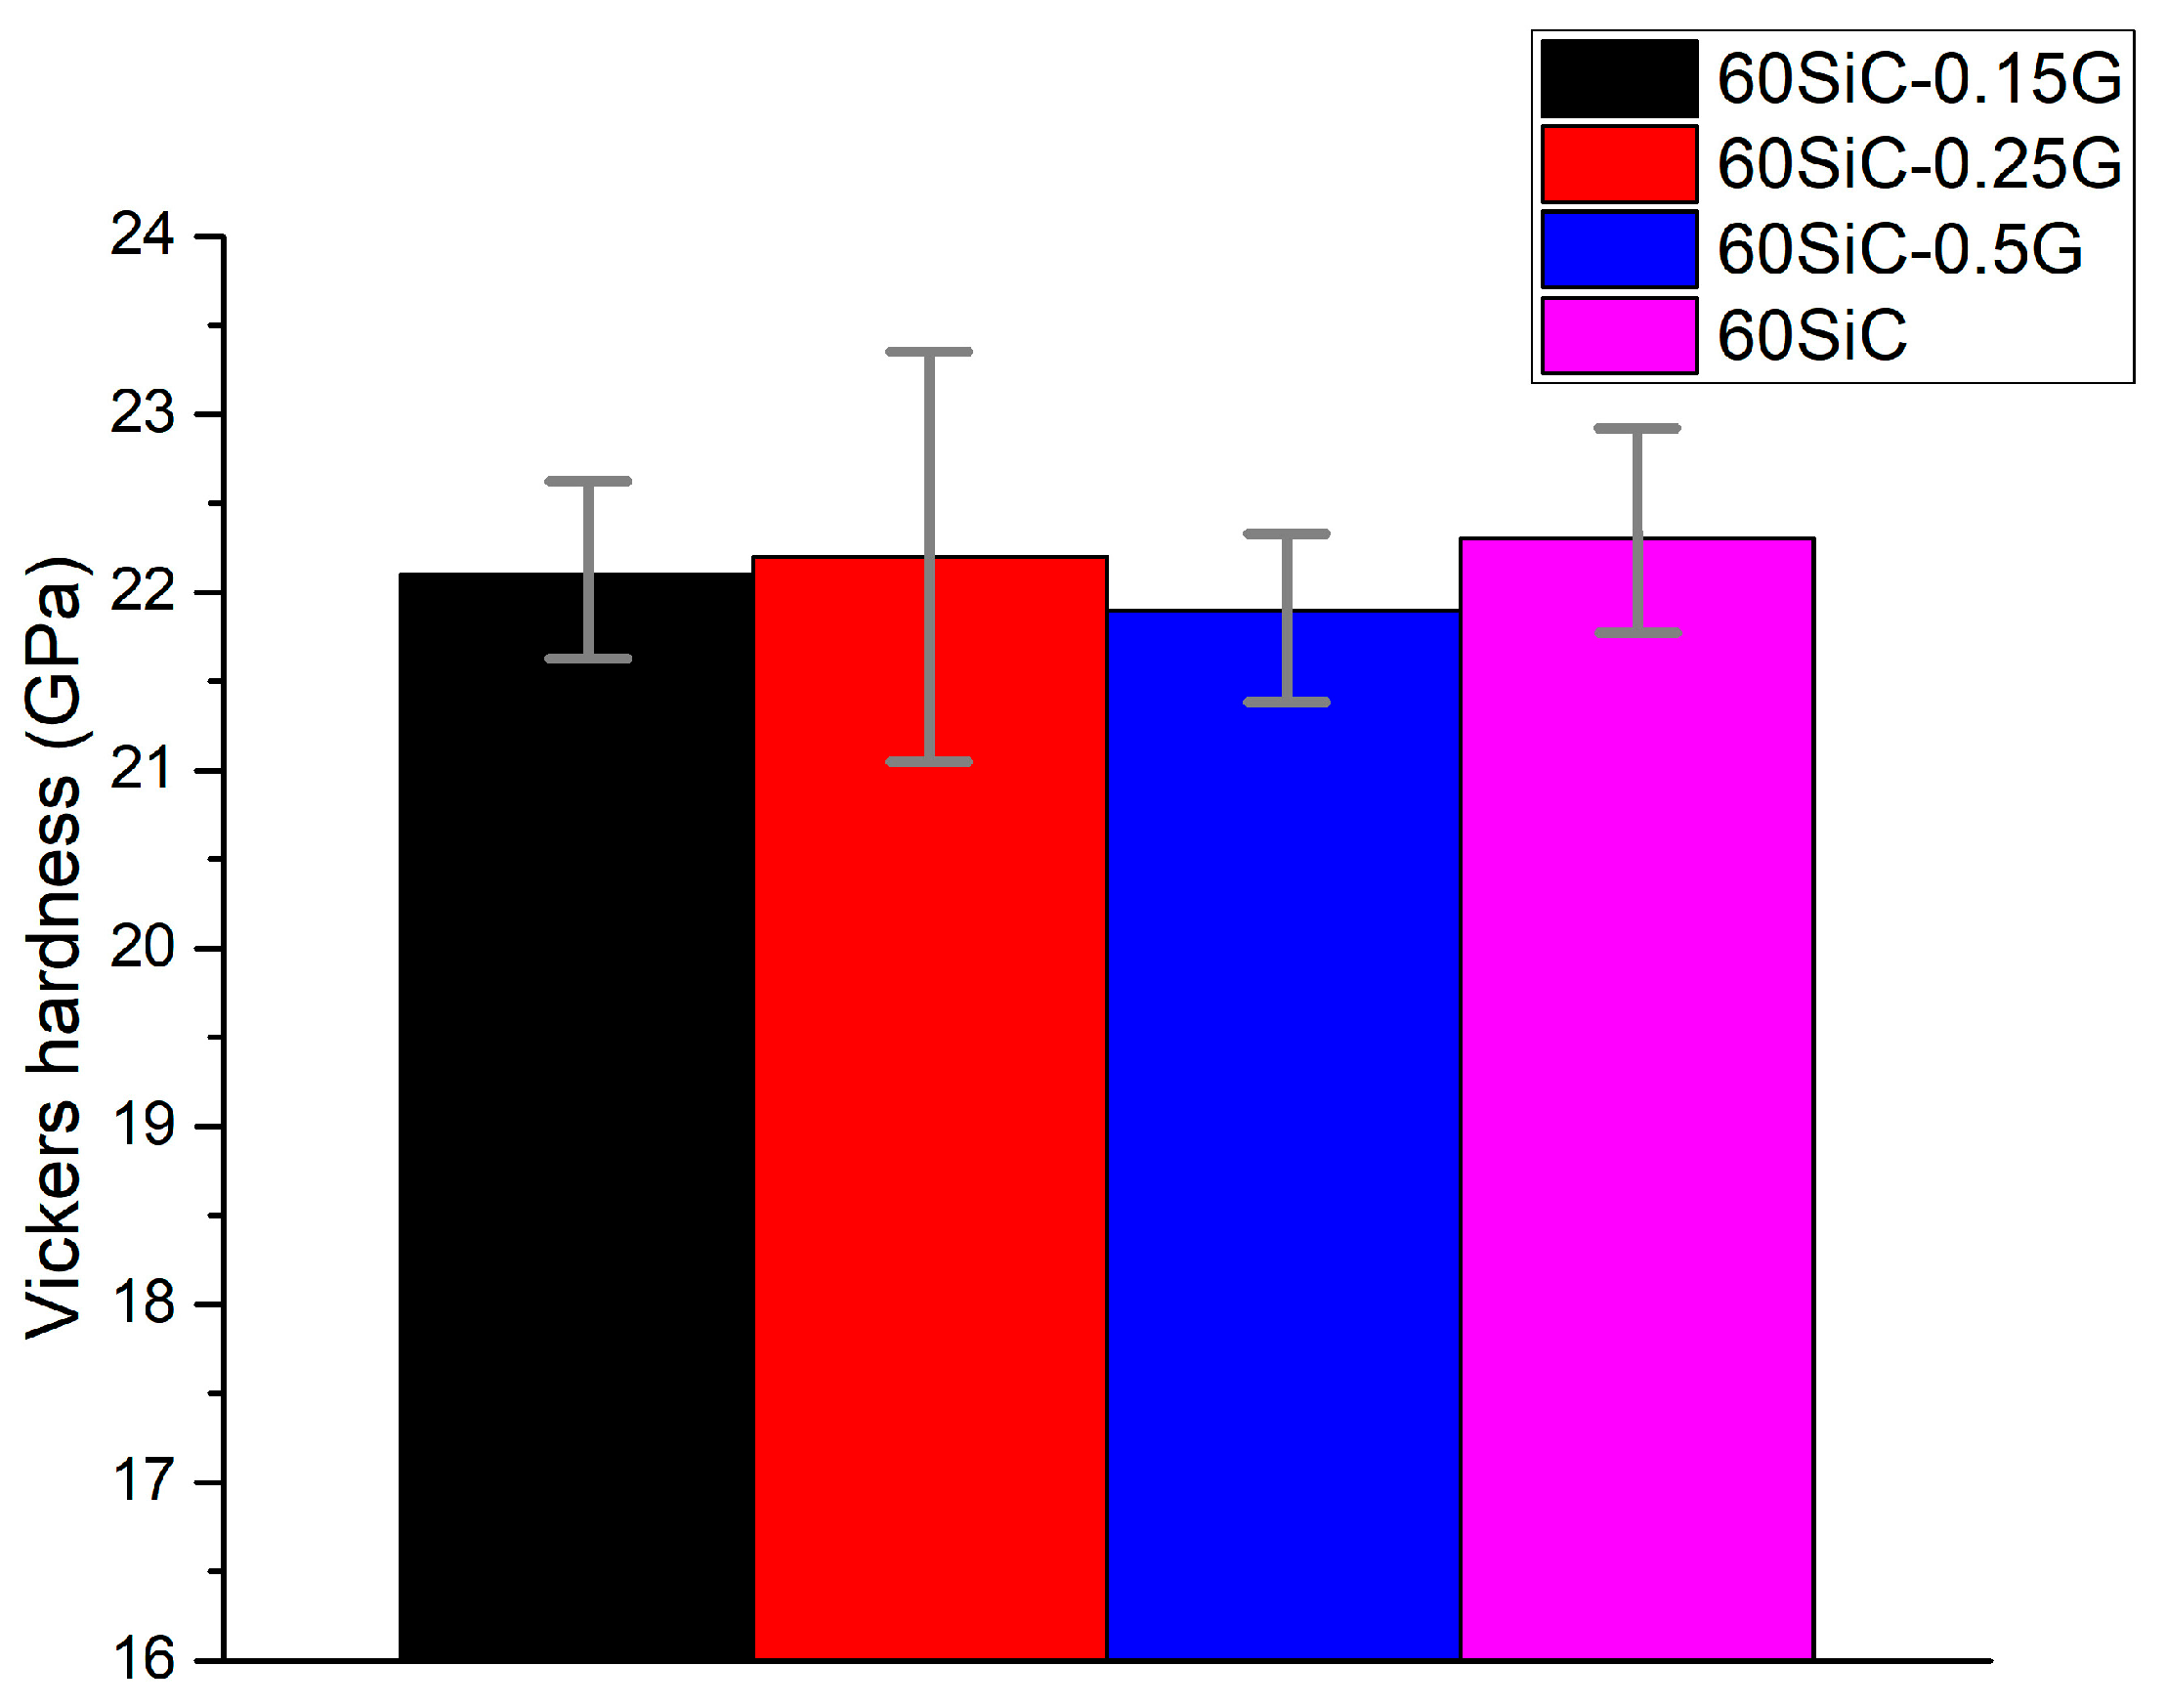
Figure 6 shows the measurement results of the measured Vickers hardness of the obtained composites.
The presence of reduced graphene oxide in 60SiC samples has no positive effect on hardness. This is because graphene is a relatively soft phase (hardness ~0.5–5 GPa for individual layers in the transverse direction) compared to the extremely hard ceramic SiC matrix (~25–30 GPa). The indenter easily pushes through rGO inclusions, so the overall macroscopic hardness of the composite is determined primarily by the hardness of the matrix and almost does not increase from the addition of a softer phase [
32].
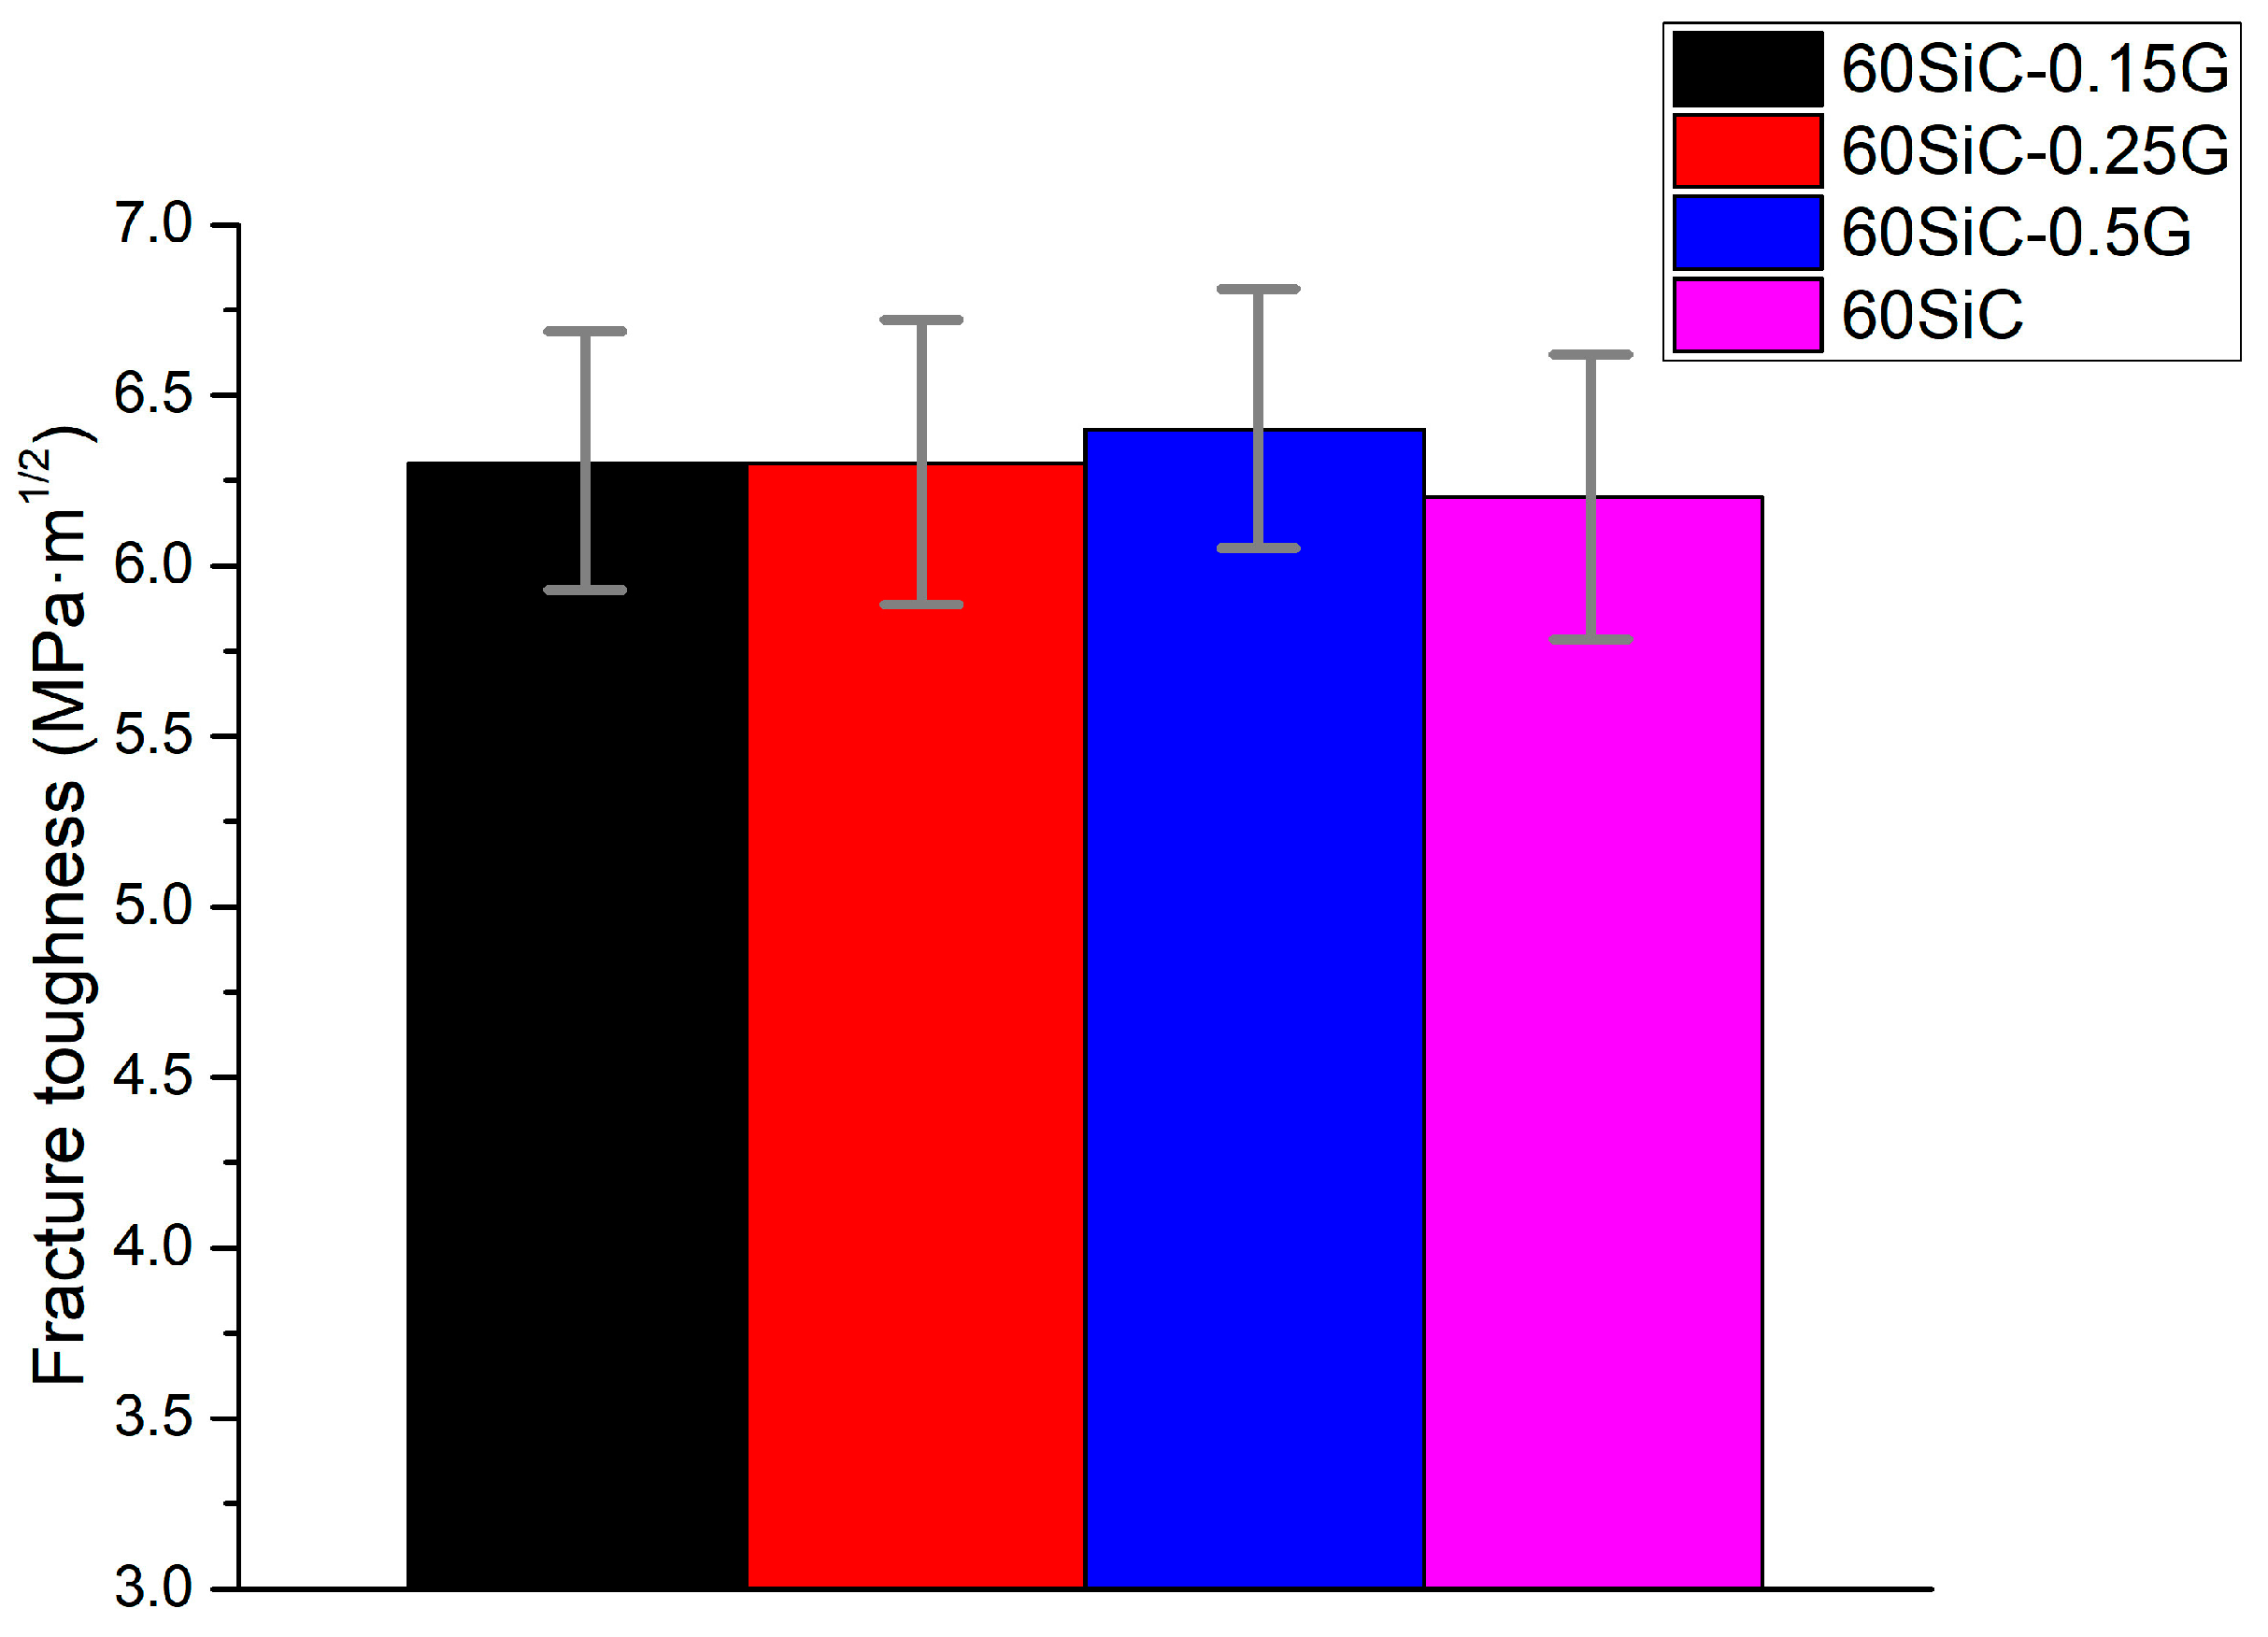
Figure 7 shows the results of measurements of the fracture toughness of the sintered composites. Based on the results obtained, it can be concluded that the presence of rGO in ceramic matrix slightly improved the fracture toughness of composites. The maximum (6.4 ± 0.3 MPa·m
1/2) crack resistance is shown by the sample 60SiC-0.5G, while the fracture toughness value of the 60SiC composite was 6.2 ± 0.4 MPa·m
1/2.
Table 3 shows the results of tribological tests of 60SiC-G samples.
Figure 8 shows the 3D friction tracks at a load of 10 N.
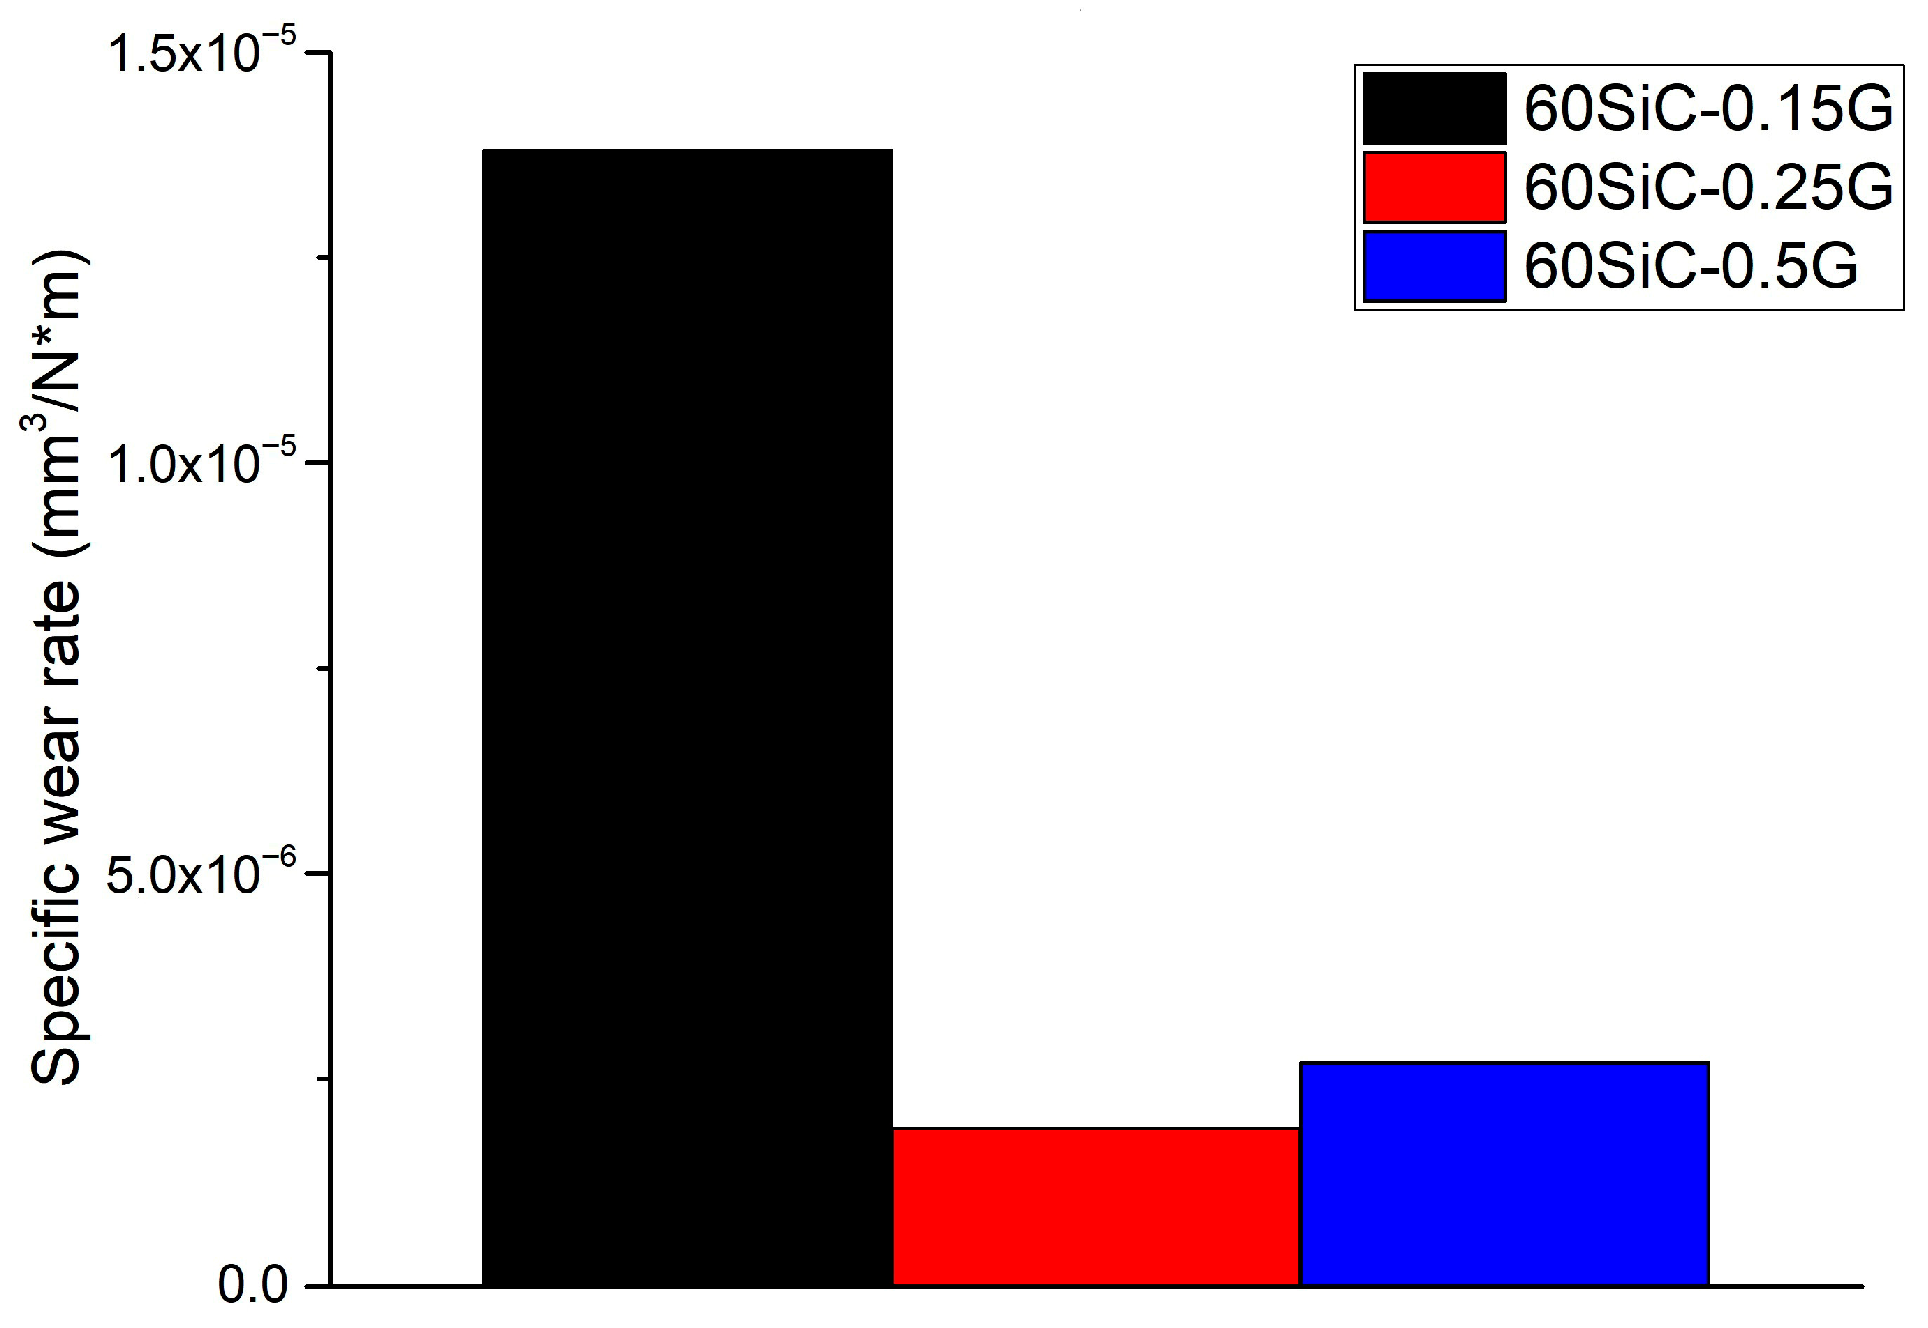
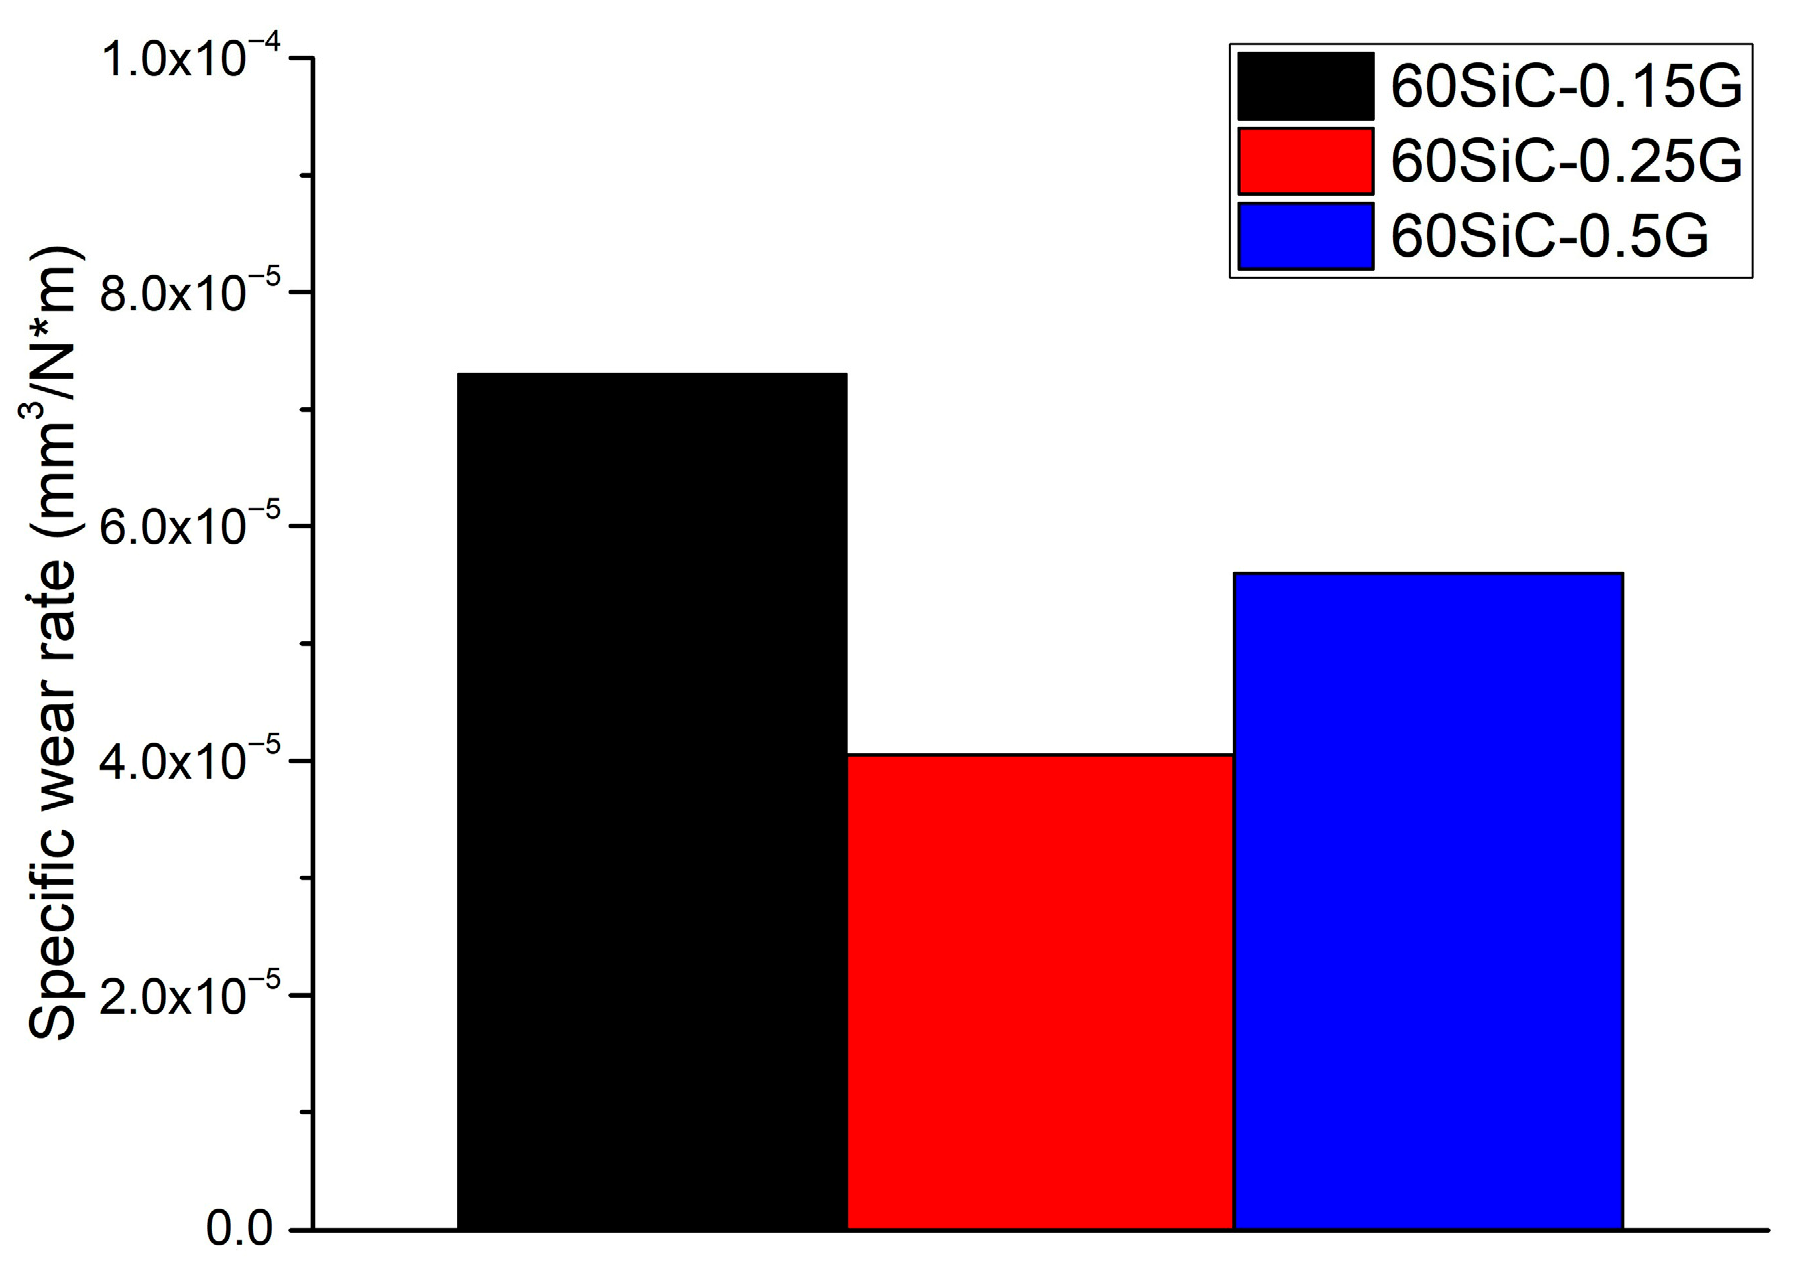
Figure 9 shows diagrams of the specific wear rate of sintered 60SiC-G composites at the load 10 N. From these figures, as well as the data in
Table 3, it can be seen that at a load of 10 N, the lowest wear is observed in the sample 60SiC-0.25G. It is followed by a sample with 0.5 vol.% rGO, and the sample with the lowest content of rGO shows the highest wear. The highest wear in the 60SiC-0.15G sample is associated with a low rGO content and low load, which does not provide the necessary pressure to form a stable, protective tribofilm.
Figure 10 shows the 3D friction tracks at a load of 30 N.
Figure 11 shows diagrams of the specific wear rate of sintered 60SiC-G composites at 30 N. At a load of 30 N, there is a natural increase in the intensity of wear, but the behavior is similar to the wear of samples at 10 N. The low rGO content in the ceramic composite is not sufficient to form a self-lubricating tribofilm. On the other hand, the high rGO content leads to its uneven distribution in the ceramic matrix and leads to an increased wear rate instead of lubrication. Therefore, the wear rate of the 60SiC-0.5G sample is higher than with a graphene content of 0.25 vol.%.
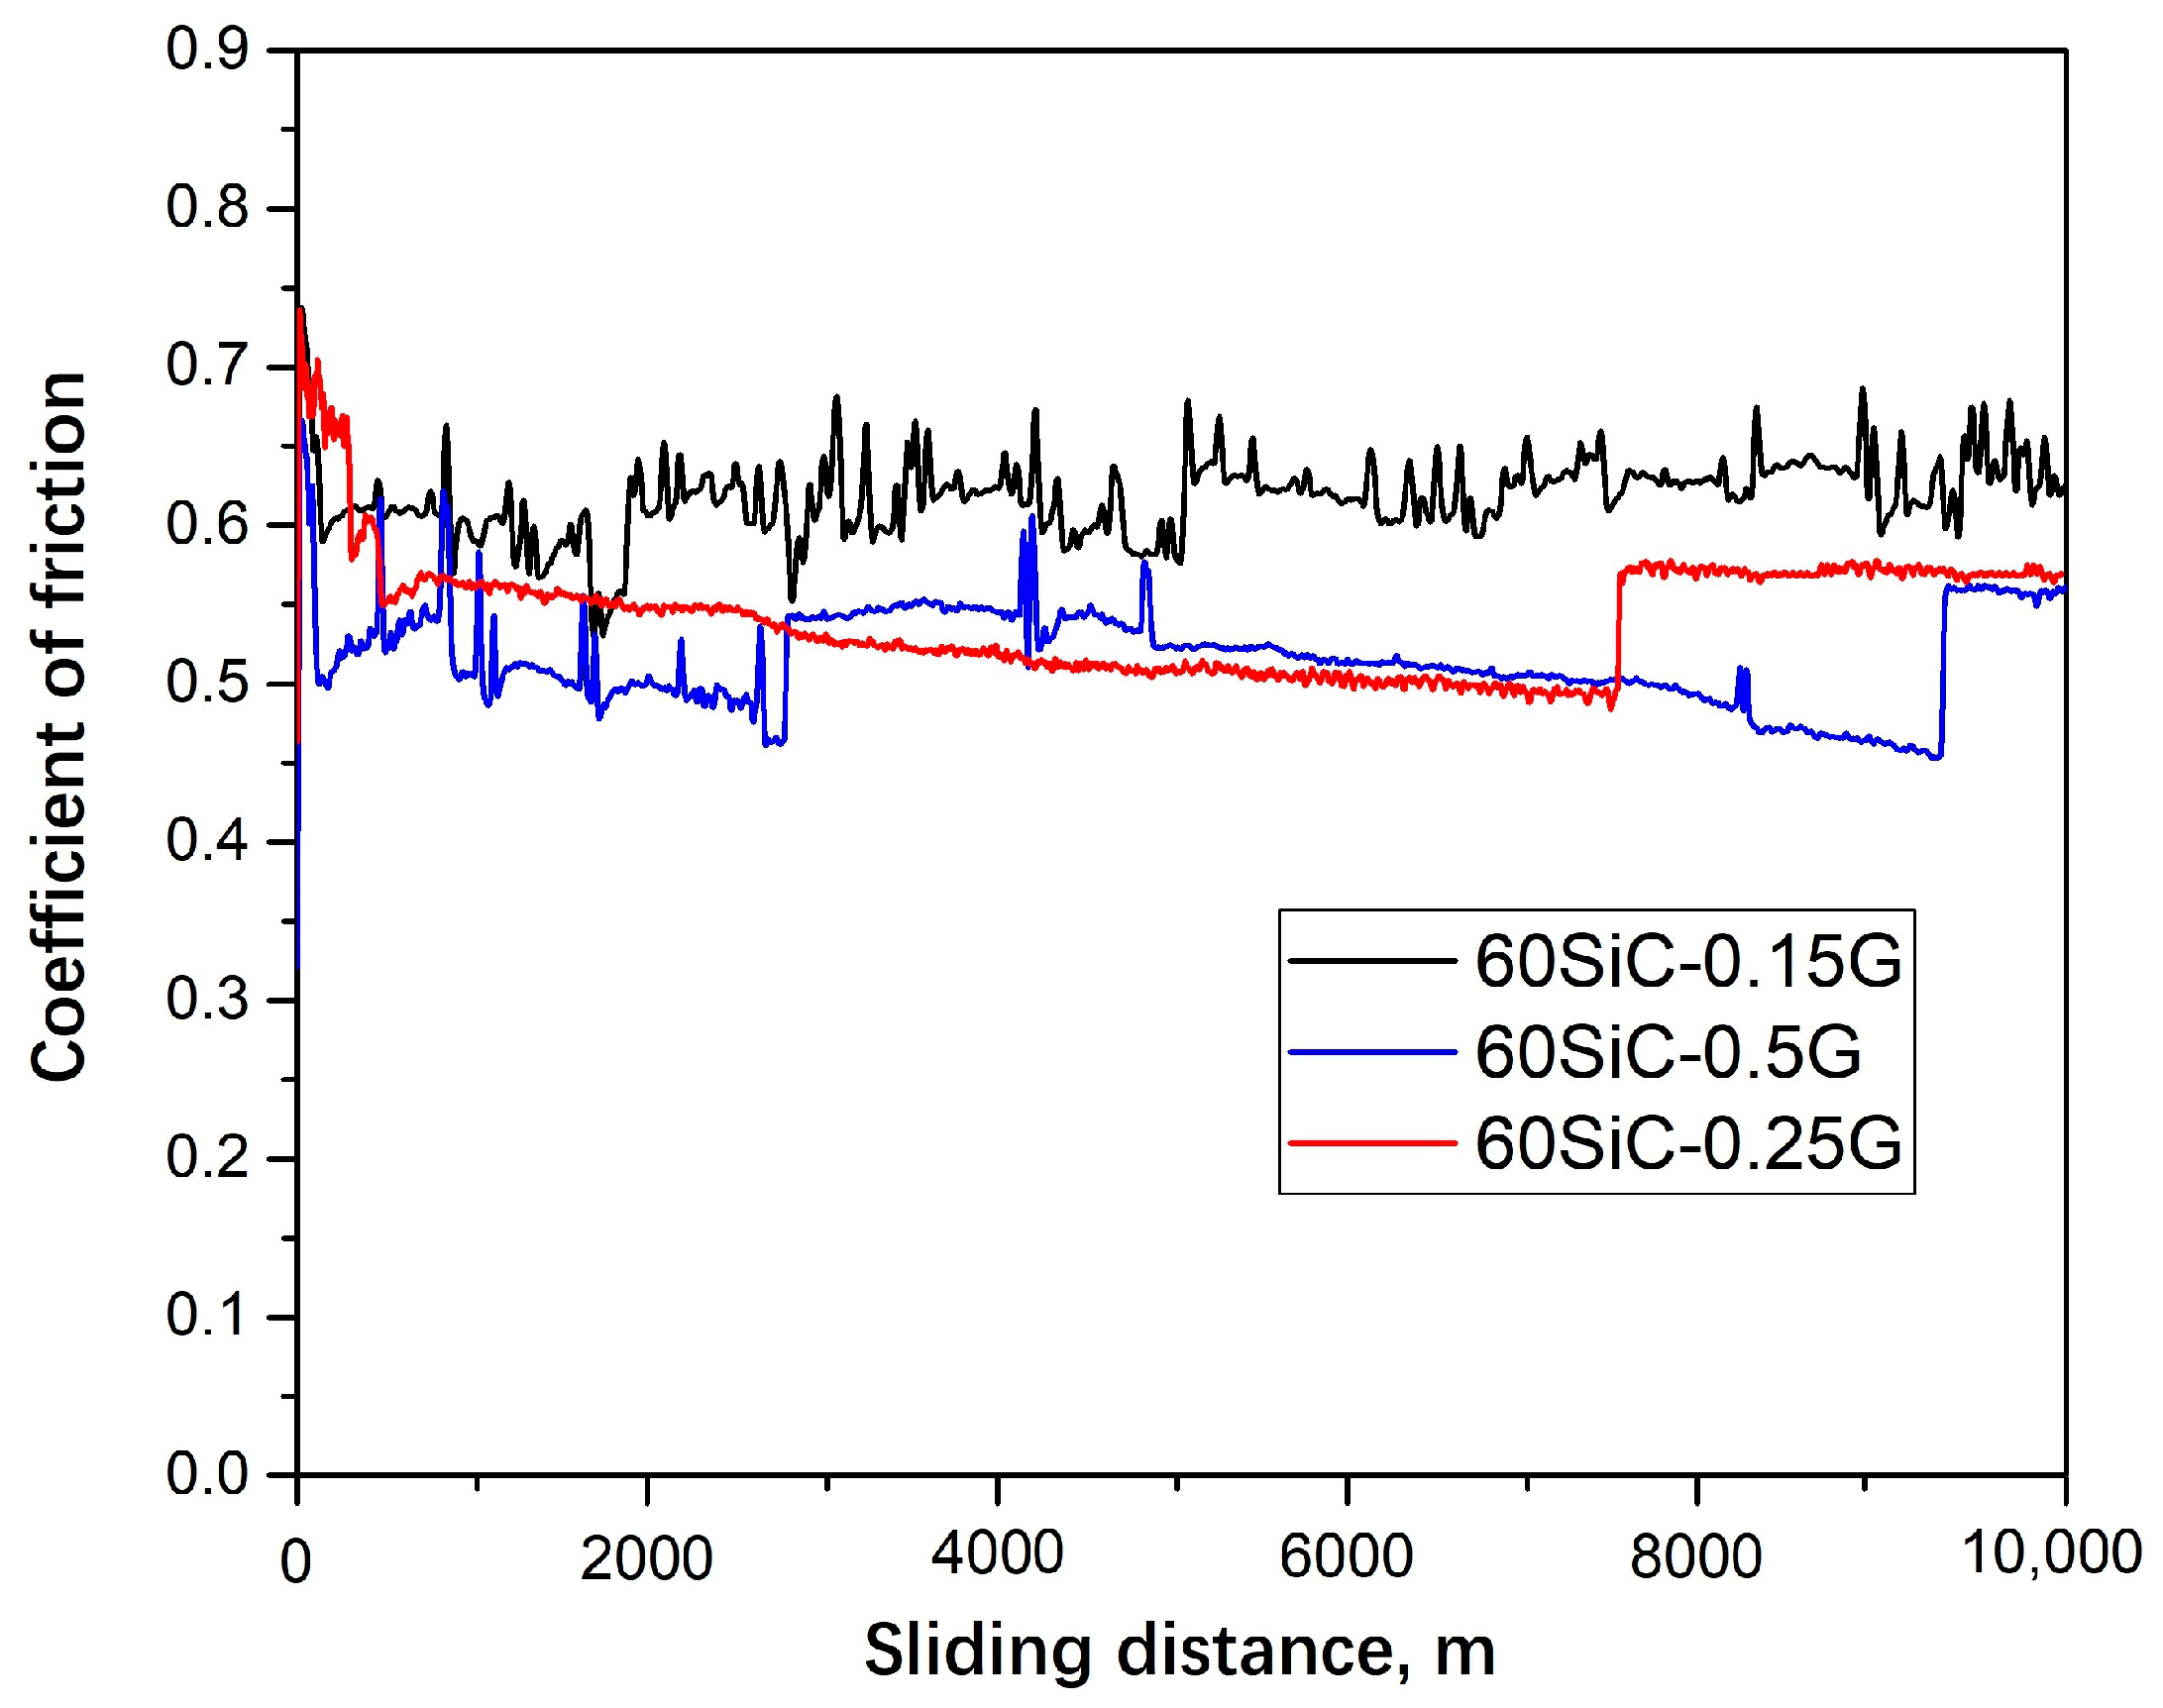
Figure 12 shows the dependence of the coefficient of friction of 60SiC-G compositions on the sliding distance at a load of 10 N. It is noticeable that the 60SiC-0.15G material has the highest coefficient of friction, and its average value ranges around 0.61. In addition, the graph consists of constant jumps in values, which are frequent from the start of the test to about 4500 m of the sliding path. After that, there are short and flat areas on the graph without pulses, which may be associated with changes on the sample surface.
The 60SiC-0.25G composite showed an average coefficient of friction of about 0.53. The behavior of the curve of this material shows that, unlike previous materials, there are no previously observed jumps in the range from 400 to 6500 m. However, when a distance of about 7500 m is reached, there is a sharp jump in the coefficient of friction from 0.5 to 0.58. This value is comparable to the value at the beginning of the observed section (0.56 at 400 m). This behavior repeats the previously observed behavior in 60SiC-0.15G. Based on the results obtained, it can be assumed that when testing 60SiC-0.25G, there are more stable changes on the surface of the material, which make it possible to maintain the decreasing trend of the coefficient of friction without abrupt changes. The 60SiC-0.5G material showed an average value of the friction coefficient equal to 0.51, which is the lowest among the studied materials at 10 N. The following relationship is obtained; the higher the rGO content, the lower the coefficient of friction of the material under study. The curve of the coefficient of friction of 60SiC-0.5G compositions is interesting because it contains more flat areas without jumps. It is also noted that jumps in values are most often found at the beginning of the test up to 2500 m, and then there is a section with almost no jumps. In addition, this section is distinguished by the fact that at its beginning there is a sharp jump in the coefficient of friction to 0.55, which then decreases to 0.45 at a distance of 8200 m (the end of the section). This observation indicates that during the test, changes occur on the surface of this sample that contribute to a decrease in the coefficient of friction along the friction path of about 5700 m. It should be noted that when the distance of 8200 m is reached, there is again a sharp jump in the coefficient of friction to 0.56, which is a comparable value at the beginning of the observed section at 2500 m.
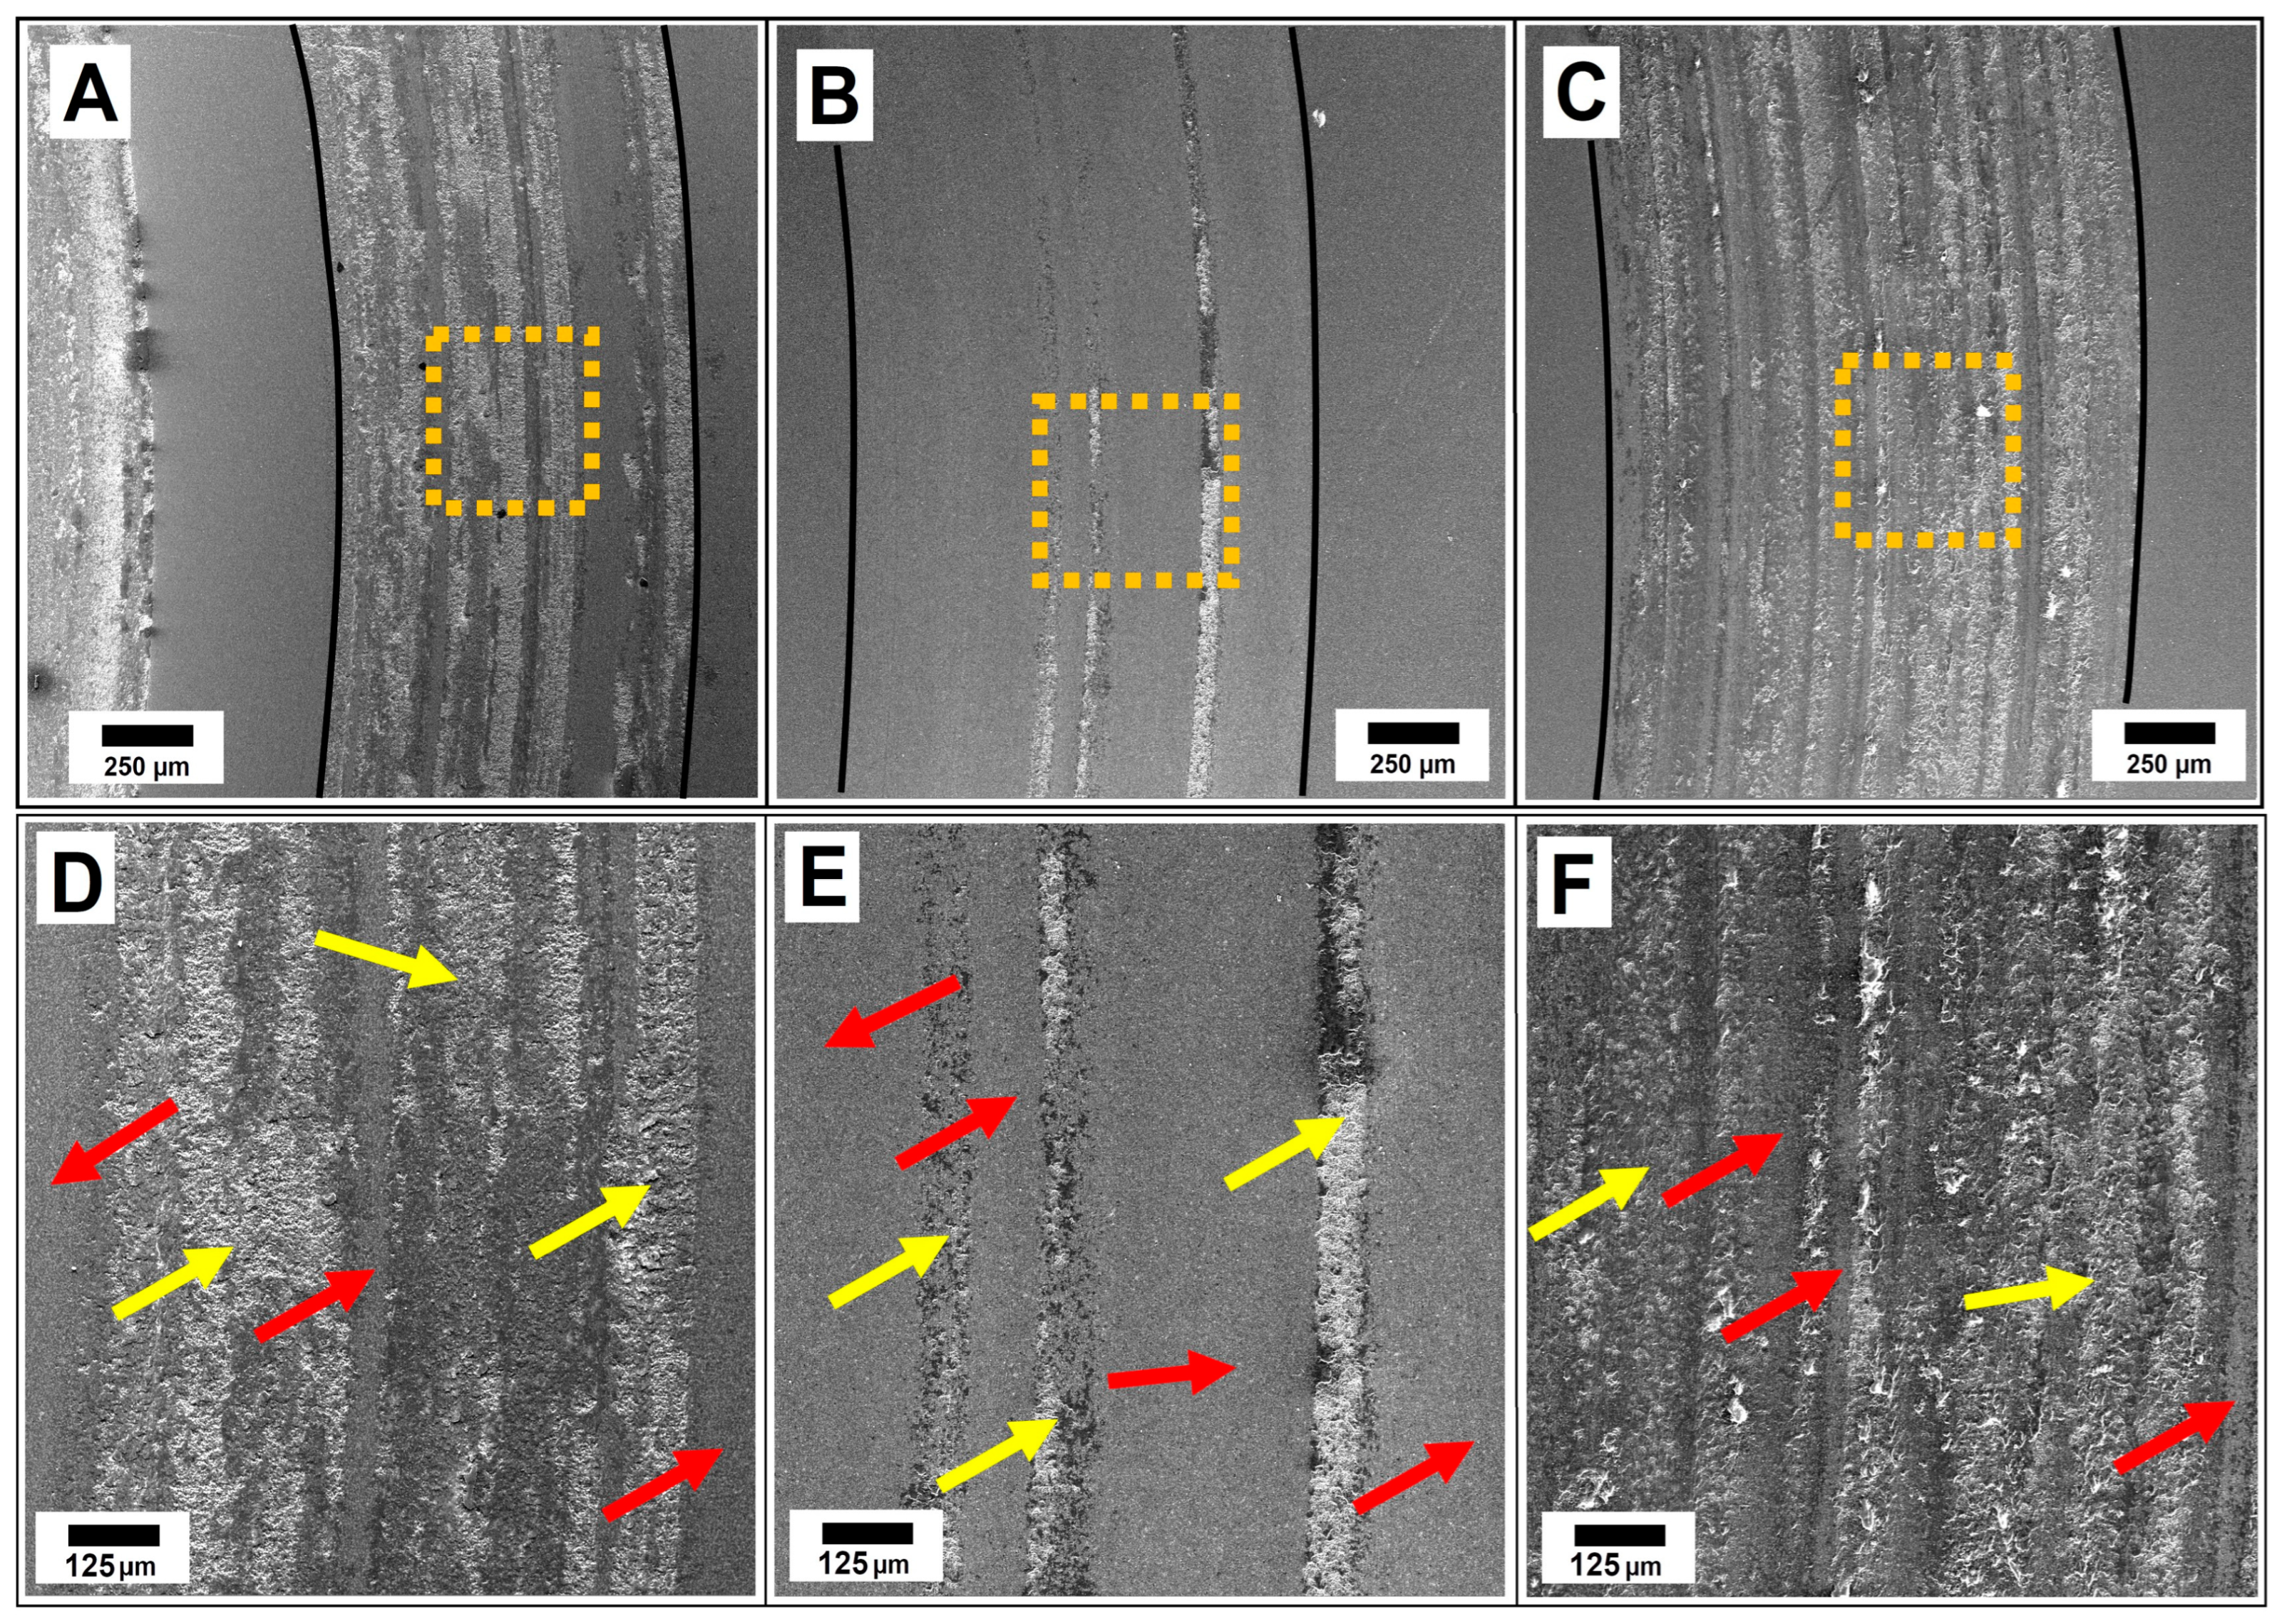
Figure 13A–C show the friction tracks of the 60SiC-G samples at 10 N load. The black lines highlight the friction tracks.
Figure 13D–F show an enlarged area (orange squares) of the friction track. It can be seen that 60SiC-0.15G have adhesive wear marks occupying approximately 70% of the friction track area, and abrasive wear occupies the remaining space. A more approximate image of this track clearly shows the places where traces of adhesive wear occur to a greater extent. The 60SiC-0.25G has mainly abrasive wear, which occupies more than 90% of the track area. In a more approximate image of this track, it is noticeable that the rest of the area (less than 10%) has traces of adhesive wear, which are represented as seams of material on the surface of the track. In addition, it is noted that in areas of adhesive wear, the tracks are covered with a new material that has a polished surface. In 60SiC-0.5G, it is noticeable that abrasive and adhesive wear took place, and besides them, there is a material in the form of flakes on the surface that cover part of the surface of the material.
Based on the above observations, it can be said that a tribological secondary structure is formed in the contact zone of the sample and the counterbody, which has a clear dependence on the content of reduced graphene oxide. The lower the rGO content in the matrix of the material, the less secondary structure is formed in the hearth of adhesive wear on the surface of the tracks. At the same time, it can be assumed that the detected jumps on the graph of the coefficient of friction (
Figure 12) reflect the moments of destruction of the formed secondary structure.
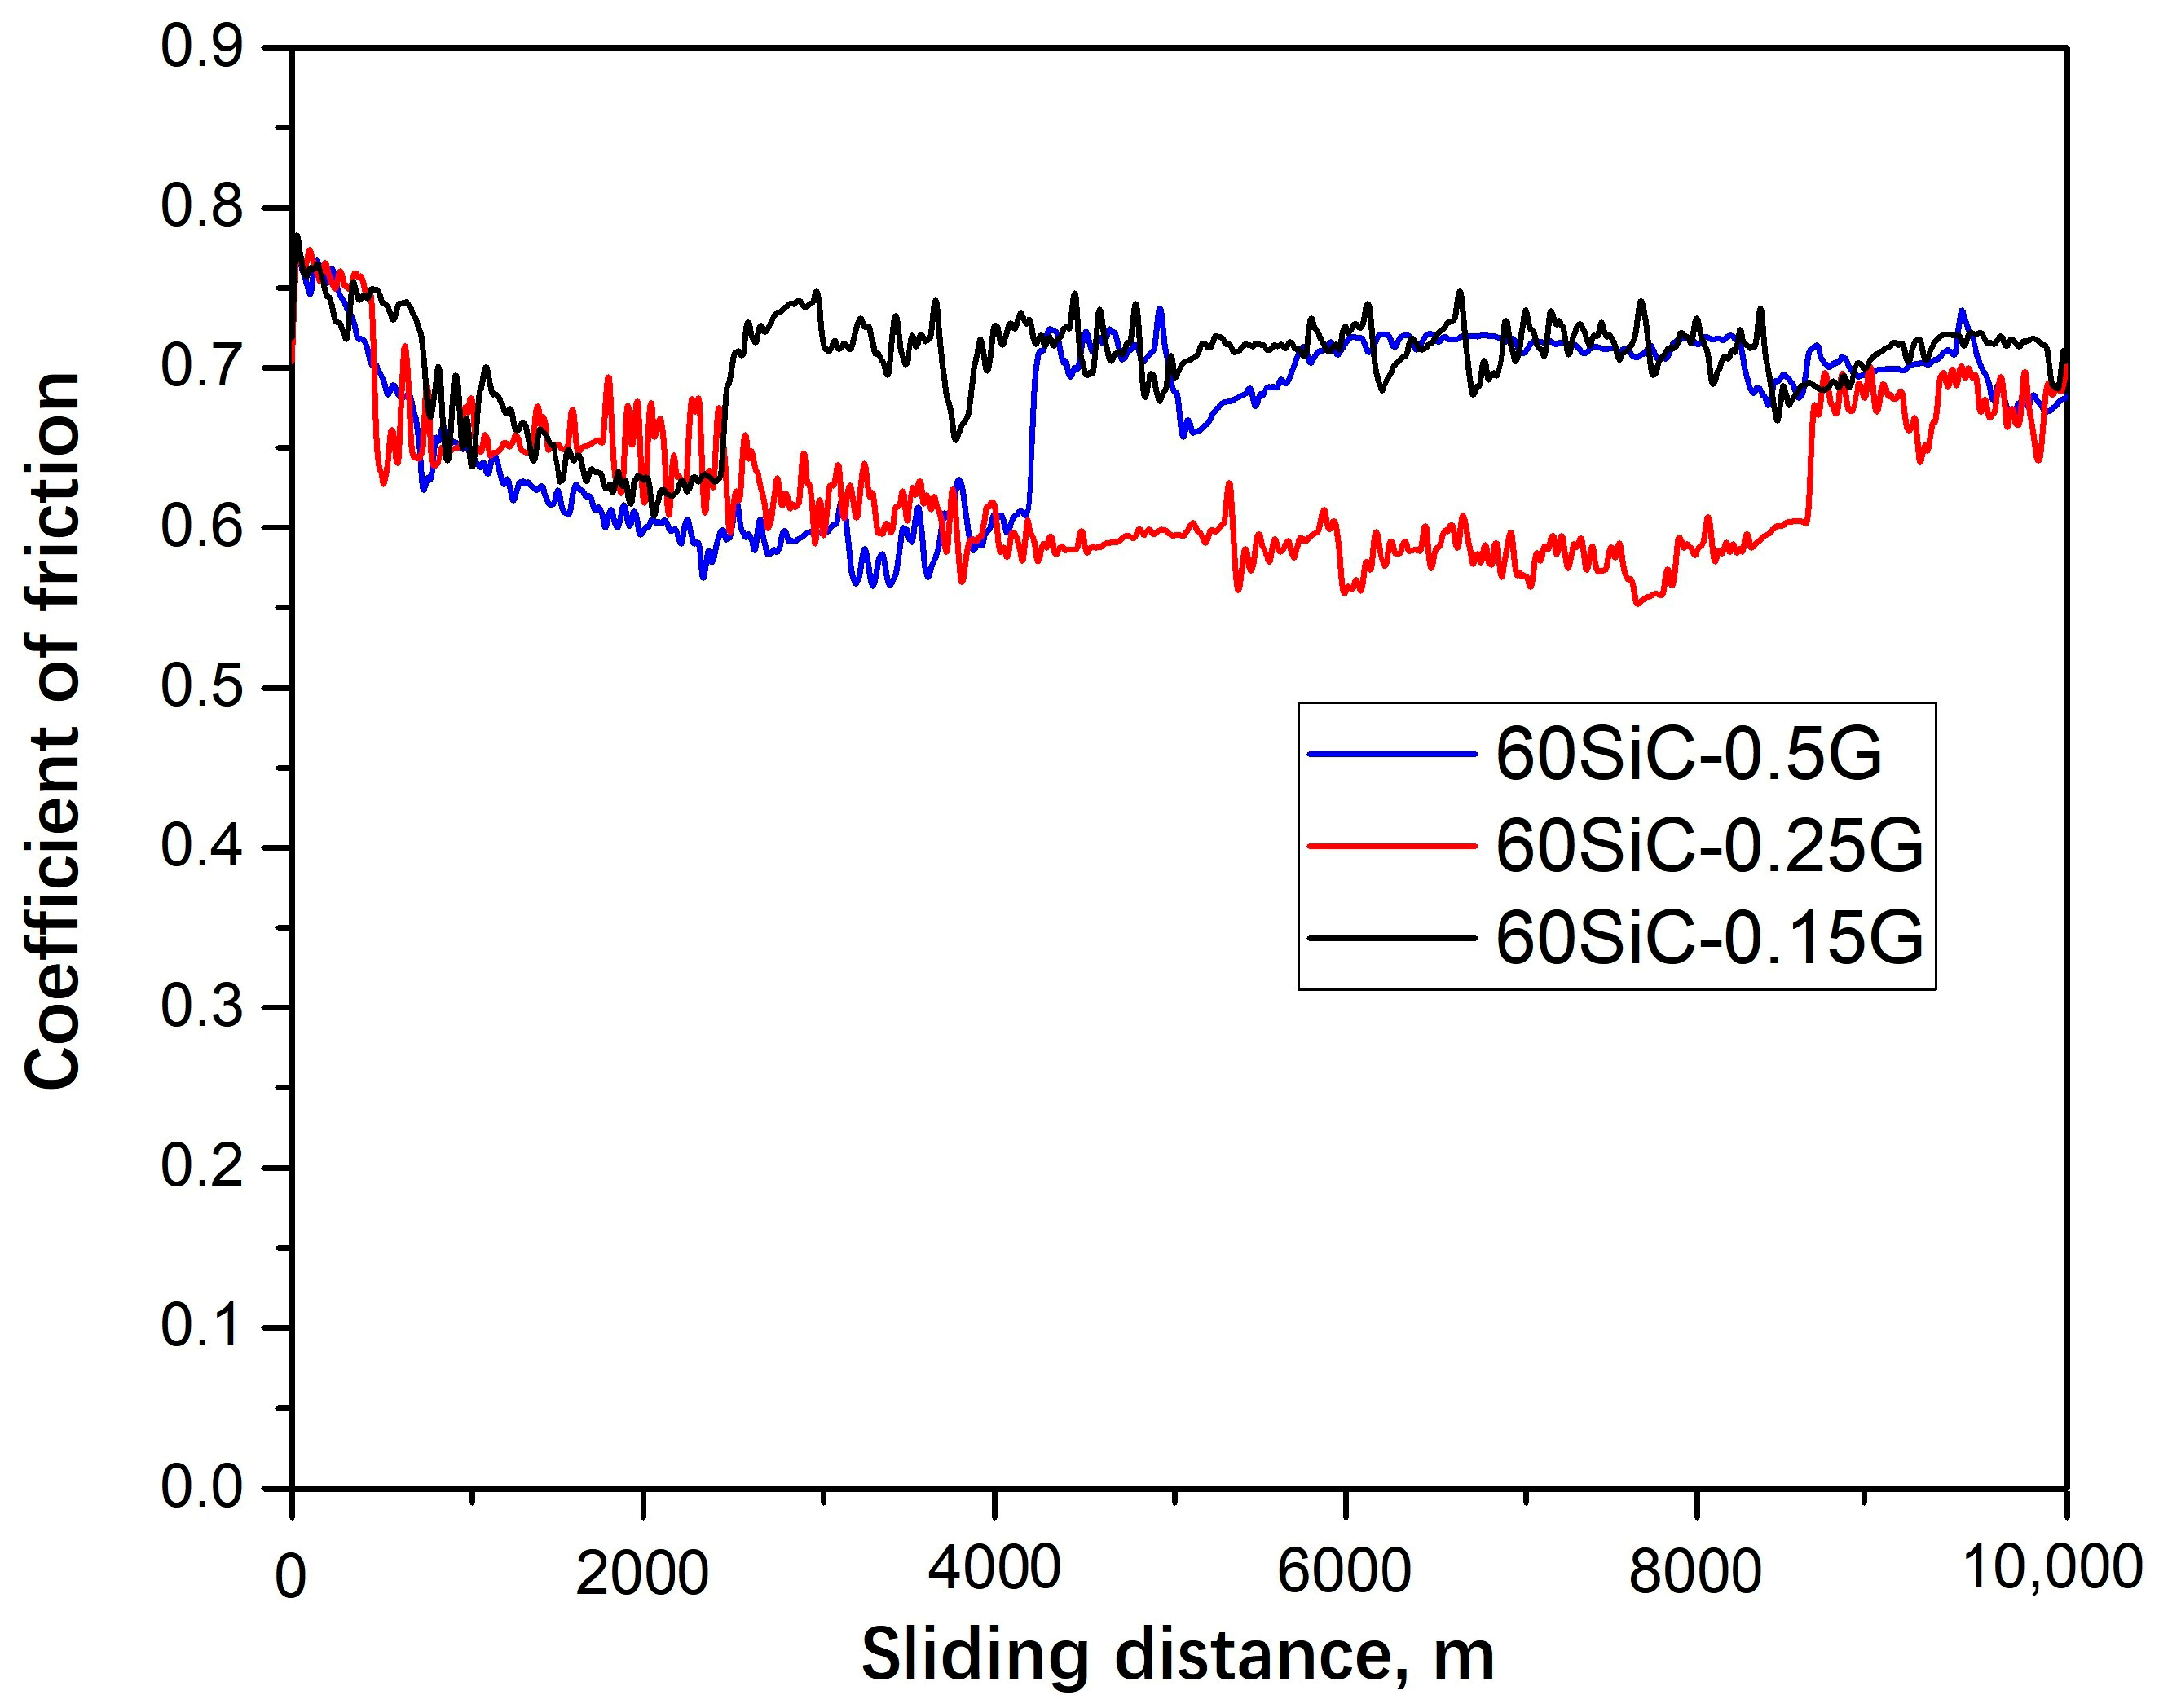
Figure 14 shows the dependence of the coefficient of friction of 60SiC-G compositions on the sliding distance at a load of 30 N.
From
Figure 14, it is noticeable that the 60SiC-0.15G material has a decrease in the coefficient of friction from 0.75 to 0.64 up to a distance of 2100 m. Then there is a sharp rise to 0.7, which then stabilizes to an average of 0.74 by the end of the test (10 km). It should be noted that in the range from 2100 to 10,000 m, frequent fluctuations in the curve are observed, but on average the value remains at the level of 0.74. As with the 10 N test, jumps in the coefficient of friction may be associated with the destruction of the resulting secondary structure. The 60SiC-0.5G material has a decrease in the coefficient of friction from 0.75 to 0.60 to a distance of 3500 m, i.e., this material withstands the minimum value of the coefficient of friction by 67% longer compared to 60SiC-0.15G. Then there is a sharp rise to a value of 0.73, which coincides with a value of 60SiC-0.15G after a sharp rise, and its average value is maintained until the end of the test. The 60SiC-0.25G material can withstand the minimum value of the coefficient of friction for the longest time—up to 7300 m of the friction path. This is 248% longer than 60SiC-0.15G, and 109% longer than 60SiC-0.5G. At the same time, the coefficient of friction gradually decreased from 0.75 to 0.6 after 7300 m. Then, as with the other two materials, there is a sharp jump to the level of 0.7, the value of which remains until the end of the test.
Based on these observations, it can be assumed that each of these materials undergoes adaptation during tribological testing. In this context, adaptation refers to the formation of a secondary structure, which reduces the coefficient of friction by about 19%. This observation was also noted in the work [
33].
However, each of the studied materials has its own period of durability of the formed secondary structure. The most resistant material, as shown earlier, is 60SiC-0.25G. This is followed by 60SiC-0.5G, and with minimal resistance—60SiC-0.15G.
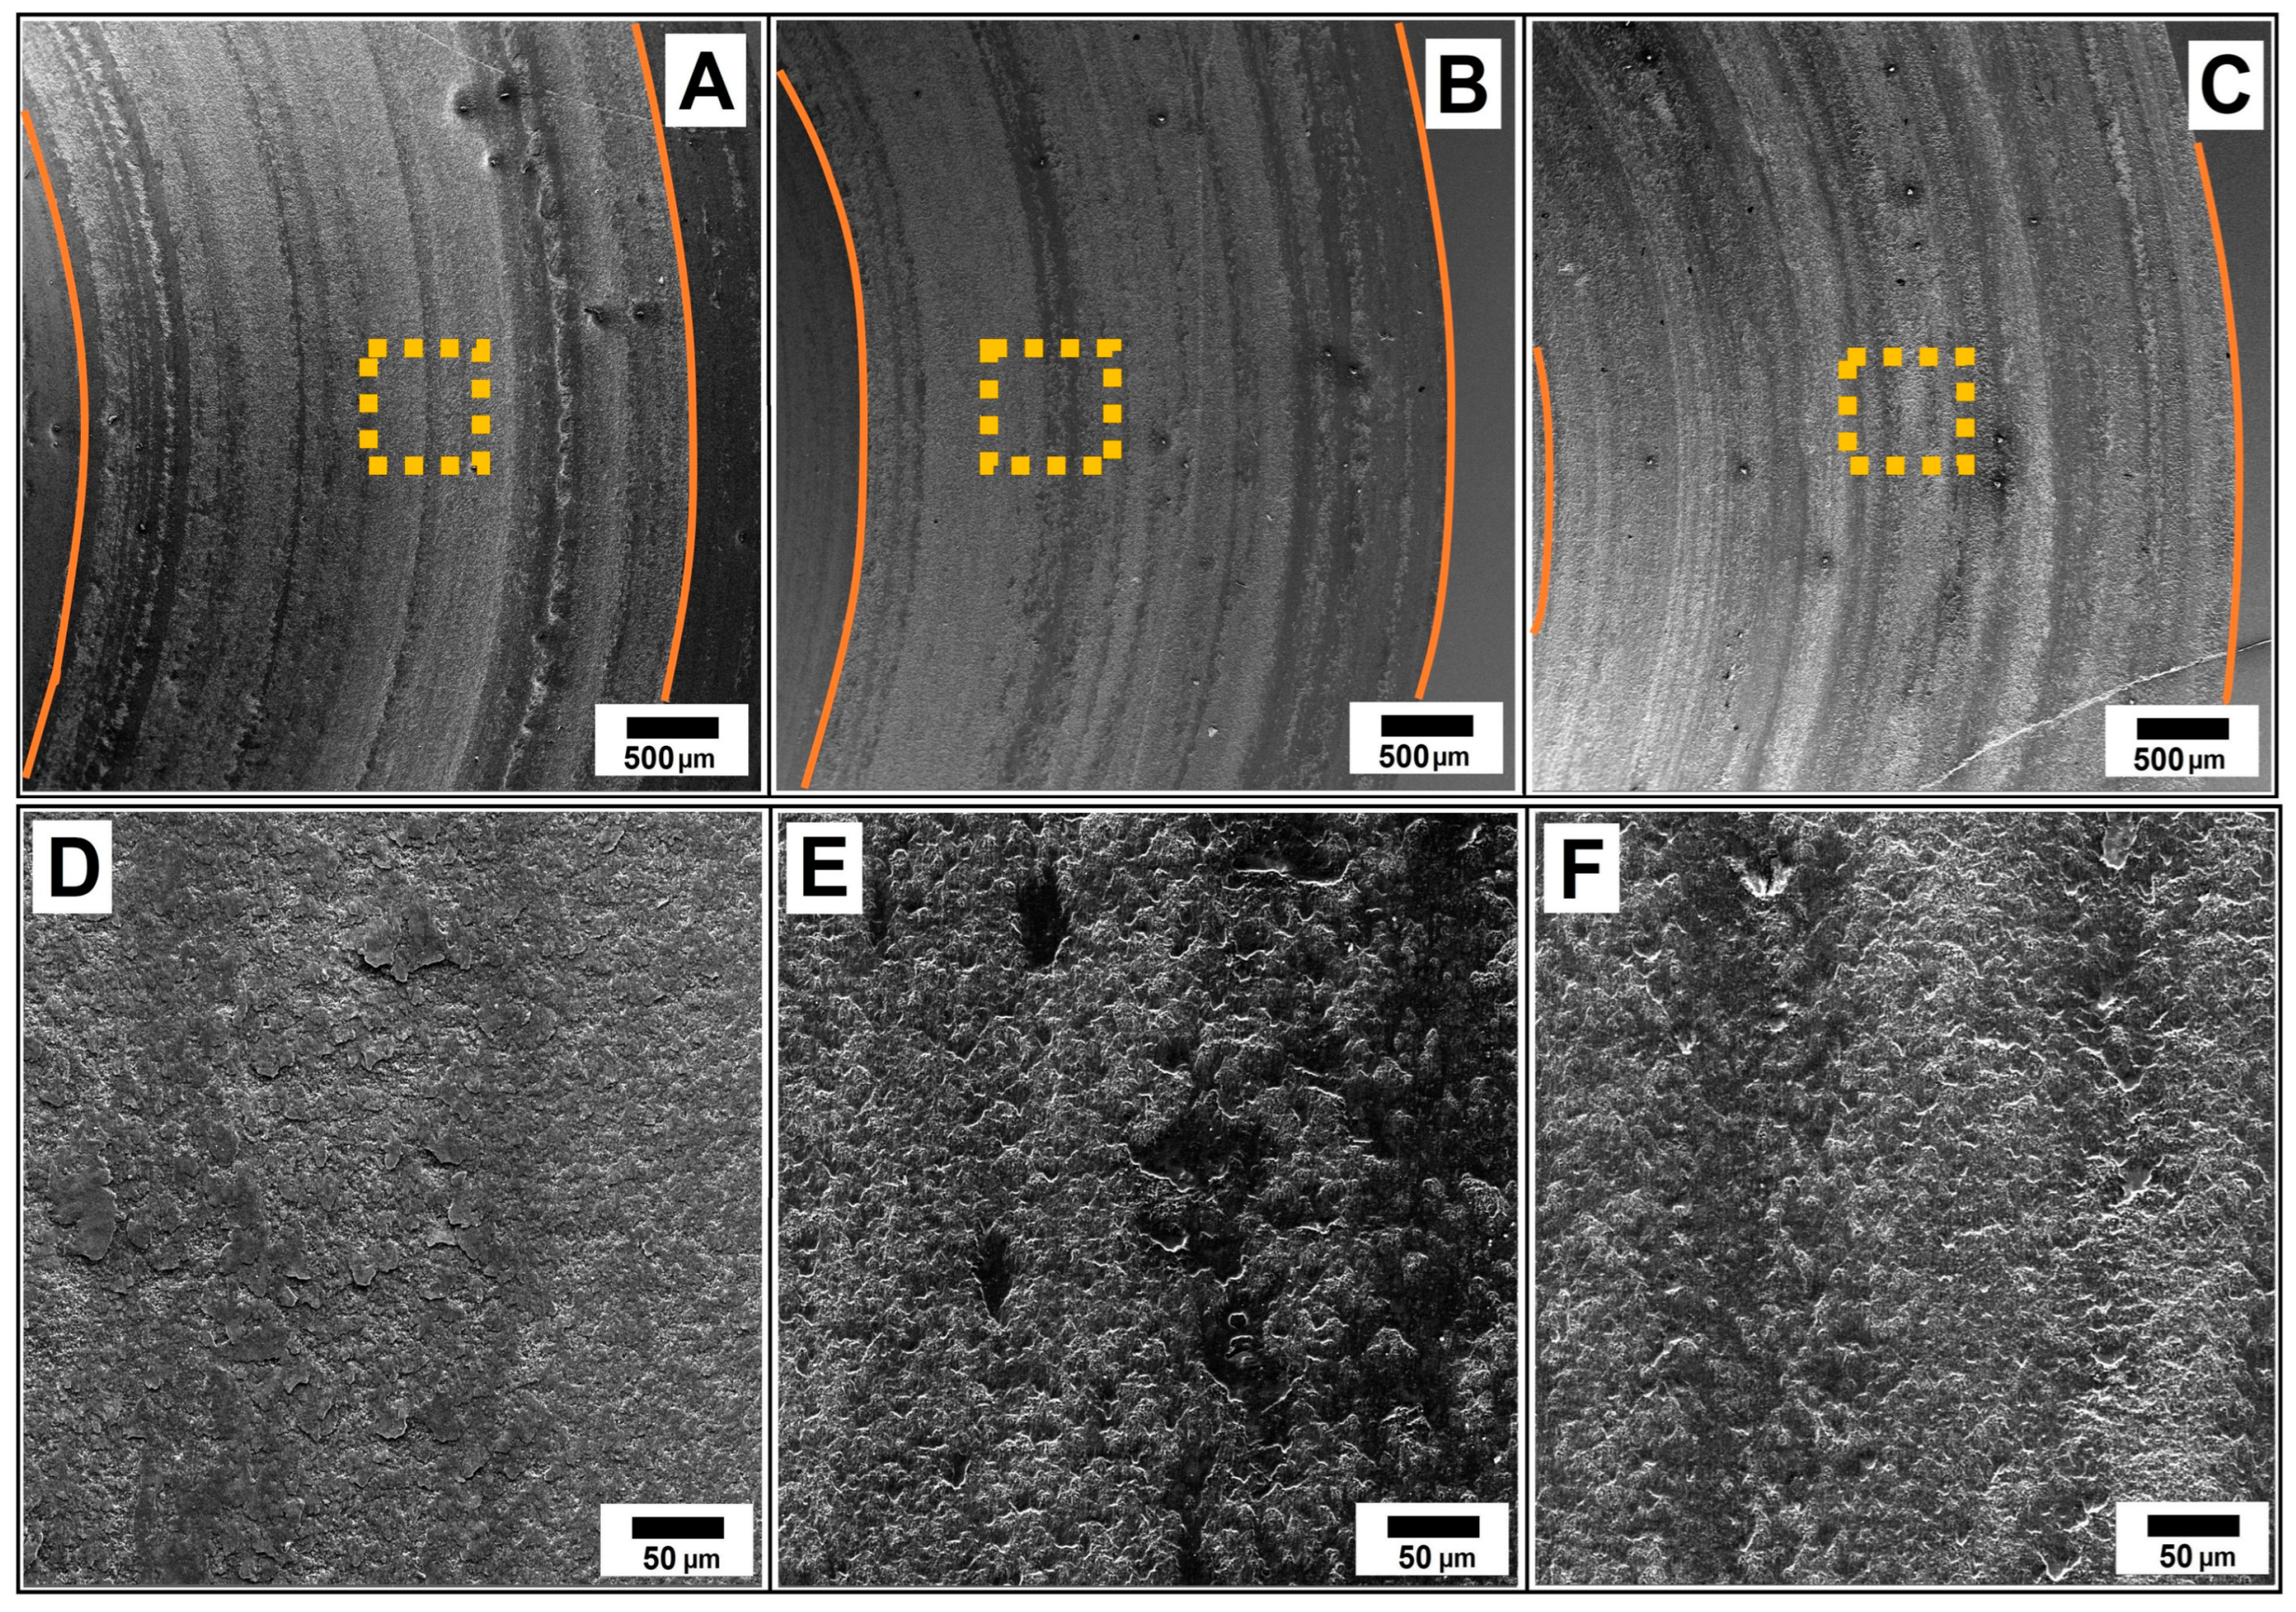
Figure 15A–C shows the friction tracks (orange lines) of the 60SiC-G samples at 30 N load.
Figure 15D–F shows an enlarged central area (orange squares) of the friction track.
The structure of the worn surface resembles the previously considered structures at a load of 10 N, where a material in the form of flakes was found. The appearance of this secondary structure on the sample surface is associated with the application of a higher load—30 N, which creates the necessary conditions for the formation of this layer. Apparently, for 60SiC-0.15G, the load of 10 N is insufficient to form a solid secondary structure. Despite the presence of this secondary structure, this material showed the highest wear rate, and this may be due to the fact that 60SiC-0.15G has a relatively low flexural strength (555.8 MPa) compared to the other two materials (578.4 and 582.8 MPa). It also has a high Vickers hardness (22.1 GPa) and, accordingly, a higher probability of destruction of the ceramic matrix. “Flakes” of the secondary structure form on the friction track of the 60SiC-0.25G sample at 30 N. The 60SiC-0.25G material has the lowest wear rate of the studied materials, and this may be due, in addition to the formation of a secondary structure, to the fact that it has a high flexural strength (582.8 MPa) compared to the other two materials (578.4 and 555.8 MPa). “Flakes” of a secondary structure are formed on the friction track of the 60SiC-0.5G sample at 30 N, which are similar to the secondary structure of the 60SiC-0.25C sample. The 60SiC-0.5G material has an average wear rate from the studied materials, and this is due, in addition to the formation of a secondary structure, to the fact that it has an average flexural strength (578.4 MPa) among the studied materials (582.8 and 555.8 MPa).
Summarizing the consideration of the microstructures of friction tracks, the following conclusion can be drawn. Under pressure at the beginning of the friction process, a tribolayer based on reduced graphene oxide is formed in the contact zone of the surfaces and persists until the destruction of the ceramic matrix itself begins under the influence of mechanical pressure. Further, after the destruction of the initial tribolayer, the newly formed secondary structure cannot adhere to the matrix and peels off from time to time, increasing the wear rate.
