

Effect of Quantum Dot-Based Remote Lenses on the Emission Properties of White LED Lighting Studied by Optical Simulation and Experiment

 , , ,
, , ,
Abstract
1. Introduction
2. Experiment and Simulation
3. Results and Discussion
4. Conclusions
Supplementary Materials
Author Contributions
Funding
Institutional Review Board Statement
Informed Consent Statement
Data Availability Statement
Conflicts of Interest
References
- Bae, W.K.; Lim, J.; Lee, D.; Park, M.; Lee, H.; Kwak, J.; Char, K.; Lee, C.; Lee, S. R/G/B/natural white light thin colloidal quantum dot-based light-emitting devices. Adv. Mater. 2014, 26, 6387. [Google Scholar] [CrossRef] [PubMed]
- Lim, S.J.; Zahid, M.U.; Le, P.; Ma, L.; Entenberg, D.; Harney, A.S.; Condeelis, J.; Smith, A.M. Brightness-equalized quantum dots. Nat. Commun. 2015, 6, 8210. [Google Scholar] [CrossRef] [PubMed]
- Lim, J.; Park, Y.S.; Wu, K.; Yun, H.J.; Klimov, V.I. Droop-free colloidal quantum dot light-emitting diodes. Nano Lett. 2018, 18, 6645. [Google Scholar] [CrossRef]
- Erdem, T.; Demir, H.V. Color science of nanocrystal quantum dots for lighting and displays. Nanophotonics 2013, 2, 57. [Google Scholar] [CrossRef]
- Denault, K.A.; Mikhailovsky, A.A.; Brinkley, S.; DenBaars, S.P.; Seshadri, R. Improving color rendition in solid state white lighting through the use of quantum dots. J. Mater. Chem. C 2013, 1, 1461. [Google Scholar] [CrossRef]
- Chung, S.-R.; Chen, S.-S.; Wang, K.-W.; Siao, C.-B. Promotion of solid-state lighting for ZnCdSe quantum dot modified-YAG-based white light-emitting diodes. RSC Adv. 2016, 6, 51989. [Google Scholar] [CrossRef]
- Bera, D.; Qian, L.; Tseng, T.-K.; Holloway, P.H. Quantum dots and their multimodal applications: A review. Materials 2010, 3, 2260. [Google Scholar] [CrossRef]
- Demir, H.V.; Nizamoglu, S.; Erdem, T.; Mutlugunand, E.; Gaponik, N.; Eychmüller, A. Quantum dot integrated LEDs using photonic and excitonic color conversion. Nano Today 2011, 6, 632. [Google Scholar] [CrossRef]
- Anc, M.J.; Pickett, N.L.; Gresty, N.C.; Harris, J.A.; Mishra, K.C. Progress in non-Cd quantum dot development for lighting applications. ECS J. Solid State Sci. Technol. 2012, 2, R3071. [Google Scholar] [CrossRef]
- Luo, Z.; Chen, Y.; Wu, S.-T. Wide color gamut LCD with a quantum dot backlight. Opt. Express 2013, 21, 26269. [Google Scholar] [CrossRef]
- Jang, E.; Jun, S.; Jang, H.; Lim, J.; Kim, B.; Kim, Y. White-light-emitting diodes with quantum dot color converters for display backlights. Adv. Mater. 2010, 22, 3076. [Google Scholar] [CrossRef] [PubMed]
- Abe, S.; Joos, J.J.; Martin, L.I.D.J.; Hens, Z.; Smet, P.F. Hybrid remote quantum dot/powder phosphor designs for display backlights. Light Sci. Appl. 2017, 6, e16271. [Google Scholar] [CrossRef]
- Kim, S.J.; Jang, H.W.; Lee, J.-G.; Ko, J.-H.; Ko, Y.W.; Kim, Y. Study on improvements in the emission properties of quantum-dot film-based backlights. New Phys. Sae Mulli. 2019, 69, 861. [Google Scholar] [CrossRef]
- Schubert, E.F.; Kim, J.K.; Luo, H.; Xi, J.-Q. Solid-state lighting—A benevolent technology. Rep. Prog. Phys. 2006, 69, 3069. [Google Scholar] [CrossRef]
- McKittrick, J.; Shea-Rohwer, L.E. Down conversion materials for solid-state lighting. J. Am. Ceram. Soc. 2014, 97, 1327. [Google Scholar] [CrossRef]
- Lien, J.-Y.; Chen, C.-J.; Chiang, R.-K.; Wang, S.-L. High color-rendering warm-white lamps using quantum-dot color conversion films. Opt. Express 2016, 24, A1021. [Google Scholar] [CrossRef]
- Kim, J.-H.; Jo, D.-Y.; Lee, K.-H.; Jang, E.-P.; Han, C.-Y.; Jo, J.-H.; Yang, H. White electroluminescent lighting device based on a single quantum dot emitter. Adv. Mater. 2016, 28, 5093. [Google Scholar] [CrossRef]
- Yoon, H.C.; Oh, J.H.; Lee, S.; Park, J.B.; Do, Y.R. Circadian-tunable perovskite quantum dot-based down-converted multi-package white LED with a color fidelity index over 90. Sci. Rep. 2017, 7, 2808. [Google Scholar] [CrossRef]
- Kim, J.-H.; Kim, B.-Y.; Jang, E.-P.; Han, C.-Y.; Jo, J.-H.; Do, Y.R.; Yang, H. A near-ideal color rendering white solid-state lighting device copackaged with two color-separated Cu-X-S (X = Ga, In) quantum dot emitters. J. Mater. Chem. C 2017, 5, 6755. [Google Scholar] [CrossRef]
- Zhang, H.; Su, Q.; Chen, S. Quantum-dot and organic hybrid tandem light-emitting diodes with multi-functionality of full-color tunability and white-light-emission. Nat. Commun. 2020, 11, 2826. [Google Scholar] [CrossRef]
- Rhee, S.; Kim, K.; Roh, J.; Kwak, J. Recent progress in high-luminance quantum dot light-emitting diodes. Curr. Opt. Photon. 2020, 4, 161. [Google Scholar]
- Li, B.; Lu, M.; Feng, J.; Zhang, J.; Smowton, P.M.; Sohn, J.I.; Park, I.-K.; Zhong, H.; Hou, B. Colloidal quantum dot hybrids: An emerging class of materials for ambient lighting. J. Mater. Chem. C 2020, 8, 10676. [Google Scholar] [CrossRef]
- Mutlugun, E.; Hernandez-Martinez, P.L.; Eroglu, C.; Coskun, Y.; Erdem, T.; Sharma, V.K.; Unal, E.; Panda, S.K.; Hickey, S.G.; Gaponik, N.; et al. Large-area (over 50 cm 50 cm) freestanding films of colloidal InP/ZnS quantum dots. Nano Lett. 2012, 12, 3986. [Google Scholar] [CrossRef] [PubMed]
- Jun, S.; Lee, J.; Jang, E. Highly luminescent and photostable quantum dot-silica monolith and its application to light-emitting diodes. ACS Nano 2013, 7, 1472. [Google Scholar] [CrossRef]
- Kim, J.-H.; Yang, H. White lighting device from composite films embedded with hydrophilic Cu(In, Ga)S2/ZnS and hydrophobic InP/ZnS quantum dots. Nanotechnology 2014, 25, 225601. [Google Scholar] [CrossRef]
- Lee, S.-H.; Lee, K.-H.; Jo, J.-H.; Park, B.; Kwon, Y.; Jang, H.S.; Yang, H. Remote-type, high-color gamut white light-emitting diode based on InP quantum dot color converters. Opt. Mater. Exp. 2014, 4, 1297. [Google Scholar] [CrossRef]
- Altintas, Y.; Genc, S.; Talpur, M.Y.; Mutlugun, E. CdSe/ZnS quantum dot films for high performance flexible lighting and display applications. Nanotechnology 2016, 27, 295604. [Google Scholar] [CrossRef]
- Yu, S.; Fritz, B.; Johnsen, S.; Busko, D.; Richards, B.S.; Hippler, M.; Wiegand, G.; Tang, Y.; Li, Z.; Lemmer, U.; et al. Enhanced photoluminescence in quantum dots-porous polymer hybrid films fabricated by microcellular foaming. Adv. Opt. Mater. 2019, 7, 1900223. [Google Scholar] [CrossRef]
- Kim, G.Y.; Kim, S.; Choi, J.; Kim, M.; Lim, H.; Nam, T.W.; Choi, W.; Cho, E.N.; Han, H.J.; Lee, C.; et al. Order-of-magnitude, broadband-enhanced light emission from quantum dots assembled in multiscale phase-separated block copolymers. Nano Lett. 2019, 19, 6827. [Google Scholar] [CrossRef]
- Hong, S.C.; Gwak, S.T.; Park, S.; Lee, G.J.; Lee, J.-G.; Ko, J.-H.; Joe, S.Y.; Kim, Y.; Park, T.; Ko, Y.W. Improvement of color-rendering characteristics of white light emitting diodes by using red quantum dot films. Curr. Appl. Phys. 2021, 31, 199. [Google Scholar] [CrossRef]
- Lee, J.-G.; Lee, G.J.; Hong, S.C.; Ko, J.-H.; Park, T.; Ko, Y.W. Shape optimization of quantum-dot caps for high color-rendering white light-emitting diodes studied by optical simulation. J. Korean Phys. Soc. 2021, 78, 822. [Google Scholar] [CrossRef]
- Hong, S.C.; Ko, J.-H. Structural optimization of vertically stacked white LEDs with a yellow phosphor plate and a red quantum-dot film. Nanomaterials 2022, 12, 2846. [Google Scholar] [CrossRef] [PubMed]
- Baek, E.; Kim, B.; Kim, S.; Song, J.; Yoo, J.; Park, S.M.; Lee, J.-M.; Ko, J.-H. Color rendering index over 95 achieved by using light recycling process based on hybrid remote-type red quantum-dot components applied to conventional LED lighting devices. Nanomaterials 2023, 13, 2560. [Google Scholar] [CrossRef] [PubMed]
- Lee, G.; Lee, H.; Cho, J.; Choi, I.; Park, S.M.; Ko, J.-H. Realization of high-rendering luminaires using color conversion films for white LED applications. New Phys. Sae Mulli 2023, 73, 703. [Google Scholar] [CrossRef]
- Perikala, M.; Bhardwaj, A. Excellent color rendering index single system white light emitting carbon dots for next generation lighting devices. Sci. Rep. 2021, 11, 11594. [Google Scholar] [CrossRef]
- Karadza, B.; Avermaet, H.V.; Mingabudinova, L.; Hens, Z.; Meuret, Y. Efficient, high-CRI LEDs by combining traditional phosphors with cadmium-free InP/ZnSe red quantum dots. Photonics Res. 2022, 10, 155. [Google Scholar] [CrossRef]
- Onal, A.; Sadeghi, S.; Melikov, R.; Karatum, O.; Eren, G.O.; Nizamoglu, S. Quantum dot to nanorod transition for efficient white-light-emitting diodes with suppressed absorption losses. ACS Photon. 2022, 9, 3268. [Google Scholar] [CrossRef]
- Li, Q.; Bai, J.; Huang, M.; Li, L.; Liao, X.; Wang, L.; Xu, B.; Jin, X. High-performance, environmentally friendly solid-phase color converted-based quantum dots white light-emitting diodes. J. Lumin. 2023, 255, 119560. [Google Scholar] [CrossRef]
- Joo, B.-Y.; Ko, J.-H. Simulation Study of Injection-Molded Light Guide Plates for Improving Luminance Uniformity Based on the Measured Replication Quality of Micro-Patterns for LED TV Backlight. J. Opt. Soc. Korea 2015, 19, 159. [Google Scholar] [CrossRef]
- Joo, B.-Y.; Ko, J.-H. Analysis of Color Uniformity of White LED Lens Packages for Direct-lit LCD Backlight Applications. J. Opt. Soc. Korea 2013, 17, 506. [Google Scholar] [CrossRef]
- Lee, G.J.; Hong, S.C.; Lee, J.-G.; Ko, J.-H.; Park, T.; Ko, Y.W.; Lushnikov, S. Substantial Improvement of Color-Rendering Properties of Conventional White LEDs Using Remote-Type Red Quantum-Dot Caps. Nanomaterials 2022, 12, 1097. [Google Scholar] [CrossRef] [PubMed]
- Lin, C.-T.; Chen, H.-S. Macroscopic discolorization in quantum dot color converters for microdisplay applications. ACS Appl. Nano Mater. 2024, 7, 8258. [Google Scholar] [CrossRef]
- Zhang, C.; He, Z.; Mogensen, M.; Gesquiere, A.J.; Chen, C.-H.; Chiu, T.-L.; Lee, J.-H.; Wu, S.-T.; Dong, Y. A deep-dyeing strategy for ultra-stable, brightly luminescent perovskite-polymer composites. J. Mater. Chem. C 2021, 9, 3396. [Google Scholar] [CrossRef]
- Yu, M.; Saeed, M.H.; Zhang, S.; Wei, H.; Gao, Y.; Zou, C.; Zhang, L.; Yang, H. Luminescence enhancement, encapsulation, and patterning of quantum dots toward display applications. Adv. Funct. Mater. 2022, 32, 2109472. [Google Scholar] [CrossRef]
- Lee, J.; Kim, Y.; Lee, K.; Yoo, J.; Kim, K.; Kim, J.W.; Lee, S.; Kim, C.; Choi, M.K.; Yang, J. Transfer-printed multi-stacked quantum dot color conversion layers for white light-emitting diodes. Appl. Surf. Sci. 2025, 687, 162196. [Google Scholar] [CrossRef]


| Variable | Lighting Frame | Diffuser Plate | Quantum-Dot Lens |
|---|---|---|---|
| Size (mm2) | 100 × 100 | 97 × 97 | Freeform |
| Thickness (mm) | 15 (Height) | 1.5 | 4.3 |
| Material | Aluminum | Polycarbonate and (n = 1.5896 and n = 2.4358) | Resin and red quantum dot (n = 1.4936) |
| Optical property | Inner bottom and side reflectance: 85% Optical smoothing (Fresnel loss) | Optical smoothing (Fresnel loss) | Optical smoothing (Fresnel loss) |
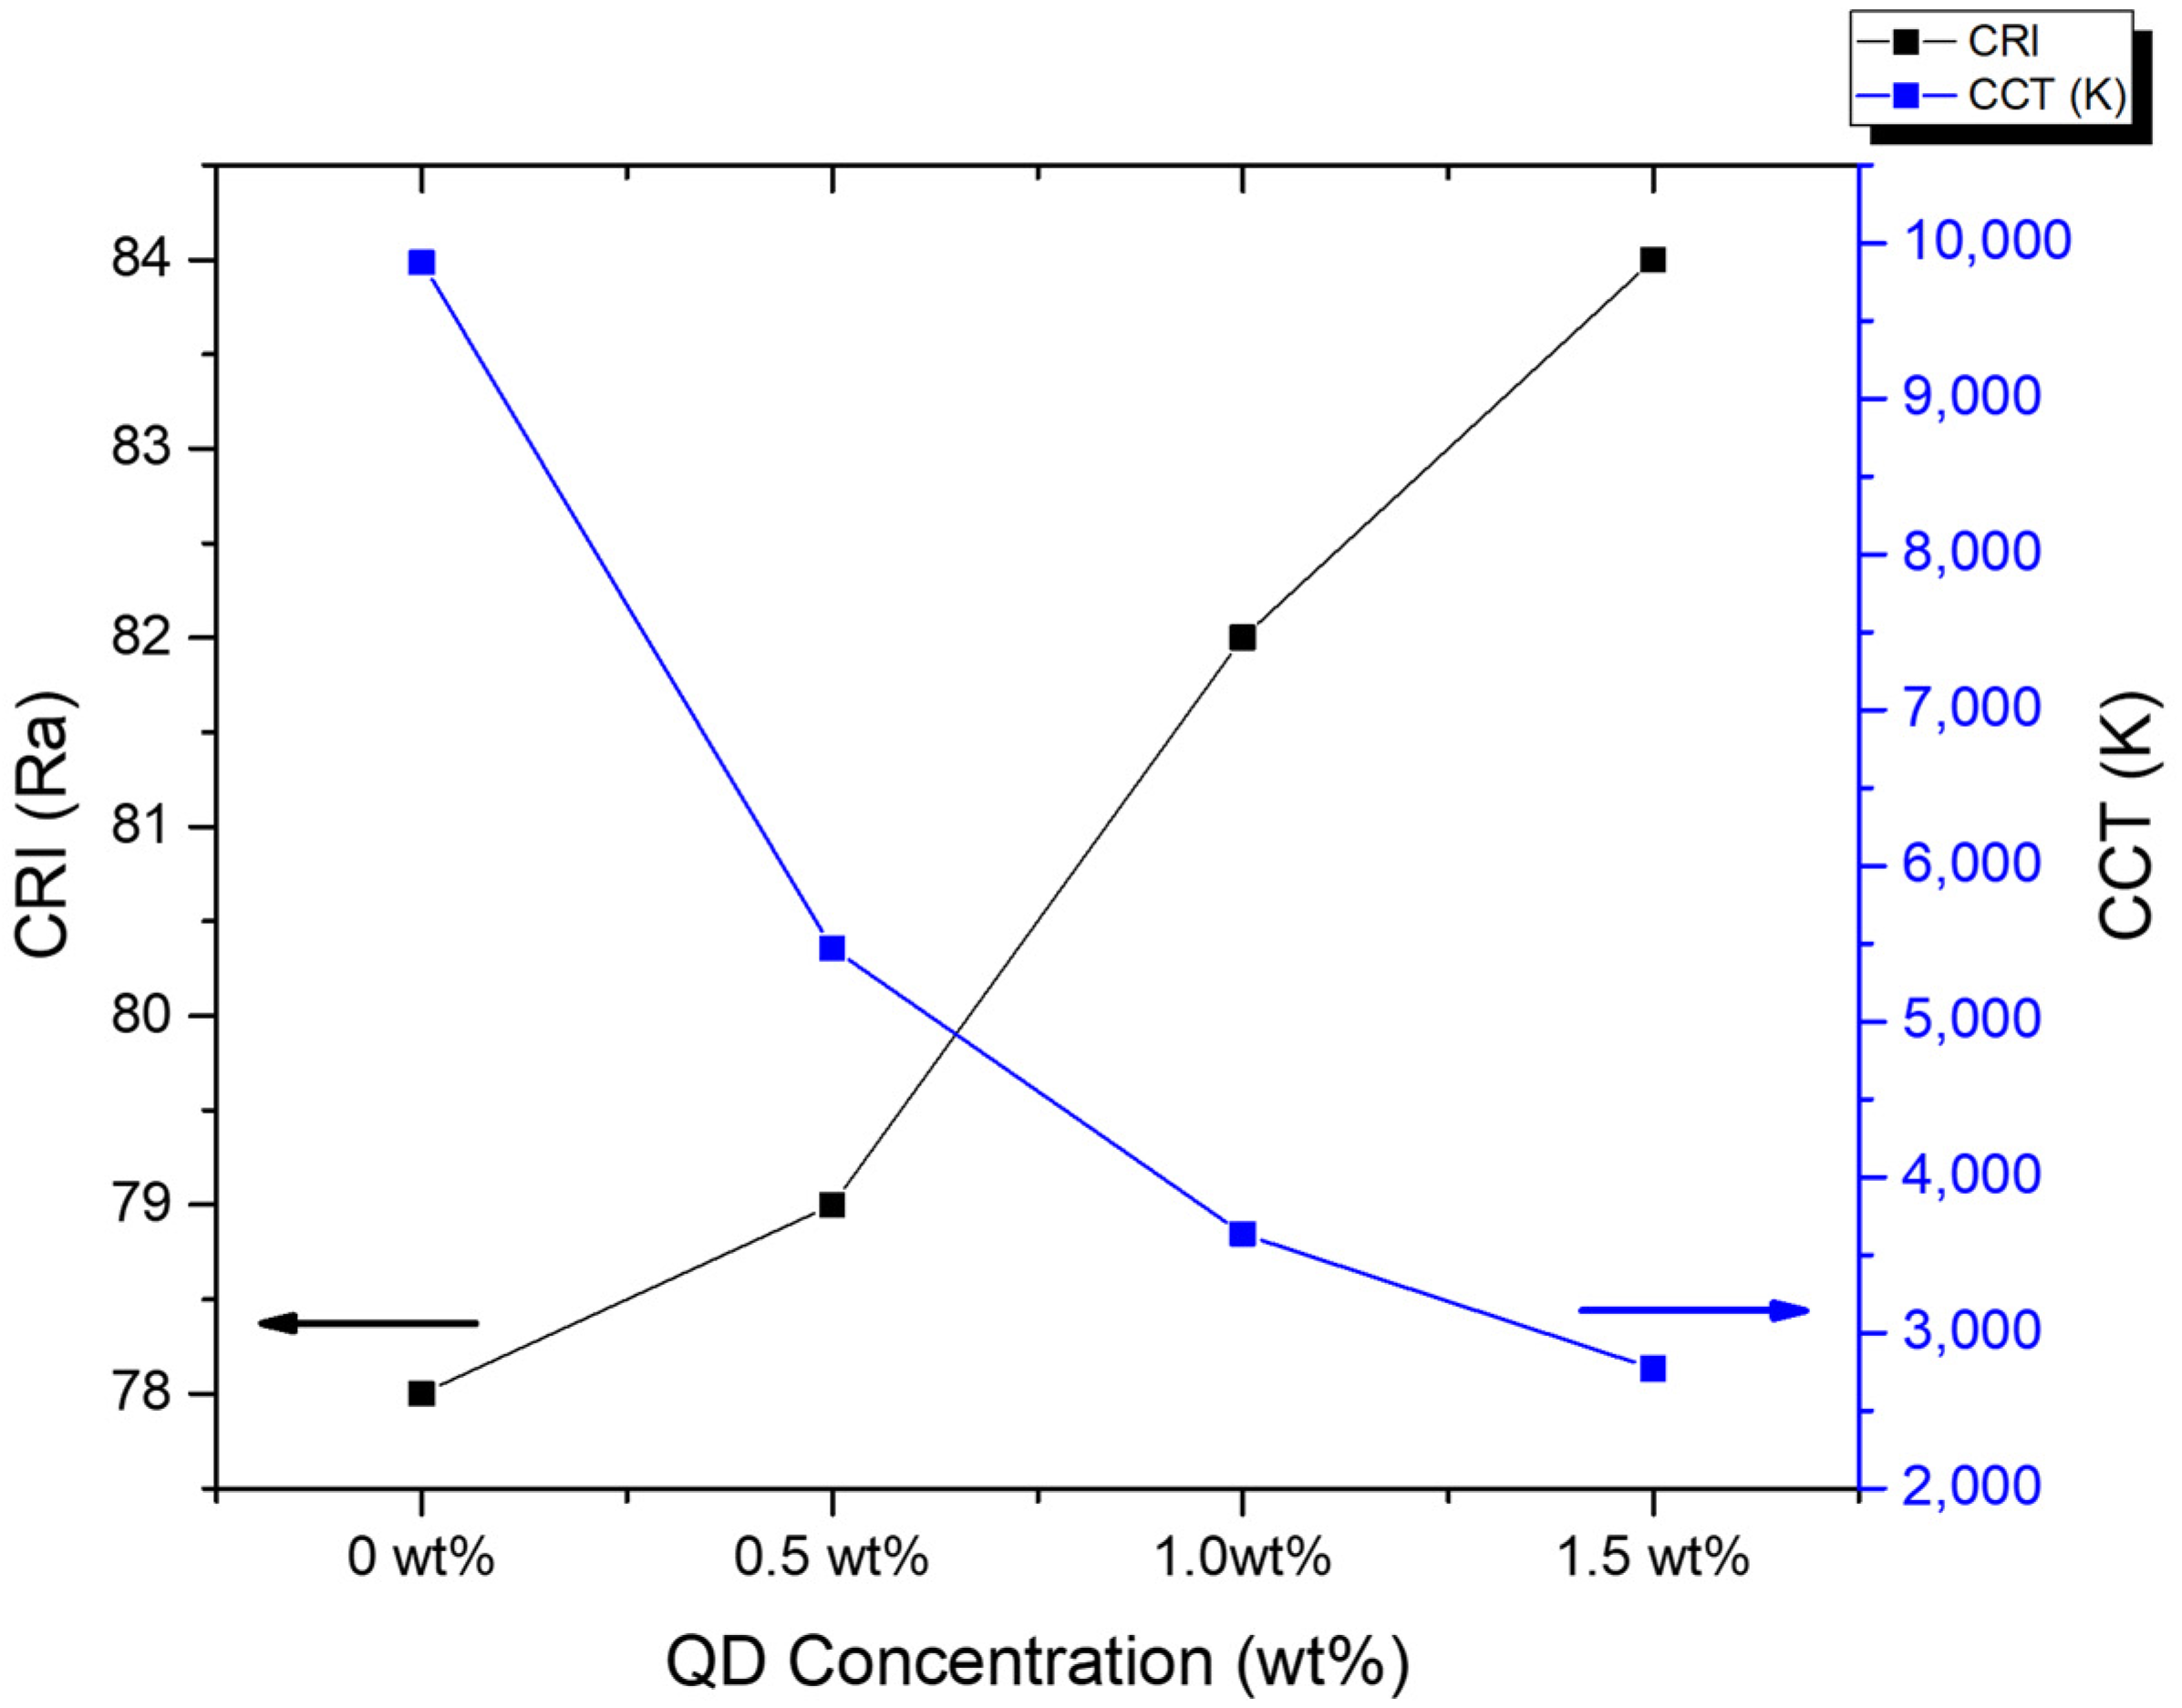
| QD Concentration (wt%) | CCT (K) | CRI (Ra) | CRI (Re) | CRI (R9) | CIE x | CIE y |
|---|---|---|---|---|---|---|
| 0 | 9876 | 78 | 68 | −12 | 0.280 | 0.292 |
| 0.5 | 5471 | 79 | 71 | 0 | 0.333 | 0.347 |
| 1.0 | 3634 | 82 | 75 | 17 | 0.399 | 0.390 |
| 1.5 | 2769 | 84 | 79 | 25 | 0.451 | 0.403 |
Disclaimer/Publisher’s Note: The statements, opinions and data contained in all publications are solely those of the individual author(s) and contributor(s) and not of MDPI and/or the editor(s). MDPI and/or the editor(s) disclaim responsibility for any injury to people or property resulting from any ideas, methods, instructions or products referred to in the content. |
© 2025 by the authors. Licensee MDPI, Basel, Switzerland. This article is an open access article distributed under the terms and conditions of the Creative Commons Attribution (CC BY) license (https://creativecommons.org/licenses/by/4.0/).
Share and Cite
Park, S.M.; Baek, E.; Kim, S.; Yoo, J.; Joe, S.-Y.; Ko, J.-H.; Park, T.; Ko, Y.W. Effect of Quantum Dot-Based Remote Lenses on the Emission Properties of White LED Lighting Studied by Optical Simulation and Experiment. Ceramics 2025, 8, 39. https://doi.org/10.3390/ceramics8020039
Park SM, Baek E, Kim S, Yoo J, Joe S-Y, Ko J-H, Park T, Ko YW. Effect of Quantum Dot-Based Remote Lenses on the Emission Properties of White LED Lighting Studied by Optical Simulation and Experiment. Ceramics. 2025; 8(2):39. https://doi.org/10.3390/ceramics8020039
Chicago/Turabian StylePark, Sung Min, Eunki Baek, Sohee Kim, Jaehyeong Yoo, Sung-Yoon Joe, Jae-Hyeon Ko, Taehee Park, and Young Wook Ko. 2025. "Effect of Quantum Dot-Based Remote Lenses on the Emission Properties of White LED Lighting Studied by Optical Simulation and Experiment" Ceramics 8, no. 2: 39. https://doi.org/10.3390/ceramics8020039
APA StylePark, S. M., Baek, E., Kim, S., Yoo, J., Joe, S.-Y., Ko, J.-H., Park, T., & Ko, Y. W. (2025). Effect of Quantum Dot-Based Remote Lenses on the Emission Properties of White LED Lighting Studied by Optical Simulation and Experiment. Ceramics, 8(2), 39. https://doi.org/10.3390/ceramics8020039