
Investigating Australian Calcined Clays as Supplementary Cementitious Materials
 , ,
, , 
Abstract
1. Introduction
2. Materials and Methods
2.1. Preselection of Suitable Sites with Overburden Clay Material
2.2. Methods Adopted for the Characterisation of Raw Clays
2.3. Methods Adopted for the Characterisation of Calcined Clays
2.4. Materials and Mix Design
3. Results and Discussion
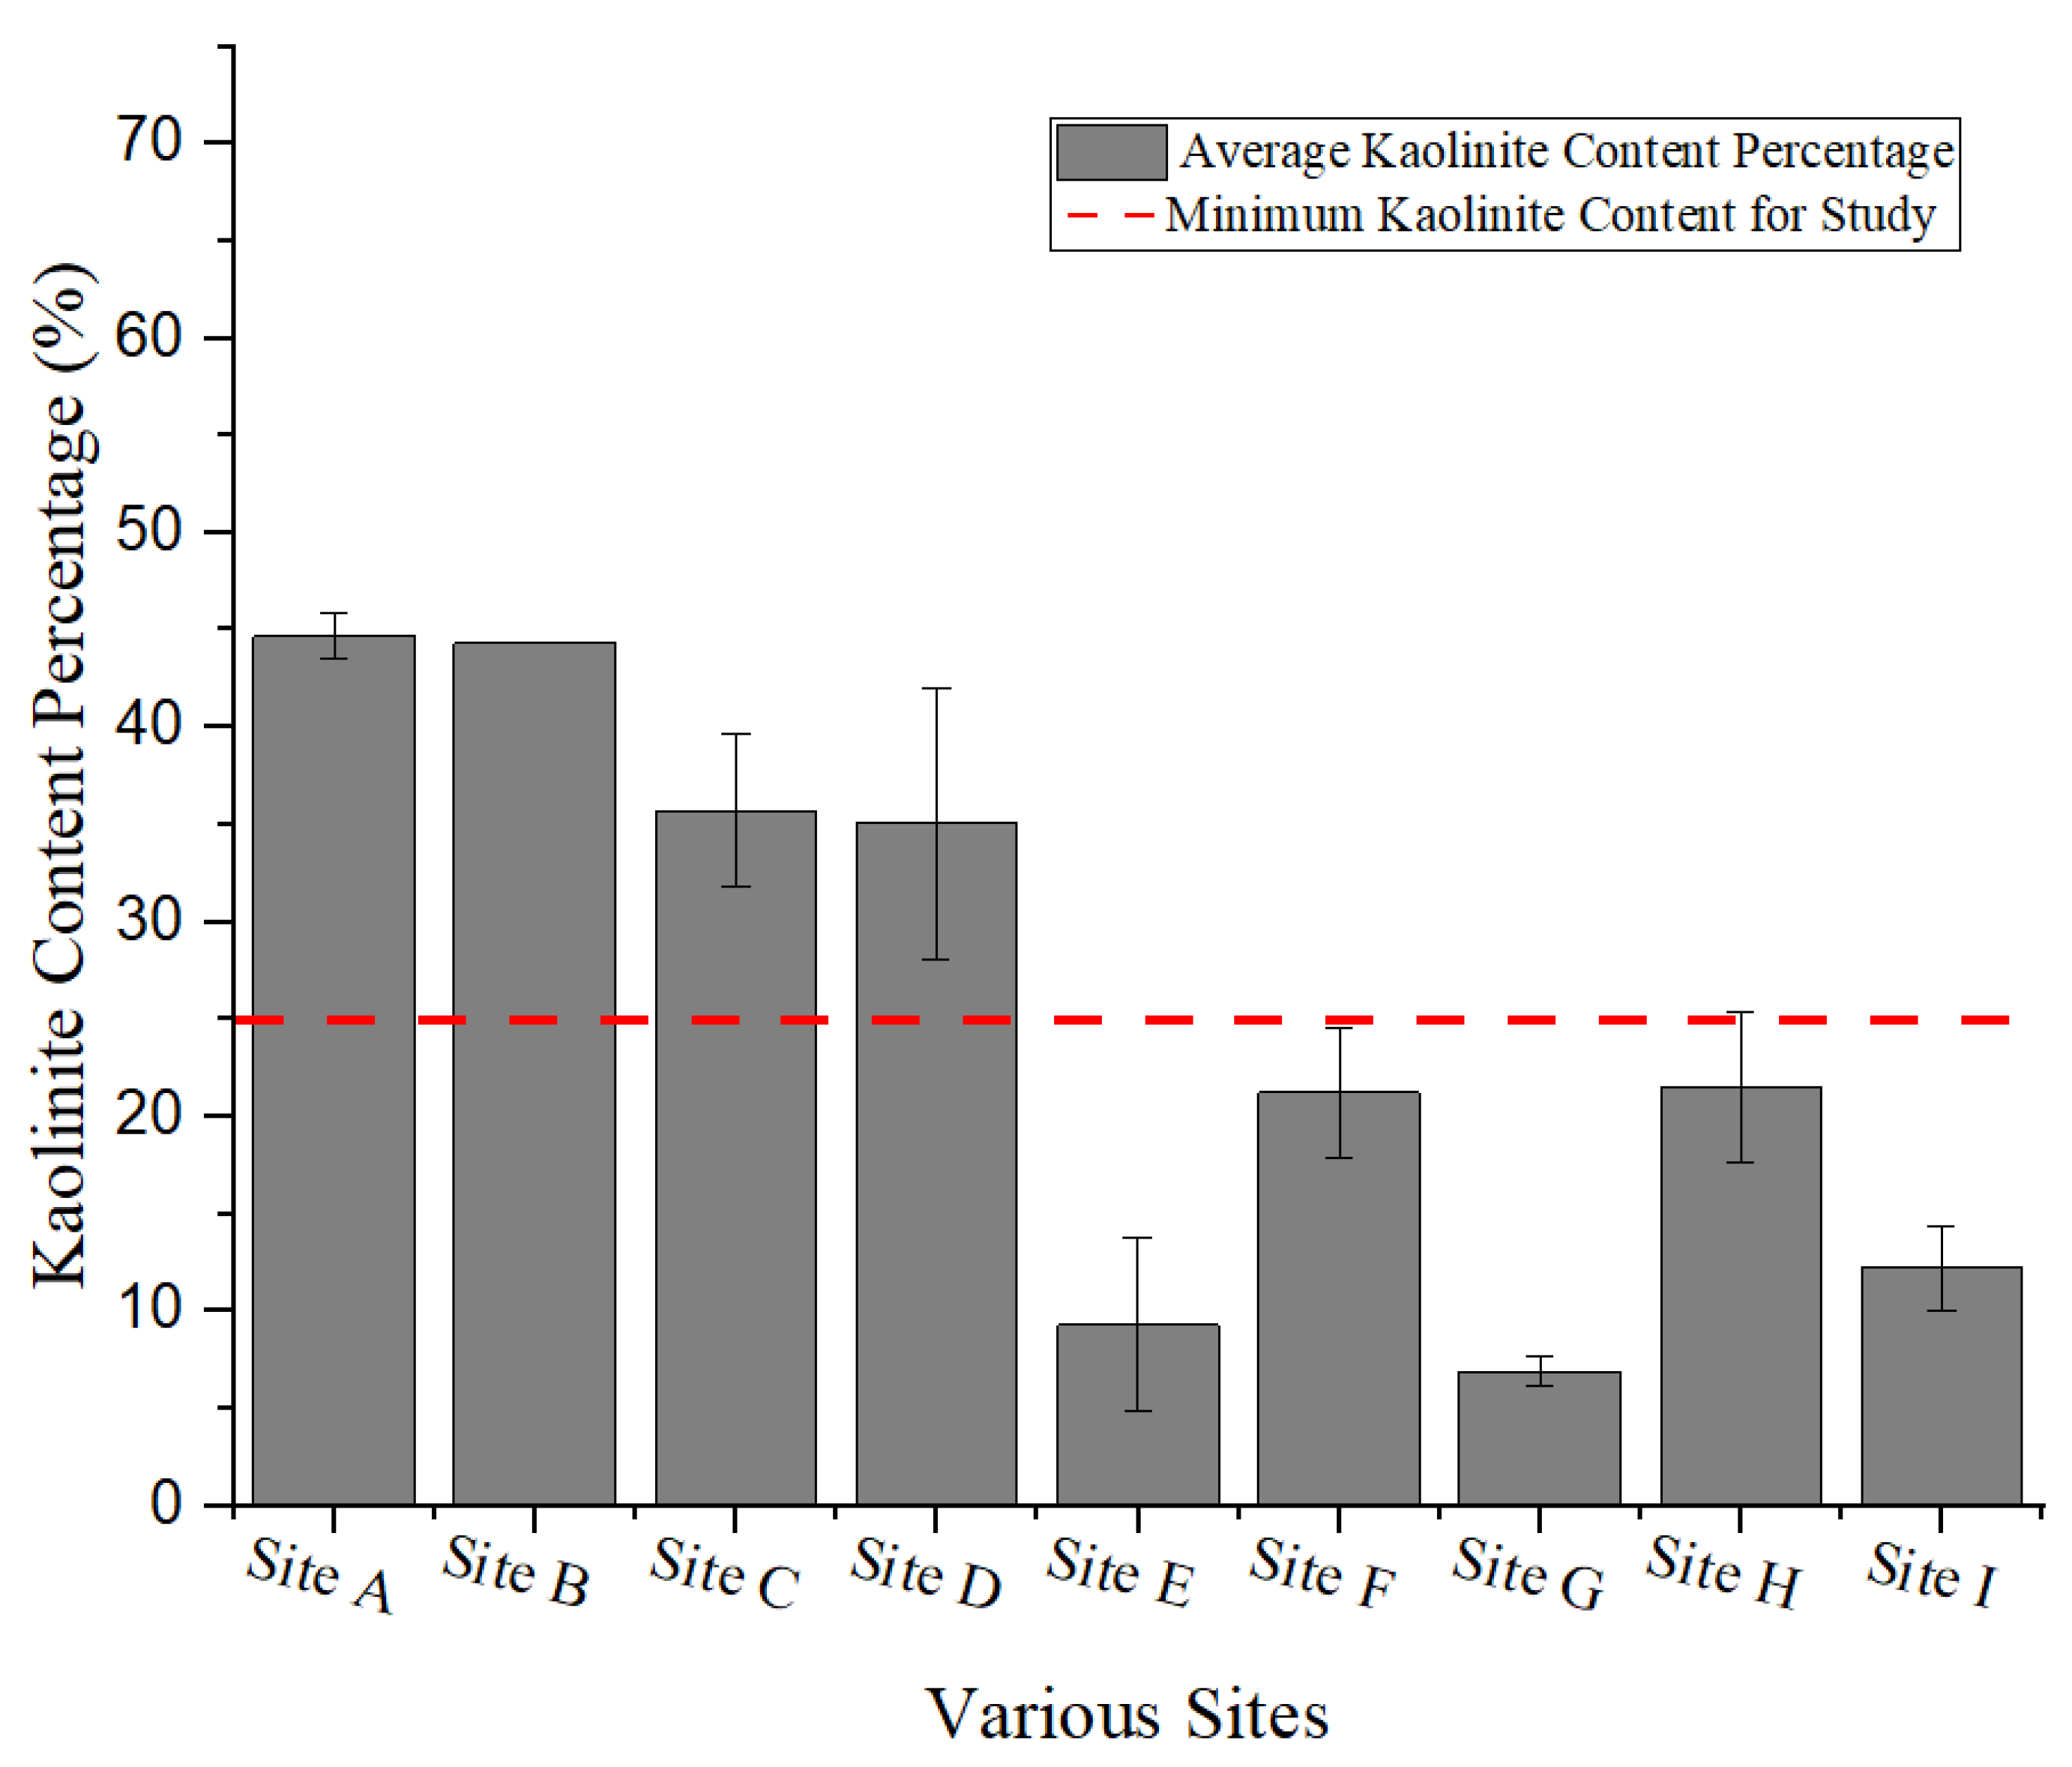
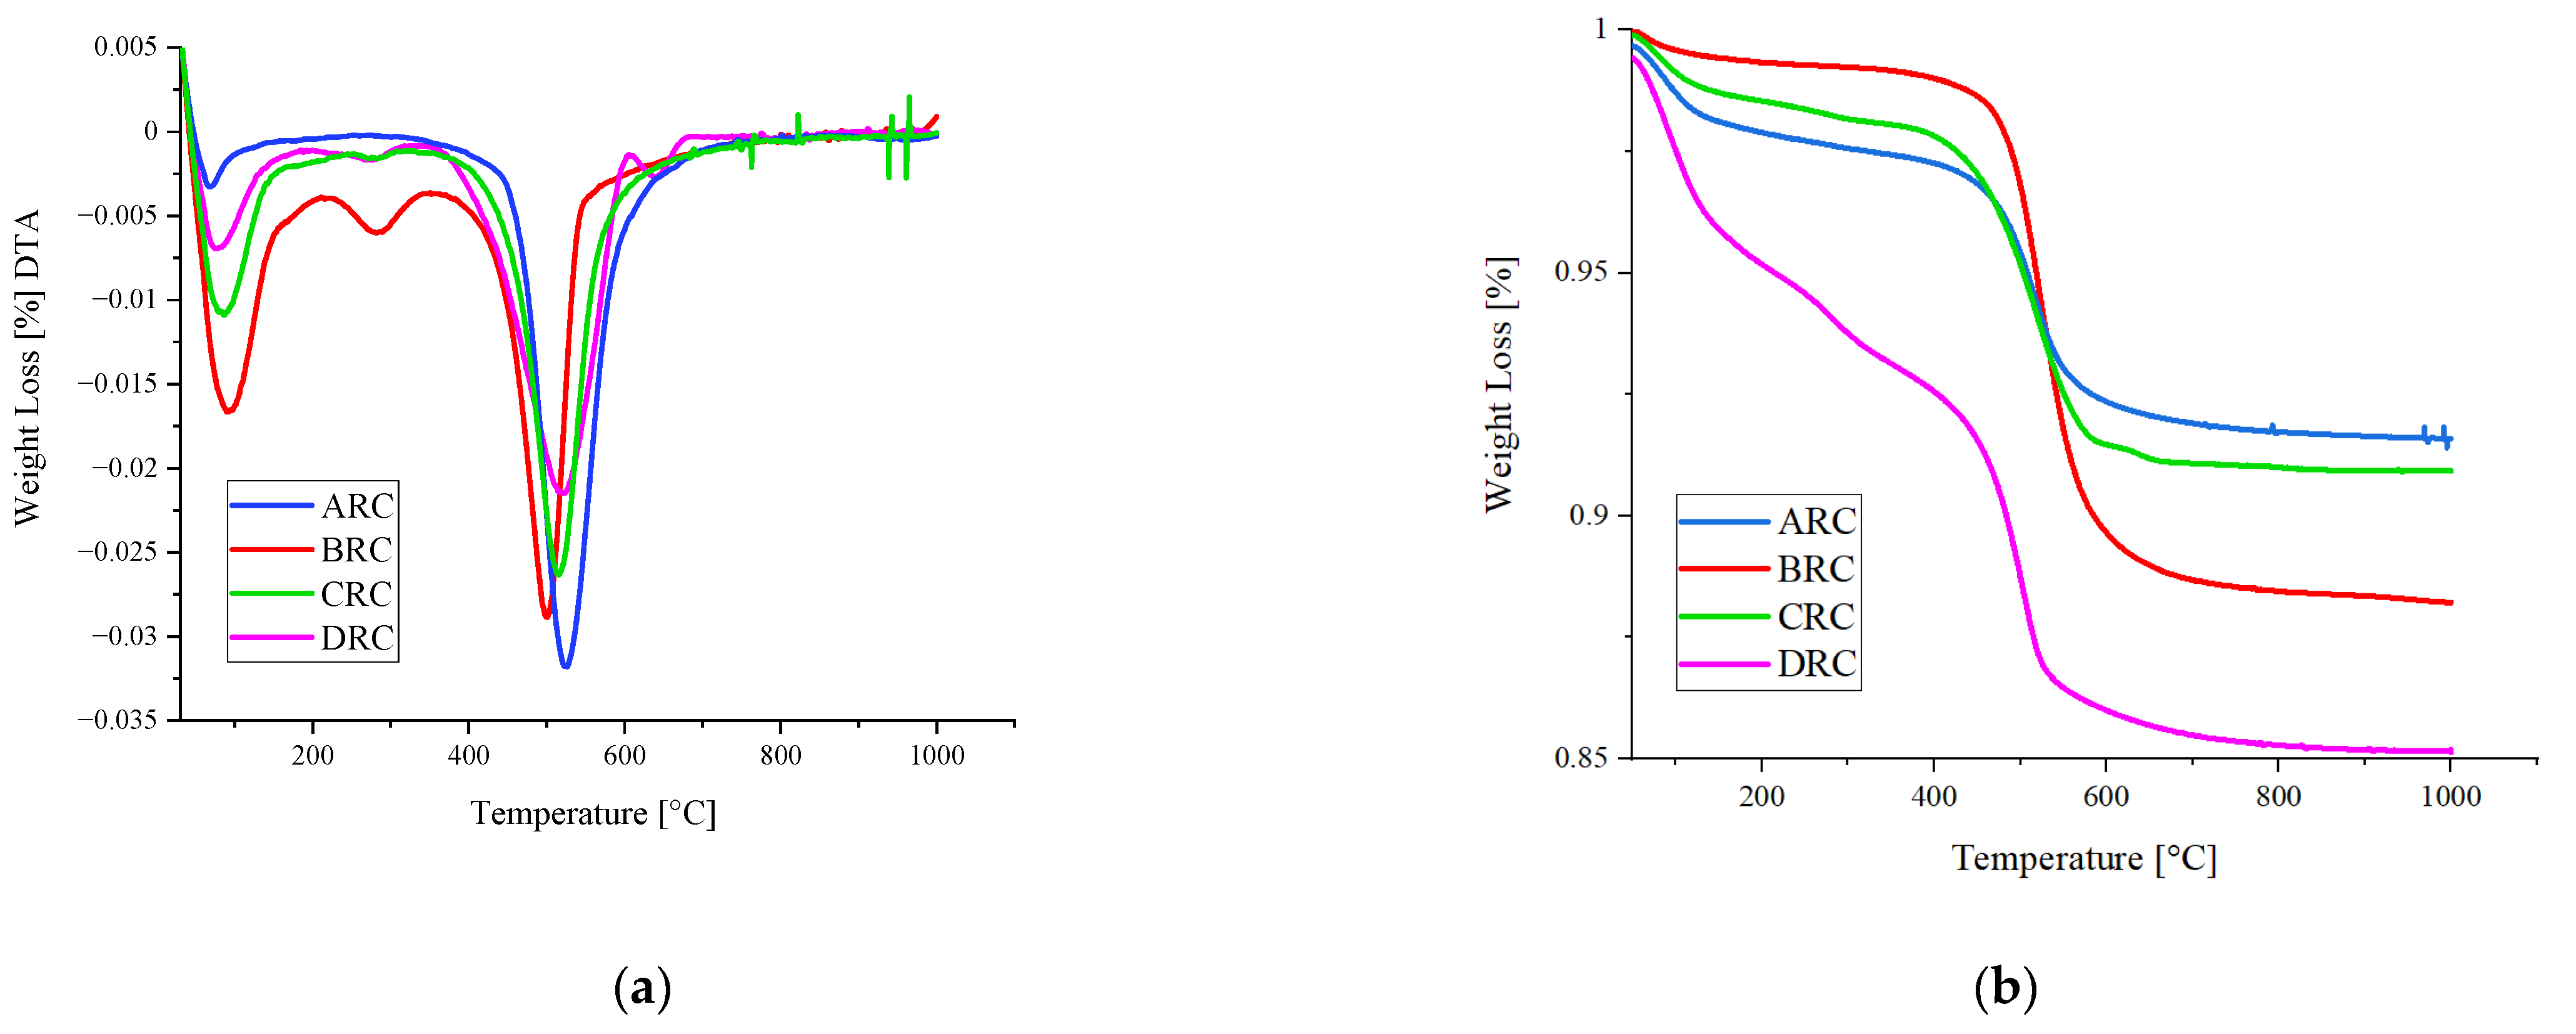
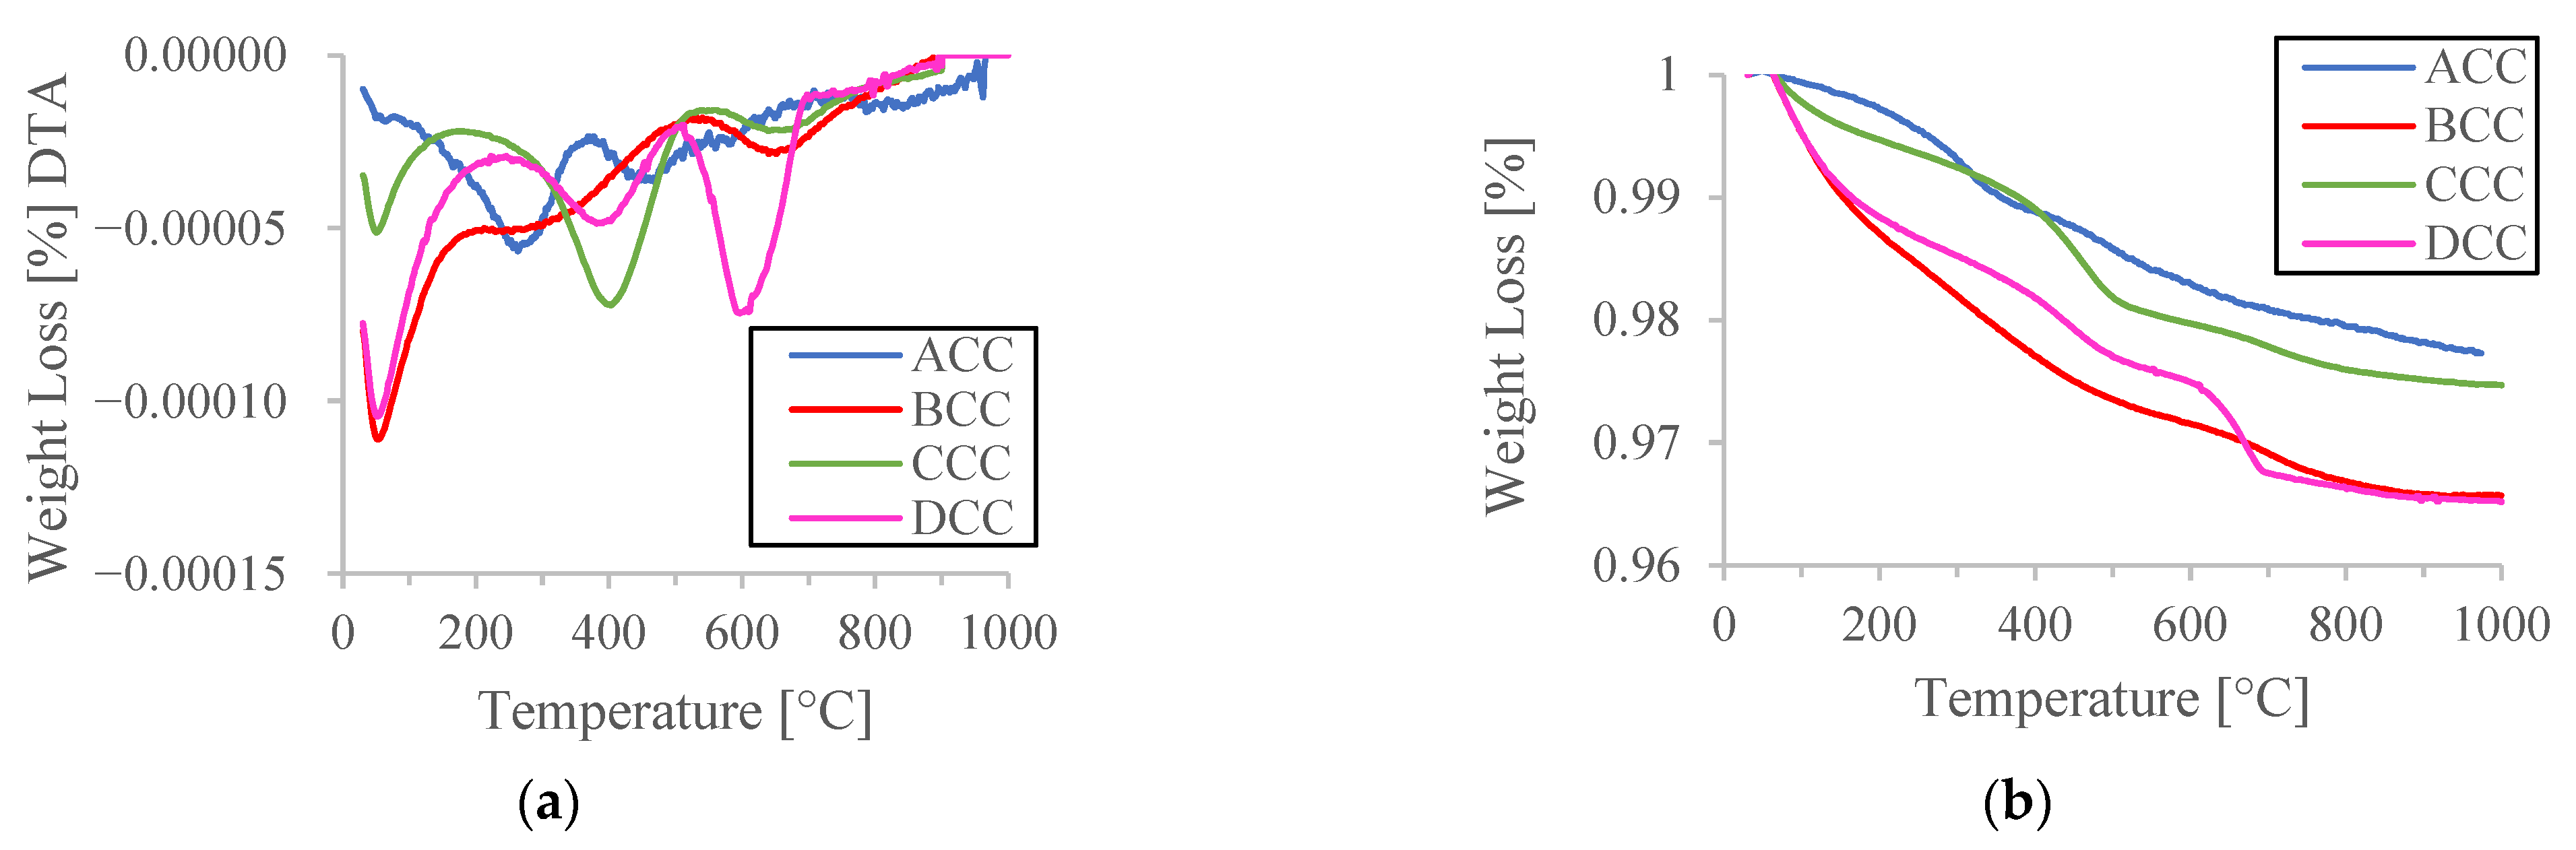
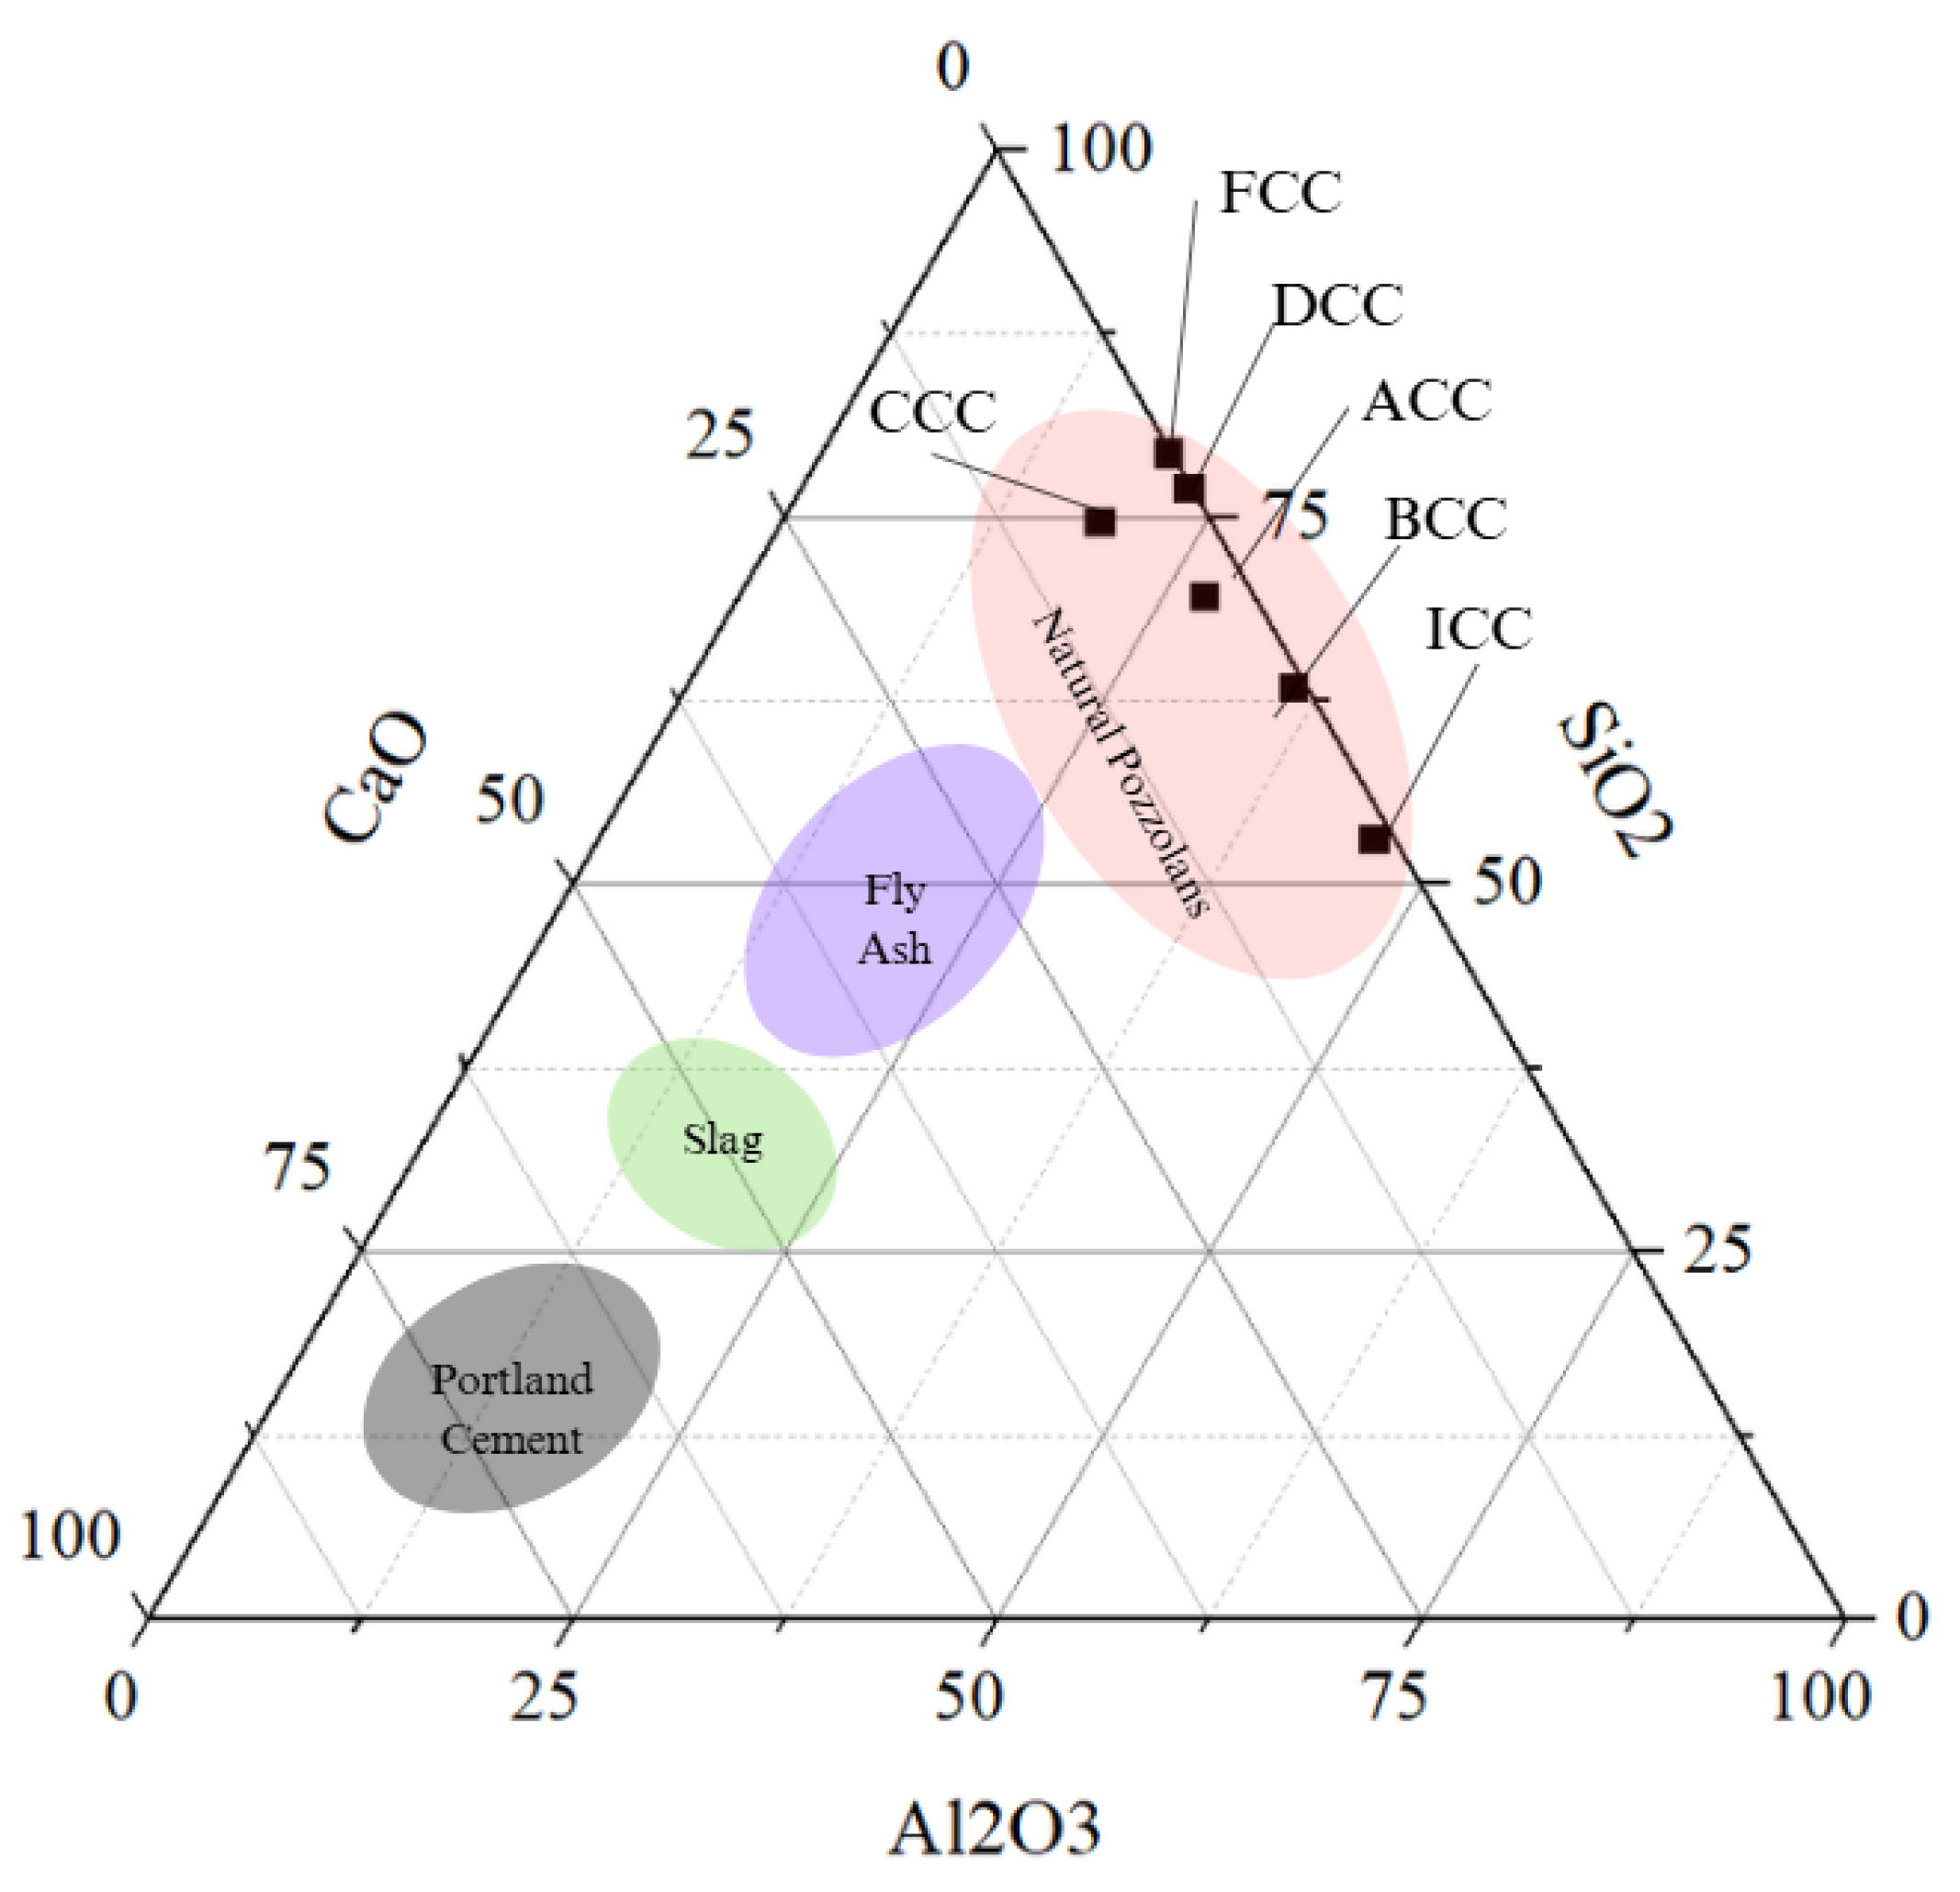
3.1. Exploration of Clays and Characterisation
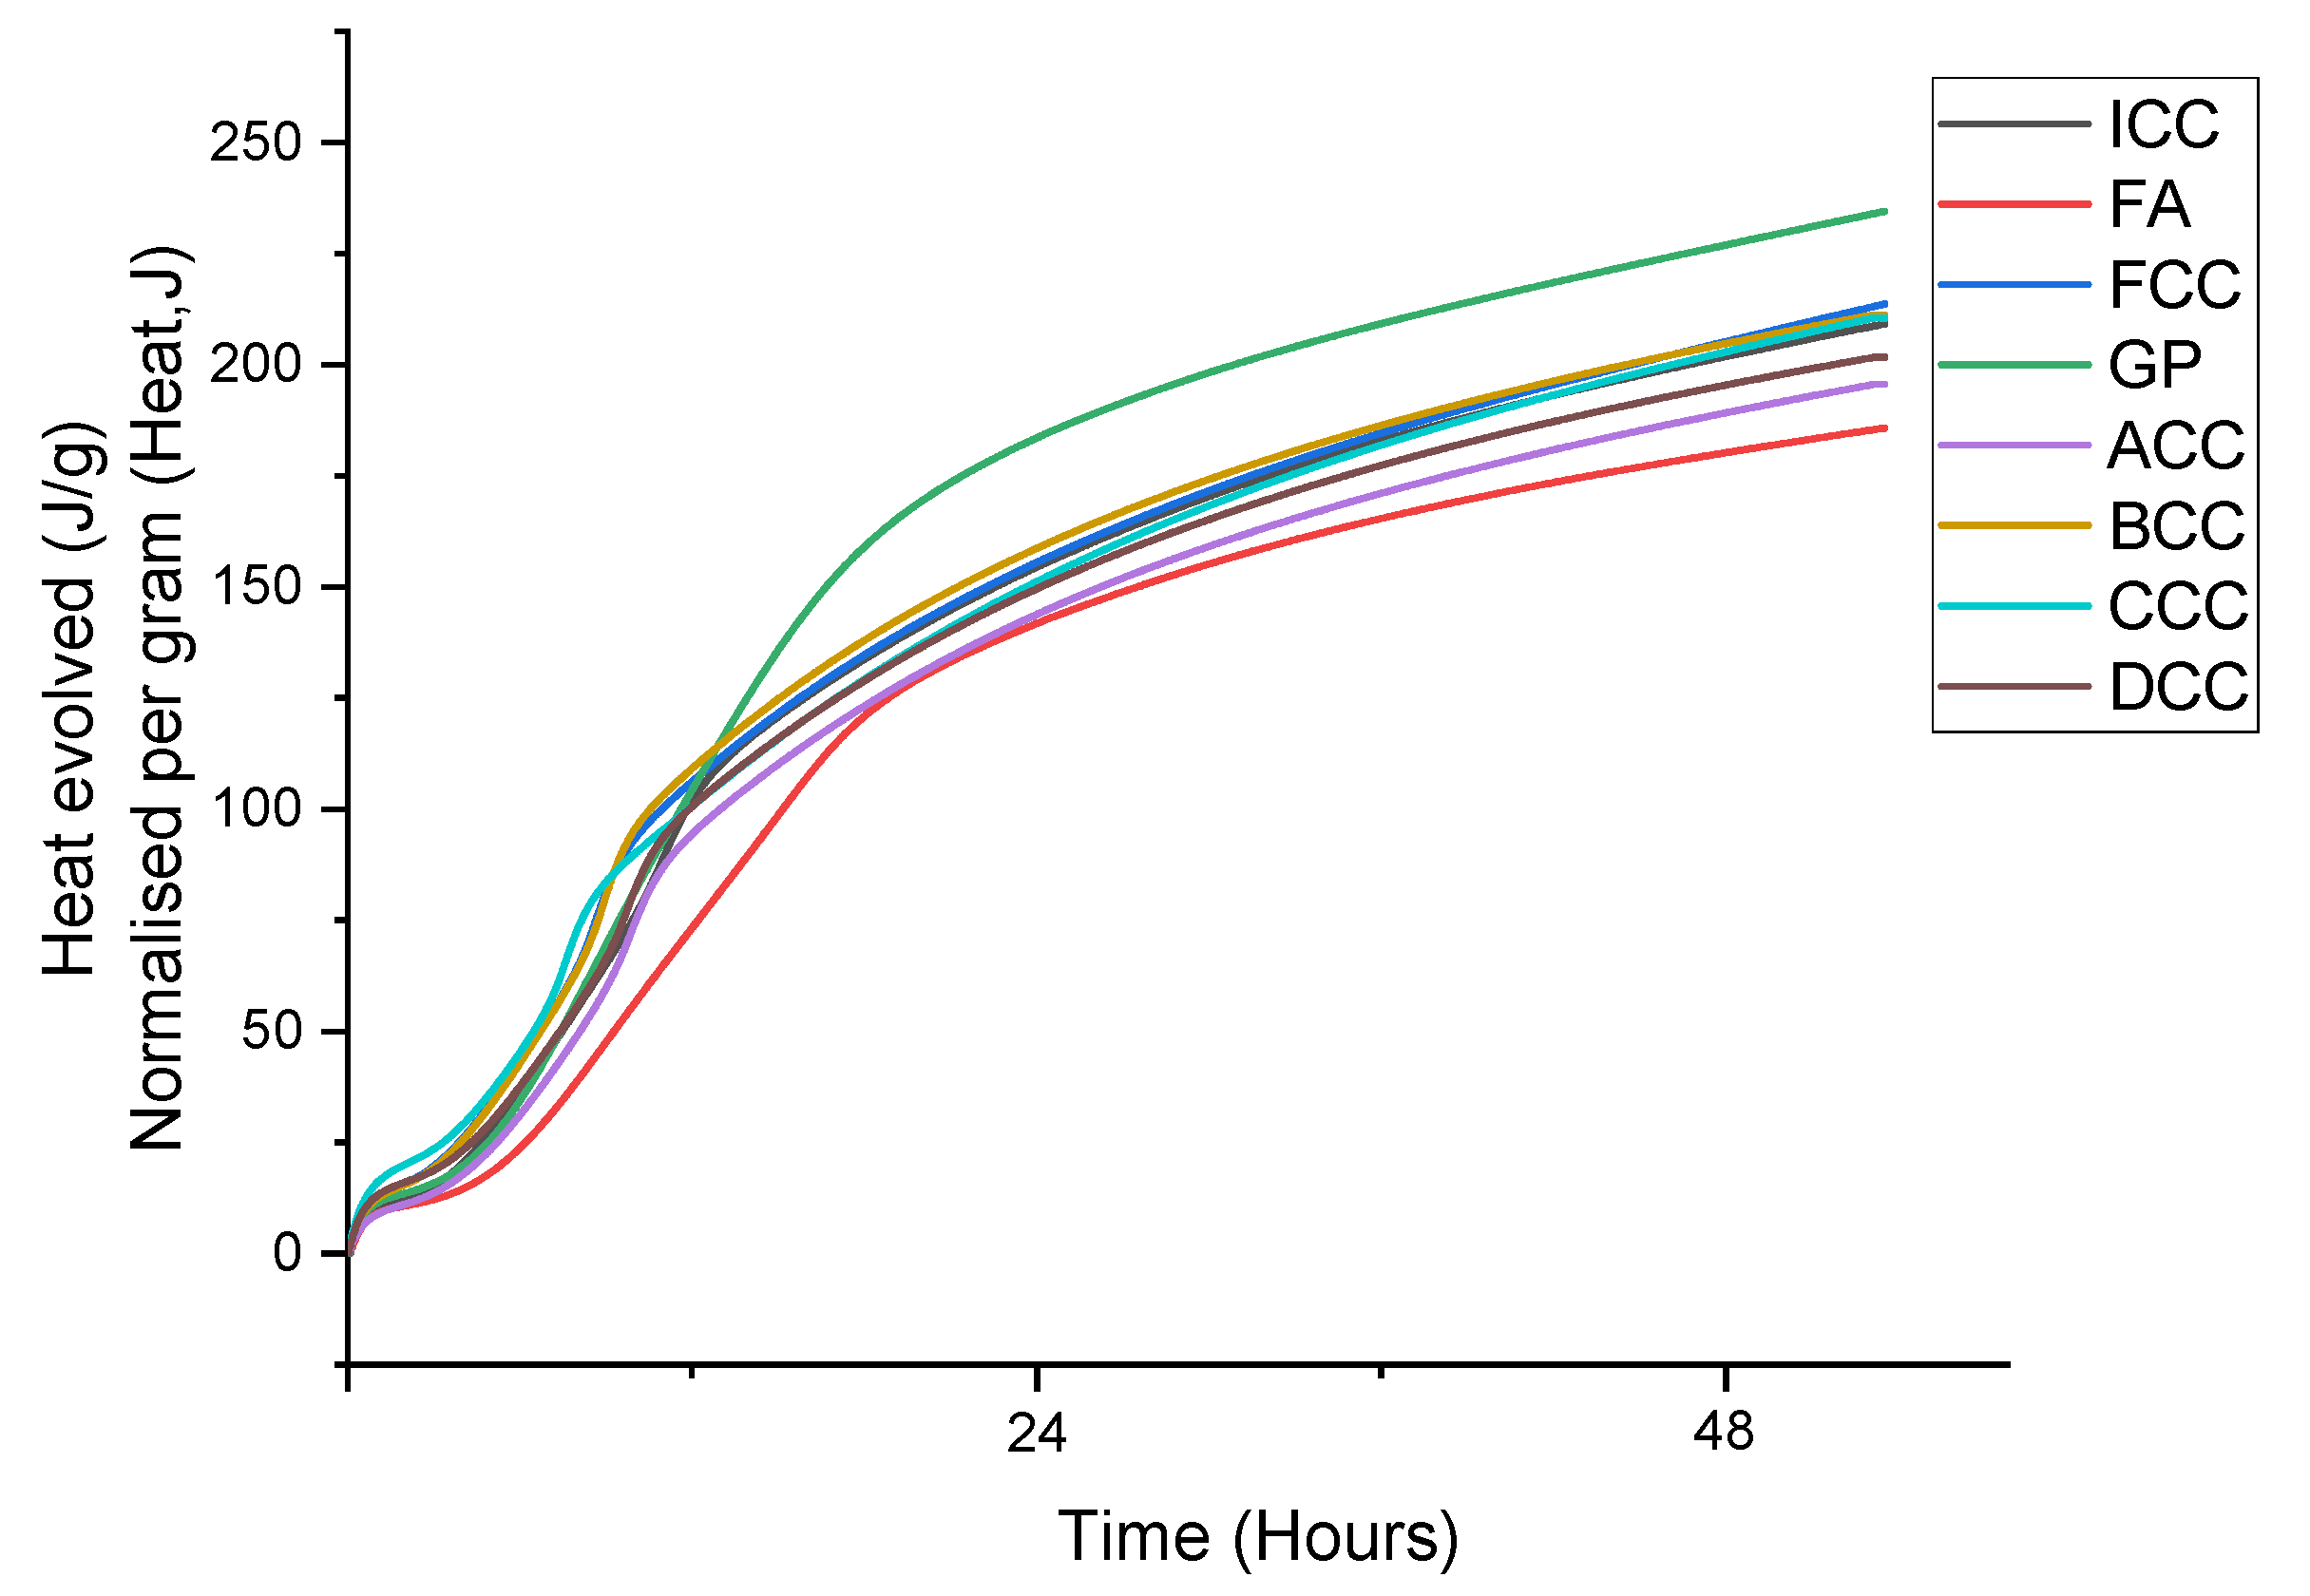
3.2. Reactivity and Calorimetry of Pastes
3.3. Mortar Results
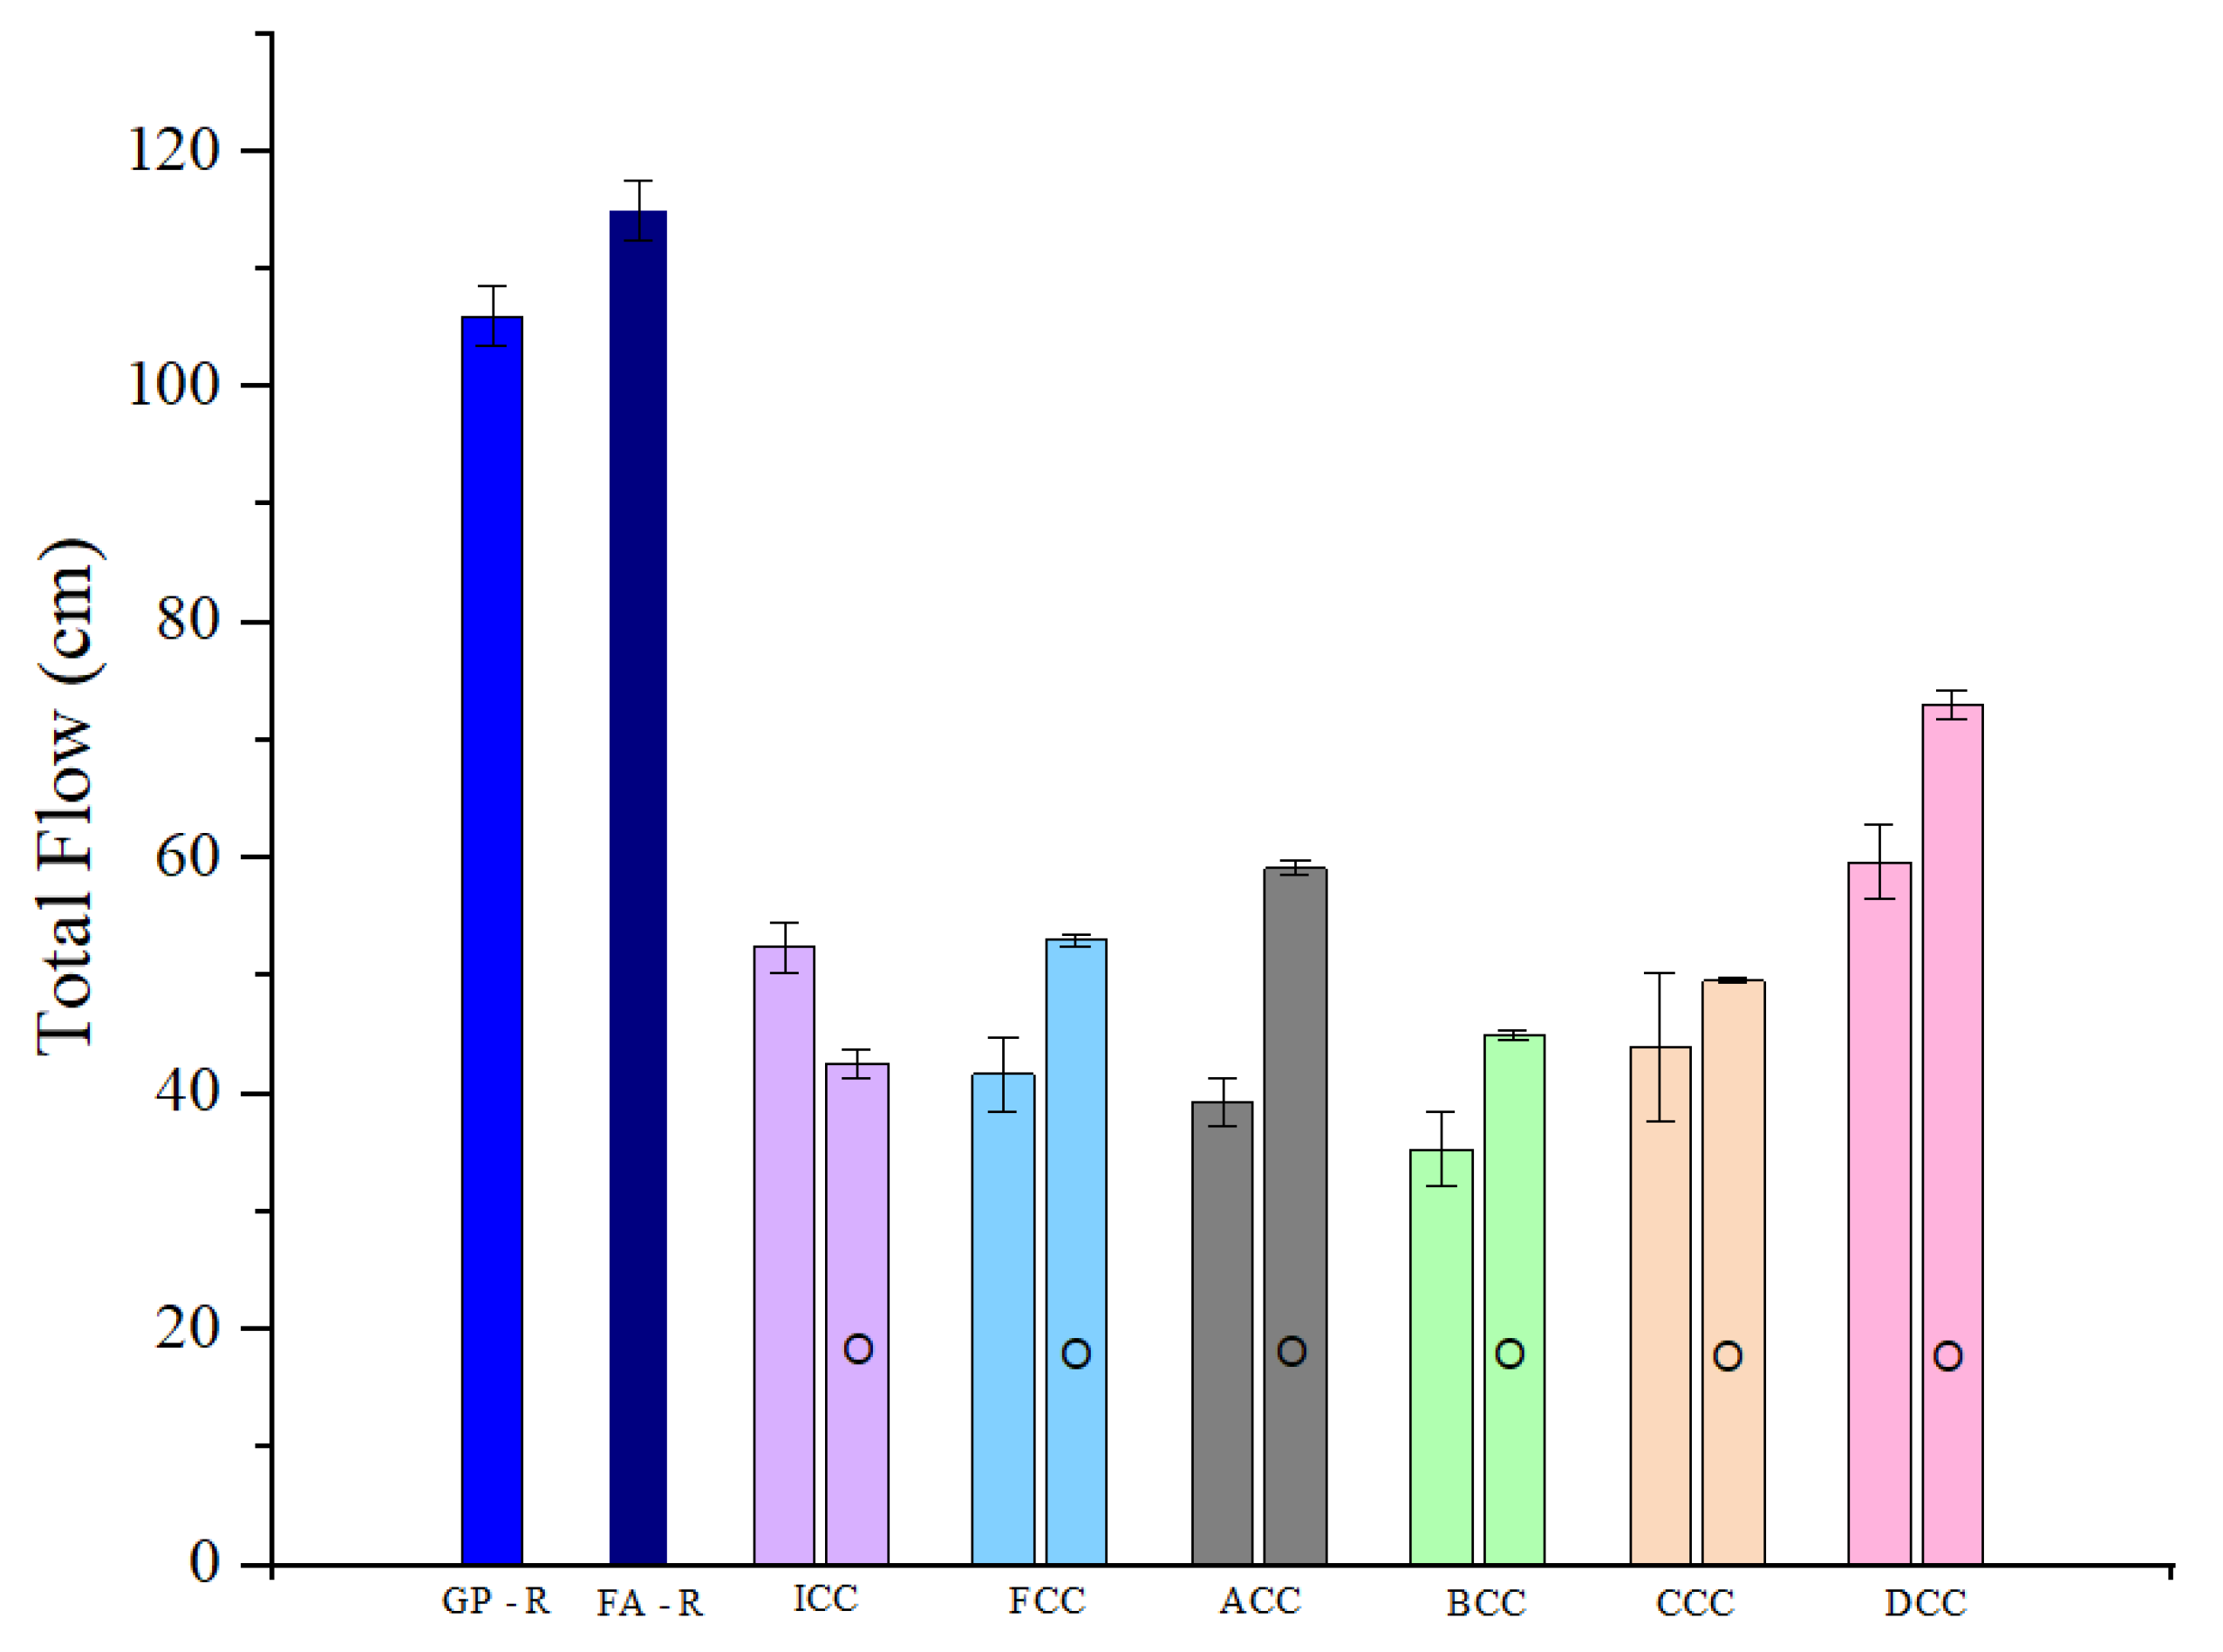
3.3.1. Flow
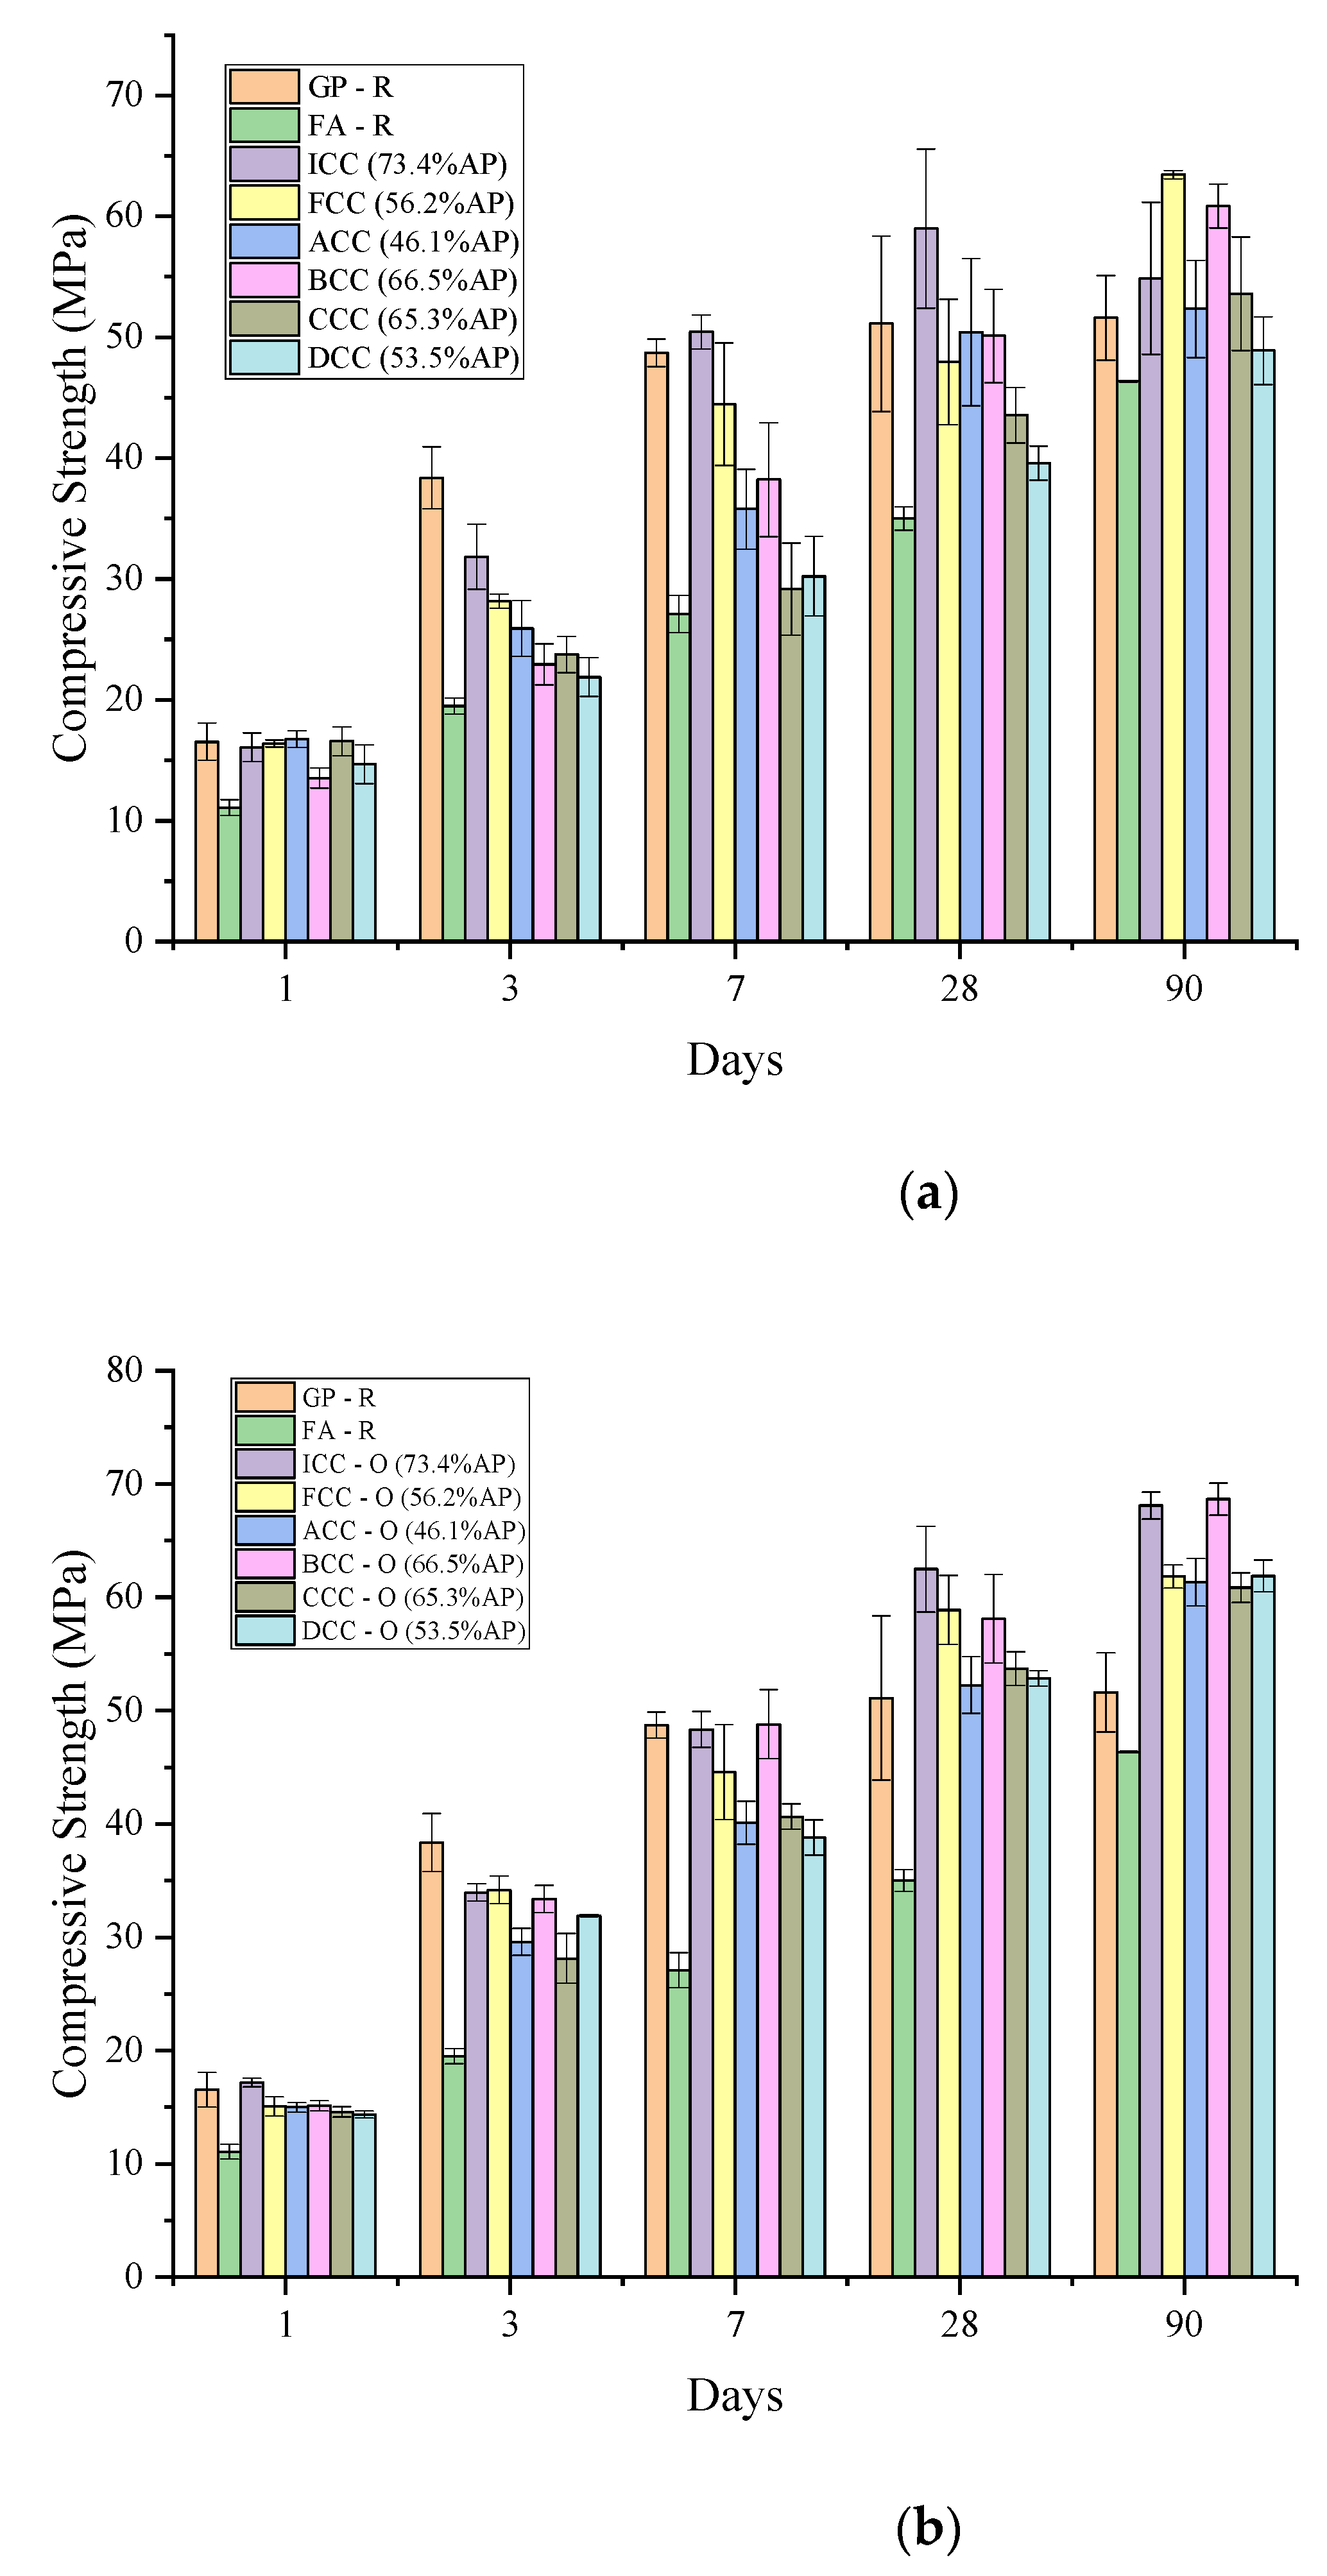
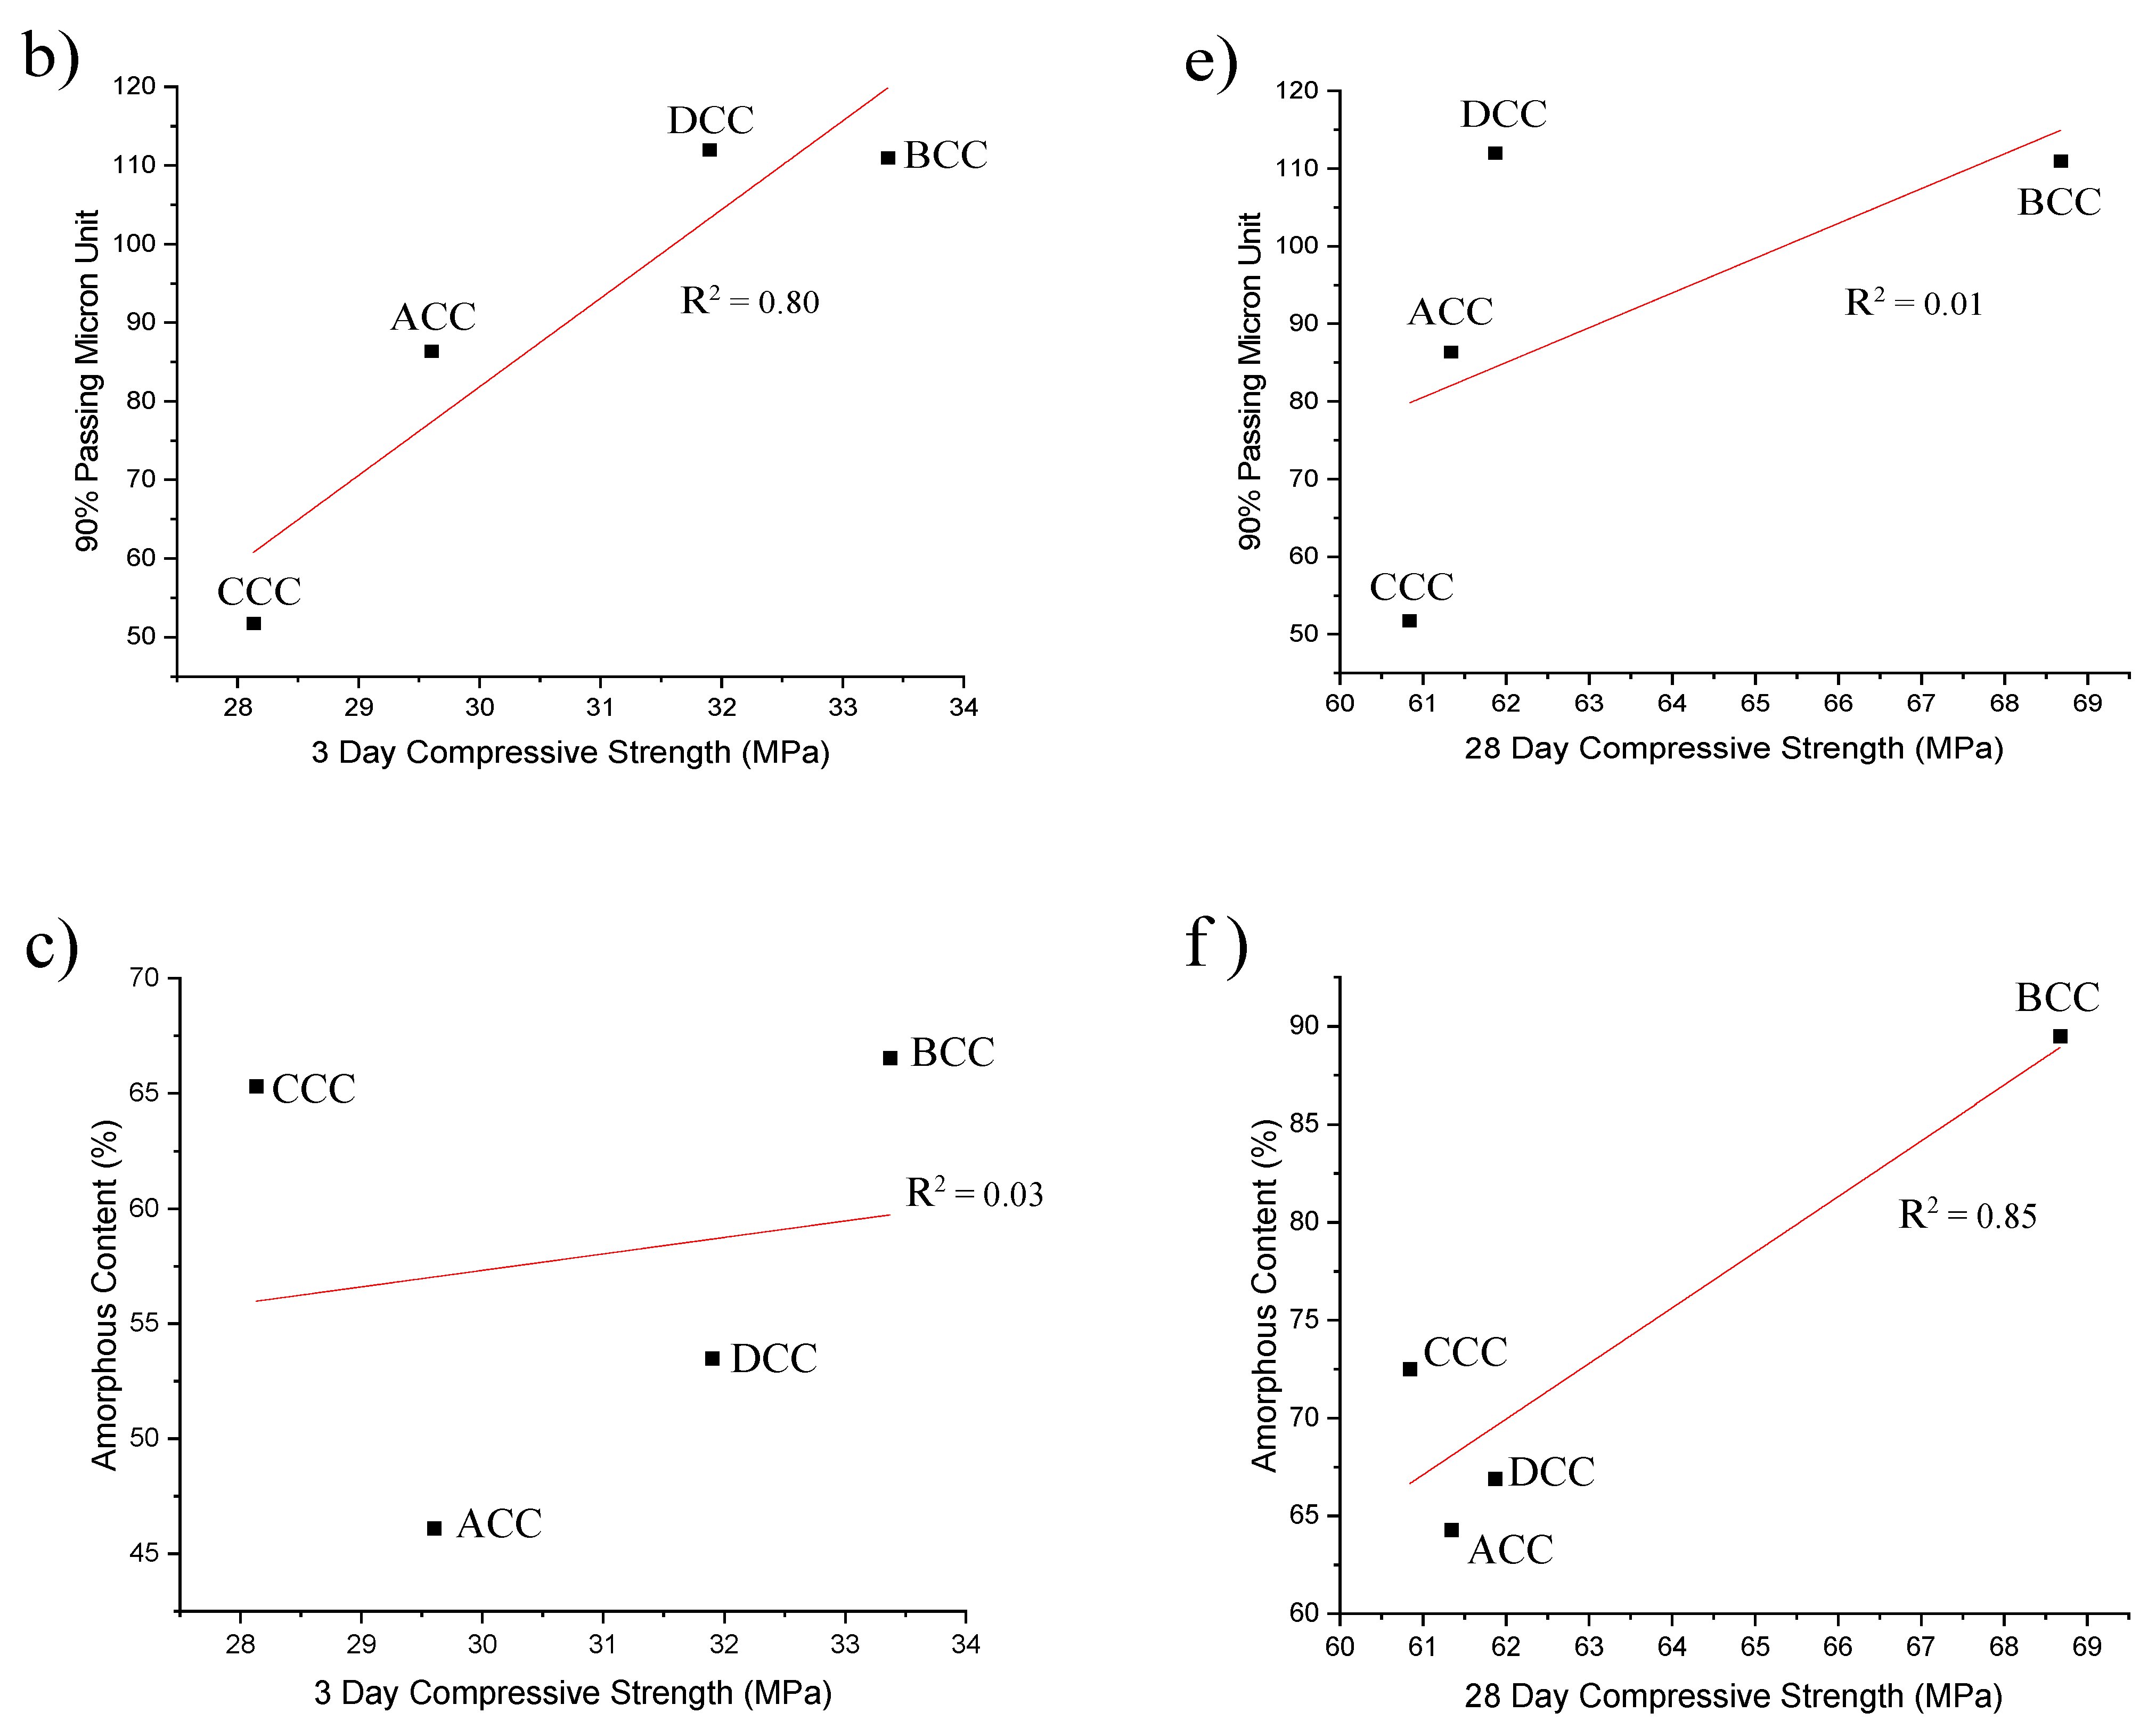
3.3.2. Compressive Strength Results
4. Conclusions
- The optimisation of the particle sizing of the calcined clays, which involved transitioning to a larger PSD and smaller surface area, led to a higher LC3 mortar compression strength in the early ages
- The calcination temperature of 650 °C at 45 min calcination time proved to be suitable for the Australian clays, where it calcined the kaolinite into metakaolin and demonstrated a suitable performance for potential calcined clay concrete applications.
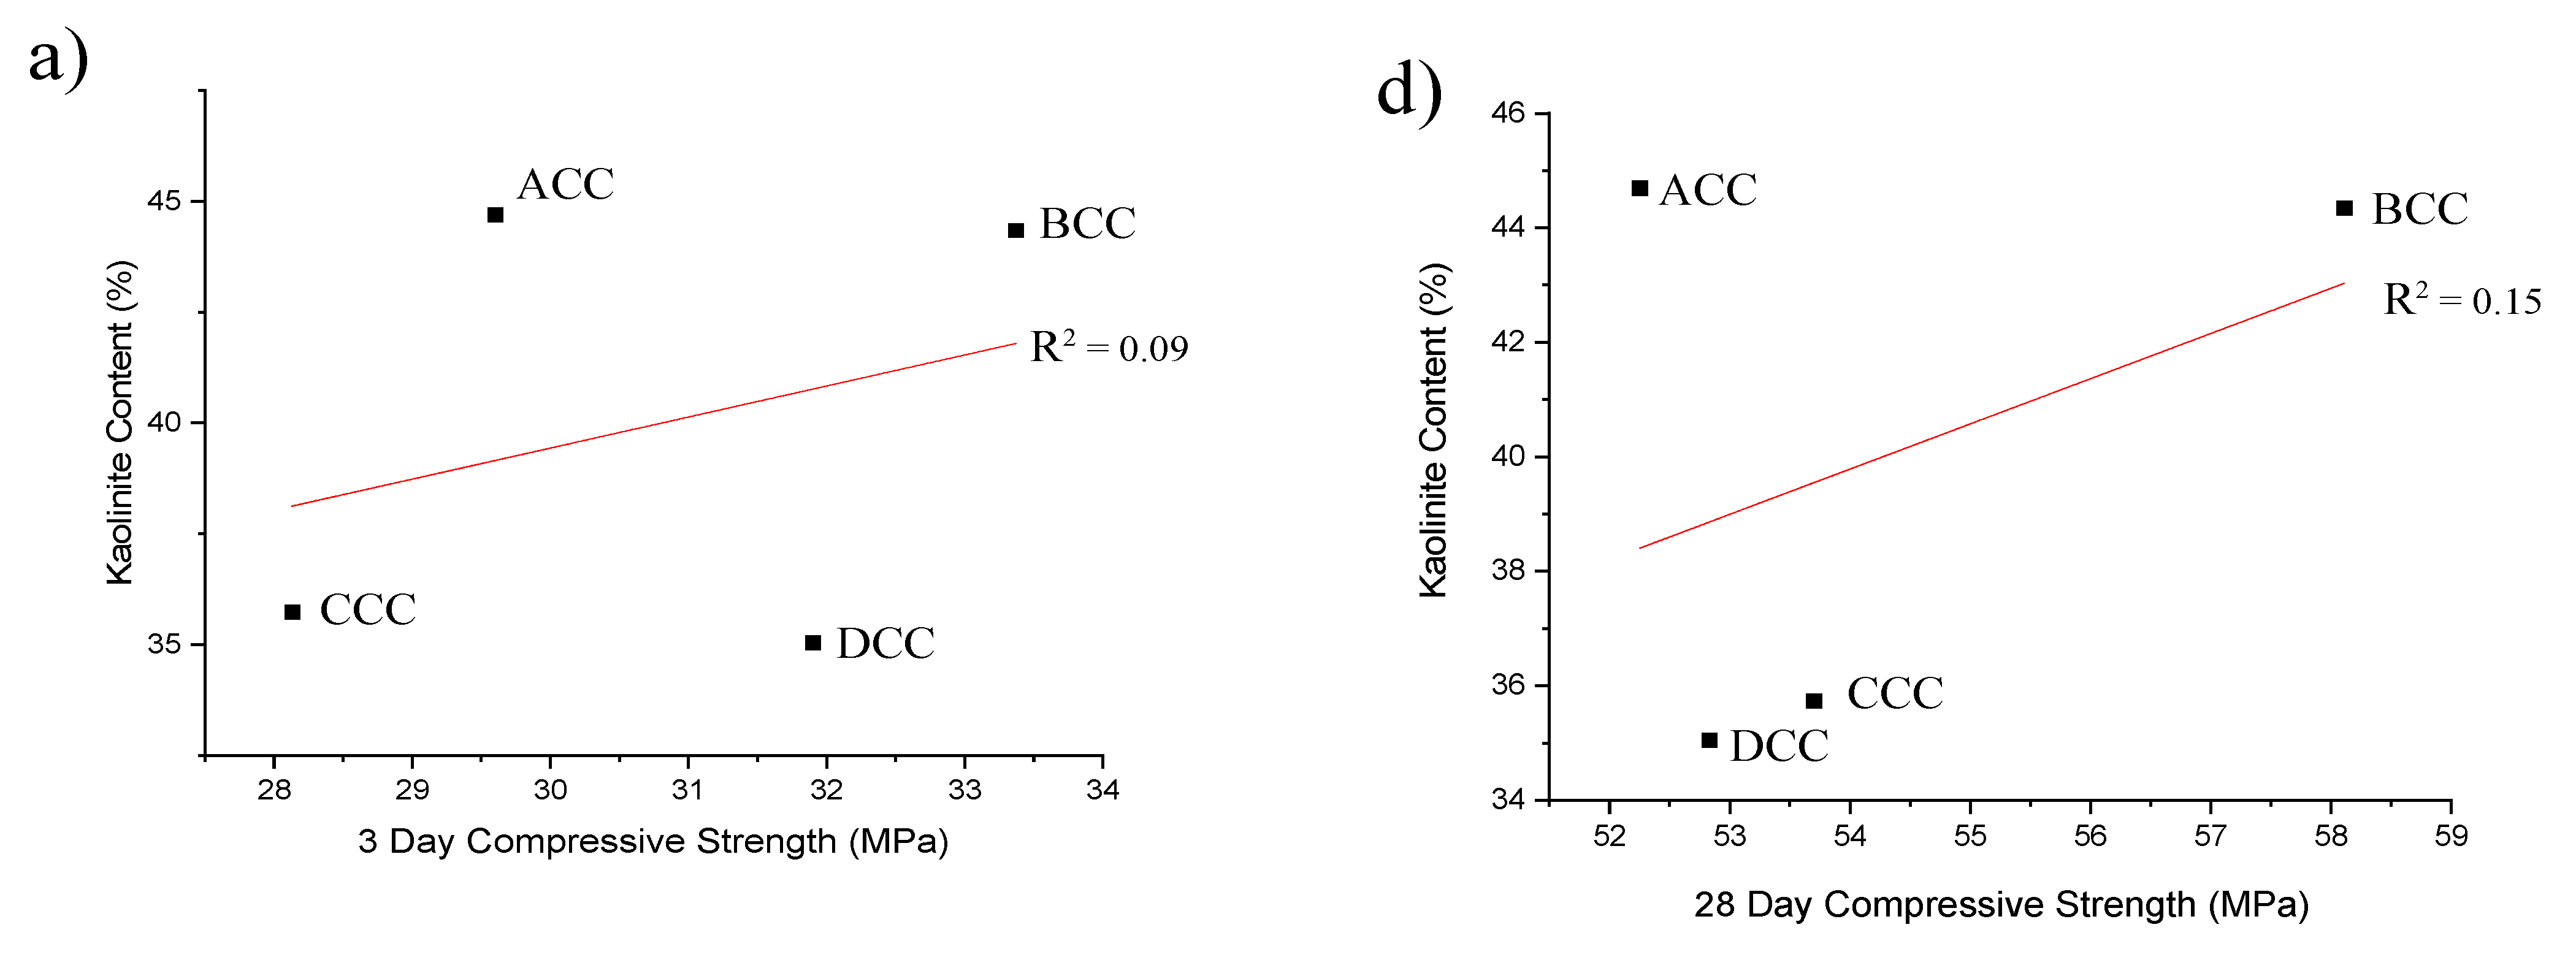
- Low-kaolinitic clays should not be disregarded, as other characteristics can compensate for the low kaolinite content. As an example, a kaolinite content around 35% would be suitable if the PSD is optimised and the surface area ranges between 15 and 35 m2/g after calcination.
- The Australian clays differed greatly between each other in terms of their characteristics. However, all the calcined clays in the application of LC3 with the optimised PSD outperformed both references of GP-R and FA-R at 28 and 90 days in terms of the mortar compressive strength and outperformed FA-R at all ages. The PSD of the calcined clays should be considered as a major contributing factor when understanding compressive strength results.
- The LC3 mortars were not as workable as the reference mixes. However, mortar mixes using calcined clays with an optimal PSD demonstrated improved flow characteristics while maintaining the same design water-to-binder ratio. Transitioning to a larger PSD and smaller surface area did contribute to a better mortar workability for all the calcined clay mixes, which can be improved further using superplasticisers.
Author Contributions
Funding
Institutional Review Board Statement
Informed Consent Statement
Data Availability Statement
Conflicts of Interest
Appendix A

References
- Lehne, J.; Preston, F. Making Concrete Change Cement; Chatham House: London, UK, 2018. [Google Scholar]
- Gagg, C.R. Cement and concrete as an engineering material: An historic appraisal and case study analysis. Eng. Fail. Anal. 2014, 40, 114–140. [Google Scholar]
- Bishnoi, S.; Maity, S. Limestone calcined clay cement: Opportunities and challenges. In Proceedings of the ICCCSC2019 Proceedings, Munich, Germany, 15–18 December 2019; p. 25. [Google Scholar]
- Siddique, R.; Khan, M.I. Fly Ash. In Supplementary Cementing Materials; Springer: Berlin/Heidelberg, Germany, 2011; pp. 1–66. [Google Scholar]
- Siddique, R.; Khan, M.I. Ground Granulated Blast Furnace Slag. In Supplementary Cementing Materials; Springer: Berlin/Heidelberg, Germany, 2011; pp. 121–173. [Google Scholar]
- Change, C. Barriers to Net-Zero Concrete—Fly Ash and GGBS Shortage. 2022. Available online: https://www.concrete4change.com/post/barriers-to-net-zero-concrete-fly-ash-and-ggbs-shortage (accessed on 23 October 2022).
- Malami, C.; Kaloidas, V.; Batis, G.; Kouloumbi, N. Carbonation and porosity of mortar specimens with pozzolanic and hydraulic cement admixtures. Cem. Concr. Res. 1994, 24, 1444–1454. [Google Scholar]
- Díaz, Y.C.; Berriel, S.S.; Heierli, U.; Favier, A.R.; Machado IR, S.; Scrivener, K.L.; Hernández, J.F.M.; Habert, G. Limestone calcined clay cement as a low-carbon solution to meet expanding cement demand in emerging economies. Dev. Eng. 2017, 2, 82–91. [Google Scholar]
- Frías, M.; de los Reyes, A.M.M.; Villar-Cociña, E.; García, R.; de la Villa, R.V.; Vasic, M.V. New Eco-Cements Made with Marabou Weed Biomass Ash. Materials 2024, 17, 5012. [Google Scholar] [CrossRef]
- Fernandez, R.; Martirena, F.; Scrivener, K.L. The origin of the pozzolanic activity of calcined clay minerals: A comparison between kaolinite, illite and montmorillonite. Cem. Concr. Res. 2011, 41, 113–122. [Google Scholar]
- Shvarzman, A.; Kovler, K.; Grader, G.; Shter, G. The effect of dehydroxylation/amorphization degree on pozzolanic activity of kaolinite. Cem. Concr. Res. 2003, 33, 405–416. [Google Scholar]
- Nguyen, Q.D.; Khan, M.S.H.; Castel, A. Engineering Properties of Limestone Calcined Clay Concrete. J. Adv. Concr. Technol. 2018, 16, 343–357. [Google Scholar]
- Tironi, A.; Scian, A.N.; Irassar, E.F. Blended Cements with Limestone Filler and Kaolinitic Calcined Clay: Filler and Pozzolanic Effects. J. Mater. Civ. Eng. 2017, 29, 04017116. [Google Scholar]
- Avet, F.; Li, X.; Scrivener, K. Determination of the amount of reacted metakaolin in calcined clay blends. Cem. Concr. Res. 2018, 106, 40–48. [Google Scholar]
- Akindahunsi, A.A.; Avet, F.; Scrivener, K. The Influence of some calcined clays from Nigeria as clinker substitute in cementitious systems. Case Stud. Constr. Mater. 2020, 13, e00443. [Google Scholar]
- Zunino, F.; Scrivener, K.L. Influence of Kaolinite Content, Limestone Particle Size and Mixture Design on Early-Age Properties of Limestone Calcined Clay Cements (LC3). In Proceedings of the ICCCSC2019 Proceedings, Munich, Germany, 15–18 December 2019; Volume 2. [Google Scholar]
- Navarrete, I.; Kurama, Y.; Escalona, N.; Lopez, M. Impact of physical and physicochemical properties of supplementary cementitious materials on structural build-up of cement-based pastes. Cem. Concr. Res. 2020, 130, 105994. [Google Scholar]
- Maier, M.; Sposito, R.; Beuntner, N.; Thienel, K.-C. Particle characteristics of calcined clays and limestone and their impact on early hydration and sulfate demand of blended cement. Cem. Concr. Res. 2022, 154, 106736. [Google Scholar]
- Snellings, R.; Reyes, R.A.; Hanein, T.; Irassar, E.F.; Kanavaris, F.; Maier, M.; Marsh, A.T.; Valentini, L.; Zunino, F.; Diaz, A.A. Paper of RILEM TC 282-CCL: Mineralogical characterization methods for clay resources intended for use as supplementary cementitious material. Mater. Struct. 2022, 55, 149. [Google Scholar]
- Avet, F.; Scrivener, K. Simple and Reliable Quantification of Kaolinite in Clay Using an Oven and a Balance. In Calcined Clays for Sustainable Concrete; RILEM Bookseries; Springer: Berlin/Heidelberg, Germany, 2020; pp. 147–156. [Google Scholar]
- Scrivener, K.; Snellings, R.; Lothenbach, B. A Practical Guide to Microstructural Analysis of Cementitious Materials; CRC Press: Boca Raton, FL, USA, 2015. [Google Scholar]
- EN196–1; Methods of Testing Cement in Part 1: Determination of Strength, European Committee for Standardization. Turkish Standards Institute: Ankara, Turkey, 2006.
- Nguyen, Q.D.; Afroz, S.; Castel, A. Influence of Calcined Clay Reactivity on the Mechanical Properties and Chloride Diffusion Resistance of Limestone Calcined Clay Cement (LC3) Concrete. J. Mar. Sci. Eng. 2020, 8, 301. [Google Scholar]
- Nguyen, Q.D.; Afroz, S.; Zhang, Y.; Kim, T.; Li, W.; Castel, A. Autogenous and total shrinkage of limestone calcined clay cement (LC3) concretes. Constr. Build. Mater. 2022, 314, 125720. [Google Scholar]
- ASTM C109/C109M; Standard Test Method for Compressive Strength of Hydraulic Cement Mortars (Using 2-in. or [50 mm] Cube Specimens. ASTM: West Conshohocken, PA, USA, 2021.
- ASTM C1437; Standard Test Method for Flow of Hydraulic Cement Mortar. ASTM: West Conshohocken, PA, USA, 2020.
- ASTM C305-20; Standard Practice for Mechanical Mixing of Hydraulic Cement Pastes and Mortars of Plastic Consistency. ASTM: West Conshohocken, PA, USA, 2020.
- ASTM C348-21; Standard Test Method for Flexural Strength of Hydraulic-Cement Mortars. ASTM: West Conshohocken, PA, USA, 2021.
- ASTM C-1698; Standard Test Method for Compressive Strength of Hydraulic-Cement Mortars (Using Portions of Prisms Broken in Flexure). ASTM: West Conshohocken, PA, USA, 2018.
- Wang, S.; Gainey, L.; Mackinnon, I.D.; Allen, C.; Gu, Y.; Xi, Y. Thermal behaviors of clay minerals as key components and additives for fired brick properties: A review. J. Build. Eng. 2023, 66, 105802. [Google Scholar]
- Alujas, A.; Fernández, R.; Quintana, R.; Scrivener, K.L.; Martirena, F. Pozzolanic reactivity of low grade kaolinitic clays: Influence of calcination temperature and impact of calcination products on OPC hydration. Appl. Clay Sci. 2015, 108, 94–101. [Google Scholar]
- Lorentz, B.; Shanahan, N.; Zayed, A. Rheological behavior & modeling of calcined kaolin-Portland cements. Constr. Build. Mater. 2021, 307, 124761. [Google Scholar]
- Avet, F.; Snellings, R.; Diaz, A.A.; Ben Haha, M.; Scrivener, K. Development of a new rapid, relevant and reliable (R3) test method to evaluate the pozzolanic reactivity of calcined kaolinitic clays. Cem. Concr. Res. 2016, 85, 1–11. [Google Scholar]
- Avet, F.; Scrivener, K. Investigation of the calcined kaolinite content on the hydration of Limestone Calcined Clay Cement (LC3). Cem. Concr. Res. 2018, 107, 124–135. [Google Scholar]


| Calcined Clay Name | Calcined Clay Sieved to 45 µm Characterisation | Calcined Clay at Optimal Milling Times | ||||||
|---|---|---|---|---|---|---|---|---|
| PSD (%) | BET Surface Area (m2/g) | PSD (%) | BET Surface Area (m2/g) | |||||
| 10 v (10% Passing the Below Micron (µm) | 50 v (50% Passing the Below Micron (µm) | 90 v (90% Passing the Below Micron (µm) | 10 v (10% Passing the Below Micron (µm) | 50 v (50% Passing the Below Micron (µm) | 90 v (90% Passing the Below Micron (µm) | |||
| ICC | 2.90 | 17.4 | 51.2 | 7.4 | 3.8 | 14.4 | 43.3 | 8.8 |
| FCC | 2.50 | 14.7 | 38.7 | 14.0 | 2.5 | 21.1 | 64.7 | 12.5 |
| ACC | 2.30 | 12.1 | 69.7 | 15.5 | 2.7 | 14.5 | 86.4 | 11.4 |
| BCC | 0.04 | 9.5 | 68.0 | 43.7 | 3.5 | 31.1 | 111.0 | 31.8 |
| CCC | 2.00 | 10.5 | 38.2 | 17.4 | 2.6 | 12.7 | 51.8 | 15.8 |
| DCC | 2.20 | 15.0 | 56.0 | 29.4 | 3.3 | 28.3 | 112.0 | 33.7 |
| Calcined Clay Used | Mix Name (Using 45 µm Clay) | Mix Name (Using Optimised PSD) | GP (g) | FA (g) | Limestone (g) | Calcined Clay (g) | Sand (g) |
|---|---|---|---|---|---|---|---|
| - | GP–R | - | 450 | - | - | - | 1350 |
| - | FA–R | - | 315 | 135 | - | - | 1350 |
| Commercial metakaolin (from India) | ICC | ICC–O | 315 | - | 45 | 90 | 1350 |
| Commercial metakaolin (from France) | FCC | FCC–O | 315 | - | 45 | 90 | 1350 |
| Site A | ACC | ACC–O | 315 | - | 45 | 90 | 1350 |
| Site B | BCC | BCC–O | 315 | - | 45 | 90 | 1350 |
| Site C | CCC | CCC–O | 315 | - | 45 | 90 | 1350 |
| Site D | DCC | DCC–O | 315 | - | 45 | 90 | 1350 |
| Phases | ICC | FCC | ACC | BCC | CCC | DCC |
|---|---|---|---|---|---|---|
| Amorphous (%) | 73.4 | 56.2 | 46.1 | 66.5 | 65.3 | 53.5 |
| Anatase (%) | 2.0 | - | - | - | - | - |
| Hematite (%) | 2.3 | 0.4 | - | 1.2 | - | - |
| Mullite (%) | 1.0 | 2.1 | - | - | - | |
| Quartz (%) | 15.2 | 20.3 | 17.1 | 2.6 | 24.7 | 14.2 |
| Illite (%) | - | - | 8.3 | - | 4.4 | - |
| Muscovite (%) | - | - | - | - | 9.3 | - |
| Sample | CaO | SiO2 | Al2O3 | Fe2O3 | SO3 | MgO | K2O | TiO2 | Na2O | P2O5 | Mn2O3 | LOI | Total + LOI | Moisture |
|---|---|---|---|---|---|---|---|---|---|---|---|---|---|---|
| ICC | 0.14 | 48.4 | 41.75 | 2.25 | 0.11 | 0.05 | 0.05 | 3.38 | 0.23 | 0.08 | 0.01 | 3.33 | 99.78 | 0.35 |
| FCC | 0.49 | 74.5 | 19.28 | 2.04 | 0.03 | 0.11 | 0.17 | 0.95 | 0.03 | 0.04 | 0.01 | 2.17 | 99.82 | 0.54 |
| ACC | 1.08 | 58.08 | 23.01 | 9.27 | 0.17 | 1.4 | 2.59 | 0.89 | 0.07 | 0.48 | 0.18 | 2.58 | 99.8 | 0.64 |
| BCC | 2.4 | 42.22 | 23.88 | 18.73 | 0.04 | 3.43 | 0.52 | 2.71 | 0.76 | 0.28 | 0.2 | 4.94 | 100.11 | 1.45 |
| CCC | 0.1 | 65.92 | 19.64 | 5.59 | 0.08 | 0.7 | 2.27 | 0.75 | 0.37 | 0.03 | 0.12 | 4.12 | 99.69 | 1.36 |
| DCC | 4.94 | 56.46 | 14.23 | 9.69 | 0.07 | 3.4 | 1.19 | 1.44 | 1.16 | 0.12 | 0.11 | 6.99 | 99.8 | 1.79 |
Disclaimer/Publisher’s Note: The statements, opinions and data contained in all publications are solely those of the individual author(s) and contributor(s) and not of MDPI and/or the editor(s). MDPI and/or the editor(s) disclaim responsibility for any injury to people or property resulting from any ideas, methods, instructions or products referred to in the content. |
© 2025 by the authors. Licensee MDPI, Basel, Switzerland. This article is an open access article distributed under the terms and conditions of the Creative Commons Attribution (CC BY) license (https://creativecommons.org/licenses/by/4.0/).
Share and Cite
Canda, E.; San Nicolas, R.; Rupasinghe, M.; Rasekh, H.; Castel, A. Investigating Australian Calcined Clays as Supplementary Cementitious Materials. Ceramics 2025, 8, 9. https://doi.org/10.3390/ceramics8010009
Canda E, San Nicolas R, Rupasinghe M, Rasekh H, Castel A. Investigating Australian Calcined Clays as Supplementary Cementitious Materials. Ceramics. 2025; 8(1):9. https://doi.org/10.3390/ceramics8010009
Chicago/Turabian StyleCanda, Emily, Rackel San Nicolas, Madhuwanthi Rupasinghe, Haleh Rasekh, and Arnaud Castel. 2025. "Investigating Australian Calcined Clays as Supplementary Cementitious Materials" Ceramics 8, no. 1: 9. https://doi.org/10.3390/ceramics8010009
APA StyleCanda, E., San Nicolas, R., Rupasinghe, M., Rasekh, H., & Castel, A. (2025). Investigating Australian Calcined Clays as Supplementary Cementitious Materials. Ceramics, 8(1), 9. https://doi.org/10.3390/ceramics8010009