Abstract
Magnesium alloys, despite having a number of attractive properties, encounter difficulties in clinical applications due to their rapid degradation rate in the physiological environment. In this work, a Bioglass (BG)-incorporated plasma electrolytic oxidation (PEO) coating was applied on the AZ31 Mg alloy to overcome this major limitation. PEO treatment was carried out in constant current mode with and without the addition of BG particles. The effects of BG particles on the coating’s morphology, composition, adhesion, electrochemical corrosion resistance and bioactivity were analyzed. SEM micrographs revealed that BG submicron particles were well adhered to the surface and the majority of them were entrapped in the micropores. Furthermore, the adhesion strength of the coated layer was adequate—a maximum value of 22.5 N was obtained via a micrometer scratch test. Potentiodynamic polarization (PDP) and electrochemical impedance spectroscopy (EIS) results revealed that the degradation rate of the Mg alloy was slowed down by up to 100 times, approximately. Moreover, the PEO–BG layer considerably enhanced the in vitro bioactivity of the Mg alloy in a simulated body fluid (SBF) environment; a prominent apatite layer was witnessed through SEM imaging. Consequently, the BG-incorporated PEO layer on Mg AZ31 alloy exhibited some promising outcomes and, therefore, can be considered for biomedical applications.
1. Introduction
Magnesium alloys have been a researcher hotspot for the last two to three decades due to their exceptional properties. As far as bone fixations or orthopedic implants are concerned, magnesium alloys have some excellent attributes (biodegradability, good biocompatibility and mechanical properties closer to bone) which make them suitable candidates for the biomedical industry. However, their fast degradation rate in the physiological environment limits them to being utilized as a biomaterial. Hence, magnesium-based devices are still not very viable commercially. Extensive research has been performed to overcome this limitation and several strategies have been adopted. Tailoring the composition and microstructure of Mg alloys is one of the approaches to countering the problem, but this is very challenging due to the lower solubility of several elements in Mg [1,2]. On the other hand, coating treatments to form a protective layer on Mg alloy surfaces have gained significant attention recently [3,4,5,6]. To form a protective layer against corrosion, there are numerous established coating techniques such as electroplating, sol–gel processes, anodizing, etc. [7,8]. Among them, plasma electrolytic oxidation (PEO) has emerged as a popular surface treatment. PEO, also known as microarc oxidation (MAO), is an environmentally friendly and economical technique that works on the principal of high-voltage plasma-assisted anodic oxidation [9,10]. PEO has been used extensively to improve the surface properties of magnesium alloys [3,11,12]. PEO is a complex electrochemical coating treatment; it involves higher voltages (above dielectric breakdown), which result in plasma discharges or microarcs. These discharges are responsible for partial fusion of the oxide layer, and eventually a very hard and adherent oxide layer is formed on the substrate. Generally, the PEO coating consists of two distinguished layers; the inner one is relatively thin but very dense. On the other hand, the outer layer is thicker and contains micron-sized porosities. It is believed that the inner layer provides the corrosion resistance while the outer porous layer offers considerable wear resistance [11,13]. Nonetheless, the presence of pores on the surface of Mg alloys can either be beneficial or undesirable. The porosity can serve as a reactive site during osteointegration; in contrast, it also facilitates the corrosive medium to penetrate through and deteriorate the implant [14,15].
Recently, particle-incorporated PEO has been explored as an effective strategy to develop more appropriate coatings [16,17]. Mostly, ceramic particles are incorporated into the electrolyte during the PEO process, such as Al2O3, TiO2, SiO2, ZrO2, CeO2, SiC, TiN, Si3N4, MoS2 and HAP [18,19,20,21,22,23,24,25,26,27]. It serves two purposes: firstly, it is useful in the sealing of pores. Secondly, it provides new functionalities to the coating. To enhance the biological properties of coatings, bioactive glass (BG)-incorporated PEO can be a brilliant combination.
Bioglass, introduced in the 1960s by Larry Hench [28], is today recognized as a highly recommended bioceramic material for numerous bone tissue engineering applications. Bioactive glasses have high surface reactivity, which ultimately accounts for their excellent bonding ability with host tissues (normally bones). In addition to this, BG’s dissolution in the physiological environment yields the soluble ions which stimulate and accelerate bone healing [29,30].
At present, there are several variants of BG available depending on the composition and constituent elements, like 45S5, S53P4, 70S30C, 13–93, etc. Amongst them, 58S BG (SiO2–CaO–P2O5 system) has shown better bioactivity (apatite formation ability) as compared to other BG compositions. Moreover, 58S BG has superior thermal behavior, as it shows very little crystallinity even at higher temperatures, which is certainly a desirable aspect [31,32,33].
To the best of the authors’ knowledge, the study of using BG particles as an additive in PEO coatings on Mg alloys has not been reported yet. Thus, in this study, 58S BG particles were synthesized and then incorporated as an additive in PEO coatings. Moreover, the crucial factors such as the coatings’ morphology, composition, adhesion, degradation rate and in vitro bioactivity have been evaluated.
2. Materials and Method
All the experiments carried out can be classified into the following three categories.
2.1. Bioactive Glass Particle Synthesis and Characterization
The precursors used for the preparation of 58S bioactive glass particles were tetraethyl orthosilicate (TEOS, 99%, Daejung Chemical & Metals Co., Ltd., Siheung, Republic of Korea), triethyl phosphate (TEP, 99%, Daejung Chemical & Metals Co., Ltd., Siheung, Republic of Korea), calcium nitrate tetrahydrate (Ca (NO3)2·4H2O, 99%, Daejung Chemical & Metals Co., Ltd. Siheung, Republic of Korea), nitric acid (HNO3, 69%, Merck, Darmstadt, Germany), ethanol 99% (Merck, Darmstadt, Germany) and ammonium hydroxide solution 99% (Merck, Darmstadt, Germany).
The sol–gel method was adapted to prepare 58S BG particles to synthesize 10 g of 58S BG powder. The stoichiometric quantities of chemicals and reagents used are mentioned in Table 1. Initially, TEOS, distilled water and 2M HNO3 were added to ethanol and stirred for 30 min at 25 °C. TEP was then added to the already prepared acid silica solution and stirred for 20 min. Calcium nitrate tetrahydrate was then added and stirred for 20 min. Finally, the gelling agent ammonia solution was added to the system drop by drop and at this moment stirring was kept quite rigorous in order to ensure proper mixing. The resultant obtained gel was kept in a dry oven at 80 °C for 24 h (to eliminate the moisture and alcohol) and then calcined at 550 °C (5 °C/min) for 2 h.

Table 1.
Chemicals and reagents used in the synthesis of 58S BG powder.
The average particle size obtained just after synthesis was 13.65 µm; therefore, the sample was milled (in dry condition) in a planetary ball mill with ZrO2 balls (balls-to-powder ratio 10:1) for 3 h to achieve the particle size in the sub-micron or nanometer range. After milling, the particle size of 58S BG powder was characterized by the Zetasizer Nano ZS (Malvern Instruments, Malvern, UK). Furthermore, Scanning Electron Microscopy (SEM) along with Energy Dispersive Spectrometry (EDS) analysis (Jeol JSM-IT-100, Jeol, Tokyo, Japan) was performed to evaluate the morphology and composition. X-ray diffraction analysis (Panalytical, X-Pert ProMPD, Malvern, UK) with Cu-Kα radiation (λ = 1.5418 Å) generated at 40 KV/30 mA, diffraction angle range of 10° to 80° with a step size of 0.025°) was also performed to investigate the phases present.
2.2. Preparation of Mg Alloy Substrate and Bioactive-Glass-Particles-Incorporated PEO Coating
AZ31 Mg alloy with dimensions 10 mm × 30 mm × 2 mm (purchased from Xi’an Yuechen Metal Products Co., Ltd., China) was used as the substrate material. The chemical composition of the alloy was 3.34 wt.% Al, 0.92 wt.% Zn, 0.30 wt.% Mn and Mg balance detected by WD-XRF (Malvern Panalytical Ltd., Malvern, UK). Prior to the PEO coating treatment, the samples were ground with SiC emery paper up to 1200 grit, rinsed with ethanol and distilled water and then finally air dried.
A 2000-Watt DC power supply (CHUX®, Yueqing, China) was employed to carry out the PEO coating process. The Mg alloy specimen and stainless steel (SS) container served as anode and cathode, respectively. The electrolyte used was based on an alkaline phosphate system, mainly composed of NaOH and Na2HPO4, whereas 58S BG particles were incorporated as an electrolyte additive. The concentration, pH, conductivity (Hanna HI9813-6) and zeta potential (Zetasizer Nano ZS, Malvern instrument, Malvern, UK) of the electrolyte solution and suspension (with BG particles) are given in Table 2.

Table 2.
Electrolyte concentration, pH, conductivity and zeta potential.
The PEO processes were carried out in the alkaline–phosphate electrolyte without and with the addition of 58S BG particles. The corresponding coatings are termed as pristine PEO (PPEO) and PEO–BG. A maximum voltage of 450 V was set for the process. Furthermore, the current density was limited to 50 mA/cm2 and 100 mA/cm2 with the help of the current-limiting option given in the power supply. Once the optimal voltage was achieved, the PEO process was continued for 10 min. Moreover, the electrolyte temperature was kept under control (around 30 °C) by keeping the SS container in a water bath. In addition to this, magnetic stirring (~200 rpm) was continuously provided to the system in order to ensure the proper dispersion of BG particles in the electrolyte. After the completion of the coating process, the samples were rinsed with distilled water and air dried at room temperature.
2.3. Coating Characterization
Coating morphology, composition and cross-sections of samples were examined through SEM with the EDS analyzer (Jeol JSM-IT-100, Jeol, Tokyo, Japan). An XRD (Panalytical, X-Pert ProMPD, Malvern, UK) was used to determine the phase composition of the oxide film. Furthermore, the adhesion strength of the coating was evaluated via a scratch tester (ST30, Teer-coatings Ltd., Worcestershire, UK) by following the guidelines of the ASTM Standard C1624-05 [34]. The Rockwell C spherical cone was used as an indenter with a tip radius of 0.2 mm and a cone angle of 120 degrees. The test was performed with a progressive load range of 1 N to 60 N with a load rate of 1 N/s and scratch speed of 3 mm/min. The resulting scratch was examined under an optical microscope. The critical load (LC2) of each coating was measured by the formula given in Equation (1) [35].
where LCN is the critical load in N, Lrate is the applied progressive loading rate in (N/m), IN is the distance between the start of the scratch and the initial point, Xrate is the horizontal displacement (mm/min) and Lstart is the minor contact load in N.
LCN = (Lrate + (IN/Xrate)) + Lstart
Furthermore, the corrosion/in vitro degradation behavior of samples was analyzed through potentiodynamic polarization (PDP) and electrochemical impedance spectroscopy (EIS) tests. The tests were carried out on the CS350 electrochemical workstation (Wuhan Corrtest Instruments Co., Ltd., Wuhan, China) in a simulated body fluid (SBF) solution. The SBF solution was prepared according to the guidelines defined by Kokubo and Takadama [36]. Moreover, a typical three-electrodes configuration was used, including Ag/AgCl as a reference electrode, a platinum wire as a counter electrode and coated/uncoated samples (exposed area of 3 cm2) as working electrodes. The open circuit potential (OCP) was run for 3600 s before every sample to achieve steady potential values. The PDP curve was measured from −500 mV to 500 mV with respect to OCP at a scan rate of 1 mV/s. The values of corrosion potential (Ecorr), corrosion current density (icorr) and corrosion rate (mm/year) were eventually calculated by the Tafel extrapolation method. Furthermore, the EIS studies were performed by applying 10 mV (rms) of sinusoidal potential with respect to OCP over the frequency range of 0.1 Hz to 100 kHz. All electrochemical tests were carried out in triplicate.
Finally, the in vitro bioactivity of coated samples was assessed by immersing them in SBF solution for 7 and 14 days at 37 °C. The pH of the SBF solution was settled at 7.40, the same as that of the human body and essential for apatite formation. Briefly, the coated samples were suspended in an airtight bottle (filled with SBF solution) with the help of nylon wire and placed in an incubator at 37 °C. The amount of SBF solution poured in the bottle was 75 mL for a sample with an average surface area of 750 mm2. To ensure homogeneous concentration, the SBF solution was replaced with a fresh one after every 48 h. Once the immersion time was complete, the samples were gently rinsed with distilled water and dried at 60 °C for 24 h. SEM and EDS analyses were performed to investigate the surface morphology and elements.
3. Results and Discussion
3.1. Characterization of Synthesized 58S BG Particles
Figure 1 shows the Scanning Electron Microscopy (SEM) images of synthesized 58S BG particles. A heterogeneous surface comprises randomly distributed microparticles in the range of 10–20 microns, as evident in Figure 1b. Although the particles had an irregular morphology, the majority of them were somewhat spherical. Furthermore, the EDS spectrum (as shown in Figure 1d) confirmed the presence of Si, Ca, P and O elements. The molar percentage of each oxide was also estimated through EDS analysis (as there was a provision of estimating oxide composition in the JEOL, JSM-IT100, InTouch Scope), considering the assumption that all the constituents were in oxide from (Table 3).
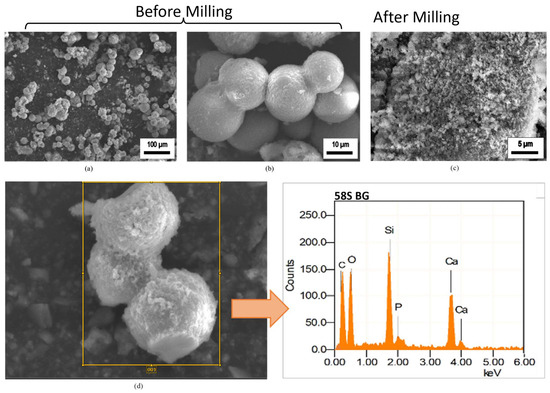
Figure 1.
SEM images of (a,b) synthesized BG particles (before milling), (c) BG particles after milling and (d) EDS analysis of milled BG particles.

Table 3.
Synthesized 58S BG composition.
Furthermore, the XRD pattern of synthesized 58S BG particles is shown in Figure 2. The absence of diffraction peaks indicates that the synthesized 58S BG powder was amorphous in nature [37]. Numerous researchers have reported that amorphous bioactive glass yields better in vitro bioactivity as compared to the crystalline one. Therefore, this result was considered desirable [37,38,39].
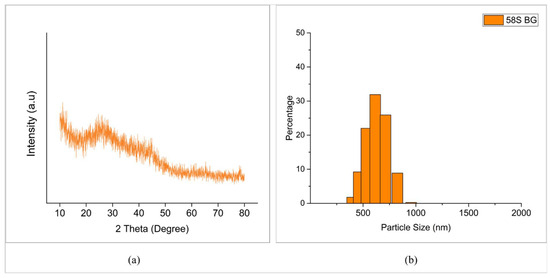
Figure 2.
(a) XRD pattern of synthesized 58S BG. (b) Particle size distribution of 58S BG powder (after milling).
In addition to this, the average particle size obtained after ball milling (Figure 1c) was around 623 nm (0.6 µm), which was almost 20 times reduced in comparison with what was synthesized (Figure 2b). In order to achieve better performance during PEO, most of the researchers have employed particles smaller than 10 μm [16]. The use of submicron and nanoparticles are also reported [40].
Moreover, the zeta potential of 58S BG particles suspension was found to be −20.2 mV. It is pertinent to mention that zeta potential is an important consideration when performing PEO with particle addition. There are two aspects: first, the higher value of zeta potential results in a higher degree of repulsion between the particles, which ultimately discourages the agglomeration and sedimentation of particles during PEO. Secondly, at a higher pH or in alkaline media, the value of zeta of the oxide particles is usually on the negative side, which is actually favorable in this work. This is due to the fact that the substrate is anodic, and this negative zeta potential will promote the mobility of particles towards the substrate [41,42].
3.2. Voltage–Time Response during PEO
Figure 3 shows voltage variation as a function of treatment time with and without 58S BG particles. The voltage–time curve constituted three distinct regions. Initially (~180 s), the voltage rose rapidly and linearly. At this stage, there were no noticeable sparks found; however, a passive and thin dielectric layer (the MgO oxide layer) was formed on the anodic surface. Certainly, this happened due to the evolution of oxygen molecules and hydroxyl ions from the water, which eventually adsorbed on the substrate (anode). Researchers have reported this stage as general anodization. Later, the voltage kept increasing, but at a lesser rate. At that point, numerous white sparks were generated all over the surface of metal. In the literature, this phenomenon is called spark anodization, which occurrs just at the breakdown voltage (the dielectric failure passive layer) [11]. The breakdown voltage (B/V) in PPEO was recorded at 275 volts, whereas in the case of PEO–BG, B/V was observed at 300 volts. PEO with BG particles needed more time and voltage to reach breakdown. This was due to the fact that the BG particles exhibited more resistivity and consequently the voltage was raised to compensate for the decreased current. During this phase, the voltage rate became steadier, and the intensity of the sparks increased with the passage of time. The sparking was observed until the critical voltage was reached (around 410 V). The final stage began, in which the appearance of the sparks was phenomenally changed. They were orange in color, lesser in quantity and much brighter than the previous ones. The voltage in this phase became almost constant and steady-state arcing took place; this stage is termed “microarc oxidation”. Hence, under the constant current density of 50 mA/cm3, the final voltage achieved in PEO coating with particle addition was greater, i.e., with PEO–BG-50 (465 V) in comparison with PPEO (450 V), confirming the lower resistance of the PPEO coating.
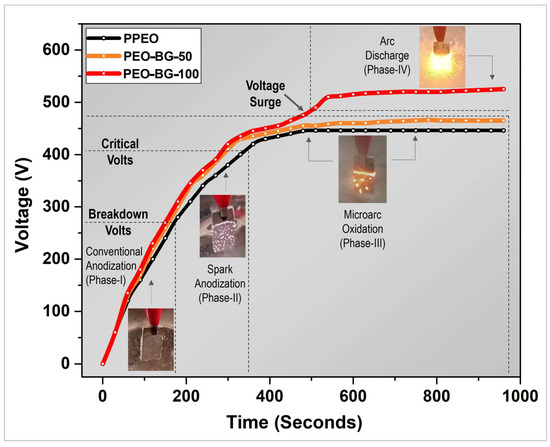
Figure 3.
Voltage–time response of PPEO, PEO–BG-50 and PEO–BG-100 coatings.
In conclusion, in this voltage–time plot, three phases were witnessed during the complete PEO cycle (Figure 3), namely: conventional anodizing, spark anodizing and microarc oxidation (for majority of the time). Beyond this voltage, “arc discharge” is the final and extreme phase of PEO. Thus, an attempt was made to perform the same coating process at higher voltages. In order to achieve higher voltages, the test was performed at a current density of 100 mA/cm2 instead of 50 mA/cm2. The electrolyte and BG particle concentrations were kept same; this coating was named PEO–BG-100. Interestingly, the final voltage recorded in this case was 520 ± 1 V; however, just above 470 ± 5 Volts, a strong surge in voltage was observed and severe arcing took place. Eventually, the orange arc covered the whole specimen (Figure 3), which caused deteriorating effects on the developed coating. After the completion of the coating process, the sample was inspected physically. The surface appeared to be rough and non-uniform (as shown in Figure 4). Hence, to avoid this detrimental effect, it is recommended to perform BG-incorporated PEO (using alkaline electrolytes) at a current density around 50 mA/cm2 and an applied voltage below 465 V.
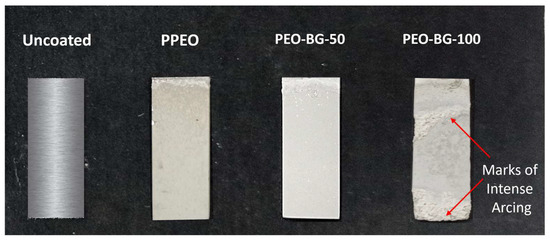
Figure 4.
Optical images of uncoated and coated samples (immersed part).
3.3. Coating Morphology and Composition
Figure 5a–i reveals the morphology of PEO coatings with and without 58S BG particles obtained from SEM imaging. In the case of PPEO, the surface appeared to have a characteristic “pancake-like” porous morphology, as generally obtained in PEO treatments [16]. The micropores were typically in the range of 1 to 5 microns, generated as a consequence of gas bubbles and molten metal escaping the microarc discharge channels [43]. Very few microcracks were also found on the surface, which were mainly due to the thermal stresses. No prominent difference was observed between PPEO and PEO–BG-50 coatings, except for the presence of submicron BG particles. The reason behind this similarity is the similar current and voltage values. The morphology (pore size and population) is strongly dependent on the conductivity of electrolytes [44]. Nonetheless, the PEO–BG-50 coating contained numerous BG particles; some were well adhered to the surface and others were entrapped in the porosities, sealing the porous pristine PEO layer to some extent. Furthermore, the micropores developed on the surface were isolated in nature, which is quite evident in the figures as well. In contrast, the PEO–BG-100 coating sample contained non-uniform interconnected porosities, possibly due to the intense arc discharge. The performance of the coating is strongly dependent on the nature of porosity, especially the degradation behavior of the coating. Researchers have reported that interconnected porosity causes the faster transfer of corrosive media towards the metal surface [45,46]. In contrast, the probability of such action is lower in the case of isolated pores. Furthermore, Figure 5c,f,j demonstrates the backscattered scanning electron (BSE) images of cross-sectioned PPEO and PEO–BG coatings. Both coatings (PPEO and PEO–BG-50) contained typical defects like pores and microcracks, although the defects were more dominant in the PPEO coating as compared to the particle-incorporated PEO–BG-50. The average coating thickness of the PPEO was noted around 12 ± 1 microns, whereas the PEO–BG coating was in the range of 13 ± 1 microns. The slight difference in the thickness was due to two possible reasons. First, the adhesion of BG particles; secondly, the final voltage achieved during the PEO–BG treatment was higher (465 V) as compared to the pristine PEO (450 V). The cross-section morphology of PEO–BG-100 was expectedly quite non-uniform with a high range of variation in thickness (10 ± 5 microns).
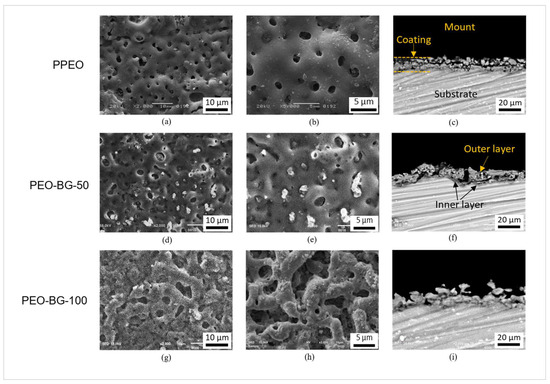
Figure 5.
(a,b) SEM images of PPEO surface morphologies, (d,e) PEO–BG-50 surface morphologies, (g,h) PEO–BG-100 surface morphologies, (c,f,i) backscattered SEM (BSEM) images of cross-sectioned morphologies.
The elemental composition of PPEO and PEO–BG-50 was evaluated by EDS analysis (as seen in Figure 6a,b). Since the composition of the coating is strongly dependent on electrolytes used, therefore, Mg, P and O were the dominant components of the coatings. The existence of a relatively small amount of Na suggested that cations were present in the electrolytes being incorporated into the discharge channels during PEO. The identification of Ca and Si elements in PEO–BG was a clear indication that BG particles had been successfully incorporated into the coating. Moreover, the XRD profiles of coated and uncoated samples are shown in Figure 7. All samples had identical magnesium peaks, indicating that X-rays penetrated into the substrate through the coated layer. It can be seen that MgO is the prominent phase in the PPEO coating formed due to the reaction of erupted molten metal and electrolytes (as discussed earlier). In addition, PEO–BG did not contain any peaks other than Mg, β Mg17Al12 and MgO, suggesting that the deposited BG layer is amorphous in nature. Recently, Lu et al. and Farag et al. have obtained similar kinds of amorphous coatings [20,47].
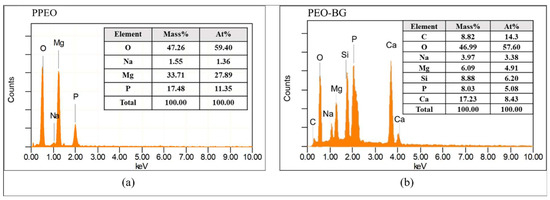
Figure 6.
EDS analysis of (a) PPEO and (b) PEO–BG-50 coatings.
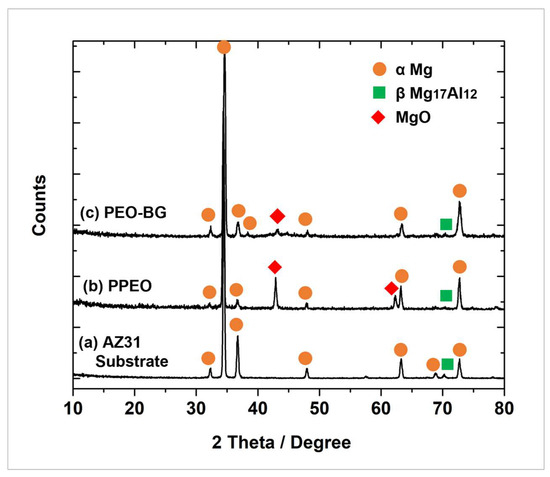
Figure 7.
XRD patterns of (a) AZ31 substrate, (b) PPEO, (c) PEO–BG.
3.4. Coating Adhesion and In Vitro Degradation Behavior
The coating’s adhesion strength was estimated by scratch testing. Figure 8 shows the optical micrographs of all the scratch tracks. By putting all the observations in Equation (1), the coating delamination or adhesive failure occurred at critical load (LC2) are enlisted in Table 4.
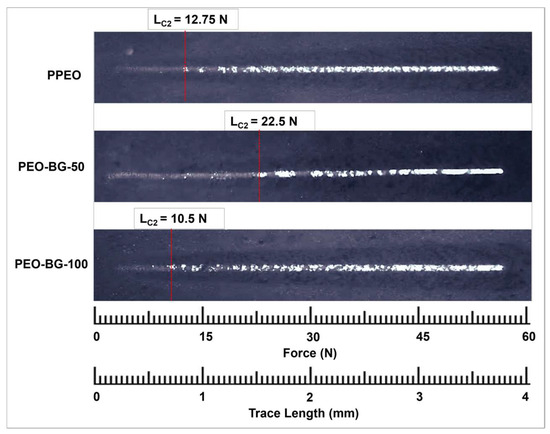
Figure 8.
The optical micrographs and critical loads of scratch tracks of all PEO coatings.

Table 4.
Failure/critical load (LC2) of all the scratch tracks.
As mentioned in Table 4, the measured critical load for the PPEO sample was 12.75 N, whereas the PEO–BG-50 sample had the highest LC2 value (22.5 N), possibly due to the more stable oxide layer. This particular adhesion value can be considered reasonable for their potential orthopedic applications [48,49,50]. However, the PEO–BG-100 samples had a comparatively lower LC2 value due to their non-uniform and rough surfaces. The adhesion strength of the coating is considered to be a very important characteristic, as it relates to the corrosion resistance and bioactivity response [50].
Figure 9 demonstrates the PDP curves of bare AZ31, PPEO-coated and PEO-with-BG-particles-coated samples tested in SBF solution. Important parameters like corrosion potential (Ecorr), corrosion current density (icorr) and corrosion rate CR (in mm/year) are mentioned in Table 5.
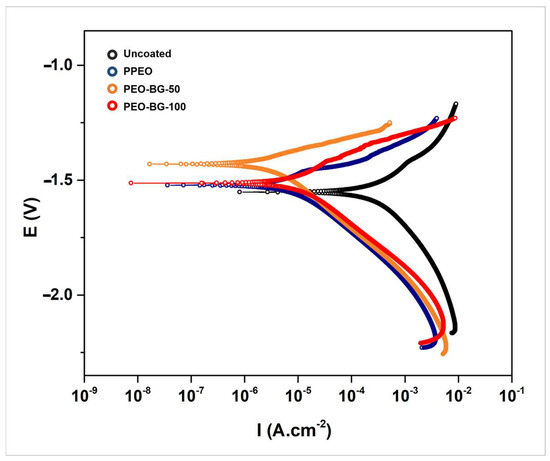
Figure 9.
Potentiodynamic behavior of the AZ31 substrate and PEO-coated samples.

Table 5.
Electrochemical parameters of bare AZ31 and PEO-coated samples.
PPEO- and PEO–BG-coated samples had lower corrosion current densities and higher current potential as compared to the uncoated AZ31 sample. It is firmly believed that a material with a higher Ecorr value is less prone to corrosion, whereas higher icorr values indicate poor corrosion resistance. Among all the coated samples, the PEO–BG-100 samples had relatively lower corrosion resistance (even slightly lower than PPEO). This is due to their large porosities and irregular surface morphology, which allowed the corrosive chloride media to attack the substrate more easily. However, PEO–BG-50 samples had relatively better numbers. Precisely, the icorr value of PEO–BG-50 was 1.79 × 10⁻⁶, which was lesser by two orders of magnitude as compared to the bare AZ31 and one half of the value of PPEO’s icorr. Similarly, the Ecorr value was also around 100 mV greater than the PPEO coating.
It is worth mentioning that the hard and stable ceramic layer is responsible for the better corrosion resistance of all PEO coatings. However, the role of porosities/discharge channels is very important. In PEO–BG-50’s case, a large number of porosities were sealed with the submicron BG particles, which inhibited the penetration of aggressive chloride ions into the coating and ultimately attributed to better resistance. The schematic diagram of the corrosion mechanism is demonstrated in Figure 10.
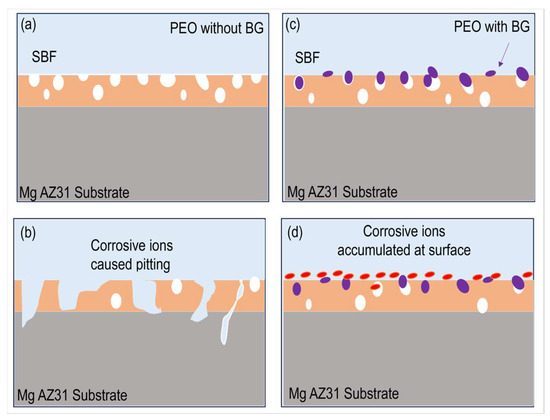
Figure 10.
The schematic diagram of the corrosion mechanism. (a,b) PEO coating without BG particles, the substrate is easily corroded. (c,d) PEO with BG particles on surface results in compact layer and better corrosion resistance.
To evaluate the corrosion performance further, EIS studies were conducted on all samples in SBF solution. Nyquist, bode impedance and bode phase graphs (Figure 11) were used to assess the corrosion resistance. In the Nyquist plots (as shown in Figure 11a), all samples generated a distorted capacitive arc with different diameters. It is generally understood that the arc diameter is directly related to the charge transfer resistance [51]. Therefore, the greater the diameter, the more resilient the material is. All coated samples had a greater diameter as compared to the uncoated one, indicating the improvement in corrosion resistance. Among them all, PEO–BG-50 had the largest diameter, followed by PPEO and PEO–BG-100. Furthermore, the bode plots (Figure 11b,c) showed the total impedance and phase angle at different frequencies. In general, impedance values |Z| at lower frequencies (f → 0) are utilized to assess corrosion resistance. A higher |Z|f→0 value indicates better corrosion resistance [20]. The total impedance |Z|f→0 of the uncoated sample was around 102 Ω·cm2, whereas the coated samples had |Z|f→0 values approximately in the range of 104 Ω·cm2. In terms of phase angles, the PEO–BG-50 possessed the most negative phase angle (~−67°) in the lower frequency range, signifying better corrosion resistance. In addition to this, flattening of curves was observed in the mid-frequency range, which indicates that coatings have a capacitive nature [52]. Among all the samples, PEO–BG-50 had a wider flattened region that shows the long-term stability of the material in the exposed solution [52].
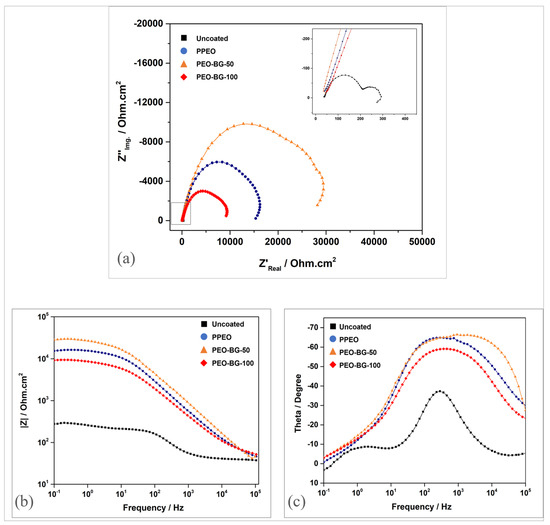
Figure 11.
(a) Nyquist plots. (b) Bode curves: frequency vs. impedance. (c) Bode curves: frequency vs. phase angle.
The equivalent circuits (ECs) (shown in Figure 12) were modelled and simulated using Zsimpwin software (version 3.20) to fit the EIS data. The ECs consist of “Rs” as solution resistance, “Ro” as outer or porous layer resistance, “Ri” as inner barrier layer resistance and “Rp” is representing charge transfer resistance or materials’ polarization resistance at the metal/electrolyte interface, whereas CPEo and CPEi (arranged parallel to Ro and Ri) represent constant phase elements for the outer and inner layers. Due to the inhomogeneity and rough surface, CPEs were utilized instead of pure capacitors. Cdl denotes the double-layer capacitance of the material. The impedance value of CPE can be estimated using Equation (2) [53].
where “ω” is the angular frequency and “Yo” and “n” are typical parameters of CPE.
ZCPE = YO−1 (iω)−n
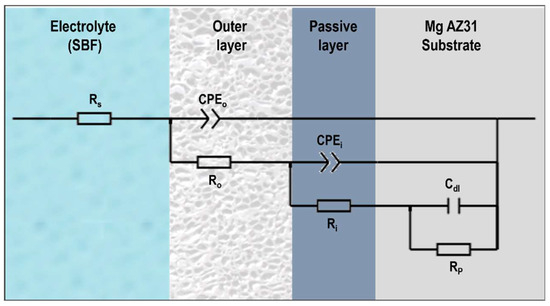
Figure 12.
Equivalent electric circuit for fitting EIS data.
Although CPE provides better results in curve fitting as compared to a capacitor, most of the researchers reported “Yo” as the magnitude of CPE having unit “Ω−1·cm−2·sn”. This unit does not give any clarity or physical means as capacitance does. In this regard, C. H. Hsu and F. Mansfeld suggested a conversion in order to obtain an equivalent effective capacitance; the equation is given below [53].
where ω″max is the frequency at the maximum imaginary impedance Z″.
Ceff = Yo(ω″max)n−1
The corresponding EIS data are represented in Table 6. The value of Rs is comparatively low because SBF is a conductive solution. The impedance results show that the cumulative resistance of all PEO-coated samples is considerably higher as compared to an uncoated one. The value of the inner barrier layer resistance Ri is somewhat similar in all coated samples. Furthermore, the magnitude of Ri is much higher as compared to Ro and Rp, signifying that the inner layer is highly stable and protective. The values of the outer layer resistance Ro are understandably lower, as it contains porosities/discharge channels which allow the corrosive media to penetrate. Importantly, when comparing the Ro value of PEO–BG-50 (8.539 kΩ·cm2) with PPEO (4.430 kΩ·cm2), the improvement is quite substantial. In fact, it suggests that BG particles minimize the overall porosities of outer layer, making it more compact and thus more resistive to the corrosive media.

Table 6.
EIS fitting data.
3.5. In Vitro Bioactivity Evaluation of Apatite Formation
The SBF immersion method is still a highly effective tool for predicting in vivo bone-bonding ability. The formation of a hydroxyapatite layer on the surface of the candidate implant is one of the key indicators that ultimately promotes bone-bonding capacity in the physiological environment [54,55].
Figure 13a–d shows the SEM images of PEO–BG-50 samples immersed in SBF for seven and fourteen days. A typical cauliflower-like apatite layer can be observed, which is a characteristic morphology for the apatite reported by many scientists [56,57]. Figure 13a,b specifically shows the progress of seven days of immersion: apatite particles or granules were spread all over the surface. Furthermore, EDS spectra confirmed the presence of Ca and P (with Ca/P ratio 1.54) along with a slight quantity of Mg, Si and Cl ions. Moreover, the apatite further matured in 14 days (Figure 13c,d), and a prominent and more populated layer developed. The presence of Ca and P content was confirmed by EDS results, but the Ca/P ratio (1.66) was more appropriate. The documented Ca/P ratio of hydroxyapatite (HAP) was 1.67 [58]. The main reason for the enhanced bioactivity is the presence of the BG layer on the substrate, which contains a high SiO2 content. SiO2 primarily promotes the reactivity between the surface and SBF environments and this leads to the formation of the HAP layer on the surface.
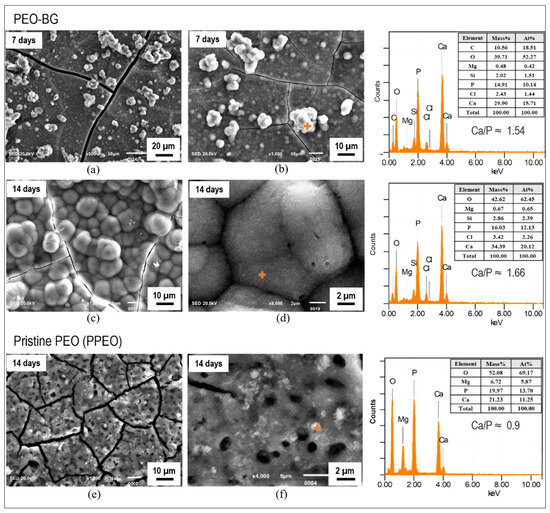
Figure 13.
SEM and EDS analyses of samples immersed in SBF. (a,b) 7 days PEO–BG. (c,d) 14 days PEO–BG. (e,f) 14 days PPEO.
Nevertheless, the PPEO-coated sample was also immersed in SBF for 14 days to access the behavior. However, there was no significant or noticeable layer found on the surface, indicating a lack of reactivity (Figure 13e,f). Although the EDS results revealed some presence of Ca and P content on the surface, the quantity (and also the Ca/P ratio~0.9) was not that significant.
4. Conclusions
In this work, particle-incorporated plasma electrolytic oxidation (PEO) treatment was performed on the Mg AZ31 alloy. The 58S BG particles were synthesized indigenously by the sol–gel method and used as an additive in the PEO treatment.
- BG particles considerably affected the coating’s microstructure and properties. During the PEO treatment, the negative zeta potential of the BG suspension caused electrophoretic mobility of the BG particles towards the anodic (Mg) substrate.
- Most of the BG submicron particles were entrapped in the discharge channels and open pores. This resulted in the sealing of porosity and a more compact surface.
- The developed coatings exhibited an appropriate adhesion strength. The coating delamination or adhesive failure occurred at 22.5 N (critical load). This particular adhesion value can be considered reasonable for their potential orthopedic applications.
- Furthermore, the PDP analysis revealed that the PEO–BG coating effectively slowed down the degradation rate of Mg alloys; corrosion rate and icorr values were significantly reduced (up to 100 times) in the SBF environment. Similarly, EIS studies indicated that overall impedance |Z| BG coated samples are far superior to conventional PPEO samples.
- The presence of BG particles in the coated surface apparently enhanced the in vitro bioactivity; a prominent apatite layer with typical cauliflower-like morphology was produced on the surface after 7 and 14 days of immersion in SBF. More importantly, the formed layers had an appropriate Ca to P ratio.
- Overall, the coating produced at current density 50 mA·cm−2 and 465 VDC yielded the best results. In conclusion, the BG-incorporated PEO coatings on Mg alloys produced some promising outcomes and can be considered an attractive candidate for biomedical applications.
Author Contributions
Conceptualization, F.H. and M.R.; methodology, S.A.U.; software, S.A.U.; investigation, S.A.U., F.H. and M.R.; resources; F.H. and M.R.; writing—original draft preparation, S.A.U.; review and editing, F.H. and M.R.; supervision, F.H. and M.R.; funding acquisition, F.H. and M.R. All authors have read and agreed to the published version of the manuscript.
Funding
This research is supported by NED University of Engineering and Technology, vide Office order No. Acad/50(48)/606, along with the National Research Program for Universities Grant of HEC Pakistan (Project No: 17058).
Data Availability Statement
The original contributions presented in the study are included in the article, further inquiries can be directed to the corresponding author/s.
Acknowledgments
The authors acknowledge the Materials Engineering Department of NED University of Engineering and Technology for providing the necessary research support and laboratory facilities to accomplish this work.
Conflicts of Interest
The authors declare no conflicts of interest.
References
- Hornberger, H.; Virtanen, S.; Boccaccini, A. Biomedical coatings on magnesium alloys—A review. Acta Biomater. 2012, 8, 2442–2455. [Google Scholar] [CrossRef] [PubMed]
- Yang, Y.; He, C.; E, D.; Yang, W.; Qi, F.; Xie, D.; Shen, L.; Peng, S.; Shuai, C. Mg bone implant: Features, developments and perspectives. Mater. Des. 2019, 185, 108259. [Google Scholar] [CrossRef]
- Narayanan, T.S.N.S.; Park, I.S.; Lee, M.H. Strategies to improve the corrosion resistance of microarc oxidation (MAO) coated magnesium alloys for degradable implants: Prospects and challenges. Prog. Mater. Sci. 2014, 60, 1–71. [Google Scholar] [CrossRef]
- Li, J.; Chen, J.; Siddiqui, M.A.; Kolawole, S.K.; Yang, Y.; Shen, Y.; Yang, J.; Wang, J.; Su, X. Enhancing Corrosion Resistance and Antibacterial Properties of ZK60 Magnesium Alloy Using Micro-Arc Oxidation Coating Containing Nano-Zinc Oxide. Acta Metall. Sin. (Engl. Lett.) 2024. [Google Scholar] [CrossRef]
- Yang, C.; Cui, S.; Fu, R.K.; Sheng, L.; Wen, M.; Xu, D.; Zhao, Y.; Zheng, Y.; Chu, P.K.; Wu, Z. Optimization of the in vitro biodegradability, cytocompatibility, and wear resistance of the AZ31B alloy by micro-arc oxidation coatings doped with zinc phosphate. J. Mater. Sci. Technol. 2024, 179, 224–239. [Google Scholar] [CrossRef]
- Yang, C.; Huang, J.; Cui, S.; Fu, R.; Sheng, L.; Xu, D.; Tian, X.; Zheng, Y.; Chu, P.K.; Wu, Z. NaF assisted preparation and the improved corrosion resistance of high content ZnO doped plasma electrolytic oxidation coating on AZ31B alloy. J. Magnes. Alloys 2023. [Google Scholar] [CrossRef]
- Galio, A.; Lamaka, S.; Zheludkevich, M.; Dick, L.; Müller, I.; Ferreira, M. Inhibitor-doped sol–gel coatings for corrosion protection of magnesium alloy AZ31. Surf. Coat. Technol. 2010, 204, 1479–1486. [Google Scholar] [CrossRef]
- Huo, H.; Li, Y.; Wang, F. Corrosion of AZ91D magnesium alloy with a chemical conversion coating and electroless nickel layer. Corros. Sci. 2003, 46, 1467–1477. [Google Scholar] [CrossRef]
- Lucas, R.R.; Marques, L.F.B.; Hein, L.R.d.O.; Botelho, E.C.; Mota, R.P. Experimental Design of the Adhesion between a PEI/Glass Fiber Composite and the AA1100 Aluminum Alloy with Oxide Coating Produced via Plasma Electrolytic Oxidation (PEO). Ceramics 2024, 7, 596–606. [Google Scholar] [CrossRef]
- Ropyak, L.; Shihab, T.; Velychkovych, A.; Bilinskyi, V.; Malinin, V.; Romaniv, M. Optimization of Plasma Electrolytic Oxidation Technological Parameters of Deformed Aluminum Alloy D16T in Flowing Electrolyte. Ceramics 2023, 6, 146–167. [Google Scholar] [CrossRef]
- Barati Darband, G.; Aliofkhazraei, M.; Hamghalam, P.; Valizade, N. Plasma electrolytic oxidation of magnesium and its alloys: Mechanism, properties and applications. J. Magnes. Alloys 2017, 5, 74–132. [Google Scholar] [CrossRef]
- Asad, R.; Uzair, S.A.; Mirza, E.H.; Rizwan, M.; Alias, R.; Chandio, A.D.; Hussain, F. Development of ceramic layer on magnesium and its alloys for bone implant applications using plasma electrolytic oxidation (PEO). J. Aust. Ceram. Soc. 2024, 1–20. [Google Scholar] [CrossRef]
- Hussein, R.; Nie, X.; O Northwood, D.; Yerokhin, A.; Matthews, A. Spectroscopic study of electrolytic plasma and discharging behaviour during the plasma electrolytic oxidation (PEO) process. J. Phys. D Appl. Phys. 2010, 43, 105203. [Google Scholar] [CrossRef]
- Li, J.; Zhang, Z.; Guo, Z.; Yang, Z.; Qian, W.; Chen, Y.; Li, H.; Zhao, Q.; Xing, Y.; Zhao, Y. Improved corrosion resistance of ZrO2/MgO coating for magnesium alloys by manipulating the pore structure. J. Mater. Res. Technol. 2023, 24, 2403–2415. [Google Scholar] [CrossRef]
- Lv, G.-H.; Chen, H.; Gu, W.-C.; Li, L.; Niu, E.-W.; Zhang, X.-H.; Yang, S.-Z. Effects of current frequency on the structural characteristics and corrosion property of ceramic coatings formed on magnesium alloy by PEO technology. J. Mater. Process. Technol. 2008, 208, 9–13. [Google Scholar] [CrossRef]
- Lu, X.; Mohedano, M.; Blawert, C.; Matykina, E.; Arrabal, R.; Kainer, K.U.; Zheludkevich, M.L. Plasma electrolytic oxidation coatings with particle additions—A review. Surf. Coat. Technol. 2016, 307, 1165–1182. [Google Scholar] [CrossRef]
- Fattah-Alhosseini, A.; Chaharmahali, R.; Babaei, K. Effect of particles addition to solution of plasma electrolytic oxidation (PEO) on the properties of PEO coatings formed on magnesium and its alloys: A review. J. Magnes. Alloys 2020, 8, 799–818. [Google Scholar] [CrossRef]
- Wang, Y.; Wei, D.; Yu, J.; Di, S. Effects of Al2O3 nano-additive on performance of micro-arc oxidation coatings formed on AZ91D Mg alloy. J. Mater. Sci. Technol. 2014, 30, 984–990. [Google Scholar] [CrossRef]
- Liang, J.; Hu, L.; Hao, J. Preparation and characterization of oxide films containing crystalline TiO2 on magnesium alloy by plasma electrolytic oxidation. Electrochim. Acta 2007, 52, 4836–4840. [Google Scholar] [CrossRef]
- Lu, X.; Blawert, C.; Huang, Y.; Ovri, H.; Zheludkevich, M.L.; Kainer, K.U. Plasma electrolytic oxidation coatings on Mg alloy with addition of SiO2 particles. Electrochim. Acta 2016, 187, 20–33. [Google Scholar] [CrossRef]
- Liu, F.; Shan, D.-Y.; Song, Y.-W.; Han, E.-H. Formation process of composite plasma electrolytic oxidation coating containing zirconium oxides on AM50 magnesium alloy. Trans. Nonferrous Met. Soc. China 2011, 21, 943–948. [Google Scholar] [CrossRef]
- Rehman, Z.U.; Uzair, M.; Lim, H.T.; Koo, B.H. Structural and electrochemical properties of the catalytic CeO2 nanoparticles-based PEO ceramic coatings on AZ91 Mg alloy. J. Alloys Compd. 2017, 726, 284–294. [Google Scholar] [CrossRef]
- Vatan, H.N.; Ebrahimi-Kahrizsangi, R.; Kasiri-Asgarani, M. Structural, tribological and electrochemical behavior of SiC nanocomposite oxide coatings fabricated by plasma electrolytic oxidation (PEO) on AZ31 magnesium alloy. J. Alloys Compd. 2016, 683, 241–255. [Google Scholar] [CrossRef]
- Mashtalyar, D.; Gnedenkov, S.; Sinebryukhov, S.; Imshinetskiy, I.; Puz’, A. Plasma electrolytic oxidation of the magnesium alloy MA8 in electrolytes containing TiN nanoparticles. J. Mater. Sci. Technol. 2017, 33, 461–468. [Google Scholar] [CrossRef]
- Lou, B.-S.; Lin, Y.-Y.; Tseng, C.-M.; Lu, Y.-C.; Duh, J.-G.; Lee, J.-W. Plasma electrolytic oxidation coatings on AZ31 magnesium alloys with Si3N4 nanoparticle additives. Surf. Coat. Technol. 2017, 332, 358–367. [Google Scholar] [CrossRef]
- Lou, B.-S.; Lee, J.-W.; Tseng, C.-M.; Lin, Y.-Y.; Yen, C.-A. Mechanical property and corrosion resistance evaluation of AZ31 magnesium alloys by plasma electrolytic oxidation treatment: Effect of MoS2 particle addition. Surf. Coat. Technol. 2018, 350, 813–822. [Google Scholar] [CrossRef]
- Gao, J.; Guan, S.; Chen, J.; Wang, L.; Zhu, S.; Hu, J.; Ren, Z. Fabrication and characterization of rod-like nano-hydroxyapatite on MAO coating supported on Mg–Zn–Ca alloy. Appl. Surf. Sci. 2011, 257, 2231–2237. [Google Scholar] [CrossRef]
- Hench, L.L. The story of Bioglass®. J. Mater. Sci. Mater. Med. 2006, 17, 967–978. [Google Scholar] [CrossRef]
- Jones, J.R. Review of bioactive glass: From Hench to hybrids. Acta Biomater. 2013, 9, 4457–4486. [Google Scholar] [CrossRef]
- Rizwan, M.; Hamdi, M.; Basirun, W.J. Bioglass® 45S5-based composites for bone tissue engineering and functional applications. J. Biomed. Mater. Res. Part A 2017, 105, 3197–3223. [Google Scholar] [CrossRef]
- Vuong, B.X.; Thanh, N.T.M. Synthesis and Characterization of a Highly Ordered Mesoporous Bio-glass. VNU J. Sci. Nat. Sci. Technol. 2020, 36, 57–63. [Google Scholar] [CrossRef]
- Panah, N.G.; Atkin, R.; Sercombe, T.B. Effect of low temperature crystallization on 58S bioactive glass sintering and compressive strength. Ceram. Int. 2021, 47, 30349–30357. [Google Scholar] [CrossRef]
- Oliveira, I.; Barbosa, A.; Santos, K.; Lança, M.; Lima, M.; Vieira, T.; Silva, J.; Borges, J. Properties of strontium-containing BG 58S produced by alkali-mediated sol-gel process. Ceram. Int. 2022, 48, 11456–11465. [Google Scholar] [CrossRef]
- ASTM C1624-05(2015)(Test Method): Standard Test Method for Adhesion Strength and Mechanical Failure Modes of Ceramic Coatings by Quantitative Single Point Scratch Testing. Available online: https://standards.iteh.ai/catalog/standards/sist/12314489-ba3b-49eb-a6f6-00ff9fd11c2a/astm-c1624-052015 (accessed on 27 August 2024).
- Sergici, A.O.; Randall, N.X. Scratch testing of coatings. Adv. Mater. Process. 2006, 164, 41–43. [Google Scholar]
- Kokubo, T.; Takadama, H. How useful is SBF in predicting in vivo bone bioactivity? Biomaterials 2006, 27, 2907–2915. [Google Scholar] [CrossRef]
- Chen, J.; Zeng, L.; Chen, X.; Liao, T.; Zheng, J. Preparation and characterization of bioactive glass tablets and evaluation of bioactivity and cytotoxicity in vitro. Bioact. Mater. 2017, 3, 315–321. [Google Scholar] [CrossRef]
- Boccaccini, A.R.; Chen, Q.; Lefebvre, L.; Gremillard, L.; Chevalier, J. Sintering, crystallisation and biodegradation behaviour of Bioglass®-derived glass–ceramics. Faraday Discuss. 2007, 136, 27–44. [Google Scholar] [CrossRef]
- Huang, K.; Cai, S.; Xu, G.; Ren, M.; Wang, X.; Zhang, R.; Niu, S.; Zhao, H. Sol–gel derived mesoporous 58S bioactive glass coatings on AZ31 magnesium alloy and in vitro degradation behavior. Surf. Coat. Technol. 2014, 240, 137–144. [Google Scholar] [CrossRef]
- Asgari, M.; Aliofkhazraei, M.; Darband, G.B.; Rouhaghdam, A.S. How nanoparticles and submicron particles adsorb inside coating during plasma electrolytic oxidation of magnesium? Surf. Coat. Technol. 2020, 383, 125252. [Google Scholar] [CrossRef]
- Doostmohammadi, A.; Monshi, A.; Salehi, R.; Fathi, M.H.; Golniya, Z.; Daniels, A.U. Bioactive glass nanoparticles with negative zeta potential. Ceram. Int. 2011, 37, 2311–2316. [Google Scholar] [CrossRef]
- Khanmohammadi, S.; Ojaghi-Ilkhchi, M.; Farrokhi-Rad, M. Evaluation of bioglass and hydroxyapatite based nanocomposite coatings obtained by electrophoretic deposition. Ceram. Int. 2020, 46, 26069–26077. [Google Scholar] [CrossRef]
- Sikdar, S.; Menezes, P.V.; Maccione, R.; Jacob, T.; Menezes, P.L. Plasma electrolytic oxidation (Peo) process—Processing, properties, and applications. Nanomaterials 2021, 11, 1375. [Google Scholar] [CrossRef] [PubMed]
- Hussein, R.O.; Northwood, D.O.; Nie, X. Processing-Microstructure Relationships in the Plasma Electrolytic Oxidation (PEO) Coating of a Magnesium Alloy. Mater. Sci. Appl. 2014, 5, 124–139. [Google Scholar] [CrossRef]
- Toulabifard, A.; Rahmati, M.; Raeissi, K.; Hakimizad, A.; Santamaria, M. The effect of electrolytic solution composition on the structure, corrosion, and wear resistance of PEO coatings on AZ31 magnesium alloy. Coatings 2020, 10, 937. [Google Scholar] [CrossRef]
- Chen, Z.; Ji, H.; Geng, X.; Chen, X.; Yong, X.; Zhang, S. 3-D distribution characteristics of the micro-defects in the PEO coating on ZM6 mg-alloy during corrosion. Corros. Sci. 2020, 174, 108821. [Google Scholar] [CrossRef]
- Farag, M.M.; Ahmed, H.Y.; Al-Rashidy, Z.M. Improving the Corrosion Resistance of Magnesium Alloy by Magnesium Phosphate/Glass Composite Coatings Using Sol–Gel Method. Silicon 2022, 15, 3841–3854. [Google Scholar] [CrossRef]
- Implants for Surgery-Hydroxyapatite-Part 4: Determination of Coating Adhesion Strength Implants Chirurgicaux-Hydroxyapatite-Partie 4: Détermination de la Résistance à L’adhésion du Revêtement Copyright Protected Document. 2018. Available online: www.iso.org (accessed on 27 August 2024).
- Rehman, M.A.U.; Ferraris, S.; Goldmann, W.H.; Perero, S.; Bastan, F.E.; Nawaz, Q.; di Confiengo, G.G.; Ferraris, M.; Boccaccini, A.R. Antibacterial and Bioactive Coatings Based on Radio Frequency Co-Sputtering of Silver Nanocluster-Silica Coatings on PEEK/Bioactive Glass Layers Obtained by Electrophoretic Deposition. ACS Appl. Mater. Interfaces 2017, 9, 32489–32497. [Google Scholar] [CrossRef]
- Yadav, V.; Sankar, M.; Pandey, L. Coating of bioactive glass on magnesium alloys to improve its degradation behavior: Interfacial aspects. J. Magnes. Alloys 2020, 8, 999–1015. [Google Scholar] [CrossRef]
- Song, D.; Hao, J.; Yang, F.; Chen, H.; Liang, N.; Wu, Y.; Zhang, J.; Ma, H.; Klu, E.E.; Gao, B.; et al. Corrosion behavior and mechanism of Cr–Mo alloyed steel: Role of ferrite/bainite duplex microstructure. J. Alloys Compd. 2019, 809, 151787. [Google Scholar] [CrossRef]
- Sorour, A.A.; Farooq, M.; Mekki, A.; Kumar, A.M. Corrosion of a Spark Plasma Sintered Fe-Cr-Mo-B-C Alloy in Hydrochloric Acid. Met. Microstruct. Anal. 2021, 10, 291–301. [Google Scholar] [CrossRef]
- Hsu, C.H.; Mansfeld, F. Concerning the Conversion of the Constant Phase Element Parameter Yo into a Capacitance. Corrosion 2001, 57, 747–748. [Google Scholar] [CrossRef]
- Rezwan, K.; Chen, Q.Z.; Blaker, J.J.; Boccaccini, A.R. Biodegradable and bioactive porous polymer/inorganic composite scaffolds for bone tissue engineering. Biomaterials 2006, 27, 3413–3431. [Google Scholar] [CrossRef] [PubMed]
- Chaharmahali, R.; Fattah-Alhosseini, A.; Esfahani, H. Plasma electrolyte oxidation of hydroxyapatite-containing coating on AZ31B Mg alloy: Effects of current density and duty cycle. J. Ultrafine Grained Nanostruct. Mater. 2021, 54, 149–162. [Google Scholar] [CrossRef]
- Rizwan, M.; Hamdi, M.; Basirun, W.; Kondoh, K.; Umeda, J. Low pressure spark plasma sintered hydroxyapatite and Bioglass® composite scaffolds for bone tissue repair. Ceram. Int. 2018, 44, 23052–23062. [Google Scholar] [CrossRef]
- Ansar, E.; Ravikumar, K.; Babu, S.S.; Fernandez, F.; Komath, M.; Basu, B.; Varma, P.H. Inducing apatite pre-layer on titanium surface through hydrothermal processing for osseointegration. Mater. Sci. Eng. C 2019, 105, 110019. [Google Scholar] [CrossRef]
- Dorozhkin, S.V. Bioceramics of calcium orthophosphates. Biomaterials 2010, 31, 1465–1485. [Google Scholar] [CrossRef]
Disclaimer/Publisher’s Note: The statements, opinions and data contained in all publications are solely those of the individual author(s) and contributor(s) and not of MDPI and/or the editor(s). MDPI and/or the editor(s) disclaim responsibility for any injury to people or property resulting from any ideas, methods, instructions or products referred to in the content. |
© 2024 by the authors. Licensee MDPI, Basel, Switzerland. This article is an open access article distributed under the terms and conditions of the Creative Commons Attribution (CC BY) license (https://creativecommons.org/licenses/by/4.0/).