Abstract
The ceramic Sr(NiNb)0.5O3, incorporating silver doping in the A site, was synthesized using a sol–gel route and subjected to comprehensive analysis through various experimental techniques. X-ray diffraction data analysis indicates a rhombohedral crystal structure. Scanning electron microscopy (SEM) examination reveals densely packed grains with minimal surface porosity. A thorough investigation of electrical properties, encompassing dielectric constant, loss tangent, electrical impedance, modulus, conductivity, etc., was conducted across a wide frequency range (103–106 Hz) and temperature range (260–340 K). This analysis provided valuable insights into structure–property relationships and conduction mechanisms. The discussion highlights the significance of interface effects, space charge polarization, and Maxwell–Wagner dielectric relaxation in achieving the material’s high dielectric constant at low frequencies and elevated temperatures. Examination of temperature dependence through Nyquist plots elucidates the contributions of grain behavior to the material’s resistive and capacitive properties. The dielectric permittivity, dissipation of energy, and electrical characteristics like impedance, modulus and conductivity are notably influenced by the frequency of the applied electric field and temperature. Overall, the material exhibits promising potential for industrial applications such as energy storage, given its intriguing properties.
1. Introduction
Electrical equipment plays a pivotal role in the storage of electrical energy. These materials find applications in various devices, such as capacitors, resonators, and switches, which are essential components in virtually all electrical devices [1,2]. The critical factors for designing compact and efficient devices are a high dielectric constant and a minimal dielectric loss (tan δ) [3]. Achieving these properties is a challenging endeavor, particularly in ensuring the consistency of performance across a wide range of operational conditions [4]. Among the materials garnering global recognition for their significance in advancing green technologies are perovskite nanoparticles [5]. Researchers worldwide have embraced them as a key breakthrough in scientific studies. Furthermore, numerous other perovskite materials have been introduced and investigated to enhance their fundamental properties or even introduce novel ones. Perovskite materials have found applications in diverse fields, serving as electrolytes or electrode materials in solid oxide fuel cells (SOFCs) [5,6], which are highly efficient devices for clean energy conversion. They also play a role in oxygen sensors and exhibit promise as catalysts for various chemical reactions [7]. Their unique electronic properties render them attractive for catalytic processes in the chemical industry [8,9,10,11,12]. In recent years, perovskite oxides have garnered significant attention due to their extraordinary properties and their wide range of potential applications in the field of materials science and technology [13,14]. One such notable perovskite is Strontium Niobate (SrNbO3), renowned for its intriguing electrical conductivity characteristics and distinctive behavior in impedance spectroscopy.
Furthermore, SrNbO3 is a complex oxide characterized by its perovskite structure, showcasing intriguing electrical properties. The electrical conductivity of this material is intricately linked to its stoichiometry, crystal structure, and defect concentration. It is recognized as a mixed ionic and electronic conductor (MIEC) with the capacity to transport both oxygen ions and electrons. This dual conduction mechanism allows for precise tuning of its electrical conductivity through various methods, including doping with different elements, adjusting the oxygen partial pressure, or modifying the crystal structure. Such versatility positions SrNbO3 as a highly promising candidate for a multitude of applications, particularly in solid oxide fuel cells (SOFCs), oxygen sensors, and other electrochemical devices [15,16,17,18,19,20,21,22]. Impedance spectroscopy emerges as a potent technique for delving into the electrical properties of materials. When applied to SrNbO3, impedance spectroscopy grants valuable insights into its electrical and ionic conductivity, elucidates charge transfer processes, and unveils the nature of defects within the material. By scrutinizing impedance spectra, researchers can deepen their comprehension of how the material behaves under varying operational conditions. Such knowledge is pivotal for optimizing the performance of devices based on SrNbO3, such as solid oxide fuel cells, and for customizing the material to suit specific industrial applications. In this study, (Sr0.75Ag0.25)(NiNb)0.5O3 was meticulously prepared, and a comprehensive analysis of its structure, dielectric properties, and electrical behavior was undertaken. This investigation serves to enhance our understanding of the behavior of perovskite nanoparticles and paves the way for future applications in a multitude of relevant fields.
2. Materials and Methods
The (Sr0.75Ag0.25)(NiNb)0.5O3 perovskite nanoparticles were synthesized using the sol–gel method, as depicted in Figure 1. Precisely measured quantities of high-purity strontium nitrate (Sr(NO3)2) (Sigma-Aldrich, 99.9%), silver nitrate (AgNO3) (Merck, 99.8%), nickel nitrate (Ni(NO3)2) (Alfa Aesar, 99.9%), and niobium nitrate (NbO(NO3)3) (Sigma-Aldrich, 99.99%) were combined in the specified molar ratios to match the molecular formula of the prepared sample: 0.75 mol of Sr(NO3)2, 0.25 mol of AgNO3, 0.5 mol of Ni(NO3)2, and 0.5 mol of NbO(NO3)3. The raw materials were sourced as follows: strontium nitrate (Sr(NO3)2) from Sigma-Aldrich, St. Louis, MO, USA; silver nitrate (AgNO3) from Merck, Darmstadt, Germany; nickel nitrate (Ni(NO3)2) from Alfa Aesar, Haverhill, MA, USA; and niobium nitrate (NbO(NO3)3) from Sigma-Aldrich, St. Louis, MO, USA. These nitrates were dissolved in distilled water under thermal stirring at 80 °C, with the subsequent addition of citric acid, serving as a complexation agent for the various metal cations. The pH of the solution was carefully adjusted to approximately 7 by introducing ammonia. Following this step, ethylene glycol was introduced as a polymerization agent. After about 5 h, the formation of a viscous liquid gel became evident. This gel was then subjected to drying in an oven at 300 °C for 4 h. The resulting precursor was subsequently processed through several cycles of grinding, pelleting, and sintering. Finally, the well-defined structure of the sample was achieved through heat treatment at 1100 °C for duration of 24 h. X-ray diffraction (XRD) patterns were recorded utilizing the “Panalytical X’Pert Pro System, a two-circle automatic diffractometer operating at a copper wavelength (λ = 1.5406 Å). A Nickel filter was employed to eliminate the Kβ ray. The measurements were conducted in Bragg–Brentano geometry, with a divergent beam, employing a step size of 0.017° and a counting time of 18 s per step within an angular range spanning from 10 to 70 degrees (10 ≤ 2θ ≤ 80°). Structural analysis was performed using the Rietveld method with the FullProf software [23]. The sample’s morphology was examined in its pellet form using scanning electron microscopy (SEM) through a Philips XL 30 microscope. This microscope was equipped with an electron gun operating at an accelerating voltage of 15 kV. For electrical characterizations, a sample in the shape of a disk, with a diameter of 11.3 mm and a thickness of approximately 1.58 mm, was utilized. Measurements were conducted using an N4L-NumetriQ analyzer (model PSM1735) across a range of different temperatures and frequencies, spanning from 100 Hz to 1 MHz.
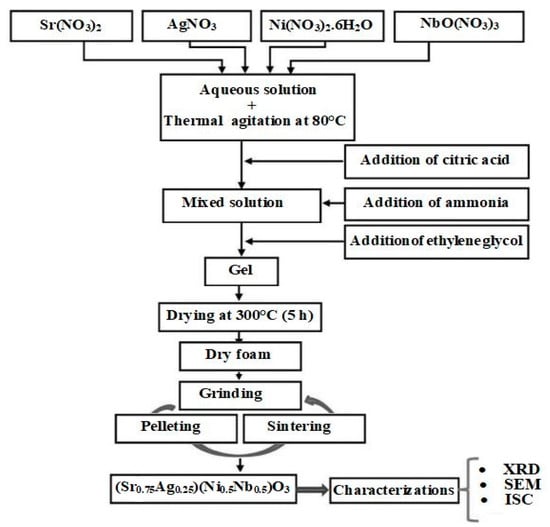
Figure 1.
Synthesis process of (Sr0.75Ag0.25)(NiNb)0.5O3 perovskite through the sol–gel method. SEM, XRD, and ISC stand for scanning electron microscopy, X-ray diffraction, and impedance spectroscopy complex, respectively.
3. Results and Discussion
3.1. Phase Structure and Microstructure
The X-ray diffraction (XRD) pattern for (Sr0.75Ag0.25)(NiNb)0.5O3 perovskite is shown in Figure 2, revealing a distinct crystalline structure characterized primarily by the perovskite phase. For the Rietveld refinement analysis, the crystallographic data were processed using the International Centre for Diffraction Data (ICDD) database card number ICDD 01-073-8912. This card number corresponds to a relevant structure with compositional elements similar to those in our (Sr0.75Ag0.25)(NiNb)0.5O3 perovskite, ensuring accurate refinement of the material’s crystal structure parameters. This choice facilitated precise determination and validation of the perovskite phase observed in the XRD pattern. The refinement process confirmed the structural integrity and composition of our synthesized material, supporting its characterization for further study in advanced energy storage applications. The diffraction peaks of this perovskite were successfully identified and matched with the RC trigonal symmetry. The refined cell parameters for this crystal structure were determined to be a = b = 5.5859 (1) Å, c = 13.4263 (2) Å, with α = 90°, β = 90°, and γ = 120°. The calculated unit cell volume was found to be V = 351.25 (1) Å3. The reliability factors obtained from the Rietveld refinement process are as follows: the profile factor Rp (%) = 5.91, the weighted profile factor Rwp (%) = 5.48, the structure factor RF (%) = 3.42, and the goodness of fit χ2 (%) = 1.44 [24]. Ag+ ions, when doped into the Sr(NiMn)0.5O3 lattice, introduce additional charge carriers. This increase in carrier concentration is primarily due to the substitution of Sr2+ ions by Ag+ ions, which can create oxygen vacancies and enhance the mobility of charge carriers. These values align well with the existing literature, suggesting that the refined crystallographic parameters are accurate. Additionally, the average grain size of the material was estimated using the XRD peaks and the Scherer formula [25]. These values align well with the existing literature, suggesting that the refined crystallographic parameters are accurate. Additionally, the average grain size of the material was estimated using the XRD peaks and the Scherer formula [26].
where D is the average grain size, K is a dimensionless shape factor, typically assumed to be around 0.89, λ is the X-ray wavelength, β is the corrected full-width half-maxima (FWHM) of the XRD peaks and θ is the Bragg angle. With the given values, including the X-ray wavelength (λ), the corrected FWHM (β), and the Bragg angle (θ), the estimated average grain size of 38 nm was determined. This grain size estimation is useful in characterizing the crystal structure and properties of the material.
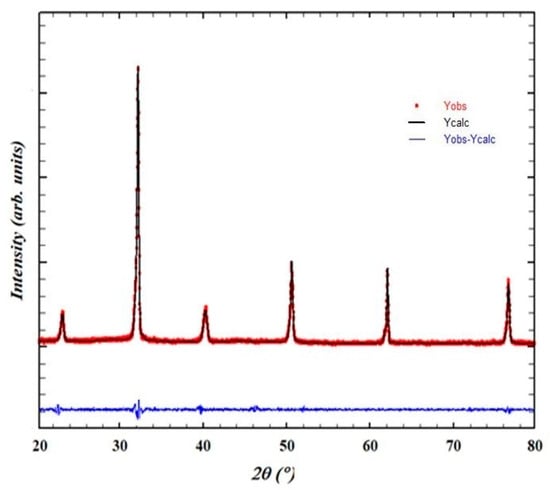
Figure 2.
XRD pattern of of (Sr0.75Ag0.25)(NiNb)0.5O3 ceramic.
In Figure 3a, the scanning electron microscopy (SEM) image reveals a uniform morphology with no discernible chemical contrast among the crystalline grains. This observation serves to confirm the absence of any secondary phases outside the perovskite phase in the prepared compound. Notably, this micrograph also indicates that the sample comprises small particles, with an average size of DMEB (Diameter by Mean Equivalent Breadth) measuring approximately 175 nanometers. This average size is notably larger than the value determined from the X-ray diffraction (XRD) pattern. It is important to note that each particle analyzed through SEM is composed of a multitude of much smaller grains. As X-rays used in XRD have a considerably higher resolution compared to SEM, the grain sizes estimated from XRD appear significantly smaller than those obtained from SEM. Furthermore, in Figure 3b, the energy dispersive X-ray (EDX) spectroscopy of the sample is presented. The spectrum clearly indicates the presence of all the elements involved in the preparation process with no discernible impurities. This observation underscores the purity of the prepared material. Based on the EDX quantification results, the atomic percentages of the elements in the (Sr0.75Ag0.25)(NiNb)0.5O3 perovskite nanoparticles are as follows: strontium (Sr) constitutes 38.0%, silver (Ag) is 25.1%, nickel (Ni) accounts for 18.5%, and niobium (Nb) makes up 18.4%, with oxygen (O) adjusted for balance. These results confirm the intended composition and doping levels of the synthesized material.
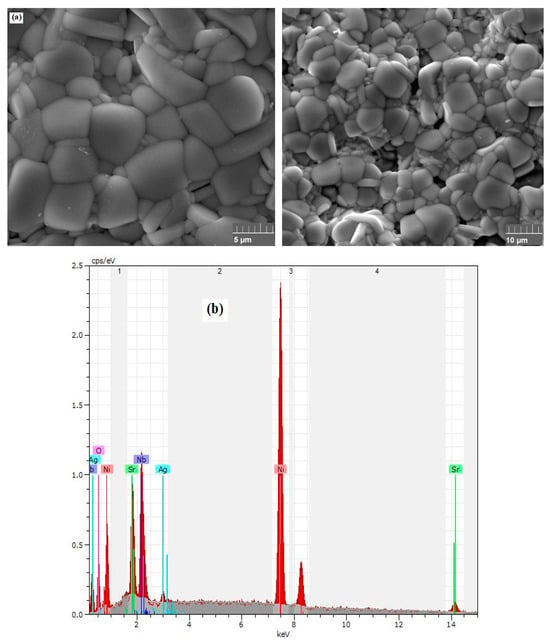
Figure 3.
(a) SEM micrograph and (b) EDX compositions of the sample.
3.2. Impact of Frequency on Dielectric Parameters
Using geometric and physical parameters such as area (S), thickness (e), and capacitance (C) of the sample in a straightforward expression ε = Ce/ε0S, one can calculate the dielectric constant ε or permittivity of the sample. Figure 4 illustrates the effect of frequency on dielectric parameters, including (a) permittivity (ε) and (b) tangent loss (tan δ), within the frequency at selected temperatures. Initially, the value of ε smoothly decreases with the rise in frequency, eventually stabilizing at higher frequencies, indicating saturation. This trend persists across all temperatures. In the low-frequency region, various types of polarization typically occur, resulting in higher relative permittivity [27]. A decrease in dielectric constant with increasing frequency is expected in nearly all insulators due to relaxation processes within the material. As frequency increases, the total polarization of the material decreases because the mechanisms contributing to polarization become less effective, consequently reducing permittivity. The temperature and frequency dependence of dielectric loss or dissipation factor exhibit a similar behavior to the dielectric constant. This behavior aligns with the Maxwell and Wagner two-layer model, which is based on Koop’s phenomenological theory. According to this model, the dielectric structure of the material consists of two layers: conducting grains and insulating grain boundaries [28]. At lower frequencies, electrons as charge carriers are more active at grain boundaries, whereas at higher frequencies, electrons primarily interact with conducting grains [29]. At low frequencies, electrons require more energy for motion due to the higher resistance of grain boundaries, resulting in a larger dissipation factor (tan δ) at high temperatures. Conversely, at high frequencies, electrons require less energy for motion due to lower resistance, leading to a smaller dissipation factor within the specified temperature range. The loss factor is significant for device quality as it describes the energy dissipation in insulators. A low tangent loss is desirable to ensure minimal power loss for an effective dielectric material [30].
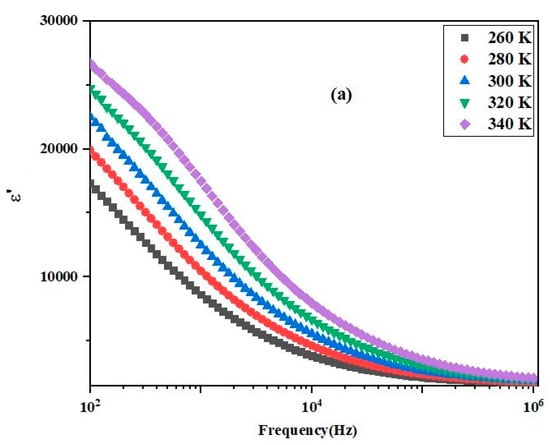
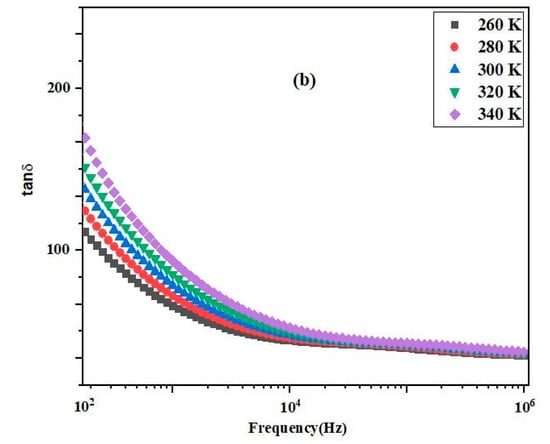
Figure 4.
Frequency dependence of (a) and (b) tan δ of (Sr0.75Ag0.25)(NiNb)0.5O3 ceramic for various temperatures.
3.3. Variation of Dielectric Properties with Temperature
Figure 5a illustrates the impact of temperature and frequency on the insulating (permittivity) properties of the material under investigation. It is observed that the dielectric parameters of the material remain unaffected by frequency and temperature, indicating the significant role of electronic and/or ionic polarization [31]. The dielectric permittivity (dielectric constant) experiences a notable increase with temperature elevation. This characteristic variation in the dielectric parameters can be attributed to the scattering of temperature-dependent charge carriers and/or defects/impurities present in the sample [32]. In Figure 5b, the temperature dependence of tan δ at a selected frequency of the AC electric field is elucidated. The trend in the variation of tan δ with temperature mirrors that of ε. Tan δ increases with temperature escalation and exhibits a sharp rise at higher temperatures. This abrupt increase is heavily influenced by electrical conductivity [33].
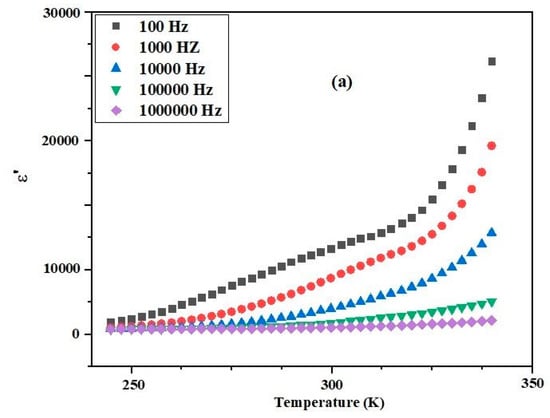
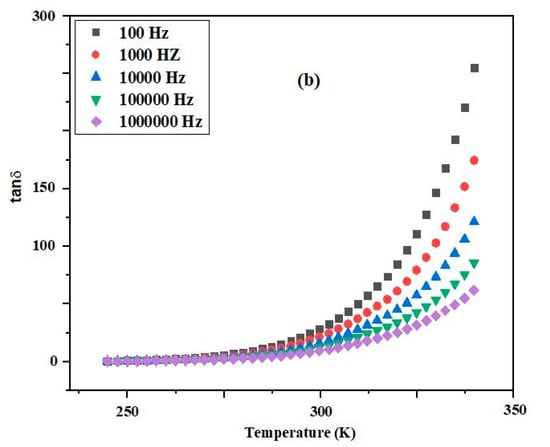
Figure 5.
Temperature dependence of (a) and (b) tan δ of (Sr0.75Ag0.25)(NiNb)0.5O3 ceramic for various frequencies.
3.4. Impedance Spectroscopy
The electrical characteristics of electro-ceramics and ionic conductors, encompassing impedance across grain boundaries and electrodes, can undergo assessment utilizing a non-invasive complex impedance approach. This method stands as a reliable means of characterizing these materials, providing insights into both the tangible (resistive) and abstract (reactive) elements of complex impedance. Spectroscopy enables the determination of impedance and elastic modulus, along with the extraction of various associated parameters. By subjecting the sample to an alternating current (AC) electric field, a sinusoidal disturbance is initiated, facilitating the examination of these characteristics across different frequencies and temperatures [34,35,36,37]. Typically, the frequency-dependent behavior of dielectric properties in materials is elucidated through complex capacitive and impedance parameters, which are articulated as follows: complex dielectric constant, complex impedance, electric modulus and dielectric loss.
ε* = ε′ − j ε′
Z* = Z′ − jZ″ = Rs + j (ωLs − 1/ωCs)
M* = M′ + j M″ = j ωC0 Z*
tan δ = ε′/ε″
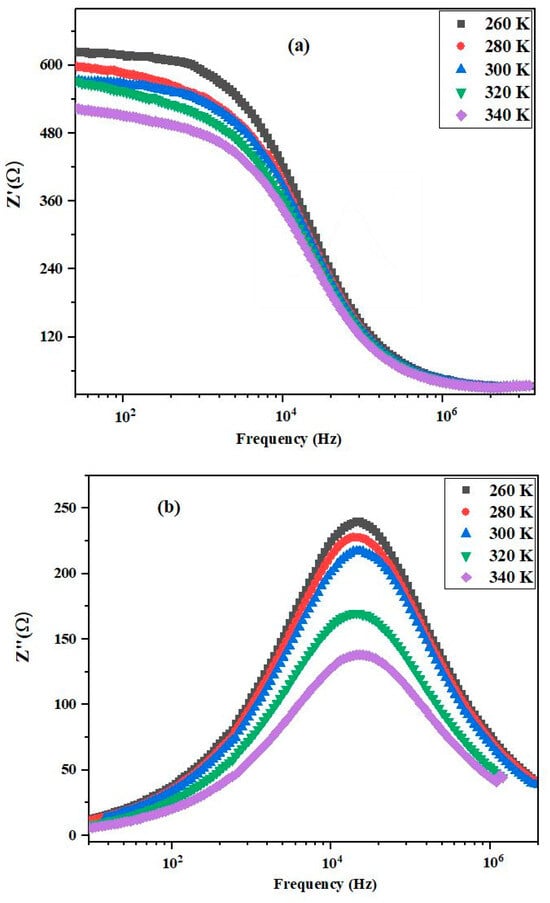
Figure 6.
(a) Variation of real part of impedance (Z′) with frequency measured at different temperatures for (Sr0.75Ag0.25)(NiNb)0.5O3. (b) Variation of imaginary part of impedance (Z″) with frequency measured at different temperatures for (Sr0.75Ag0.25)(NiNb)0.5O3.
The resistance measured as R corresponds with the angular frequency of the electric field denoted by ω, and the relaxation time, symbolized by τ, equals RC, where C signifies capacitance. The relaxation time for a bulk sample can be estimated using the formula τ = RgCg. As depicted in Figure 6a, the decrease in the value of Z′ with increasing temperature at low frequencies indicates the semiconductor characteristics of the material. Consequently, the negative temperature coefficient of resistance (NTCR) or semiconductor behavior of the material is observed at higher temperatures [39]. Therefore, the relaxation properties of the sample are established [32]. The Z′ value smoothly rises with increasing temperature and frequency, suggesting an increase in AC conductivity at low frequency (100 kHz) with temperature. In the figure, it is observed that at higher frequencies, the Z′ value merges into a line at higher temperatures, indicating the existence of a mechanism strongly related to temperature and the release of space charge [40]. As observed in Figure 6b, there is no peak, indicating less or no dissipation of current in the sample at low temperatures. The presence of a peak at higher temperatures suggests the existence of dielectric relaxation in the material. The frequency at which the imaginary value Z″ reaches its highest limit (Zmax″) shifts to the higher frequency region with increasing temperature. The broadening of peaks and the decrease in the highest limit of the imaginary impedance component (with respect to temperature) indicate that the dielectric relaxation mechanism is temperature dependent. Therefore, these dielectric processes related to relaxation occur due to lattice deformation and vacancies present in the material at higher temperatures [41,42].
3.5. Nyquist Diagram
Figure 7 displays the Nyquist diagram, showcasing complex impedance plots (Z′ vs. Z″), within the frequency range of 1 kHz to MHz, depicting temperature-dependent semicircular arcs. By comparing experimental data (real and imaginary components of Z) with the components of a circuit comprising resistors and capacitors, fitting parameters are obtained. In this circuit, the capacitor represents polarization with energy storage, while the resistor signifies a conductive path. The decrease in impedance with rising temperature indicates dependence on the sample’s conductivity. According to Debye theory, a perfect semicircle with its center precisely on the x-axis (real impedance component) signifies Debye-type dielectric relaxation, resulting in a single semicircle [43]. Conversely, when the semicircle’s center is below the axis (typically observed at high temperatures), the relaxation process is non-Debye type, resulting in two circles or semicircles. The center of the first semicircle falling on the Z′ axis indicates grain resistance or effect, while the second one is caused by grain boundary resistance. However, in this study, only a single semicircle (with its center below the x-axis) is observed even at higher frequencies and temperatures, attributed to the conduction of the material due to grain effect [44]. The Debye-type dielectric relaxation primarily accounts for the formation of such single semicircles, whose magnitude can be estimated using an electric circuit with a parallel combination of a capacitor Cg and resistance Rg. The relaxation time (τ) related to the circle can be estimated using the formula τ = RgCg. As depicted in the figure, grain boundaries do not contribute to impedance or electrical parameters, particularly at the stated frequency and temperature ranges, indicating that only grains are responsible for transport properties or electrical conduction in the material. The value of grain or bulk resistance can be determined using the semicircle’s diameter. The close agreement between experimental and model parameters obtained from the circuit using the software Zveiw underscores the accuracy and validity of the experimental data and the proposed theoretical model. The values of the parameters Rg and Cg are summarized in Table 1.
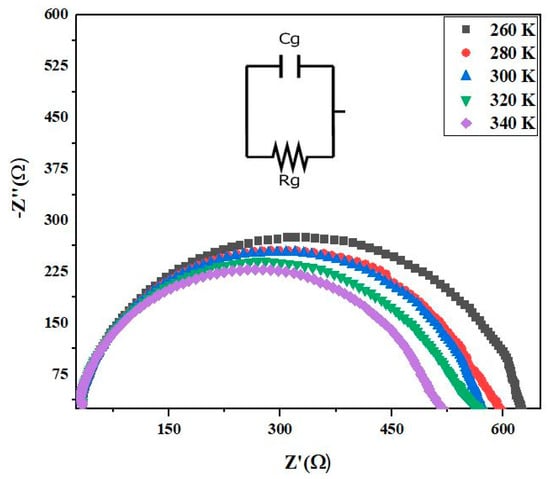
Figure 7.
Nyquist plots for (Sr0.75Ag0.25)(NiNb)0.5O3 ceramic at different temperatures.

Table 1.
Electrical parameters of equivalent circuit deduced from Nyquist plots at different temperatures for (Sr0.75Ag0.25)(NiNb)0.5O3 perovskite.
3.6. Modulus Analysis
To determine the resistive and capacitive characteristics of dielectrics under AC electrical fields, electric modulus spectroscopy is employed. Analyzing the frequency dependence of electrical modulus aids in understanding relaxation processes in materials. Through this technique, various electrical properties and processes of materials can be studied, including polarization, the role of grain boundaries in conduction, AC/DC electrical conductivity, dielectric relaxation, and more. Additionally, the influence of temperature and frequency on these parameters can be investigated using this technique. The equation for the modulus technique’s general relation has been derived and presented as follows [45].
In the equation, A represents the ratio of capacitance (C) in vacuum to dielectric (Co/C), R stands for resistance, and ω denotes the angular frequency of the applied AC field. By leveraging the effects of grains and grain boundary in electric modulus technique, we can effectively investigate the heterogeneous nature of polycrystalline sample. This insight is not achievable through complex impedance graphs. Furthermore, this technique is instrumental in estimating the electrode contribution to the total resistance. It is noteworthy that impedance techniques are unable to discern electrode contributions in the resistive/capacitive characteristics of the material. Figure 8a,b illustrate the effects of electric field frequency and temperatures on modulus components, namely M′ and M″. A continuous decrease in the value of M′ is observed in the low-frequency region, followed by a gradual increase in its value with increasing frequency, eventually reaching a saturated asymptotic value at higher frequencies across all temperatures. To elucidate the transport properties and conduction mechanism in the material, the short-range mobility of charge carriers is taken into account. This implies that under the influence of a DC electric field, there is a lack of restoring force that affects the flow of charge carriers [46]. As depicted in Figure 8b, initially, the value of M″ increases with frequency up to its maximum (peak) value (M″max), then decreases. Additionally, it is observed that with increasing temperature, the position of M″ max shifts to the higher frequency side. The shift of the peak position to the higher frequency side at higher temperatures indicates that thermal energy activates charge carriers. Moreover, as the broadening of the asymmetric peak increases with rising temperature, the relaxation time of charge carriers decreases. This phenomenon is observed only in the case of a non-Debye type of relaxation mechanism. The dielectric relaxation can be modeled using the Arrhenius relation, and the activation energy (Ea) estimated from Ln (Fmax) vs. (1000/T) plot is determined as 0.266 eV (Figure 9).
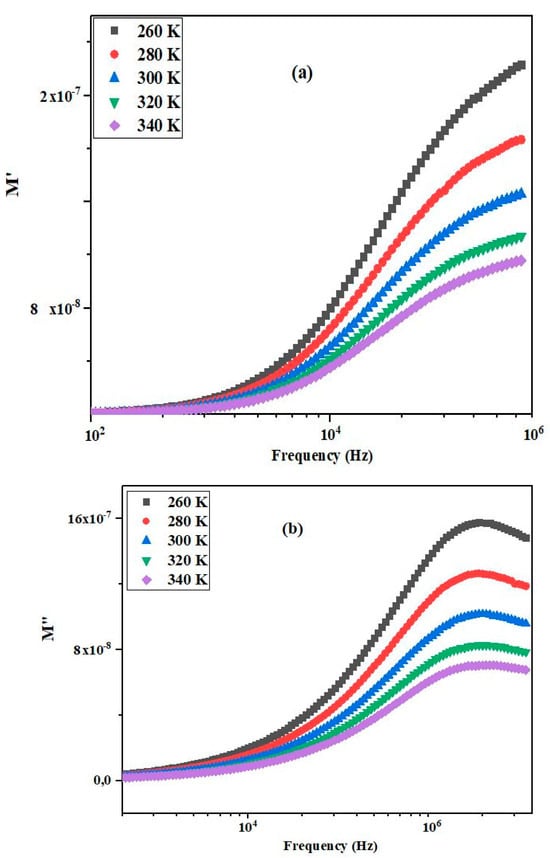
Figure 8.
(a) Variation of reel part of electrical modulus (M′) with frequency at different temperatures for (Sr0.75Ag0.25)(NiNb)0.5O3 ceramic. (b) Variation of imaginary part of electrical modulus (M″) with frequency at different temperatures for (Sr0.75Ag0.25)(NiNb)0.5O3 ceramic.
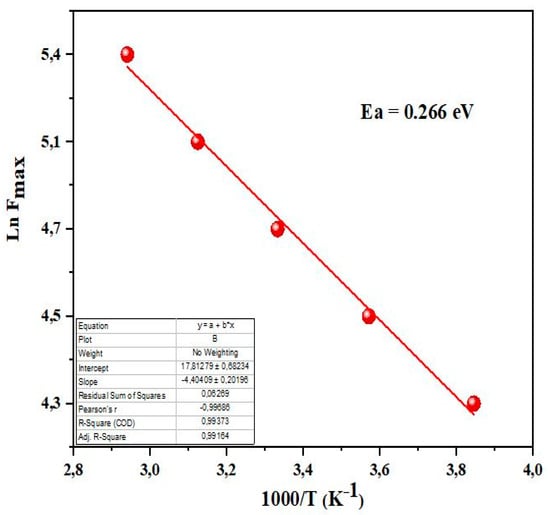
Figure 9.
Arrhenius plot of Ln(Fmax) vs. (1000/T) for (Sr0.75Ag0.25)(NiNb)0.5O3 perovskite.
3.7. Electrical Conductivity Study
In many instances, the electrical conductivity (σ) in manganite systems such as (Ln3+1−x M2+x)(Mn3+1−xMn4+x)O−23, where Ln represents elements like La or Sr, is primarily ascribed to the process of electron hopping that takes place between adjacent Mn3+ and Mn4+ ions. This electron hopping is facilitated by the presence of the oxygen anion O2− [40], and it serves as a fundamental mechanism influencing the electrical properties of these materials. To investigate the hopping conduction mechanism in the synthesized (Sr3+0.75Ag+20.25)0.5(Ni+3Nb+4)0.5O3 sample, the changes in its conductivity are depicted in Figure 10 with respect to both frequency and temperature. The values of σ (conductivity) were determined using the following relationship [47]:
where G represents the electrical conductance, t is the thickness of the pellet, and A is the cross-sectional area of the pellet. Notably, conductivity values remain relatively stable in the low-frequency range, up to a frequency value (f ≤ 105 Hz), identified as the hopping frequency. This constancy is attributed to limited electron hopping between Mn3+–Mn4+ ions, primarily influenced by the heightened activity of weakly conductive grain boundaries within this frequency spectrum. The low-frequency conductivity corresponds to the dc conductivity (σdc). Subsequently, a notable exponential increase in conductivity occurs beyond frequency. This phenomenon is attributed to enhanced activity of conductive grains in this frequency range, intensifying electron hopping between Mn3+–Mn4+ ions and thereby facilitating the conduction process in the sample. This high-frequency conductivity aligns with the ac conductivity (σAC). To modelize σ-values, the Jonscher power law [48,49] was employed as the mathematical relation.
where σdc represents the dc conductivity, and A and s denote the pre-exponential and exponent factors, respectively.
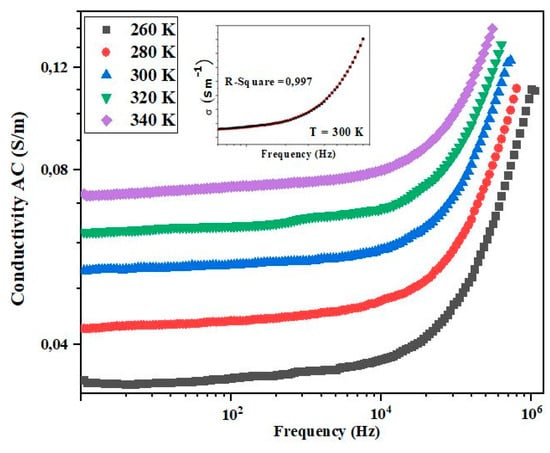
Figure 10.
Variation of AC conductivity of (Sr0.75Ag0.25)(NiNb)0.5O3 ceramic with frequency at different temperatures.
Furthermore, our analysis leads to the conclusion that the sample demonstrates semiconductor behavior without undergoing a transition into a metal-semiconductor phase. Notably, all s-values are below unity, indicating, according to the Funke criterion [50], that electron hopping between Mn3+–Mn4+ ions occurs between neighboring sites. In the high-temperature range, the dc conductivity behavior aligns well with the Arrhenius relation [51], expressed by the following mathematical formula:
where Ea represents the activation energy, is the pre-exponential term, and is Boltzmann’s constant. The activation energy (Ea) for the sample is calculated using Equation (12), and the graph of Ln (σdc) vs. (1000/T) is depicted in Figure 11. The expected Ea value, derived from the slope of the plot, is determined to be 0.268 eV. The activation energy derived from electrical conductivity closely aligns with the activation energy obtained from complex spectroscopic impedance. This close correspondence affirms that the conduction processes and relaxation phenomena within the prepared materials involve the same type of charge carrier. The electrical properties of Sr0.75Ag0.25Ni0.5Mn0.5O3, a material doped with silver, were investigated using impedance spectroscopy across various temperatures and frequencies. The study revealed that silver doping significantly enhances the material’s electrical conductivity compared to its undoped counterpart, Sr(NiMn)0.5O3. Specifically, the electrical conductivity of Sr0.75Ag0.25Ni0.5Mn0.5O3 was found to range from 0.9 × 10⁻² S/m to 1.25 × 10⁻² S/m, indicating a notable increase attributed to the doping process. Moreover, the activation energy required for electrical conduction was observed to decrease upon silver doping. The undoped Sr(NiMn)0.5O3 exhibited an activation energy of 0.287 eV, whereas the doped Sr0.75Ag0.25Ni0.5Mn0.5O3 showed a reduced activation energy of 0.268 eV. This reduction in activation energy signifies that the introduction of silver lowers the energy barrier for charge carrier movement within the material. Consequently, the doped material demonstrates improved electrical conductivity due to enhanced mobility of charge carriers at a given temperature.
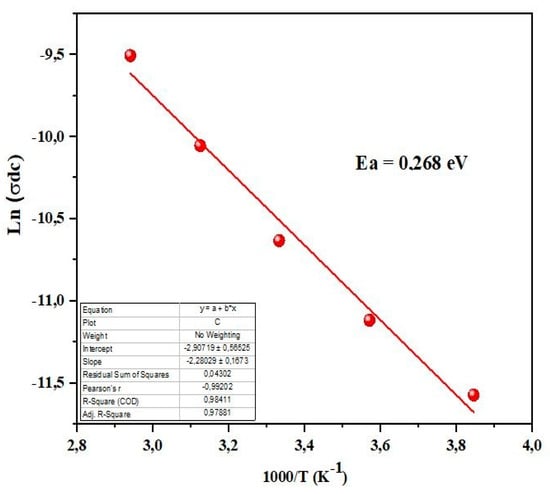
Figure 11.
Variation of Ln(σdc) as a function of (1000/T) for (Sr0.75Ag0.25)(NiNb)0.5O3 perovskite.
4. Conclusions
The polycrystalline (Sr0.75Ag0.25)(NiNb)0.5O3 ceramic has been synthesized using the sol–gel technique. Initial structural analysis based on X-ray diffraction data indicates a single phase of the trigonal system. The dielectric parameters like permittivity and dissipation factor are influenced by the frequency of the applied AC electric field and temperature. These electrical parameters are obtained through dielectric and impedance measurements. The high dielectric constant of the material is attributed to the Maxwell–Wagner model and space charge polarization. Despite the dissipation factor being temperature-dependent, the compound exhibits low energy loss even at higher temperatures, which further decreases with increasing frequency. Due to its low energy dissipation factor, the material possesses a high-quality factor, making it suitable for use as a component in microwave devices. Complex-impedance plots offer valid explanations and applications of the conduction phenomenon in the material. The frequency dependence of the AC conductivity conforms to Jonscher’s universal power law.
Author Contributions
Conceptualization, F.T. and M.B.; methodology, K.I.N.; software, M.E.; validation, M.L. and F.T.; formal analysis, K.I.N.; investigation, P.T.; resources, S.S.T.; data curation, S.S.T.; writing—original draft preparation, M.P.F.G.; writing—review and editing, F.T.; visualization, M.E.; supervision, M.P.F.G.; project administration, D.K.; funding acquisition, D.K. All authors have read and agreed to the published version of the manuscript.
Funding
The authors extend their appreciation to the Deanship of Research and Graduate Studies at King Khalid University for funding this work through Large Research Project under grant number RGP2/201/45. The authors are grateful to i3N (LA/P/0037/2020, UID-B/50025/2020, and UID-P/50025/2020) financed by COMPETE 2020 Program and national funds through the FCT/MEC and FEDER under the PT2020 Partnership Agreement. This work is funded by national funds (OE) through FCT—Fundação para a Ciência e a Tecnologia, I.P., in the scope of the framework contract foreseen in the numbers 4, 5, and 6 of article 23 of the Decree-Law 57/2016, of August 29, changed by Law 57/2017, of July 19.
Data Availability Statement
The data presented in this study are available from the corresponding author upon reasonable re-quest.
Acknowledgments
The authors extend their appreciation to the Deanship of Research and Graduate Studies at King Khalid University for funding this work through Large Research Project under grant number RGP2/201/45.
Conflicts of Interest
The authors declare no conflicts of interest.
References
- Davies, P.K.; Roth, R.S. National Institute of Standards and Technology Special Publication 804; NIST: Gaithersburg, MD, USA, 1991.
- Lines, M.E.; Glass, A.M. Principles and Applications of Ferroelectrics and Related Materials; Oxford University Press: New York, NY, USA, 1997. [Google Scholar]
- Tang, C.C.; Roberts, M.A.; Azough, F.; Leach, C.; Freer, R. Synchrotron x-ray diffraction study of Ba4.5Nd9Ti18O54 microwave dielectric ceramics at 10–295 K. J. Mater. Res. 2022, 17, 675–682. [Google Scholar] [CrossRef]
- Colla, E.L.; Reaney, I.M.; Setter, N.J. Effect of structural changes in complex perovskites on the temperature coefficient of the relative permittivity. Appl. Phys. 1993, 74, 3414–3425. [Google Scholar] [CrossRef]
- Hanif, M.B.; Rauf, S.; Motola, M.; Babar, Z.U.; Li, C.J.; Li, C.X. Recent progress of perovskite-based electrolyte materials for solid oxide fuel cells and performance optimizing strategies for energy storage applications. Mater. Res. Bull. 2022, 146, 111612. [Google Scholar] [CrossRef]
- Hanif, M.B.; Motola, M.; Rauf, S.; Li, C.J.; Li, C.X. Recent advancements, doping strategies and the future perspective of perovskite-based solid oxide fuel cells for energy conversion. Chem. Eng. J. 2022, 428, 132603. [Google Scholar] [CrossRef]
- Kubicek, M.; Bork, A.H.; Rupp, J.L.M. Perovskite oxides—A review on a versatile material class for solar-to-fuel conversion processes. J. Mater. Chem. A 2017, 5, 11983–12000. [Google Scholar] [CrossRef]
- Ofoegbuna, T.; Darapaneni, P.; Sahu, S.; Plaisance, C.; Dorman, J.A. Stabilizing the B-site oxidation state in ABO3 perovskite nanoparticles. Nanoscale 2019, 11, 14303–14311. [Google Scholar] [CrossRef]
- Oka, D.; Hirose, Y.; Nakao, S.; Fukumura, T.; Hasegawa, T. Intrinsic high electrical conductivity of stoichiometric SrNbO3 epitaxial thin films. Phys. Rev. B 2015, 92, 205102. [Google Scholar] [CrossRef]
- Hossain, A.; Bandyopadhyay, P.; Roy, S. An overview of double perovskites A2B′B″O6 with small ions at A site: Synthesis, structure and magnetic properties. J. Alloys Compd. 2018, 740, 414–427. [Google Scholar] [CrossRef]
- Velinov, N.; Brashkova, N.; Kozhukharov, V. Synthesis, structure and conductivity of layered perovskites. Ceram.-Silik. 2005, 49, 29–33. [Google Scholar]
- Arjun, N.; Pan, G.-T.; Yang, T.C.K. The exploration of Lanthanum based perovskites and their complementary electrolytes for the supercapacitor applications. Results Phys. 2017, 7, 920–926. [Google Scholar] [CrossRef]
- Tran, M.-N.T.; Quach, H.Y.; Nguyen, Q.V.; Nguyen, T.D.; On, D.T. Synthesis of perovskite-based nanocomposites for deNOx catalytic activity. Can. J. Chem. 2016, 94, 215–220. [Google Scholar] [CrossRef]
- Li, X.; Zhu, S.; Jia, Q.; Zhao, H.; Cao, Y.; Ma, Y.; Hu, S.; Cao, X. Fast synthesis of MoO3-x and its catalytic effect on the thermal decomposition of ammonium perchlorate based molecular perovskite (DAP-4). Can. J. Chem. 2021, 99, 795–800. [Google Scholar] [CrossRef]
- Gómez, L.; Galeano, V.; Parra, R.; Michel, C.R.; Paucar, C.; Morán, O. Carbon dioxide gas sensing properties of ordered oxygen deficient perovskite LnBaCo2O5+δ (Ln = La, Eu). Sens. Actuators B Chem. 2015, 221, 1455–1460. [Google Scholar] [CrossRef]
- Polini, R.; Pamio, A.; Traversa, E. Effect of synthetic route on sintering behaviour, phase purity and conductivity of Sr- and Mg-doped LaGaO3 perovskites. J. Eur. Ceram. Soc. 2004, 24, 1365–1370. [Google Scholar] [CrossRef][Green Version]
- Fumo, D.A.; Jurado, J.R.; Segadães, A.M.; Frade, J.R. Combustion synthesis of iron-substituted strontium titanate perovskites. Mater. Res. Bull. 1997, 32, 1459–1470. [Google Scholar] [CrossRef]
- Alhokbany, N.; Almotairi, S.; Ahmed, J.; Al-Saeedi, S.I.; Ahamad, T.; Alshehri, S.M. Investigation of structural and electrical properties of synthesized Sr-doped lanthanum cobaltite (La1−xSrxCoO3) perovskite oxide. J. King Saud Univ.-Sci. 2021, 33, 101419. [Google Scholar] [CrossRef]
- Jayakumar, G.; Poomagal, D.S.; Irudayaraj, A.A.; Raj, A.D.; Thresa, S.K.; Akshadha, P. Study on structural, magnetic and electrical properties of perovskite lanthanum strontium manganite nanoparticles. J. Mater. Sci. Mater. Electron. 2020, 31, 20945–20953. [Google Scholar] [CrossRef]
- Intatha, U.; Eitssayeam, S.; Wang, J.; Tunkasiri, T. Impedance study of giant dielectric permittivity in BaFe0.5Nb0.5O3 perovskite ceramic. Curr. Appl. Phys. 2010, 10, 21–25. [Google Scholar] [CrossRef]
- Kodera, M.; Moriya, Y.; Katayama, M.; Hisatomi, T.; Minegishi, T.; Domen, K. Investigation on nitridation processes of Sr2Nb2O7 and SrNbO3 to SrNbO2N for photoelectrochemical water splitting. Sci. Rep. 2018, 8, 15849. [Google Scholar] [CrossRef]
- Bigi, C.; Orgiani, P.; Sławińska, J.; Fujii, J.; Irvine, J.T.; Picozzi, S.; Panaccione, G.; Vobornik, I.; Rossi, G.; Payne, D.; et al. Direct insight into the band structure of SrNbO3. Phys. Rev. Mater. 2020, 4, 025006. [Google Scholar] [CrossRef]
- Rietveld, H.M. A profile refinement method for nuclear and magnetic structures. J. Appl. Crystallogr. 1969, 2, 65. [Google Scholar] [CrossRef]
- Voorhoeve, R.J.H. Advanced Materials in Catalysis; Academic Press: Cambridge, MA, USA, 1977; p. 129. [Google Scholar]
- Khadhraoui, S.; Triki, A.; Hcini, S.; Zemni, S.; Oumezzine, M. Variable-range-hopping conduction and dielectric relaxation in Pr0.6Sr0.4Mn0.6Ti0.4O3±δ perovskite. J. Magn. Magn. Mater. 2014, 371, 69. [Google Scholar] [CrossRef]
- Hsini, M.; Hamdaoui, N.; Hcini, S.; Bouazizi, M.L.; Zemni, S.; Beji, L. Effect of iron doping at Mn-site on complex impedance spectroscopy properties of Nd0.67Ba0.33MnO3 perovskite. Phase Transit. 2018, 91, 316. [Google Scholar] [CrossRef]
- Benamara, M.; Nassar, K.I.; Soltani, S.; Kallekh, A.; Dhahri, R.; Dahman, H.; El Mir, L. Light-enhanced electrical behavior of a Au/Al-doped ZnO/p-Si/Al heterostructure: Insights from impedance and current–voltage analysis. RSC Adv. 2023, 13, 28632–28641. [Google Scholar] [CrossRef] [PubMed]
- Rosić, M.; Logar, M.; Devečerski, A.; Prekajski, M.; Radosavljević-Mihajlović, A.; Kusigerski, V.; Spasojević, V.; Matović, B. Synthesis, structural and magnetic properties of nanostructured Ca0.9Gd0.1MnO3 obtained by modified glycine nitrate procedure (MGNP). Ceram. Int. 2011, 37, 1313–1319. [Google Scholar] [CrossRef]
- Nassar, K.I.; Tayari, F.; Benamara, M.; Teixeira, S.S.; Graça, M.P. Exploring bismuth-doped polycrystalline ceramic Ba0.75Bi0.25Ni0.7Mn0.3O3: Synthesis, structure, and electrical properties for advanced electronic applications. RSC Adv. 2023, 13, 24023–24030. [Google Scholar] [CrossRef] [PubMed]
- Parida, S.K.; Choudhary, R.N.P.; Achary, P.G.R. Study of structural and electrical properties of polycrystalline Pb(Cd1/3Ti1/3W1/3)O3 tungsten perovskite. Int. J. Microstruct. Mater. Prop. 2020, 15, 107–121. [Google Scholar]
- Tayari, F.; Iben Nassar, K.; Maalem, M.B.; Teixeira, S.S.; Graça, M.P.F. Structural, morphology, Raman spectroscopy, magnetic and electrical proprieties of BaNi0.5Mn0.25Fe0.25O3 ce-ramic for electronic applications. Indian J. Phys. 2023, 97, 3545–3555. [Google Scholar] [CrossRef]
- Elliot, S.R. Ac conduction in amorphous chalcogenide and pnictide semiconductors. Adv. Phys. 1987, 36, 135–217. [Google Scholar] [CrossRef]
- Gudmundsson, T.; Svavarsson, H.G.; Gudjonsson, S.; Gislason, H.P. Frequency-dependent conductivity in lithium-diffused and annealed GaAs. J. Phys. B 2003, 340, 324–328. [Google Scholar] [CrossRef]
- Benamara, M.; Iben Nassar, K.; Rivero-Antúnez, P.; Essid, M.; Soreto Teixeira, S.; Zhao, S.; Serrà, A.; Esquivias, L. Study of Electrical and Dielectric Behaviors of Copper-Doped Zinc Oxide Ceramic Prepared by Spark Plasma Sintering for Electronic Device Applications. Nanomaterials 2024, 14, 402. [Google Scholar] [CrossRef] [PubMed]
- Hcini, S.; Khadhraoui, S.; Triki, A.; Zemni, S.; Boudard, M.; Oumezzine, M. Impedance Spectroscopy Properties of Pr0.67A0.33MnO3 (A = Ba or Sr) Perovskites. J. Supercond. Nov. Magn. 2014, 27, 195. [Google Scholar] [CrossRef]
- Padmasree, K.P.; Kanchan, D.D.; Kulkami, A.R. Impedance and Modulus studies of the solid electrolyte system 20CdI2–80[xAg2O − y (0.7 V2O5 − 0.3 B2O3)], where 1≤ x/y ≤ 3. Solid State Ion. 2006, 177, 475. [Google Scholar] [CrossRef]
- Mahato, D.K.; Dutta, A.; Sinha, T.P. Impedance spectroscopy analysis of double perovskite Ho2NiTiO6. J. Mater. Sci. 2010, 45, 6757–6762. [Google Scholar] [CrossRef]
- Datta, R.; Pradhan, S.K.; Majumdar, S.; De, S.K. Dielectric and impedance spectroscopy of Nd2CoIrO6 double perovskite. J. Phys. Condens. Matter 2020, 32, 495702. [Google Scholar]
- Von Hauff, E.; Klotz, D. Impedance spectroscopy for perovskite solar cells: Characterisation, analysis, and diagnosis. J. Mater. Chem. C 2022, 10, 742–761. [Google Scholar] [CrossRef]
- Khadhraoui, S.; Triki, A.; Hcini, S.; Zemni, S.; Oumezzine, M. Structural and impedance spectroscopy properties of Pr0.6Sr0.4Mn1−xTixO3±δ perovskites. J. Alloys Compd. 2013, 574, 290–298. [Google Scholar] [CrossRef]
- Zarazua, I.; Sidhik, S.; Lopez-Luke, T.; Esparza, D.; De la Rosa, E.; Reyes-Gomez, J.; Garcia-Belmonte, I.M.-S. Operating Mechanisms of Mesoscopic Perovskite Solar Cells through Impedance Spectroscopy and J–V Modeling. J. Phys. Chem. Lett. 2017, 8, 6073–6079. [Google Scholar] [CrossRef] [PubMed]
- Cordoba-Torres, P.; Mesquita, T.J.; Devos, O.; Tribollet, B.; Roche, V.; Nogueira, R.P. On the intrinsic coupling between constant-phase element parameters α and Q in electrochemical impedance spectroscopy. Electro. Acta 2012, 72, 172–178. [Google Scholar] [CrossRef]
- Hirschorn, B.; Orazema, M.E.; Tribollet, B.; Vivier, V.; Frateur, I.; Musiani, M. Determination of effective capacitance and film thickness from constant-phase-element parameters. Electro. Acta 2010, 55, 6218–6227. [Google Scholar] [CrossRef]
- Wang, Z.; Yuan, C.; Zhu, B.; Feng, Q.; Liu, F.; Xu, J.; Zhou, C.; Chen, G. Complex impedance spectroscopy of perovskite microwave dielectric ceramics with high dielectric constant. J. Am. Ceram. Soc. 2019, 102, 1852–1865. [Google Scholar] [CrossRef]
- Tlili, D.; Hamdaoui, N.; Hcini, S.; Bouazizi, M.L.; Zemni, S. Above room temperature complex impedance analysis of properties of La0.33Sr0.67Mn0.33Ti0.67O3±δ perovskite. Phase Transit. 2017, 90, 644. [Google Scholar] [CrossRef]
- Pascoe, A.R.; Duffy, N.W.; Scully, A.D.; Huang, F.; Cheng, Y.B. Insights into planar CH3NH3PbI3 perovskite solar cells using impedance spectroscopy. J. Phys. Chem. C. 2015, 119, 4444–4453. [Google Scholar] [CrossRef]
- Tayari, F.; Nassar, K.I.; Benamara, M.; Essid, M.; Teixeira, S.S.; Graça, M.P.F. Sol–gel synthesized (Bi0.5Ba0.5Ag)0.5(NiMn)0.5O3 perovskite ceramic: An exploration of its structural characteristics, dielectric properties and electrical conductivity. Ceram. Int. 2024, 50, 11207–11215. [Google Scholar] [CrossRef]
- Achary, P.G.R.; Choudhary, R.N.P.; Parida, S.K. Structure, electric and dielectric properties of PbFe1/3Ti1/3W1/3O3 single perovskite compound. Process. Appl. Ceram. 2020, 14, 146–153. [Google Scholar] [CrossRef]
- Chebaane, M.; Talbi, N.; Dhahri, A.; Oumezzine, M.; Khirouni, K.J. Structural and impedance spectroscopy properties of La0.8Ba0.1Ca0.1Mn1−xRuxO3 perovskites. Magn. Magn. Mater. 2017, 426, 646. [Google Scholar] [CrossRef]
- Halizan, M.Z.M.; Mohamed, Z.; Yahya, A.K. Simultaneously improved dielectric, optical and conductivity properties of SrLa1−xNdxLiTeO6 double perovskites. Mater. Res. Express 2020, 7, 086301. [Google Scholar] [CrossRef]
- Boudad, L.; Taibi, M.; Belayachi, W.; Sajieddine, M. High temperature dielectric investigation, optical and conduction properties of GdFe0.5Cr0.5O3 perovskite. J. Appl. Phys. 2020, 127, 174103. [Google Scholar] [CrossRef]
Disclaimer/Publisher’s Note: The statements, opinions and data contained in all publications are solely those of the individual author(s) and contributor(s) and not of MDPI and/or the editor(s). MDPI and/or the editor(s) disclaim responsibility for any injury to people or property resulting from any ideas, methods, instructions or products referred to in the content. |
© 2024 by the authors. Licensee MDPI, Basel, Switzerland. This article is an open access article distributed under the terms and conditions of the Creative Commons Attribution (CC BY) license (https://creativecommons.org/licenses/by/4.0/).