Figure 1.
The archaeological area of Palazzo Corsini alla Lungara (credit to Veronica Romoli).
Figure 1.
The archaeological area of Palazzo Corsini alla Lungara (credit to Veronica Romoli).
Figure 2.
(A) Scale plan of the intervention area (red box) in the Cavallerizza courtyard (green) located in Palazzo Corsini alla Lungara (blue). (B) Detailed plan of the structures that emerged during the excavation (credit to Margherita Zannini).
Figure 2.
(A) Scale plan of the intervention area (red box) in the Cavallerizza courtyard (green) located in Palazzo Corsini alla Lungara (blue). (B) Detailed plan of the structures that emerged during the excavation (credit to Margherita Zannini).
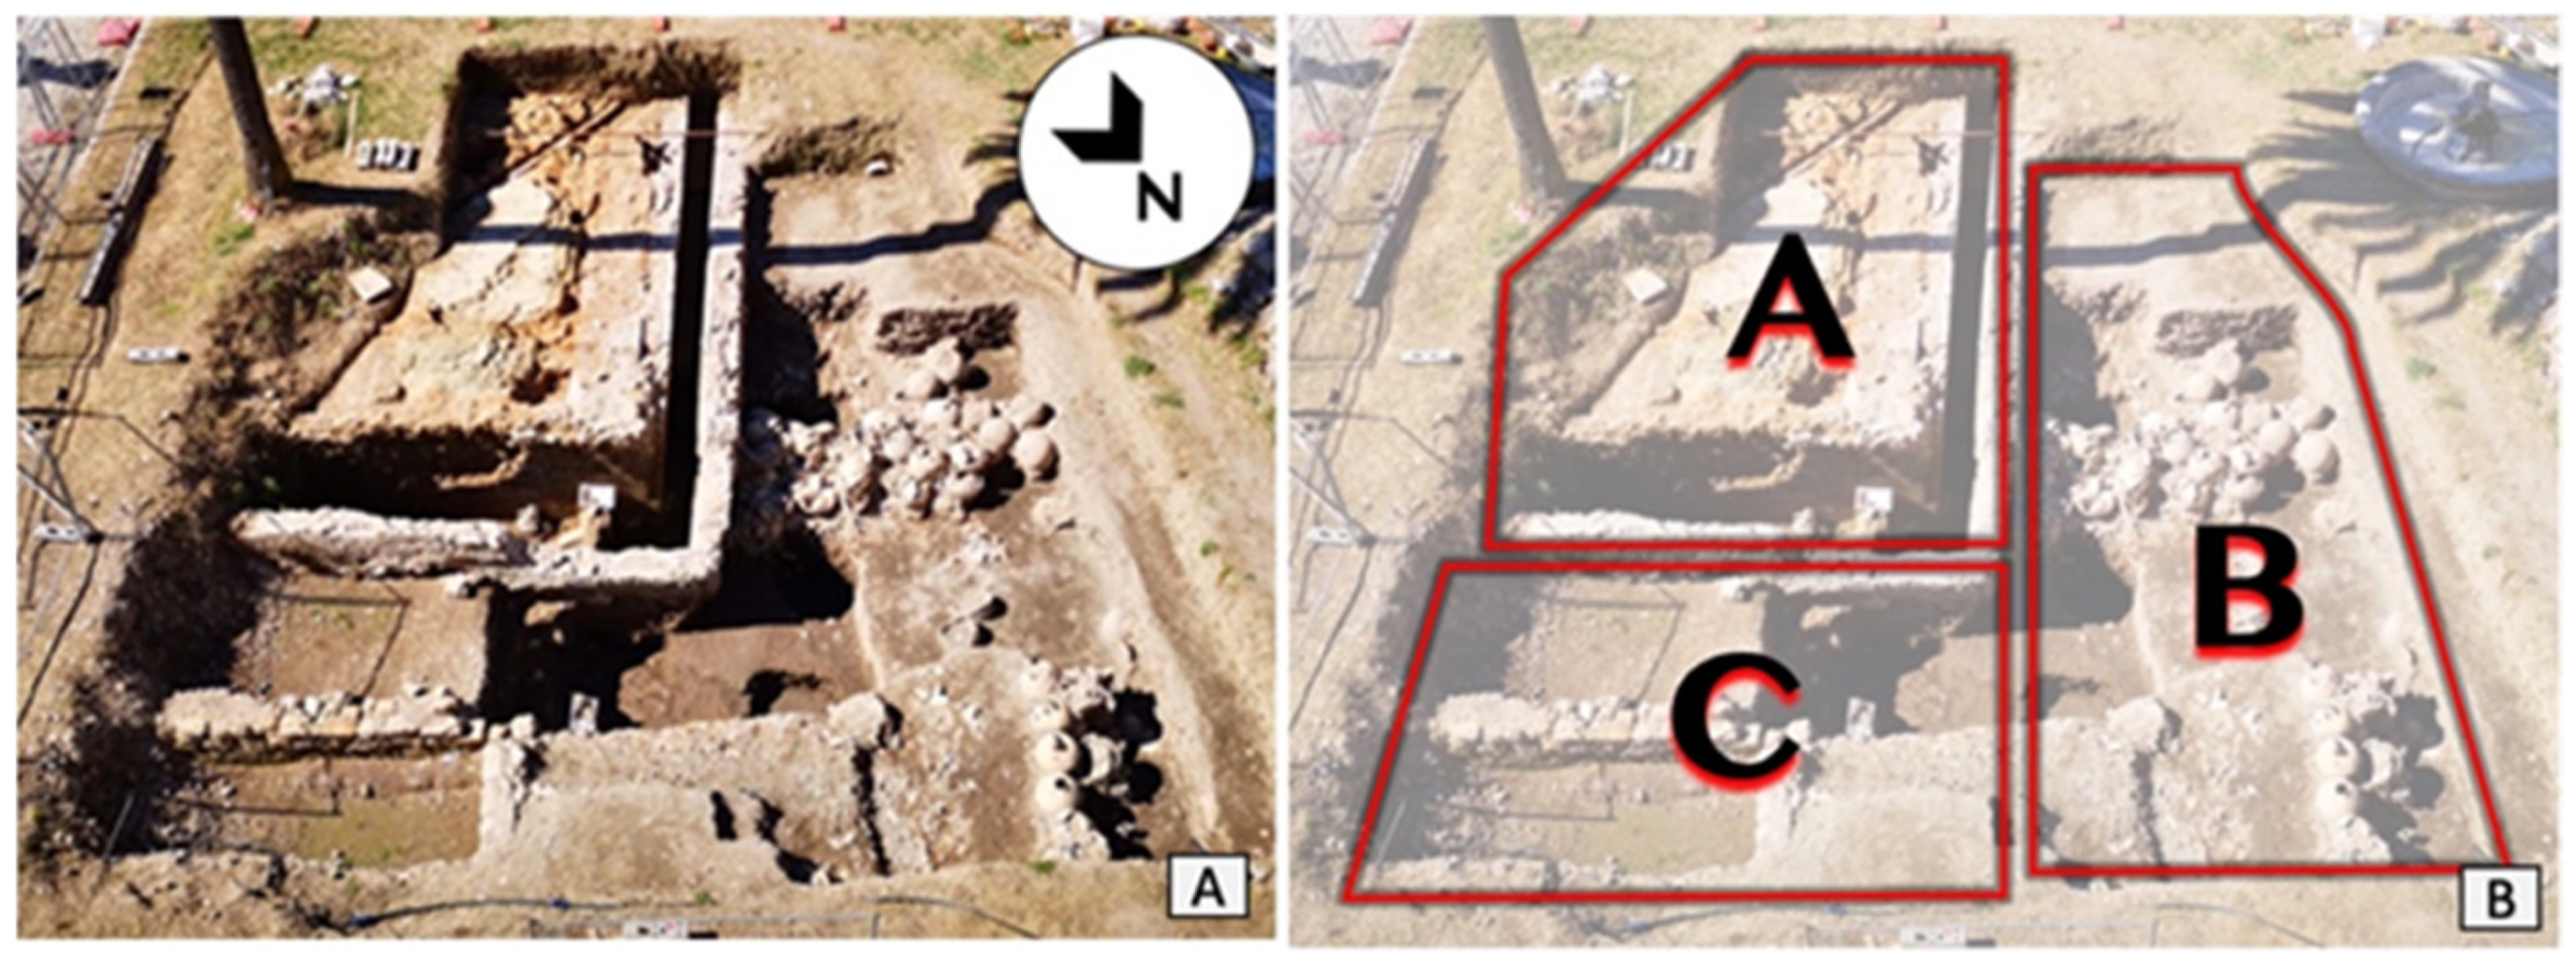
Figure 3.
(A) Image of the archaeological excavation providing a general perspective of the structures discovered (credit to Veronica Romoli). The quadrants in (B) refer to the excavation areas where different materials and structures were found. Quadrant A indicates the area relating to the presumed furnace. Quadrant B indicates the area belonging to the location of the amphorae; Quadrant C indicates the area where there are walls of different eras.
Figure 4.
Areas with different colours (shown by arrows) may be visible in the surface layer of the backed clay floor (quadrant A,
Figure 3B), indicating heating operations that resulted in the formation of various forms of oxidation in the clay material’s components (credit to Veronica Romoli for the picture and to Margherita Zannini for the plant).
Figure 5.
The remains of the walls (indicated by arrows) that could have supported the vault above the fireplace (credit to Veronica Romoli).
Figure 5.
The remains of the walls (indicated by arrows) that could have supported the vault above the fireplace (credit to Veronica Romoli).
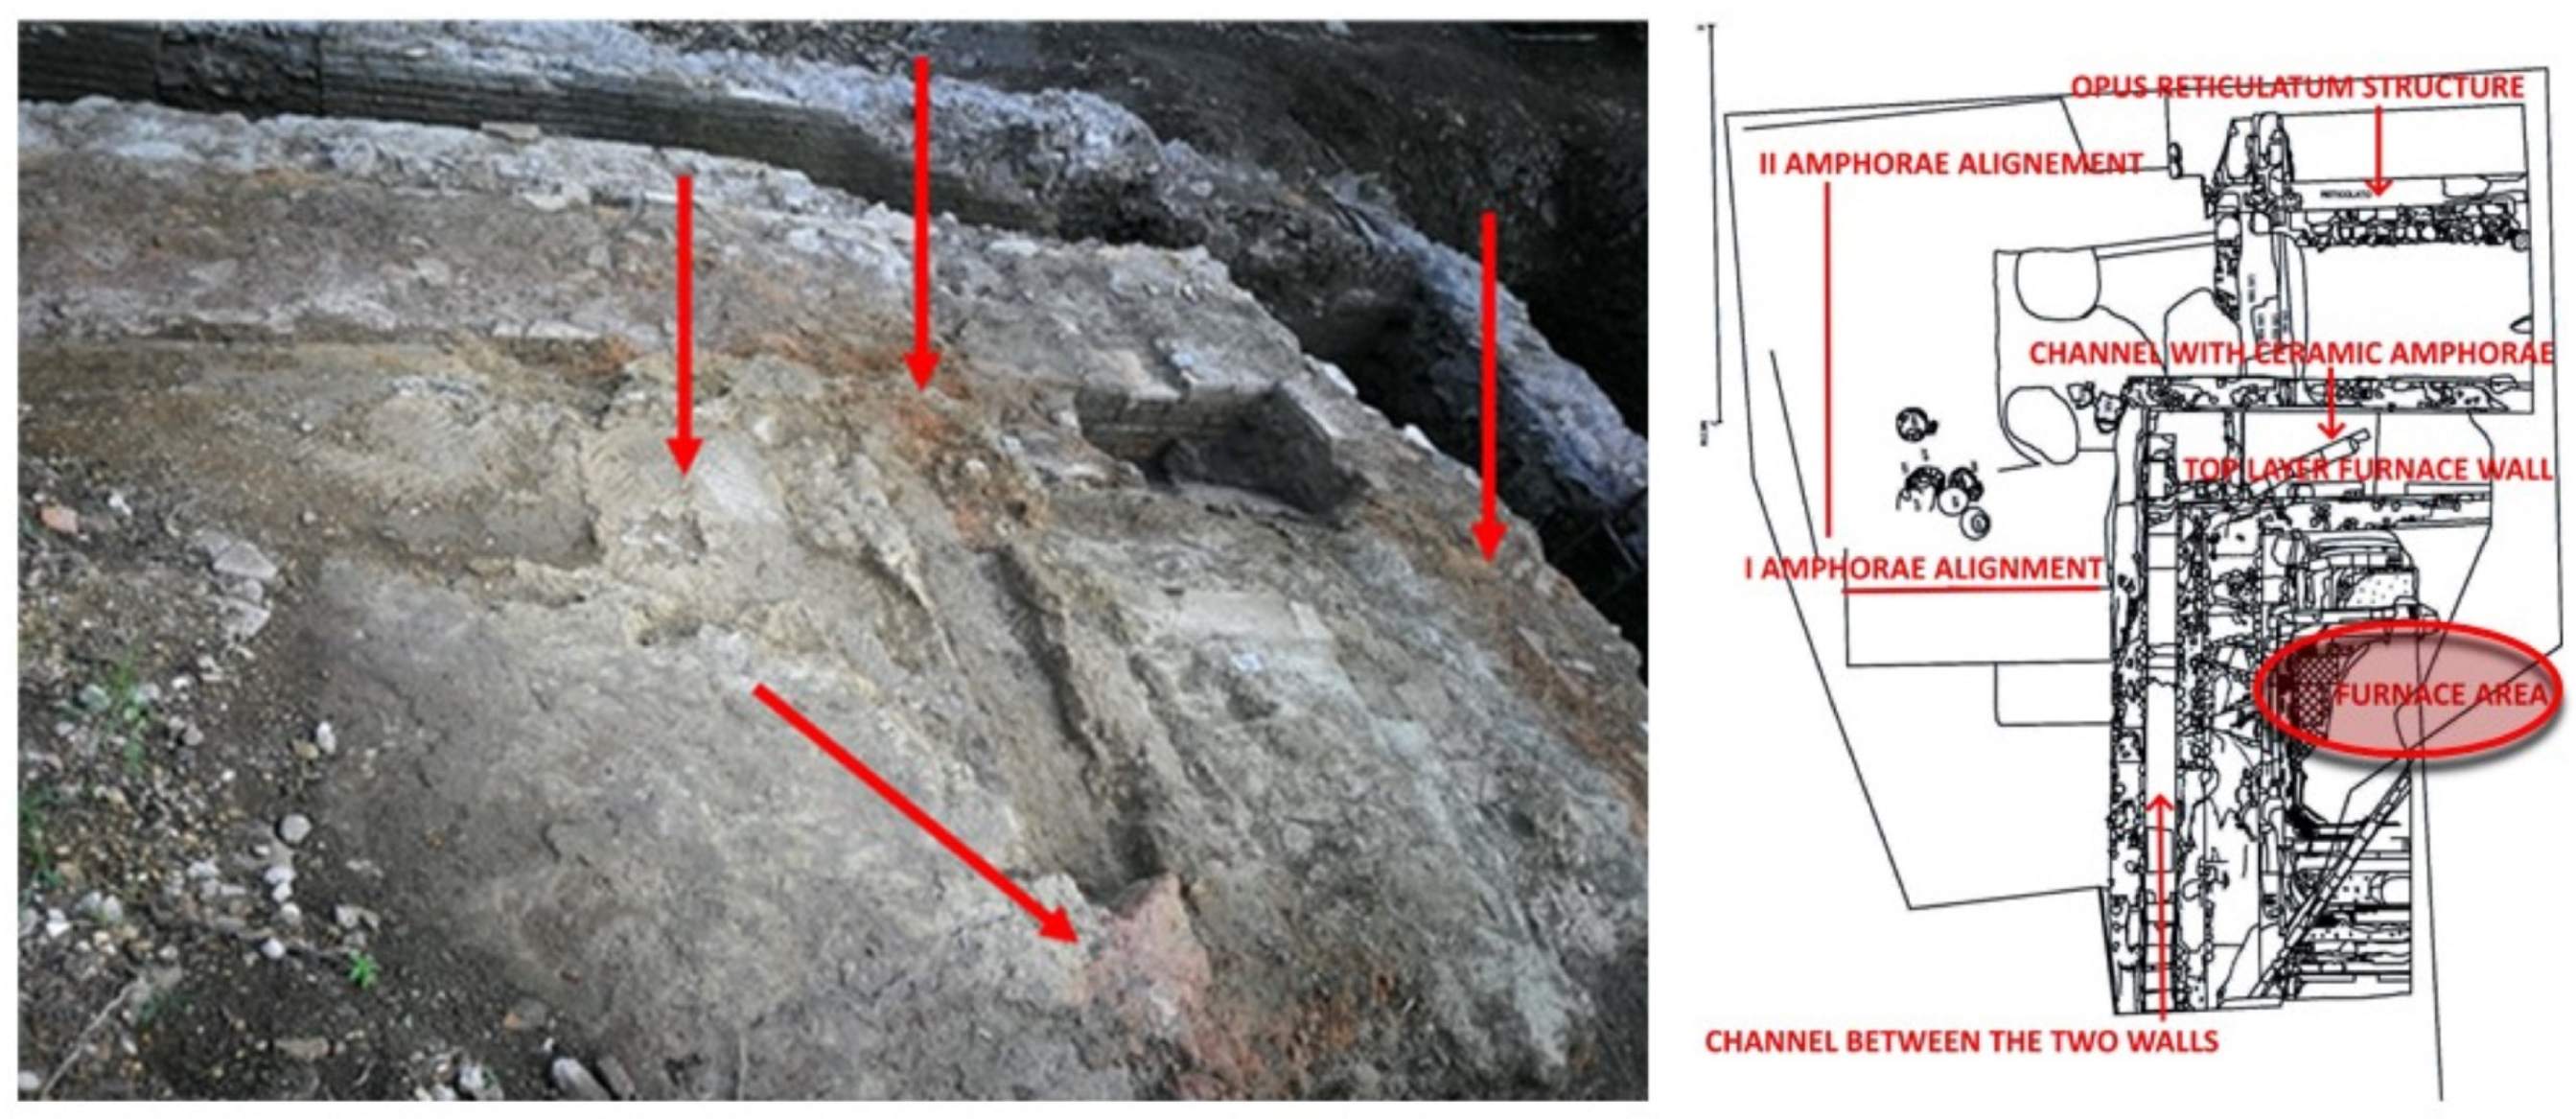
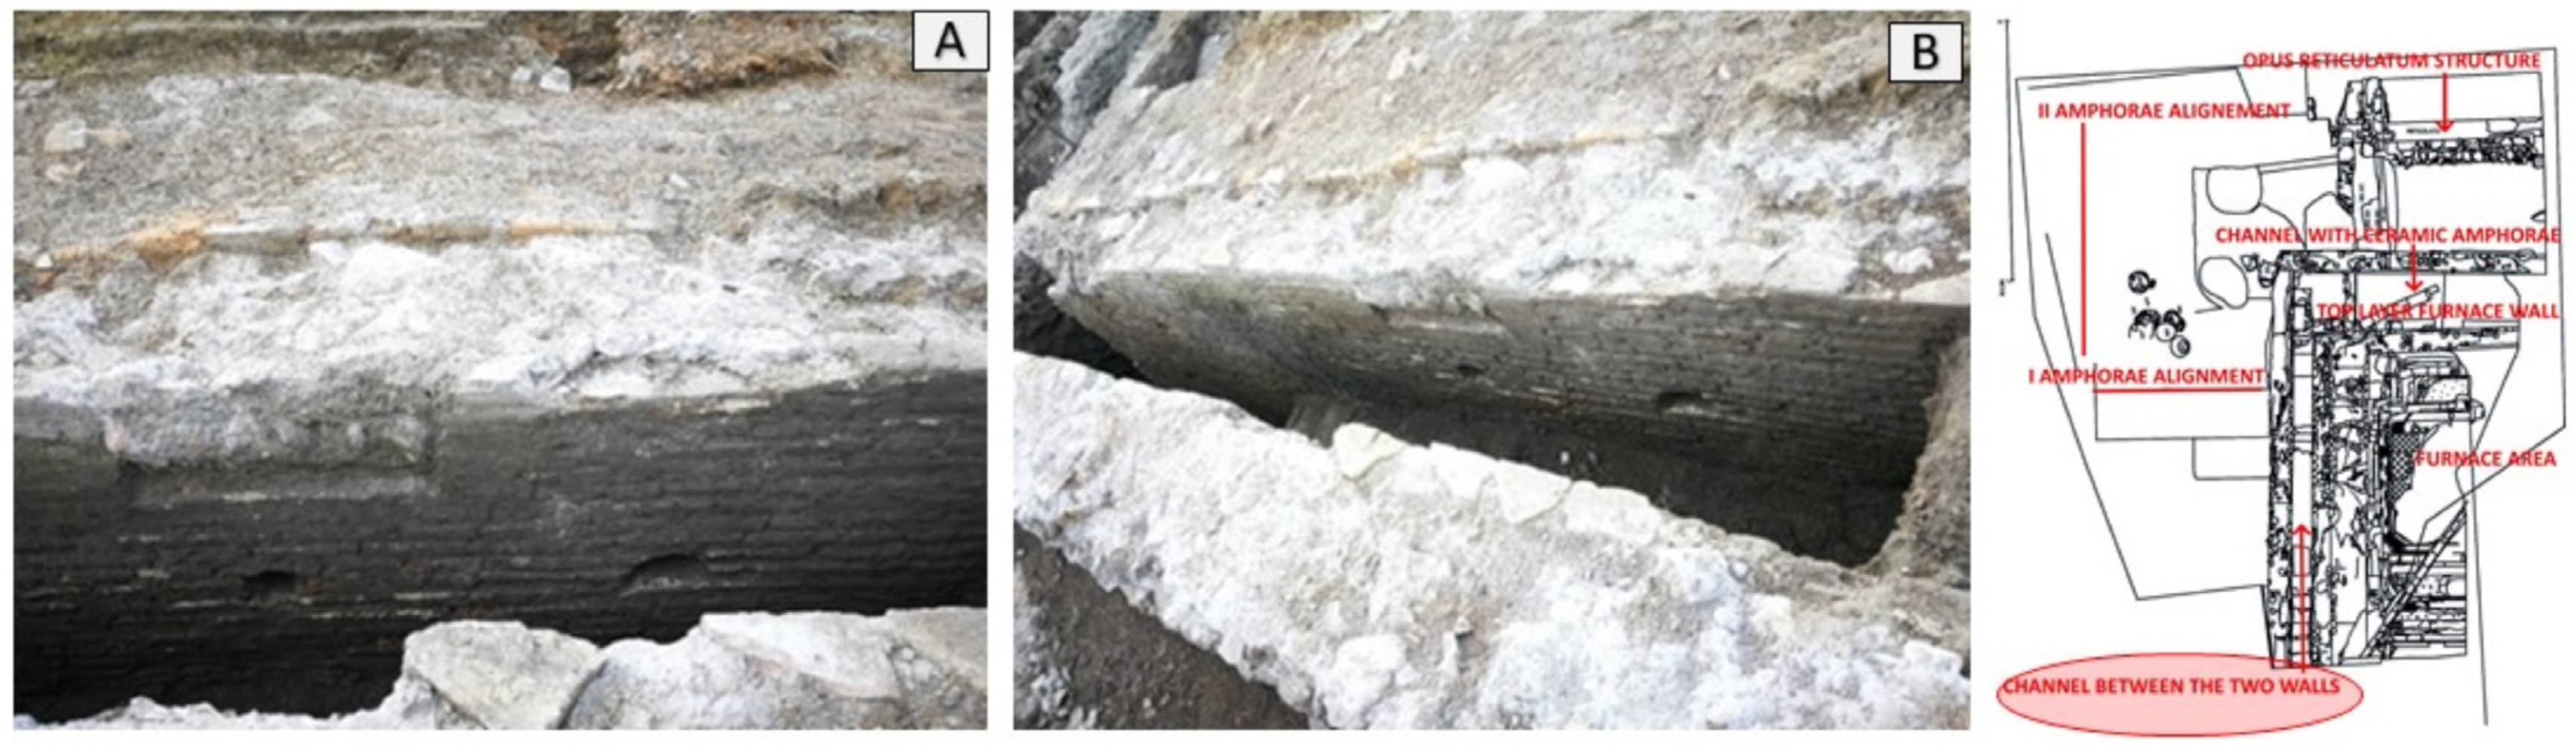
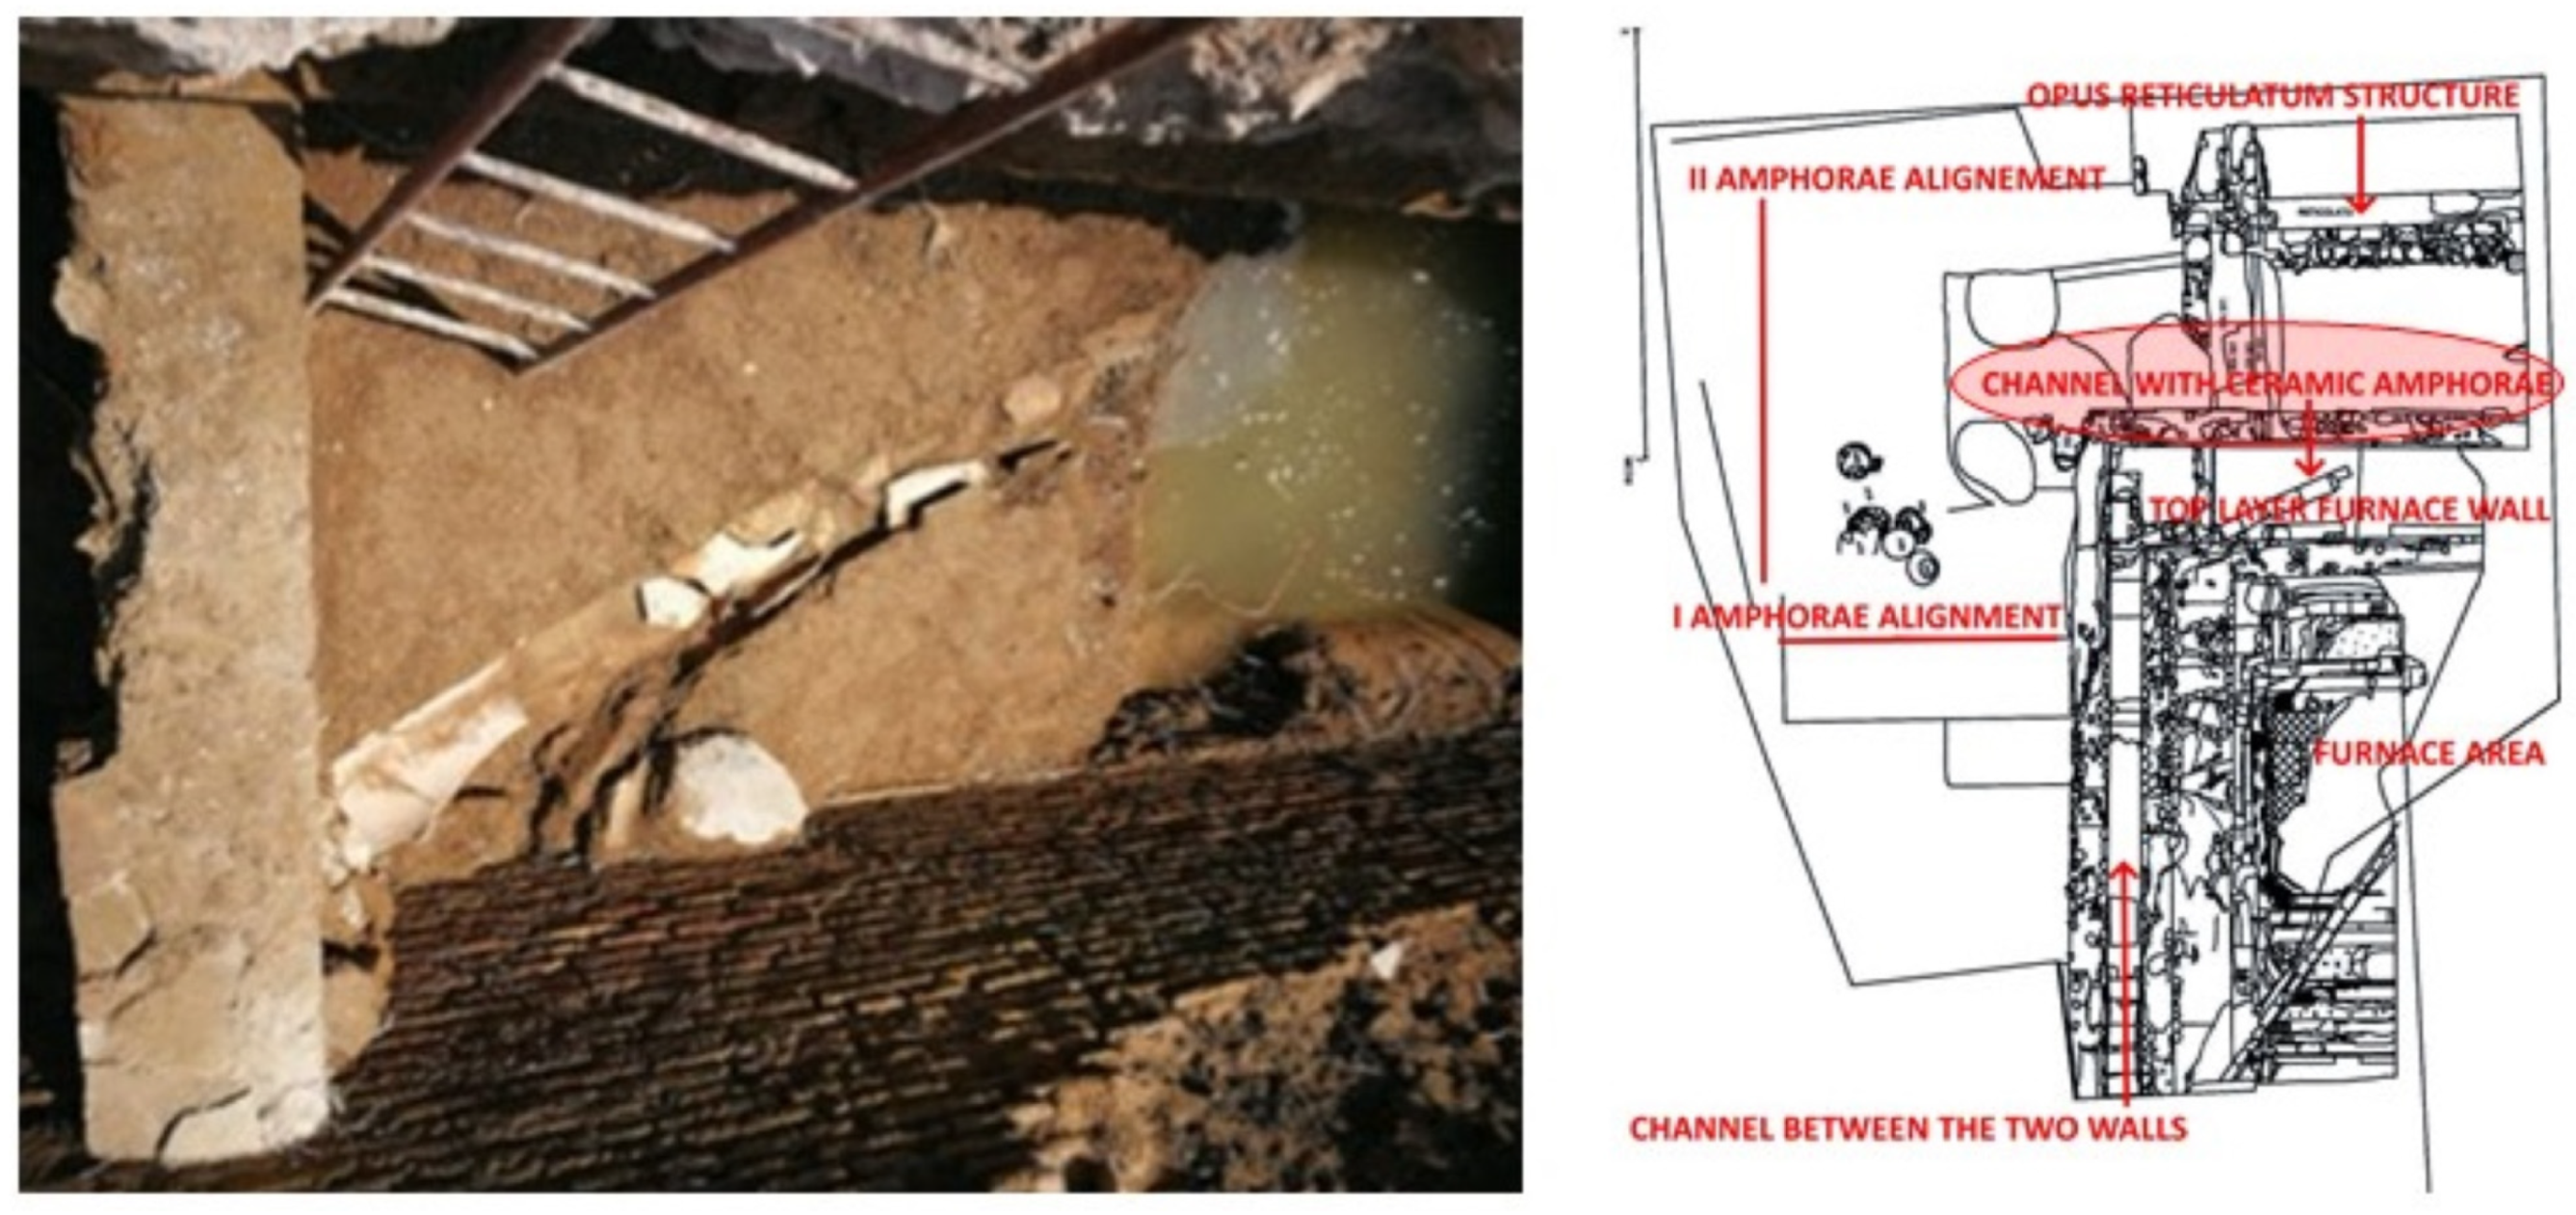
Figure 6.
(A) Walls of south-west sector of area A. (B) Canalisation formed between the two walls (credit to Veronica Romoli for the picture and to Margherita Zannini for the plant).
Figure 6.
(A) Walls of south-west sector of area A. (B) Canalisation formed between the two walls (credit to Veronica Romoli for the picture and to Margherita Zannini for the plant).
Figure 7.
Channel filled with ceramic amphorae from the 1st and 2nd centuries AD (credit to Veronica Romoli for the picture and to Margherita Zannini for the plant).
Figure 7.
Channel filled with ceramic amphorae from the 1st and 2nd centuries AD (credit to Veronica Romoli for the picture and to Margherita Zannini for the plant).
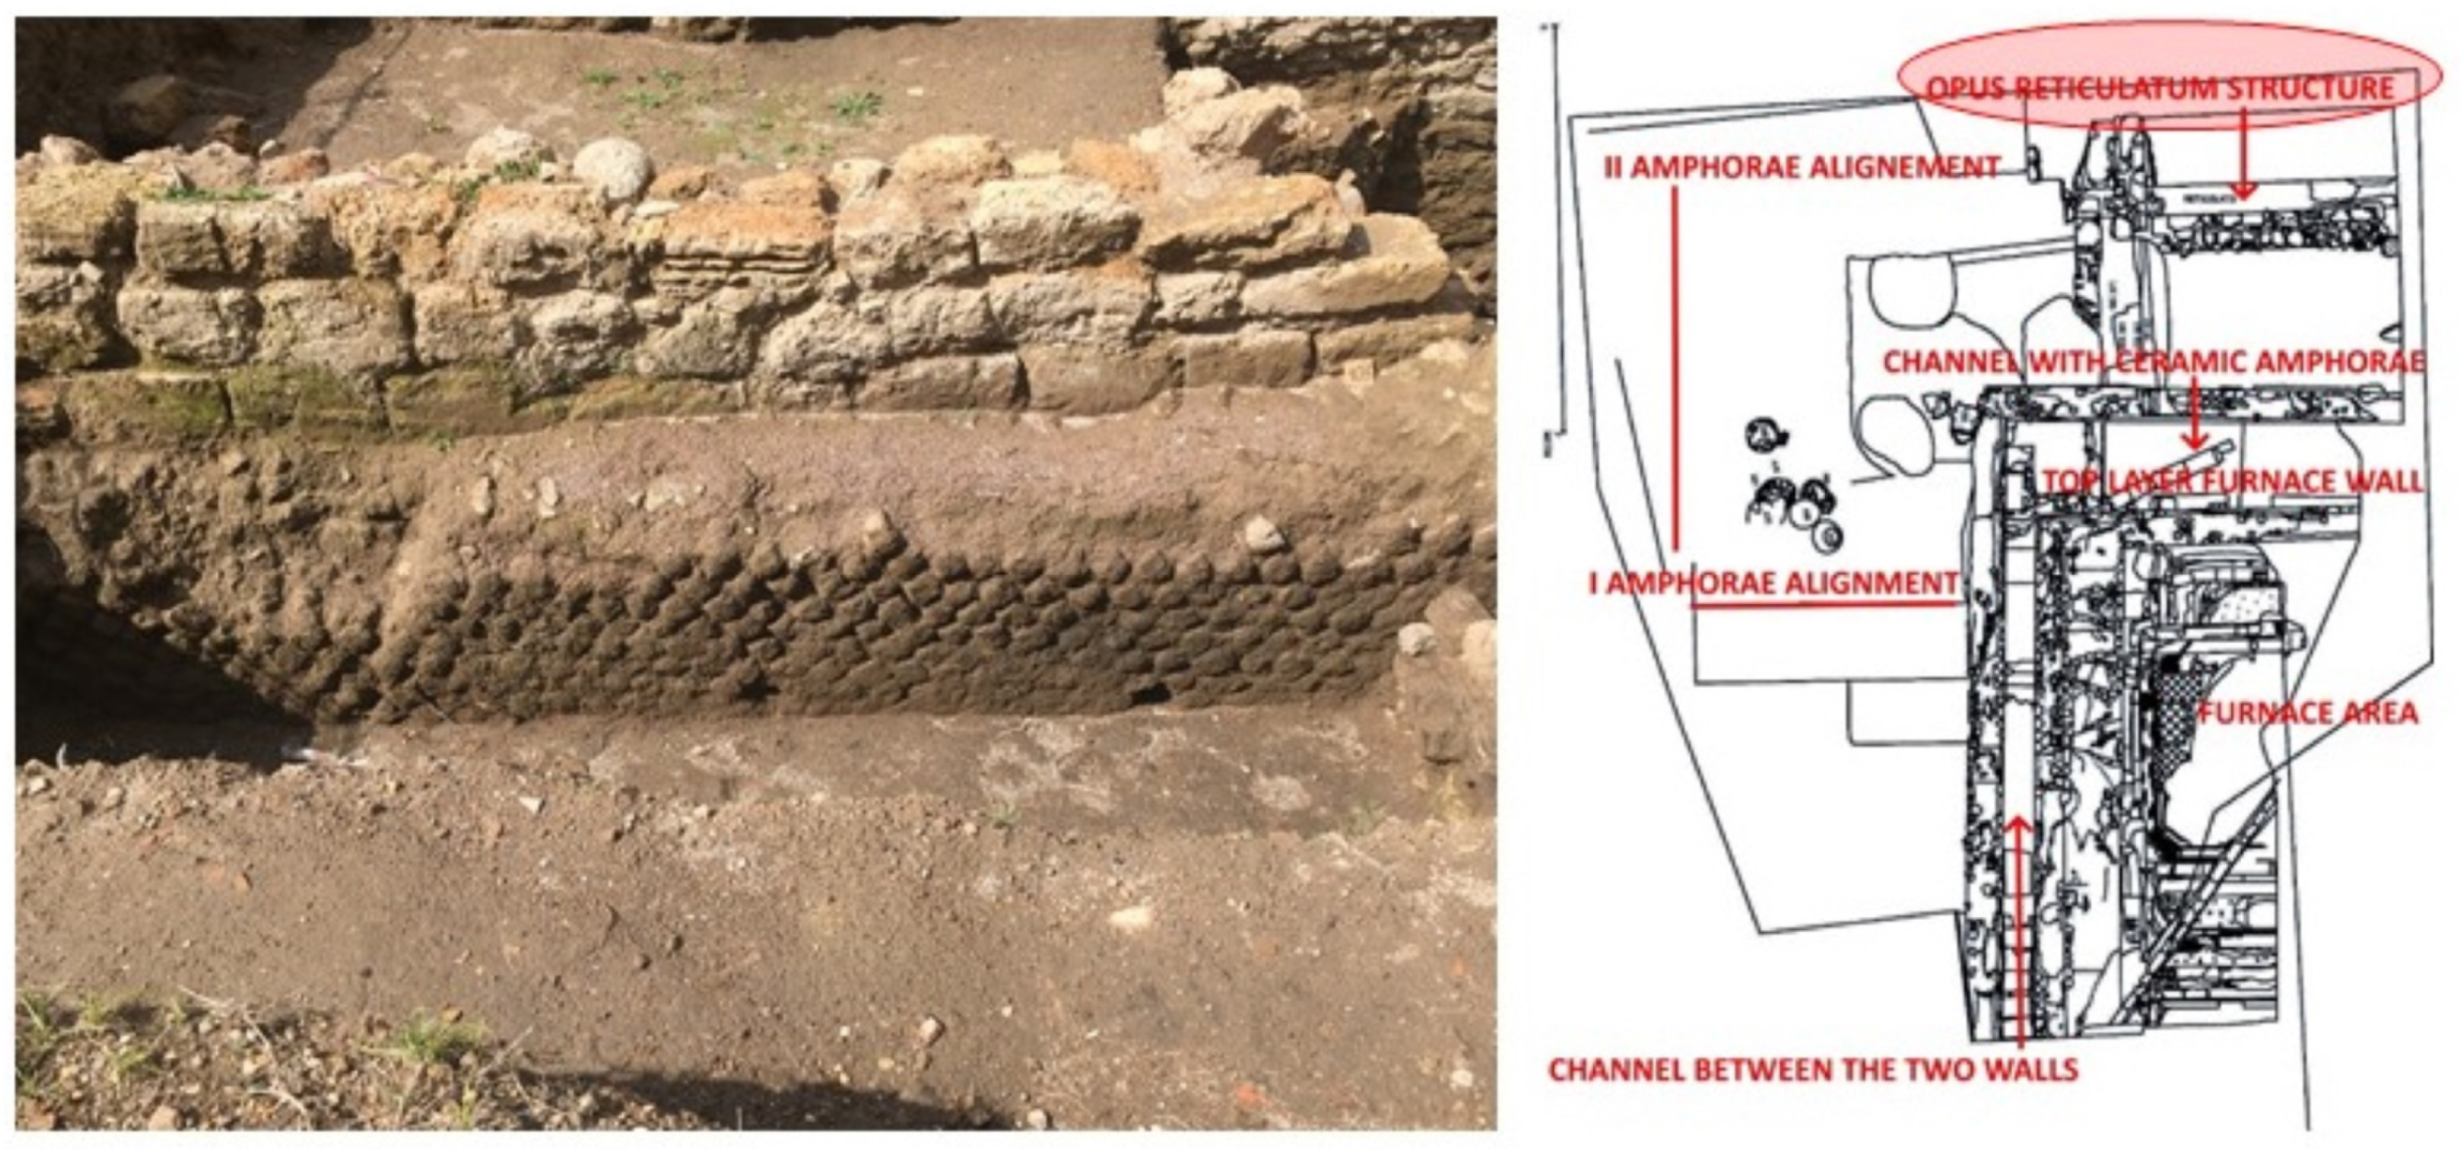
Figure 8.
Post-ancient wall (wall above) and opus reticulatum structure (wall below) (credit to Veronica Romoli for the picture and to Margherita Zannini for the plant).
Figure 8.
Post-ancient wall (wall above) and opus reticulatum structure (wall below) (credit to Veronica Romoli for the picture and to Margherita Zannini for the plant).
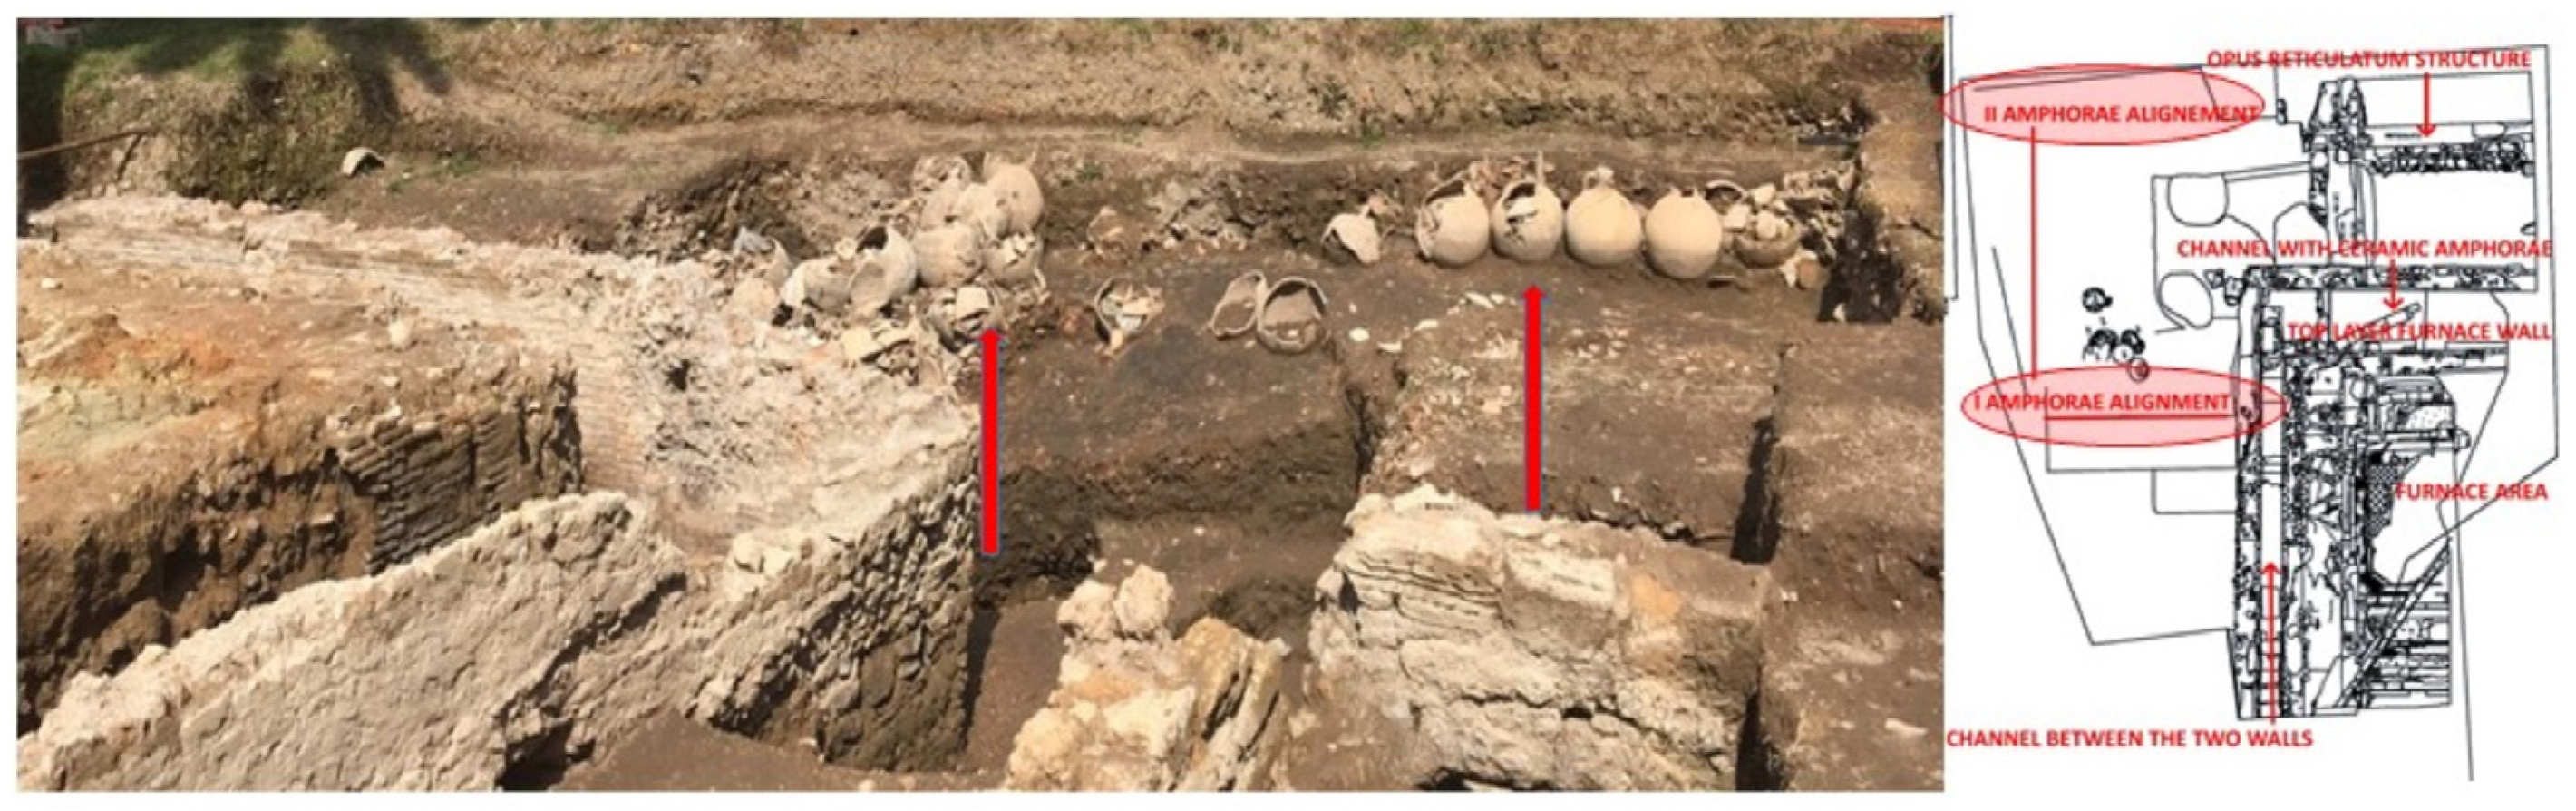
Figure 9.
The double line of Dressel 20-type oil amphorae (indicate by arrows) (credit to Veronica Romoli for the picture and to Margherita Zannini for the plant).
Figure 9.
The double line of Dressel 20-type oil amphorae (indicate by arrows) (credit to Veronica Romoli for the picture and to Margherita Zannini for the plant).
Figure 10.
(A) Excavation plan with UUSS location for quadrants A, B, C and (B) location of the analysed materials (credit to Margherita Zannini).
Figure 10.
(A) Excavation plan with UUSS location for quadrants A, B, C and (B) location of the analysed materials (credit to Margherita Zannini).
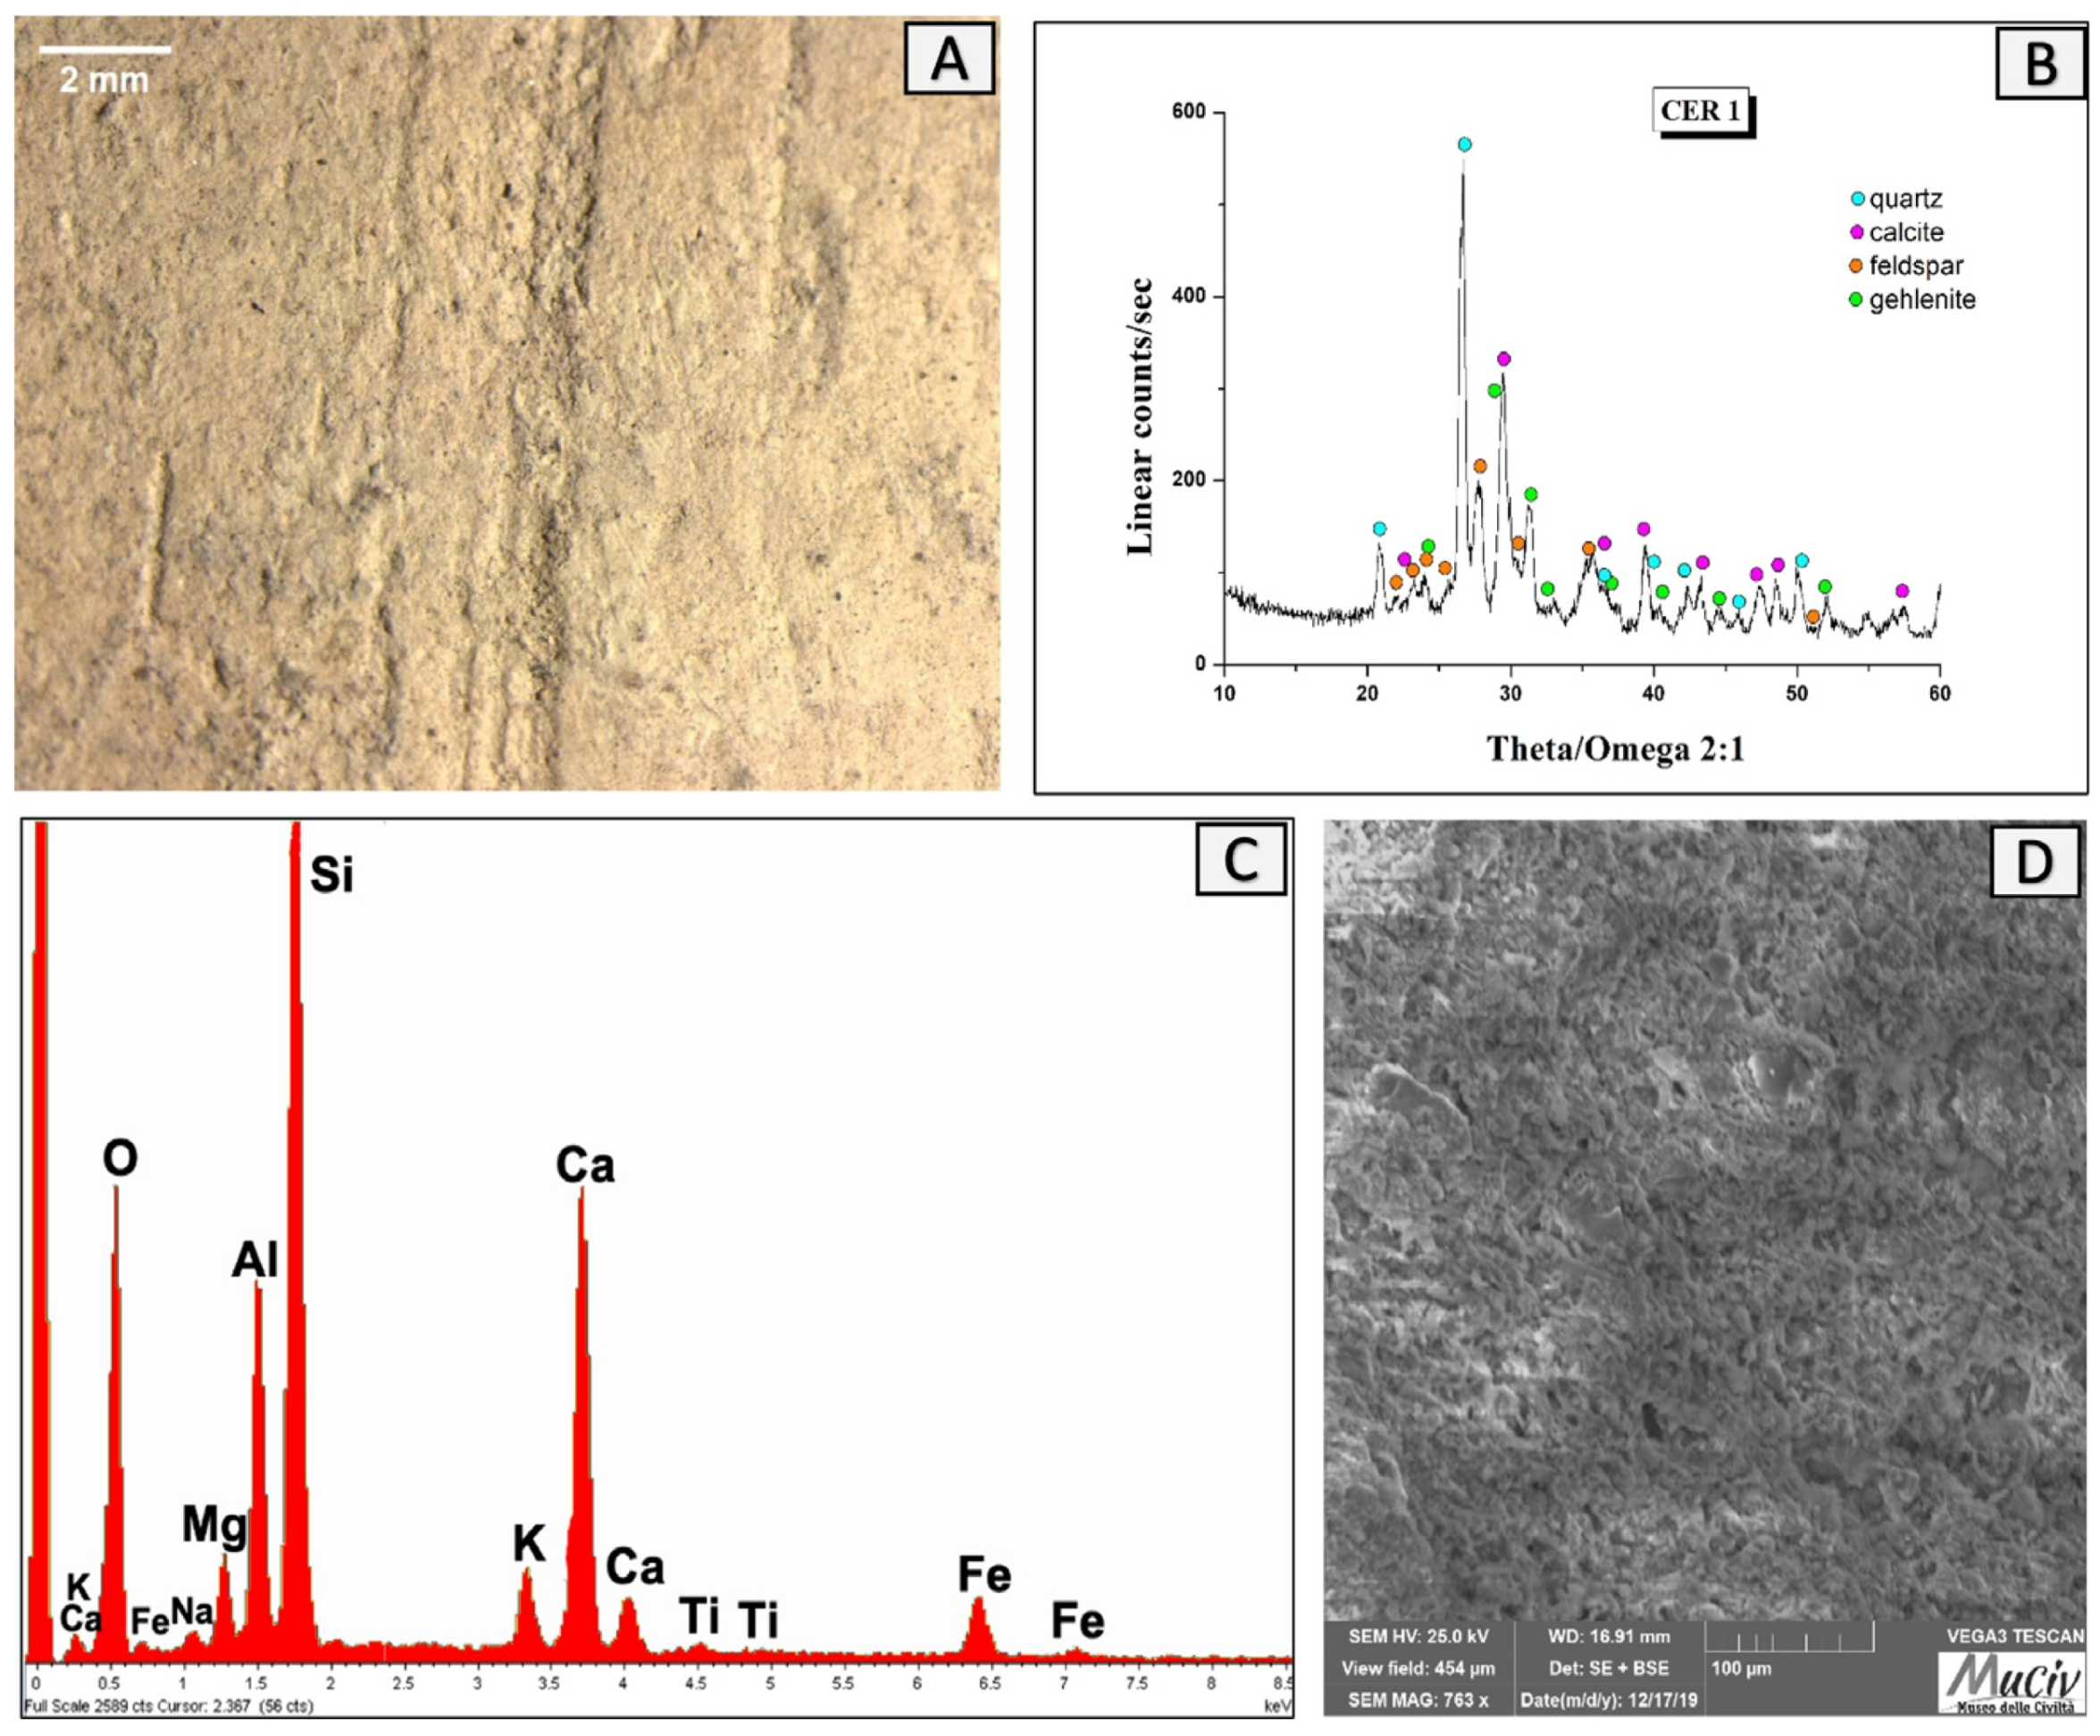
Figure 11.
Surface analysis of the bowl fragment CER1. (A) Optical and (D) backscattered SEM images of ceramic surface. The XRD spectrum (B) reveals the mineralogical phases present: quartz (SiO2), calcite (CaCO3), feldspar-albite (NaAlSi3O), and gehlenite (Ca2Al(AlSi)O7). EDS area spectrum (C) reveals the presence of Si, Ca, and Al together with smaller quantities of Fe, Na, Ti, and K.
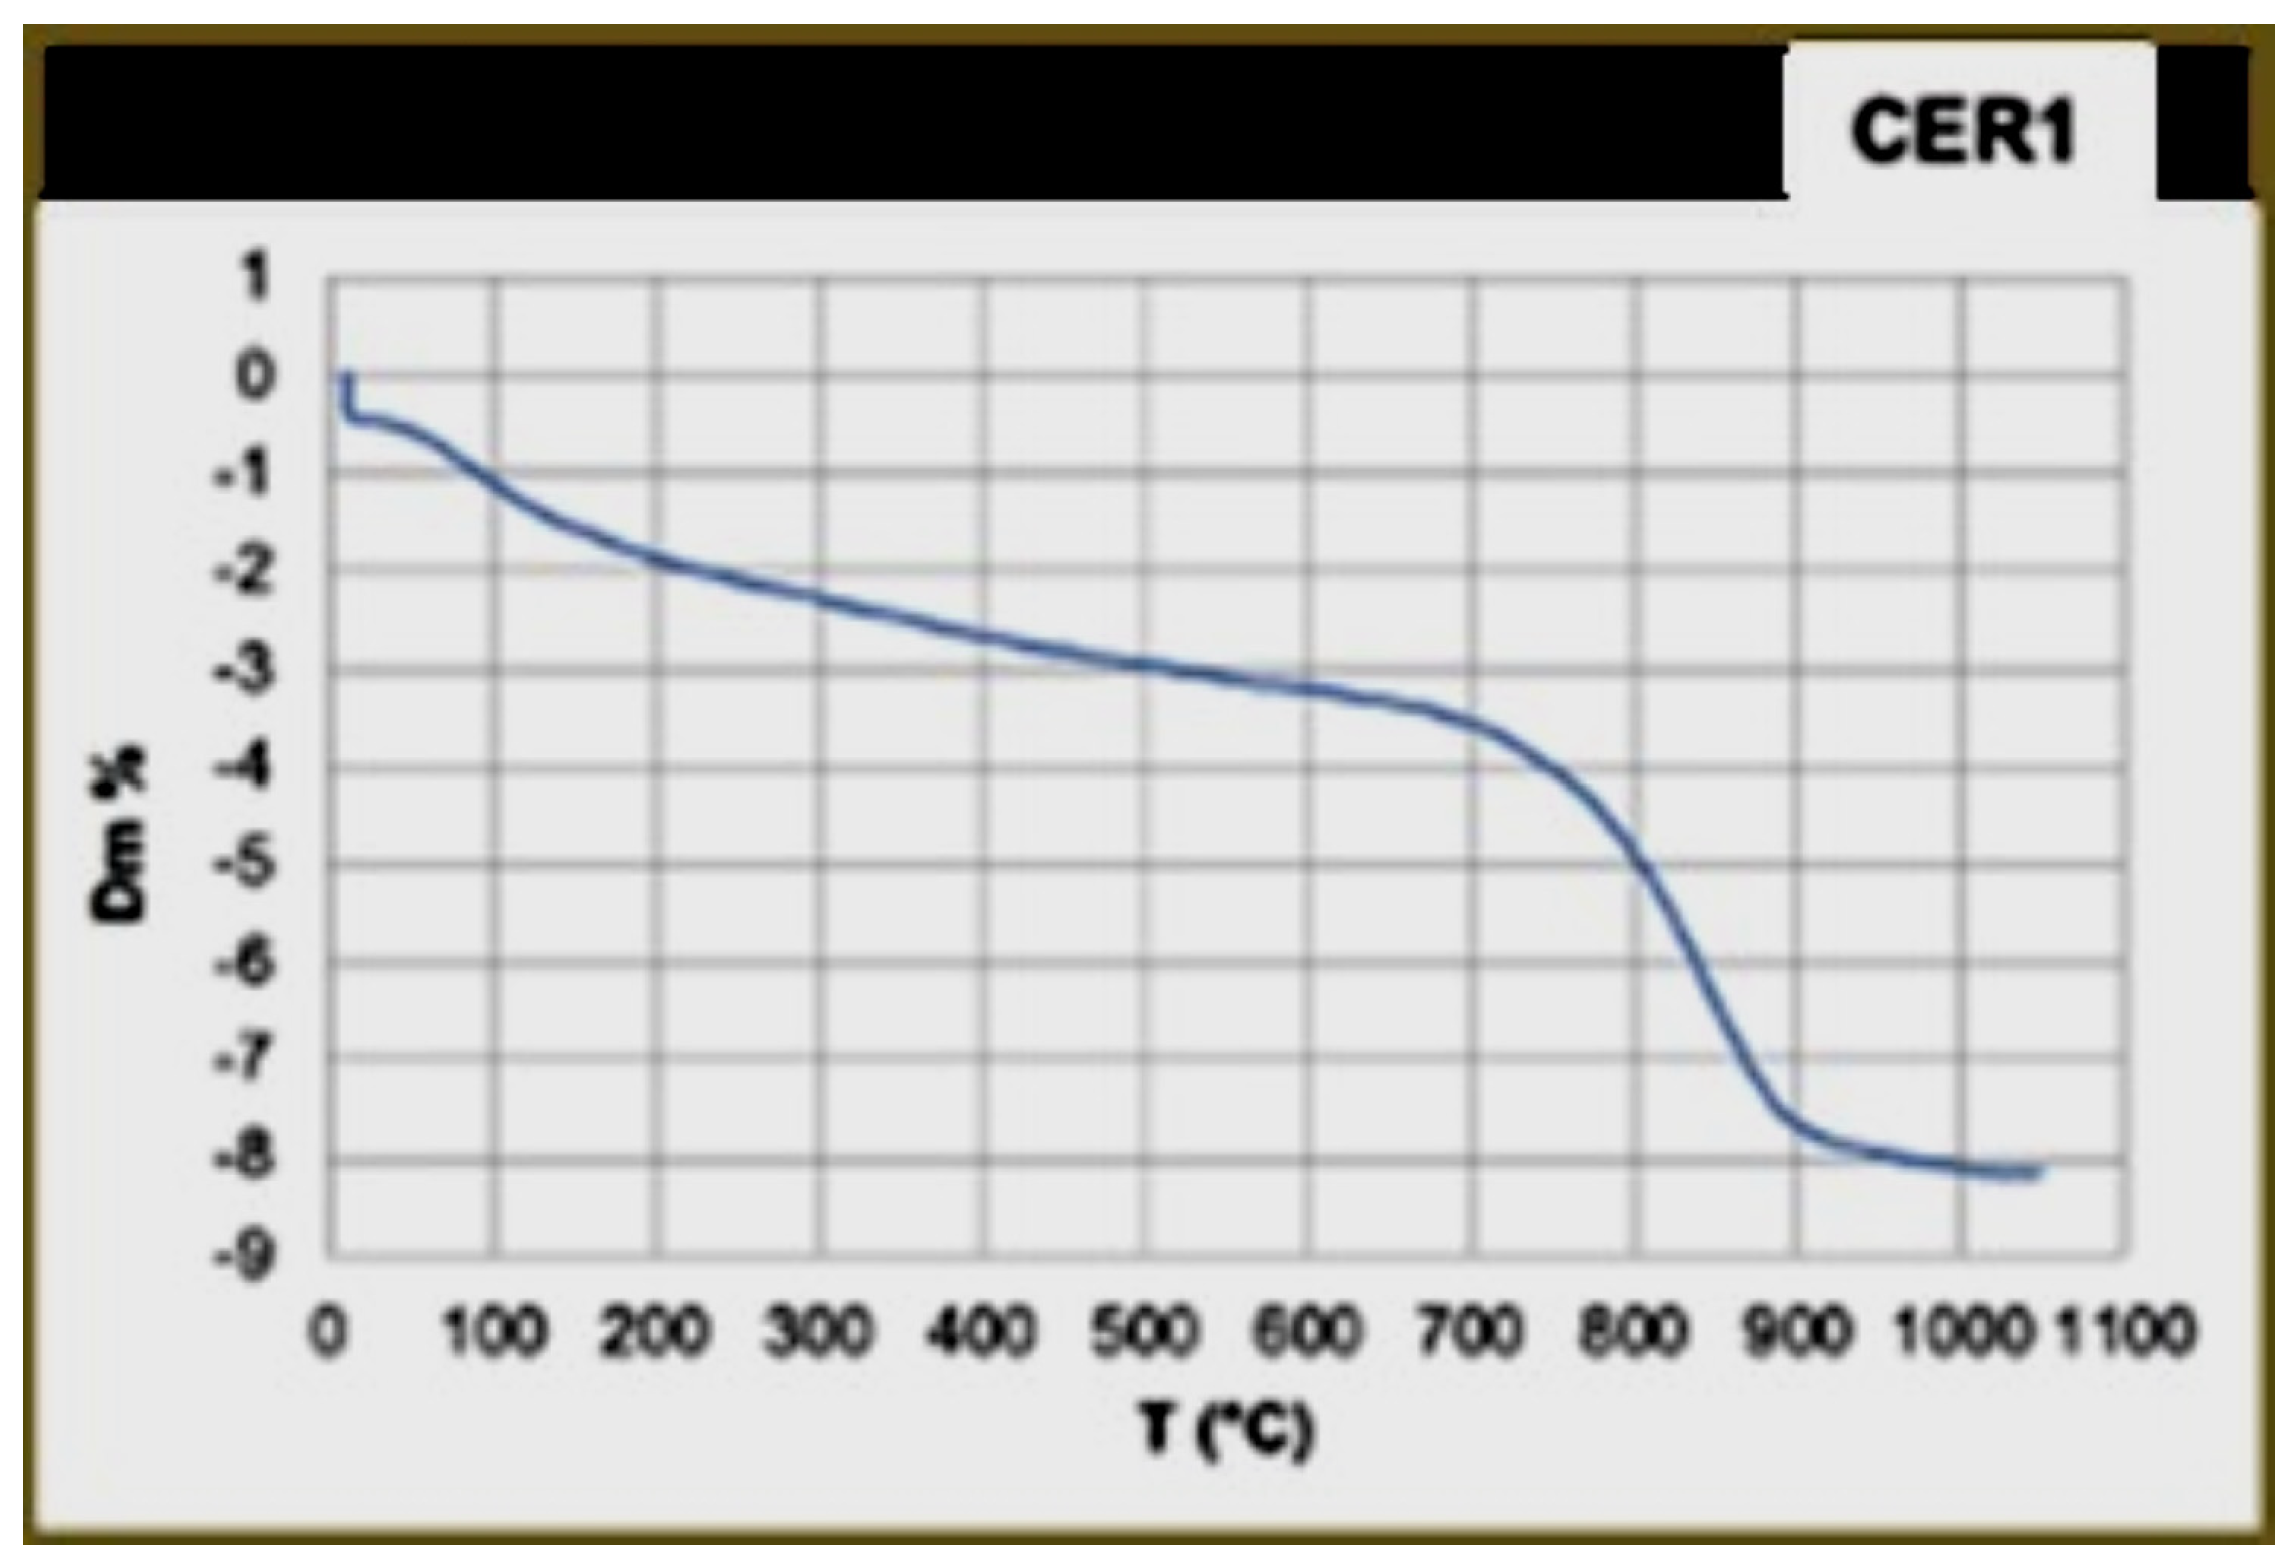
Figure 12.
Thermogravimetric analysis (TG) of the CER1 basin shows a point of flex between 700 °C and 900 °C, which is attributed to the decomposition of the calcite.
Figure 12.
Thermogravimetric analysis (TG) of the CER1 basin shows a point of flex between 700 °C and 900 °C, which is attributed to the decomposition of the calcite.
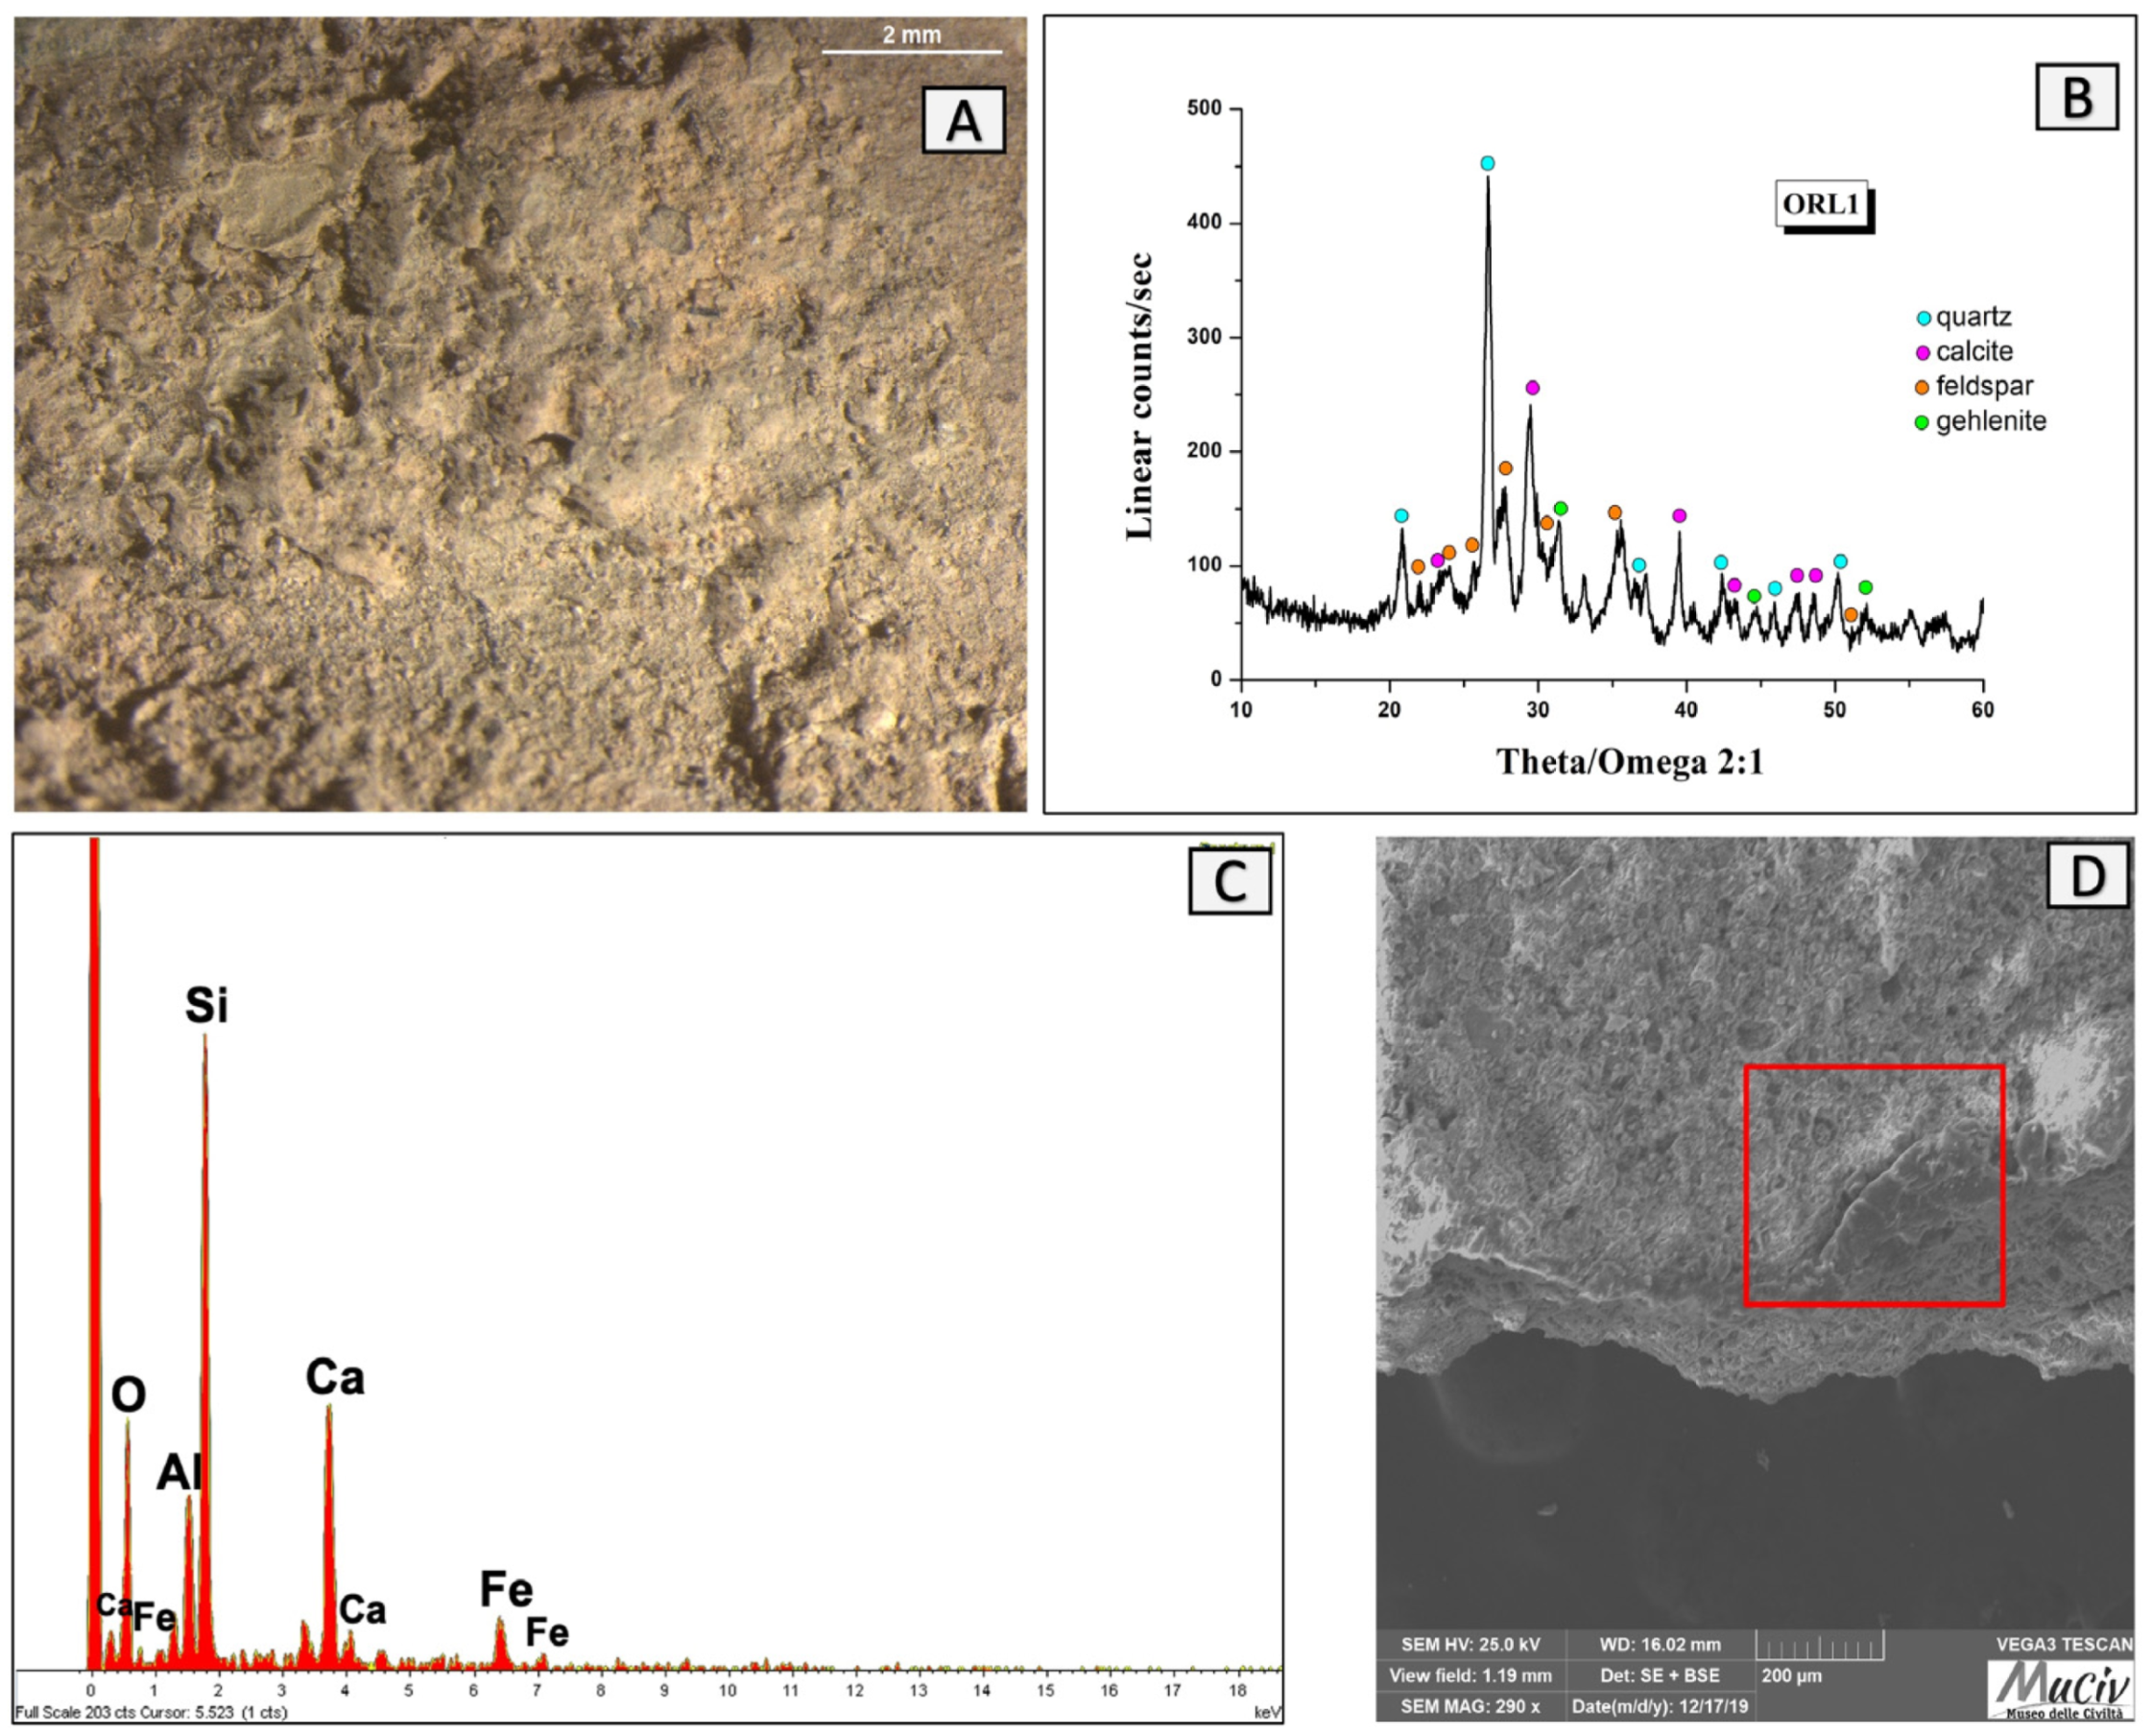
Figure 13.
Surface analysis of glassy layer of neck of ORL1 vessel. (A) Optical and (D) backscattered SEM images of the vitrified surface of the ORL1 fragment (square in red). The XRD spectrum (B) reveals the mineralogical phases present: quartz (SiO2), calcite (CaCO3), albite (NaAlSi3O8), and gehlenite (Ca2Al(AlSi)O7). The EDS spectrum (C) reveals the presence of Si, Ca, Na, K, and Al.
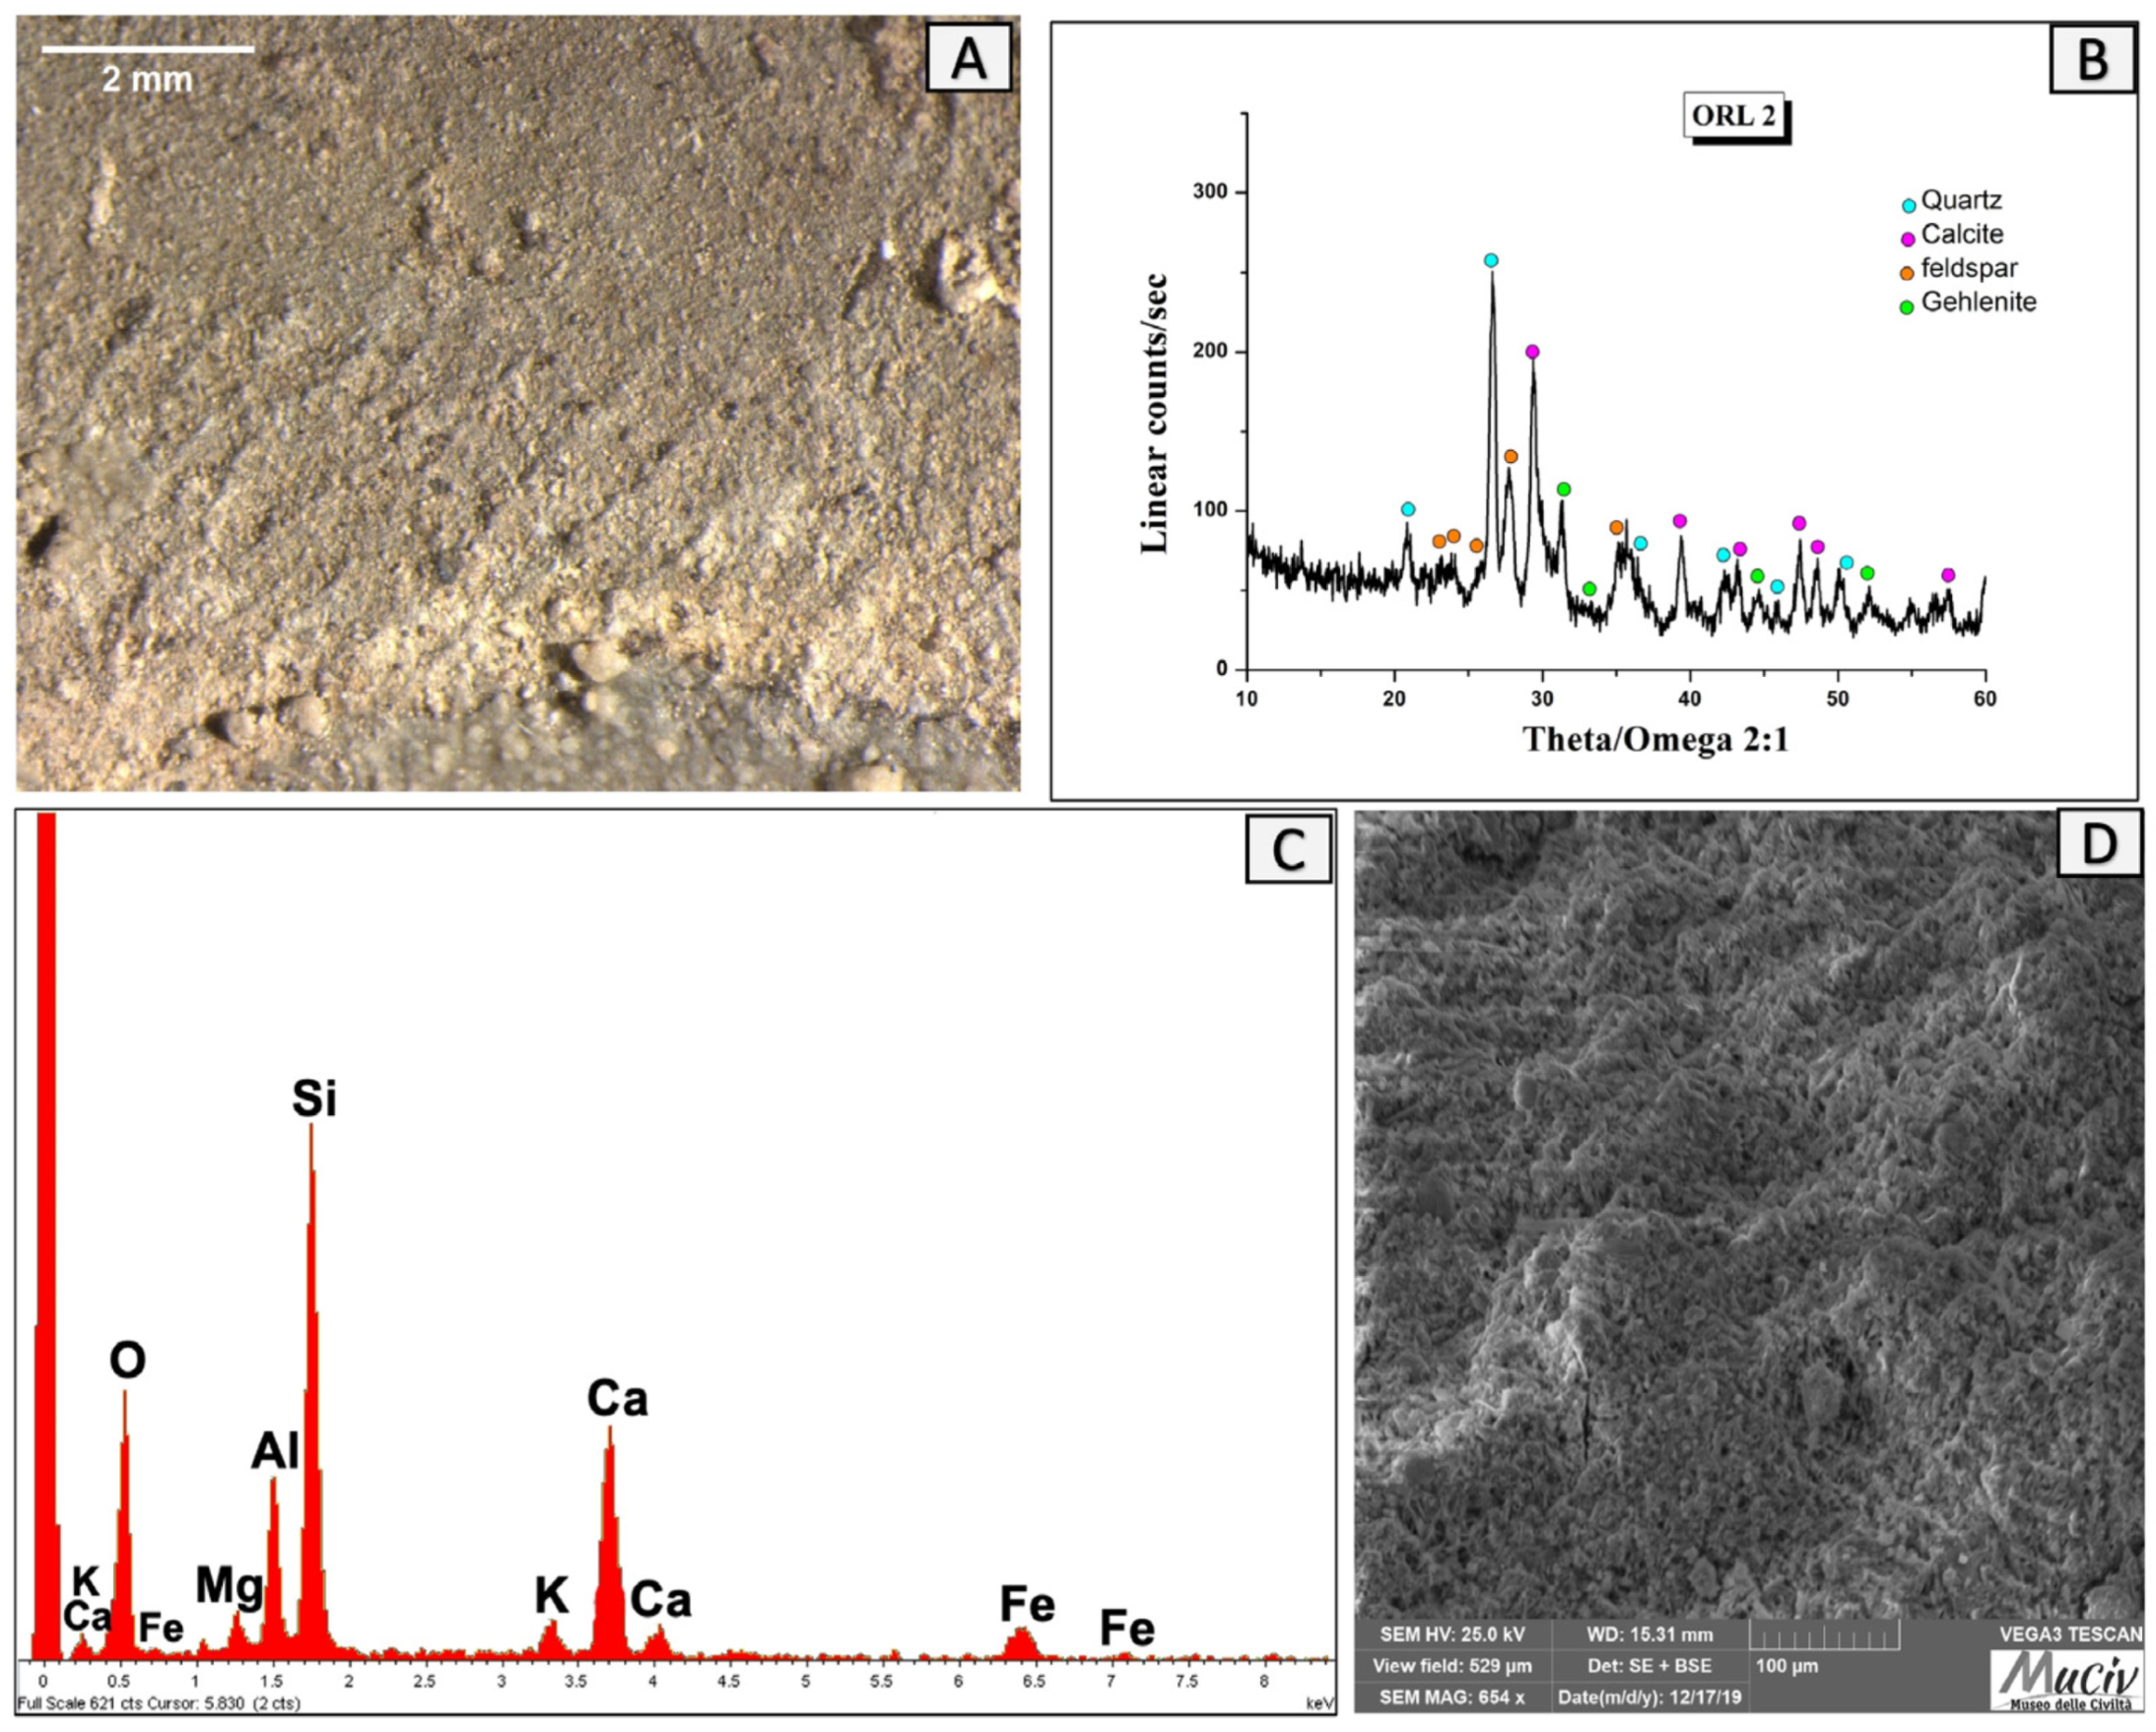
Figure 14.
Surface analysis of neck of ORL2 vessel. (A) Optical and (D) backscattered SEM images of the ceramic surface. The XRD spectrum (B) reveals the presence of quartz (SiO2), calcite (CaCO3), albite (NaAlSi3O8), and gehlenite (Ca2Al(AlSi)O7). The EDS area spectrum (C) reveals high concentrations of Si, Al, and Ca and reduced quantities of Fe and K.
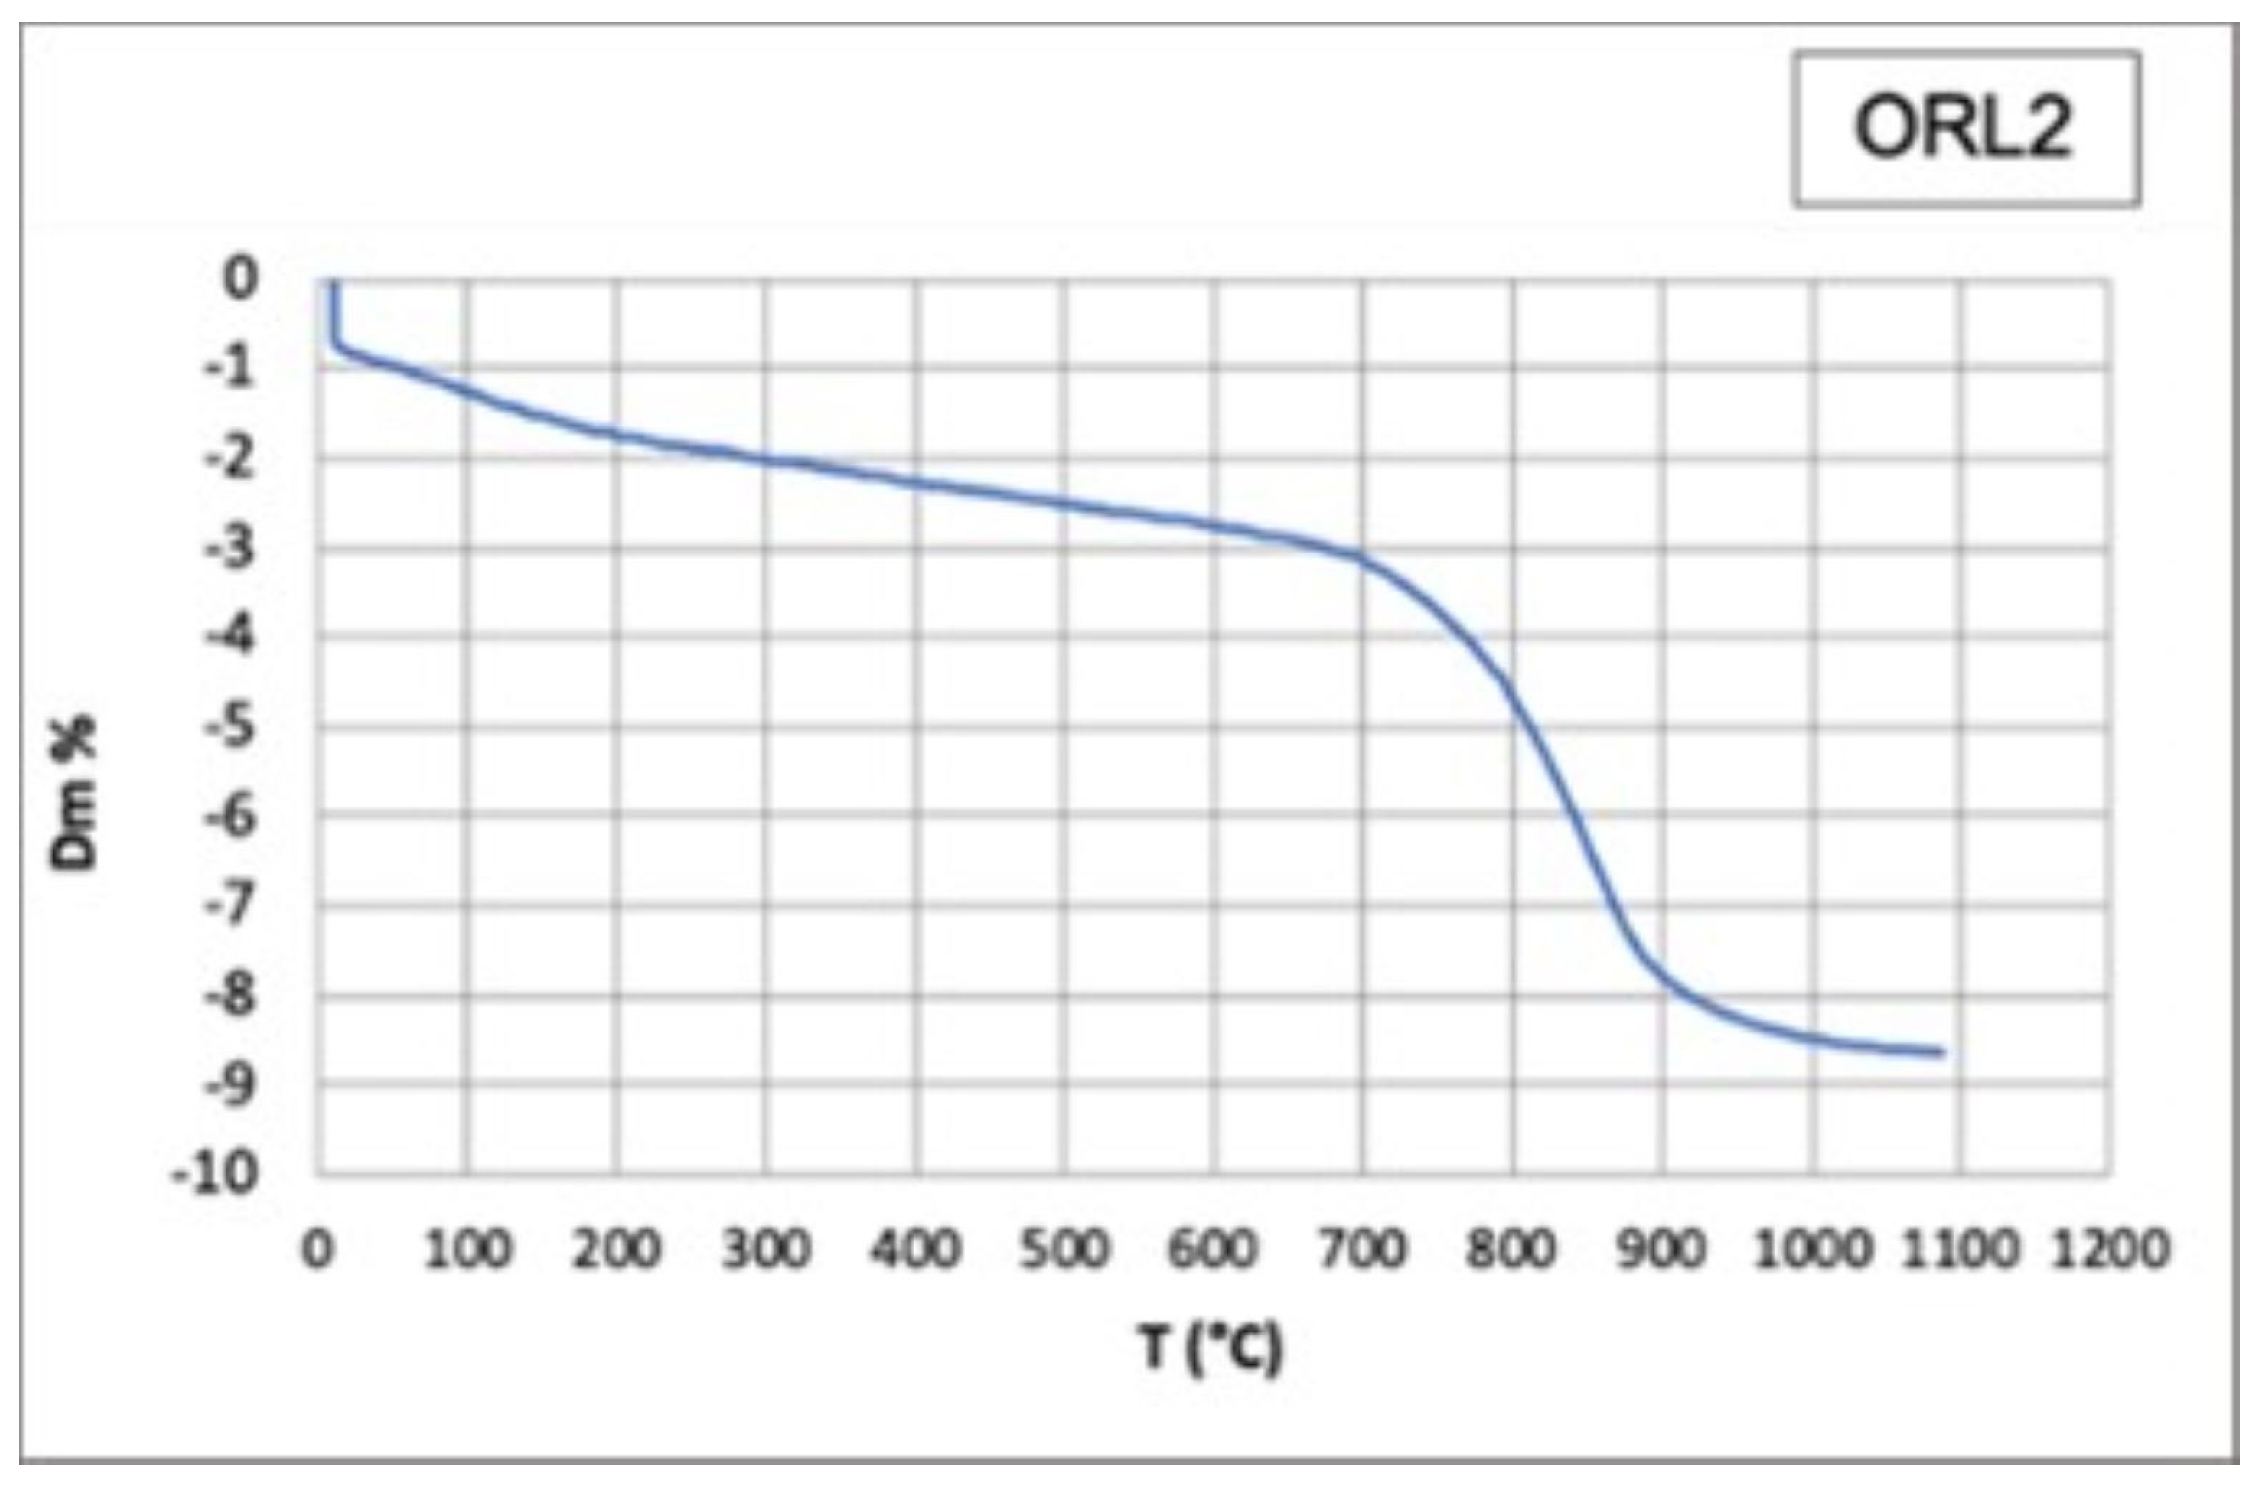
Figure 15.
Thermogravimetric analysis (TG) of the ORL2 fragment shows a point of flex between 700 °C and 900 °C, which is attributed to the decomposition of the calcite.
Figure 15.
Thermogravimetric analysis (TG) of the ORL2 fragment shows a point of flex between 700 °C and 900 °C, which is attributed to the decomposition of the calcite.
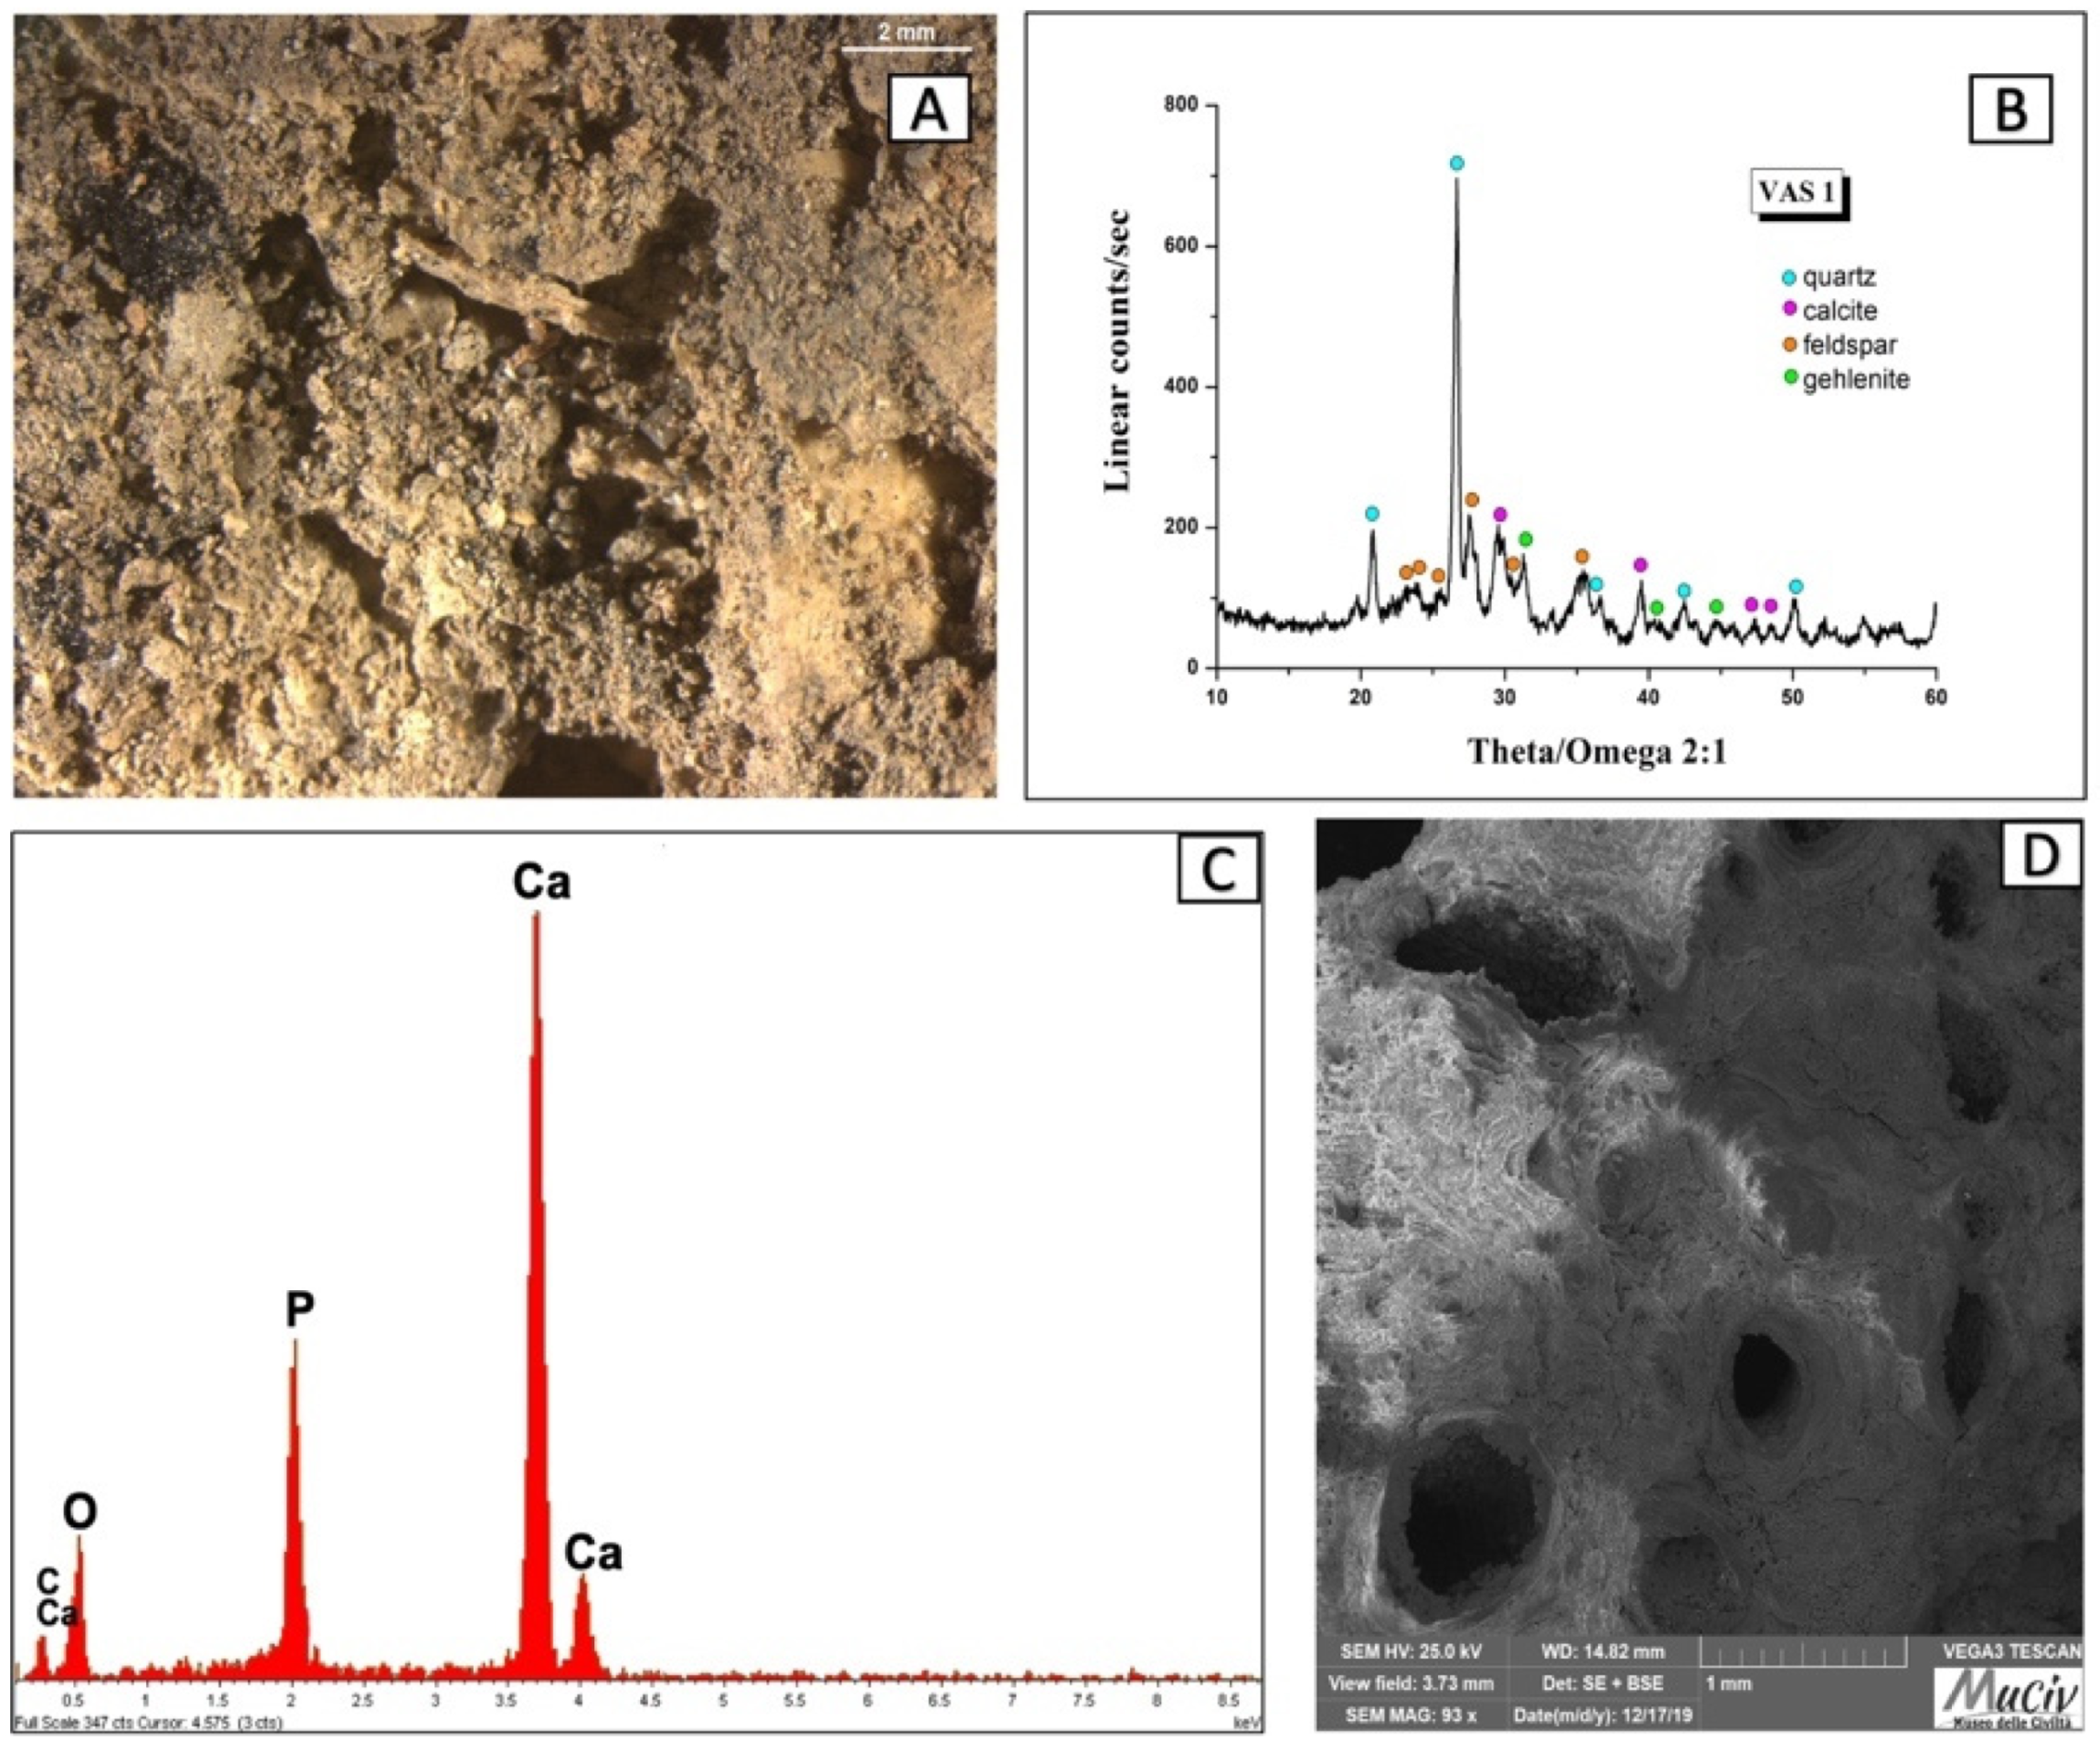
Figure 16.
Surface analysis of the material attached to fragment of VAS1 vessel. (A) Optical and (D) backscattered SEM images (D) of the bottom remains. The XRD spectrum of the ceramic item (B) reveals the mineralogical phases present: quartz (SiO2), calcite (CaCO3), feldspar-albite (NaAlSi3O8), and gehlenite (Ca2Al(AlSi)O7)). The EDS spectrum (C) of the bottom remains reveals the presence of Ca and P due to the presence of hydroxyapatite, Ca10(PO4)6(OH)2.
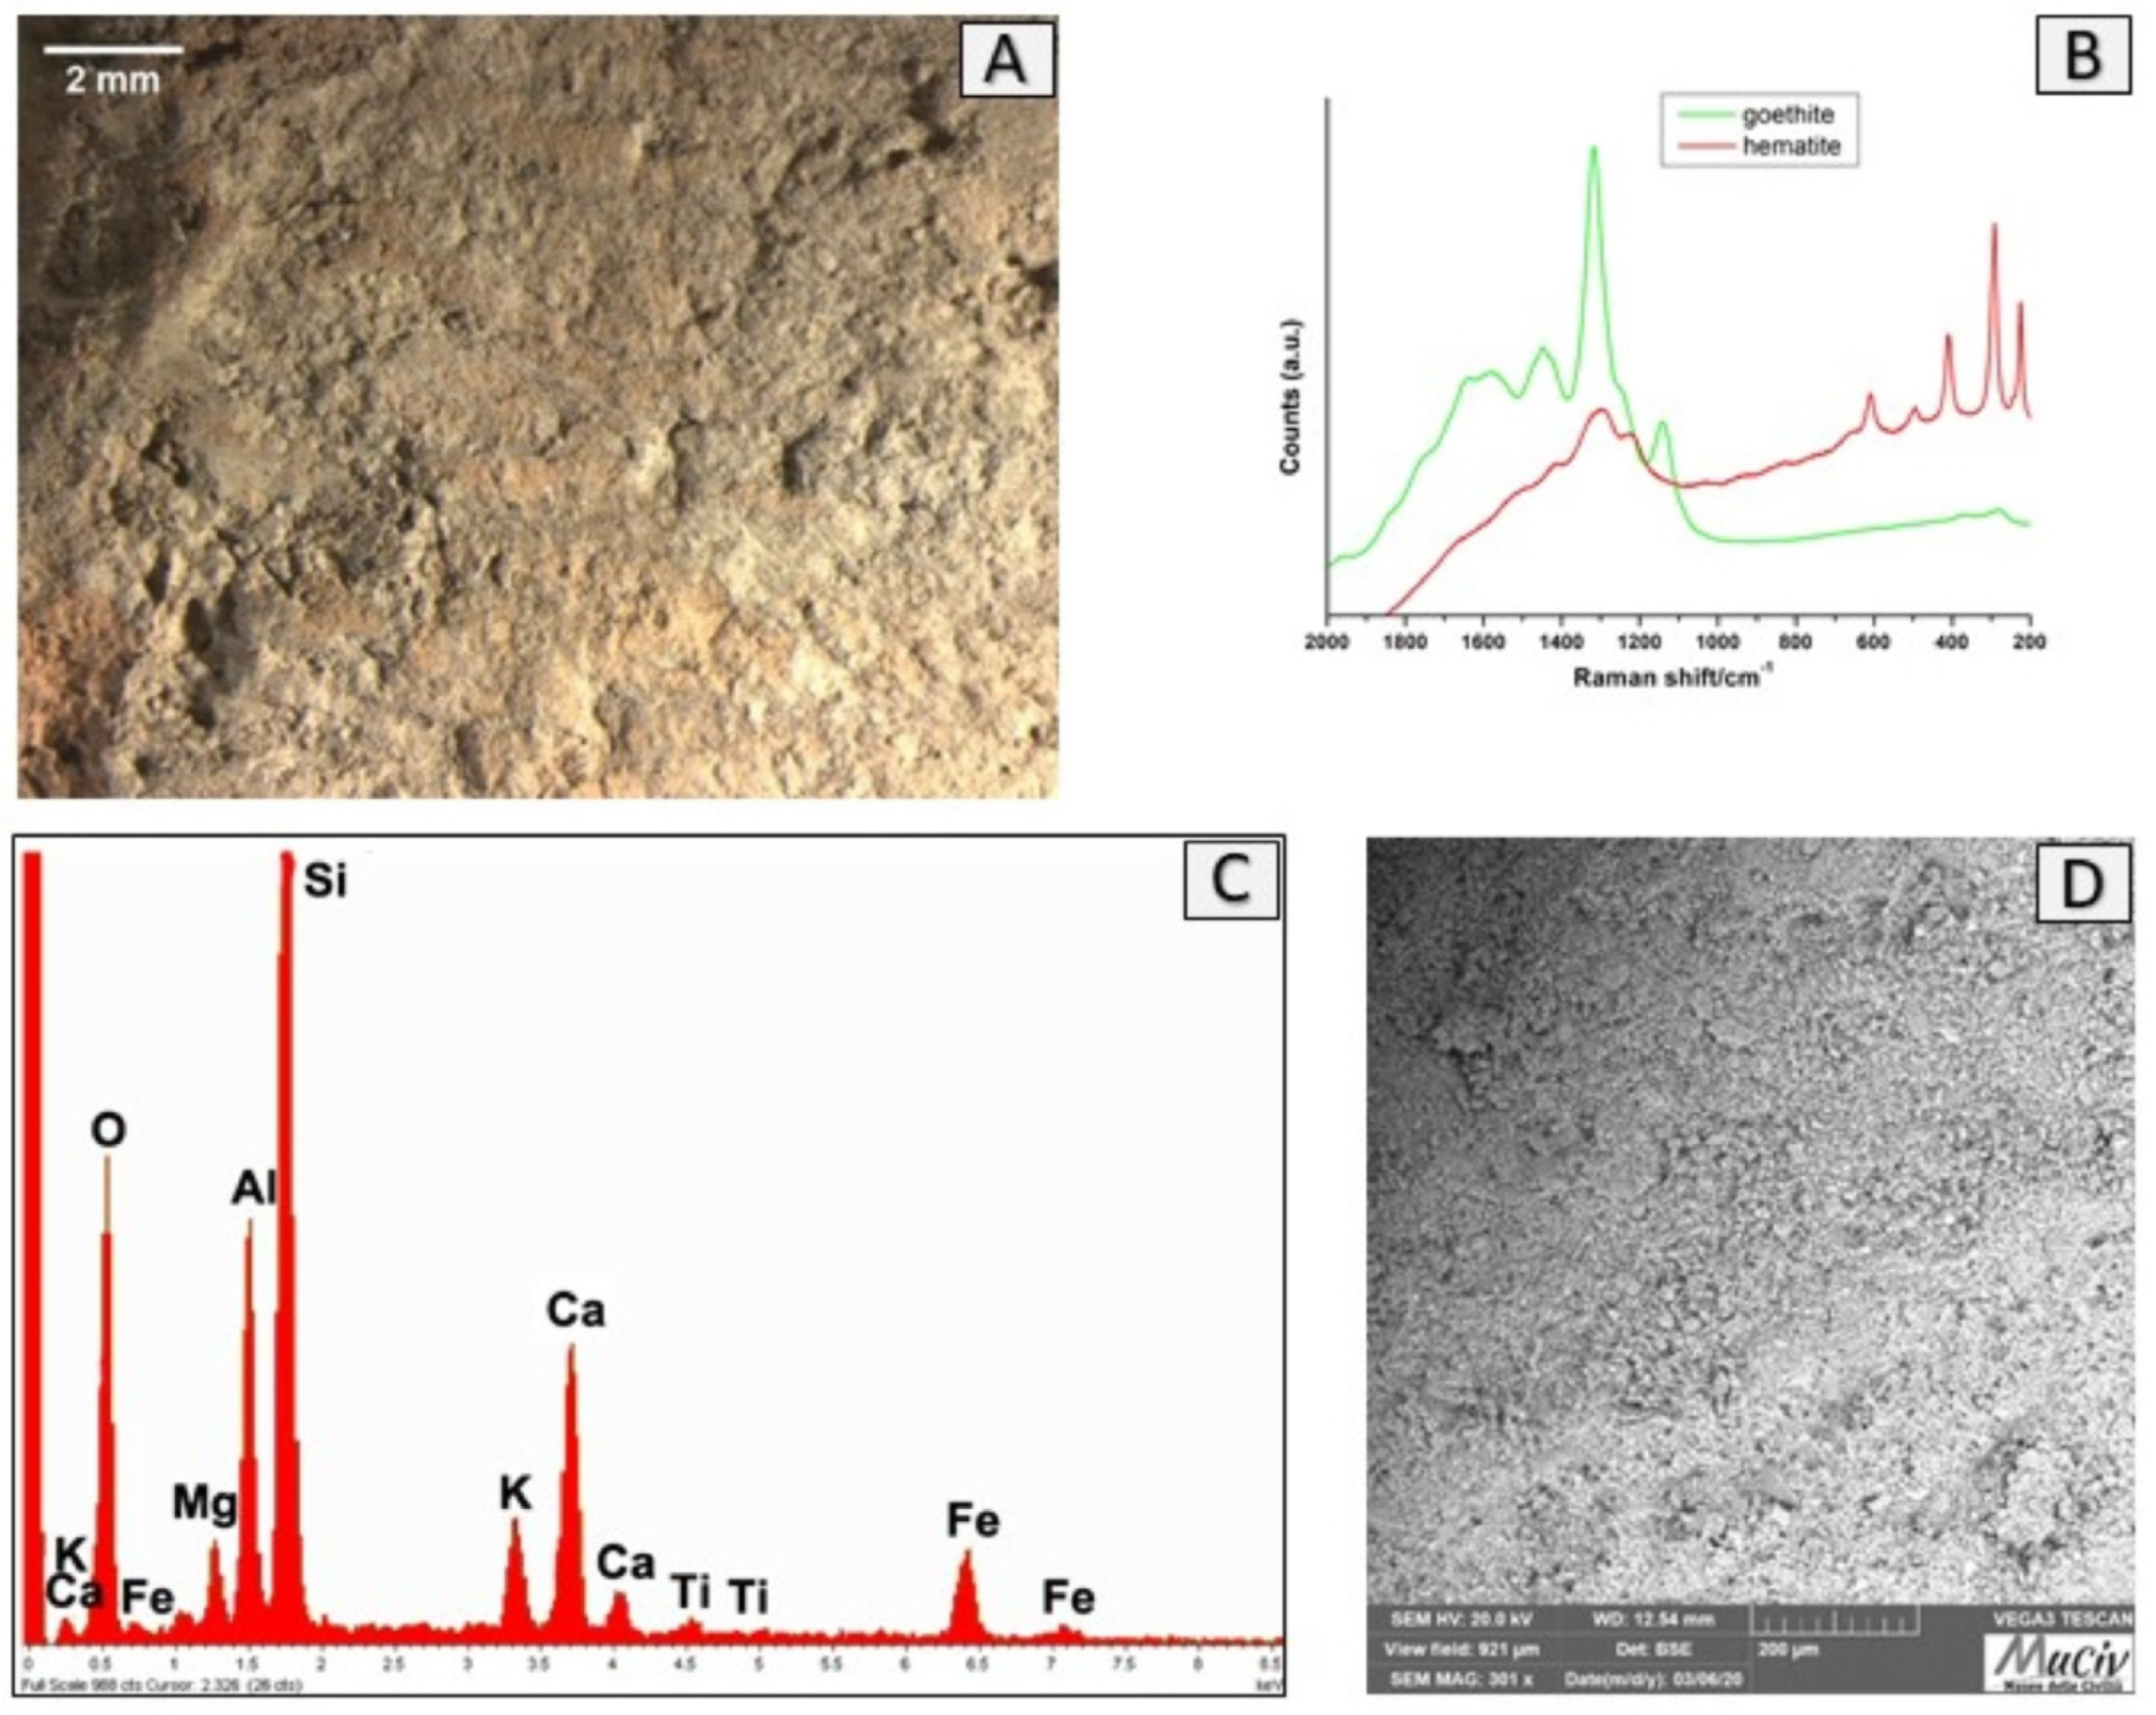
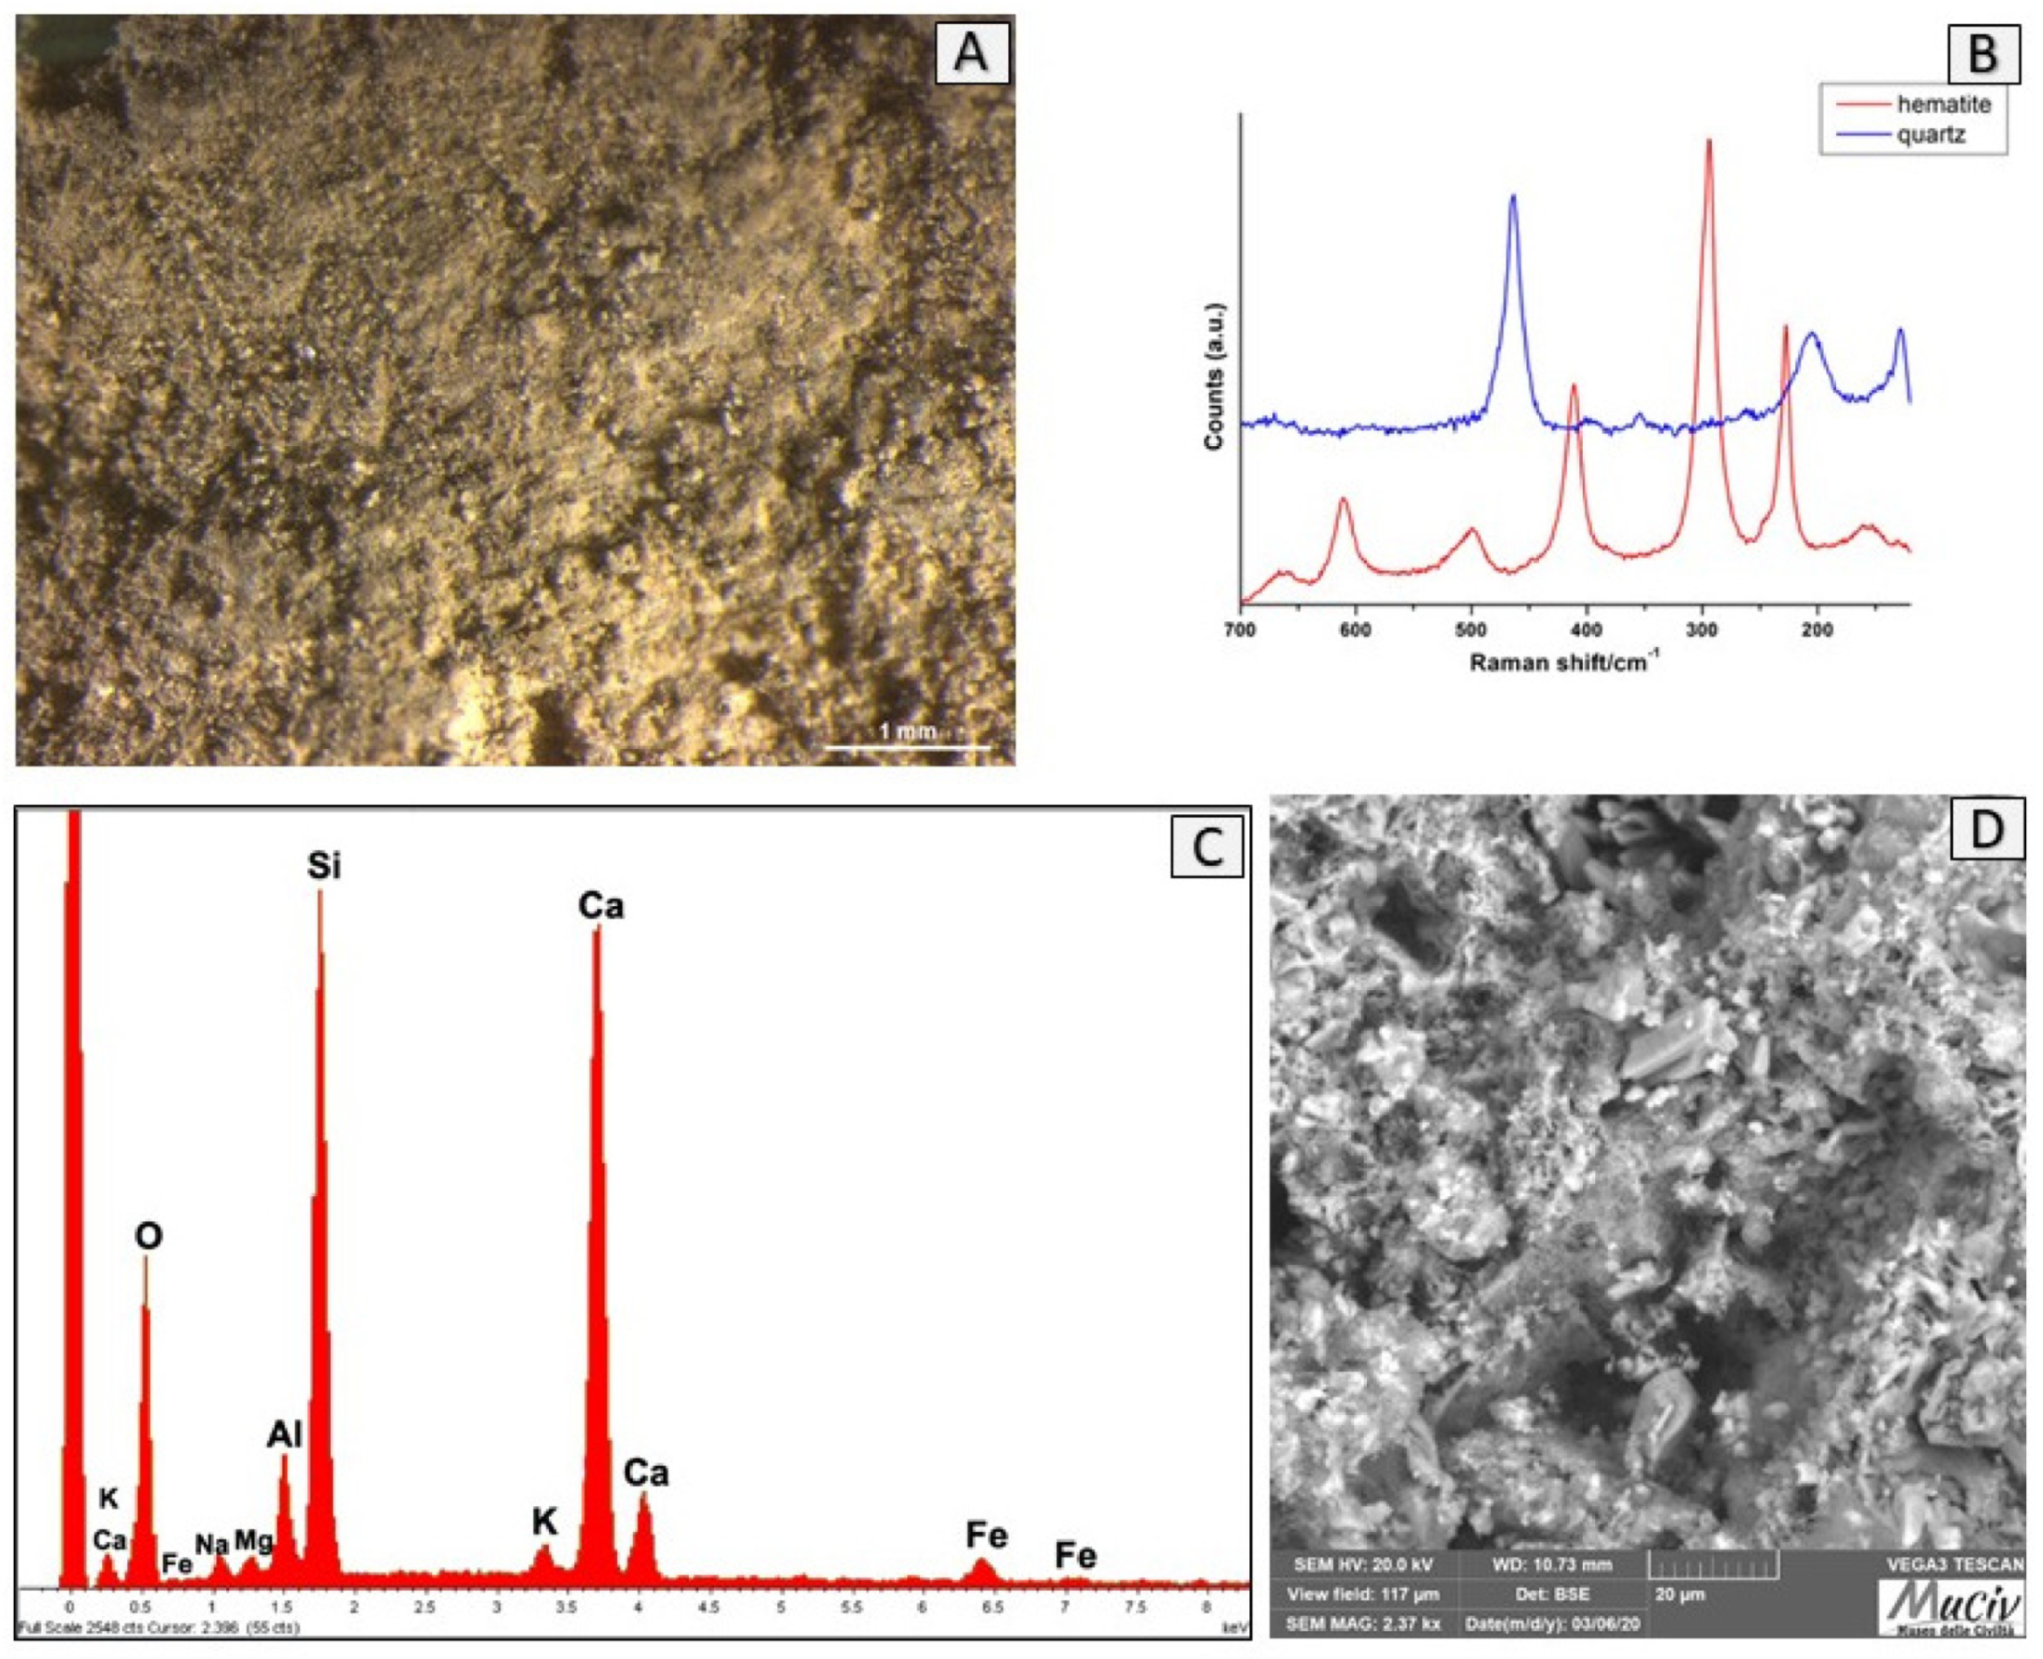
Figure 17.
Surface analysis of the base of VAS2 vessel. (A) Optical and (D) backscattered SEM images of the ceramic surface. The µ-Raman spectra (B) reveal the presence of goethite (FeO(OH)) and hematite (Fe2O3). The EDS spectrum (C) highlights the presence of Si, Al, and Ca and smaller quantities of Fe, K, Mg, and Ti.
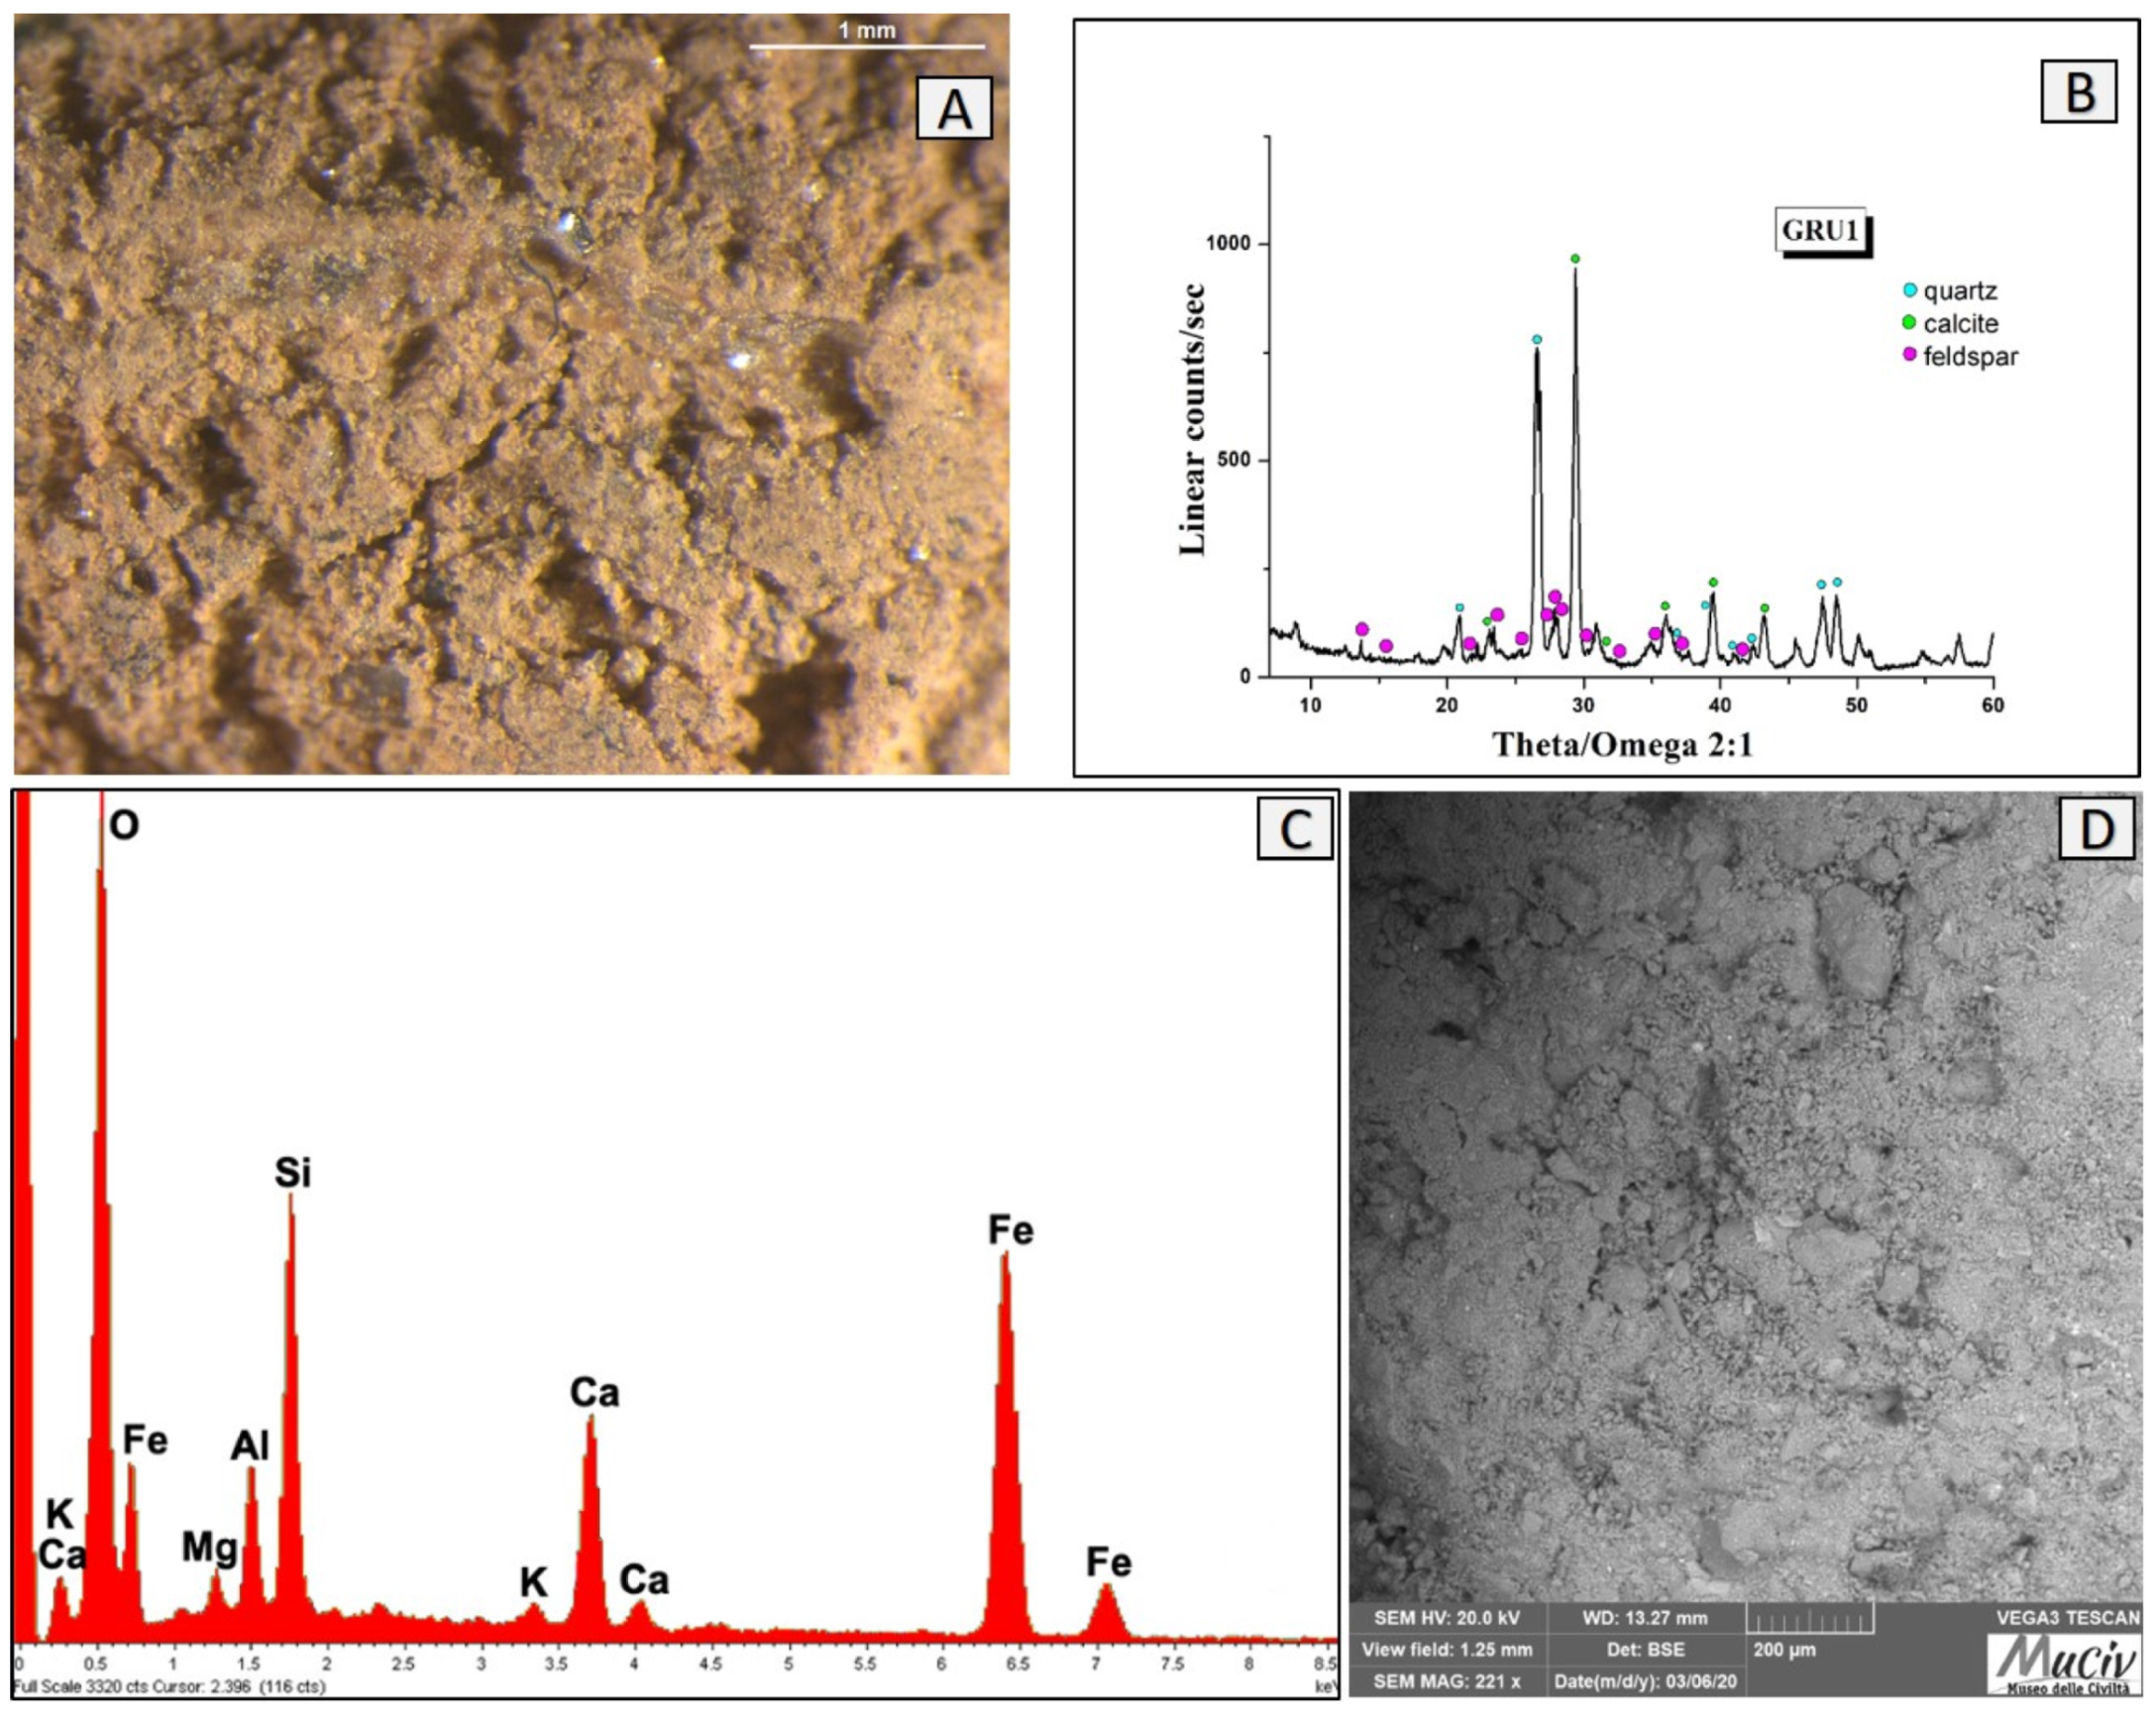
Figure 18.
Surface area analysis of red clay GRU1. (A) Optical and (D) backscattered SEM images of the clay. The XRD spectrum (B) reveals the mineralogical phases present: quartz (SiO2), calcite (CaCO3), and albite-feldspar (NaAlSiO3). The EDS area spectrum (C) reveals the presence of Si, Fe, and Ca and low contents of Al and Mg.
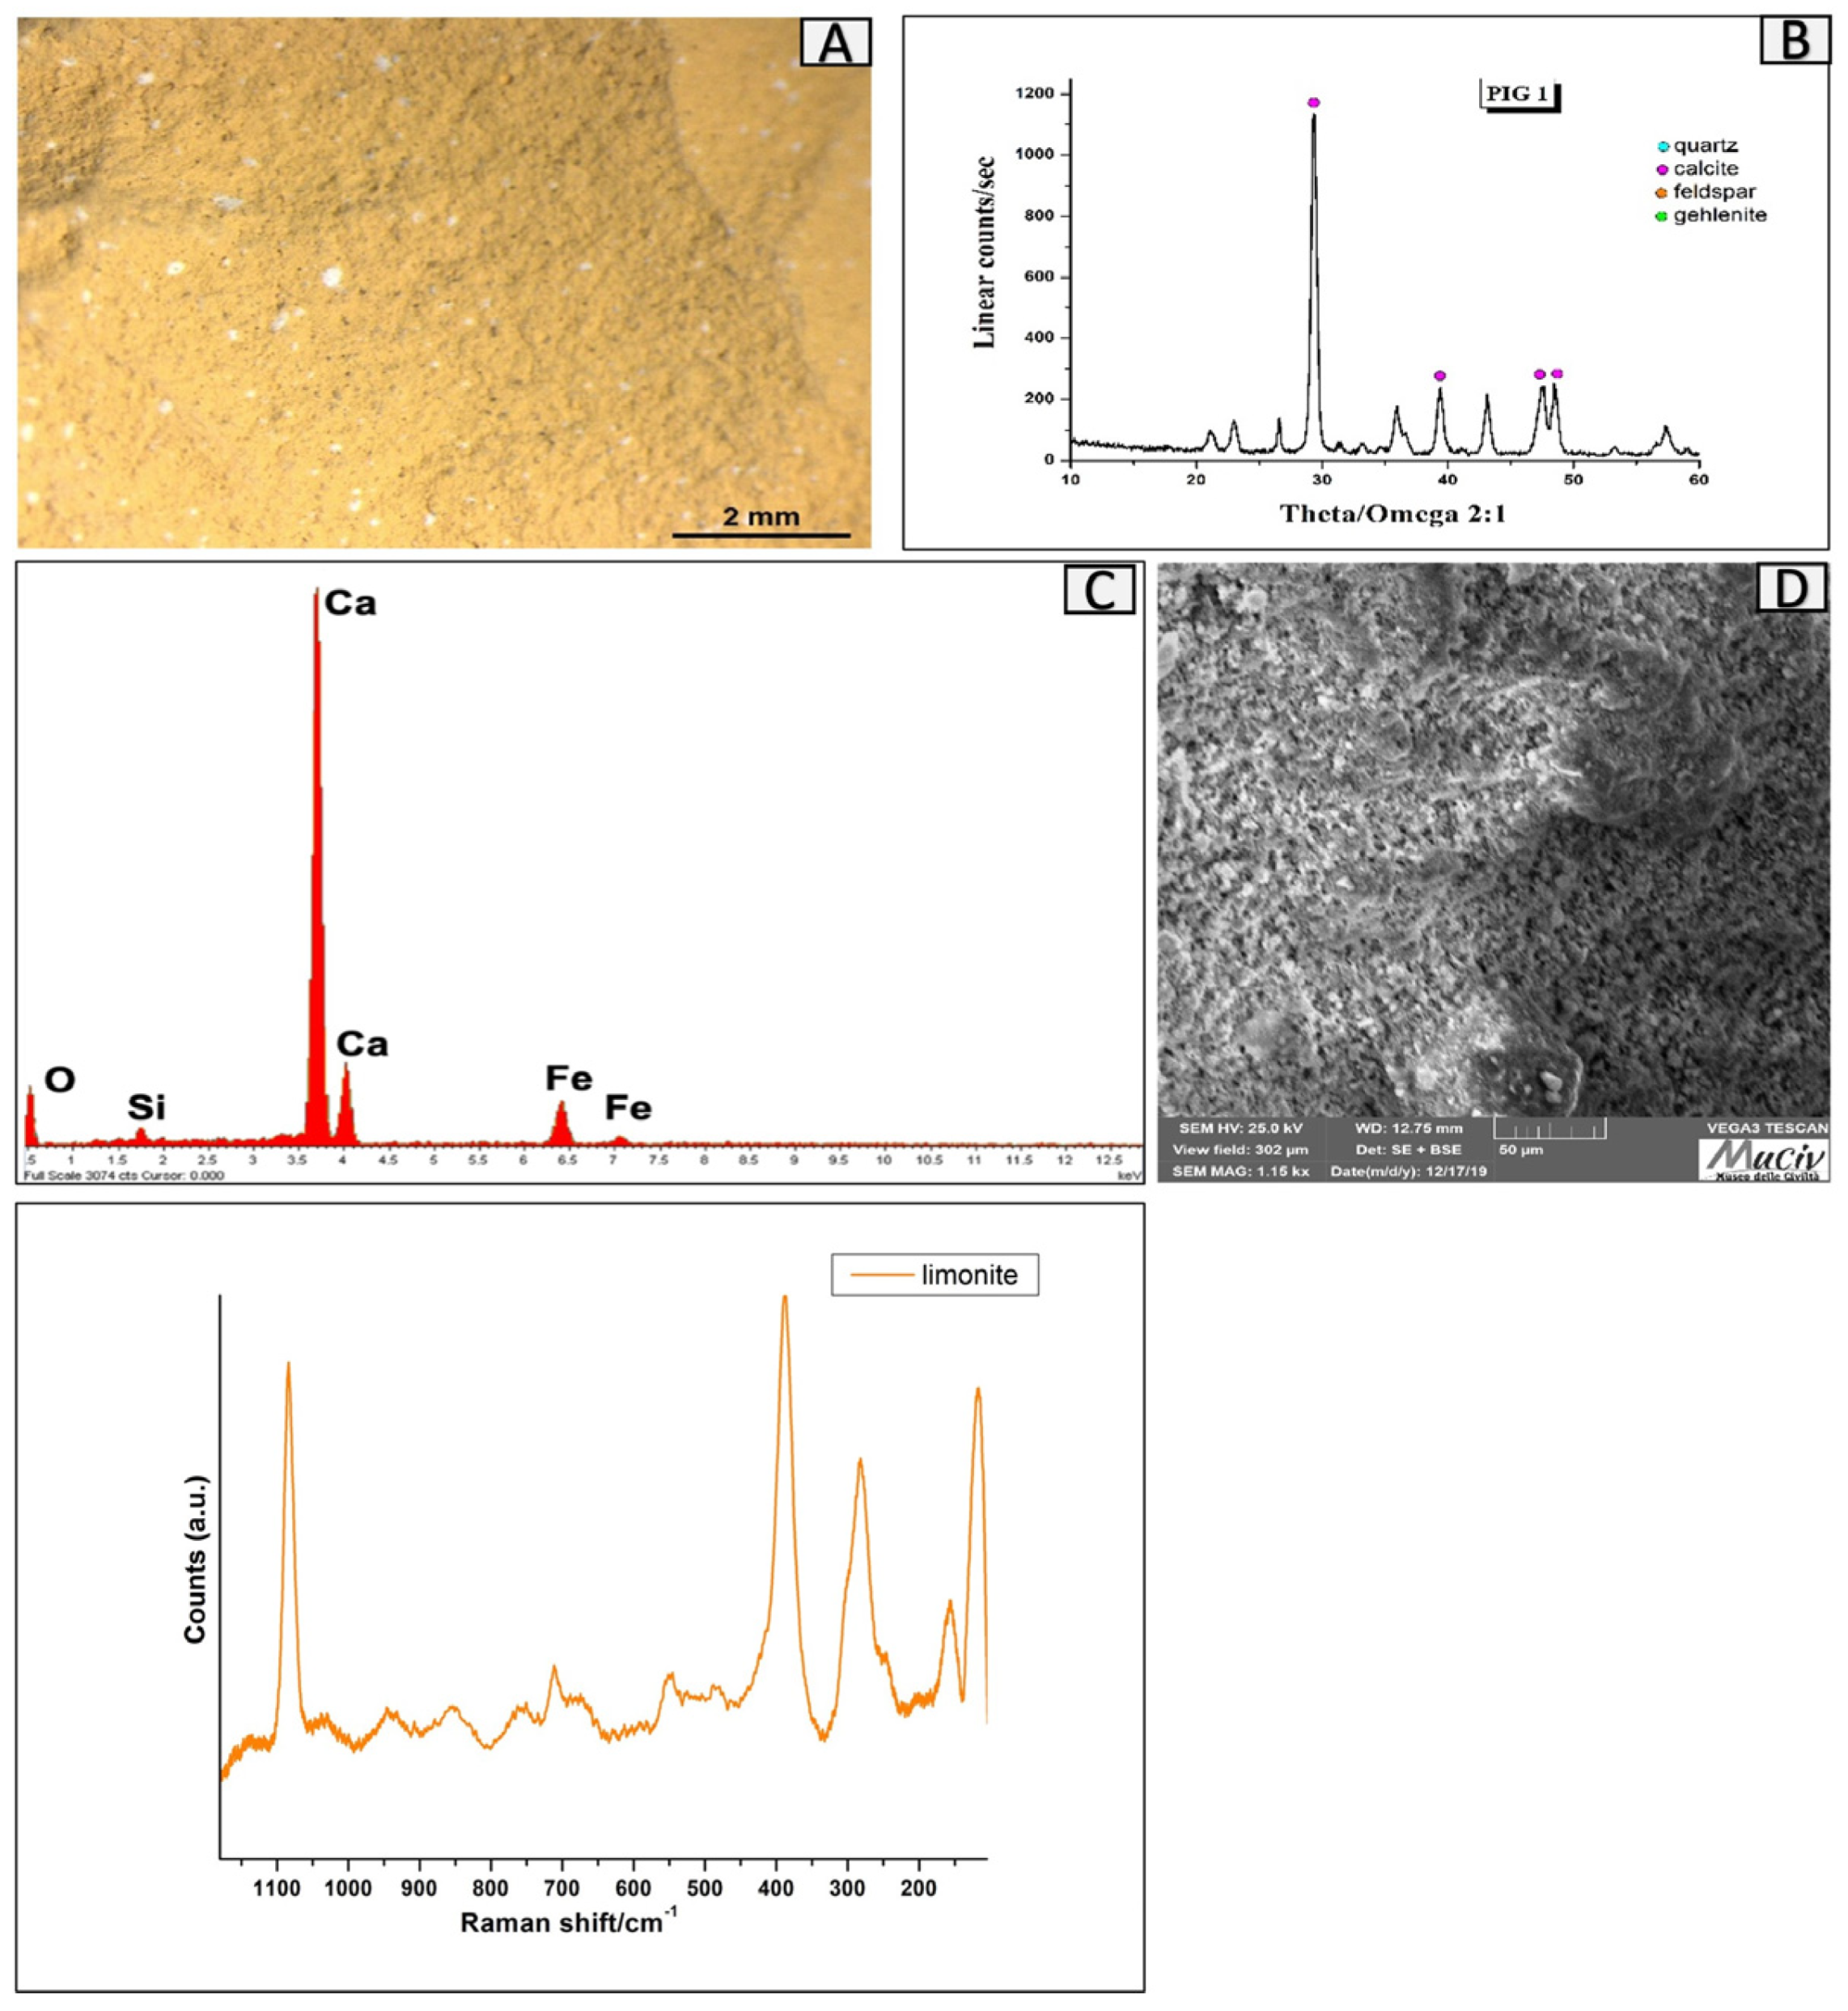
Figure 19.
Surface area analysis of yellow clay, PIG1. (A) Optical and (D) backscattered SEM images of the clay. The XRD spectrum (B) identifies calcite (CaCO3), quartz (SiO2), feldspar (albite-NaAlSi3O8), and goethite (FeO(OH)). The EDS area spectrum (C) reveals the presence of Ca, Fe, and Si. The µ-Raman spectrum (E) highlights the presence of limonite, (FeO(OH)•nH2O.
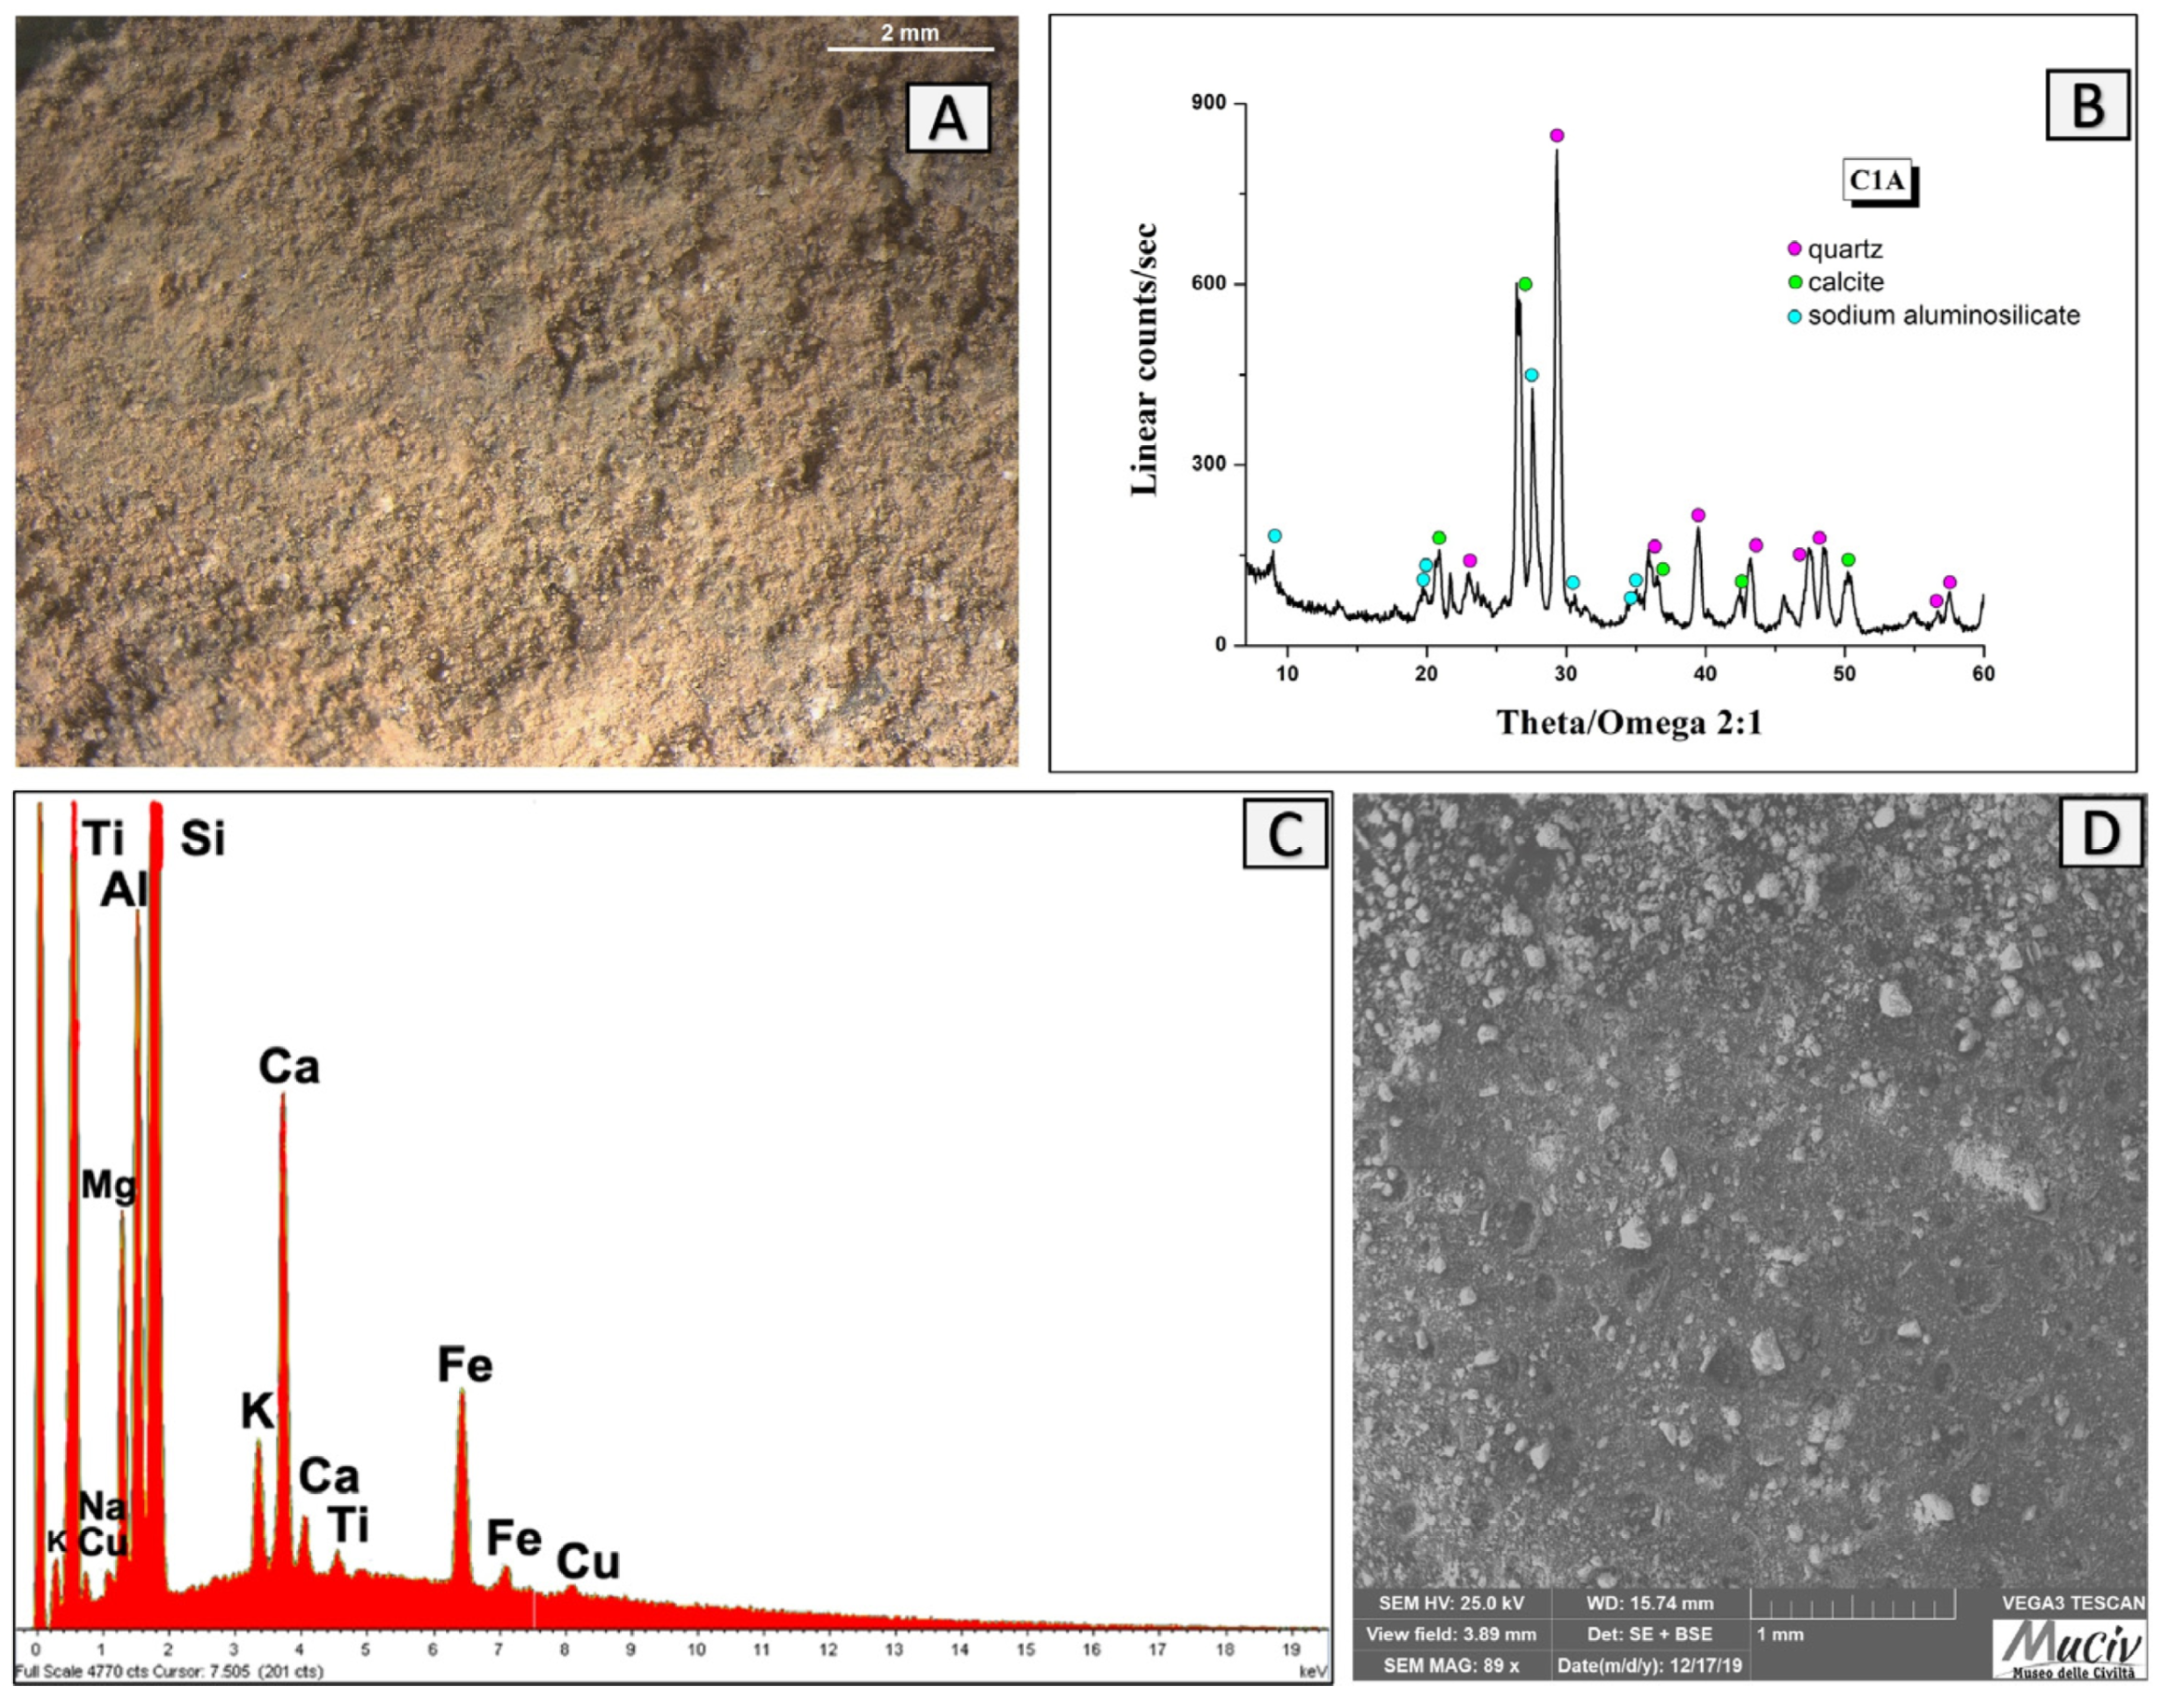
Figure 20.
Surface area analysis of C1A fired clay. (A) Optical and (D) backscattered SEM images of fired clay. The XRD spectrum (B) reveals the mineralogical phases present: quartz (SiO2), calcite (CaCO3), and high albite (NaAlSiO3). The EDS area analysis (C) revealed high contents of Si, Ca, and smaller amounts of Al, Ti, and Fe.
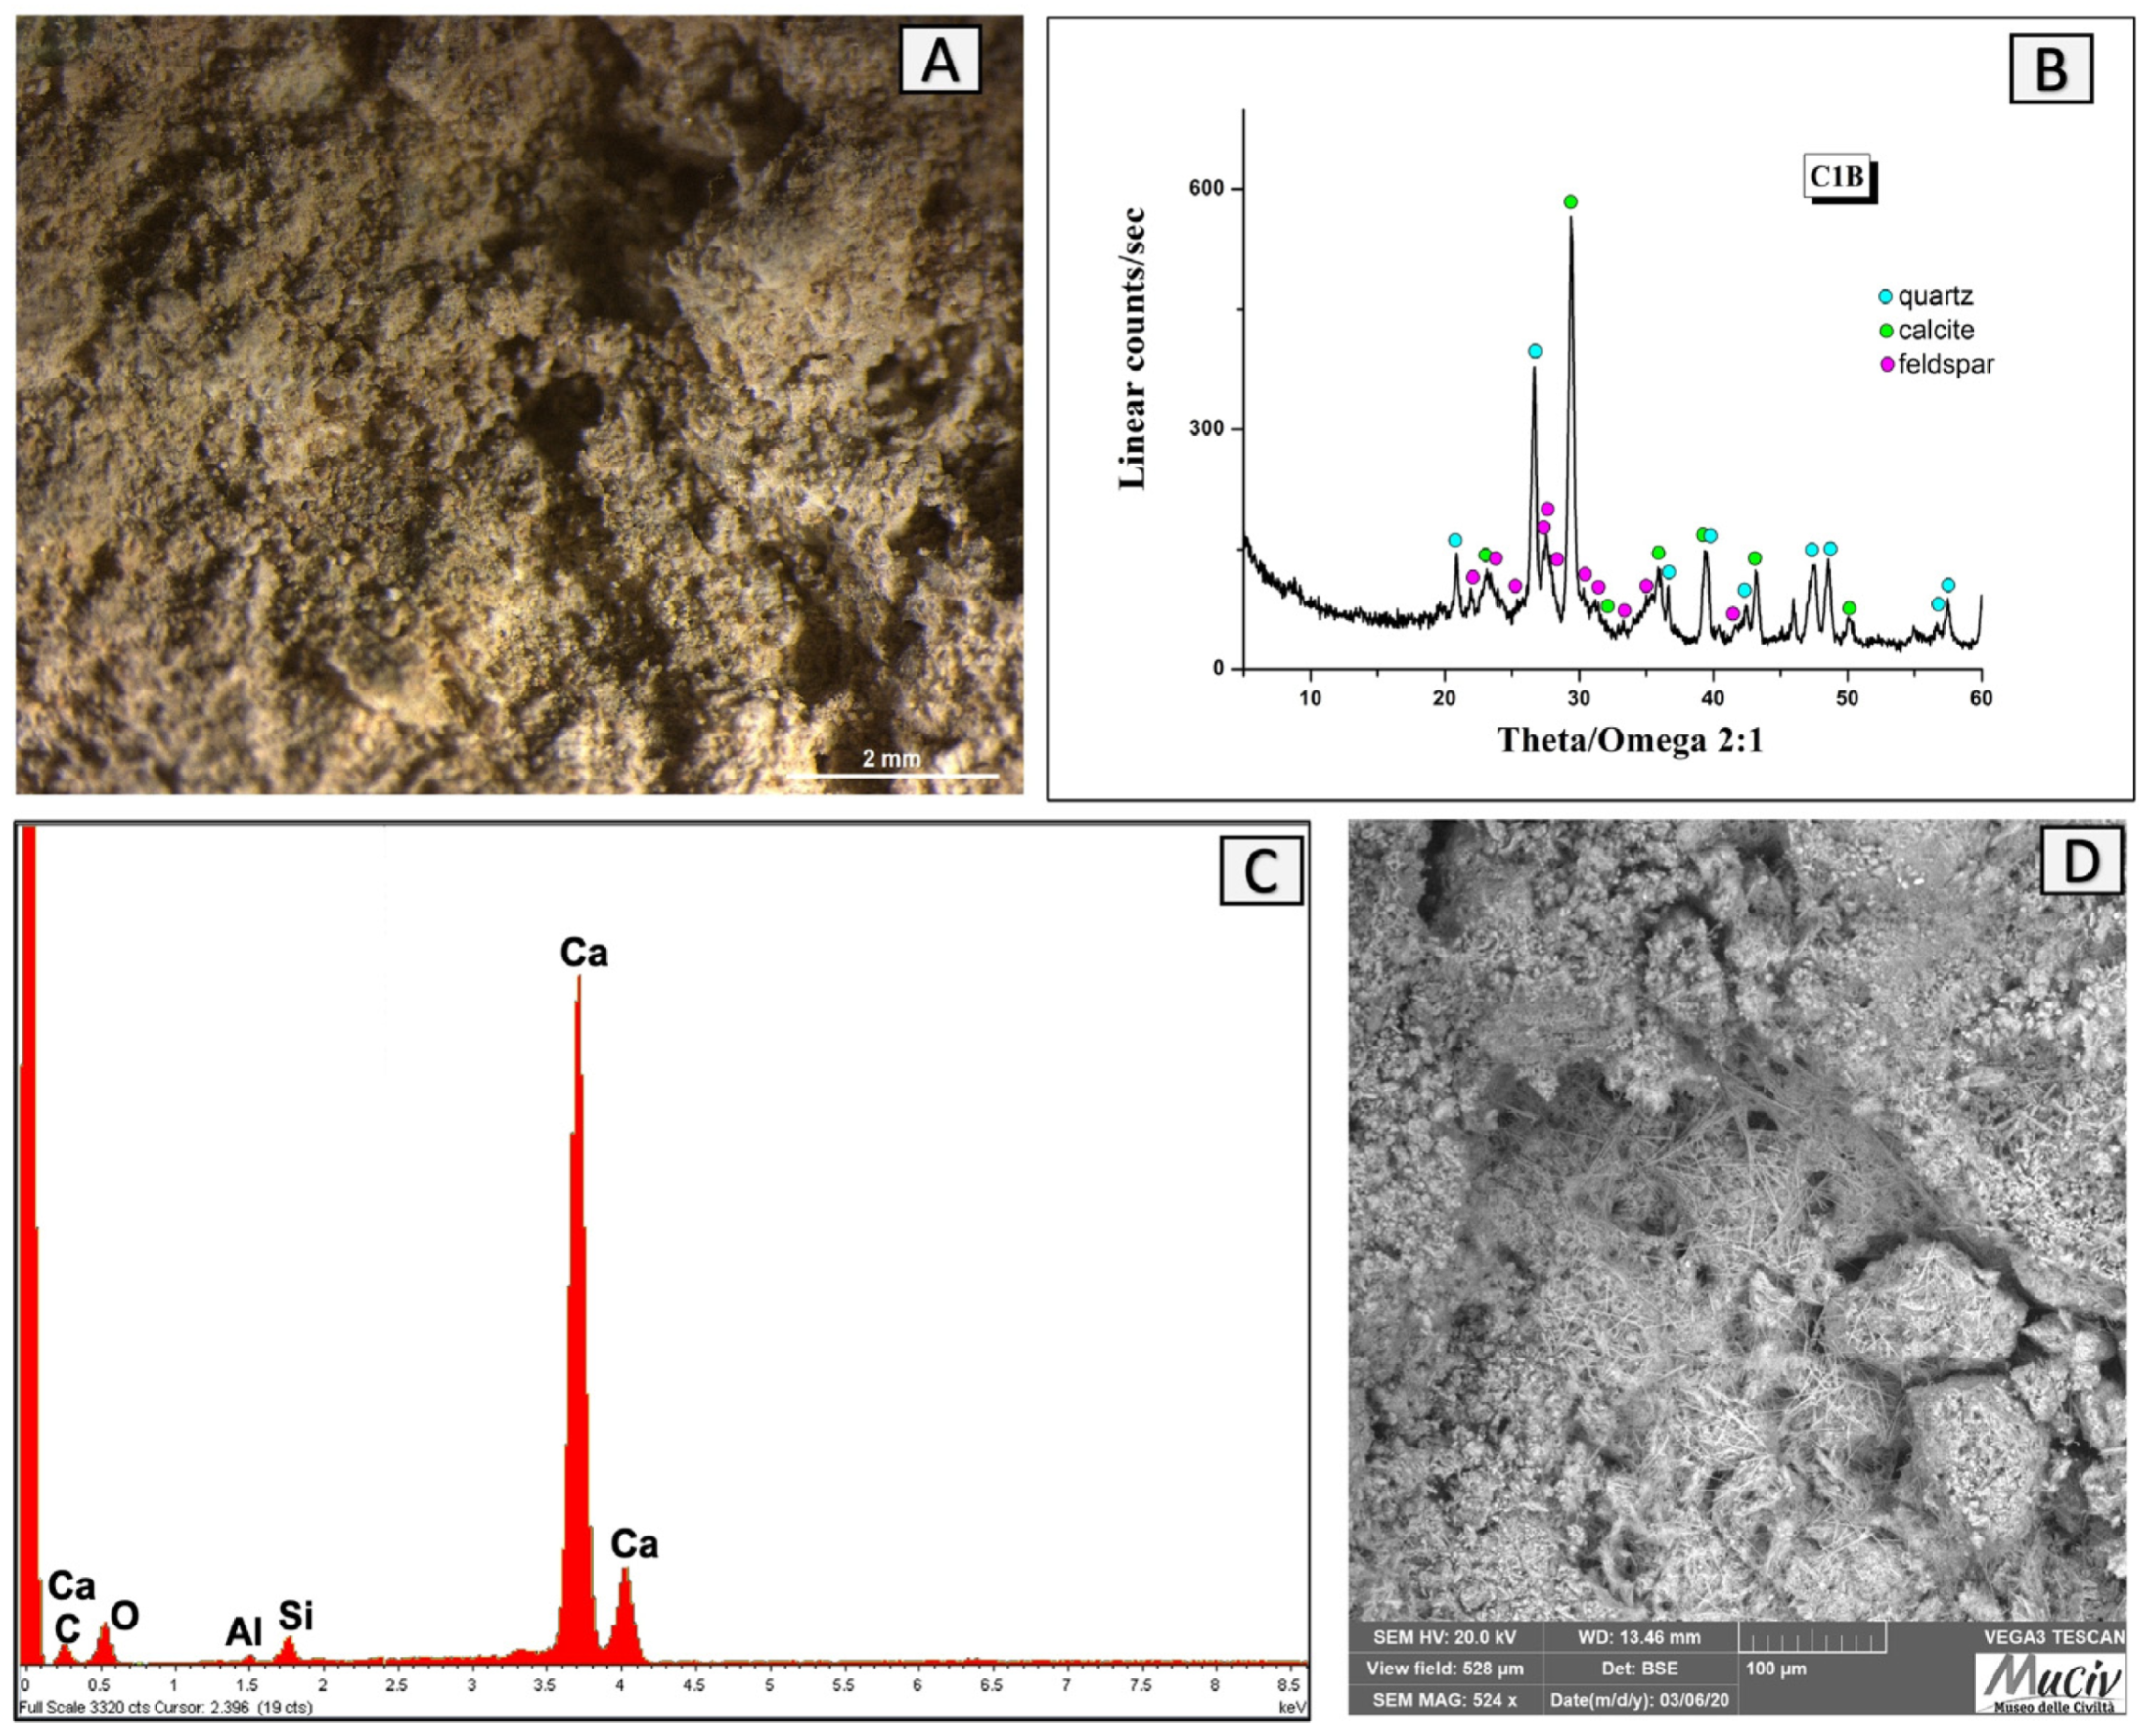
Figure 21.
Surface area analysis of C1B fired clay. (A) Optical and (D) backscattered SEM images of fired clay. The XRD spectrum (B) reveals the mineralogical phases present: quartz (SiO2), calcite (CaCO3), and high albite (NaAlSiO3). The EDS area analysis (C) detected a high amount of Ca and low concentrations of Si and Al.
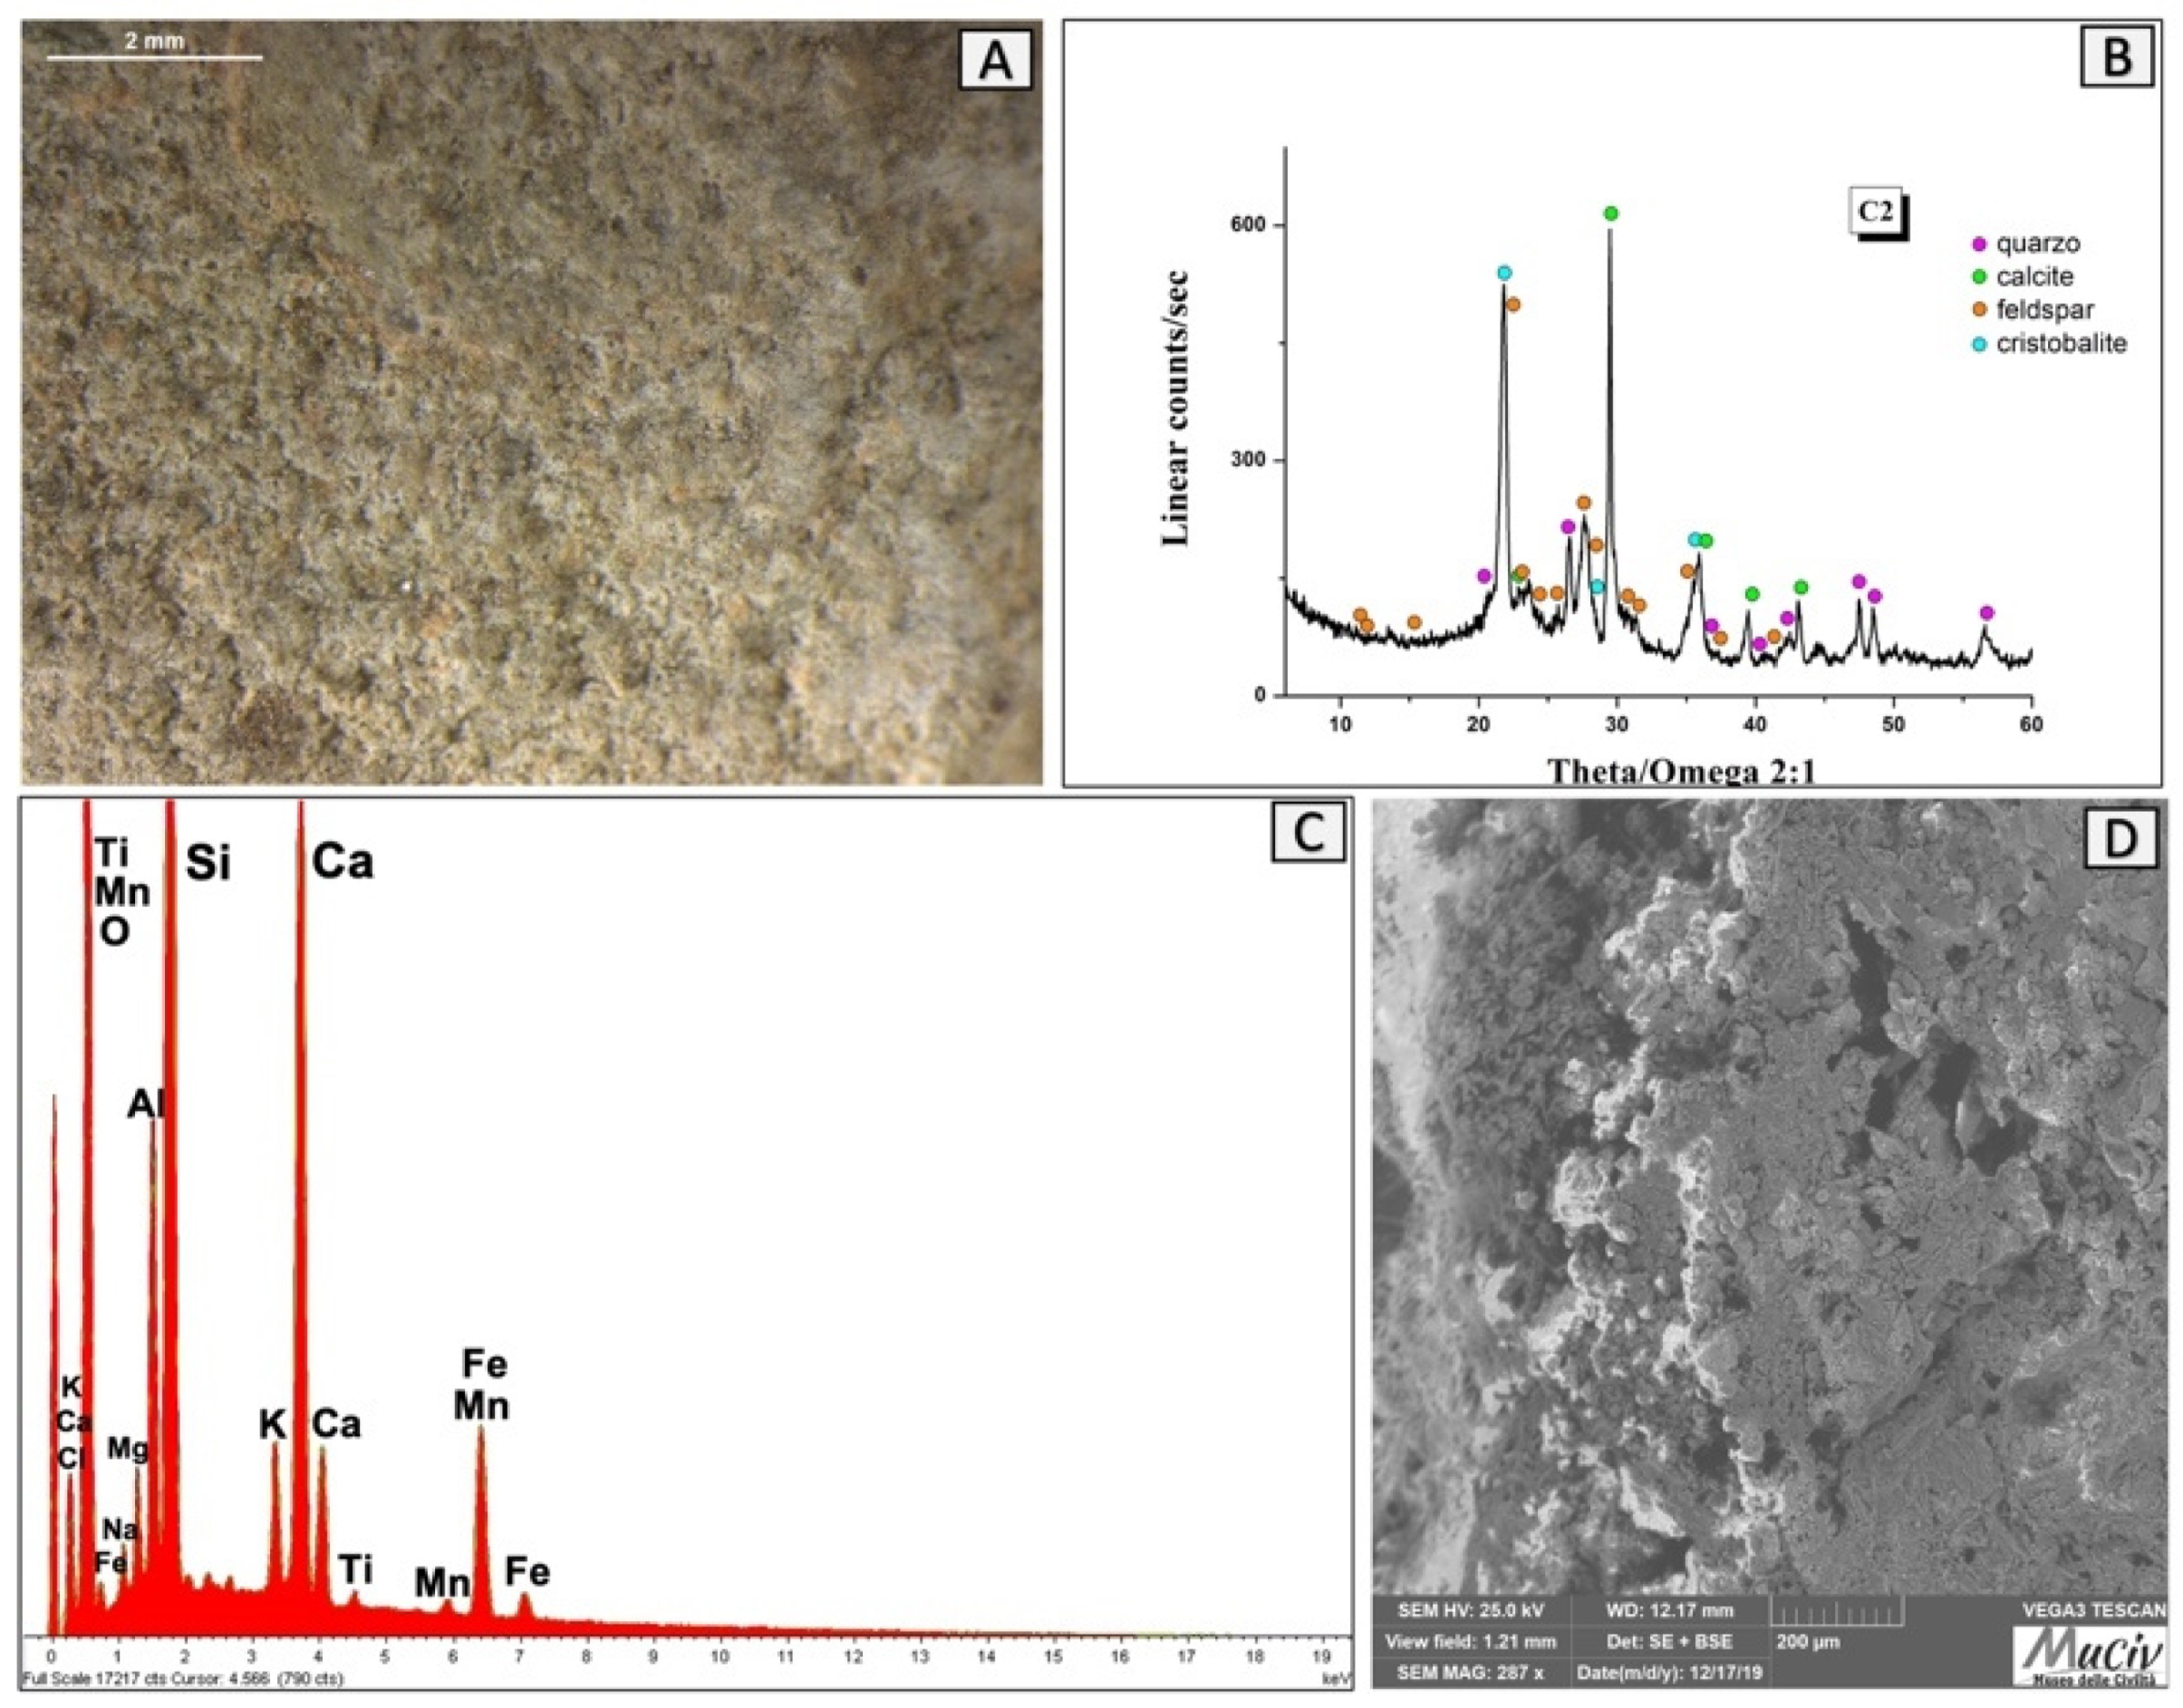
Figure 22.
Surface area analysis of fired clay C2. (A) Optical and (D) backscattered SEM images of fired clay. The XRD spectrum (B) reveals the mineralogical phases present: quartz (SiO2), calcite (CaCO3), high albite (NaAlSiO3), and hematite (Fe2O3). The EDS analysis (C) detected the presence of Ca, Si, Al, Fe, and Mn.
Figure 23.
Surface analysis of C3 fired clay. (A) Optical and (D) backscattered SEM images of fired clay. The XRD spectrum (B) reveals the mineralogical phases present: quartz (SiO2), goethite (FeO(OH)), and hematite (Fe2O3). The EDS area analysis (C) detected the presence of Si, Ca, and Al.
Figure 23.
Surface analysis of C3 fired clay. (A) Optical and (D) backscattered SEM images of fired clay. The XRD spectrum (B) reveals the mineralogical phases present: quartz (SiO2), goethite (FeO(OH)), and hematite (Fe2O3). The EDS area analysis (C) detected the presence of Si, Ca, and Al.
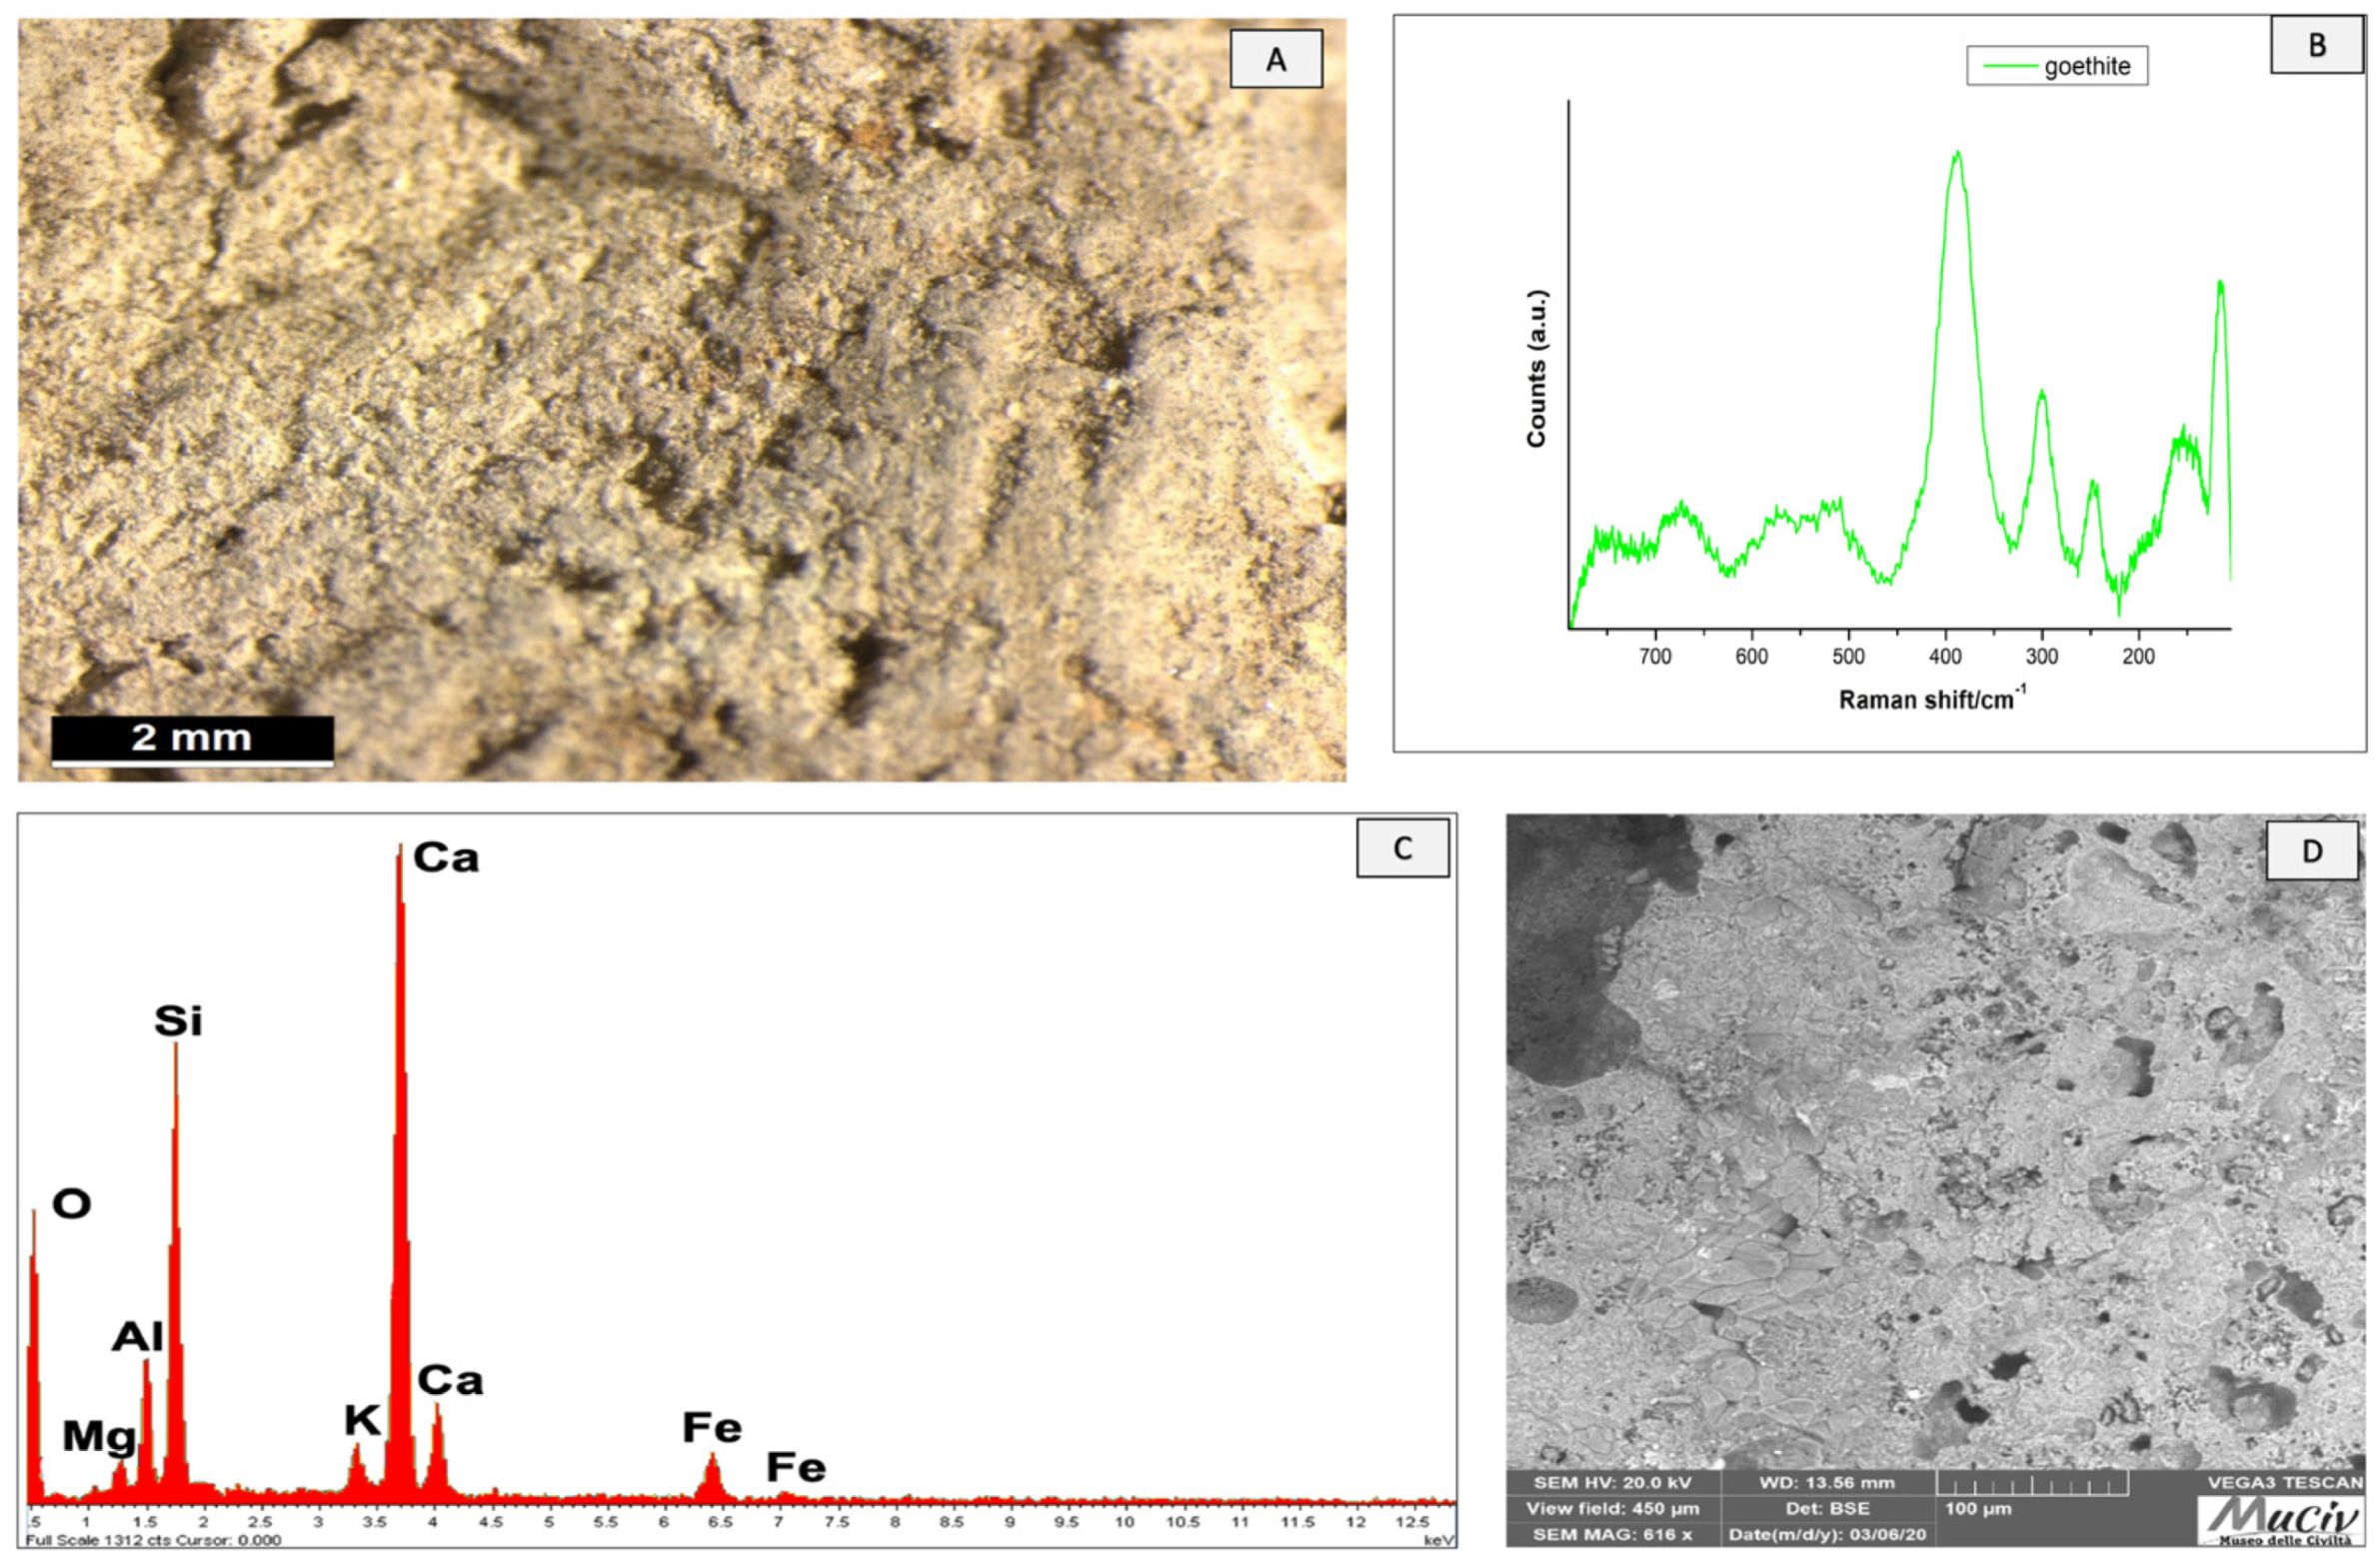
Figure 24.
Surface analysis of SNZ1fired clay. (A) Optical and (D) backscattered SEM images of fired clay. The Raman spectrum (B) reveals the presence of a goethite phase. The area chemical analysis (C) revealed the presence of Ca, Si, Al, and Fe.
Figure 24.
Surface analysis of SNZ1fired clay. (A) Optical and (D) backscattered SEM images of fired clay. The Raman spectrum (B) reveals the presence of a goethite phase. The area chemical analysis (C) revealed the presence of Ca, Si, Al, and Fe.
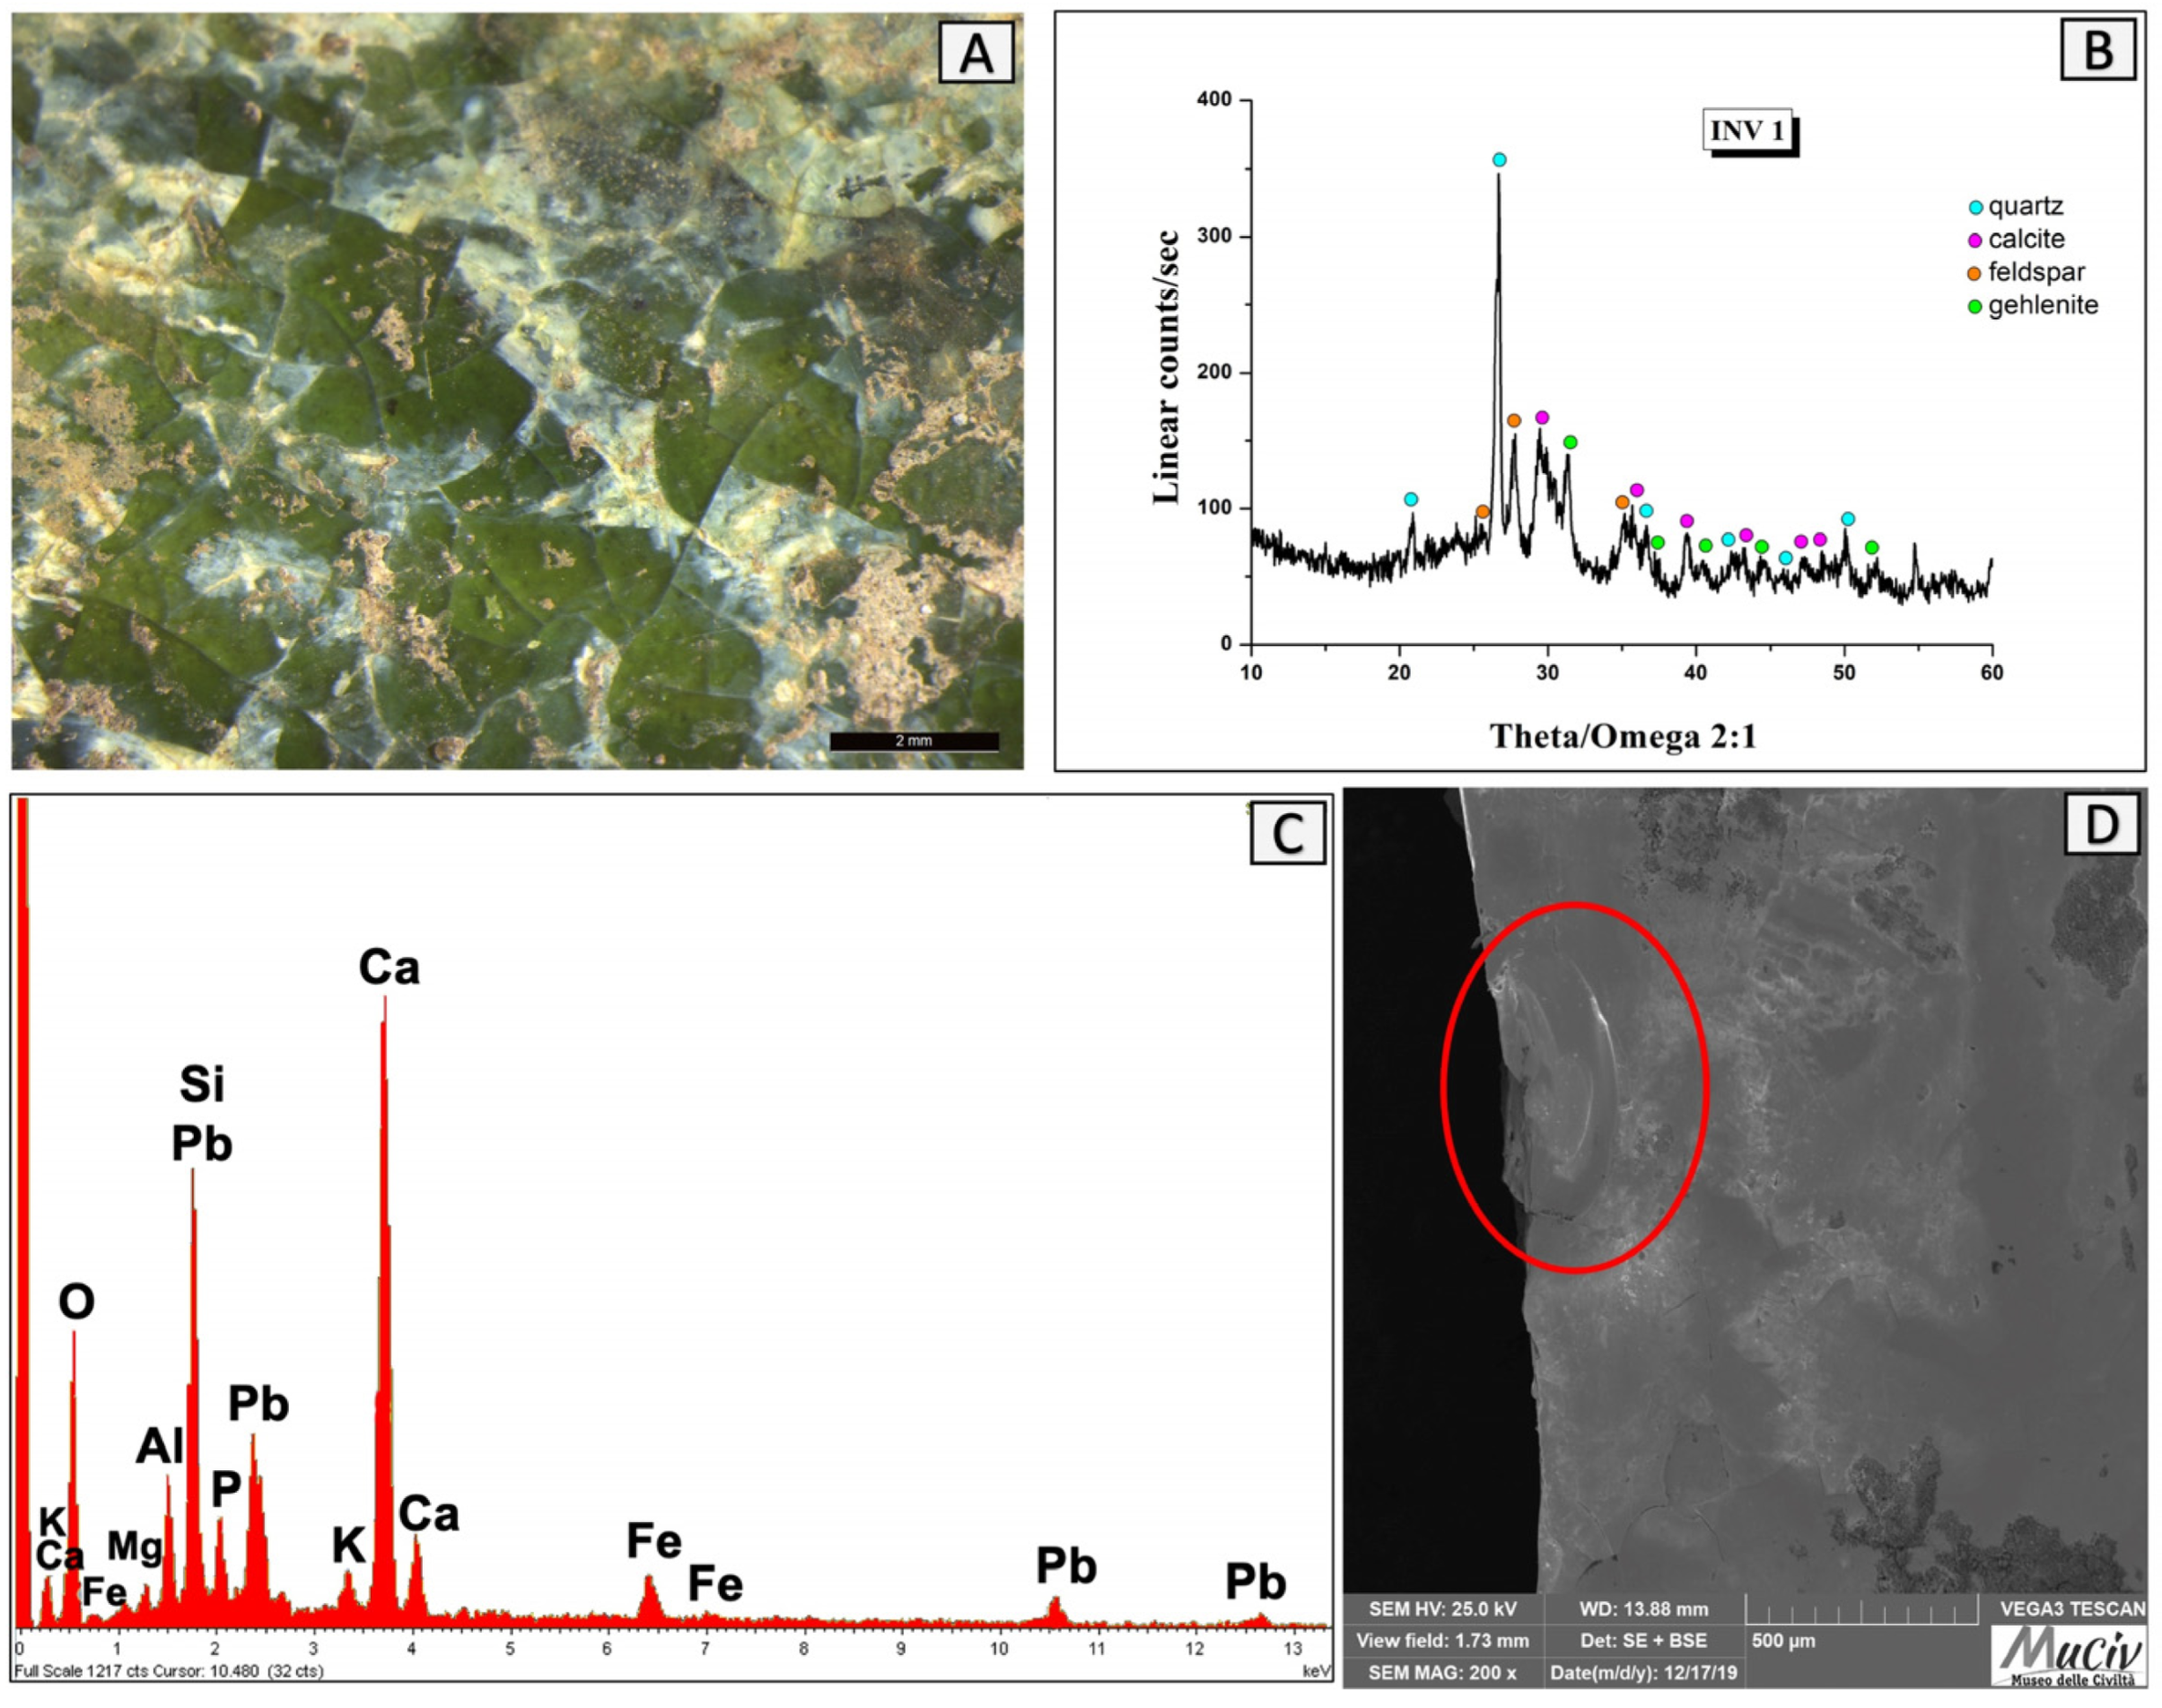
Figure 25.
Surface analysis of INV1 glass. (A) Optical and (D) backscattered SEM images of the glass surface where the conchoidal breakage of the INV1 fragment can be observed (shown in the red circle). The XRD spectrum (B) reveals the mineralogical phases present: quartz (SiO2), calcite (CaCO3), and apatite (Ca5(PO4)3[F, OH, Cl]. The area chemical analysis (C) detected the presence of Mg, Al, Si, P, K, Ca, Fe, and Pb.
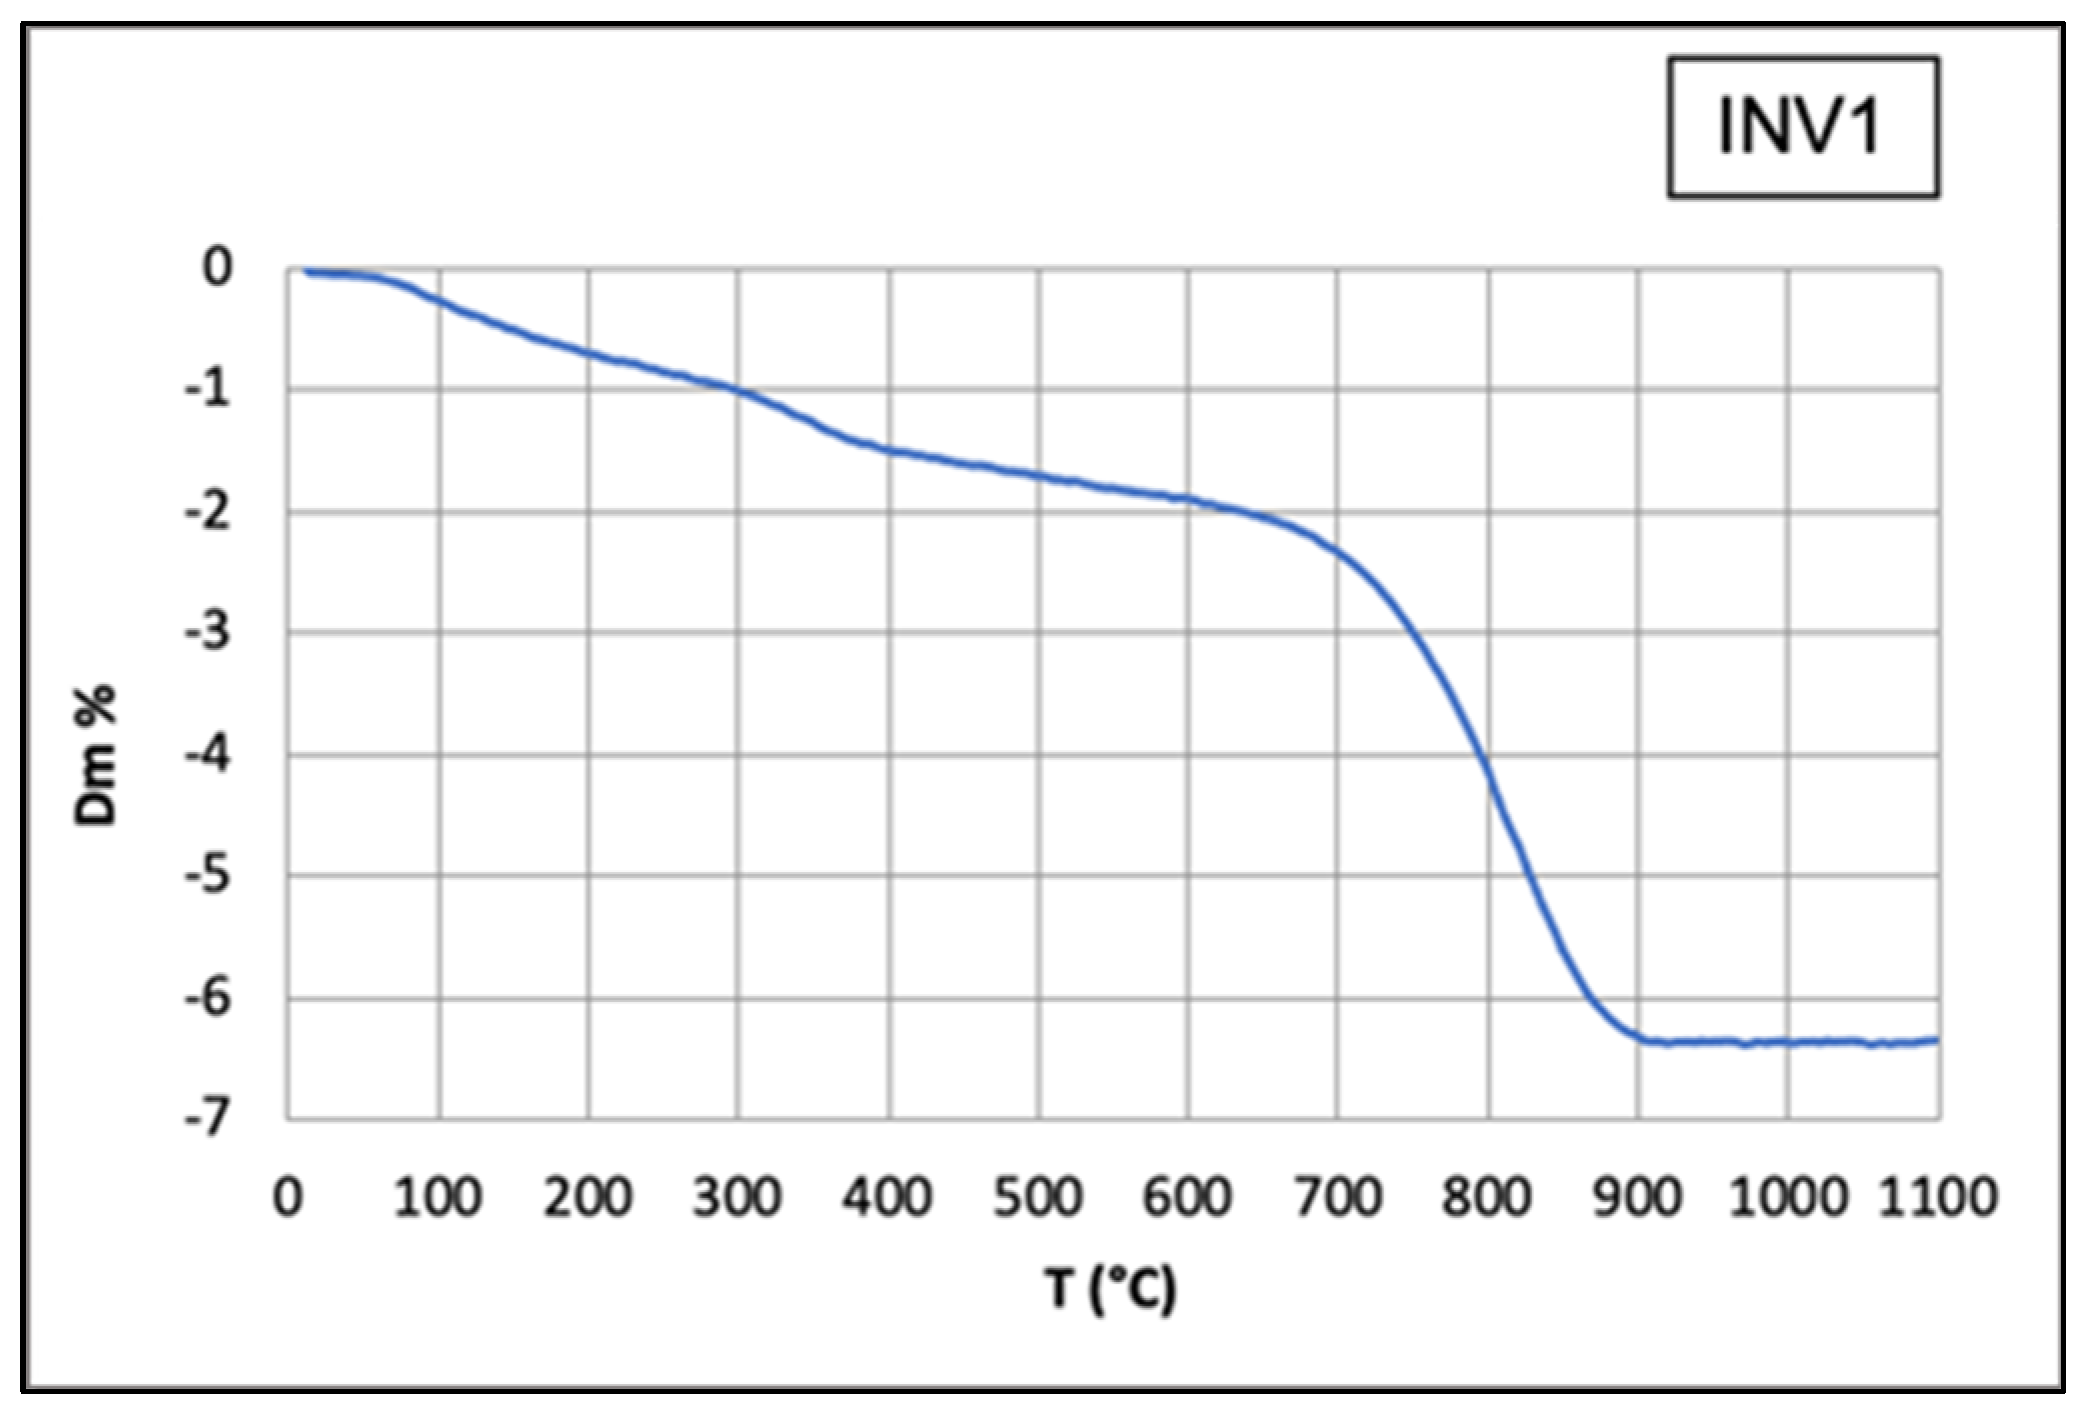
Figure 26.
TGA graph of the INV1 fragment shows a decrease from 750 °C to 850 °C due to the dissociation of CaCO3.
Figure 26.
TGA graph of the INV1 fragment shows a decrease from 750 °C to 850 °C due to the dissociation of CaCO3.
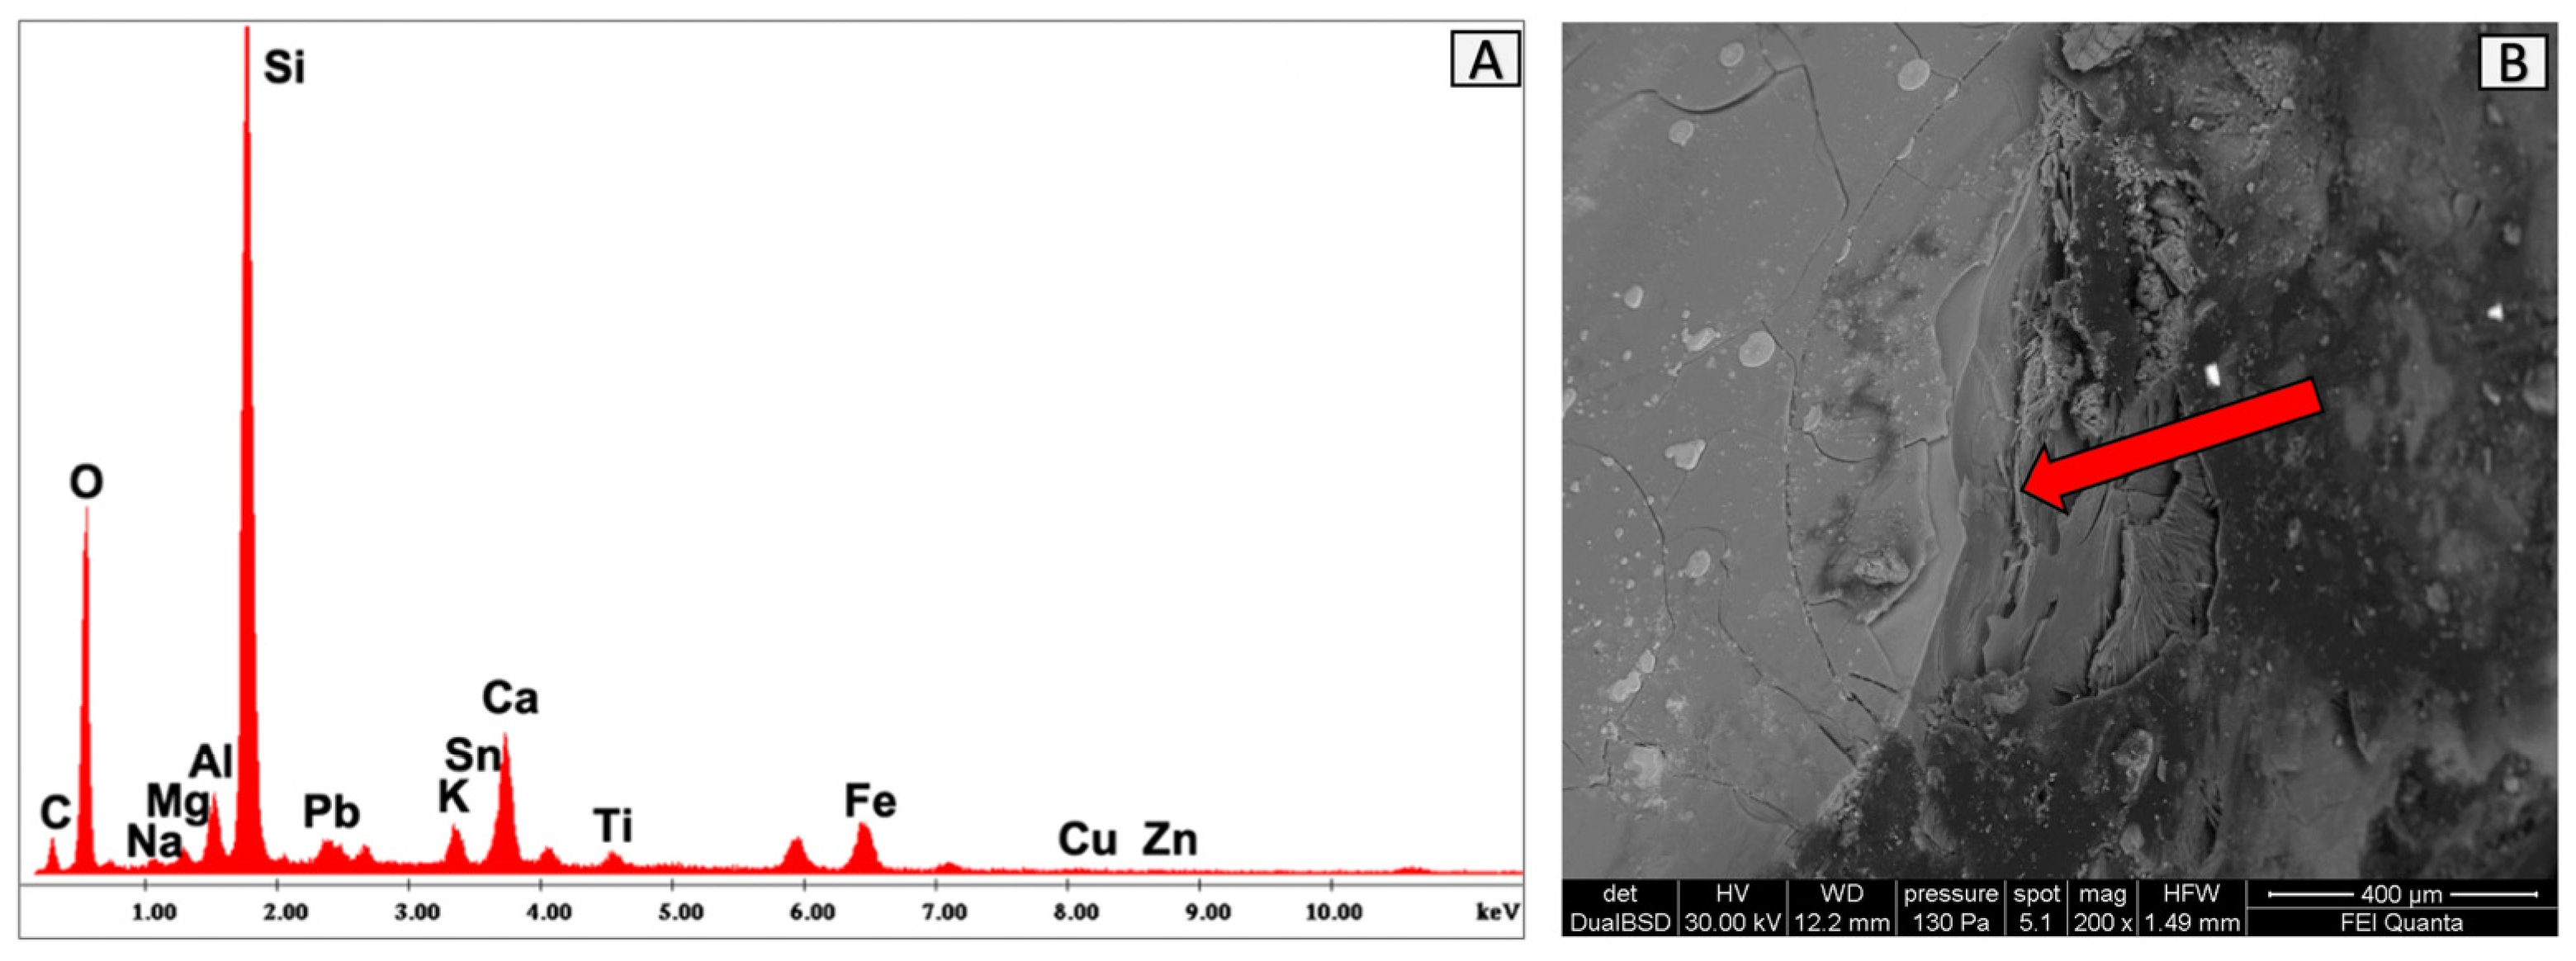
Figure 27.
Surface analysis of FRT1 frit. (A) Optical and (C) backscattered SEM images where the conchoidal fracture structures of the FRT1 fragment are indicated by the red arrow. The EDS area analysis (B) detected the presence of Si, Na, Al, and K.
Figure 27.
Surface analysis of FRT1 frit. (A) Optical and (C) backscattered SEM images where the conchoidal fracture structures of the FRT1 fragment are indicated by the red arrow. The EDS area analysis (B) detected the presence of Si, Na, Al, and K.
Figure 28.
Surface analysis of VET1 glass. The EDS area analysis (A) detected the presence of silicon oxide and traces of sodium oxide and aluminium oxide. (B) Backscattered SEM image where the glass fractures of the VET1 fragment can be observed.
Figure 28.
Surface analysis of VET1 glass. The EDS area analysis (A) detected the presence of silicon oxide and traces of sodium oxide and aluminium oxide. (B) Backscattered SEM image where the glass fractures of the VET1 fragment can be observed.
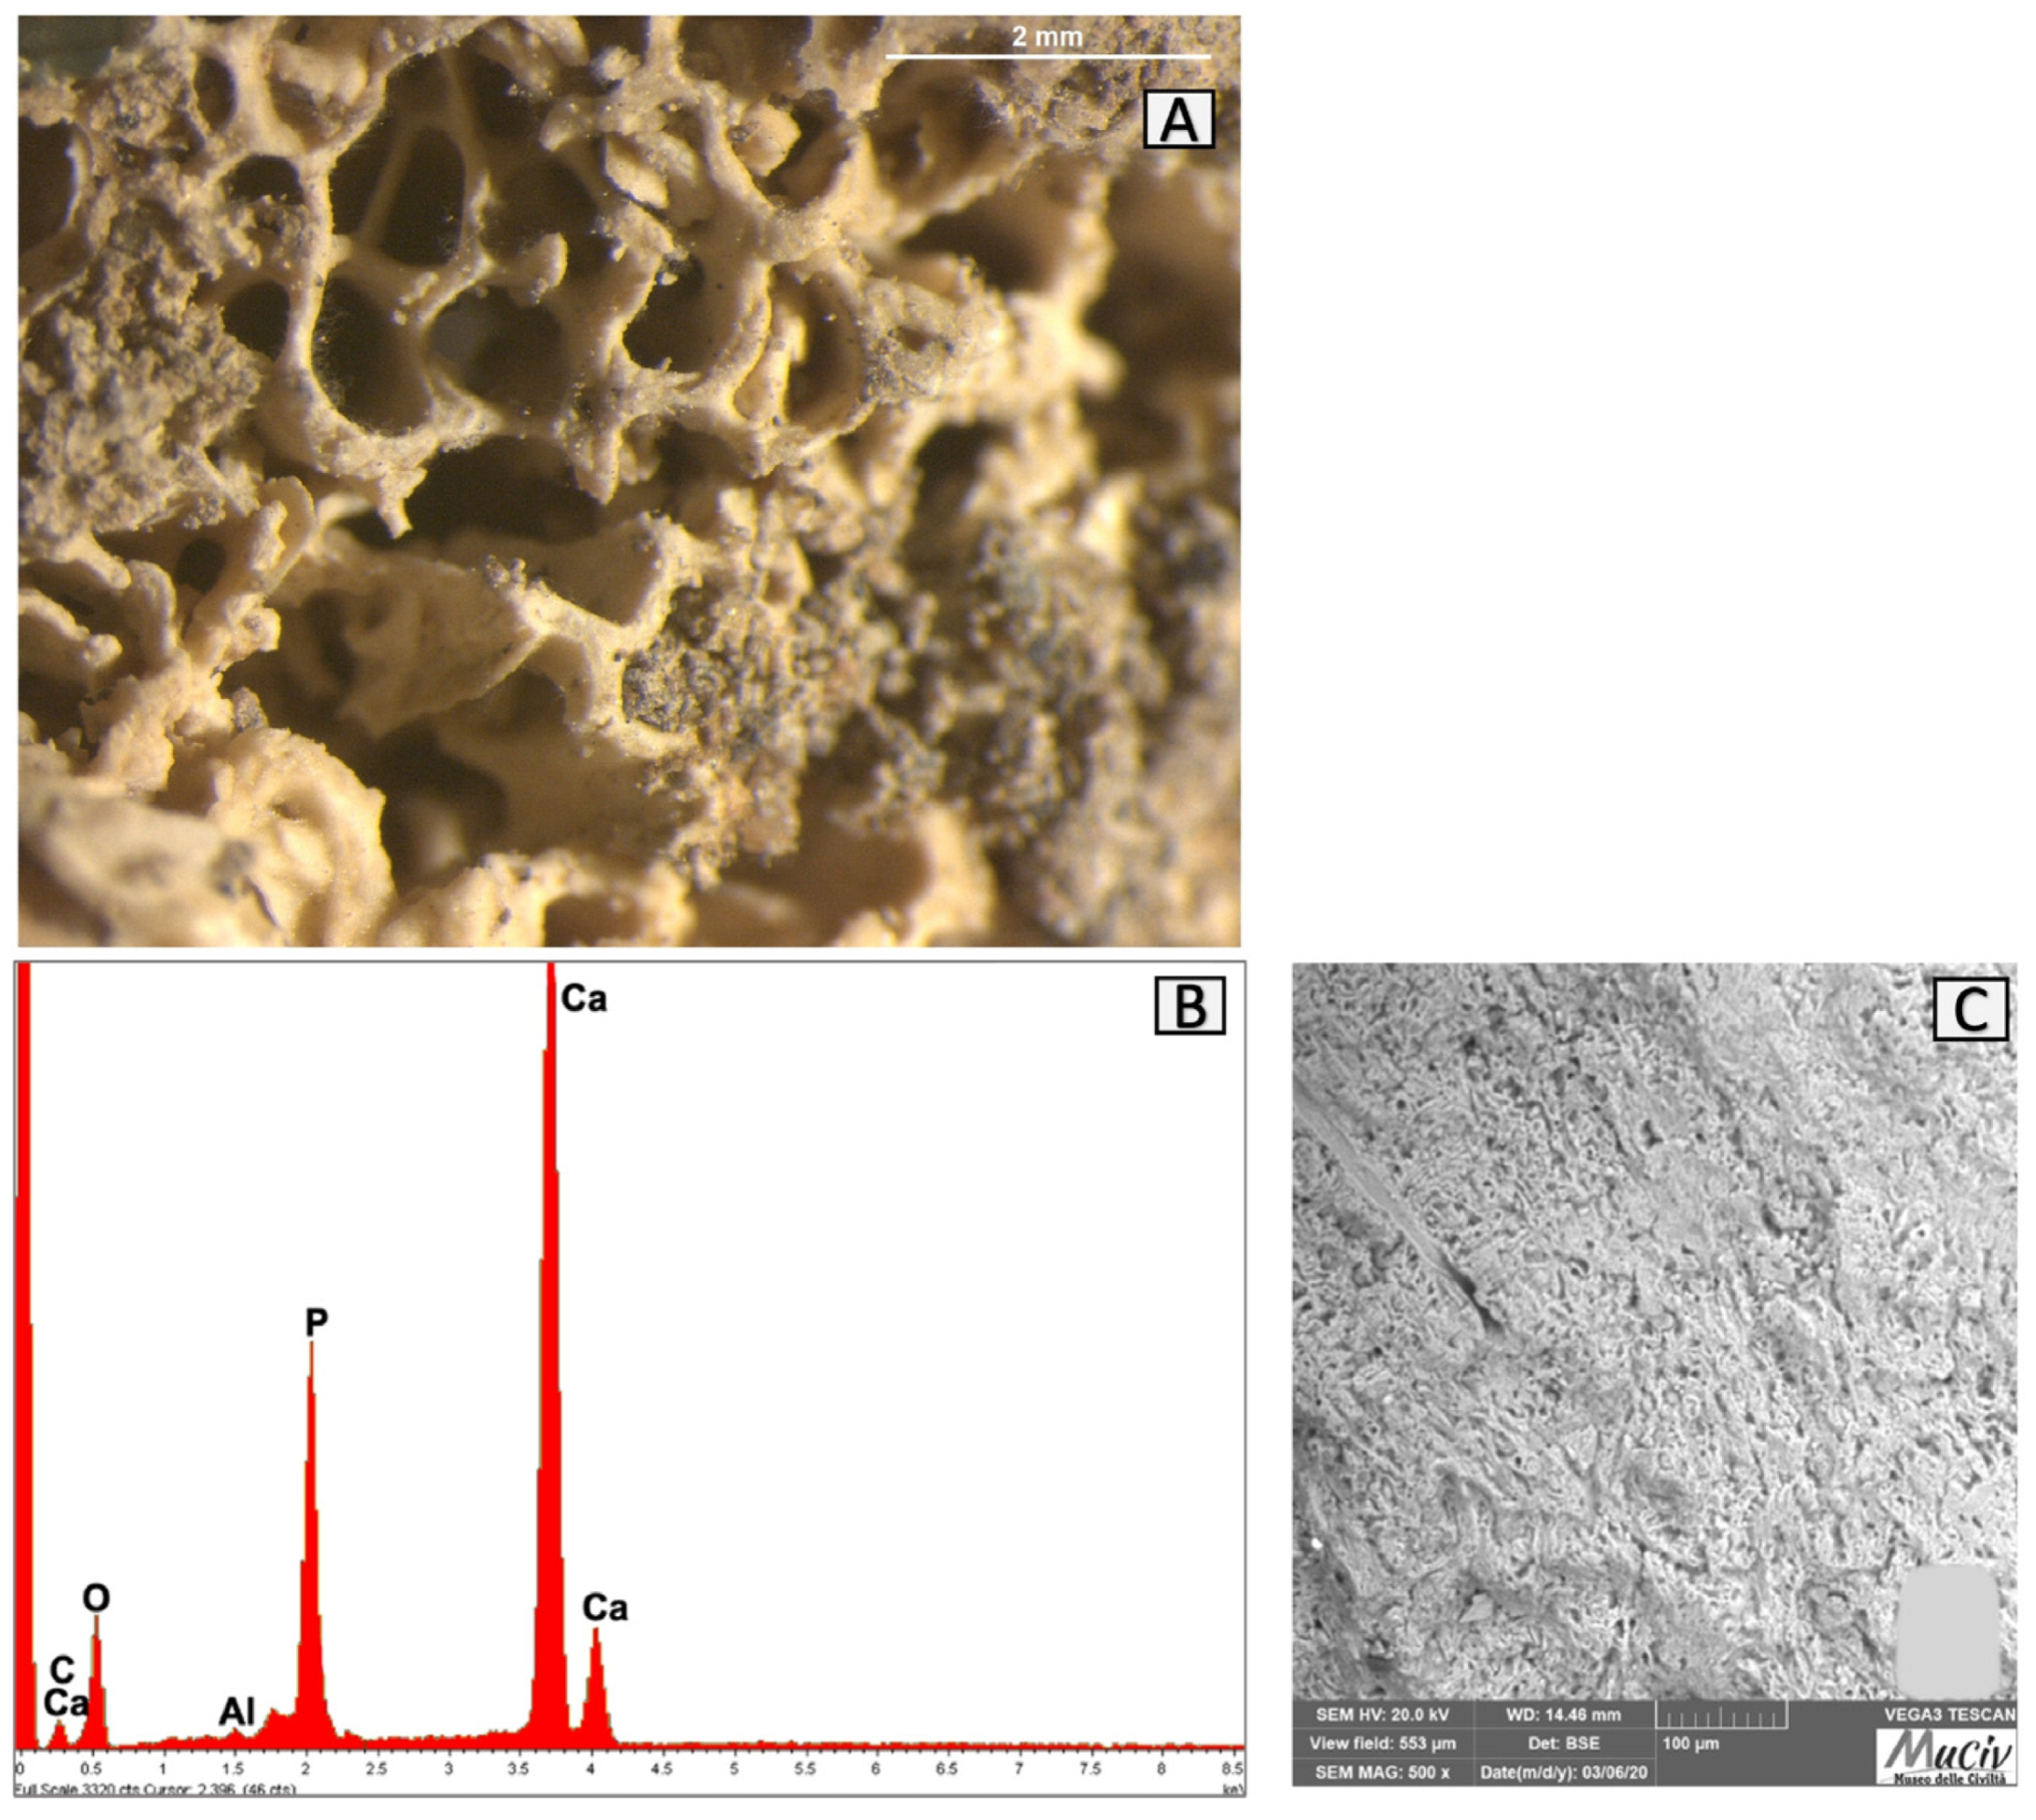
Figure 29.
Surface analysis of OSS1 fragment. (A) Optical and (C) backscattered SEM images show the characteristic spongy structure of a bone. The EDS analysis (B) detected the presence of Ca and P comparable to the composition of hydroxyapatite (Ca10(PO4)6(OH)2).
Figure 29.
Surface analysis of OSS1 fragment. (A) Optical and (C) backscattered SEM images show the characteristic spongy structure of a bone. The EDS analysis (B) detected the presence of Ca and P comparable to the composition of hydroxyapatite (Ca10(PO4)6(OH)2).
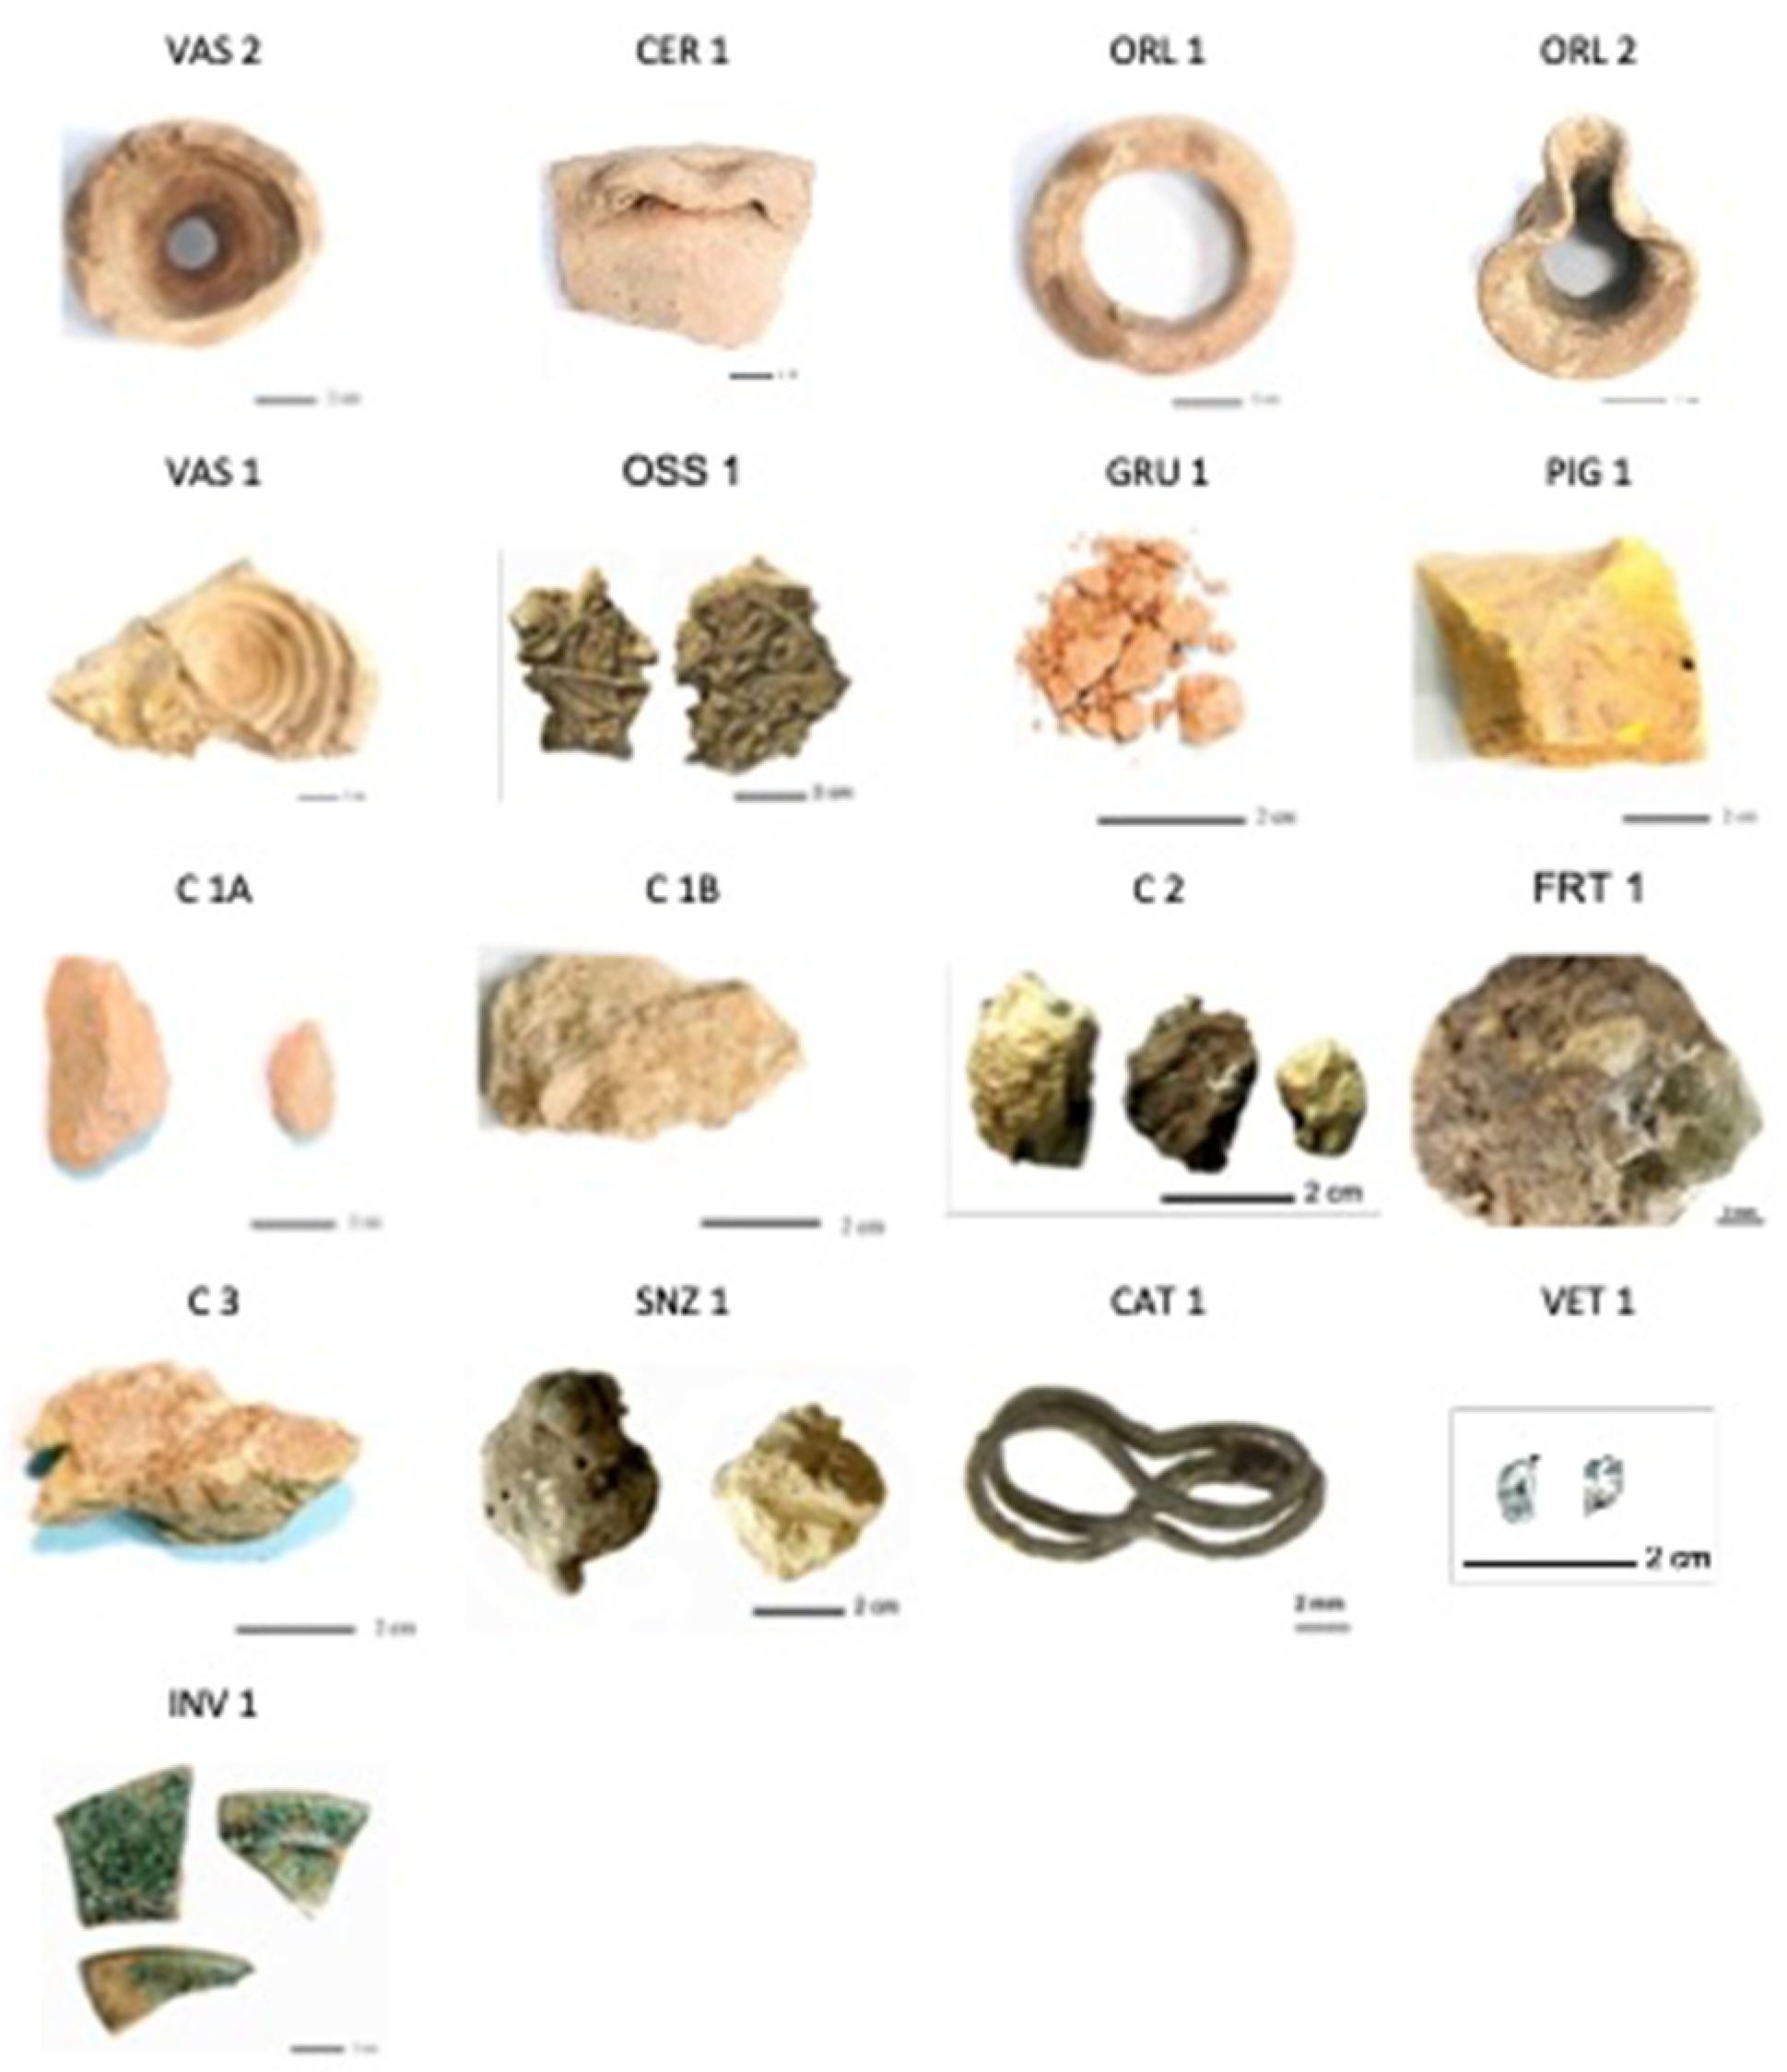
Table 1.
Typology (A) and excavation reference of analysed materials (B).
Table 1.
Typology (A) and excavation reference of analysed materials (B).
![Ceramics 07 00010 i001]() |
| (A) |
| Sample | Typology | Excavation reference |
| CER 1 | Bowl fragment | US 99, area B |
| ORL 1 | Neck of vessel | US 99, area C |
| ORL 2 | Neck of vessel | US 99, area C |
| VAS 1 | Bowl fragment with bone remains | US 99, area C |
| VAS 2 | Base of vase | US 102, area C |
| INV 1 | Glazed ceramic | US 17, area C |
| FRT 1 | Frit | US 17, area B |
| GRU 1 | Red clay | US 99, area B |
| PIG 1 | Yellow clay | US 17 (M/3), area B |
| C 1A | Fired clay | Area A |
| C 1B | Fired clay | Area A |
| C2 | Fired clay | Area A |
| C3 | Fired clay | Area A |
| SNZ 1 | Fired clay | ? |
| VET 1 | Shard of glass | Area C |
| OSS 1 | Bone-processing remnant | US 99, area C |
| (B) |
Table 2.
EDS area analysis of vessel CER1; * weight per cent (wt%), error ± 0.2%.
Table 2.
EDS area analysis of vessel CER1; * weight per cent (wt%), error ± 0.2%.
| | O | Na | Mg | Al | Si | K | Ca | Ti | Fe |
|---|
| CER1 * | 55.0 | 0.6 | 2.0 | 7.0 | 20.0 | 1.6 | 10.2 | 0.3 | 3.0 |
Table 3.
EDS area analysis of ORL1 fragment; * weight per cent (wt%), error ± 0.2%.
Table 3.
EDS area analysis of ORL1 fragment; * weight per cent (wt%), error ± 0.2%.
| | O | Na | Al | Si | Cl | K | Ca | Fe |
|---|
| ORL1 * | 70 | 2.8 | 1.6 | 11.1 | 1.5 | 2.3 | 8.6 | 2.1 |
Table 4.
EDS area analysis of ORL2 fragment; * weight percentage (wt%), error ± 0.2%.
Table 4.
EDS area analysis of ORL2 fragment; * weight percentage (wt%), error ± 0.2%.
| | O | Mg | Al | Si | K | Ca | Fe |
|---|
| ORL2 * | 52.2 | 1.7 | 13.3 | 18.6 | 1.3 | 10.3 | 2.5 |
Table 5.
EDS area analysis of the VAS2 fragment; * weight per cent (wt%), error ± 0.2%.
Table 5.
EDS area analysis of the VAS2 fragment; * weight per cent (wt%), error ± 0.2%.
| | O | Mg | Al | Si | K | Ca | Ti | Fe |
|---|
| VAS2 * | 50.2 | 2 | 7.3 | 23 | 2.7 | 6.2 | 0.3 | 8 |
Table 6.
EDS area analysis of the GRU1 red clay; * weight per cent (wt%), error ± 0.2%.
Table 6.
EDS area analysis of the GRU1 red clay; * weight per cent (wt%), error ± 0.2%.
| | O | Mg | Al | Si | K | Ca | Fe |
|---|
| GRU1 * | 55.8 | 1.2 | 4.1 | 18.2 | 1.1 | 10.2 | 9.2 |
Table 7.
EDS area analysis of the PIG1 clay fragment; * weight percentage (wt%), error ± 0.2%.
Table 7.
EDS area analysis of the PIG1 clay fragment; * weight percentage (wt%), error ± 0.2%.
| | O | Al | Si | Ca | Fe |
|---|
| PIG1 * | 54.6 | 0.2 | 1 | 37.4 | 6.7 |
Table 8.
EDS area analysis of the C1A clay fragment; * weight percentage (wt%), error ± 0.2%.
Table 8.
EDS area analysis of the C1A clay fragment; * weight percentage (wt%), error ± 0.2%.
| | O | Na | Mg | Al | Si | K | Ca | Ti | Fe | Cu |
|---|
| C1A * | 56.5 | 0.4 | 1.7 | 6.1 | 18.3 | 3.4 | 10.8 | 0.2 | 2.1 | 0.2 |
Table 9.
EDS area analysis of the C1B clay fragment; * weight percentage (wt%), error ± 0.2%.
Table 9.
EDS area analysis of the C1B clay fragment; * weight percentage (wt%), error ± 0.2%.
| | O | Mg | Al | Si | K | Ca | Fe |
|---|
| C1B * | 51.5 | 0.2 | 0.8 | 3.5 | 0.2 | 42.8 | 0.6 |
Table 10.
EDS area analysis of the C2 clay fragment; * weight percentage (wt%), error ± 0.2%.
Table 10.
EDS area analysis of the C2 clay fragment; * weight percentage (wt%), error ± 0.2%.
| | O | Na | Mg | Al | Si | K | Ca | Mn | Fe |
|---|
| C2 * | 60.5 | 0.2 | 0.2 | 1 | 23.6 | 0.4 | 12.6 | 0.4 | 0.9 |
Table 11.
EDS analysis of the C3 clay fragment; * weight per cent (wt%), error ± 0.2%.
Table 11.
EDS analysis of the C3 clay fragment; * weight per cent (wt%), error ± 0.2%.
| | O | Na | Mg | Al | Si | K | Ca | Fe |
|---|
| C3 * | 49 | 1.9 | 0.9 | 3.7 | 24.3 | 1.3 | 12.3 | 6.5 |
Table 12.
EDS area analysis of the SNZ1 clay fragment; * weight per cent (wt%), error ± 0.2%.
Table 12.
EDS area analysis of the SNZ1 clay fragment; * weight per cent (wt%), error ± 0.2%.
| | O | Na | Mg | Al | Si | K | Ca | Ti | Fe |
|---|
| SNZ1 * | 54.5 | 0.5 | 1.1 | 4.5 | 17.1 | 1.6 | 16.8 | 0.5 | 3.3 |
Table 13.
EDS analysis of the INV1 fragment; * weight per cent (wt%), error ± 0.2%.
Table 13.
EDS analysis of the INV1 fragment; * weight per cent (wt%), error ± 0.2%.
| | MgO | Al2O3 | SiO2 | P2O5 | K2O | CaO | Fe2O | PbO2 |
|---|
| INV1 * | 0.98 | 7.07 | 28.48 | 18.8 | 1.17 | 29.6 | 3.9 | 9.82 |
Table 14.
EDS area analysis of the FRT1 fragment; * weight per cent (wt%), error ± 0.2%.
Table 14.
EDS area analysis of the FRT1 fragment; * weight per cent (wt%), error ± 0.2%.
| | Na2O | MgO | Al2O3 | SiO2 | K2O | CaO | MnO | Fe2O |
|---|
| FRT1 * | 3.6 | 0.7 | 5 | 25.1 | 1.1 | 15.1 | 0.3 | 49 |
Table 15.
EDS area analysis of the VET1 fragment; * weight per cent (wt%), error ± 0.2%.
Table 15.
EDS area analysis of the VET1 fragment; * weight per cent (wt%), error ± 0.2%.
| | Na2O | MgO | Al2O3 | SiO2 | SnO2 | K2O | CaO | ZnO | Fe2O | PbO2 |
|---|
| VET1 * | 0.7 | 1.1 | 6 | 77 | 2 | 2.2 | 7.5 | 0.6 | 1.5 | 1 |


 ,
, 


