Article

Phase Transformations upon Formation of Transparent Lithium Alumosilicate Glass-Ceramics Nucleated by Yttrium Niobates

1
S.I. Vavilov State Optical Institute, 36 Babushkina St., 192171 St. Petersburg, Russia
2
Ioffe Institute, Russian Academy of Sciences, 194021 St. Petersburg, Russia
3
Institute of Silicate Chemistry of Russian Academy of Sciences, Adm. Makarova emb. 2, 199034 St. Petersburg, Russia
4
Center of Information Optical Technologies, ITMO University, Kronverkskiy pr. 49, 197101 St. Petersburg, Russia
5
Department of Chemical Technology of Refractory Nonmetallic and Silicate Materials, Faculty of Chemistry of Substances and Materials, St. Petersburg State Technological Institute (Technical University), Moskovski Ave. 26, 190013 St. Petersburg, Russia
6
D.V. Efremov Institute of Electrophysical Apparatus, Metallostroy, Doroga na Metallostroy, 3 Bld., 196641 St. Petersburg, Russia
*
Author to whom correspondence should be addressed.
Ceramics 2023, 6(3), 1490-1507; https://doi.org/10.3390/ceramics6030092
Submission received: 1 June 2023 / Revised: 21 June 2023 / Accepted: 3 July 2023 / Published: 6 July 2023
(This article belongs to the Special Issue Advanced Glasses and Glass-Ceramics)

Abstract

:
Phase transformations in the lithium aluminosilicate glass nucleated by a mixture of yttrium and niobium oxides and doped with cobalt ions were studied for the development of multifunctional transparent glass-ceramics. Initial glass and glass-ceramics obtained by isothermal heat-treatments at 700–900 °C contain YNbO4 nanocrystals with the distorted tetragonal structure. In samples heated at 1000 °C and above, the monoclinic features are observed. High-temperature X-ray diffraction technique clarifies the mechanism of the monoclinic yttrium orthoniobate formation, which occurs not upon high-temperature heat-treatments above 900 °C but at cooling the glass-ceramics after such heat-treatments, when YNbO4 nanocrystals with tetragonal structure undergo the second-order transformation at ~550 °C. Lithium aluminosilicate solid solutions (ss) with β-quartz structure are the main crystalline phase of glass-ceramics prepared in the temperature range of 800–1000 °C. These structural transformations are confirmed by Raman spectroscopy and illustrated by SEM study. The absorption spectrum of the material changes only with crystallization of the β-quartz ss due to entering the Co2+ ions into this phase mainly in octahedral coordination, substituting for Li+ ions. At the crystallization temperature of 1000 °C, the Co2+ coordination in the β-quartz solid solutions changes to tetrahedral one. Transparent glass-ceramics have a thermal expansion coefficient of about 10 × 10−7 K−1.

1. Introduction

Low thermal expansion transparent glass-ceramics of the lithium aluminosilicate (LAS) system form commercially the most important glass-ceramic family [1,2]. They are composed of the main crystalline phase of lithium aluminosilicate solid solutions (ss) with β-quartz structure and have found their applications as cooktop plates, woodstove windows, fireplaces, as cooking ware and fire protection doors or windows, large telescope mirror blanks, ring laser gyroscopes, liquid crystal displays, and optical components [1,2]. A combination of unique thermal-mechanical properties of LAS glass-ceramics and their transparency with optical properties of rare-earth ions in oxide nanocrystals could allow for the development of new multifunctional materials. However, ionic radii of rare-earth ions are larger than those of ions that constitute the β-quartz ss, and there exist no cation sites for trivalent rare-earth ions in the LAS crystals [3]; β-quartz ss appeared to be a poor host for fluorescent cations [4].
It should be noted that LAS glass-ceramics are multiphase materials that contain the crystalline phases of not only the β-quartz ss, but also of the nucleating agent and it is the nucleating agent that can become a promising host for trivalent rare-earth ions. In our previous studies [5,6,7], we developed new transparent LAS glass-ceramics containing rare-earth orthoniobates, such as (Er,Yb)NbO4, YbNbO4 [6], and (Eu3+,Yb3+):YNbO4 [7], bearing a bifunctional role of nucleating agents and luminescent compounds. It was found that nanocrystals of rare-earth orthoniobates with disordered fluorite structures precipitate from the initial X-ray amorphous glass upon heat-treatment; at elevated temperatures, structural transformation to a tetragonal phase takes place. Glass-ceramics prepared by heat-treatments at above 950 °C additionally contain crystals of rare-earth orthoniobates with a monoclinic structure. The spectral-luminescent properties of rare-earth ions are directly linked to the structure of corresponding rare-earth orthoniobates [5,6,7]. However, it was not clear up to now if the monoclinic rare-earth orthoniobates were formed during the high-temperature heat-treatments of initial glasses or upon cooling down the glass-ceramics prepared by these heat-treatments. Therefore, the aim of the present study is to clarify the sequence and the mechanism of phase transformations in transparent glass-ceramics containing rare-earth and niobium oxides by means of in situ high-temperature X-ray diffraction and differential thermal analysis.
In this study, yttrium was taken as a representative rare-earth ion, and yttrium orthoniobate was chosen as a model rare-earth orthoniobate. Yttrium orthoniobate is a promising optical host for rare-earth ions because yttrium ions are easily replaced in any proportion by other rare-earth ions with similar ionic radii [7,8,9,10,11,12,13,14,15]. It should be noted that yttrium orthoniobate itself is distinguished by the combination of promising luminescent, chemical, and mechanical properties. It is a self-activated X-ray phosphor [16] and widely used in X-ray medical techniques. We believe the regularities of phase transformations found by the example of yttrium orthoniobates crystallized in LAS glass-ceramics are the general regularities that can be extended to other rare earth orthoniobates crystallized in LAS glass-ceramics.
In nature, yttrium orthoniobate, YNbO4, is known as a mineral fergusonite [17,18]. There are three crystalline forms of synthetic yttrium orthoniobate, monoclinic (M-phase, M-fergusonite) at room temperature, tetragonal (T-phase) with the scheelite (CaWO4) structure at higher temperatures [19], and a high-temperature cubic phase [20]. The structural transformation between the monoclinic and tetragonal forms of YNbO4 is reversible and proceeds by a gradual change in symmetry in the approximate range of 500 to 800 °C; the T-phase cannot be preserved at room temperature [19]. These phase transformations were studied by K. Jurkschat et al. [20] and considered to be displacive ferroelastic transformations of a second order, leading to the formation of ferroelastic twinning domains during the T–M phase transition. Heating of YNbO4 crystals close to the melting temperature shows that a high-temperature cubic phase could be detected, which consists of a solid solution of YNbO4 and Y3NbO7 and possibly small amounts of Nb2O3 [20].
While heating an amorphous material prepared by the simultaneous hydrolysis of yttrium and niobium alkoxides [21] or by the sol-gel method [22], another form of YNO4, the T’ one, was crystallized. This phase has been shown [22] to have a distorted tetragonal structure similar to that found in tetragonal ZrO2 with pseudo-fluorite lattice. The T’ to M phase transformation does not occur, and the T’-phase can be obtained at room temperature [21]. O. Yamaguchi et al. [21] suggested that the distortion of the tetragonal structure is responsible for stabilization of the T’-phase at room temperature. The heating behavior of this phase is very similar to that of the metamict mineral; it crystallizes in a tetragonal modification when heated for prolonged periods of time at 400 to 800 °C, and when heated to 1000 °C and cooled it is monoclinic [21].
Here, for the first time we report the preparation of transparent glass-ceramics of the LAS system containing yttrium orthoniobates nanocrystals by the melt-quenching method with the aim to clarify the sequence and the mechanism of phase transformations of yttrium orthoniobate nanocrystals in this system by means of in situ high-temperature X-ray diffraction and differential thermal analysis.

2. Materials and Methods

2.1. Materials Preparation

For this study, we have chosen the glass of the composition 18 Li2O, 27 Al2O3, 55 SiO2 (mol%) [23], 5 mol% Y2O3, 5 mol% Nb2O5, and 0.1 mol% CoO were added above 100% as nucleators and colour dopant, respectively. The reagent-grade raw materials were supplied by Nevareactive, Saint Petersburg, Russia. The batch weight was 300 g. The glass was melted in air in a home-made crucible made of quartz ceramics at 1560 °C for 4 h with stirring, and then poured out onto a metal plate and annealed at 620 °C for 1 h. Then, the furnace was switched off and the glass was cooled down with the annealing furnace. The transparent violet-blue-colored initial glass was heat-treated in isothermal conditions from 700 to 1350 °C for 6 h by the two-stage heat-treatments with the first hold at 700 °C for 6 h. The heating rate was 5 °C per minute.

2.2. Characterization

2.2.1. Thermal Analysis

Differential thermal analysis (DTA) was carried out using a simultaneous thermal analyzer, Netzsch STA 449F3 Jupiter, in platinum crucibles. The measurements were taken upon heating from 30 to 1200 °C and upon cooling from 1200 to 300 °C under the argon flow (30 mL/min). Two sets of measurements were conducted, employing heating and cooling rates of 10 and 30 °C/min, respectively. The sample weight was 15 mg.

2.2.2. Powder X-ray Diffraction (PXRD)

PXRD measurements were performed using a Shamadzu XRD-6000 diffractometer with CuKα radiation (λ = 1.5406 Å). The phase composition was analyzed by matching the recorded PXRD patterns with the Inorganic Crystal Structure Database (ICSD). The Rietveld refinement was performed using PDWin 4.0 software (Burevestnik, St. Petersburg, Russia). The mean crystal sizes were estimated from broadening of X-ray peaks according to Scherrer’s equation:
D = Kλ/Δ(2θ)cosθ,
where λ is the wavelength of X-ray radiation, θ is the diffraction angle, Δ(2θ) is the width of peak at half of its maximum, and K is the constant assumed to be 1 [24]. The error in the mean crystal size estimation is about 5%. The size of T’- and T-forms of YNbO4 nanocrystals was estimated using the peak with the Miller’s indices (hkl) of (112). The size of the β-quartz ss was estimated using the peak with the (hkl) indices of (121).
The a and c lattice parameters of the T’- and T-forms of YNbO4 crystals were estimated from the positions of diffraction peaks with the Miller’s indices (hkl) of (112) and (004), which ensured accuracy (±0.003 Å), according to the equation:
1/dhkl2 = (h2 + k2)/a2 + l2/c2.
High-temperature powder X-ray diffraction (HT-PXRD) patterns were recorded with a Shimadzu XRD-7000 diffractometer with CuKα radiation (λ = 1.5406 Å) equipped with an Anton Paar HTK-1200 furnace attachment. Powdered samples were heat-treated from room temperature up to 1100 °C with a step of 100 °C, a heating/cooling rate of 30 °C per minute, and isothermal holdings of 15 min at each step. PXRD patterns were collected in-situ after each isothermal holding upon heating and cooling. The measurements were taken for the Bragg angle (2θ) range from 20 to 40° (i.e., over the range of the strongest peaks of possible crystalline phases in the material studied) with a step of 0.02° and a scan rate of 2°/min.

2.2.3. Small Angle X-ray Scattering

Plane-parallel polished samples with thickness of 0.2 mm were studied by small angle X-ray scattering (SAXS) method. The SAXS intensity I(ϕ) was measured with a home-made instrument in the range of scattering angles ϕ from 6 to 450 arc min. CuKα radiation (λ = 1.5406 Å) was used with an “infinitely” high primary beam (“infinitely” high slit).
SAXS curves of glass-ceramics and phase-separated glasses often exhibit maximum, which appears due to the regularity in a distribution of scattering regions in the glass volume. In the presence of spatial ordering of the scattering regions, at which the interference maximum is observed, the value of the angle ϕm corresponding to the maximum on the I(ϕ) curve ϕm and the mean distance between centers of regularly distributed particle (L) are related as
L ≅ (2.85 ÷ 2.97)·103 ϕm−1,
where L (in Å) is a distance between centers of regularly distributed particle [25]. The position of the maximum ϕm on the ϕ dependence of ϕ·I(ϕ) corresponds to the inverse radius of the scattering regions. For the monodisperse system of spherical particles with radius R, in condition of validity of Guineir equation [26],
R = 1328/ϕm.

2.2.4. Scanning Electron Microscopy (SEM) and Energy Dispersive X-ray (EDX)-Based Element Analysis

The morphology of glass-ceramics was characterized by scanning electron microscopy (SEM) using Tescan Vega 3 SBH microscope. For the study, the surface of the polished samples was preliminary etched in a hydrofluoric acid for about 10 s. Particle size was calculated using ImageJ software. The same Tescan Vega 3 SBH microscope equipped with an Oxford INCA 200 energy-dispersive detector was employed for energy dispersive X-ray (EDX)-based element analysis.

2.2.5. Raman Spectroscopy

Raman spectra were recorded on plane-parallel polished samples with a thickness of ~1 mm in backscattering geometry by using an InVia (Renishaw, Wotton-under-Edge, UK) Micro-Raman spectrometer equipped with the CCD camera cooled up to −70 °C. Ar+ laser line of 514 nm was employed as an excitation source. Leica 50 × (NA = 0.75) objective was used for illuminating the sample; the scattered light was collected by the same objective. Edge filter was placed before the spectrograph entrance slit. A spatial resolution of 2 cm−1 was obtained. Acquisition time was 60 s.

2.2.6. Absorption Spectroscopy

Absorption spectra were measured on a Shimadzu UV-3600 spectrophotometer in the spectral range from 200 to 3300 nm on the same plane-parallel polished samples with a thickness of ~1 mm that were used for the Raman spectra recording. The wavelength step of measurements was 0.5 nm.

2.2.7. The Linear Coefficient of Thermal Expansion

The linear coefficient of thermal expansion (CTE) was measured with the Linseis L75 VS 1000 dilatometer using samples with the length of 25–35 mm and cross-section of 3 × 3 mm. The measurements were taken upon heating from 30 to 500 °C at a heating rate of 5 K/min.

3. Results

The images of polished samples of transparent initial glass and glass-ceramics with the thickness of 1 mm and of the opaque sample prepared by the heat-treatment at 700 °C and at 1350 °C for 6 h at each stage are shown in Figure 1.

3.1. DTA and XRD Studies
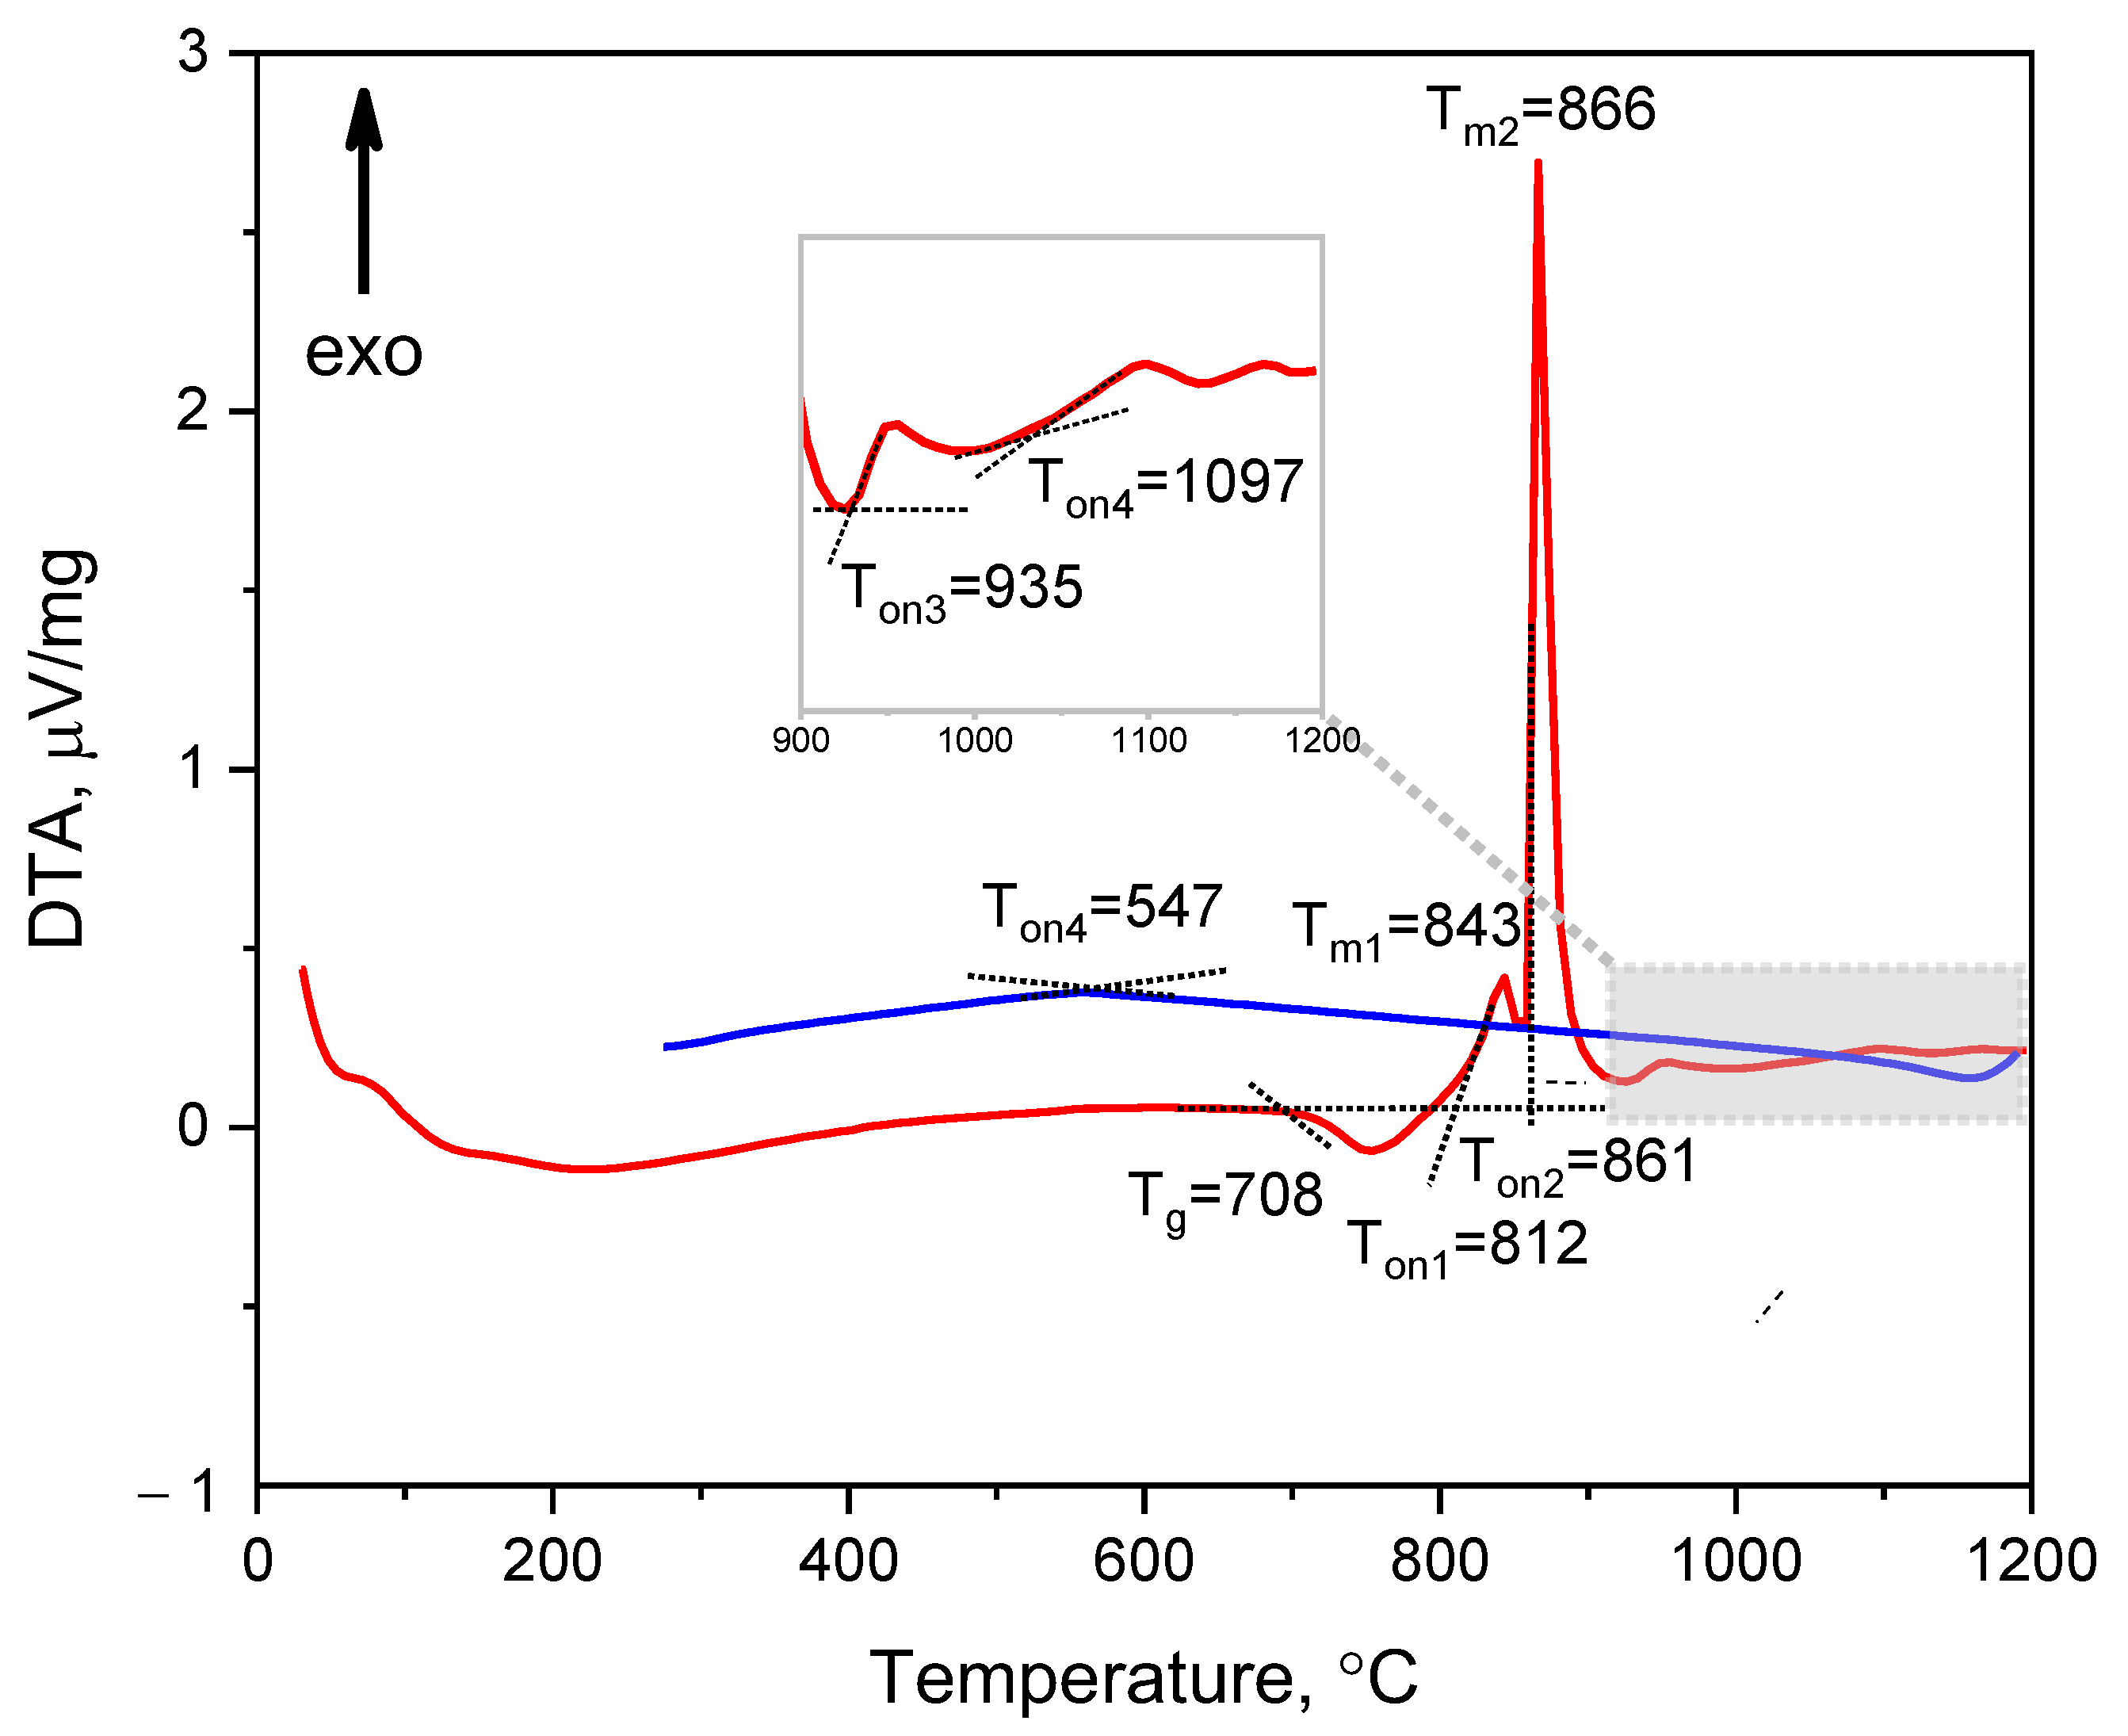
3.1.1. DTA Study

The first set of DTA measurements was conducted using conventional heating and cooling rates of 10 °C/min. Several thermal effects were observed: a glass transition at 697 °C, followed by three exothermic peaks with onset temperatures at 782 °C (broad and non-intense), 828 °C (sharp and intense), and 913 °C (very weak). No significant effects were observed during the cooling process. With the aim to reveal the possible thermal effect of the tetragonal–monoclinic phase transition upon cooling, we increased the heating and cooling rate, and the second set of DTA measurements was performed at a heating and cooling rate of 30 °C/min. The increased heating and cooling rate resulted in a shift of the thermal effects towards higher temperatures, and two additional weak features were revealed on the DTA curves. Figure 2 displays the data obtained from the second set of DTA measurements. Consequently, the DTA curve of the initial glass exhibited a glass transition temperature (Tg) at 708 °C and four exothermic peaks during heating (Figure 2). The first broad exothermic peak occurred at Ton1 = 812 °C, where Ton1 is a crystallization onset temperature, indicating the onset of crystallization of the nucleator in the form of the T’-phase. This peak was followed by a sharp and intense peak at Ton2 = 861 °C, corresponding to the crystallization of β-quartz ss. Two small, broad peaks were observed at Ton3 = 935 °C and Ton4 = 1097 °C. The peak at Ton3 = 935 °C was attributed to the T’-phase to T-phase transformation, while the small peak at Ton4 = 1097 °C was associated with the formation of β-spodumene ss. The DTA curve collected on cooling showed an inflection point at temperature of 547 °C. This observation suggests the existence of a weak thermal effect, which may be attributed to the phase transition from the T-phase to the M-phase, which is known to be a continuous second-order transition [27]. To further support this suggestion, HT-PXRD investigations were conducted and the results are described in detail below.

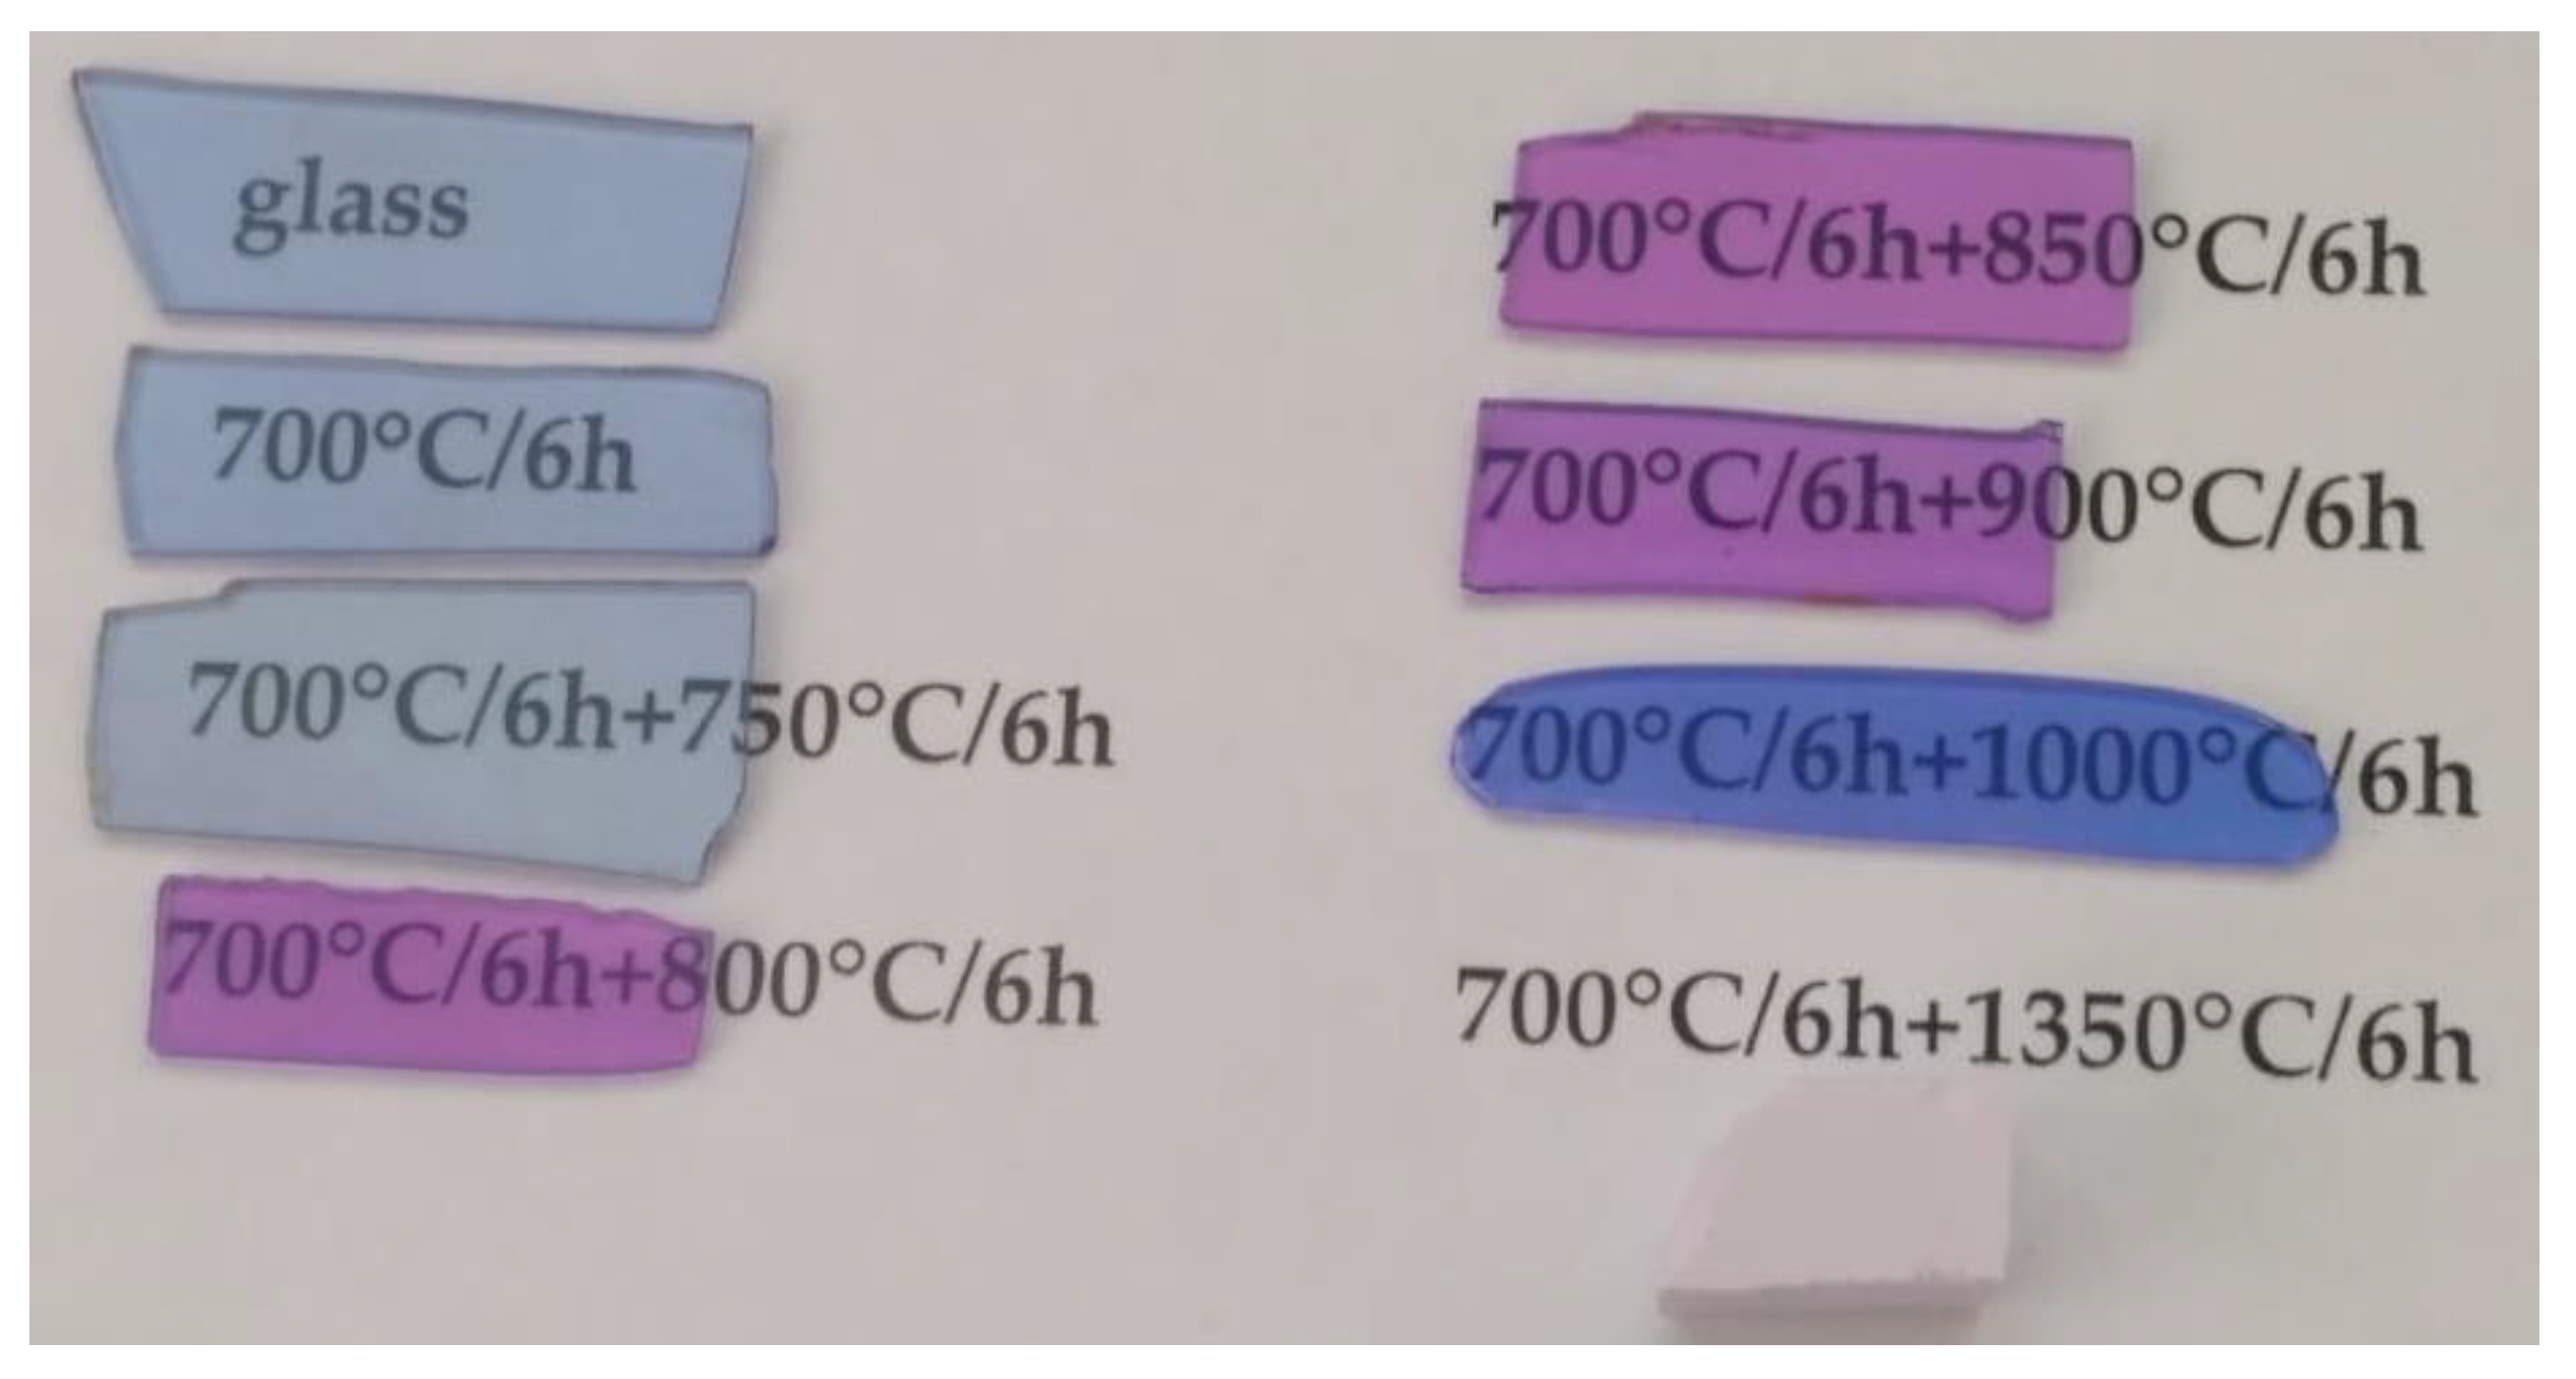
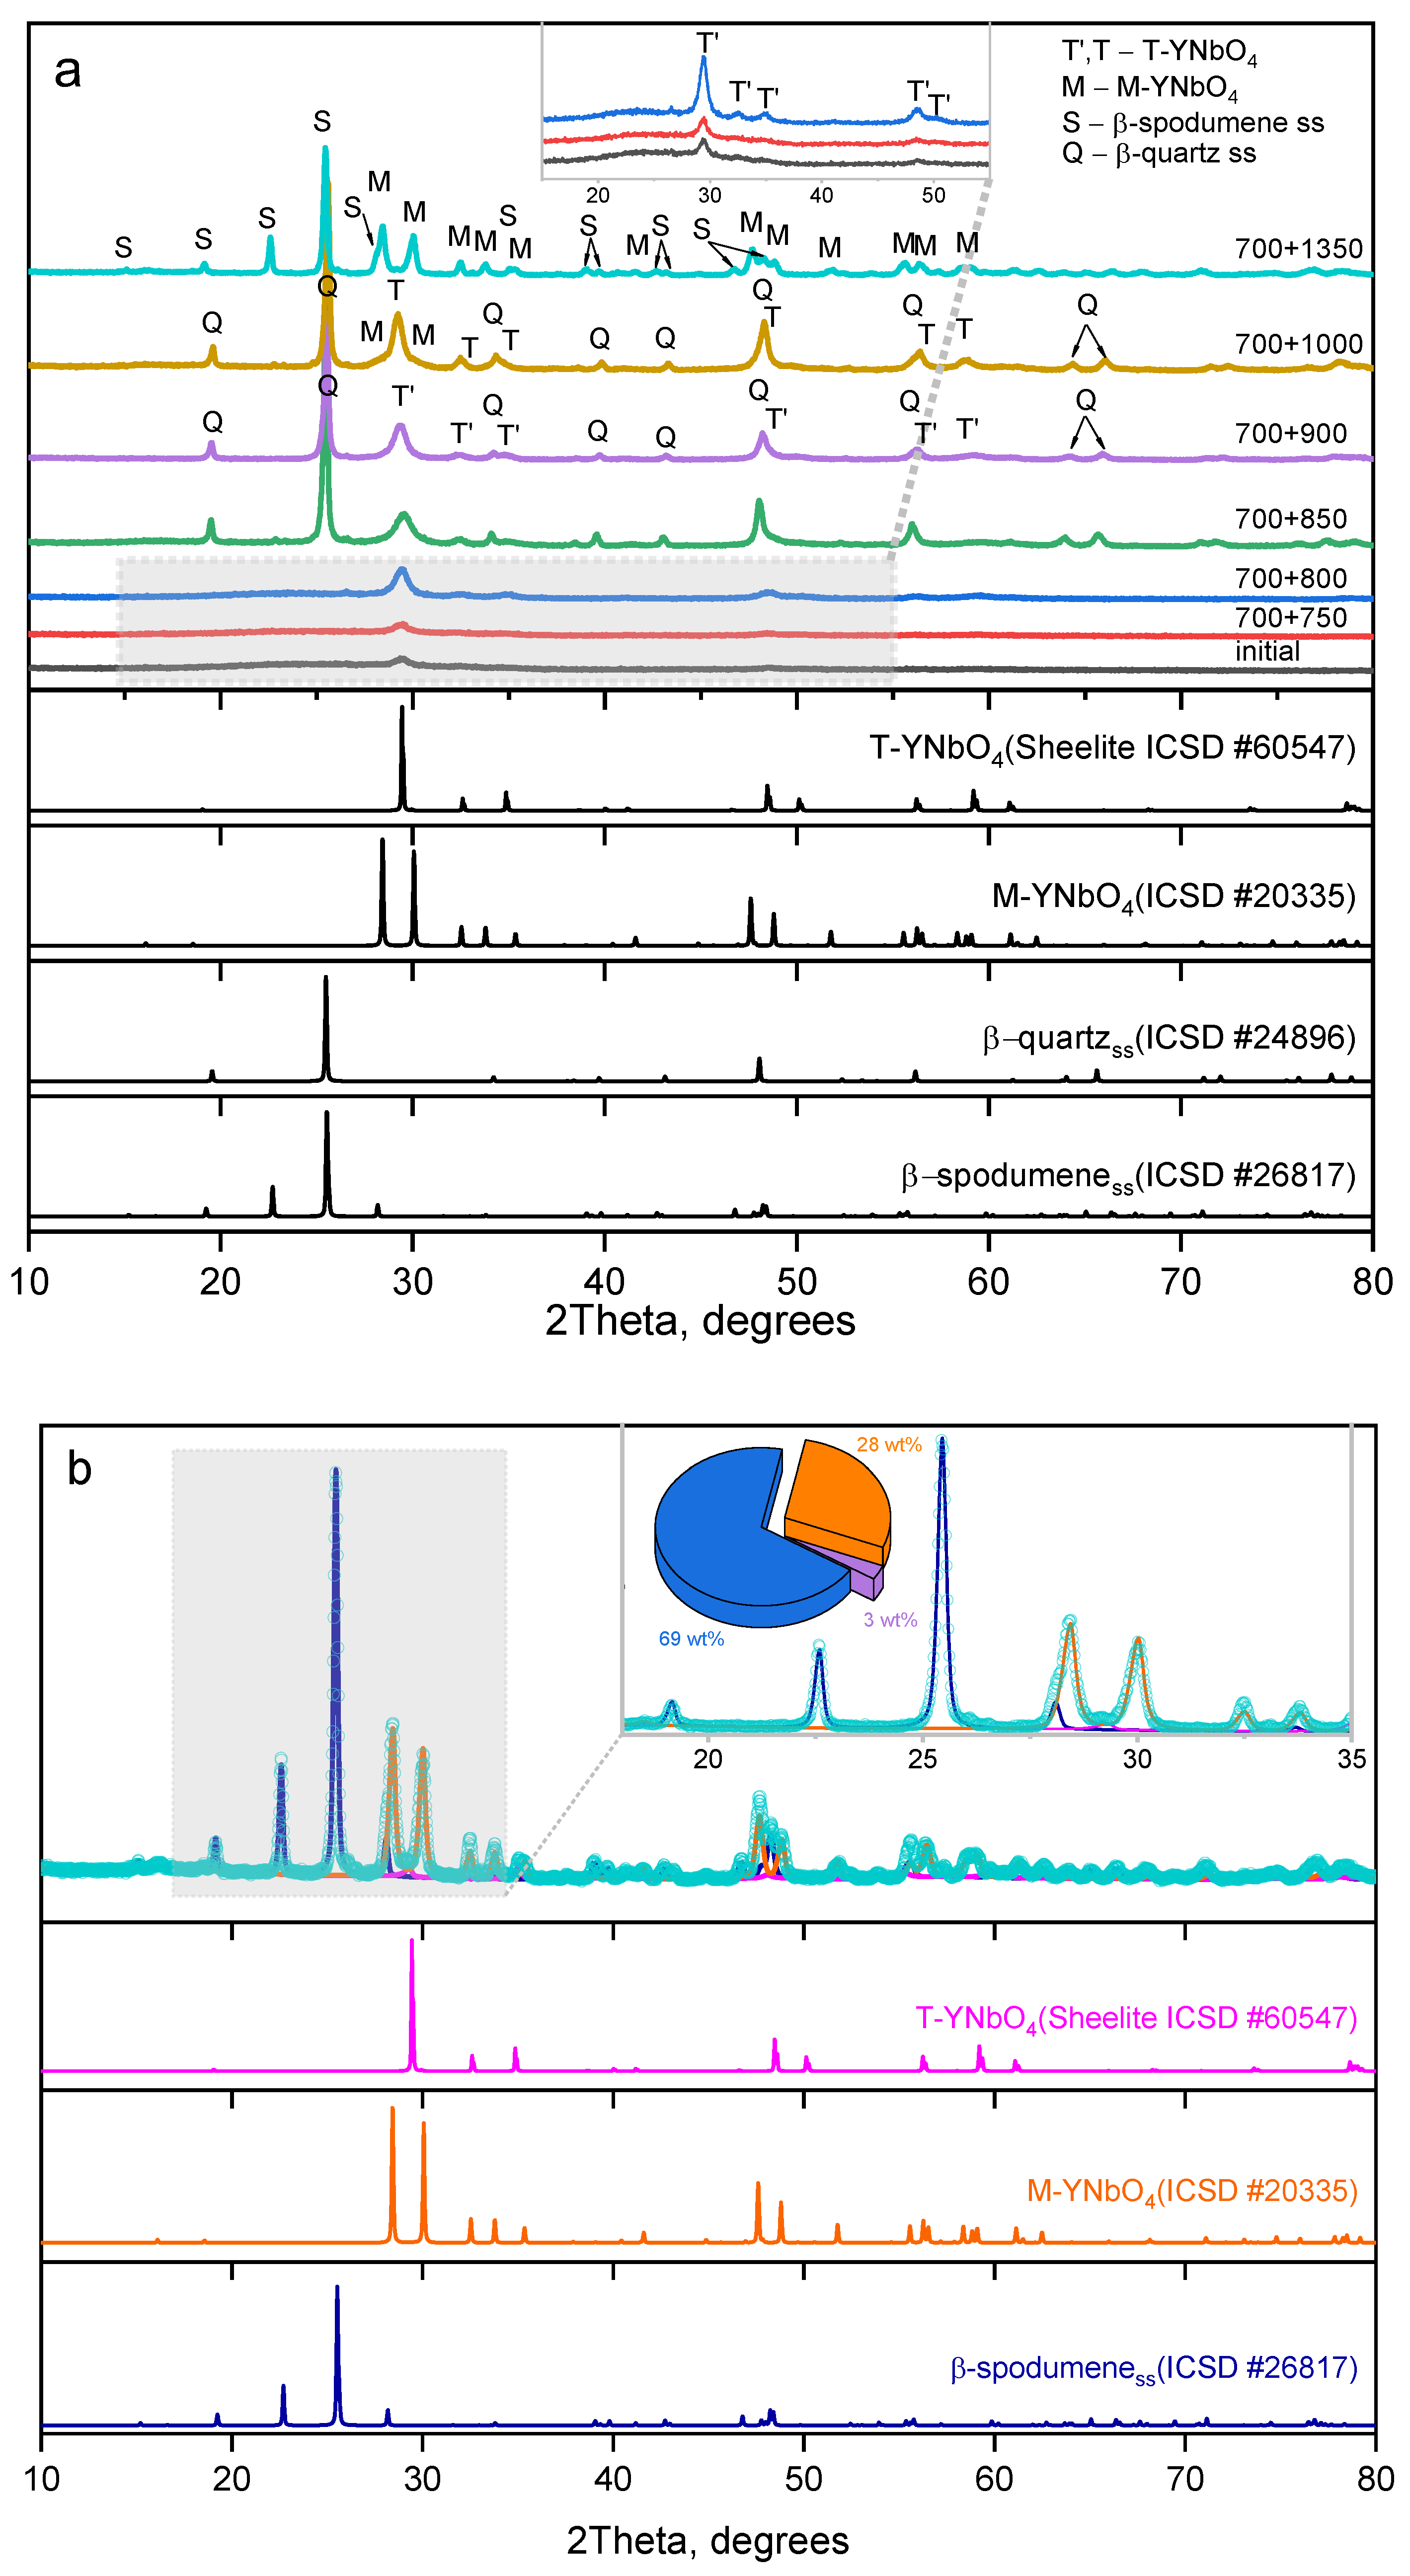
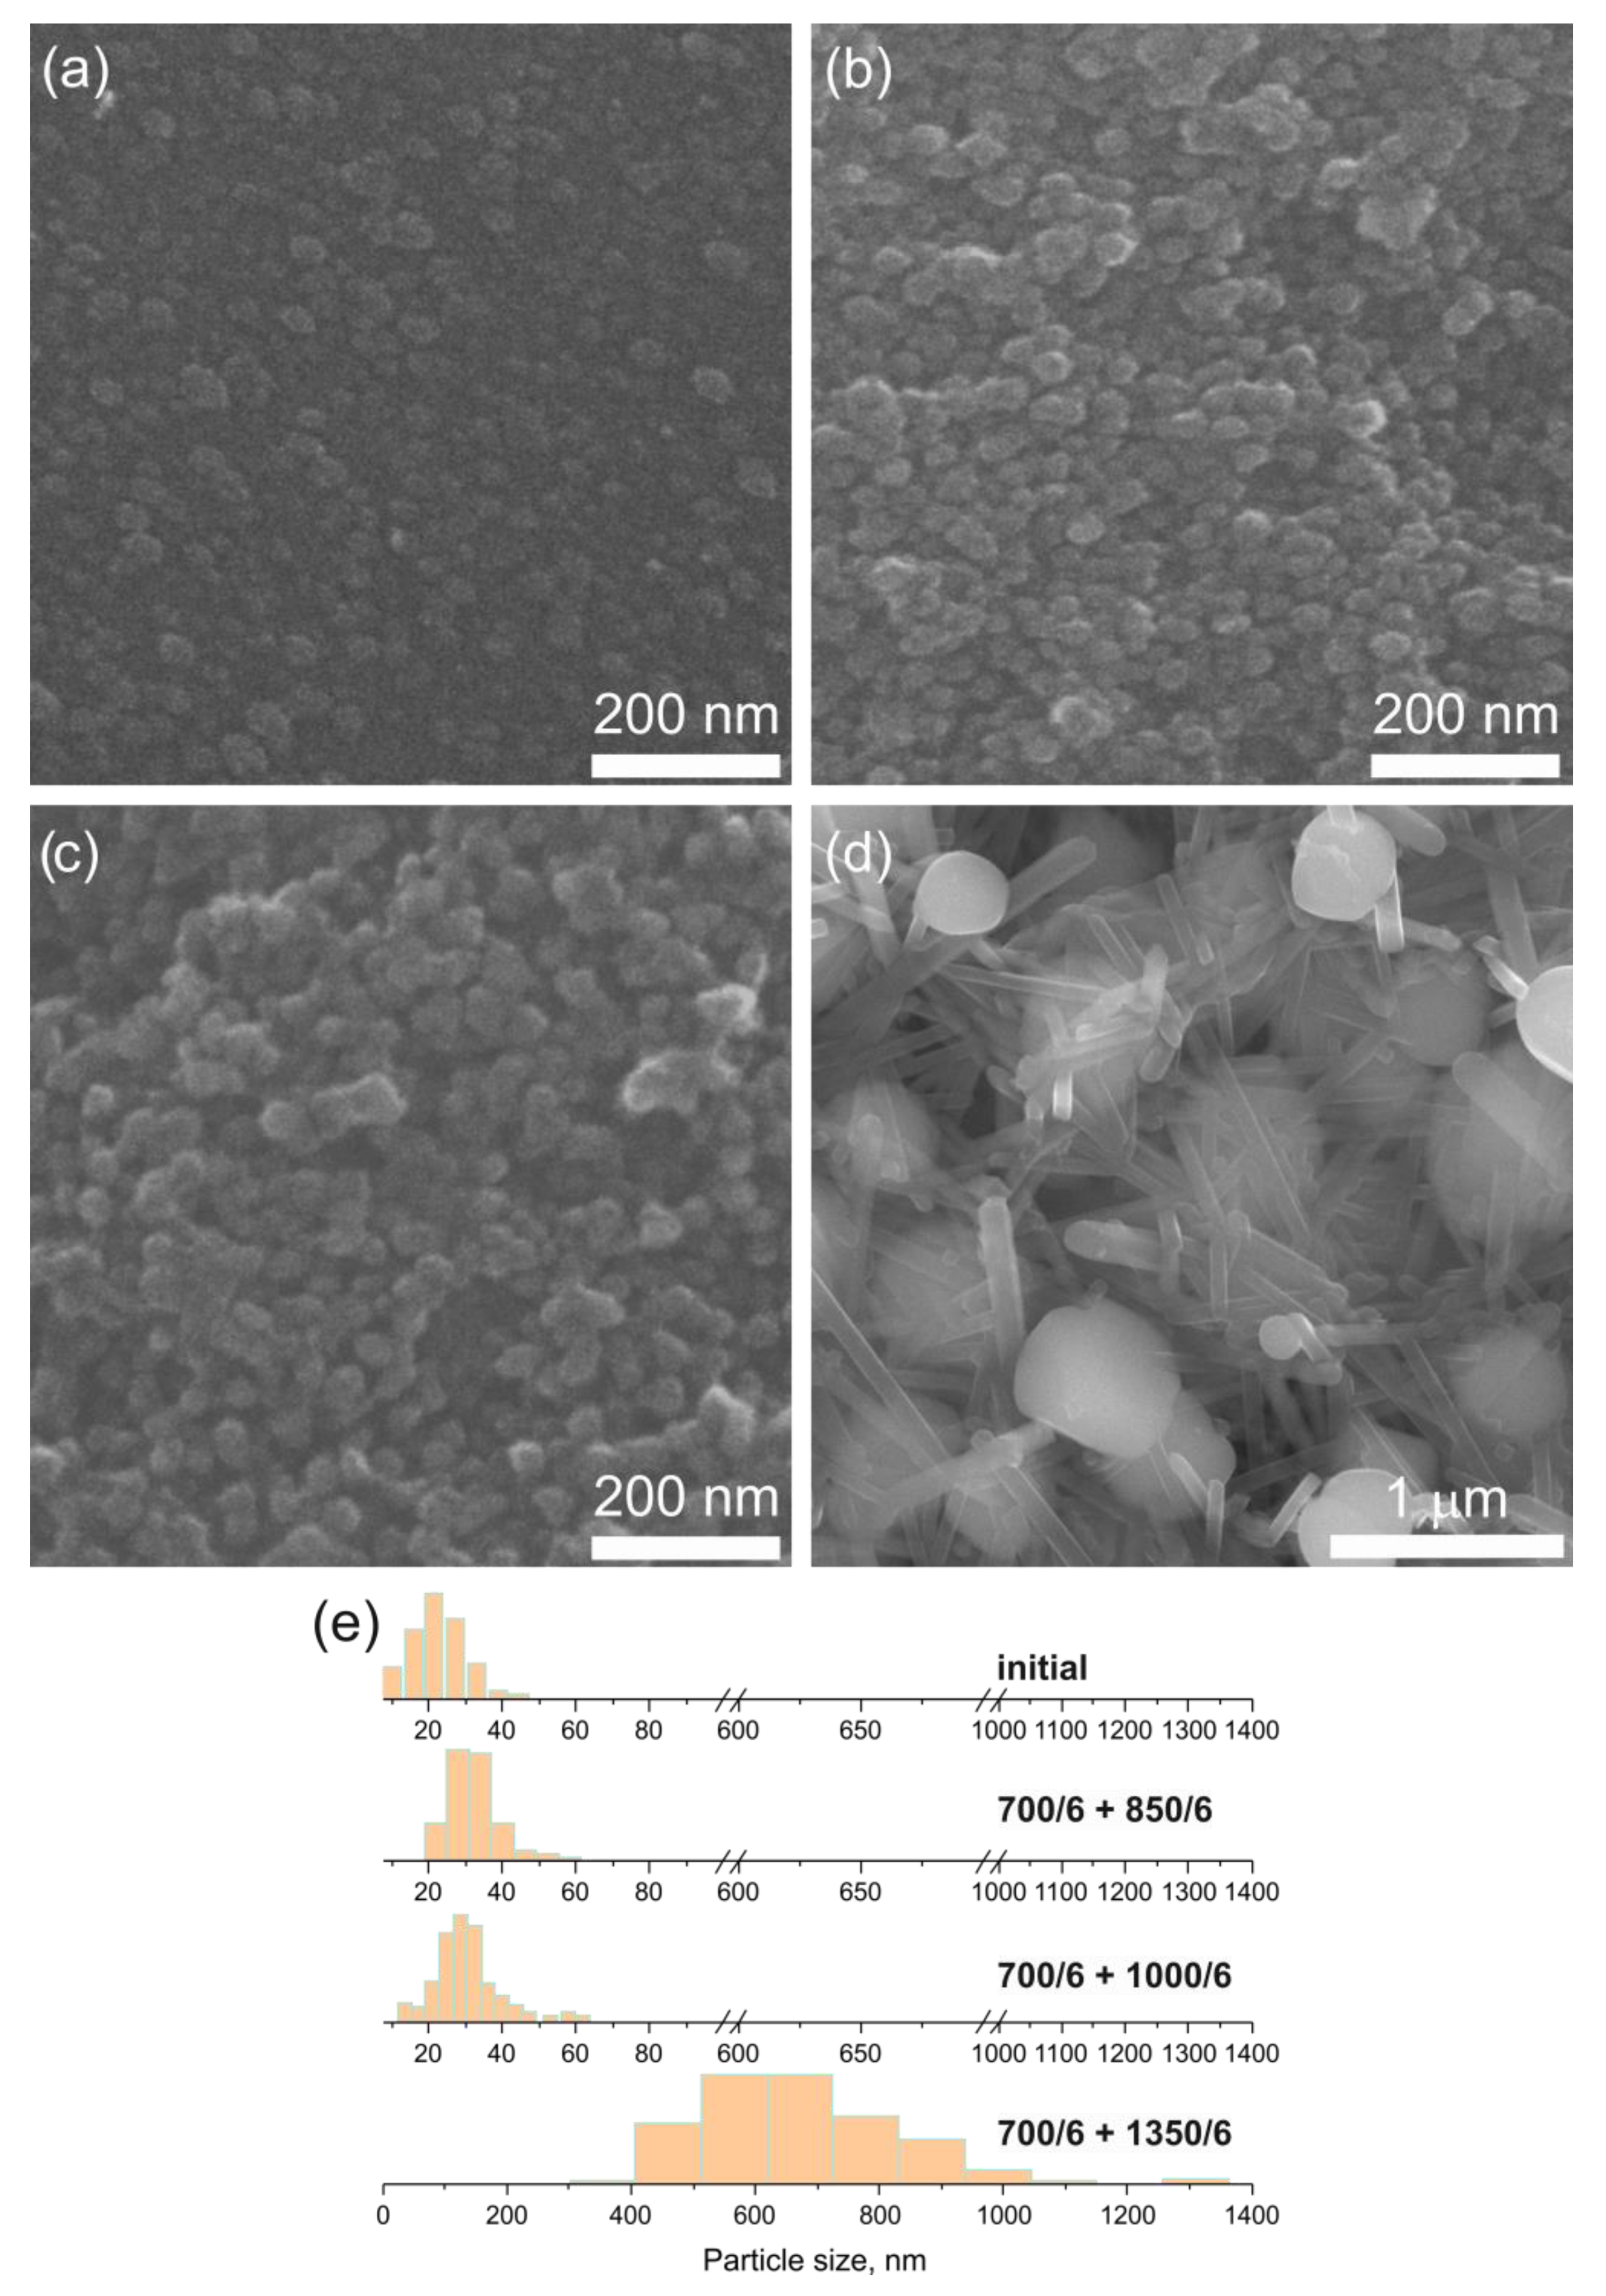
3.1.2. Isothermal Heat-Treatments

The XRD patterns for the initial and heat-treated glasses are presented in Figure 3. Initial glass, as well as the glass heat-treated at 700 °C for 6 h (Figure 3a) contains the crystals of yttrium orthoniobate, YNbO4, with distorted tetragonal structure (T’-phase) 11 nm in size (Table 1). The addition of the second heat-treatment hold at 750 °C for 6 h results in increasing fraction of the T’-phase with the same crystal size. After heat-treatments with the second hold at 800–1000 °C, volume crystallization of lithium aluminosilicate solid solutions (ss) with β-quartz structure (β-quartz ss) was observed. Thus, nanocrystals of yttrium orthoniobates serve as the heterogeneous nucleation sites for the crystallization of β-quartz ss. The crystallinity fractions and crystal sizes increase with an increase in the heat-treatment temperature. After heat-treatment at 900 °C for 6 h, the size of T’-YNbO4 crystals is 12 nm, the size of β-quartz ss is about 42 nm. XRD pattern of the sample heat-treated at the second stage at 1000 °C for 6 h shows co-precipitation of tetragonal and monoclinic nanocrystals (M-phase) of YNbO4 together with β-quartz ss (Figure 3a). The lattice parameters of the T’-phase are consistent with previously reported values of a = 5.164 Å, c = 10.864 Å [21] and show no significant change until the temperature of the second hold reaches 900 and 1000 °C, see Table 1. At the second stage at 1000 °C, the appearance of the M-phase is accompanied by a shift towards lower Bragg angles of the peaks in the XRD pattern, corresponding to the tetragonal yttrium niobate (Figure 3a). This observation is reflected in the lattice parameters, which become larger and closer to the values a = 5.21 Å and c = 11.05 Å of lattice parameters of the high-temperature T-phase [21,28].
The sample heat-treated at 700 °C and 1350 °C for 6 h at each stage contains monoclinic YNbO4 crystals with the admixture of the T-phase and crystals of β-spodumene ss (Figure 3b). To refine its structure, a Rietveld refinement was performed for this sample, and the results are presented in Figure 3b. The initial models for structure refinement of the monoclinic phase of YNbO4, the tetragonal phase of YNbO4, and β-spodumene ss were based on ICSD records #20335, #60547, and #26817, respectively. According to the phase analysis, the composition is as follows: 69 ± 1 mass% of lithium aluminosilicate with a structure of β-spodumene ss, 28 ± 1 mass% yttrium niobate with a monoclinic structure (M-YNbO4), and a trace amount of 3 ± 1 mass% yttrium niobate with a tetragonal structure (T-YNbO4). The refined lattice parameters for the β-spodumene ss phase (space group: P43212) are a = 7.5357(9) Å and c = 9.1689(15) Å, while for the M-YNbO4 phase (space group: C12/c1), the lattice parameters are a = 7.0521(10) Å, b = 10.9788(17) Å, c = 5.3004(8) Å, and β = 134.180(5)°. The refined lattice parameters for the β-spodumene ss and the M-phase are consistent with previous reports [29,30], respectively.

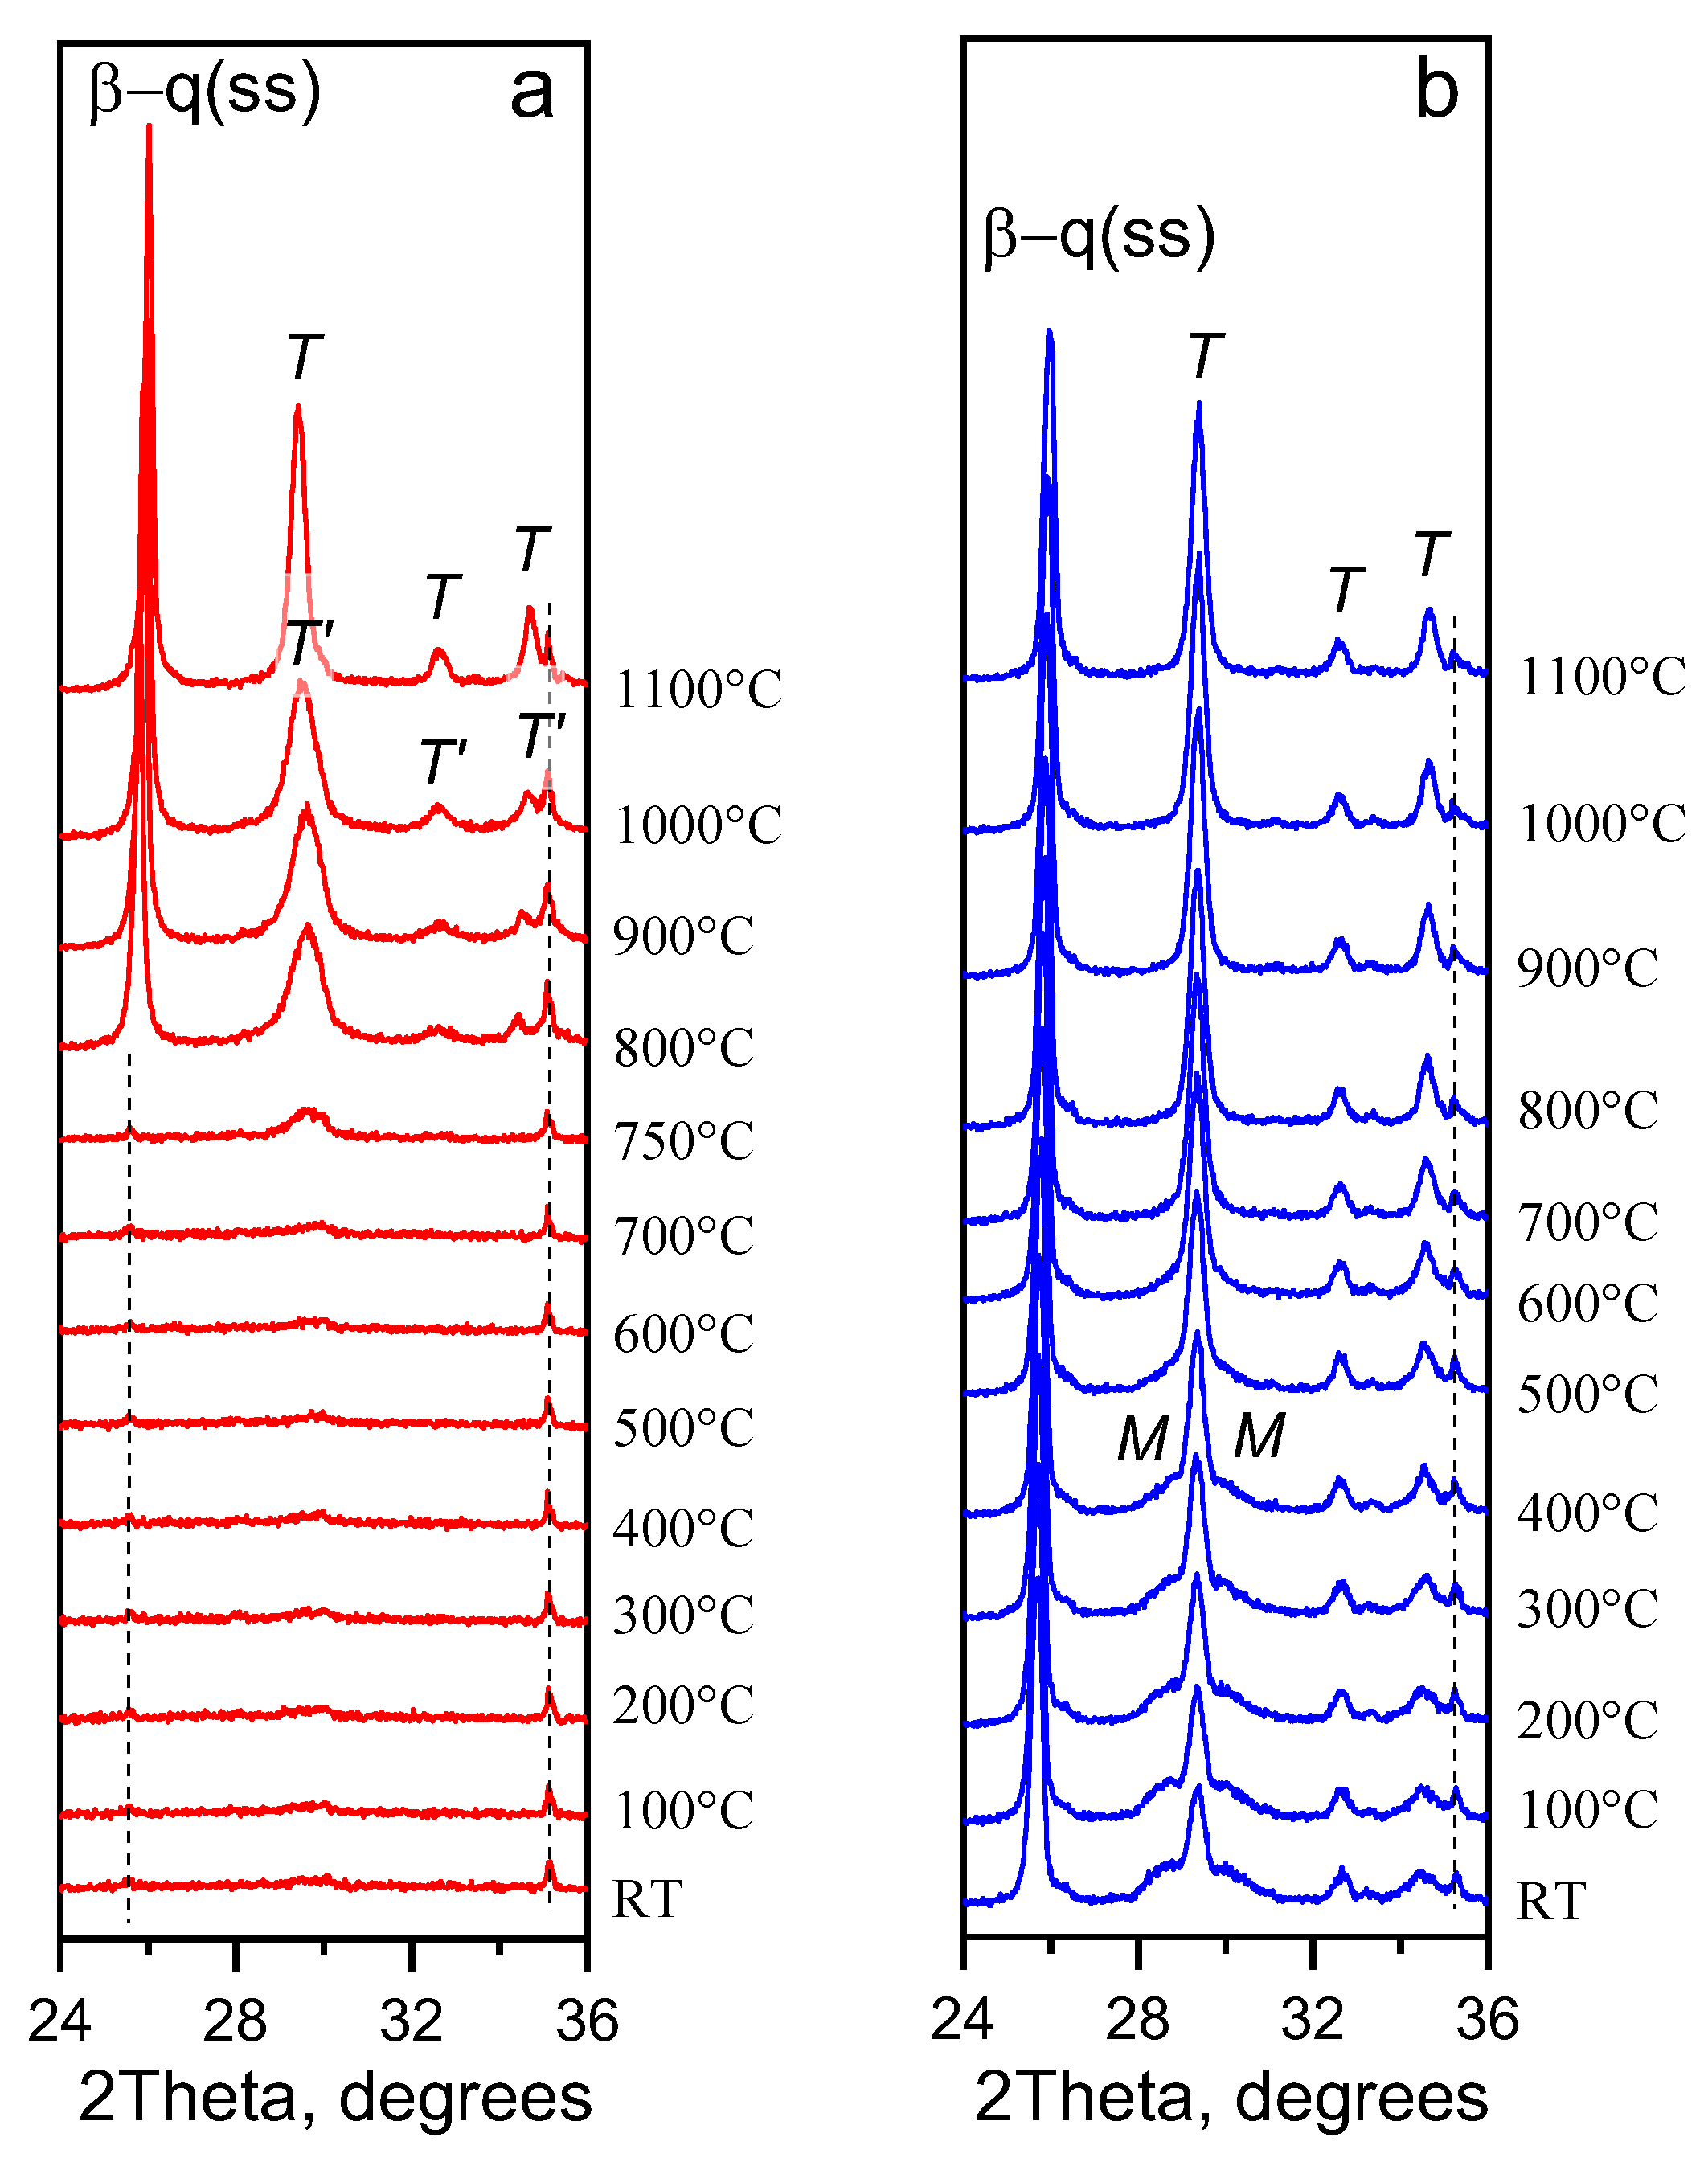
3.1.3. In Situ High-Temperature XRD Study

According to Figure 4a, above 700 °C, nanocrystalls of T’-YNbO4 continue to grow from the initial glass containing traces of the T’-phase of yttrium niobate. Crystallization of β-quartz ss begins at 800 °C. The temperature raise to 1100 °C leads to the transformation of the distorted tetragonal T’-YNbO4 to the high-temperature sheelite-like tetragonal structure. Thus, XRD patterns collected in situ upon heating demonstrate no evidence of low-temperature monoclinic phase (M-YNbO4) and argue for sequential transformations of the yttrium niobate phase from the metastable distorted tetragonal T’-phase to the thermodynamically stable at high temperatures sheelite-like one. Nanocrystals of M-YNbO4 are formed from the high-temperature tetragonal phase with sheelite-like structure upon cooling in the temperature range between 600 °C and room temperature, see Figure 4b.

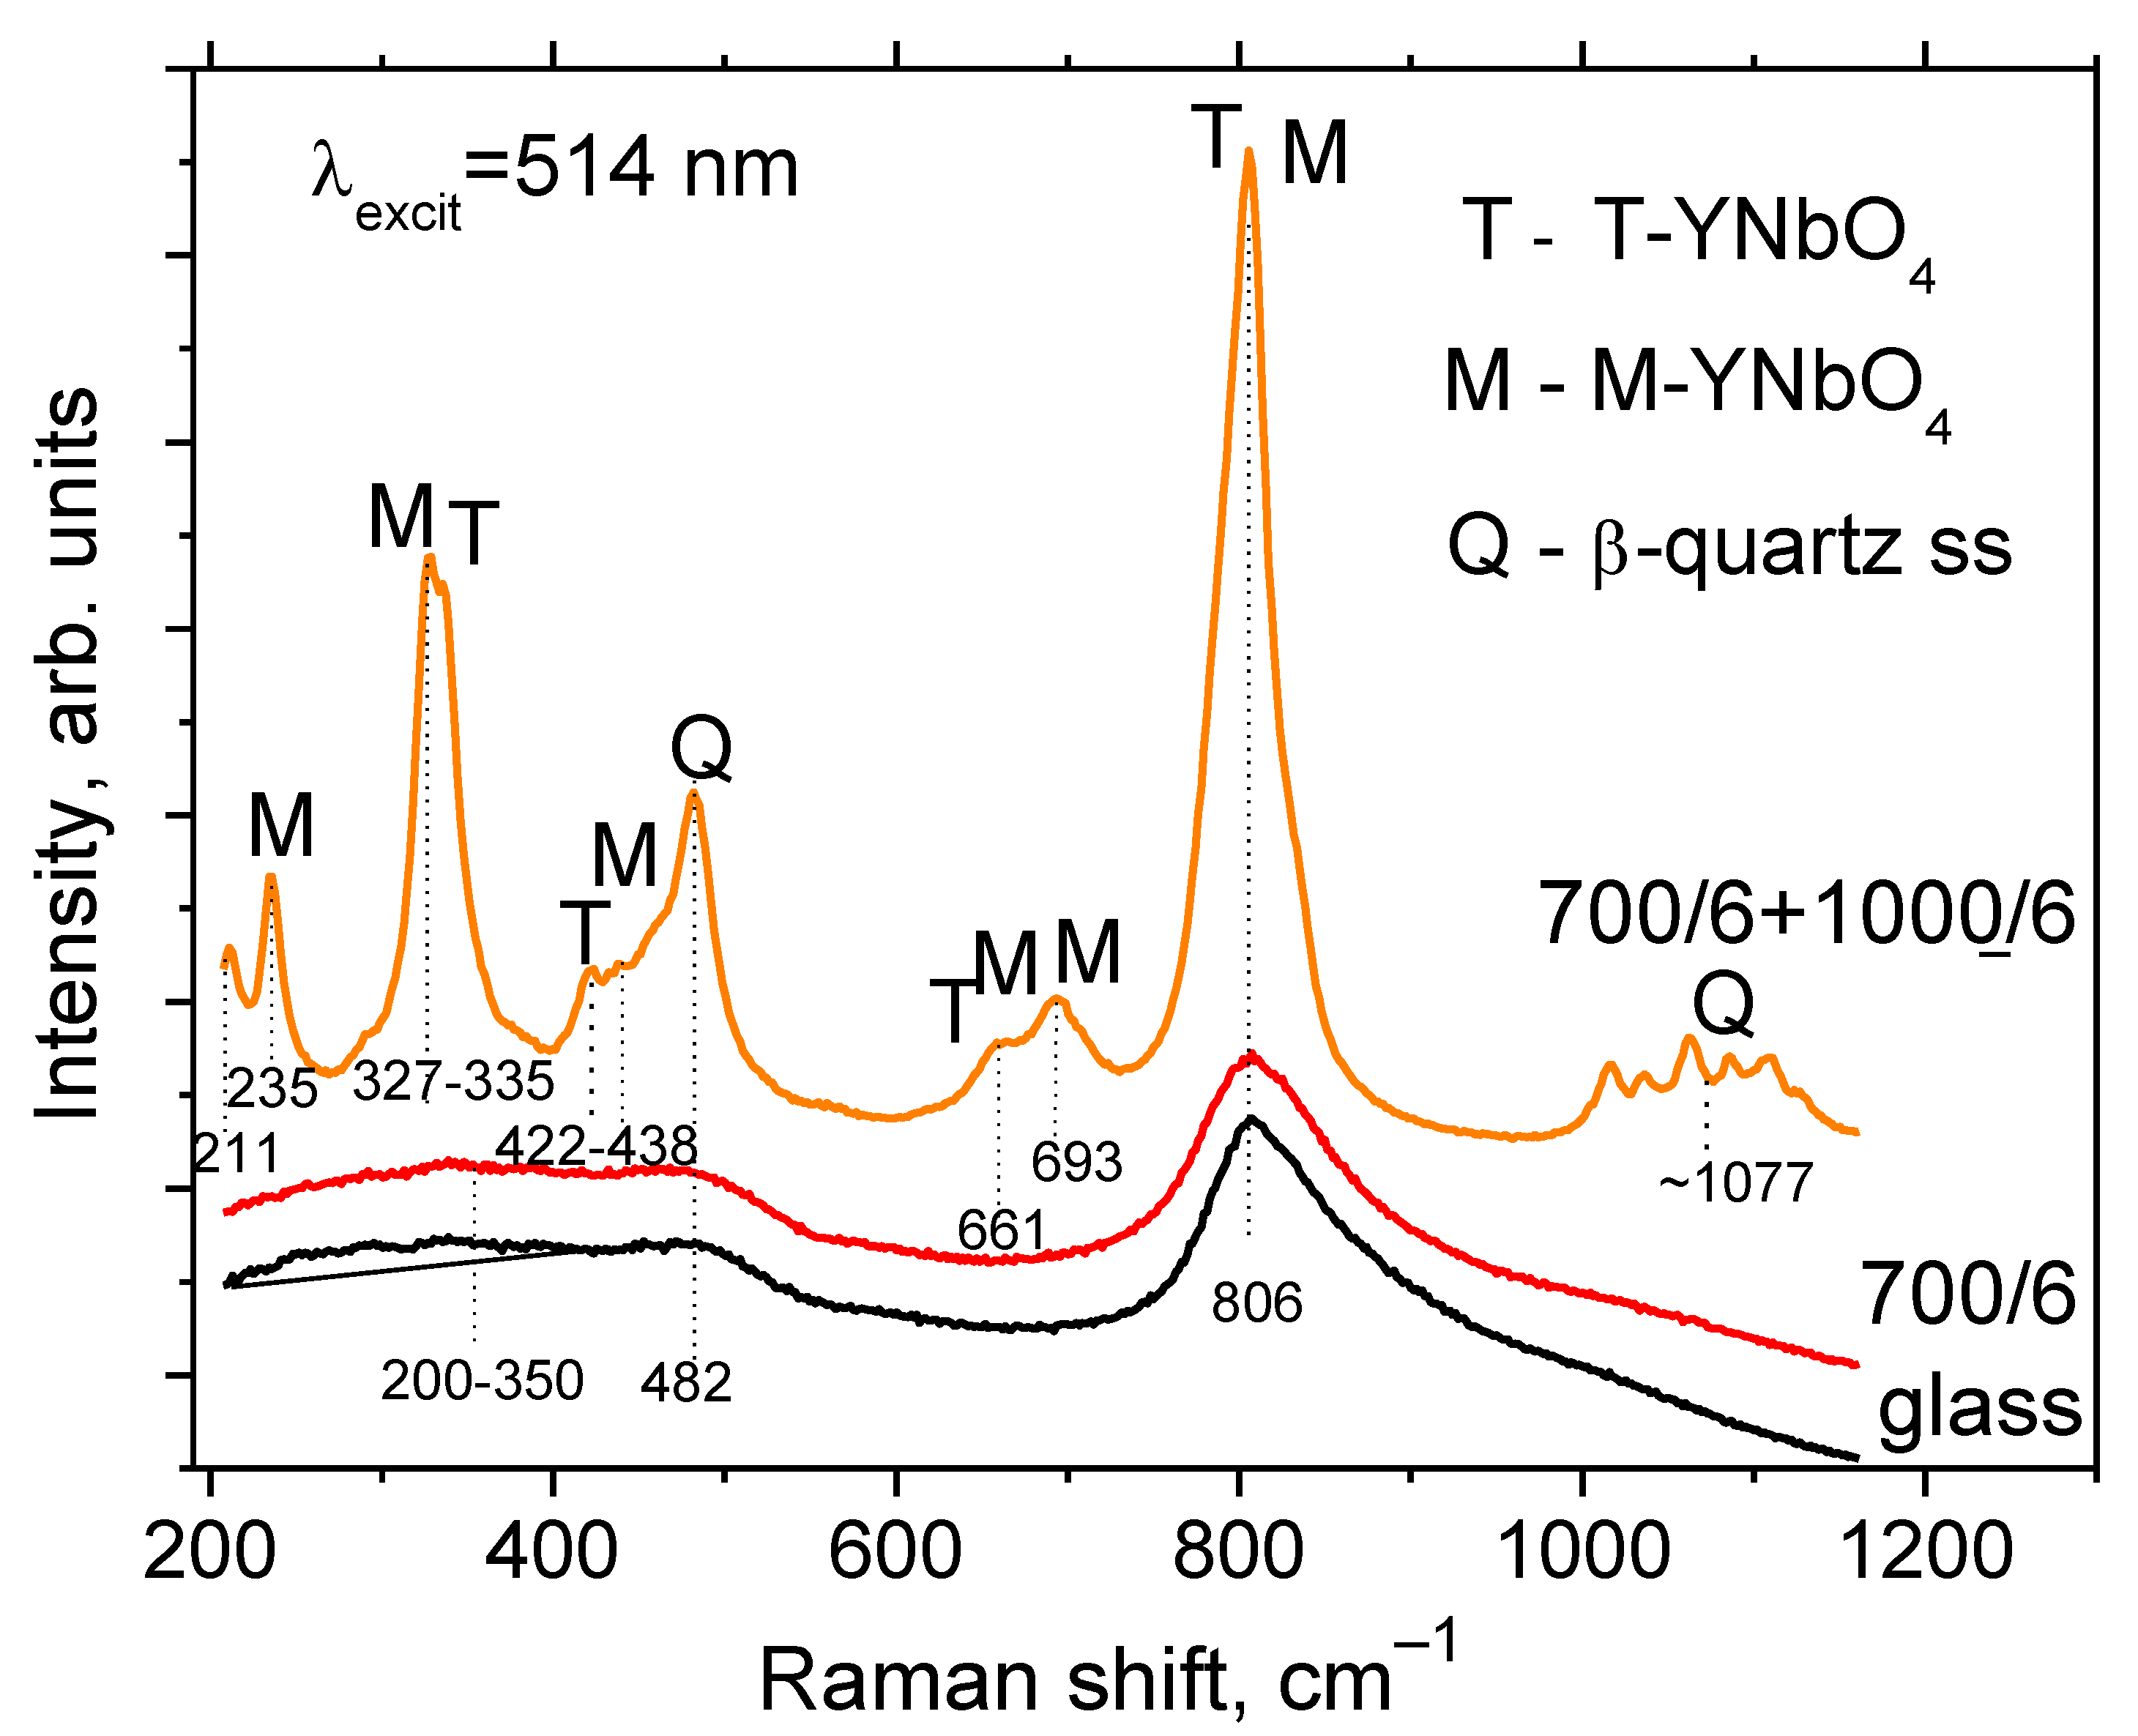
3.2. Raman Spectroscopy Study

The Raman spectrum of the initial glass demonstrates the broad band spanning from ~200 to 350 cm−1, the band at ~480 nm, an intense band with the maximum at 806 cm−1 and a shoulder in the range of about 880–1000 cm−1, see Figure 5. The spectrum of the glass heat-treated at 700 °C for 6 h resembles that of the initial glass, which is explained by their similar phase compositions, see Figure 3a. The Raman spectrum drastically changes after the heat-treatment at 700 + 1000 °C for 6 h at each stage. There are bands at 211, 235, 327, 335, 422, 438, 482, 661, and 693 cm−1, and the most pronounced band is at 806 cm−1 (Figure 5).
In the Raman spectrum of the initial glass (Figure 5), the broad band of about 480 cm−1 and a shoulder at 880 to 900 cm−1 are due to vibrations of the aluminosilicate glass network with a large number of non-bridging oxygens [31] and of [NbO4] and [NbO6] polyhedrons in the glass structure [32], respectively. The broad band at ~1000 cm−1 corresponds to vibrations of [SiO4] tetrahedrons in the aluminosilicate glass network. A very weak broad band at about 200–350 cm−1, as well as the intense band at 806 cm−1, reveal the beginning of formation of distorted orthoniobate T’-YNbO4 crystals with disordered fluorite-type structure [6,7,33]. The Raman spectrum of the glass-ceramic obtained by the heat-treatment at 1000 °C for 6 h gives the evidence of the absence of T’-phase (the disappearance of the broad band at about 200–350 cm−1). A number of distinct bands appear in the Raman spectrum of the sample. The bands at 482 and 1077 cm−1 reveal crystallization of the β-quartz ss [34]. The complex shape of the broad band with the maximum at ~1077 cm−1 is due to luminescence of Er3+ ions, the unwanted impurity in the reagent of yttrium oxide [7]. The bands at ~330, ~420, ~660, and 806 cm−1 belong to vibrations of [NbO4] tetrahedrons in the T-YNbO4 crystals [35]. Since the frequencies of the main Raman bands of the T- and M-YNbO4 crystals are very close [35], unambiguous judgment about the appearance of the M-phase is possible by the appearance in the Raman spectrum of two intense bands at 235 and 690 cm−1 and two weak bands at ~211 and ~435 cm−1. Thus, according to Raman spectroscopy findings in the sample heat-treated at 700 +1000 °C for 6 h, the tetragonal and monoclinic crystals of YNbO4 coexist, which is in accordance with the XRD findings, see Figure 3a.

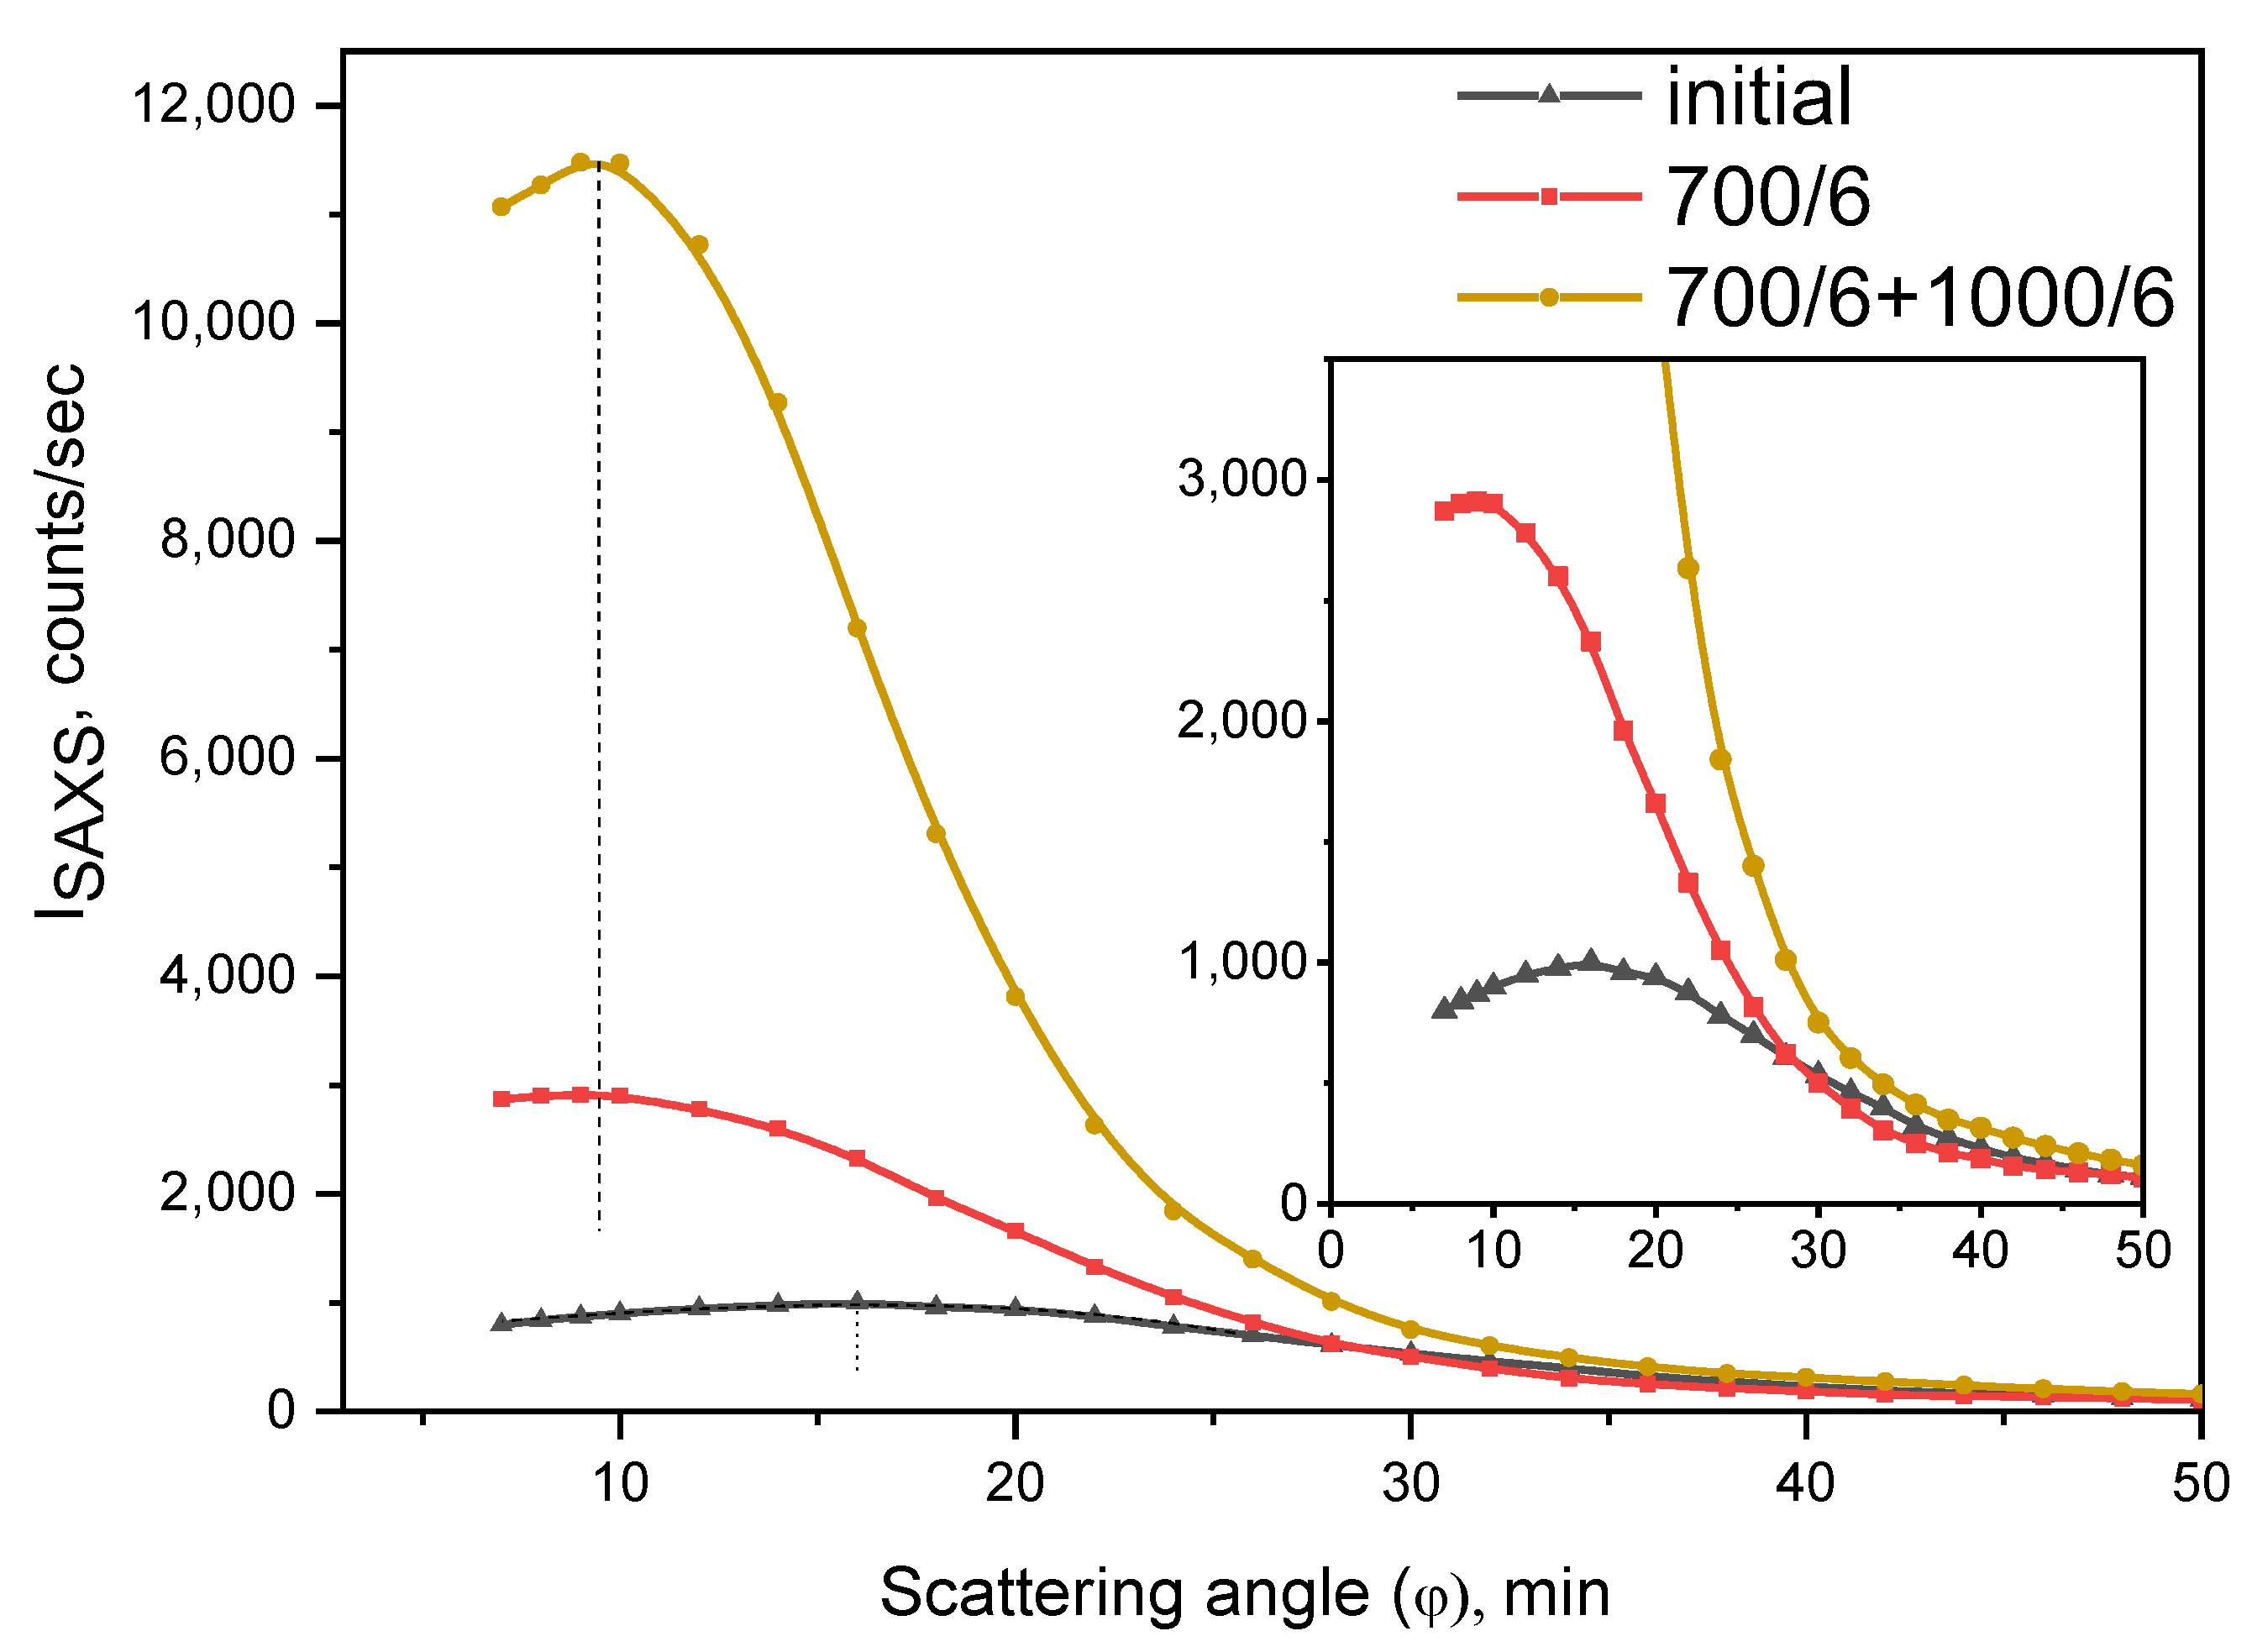
3.3. Small Angle X-ray Scattering Study
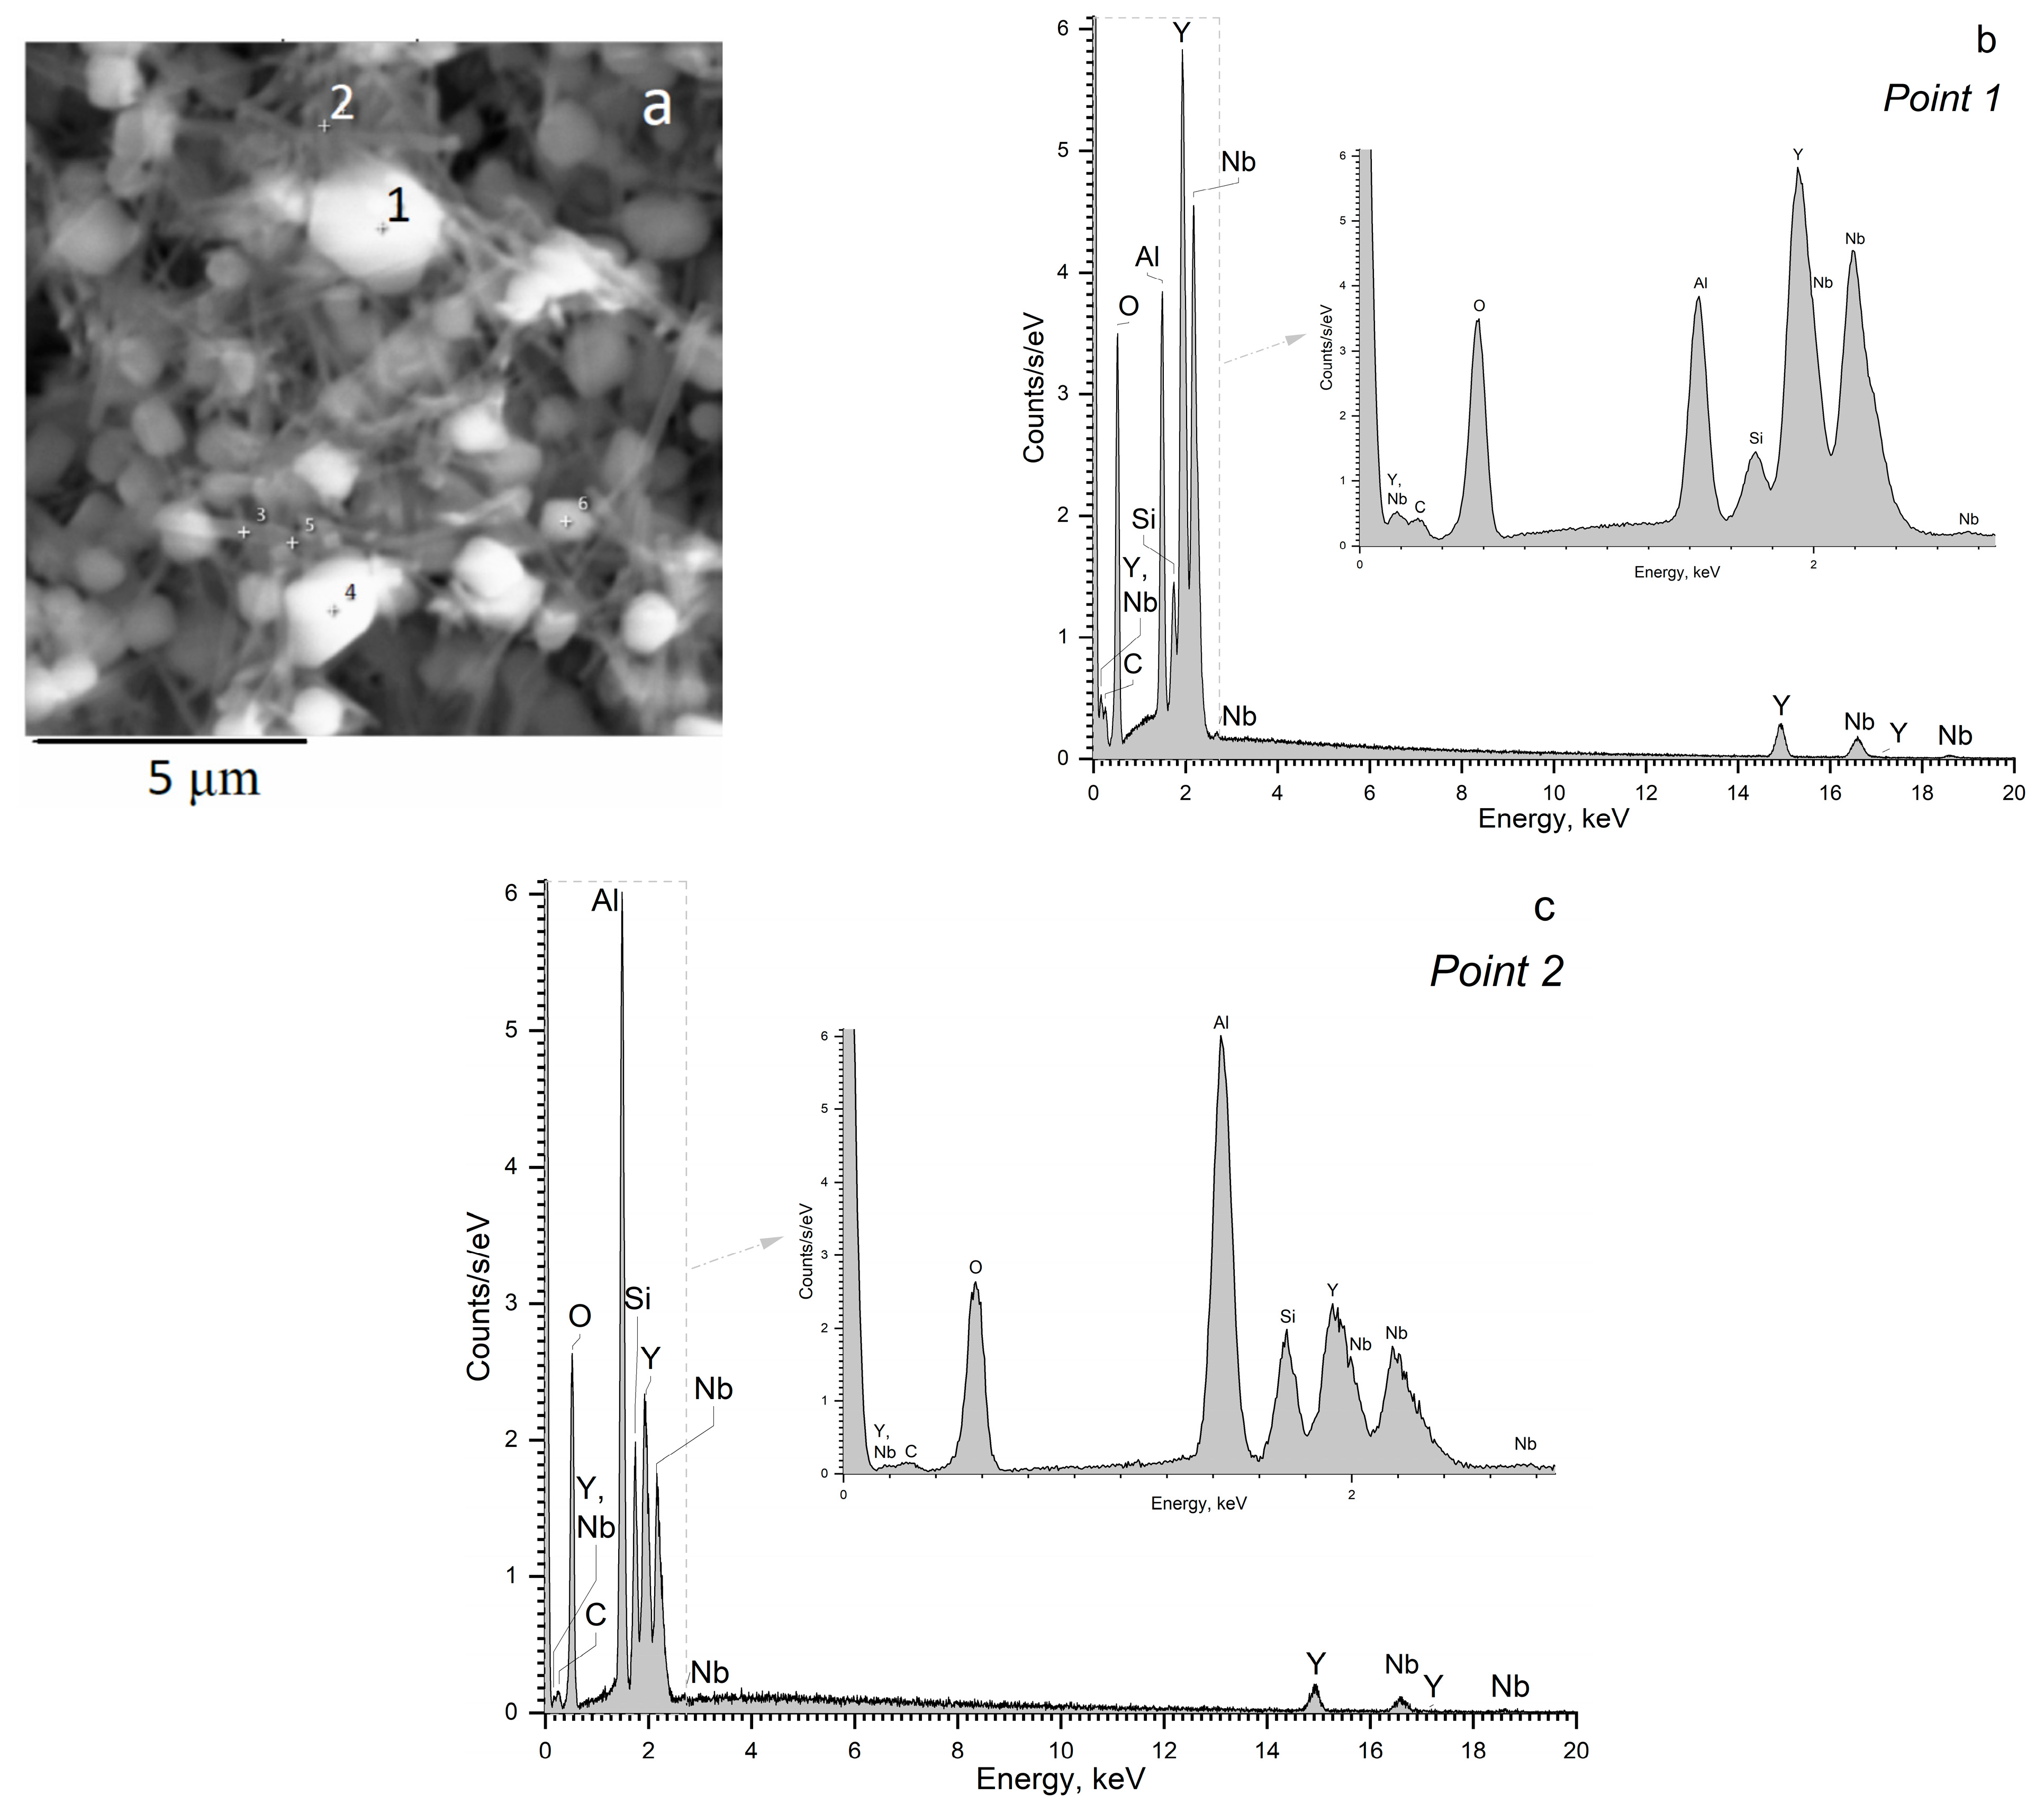
Figure 6 shows the angular dependences of the SAXS intensity for the initial glass and glasses heat-treated at 700 °C and at 700 + 1000 °C. Due to high electron density of the inhomogeneous regions containing nanosized YNbO4 crystals, the small-angle X-ray scattering is predominantly determined by scattering by these regions.
The initial glass demonstrates a well-developed inhomogeneous structure. It contains inhomogeneity regions with radii of ~50 Å as the result of phase separation and crystallization during the melt casting and cooling. The SAXS intensity increases with heat-treatment due to continuous crystallization of YNbO4 nanocrystals.
All SAXS curves exhibit a maximum, which indicates interparticle interference and, accordingly, ensures an order in the distribution of regions of inhomogeneity. It confirms the role of yttrium niobate as a nucleating agent. It can be assumed that interference effects affect the intensity of light scattering and transparency.
The maximum on the SAXS curve from the initial glass presented in Figure 6 is observed at a scattering angle of about 16’. So the average distance between scattering regions estimated by the Equation (3) is about 180 Å. As can be seen from Figure 6, low-temperature heat-treatment at 700 °C for 6 h leads to a shift of the maximum to smaller angles of ~10’ and, accordingly, to an increase in the distance between the inhomogeneous regions to ~290 Å. After the heat-treatment at 700°C + 1000 °C for 6 h, the position of the maximum on the SAXS curve practically does not change, that is, the geometry of the structure and the distribution of regions of inhomogeneity do not change. The radii of scattering regions increase from ~50 Å for the initial glass to ~80 Å for the glass heat-treated at 700 °C for 6 h and to ~100 Å for the glass-ceramics prepared by the heat-treatment at 1000 °C at the second stage. The main reasons for the increase in the intensity of SAXS during high-temperature heat-treatments are structural transformations within the inhomogeneous regions resulting in the crystallization of the YNbO4 phase.

3.4. SEM-EDX Study

Figure 7 illustrates the evolution of the initial glass morphology as a function of the heat-treatment temperature. Analysis of the SEM data of the initial glass sample revealed the presence of regions of inhomogeneity in the form of spherical particles characterized by a narrow size distribution. The average size of these particles was determined to be approximately 24 nm. Based on our previous studies [6,7] and the present data of the SAXS analysis, we suggest that nanocrystals of YNbO4 are formed within these regions of inhomogeneity. Upon subjecting the samples to two-stage heat treatments with increasing temperature, an increase in the number of these regions was observed. Their size distributions exhibited a broader shape, and the maxima of the distributions shifted towards higher values.
The average size of the regions of inhomogeneity in the sample heat-treated at the second stage at 850 °C was approximately 35 nm, while in the sample heat-treated at temperature of 1000 °C, the average size was approximately 37 nm. The morphology of the sample, which underwent a two-stage heat-treatment at 700 °C + 1350 °C, exhibited a drastic change compared to the morphology of the initial glass and the other glass-ceramics. In Figure 7d, two distinct types of particles were observed. The particles of the first type were almost spherical; with a bimodal size distribution (the smaller particles had the diameter of ~0.4 μm and the larger ones of ~0.8 μm) with the average diameter of approximately 0.72 μm. The particles of the second type had a rod-like shape with rectangular section. The length of these rod-like particles ranged from 0.2 to 6.5 μm, while the width varied from 73 to 266 nm. Based on Refs. [27,36,37] and our XRD findings, we believe that the almost spherical particles correspond to yttrium orthoniobate crystals with a monoclinic structure. Some of them have distinct facets, while the other show the melted facets, see Figure 7d. We attribute the rod-like particles to the crystalline phase of β-spodumene ss.
The microstructure and elemental composition of glass-ceramic prepared by the heat-treatment at 700 °C + 1350 °C were evaluated by SEM coupled with EDX analysis. The results are shown in Figure 8a–c. It should be mentioned that the lithium content cannot be determined by the EDX method, and the content of all other elements was normalized to 100%.
According to Figure 8b and Table 2, the bright round-shaped crystals denoted by the number 1 in Figure 8a consist of yttrium, niobium, and oxygen ions. We also conducted EDX analysis of the other round-shaped particles of different sizes and found that they have a very similar elemental composition. Aluminum and silicon ions that appear in the EDX spectrum in Figure 8b probably come from the surrounding matrix and from the rod-like crystals located nearby (we should bear in mind that aluminum oxide is more resistant to hydrofluoric acid than silica). Figure 8c presents the results of the EDX analysis of the material from the point 2 in Figure 8a. Point 2 was chosen as a place where a number of the rod-like crystals are located, see Figure 8a. This composition is enriched in aluminum and silicon and depleted in yttrium and niobium as compared with the composition in the point 1.

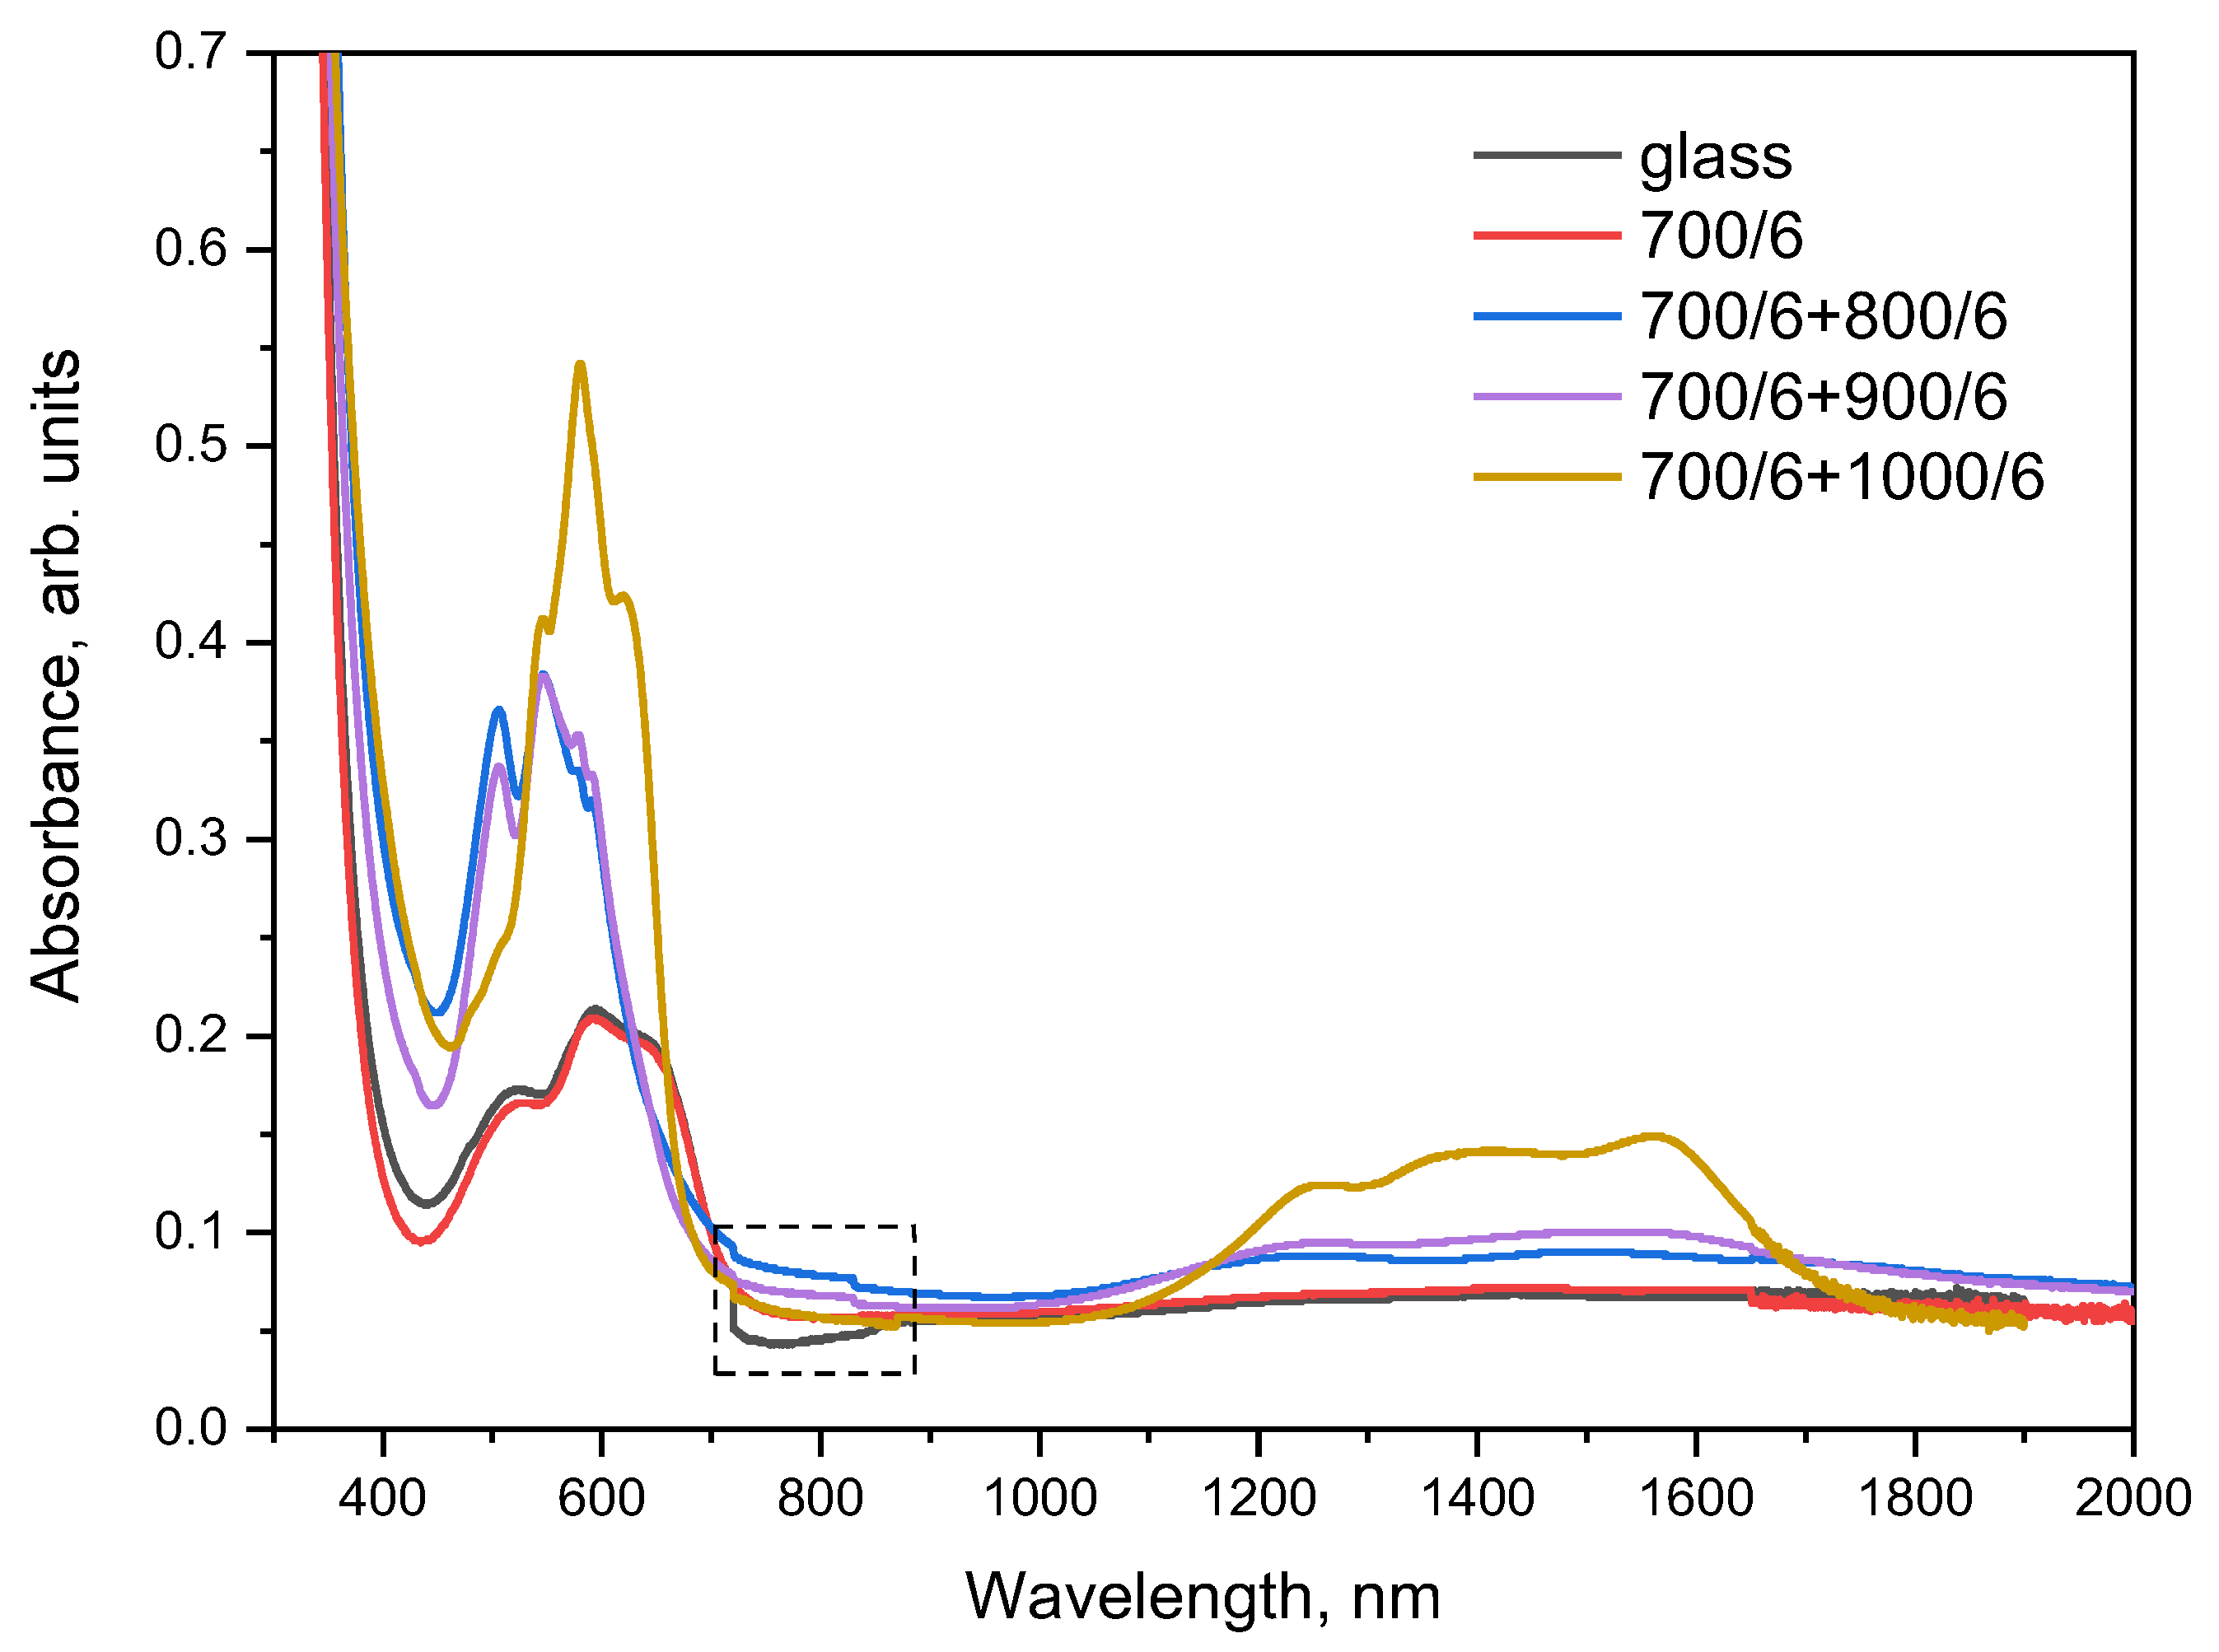
3.5. Absorption Spectra

Absorption spectra of the initial glass and glass-ceramics are determined by absorption of Co2+ ions. The spectrum of the initial blue glass shows three wide absorption bands in the visible region at 510, 590, and 650 nm, and a weak broad band in IR region spanning from ~1000 to ~2300 nm with a maximum at ~1460 nm, see Figure 9. The shape of the absorption spectrum remains near unchanged after heat-treatments at 700 °C and 700 + 750 °C for 6 h; these samples are also blue-colored, see Figure 1. When the main crystalline phase of β-quartz ss starts to crystallize at 800 °C, the material becomes violet-colored and its absorption drastically changes. It is characterized by a number of well-resolved intense bands in the visible range of spectrum with maxima at 505, 550, 580, and 595 nm, see Figure 9. There is also a weak inflection at 430 nm. In the IR region, broad bands are observed with maxima around 1250, 1500, 1720, and 1970 nm. The spectrum remains near unchanged up to heat-treatment at 700 + 1000 °C, when the color of the materials changes again to violet-blue, and new spectral features evolve. In the visible region, the spectrum is characterized by a number of narrow bands at 545, 580, and 620 nm. In the IR, there are three wide bands at approximately 1260, ~1400, and 1560 nm.
The spectrum of the initial glass is characteristic for Co2+ ions in silicate and aluminosilicate glasses and thoroughly discussed in the literature [23,38,39,40]. This type of spectrum is caused by the absorption of octahedrally and tetrahedrally coordinated Co2+ species with the predominance of the octahedrally coordinated Co2+ species (the presence of octahedrally coordinated Co2+ ions is confirmed by a characteristic absorption band at 510 nm). This spectrum is similar to the spectrum of the cobalt-doped initial glass of the same composition nucleated by ZrO2, see Ref. [23]. This similarity suggests that Co2+ ions do not enter into the crystalline phase of the nucleating agent but remain in the residual glass phase. The fact that the absorption spectrum of the initial glass does not change with heat-treatment at 700 °C and even at 700 + 750 °C confirms this suggestion because the volume fraction of YNbO4 nanocrystals increases with these heat-treatments, see Figure 3a. The spectral features of absorption spectra of glass-ceramics prepared by the heat-treatments at the second stage at 800, 850, 900, and 1000 °C are similar to those discussed in Ref. [23]. It is not surprising because in Ref. [23], we studied the structural states of Co2+ ions upon formation of the same main crystalline phase of β-quartz ss in the glass of the same composition nucleated by ZrO2. The spectrum of the violet-colored glass-ceramic prepared at 800 and 900 °C, resembles the so-called type II spectrum of Ref. [23]. It is assigned to a combination of the two coordinations, with a predominance of octahedral coordination, which gives rise to a band at 505 nm. Intensities of absorption bands at 505 and 550 nm are relatively high, indicating the possibility of distortion of the octahedral symmetry. The presence of tetrahedral sites is manifested by the bands at 550, 580, and 595 nm. The band at 1220 nm arises from Co2+ ions in octahedral sites, while bands at 1260, 1400, and 1570 nm are due to tetrahedral sites of Co2+. Following Bogdanova et al. [40], we state [23] that Co2+ ions isomorphously replace Li+ ions located mostly in octahedral sites in the disordered structure of β-quartz ss crystallized in glass having high viscosity. The appearance of the so-called type III spectrum [23] after the heat-treatment at 1000 °C could be explained by a significant change in the local environment around the Co2+ ions in the structure of β-quartz ss. An increase in intensities of the bands at 545, 580, and 620 nm in the visible range of spectrum, and of bands at 1390 and 1570 nm in the IR (Figure 9), manifests an increase in tetrahedrally coordinated Co2+ sites. Table 1 of Ref. [23] shows an assignment of the absorption bands of Co2+ ions recorded in the initial glass and glass-ceramics.

3.6. Linear Coefficient of Thermal Expansion

The CTE value is ~61.0 ± 1.0 × 10⁻⁷ K−1 for the initial glass and the glass heat-treated at 700 °C and at 700 + 750 °C, which is consistent with their similar phase composition. The CTE value drastically changes upon crystallization of the main phase, β-quartz ss, see Table 3. The lowest CTE value of the transparent glass-ceramics of the LAS system obtained in this study is 8.5 ± 1.0 × 10⁻⁷ K−1. Crystallization of β-quartz ss in glasses of the LAS system doped with TiO2, ZrO2, or their mixture usually results in transparent glass-ceramics with near zero CTE value [1,2]. We believe that the crystals of yttrium orthoniobate with the CTE value of about 100–110 × 10−7 K−1 [27] are responsible for the obtained CTE values, while the combination of two crystalline phases with different CTE values and of the residual glass phase is responsible for the complex dependence of the CTE value on the heat-treatment schedule. It is worth mentioning that the proper choice of the heat-treatment schedule allows us to obtain glass-ceramics with the CTE varied in the broad range of the values.

4. Discussion

The initial glass is found to be inhomogeneous. It contains nanosized metastable crystals of T’-YNbO4 with the distorted tetragonal structure. They crystallized from the initial glass during melt casting, cooling, and annealing. The T’-crystals are preserved at room temperature. According to SAXS findings, there is an order in the distribution of these T’-YNbO4 crystals, which confirms the role of yttrium niobate as a nucleating agent. Glass-ceramics obtained by isothermal heat-treatments at 700–900 °C also contain the T’-phase. In our previous studies [6,7], we have demonstrated that the formation of M-YNbO4 nanocrystals in glass-ceramics typically occurs only after isothermal heat-treatments at temperatures exceeding 950 °C.
According to in situ HT-PXRD study, the T’-phase had broadened peaks. The T-phase with sharp lines developed above 1000 °C. No yttrium niobate other than YNbO4 was observed during the heating process. On cooling, the T-phase was gradually converted to the M-phase by a very sluggish phase transformation below 600 °C. It should be noted the T’ to M-phase transformation did not occur; the T’-phase crystallized during heat-treatments was obtained at room temperature.
Thus, the in situ HT-PXRD study revealed that the M-YNbO4 crystals are formed not during isothermal heat-treatments but during cooling the prepared glass-ceramics in the temperature range from 600 °C to room temperature. M-phase is formed by the transformation of crystals of the high-temperature tetragonal phase with a sheelite-like structure, T-YNbO4.
In our studies, a complete T–M phase transition did not occur in the selected heat-treatment schedules, resulting in the coexistence of the M-phase and the T-phase at room temperature. It can be inferred that the stabilization of the tetragonal niobate phase with sheelite structure at room temperature is influenced by the size effect through the contribution of high surface energy to the Gibbs energy of the tetragonal niobate crystals.
Prolonged heat-treatment at 1350 °C ensures that the majority of the niobate phase undergoes crystallization in the form of the T-phase and subsequently transforms into the M-phase during cooling to room temperature.
In this study, we aimed to reveal the mechanism of phase transformations in yttrium orthoniobate nanocrystals upon heating the initial glass and cooling the fabricated glass-ceramic. The glass composition studied in this work was the model one. Relatively high concentrations of yttrium and niobium oxides made it easier for us to study these phase transformations. It should be noted that the crystalline phase of YNbO4 is not only the nucleating agent but also a promising host for other rare-earth ions [6,7]. That is why it is quite natural that the proportion of Y2O3 and Nb2O5 is above the proportions of TiO2/ZrO2 usually used in industry. It should be noted that rare-earth ions do not enter any crystalline phase of LAS glass-ceramics produced in industry.
Doping the glass with small amount of cobalt oxide allowed us to demonstrate that the developed glass-ceramics are multifunctional materials. In this work, we have shown that cobalt ions, as representatives of transition metal ions, do not enter the crystalline phase of yttrium orthoniobate, but selectively enter crystals of the β-quartz ss. According to our previous studies [6,7] rare-earth ions, such as Er3+, Yb3+, and Eu3+, do not enter the structure of the β-quartz ss, but form their own phase of rare-earth orthoniobate or selectively enter the structure of yttrium orthoniobate [6,7]. By this means, rare-earth orthoniobates play the dual role of nucleating agents and active crystalline phases containing rare-earth ions. Thus, we demonstrated the development of transparent glass-ceramics with near zero thermal expansion and with a selective doping of rare-earth and transition metal ions into different crystalline phases. These materials are promising for photonic applications.

5. Conclusions

Transparent glass-ceramics based on nanosized crystals of yttrium orthoniobates, YNbO4, and β-quartz ss and doped with cobalt ions were prepared for the first time. The initial glass and glass-ceramics obtained by isothermal heat-treatments at 700–750 °C contain the only phase of T’-YNbO4 with the distorted tetragonal structure and the crystal size of ~10 nm. With an increase in the heat-treatment temperature, the size and volume fraction of YNbO4 crystals grow; in the process, the crystal structure transforms to the tetragonal one, T-phase. In glass-ceramics obtained by heat-treatment at 1000 °C the transformation to the monoclinic form (M-phase) begins.
The sequence of phase transformations in the yttrium orthoniobates crystals was studied in detail by means of in situ high-temperature X-ray diffraction and differential thermal analysis. It was revealed for the first time that formation of the monoclinic phase of yttrium orthoniobate occurs only from the high-temperature tetragonal phase with a sheelite-like structure upon cooling according to the displacive ferroelastic transformation of a second order.
Nanosized crystals of yttrium orthoniobates act as nucleating agents for bulk crystallization of lithium aluminosilicate solid solutions with β-quartz structure, the main crystalline phase of glass-ceramics, which starts to crystallize at 800 °C.
It was demonstrated that cobalt ions from the initial glass selectively enter the crystals of β-quartz ss. The multifunctional transparent glass-ceramics were developed. In these glass-ceramics, rare-earth ions can selectively enter the nanosized crystals of yttrium niobate, while the transition metal ions can selectively enter the β-quartz ss. The large amount of the main crystalline phase of β-quartz ss ensures the low values of coefficient of thermal expansion and high thermal shock resistance of the developed glass-ceramics. Heat-treatments at different temperatures result in the development of glass-ceramics containing crystalline phases of different structures, thus ensuring a variety of their physical and optical properties.

Author Contributions

Conceptualization, O.D., A.B. and A.Z.; methodology, O.D., A.B., I.A., M.T. and D.D.; software, A.B.; validation, O.D., A.B. and I.A.; investigation, O.D., A.B., I.A., V.G., S.Z. and M.T.; resources, O.D. and D.D.; data curation, S.Z. and K.B.; writing—original draft preparation, O.D. and A.B.; writing—review and editing, O.D.; visualization, A.B.; supervision, O.D.; project administration, O.D.; funding acquisition, O.D. and A.Z. All authors have read and agreed to the published version of the manuscript.

Funding

This research received no external funding.

Institutional Review Board Statement

Not applicable.

Informed Consent Statement

Not applicable.

Data Availability Statement

Data is contained within the article.

Acknowledgments

The SEM study was performed using the analytical equipment of the Engineering Center of the St. Petersburg State Institute of Technology.

Conflicts of Interest

The authors declare no conflict of interest.

References

  1. Holand, W.; Beall, G.H. (Eds.) Glass-Ceramic Technology, 3rd ed.; Wiley/American Ceramic Society: New York, NY, USA, 2020; pp. 82–87, 273–281. [Google Scholar]
  2. Bach, H.; Krause, D. (Eds.) Low Thermal Expansion Glass Ceramics, 2nd ed.; Springer: Berlin/Heidelberg, Germany, 2005; p. 260. [Google Scholar]
  3. Fujita, S.; Tanabe, S. Structural evolution of Er3+ ions in Li2O–Al2O3–SiO2 glass-ceramics. J. Ceram. Soc. Jpn. 2008, 116, 1121–1125. [Google Scholar] [CrossRef] [Green Version]
  4. Beall, G.H. Milestones in glass-ceramics: A personal perspective. Int. J. Appl. Glass Sci. 2014, 5, 93–103. [Google Scholar] [CrossRef]
  5. Dymshits, O.; Shepilov, M.; Zhilin, A. Transparent glass-ceramics for optical applications. MRS Bull. 2017, 42, 200–205. [Google Scholar] [CrossRef]
  6. Dymshits, O.S.; Alekseeva, I.P.; Zhilin, A.A.; Tsenter, M.Y.; Loiko, P.A.; Skoptsov, N.A.; Malyarevich, A.M.; Yumashev, K.V.; Mateos, X.; Baranov, A.V. Structural characteristics and spectral properties of novel transparent lithium aluminosilicate glass-ceramics containing (Er,Yb)NbO4 nanocrystals. J. Lumin. 2015, 160, 337–345. [Google Scholar] [CrossRef]
  7. Loiko, P.A.; Dymshits, O.S.; Alekseeva, I.P.; Zhilin, A.A.; Tsenter, M.Y.; Vilejshikova, E.V.; Yumashev, K.V.; Bogdanov, K.V. Structure and spectroscopic properties of transparent glass-ceramics with (Eu3+,Yb3+):YNbO4 nanocrystals. J. Lumin. 2016, 179, 64–73. [Google Scholar] [CrossRef]
  8. Blasse, G. Luminescence processes in niobates with fergusonite structure. J. Lumin. 1976, 14, 231–233. [Google Scholar] [CrossRef]
  9. Mao, J.; Jiang, B.; Wang, P.; Qiu, L.; Abass, M.T.; Wei, X.; Chen, Y.; Yin, M. A study on temperature sensing performance based on the luminescence of Eu3+ and Er3+ co-doped YNbO4. Dalton Trans. 2020, 49, 8194–8200. [Google Scholar] [CrossRef]
  10. Wang, X.; Li, X.; Shen, R.; Xu, S.; Zhang, X.; Cheng, L.; Sun, J.; Zhang, J.; Chen, B. Optical transition and luminescence properties of Sm3+-doped YNbO4 powder phosphors. J. Am. Ceram. 2020, 103, 1037–1045. [Google Scholar] [CrossRef]
  11. Hirano, M.; Ishikawa, K. Intense up-conversion luminescence of Er3+/Yb3+ co-doped YNbO4 through hydrothermal route. J. Photochem. Photobiol. A Chem. 2016, 316, 88–94. [Google Scholar] [CrossRef]
  12. Đačanin, L.R.; Lukić-Petrović, S.R.; Petrović, D.M.; Nikolić, M.G.; Dramićanin, M.D. Temperature quenching of luminescence emission in Eu3+- and Sm3+-doped YNbO4 powders. J. Lumin. 2014, 151, 82–87. [Google Scholar] [CrossRef]
  13. Niu, C.; Li, L.; Li, X.; Lv, Y.; Lang, X. Upconversion photoluminescence properties of Ho3+/Yb3+ co-doped YNbO4 powder. Opt. Mater. 2018, 75, 68–73. [Google Scholar] [CrossRef]
  14. Đačanin Far, L.; Lukić-Petrović, S.R.; Đorđević, V.; Vuković, K.; Glais, E.; Viana, B.; Dramićanin, M.D. Luminescence temperature sensing in visible and NIR spectral range using Dy3+ and Nd3+ doped YNbO4. Sens. Actuator A Phys. 2018, 270, 89–96. [Google Scholar] [CrossRef]
  15. Đačanin Far, L.; Ćirić, A.; Sekulić, M.; Periša, J.; Ristić, Z.; Antić, Ž.; Dramićanin, M.D. Judd-Ofelt description of radiative properties of YNbO4 activated with different Eu3+ concentrations. Optik 2023, 272, 170398. [Google Scholar]
  16. Zhou, Y.; Ma, Q.; Lü, M.; Qiu, Z.; Zhang, A. Combustion synthesis and photoluminescence properties of YNbO4-based nanophosphors. J. Phys. Chem. C 2008, 112, 19901–19907. [Google Scholar] [CrossRef]
  17. Barth, T. The structure of synthetic, metamict, and recrystallized fergusonite. Nor. Geol. Tidsskr. 1926, 9, 23–36. [Google Scholar]
  18. Komkov, A.I. The structure of natural fergusonite, and of a polymorphic modification. Kristallografiya (Sov. Phys. Crystallogr.) 1959, 4, 836–841. (In Russian) [Google Scholar]
  19. Stubican, V. High-temperature transitions in rare-earth niobates and tantaIates. J. Am. Ceram. Soc. 1964, 47, 55–58. [Google Scholar] [CrossRef]
  20. Jurkschat, K.; Sarin, P.; Siah, L.F.; Kriven, W.M. In Situ High-temperature phase transformations in rare earth niobates. Adv. X-ray Anal. 2004, 47, 357–359. [Google Scholar]
  21. Yamaguchi, O.; Matsui, K.; Kawabe, T.; Shimizu, K. Crystallization and transformation of distorted tetragonal YNbO4. J. Am. Ceram. Soc. 1985, 68, 275–276. [Google Scholar] [CrossRef]
  22. Mather, S.A.; Davies, P.K. Nonequilibrium phase formation in oxides prepared at low temperature: Fergusonite-related phases. J. Am. Ceram. Soc. 1995, 78, 2737–2745. [Google Scholar] [CrossRef]
  23. Kang, U.; Dymshits, O.S.; Zhilin, A.A.; Chuvaeva, T.I.; Petrovsky, G.T. Structural states of Co(II) in β-eucryptite-based glass-ceramics nucleated with ZrO2. J. Non-Cryst. Solids 1996, 204, 151–157. [Google Scholar] [CrossRef]
  24. Lipson, H.; Steeple, H. Interpretation of X-ray Powder Patterns; McMillan, Ed.; Martins Press: London, UK, 1970; p. 335. [Google Scholar]
  25. Filipovich, V.N. Toward the theory of Small-Angle X-ray Scattering. Zh. Tekh. Fiz. 1956, 26, 398–416. (In Russian) [Google Scholar]
  26. Andreev, N.S.; Filipovich, V.N.; Mazurin, O.V.; Porai-Koshits, E.A.; Roskova, G.P. Phase Separation in Glass; Elsevier Science Publishers B.V.: Amsterdam, The Netherlands, 1984. [Google Scholar]
  27. Wu, F.; Wu, P.; Zhou, Y.; Chong, X.; Feng, J. The thermo-mechanical properties and ferroelastic phase transition of RENbO4 (RE = Y, La, Nd, Sm, Gd, Dy, Yb) ceramics. J. Am. Ceram. Soc. 2020, 103, 2727–2740. [Google Scholar] [CrossRef]
  28. Bondar, A.; Koroleva, L.N.; Toropov, N.A. Phase equilibriums in the yttrium sesquioxide-niobium pentoxide system. Izv. Akad. Nauk SSSR Neorg. Mater. 1969, 5, 1730–1733. [Google Scholar]
  29. Moore, R.L.; Haynes, B.S.; Montoya, A. Effect of the local atomic ordering on the stability of β-spodumene. Inorg. Chem. 2016, 55, 6426–6434. [Google Scholar] [CrossRef] [PubMed]
  30. Trunov, V.K.; Efremov, V.A.; Velikopodnyi, Y.A.; Averina, I.M. The structure of YNbO4 crystals at room temperature. Kristallografiya (Sov. Phys. Crystallogr.) 1981, 26, 67–71. (In Russian) [Google Scholar]
  31. McMillan, P. Structural studies of silicate glasses and melts—Applications and limitations of Raman spectroscopy. Am. Min. 1984, 69, 622–644. [Google Scholar]
  32. Huanxin, G.; Zhongcai, W.; Shizhuo, W. Properties and structure of niobosilicate glasses. J. Non-Cryst. Solids 1989, 112, 332–335. [Google Scholar] [CrossRef]
  33. Yashima, M.; Lee, J.-H.; Kakihana, M.; Yoshimura, M. Raman spectral characterization of existing phases in the Y2O3-Nb2O5 system. J. Phys. Chem. Solids 1997, 58, 1593–1597. [Google Scholar] [CrossRef]
  34. Alekseeva, I.; Dymshits, O.; Ermakov, V.; Zhilin, A.; Petrov, V.; Tsenter, M. Raman spectroscopy quantifying the composition of stuffed β-quartz derivative phases in lithium aluminosilicate glass-ceramics. J. Non-Cryst. Solids 2008, 354, 4932–4939. [Google Scholar] [CrossRef]
  35. Blasse, G. Vibrational spectra of yttrium niobate and tantalite. J. Solid State Chem. 1972, 7, 169–171. [Google Scholar] [CrossRef]
  36. Guene-Girard, S.; Courtois, J.; Dussauze, M.; Heintz, J.-M.; Fargues, A.; Roger, J.; Nalin, M.; Cardinal, T.; Jubera, V. Comparison of structural and spectroscopic properties of Ho3+-doped niobate compounds. Mater. Res. Bull. 2021, 143, 111451. [Google Scholar] [CrossRef]
  37. Sekulić, M.; Dramićanin, T.; Ćirić, A.; Đačanin Far, L.; Dramićanin, M.D.; Đorđević, V. Photoluminescence of the Eu3+-activated YxLu1−xNbO4 (x = 0, 0.25, 0.5, 0.75, 1) solid-solution phosphors. Crystals 2022, 12, 427. [Google Scholar] [CrossRef]
  38. Weyl, W.A. Coloured Glasses, 2nd ed.; Dawson’s of Pall Mall: London, UK, 1959; p. 558. [Google Scholar]
  39. Bamford, C.R. The application of ligand field theory to coloured glasses. Phys. Chem. Glasses 1962, 3, 189–202. [Google Scholar]
  40. Bogdanova, G.C.; Antonova, C.L.; Dzhurinskii, B.F. Distribution of coloring ions in the structure of glass-ceramics. Izv. Akad. Nauk SSSR Neorg. Mater. 1969, 5, 204–206, (in J. Am. Ceram. Soc. 1971, 54, 193d). [Google Scholar]
Figure 1. Images of samples of the initial and heat-treated glasses. The thickness of polished transparent samples is 1 mm. The values indicated in the figure denote heat-treatment schedules.
Ceramics 06 00092 g001
Figure 2. The DTA curve of the initial glass recorded in heating (red curve) and cooling (blue curve) modes. The heating and cooling rates are 30 °C/min. The values indicated in the figure denote the temperature, in °C.
Ceramics 06 00092 g002
Figure 3. XRD patterns of the initial and heat-treated glasses: (a) initial glass and glasses subjected to two-stage heat treatments at indicated temperatures, °C. The appropriate letters are used to indicate the primary peaks of the crystalline phases. (b) results of the phase analysis of the glass heat-treated at temperatures of 700 °C + 1350 °C using Rietveld method (Rwp = 8.35%). The inserts display the magnified Bragg angle ranges containing the most intense peaks of all crystalline phases for improved visibility. The pie plot represents the quantified phase composition (mass%), where blue corresponds to β-spodumene ss, orange to the M-phase, and light violet to the T-phase. The duration of each hold is 6 h. The diffraction patterns are shifted along the vertical axis for the convenience of observation.
Ceramics 06 00092 g003
Figure 4. In-situ PXRD patterns collected during (a) the heating of the initial glass and (b) the cooling of the fabricated glass-ceramic. The assigned peaks correspond to the following phases: T’—distorted, disordered tetragonal phase of YNbO4; T—high-temperature ordered tetragonal phase of YNbO4 with sheelite structure; M—M-fergusonite-like monoclinic phase of YNbO4; β-q(ss)—lithium aluminosilicate solid solution with β-quartz structure. The dashed lines show the lack of peaks shift of corundum from the sample holder. The diffraction patterns are shifted along the vertical axis for the convenience of observation.
Ceramics 06 00092 g004
Figure 5. Raman spectra of the initial and heat-treated glasses. The excitation wavelength is 514 nm. The values indicated in the figure denote heat-treatment temperatures and time, °C/h. The dashed lines show positions of the maxima, cm−1. The spectra are shifted for the convenience of observation.
Ceramics 06 00092 g005
Figure 6. Small angle X-ray scattering of the initial and heat-treated glasses. The values indicated in the figure denote heat-treatment temperatures and time, °C/h. The dashed line shows the position of the maximum.
Ceramics 06 00092 g006
Figure 7. SEM images of the samples of (a) the initial glass, (bd) heat-treated at (b) 700 °C + 850 °C, (c) 700 °C + 1000 °C, and (d) 700 °C + 1350 °C. The duration of each hold is 6 h. (e) Particle size distributions calculated from SEM data. The values presented in the figure (e) denote heat-treatment temperatures and time (°C/h).
Ceramics 06 00092 g007
Figure 8. SEM-EDX analysis of the etched surface of the glass-ceramic prepared by the heat-treatment at 700 °C + 1350 °C. The duration of each hold is 6 h: (a) SEM image; (b) EDX spectrum, point 1; (c) EDX spectrum, point 2. The points 1 and 2 are shown in Figure 8a by the corresponding numbers. The numbers and plus sign in Figure 8a show the places from which the EDX spectra were recorded.
Ceramics 06 00092 g008
Figure 9. Absorption spectra of the initial and heat-treated glasses. The values presented in the figure denote heat-treatment temperatures and time (°C/h). The samples thickness is ~1 mm. The spectral range marked with the dotted line shows the steps due to the change in detectors.
Ceramics 06 00092 g009
Table 1. Characteristics of crystalline phases of yttrium niobate and β-quartz ss in LAS glass-ceramics prepared by different heat-treatments.
Heat-Treatment
Schedule, °C/h
Yttrium Niobateβ-Quartz ss
Crystal Size, nmLattice Parameters, ÅCrystal Size, nm
a, ±0.003 c, ±0.003
Initial glass11.0 ± 0.35.12011.03-
700/610.0 ± 0.35.12111.08 -
700/6 + 750/610.5 ± 0.35.12811.06-
700/6 + 800/610.0 ± 0.35.12011.0346.0 ± 1.5
700/6 + 900/612.0 ± 0.35.15711.0442.0 ± 1.0
700/6 + 1000/615.5 ± 0.45.15811.0140.5 ± 1.0
Table 2. Compositions of the points 1 and 2 on the etched surface of the glass-ceramic prepared by the heat-treatment at 700 °C + 1350 °C (see Figure 8a).
Spectrum MarkOAlSiYNbTotal
% Atom
165.3311.362.728.6411.95100.00
263.3119.396.055.995.26100.00
Table 3. The CTE values of the initials and the heat-treated glass.
Heat-Treatment Schedule, °CGlass700700 + 750700 + 800700 + 850700 + 900700 + 1000700 + 1350
CTE, ±1.0, ×10−7 K−161.560.561.512.08.511.513.527.0
Disclaimer/Publisher’s Note: The statements, opinions and data contained in all publications are solely those of the individual author(s) and contributor(s) and not of MDPI and/or the editor(s). MDPI and/or the editor(s) disclaim responsibility for any injury to people or property resulting from any ideas, methods, instructions or products referred to in the content.

