1. Introduction
Suspension Plasma Spray (SPS) and Atmospheric Plasma Spray (APS) coatings represent a challenging field of research, both for academic interest and commercial applications. In the aerospace environment, coatings are widely applied, and a typical application is Thermal Barrier Coating (TBC) for underneath metallic layers. Improvement to TBCs allows gas turbines to operate at higher temperatures, so the thermal conductivity of the coating dictates the temperature drop across the thermal barrier [
1].
The increased coating requirements, such as low thermal conductivity and high level of thermal cycling resistance, can be reached using the new SPS technology; SPS can generate columnar microstructures typical of Electron-Beam Physical Vapor Deposition (EB-PVD) TBC, but at a much lower investment cost [
2,
3]. In more detail, SPS coating combines the advantages of APS and EB-PVD systems: its structure is columnar like EB-PVD, with columns, and its characteristics in terms of uniformity and density provide a higher thermal resistance compared to EB-PVDs.
From the technological point of view, SPS coatings may be produced with micro and nano scale features by using ultrafine particle feedstock (less than 5 microns). To facilitate the use of these ultrafine powders, the particles are suspended in solution, providing them with enough momentum to carry them into the plasma gun and make a coating on the target surface. Suspension feedstocks can cover a range of material compositions, including ceramics and metal alloy blends. Since the powder feedstocks used are ultrafine, the resulting coatings have a wider range of columnar structures.
SPS is a process that enables the use of thermal spray feedstocks too small for conventional plasma spray processes. These feedstocks come in the form of a slurry, with micron and submicron sized particles suspended in water, alcohol, or other solvents. Generally, the concentration of the fine particles in the slurry can be controlled and ranges between 5–80% by weight. This allows for the best combination of coating microstructure and deposition rate to be achieved.
During the SPS process, the thermal spray slurry is pumped to the outlet of the thermal spray torch and injected into the thermal spray jet. Once entrained in the plasma, the droplets fragment and the liquid phase evaporates, leaving ultrafine particles accelerating towards the substrate. By using these ultrafine particles sizes, it is possible to generate uniform coatings as thin as 25 microns thick. Practically, SPS combines the versatility and rapid deposition rate of APS with the ability to produce advanced microstructures from submicron and nanoscale powders. At the same time, it maintains excellent resistance to thermal shock, typical of coatings with a columnar structure.
Therefore, SPS succeeds in satisfying both fundamental requirements of the main aero-engine manufacturers: increasing turbine inlet temperature (TIT), with consequent increase in performance and efficiency, and ensuring resistance to thermal variations due to in-flight maneuvers.
In support of this 4th generation coating, material selection plays a key role, both for the bond coat and the TBC.
In general, preparation methods for coatings and corresponding key process parameters substantially influence their performance. In this context, the characterization of thermal diffusivity and conductivity properties is critical for process and material selection.
Over the years, many experimental techniques, such as optical microscopy, scanning electron microscopy (SEM), field emission scanning electron microscopy (FE-SEM), and X-ray diffraction, were used to measure physical characteristics in TBCs and their microstructure. An example of the screening of experimental variables leading to formation of a columnar microstructure in suspension plasma sprayed zirconia coatings is widely described in [
4]. In that case, the thermal diffusivity of coatings was characterized with the use of NDT methods (IR thermography, flash method) and thermal conductivities of coatings were then determined. Recently, a novel approach was presented to characterize microstructural features as porosity of atmospheric-plasma-sprayed (APS) thermal barrier coatings using terahertz spectroscopy [
5].
Anyhow, characterization of thermal diffusivity and conductivity in TBCs, already in the design phase, plays an important role in the performance definition.
Available and commercialized methods to measure the thermal conductivity can be classified [
6] into steady-state conditions methods (guarded hot plate, heat flowmeter) and transient conditions methods (transient plane source, transient hot wire, laser flash apparatus, modulated DSC, 3ω method, thermocouple method).
Steady state methods may directly measure the thermal conductivity, based on Fourier’s law, while in transient methods, the thermal diffusivity is firstly needed to calculate the thermal conductivity if both specific heat and density are known.
An example of the transient method is the so-called flash method (or flash diffusivity technique [
7]), widely used to verify the design parameters of TBCs and to assess both in-plane and in cross-plane the thermal diffusivities of the top coats in the blades of gas turbines, pointing out the anisotropy of thermal conduction [
8]. Flash-pulse thermography was recently introduced for quantitative inspection of the thickness of thermally sprayed coatings [
9] and for porosity verification [
10].
Pulsed active thermography in reflection configuration was applied in [
11] to monitor the thermal diffusivity variation due to ageing of ceramic thermal barrier coatings and to detect the presence of cracks at the interface of Atmospheric Plasma Spray (APS) TBCs [
12]. Thermography, in passive configuration, was also used to analyze the delamination crack growth in a thermal barrier coating [
13].
During the last decade, thermal characterization of coatings was classically performed by the laser-flash method and following the procedure described in detail in a dedicated ASTM E1461-13 Standard [
14] and in Standards [
15,
16,
17]. Tests for thermal characterization were usually carried on by dedicated equipment, well described in [
14,
15,
16,
17]. Standards [
14,
15,
16,
17] provide both technical requirements for experimental set up and measurements and multi-layer analytical models for the calculation of thermal diffusivities.
In a very recent paper [
18], the thermal diffusivity of coatings was measured by the dedicated laser-flash apparatus described in ASTM E1461-13 Standard [
14], and calculated by an analytical two layers model. That model was applied for the determination of the thermal diffusivity of individual layers by separating its contribution from the one of the overall sample [
18].
Active thermographic techniques were developed to characterize mechanical and thermal properties of components with coatings, regardless of the approaches involved in Standards [
14,
15,
16,
17]. In more detail, a thermal excitation was applied to the sample by laser sources or flash lamps and then the corresponding thermal response was detected by an infrared thermal camera. As an example, pulsed and lock-in infrared thermography, both in reflection mode and by using flash lamps, were used in [
19] to characterize the variation in thickness of a topcoat.
The aim of this paper is to define and set up an experimental procedure, based on active thermography, for the characterization of coatings for industrial applications.
This procedure is intended to be a fast and reliable method, alternative to the consolidated one described in International Standards [
14,
15,
16,
17]. In more detail, a classical active thermographic set up, and not a dedicated apparatus, was used for that aim, and data processing techniques referred to the analytical approach described in Standards.
The active thermography procedure provided the measurement of the surface temperature of specimens undergoing a thermal excitation, applied by means of a laser pulse (Pulsed Technique).
Temperature data processing, according to and adapting the Standard procedures [
15,
16,
17], allowed to obtain thermal conductivity and diffusivity information.
In particular, two coating processes (Atmospheric and Suspension Plasma Spray) applied to the same base material, Inconel 601, and the same coating material were investigated.
These results were compared in terms of thermal properties (both for base and coated materials) with those available in the literature.
2. Active Thermography Approach for Thermal Characterization of Coatings and Experimental Setup
Standards [
15,
16,
17] are intended to provide methodologies for the thermal characterization of materials. In particular, these Standards describe the fundamental procedures based on the laser flash method (testing apparatus and formulas) for determining the thermal diffusivity of thermal barrier coatings [
15], of monolithic ceramics [
17] and plastics [
16]. Thermal conductivity may be obtained from thermal diffusivity values by its physical equation.
The typical apparatus for measuring thermal diffusivity, according to the flash method, is well described in [
15,
17] and mainly consists of a specimen holder, a flash source (laser) to generate a temperature rise on one of the two major surfaces of the specimen, and a transient IR detector with its associated electronics. The detector acquires the thermal heating profile of the surface opposite to that heated by the laser flash. This setup is the so called “transmission configuration” and it allows to record the thermal heating behavior due to the energy transmitted through the sample, which will be affected by the proper thermal properties. In the case of multilayer materials, as thermal barrier coatings, the heated surface is the base material while the detected surface is the coated one. Standards [
15,
16,
17] describe shape, dimensions, and thicknesses of samples to be tested.
More in detail, Standard [
17] describes the procedure to compute the thermal property of fine and advanced ceramic materials. The so-called half rise time method is proposed to compute the thermal diffusivity of the material. In [
15], a multi-layer analytical model is provided for determining thermal diffusivities. In particular, the areal heat diffusion time method allows to compute the apparent thermal diffusivity of the sample and the real thermal diffusivity and thermal conductivity of each layer. For both Standards [
15,
17], appropriate corrections are proposed to obtain the real thermal properties of the analyzed material.
The Active Thermography technique (AT) presented in this paper aims to substitute the consolidated equipment described in International Standards [
15,
16,
17], but based on the same theoretical approach.
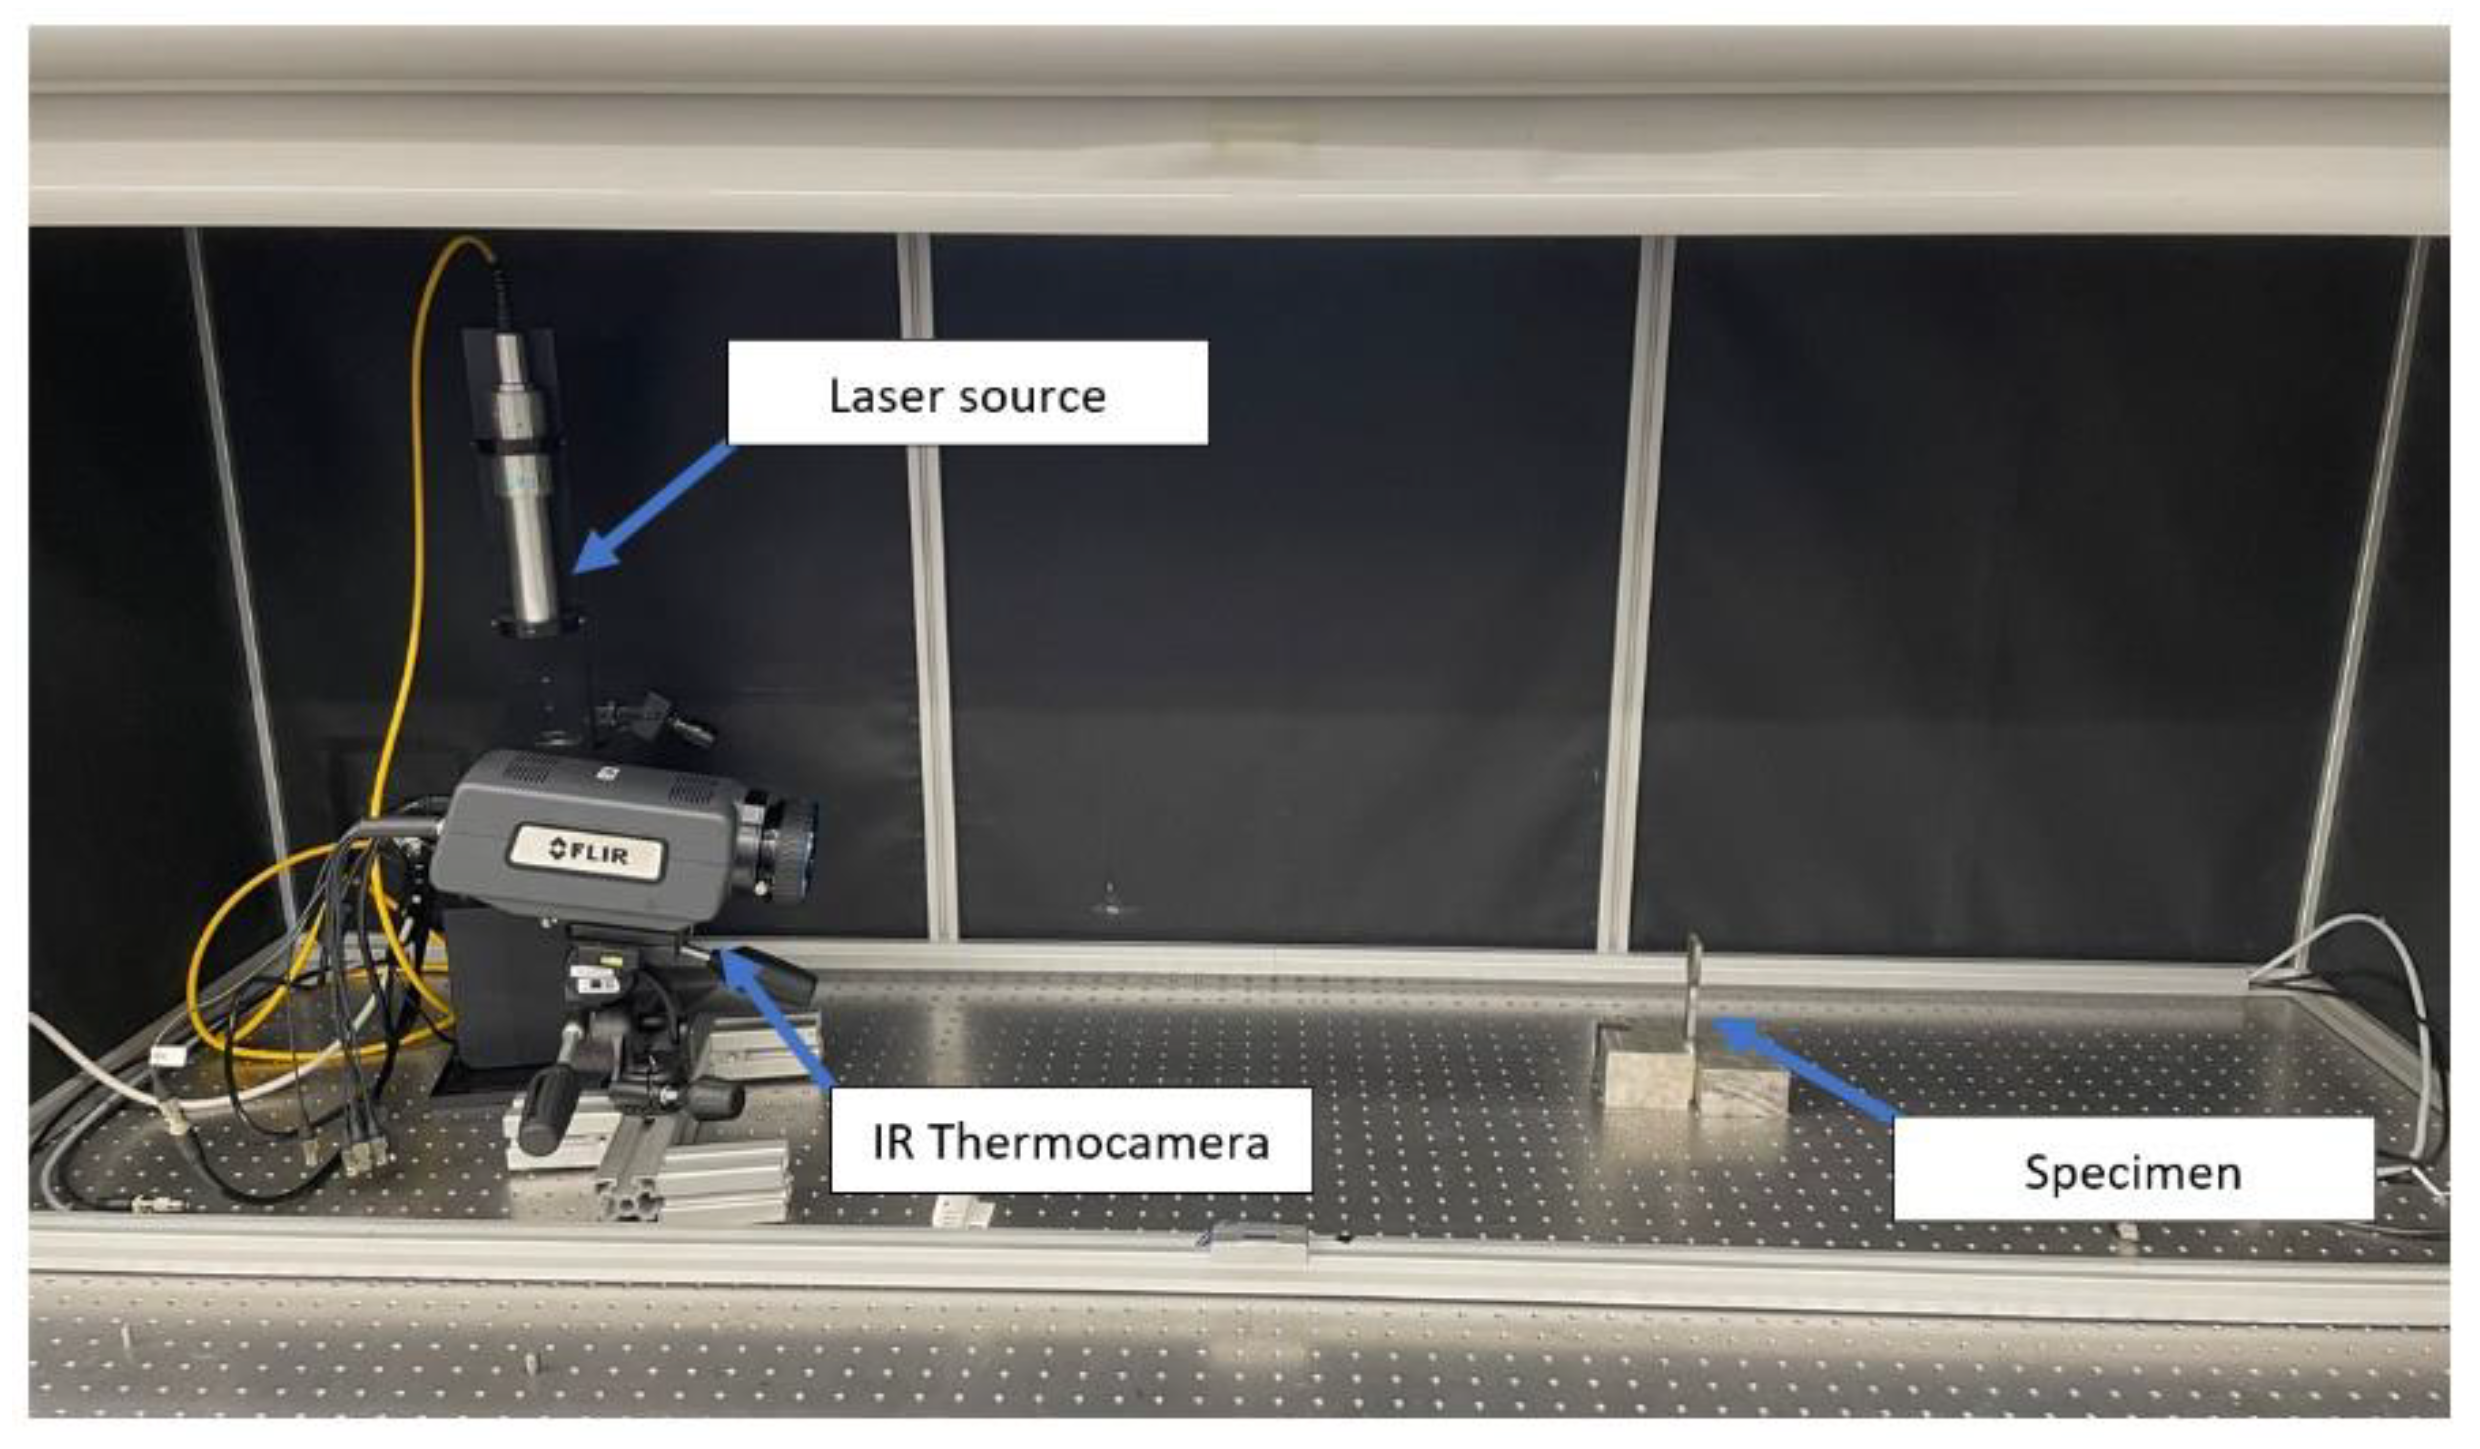
This AT technique provides the measurement of the samples’ surface temperature undergoing an external thermal excitation, applied by means of a laser pulse (Pulsed Technique). In more detail, the external thermal excitation is a laser beam, able to give a higher quantity of energy in a small application surface (maximum power 50 W) and the response thermal sensor is an IR thermal camera FLIR A6751sc (Wilsonville, OR, USA) (sensitivity lower than 20 mK and 3–5 µm spectral range) (see
Figure 1). Temperature data processing, according to and adapting the Standard procedures and analytical models [
15,
17], allows thermal diffusivity and conductivity information.
Shape and dimensions of specimens, thickness values of base material and coating are chosen following Standard indication [
15]. As a matter of fact, coating thermal diffusivity and thermal conductivity can be obtained by referring to the substrate material. This means that, for experimental characterization, the base material sample is always necessary, as well as the coated sample.
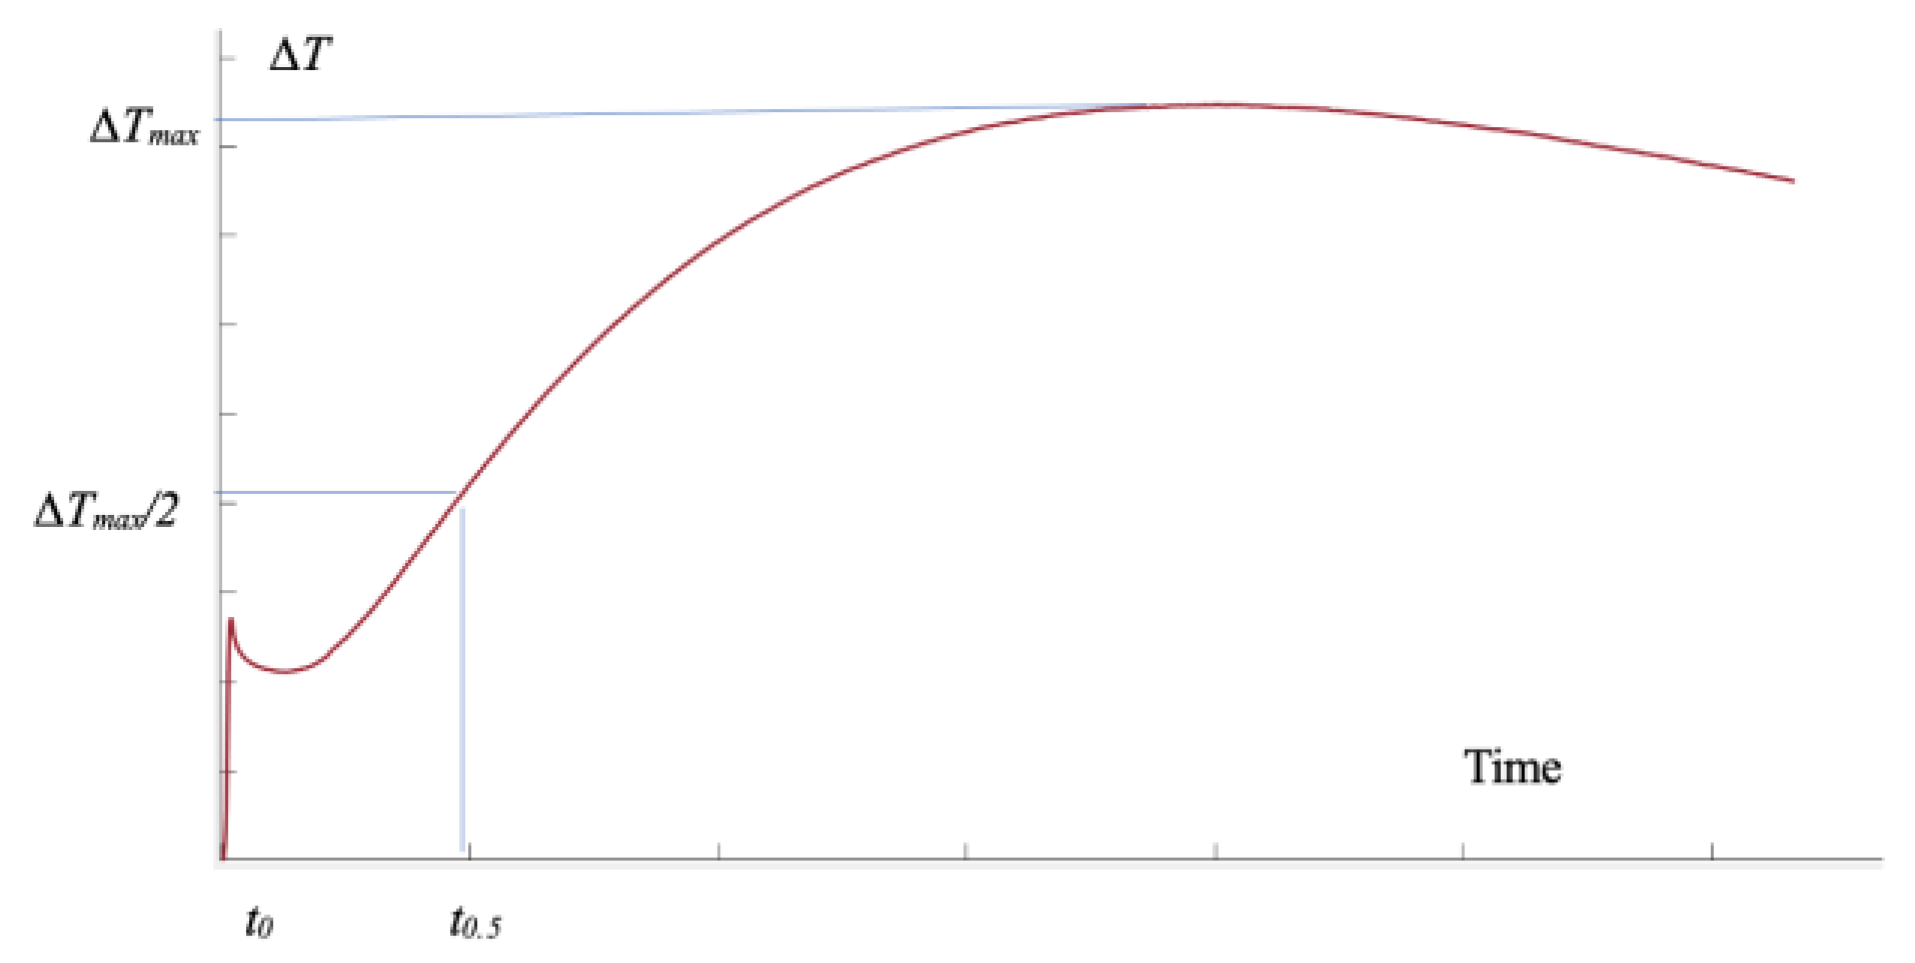
The calculation of the coating thermal diffusivity is based on the temperature-rise of the base material (see
Figure 2) by using the half-rise time method described in [
17] for monolayer materials and the areal heat diffusion time method, specific for metallic and other inorganic coatings [
15].
In more detail, for monolayer materials, the thermal diffusivity α [m
2/s] may be obtained by the following equation, based on the half-rise time method:
where
t0.5 is the time delay when the temperature of the rear face reaches one-half of the maximum temperature rise, Δ
Tmax, after the front face was heated by the laser pulse (see
Figure 2) and d is the sample thickness.
In order for the rise-time to be validly applied, both duration of the laser pulse and sampling time have to be less than 1% of the time delay
t0.5 (first condition [
17]).
Furthermore, the data acquisition unit requires a sampling time faster than 1% of the half rise-time (second condition [
17]).
The calculation of thermal diffusivity using Equation (1) may be modified if the duration time of the heating laser pulse does not respect initial and boundary conditions, as indicated in [
17] by several correction methods (Centroid method, determination of chronological centroid of laser pulse and Triangular pulse approximation). In the present work, the Centroid method was applied to satisfy the laser square pulse condition.
In the same Standard [
17], some correction factors may be introduced if radiative heat losses cannot be neglected. In particular, Standard [
17] proposes Cape and Lehman’s equation [
20], Clark and Taylor’s method [
21], the Takahashi method [
22], and Cowan method [
23]. The Cowan method was chosen here, due to its effect on the stabilization zone of the thermal profile.
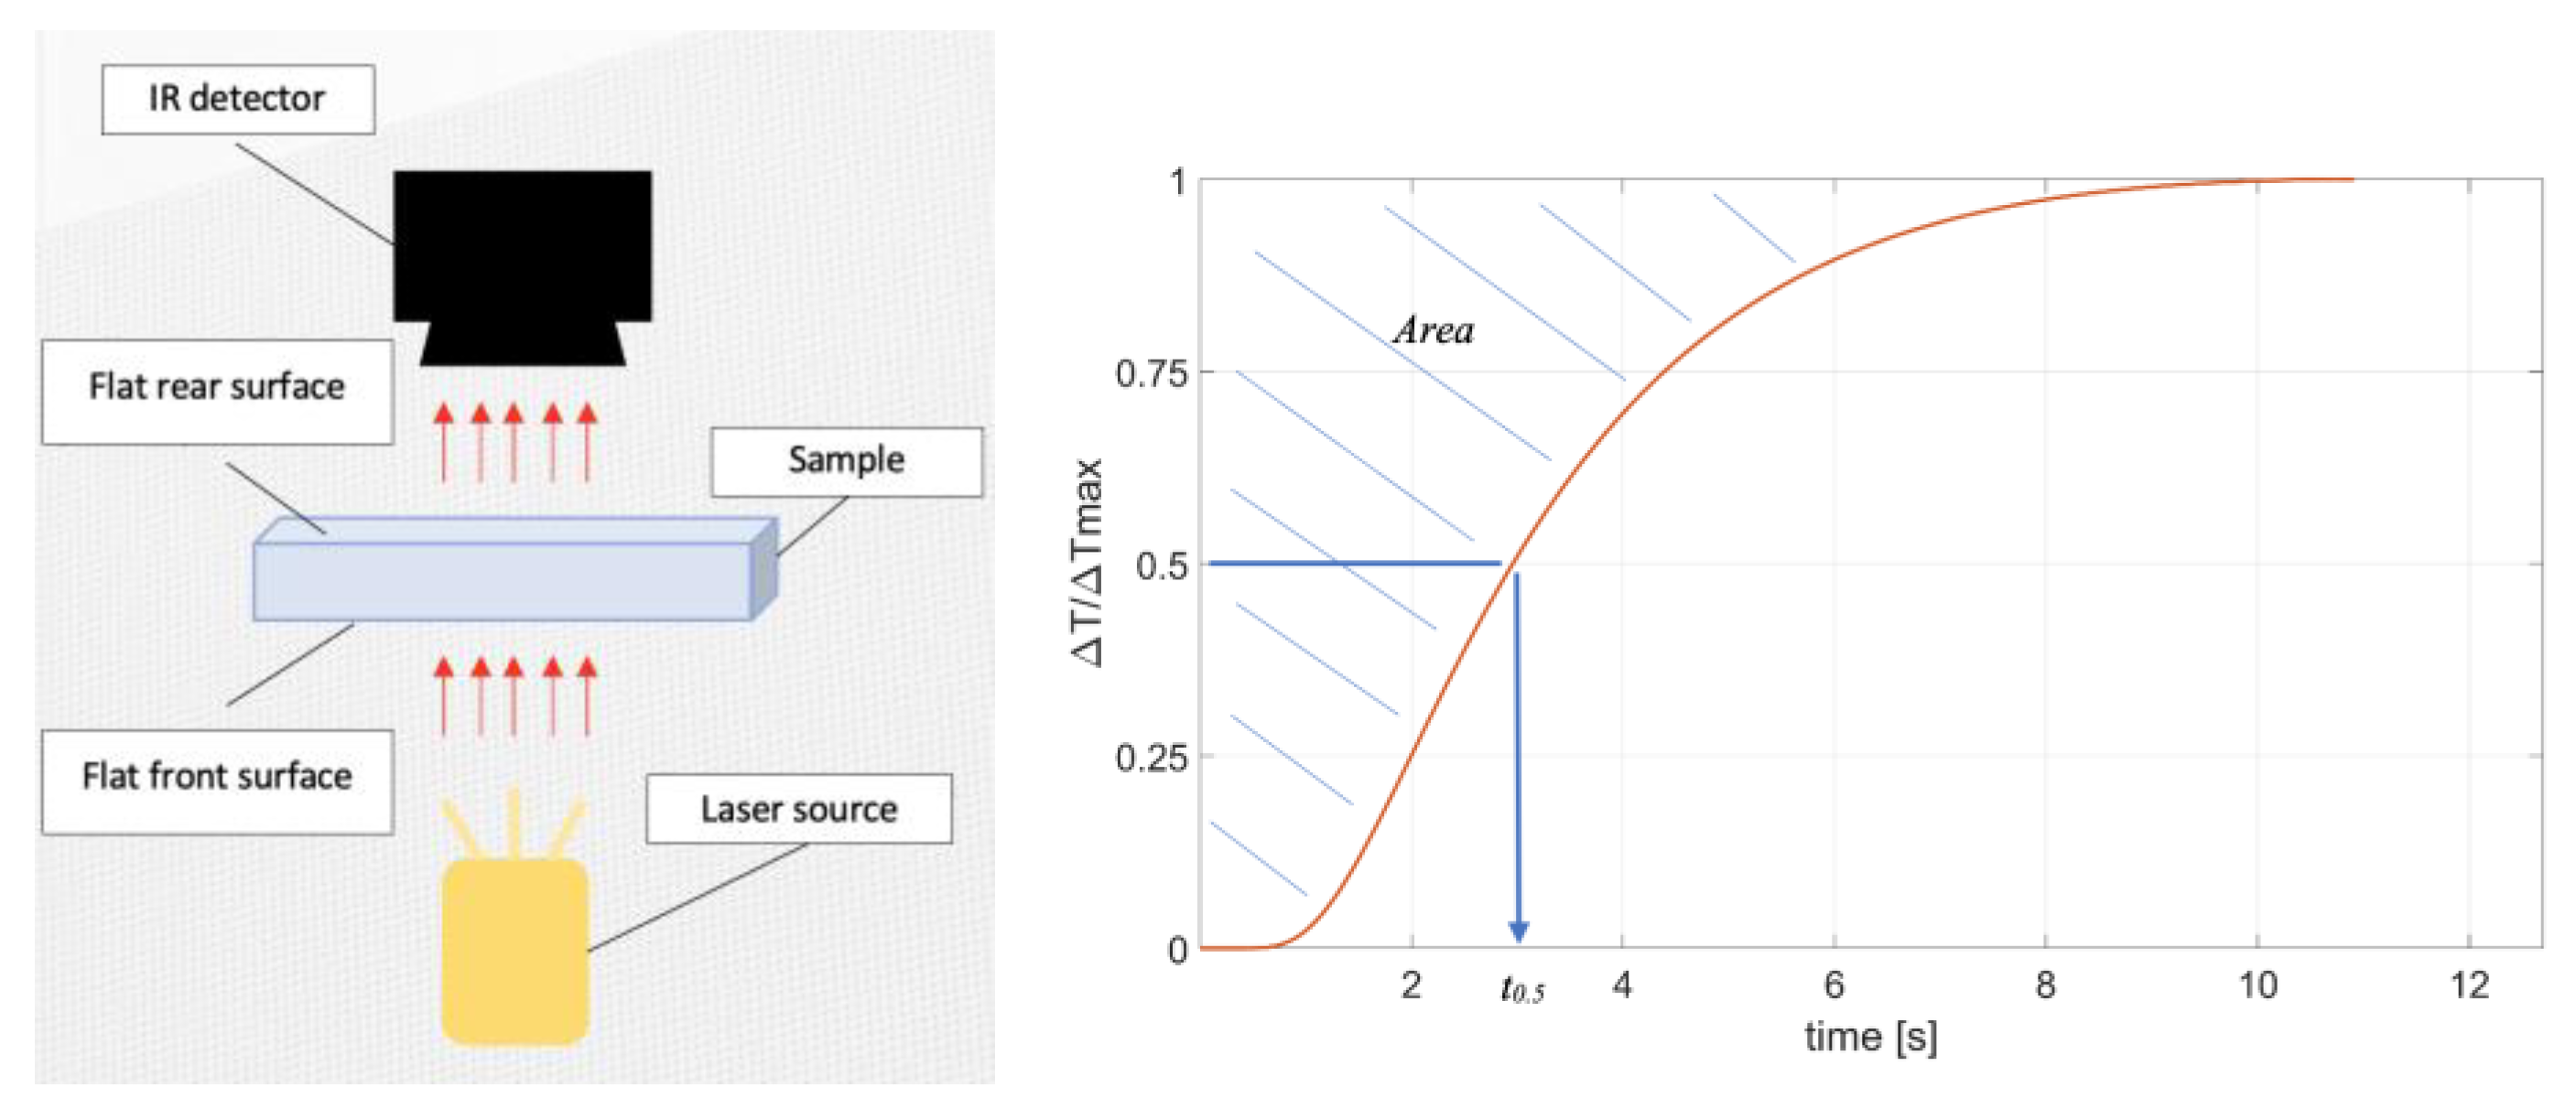
A specific approach for metallic and other inorganic coatings is described in Standard [
15]. In particular, the areal heat diffusion time method provides both thermal diffusivity of each layer
αi (and therefore of the substrate too) and apparent thermal diffusivity of the multilayer sample αapp (substrate and coatings). The method refers to the areal heat diffusion time represented in
Figure 3 and to the analytical multi-layer model shown in
Figure 4, both reported in [
15].
The thermal diffusivity of a single layer belonging to a multi-layered system is computed as follows:
where
di is the thickness of the layer and the heat diffusion time
τi is evaluated with a specific formulation for each layer of the specimen.
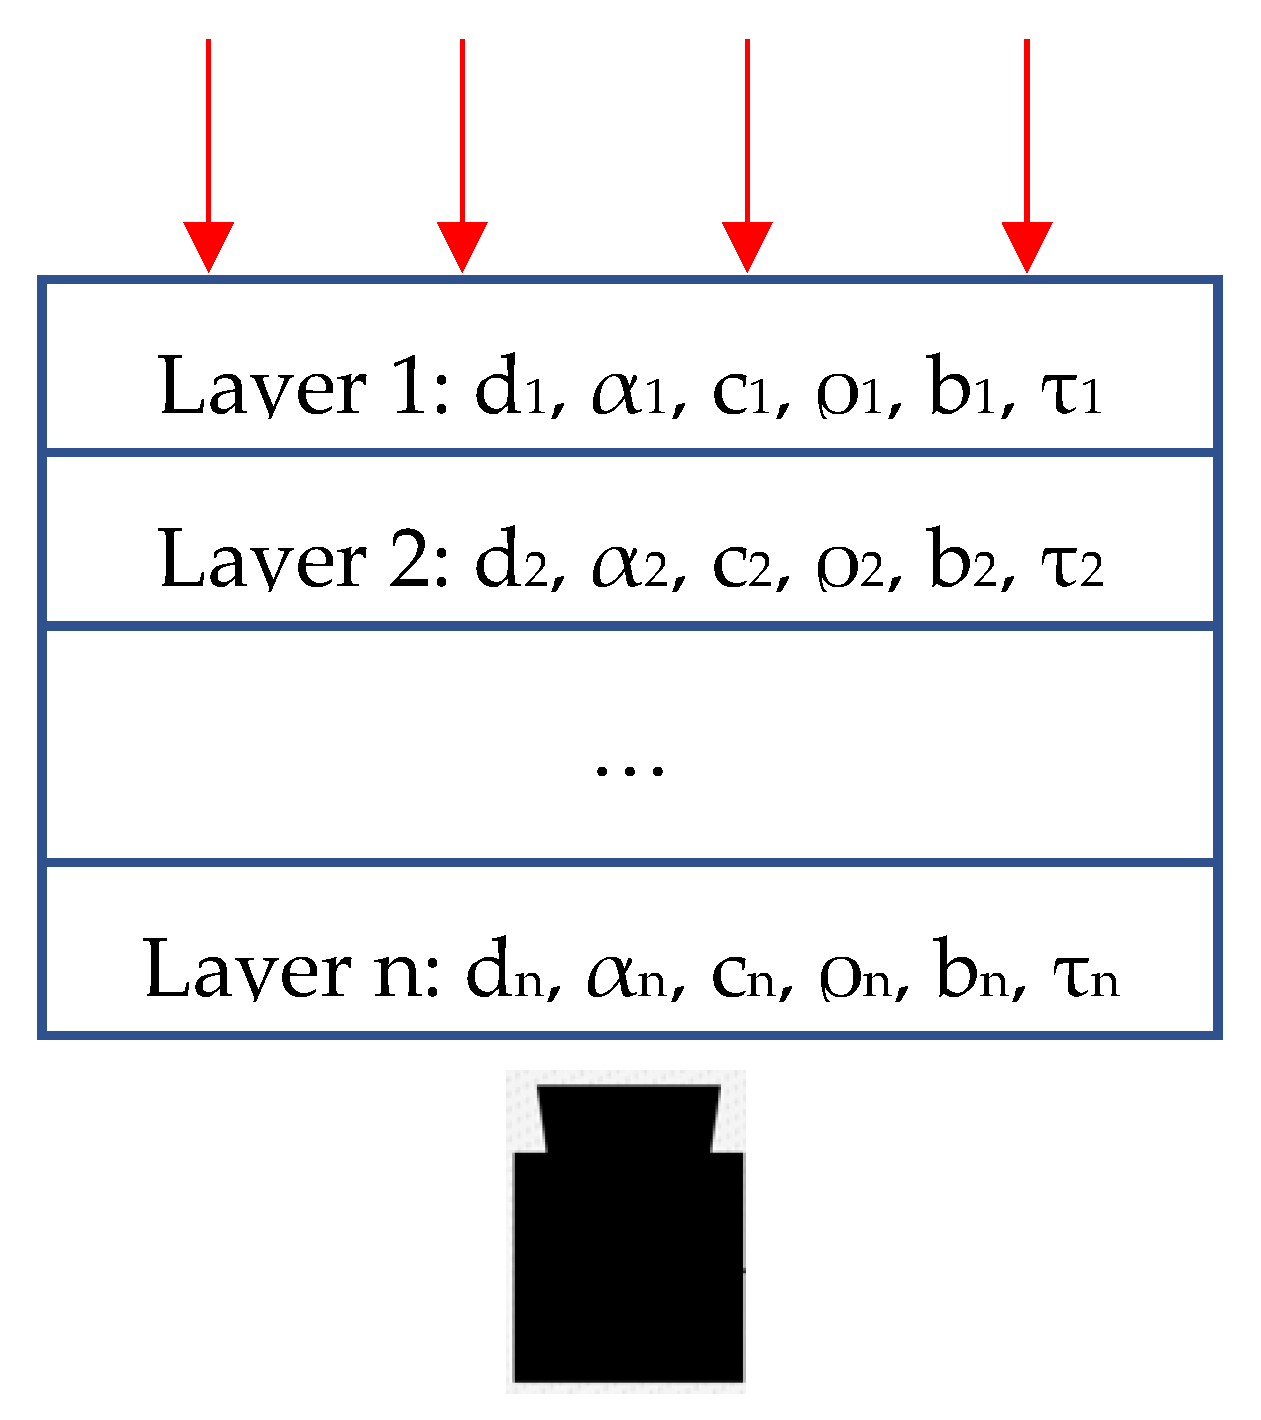
Physical parameters required to compute the heat diffusion time of each layer (
τ1,
τ2,…,
τn) are illustrated in
Figure 4 [
15].
In Standard [
15], the analytical formulations for calculating the heat diffusion time of both layer 1 (
τ1) (the substrate) and layer 2 (
τ2) (the coating) are described.
In particular,
τ1 is defined as:
where
A1-S is the area (see
Figure 3) obtained from the temperature profile generated with the base material specimen,
τ2 is evaluated as:
and
A2-S (see
Figure 3) is the area obtained from the temperature profile generated with the two-layer specimen (base material and coating).
Standard [
15] also suggests a specific formulation for the evaluation of the apparent thermal diffusivity of a multilayer specimen:
where
ds and
dc are, respectively, substrate and coating thicknesses.
Equation (5) represents an alternative formulation with respect to Equation (1) to evaluate the apparent thermal diffusivity.
Finally, the thermal conductivity can be obtained from the thermal diffusivity α
app values by the following relationship:
where
ρ and
c are, respectively, density and heat capacity of the material useful for the purpose.
3. Materials, Samples, and Testing Procedure
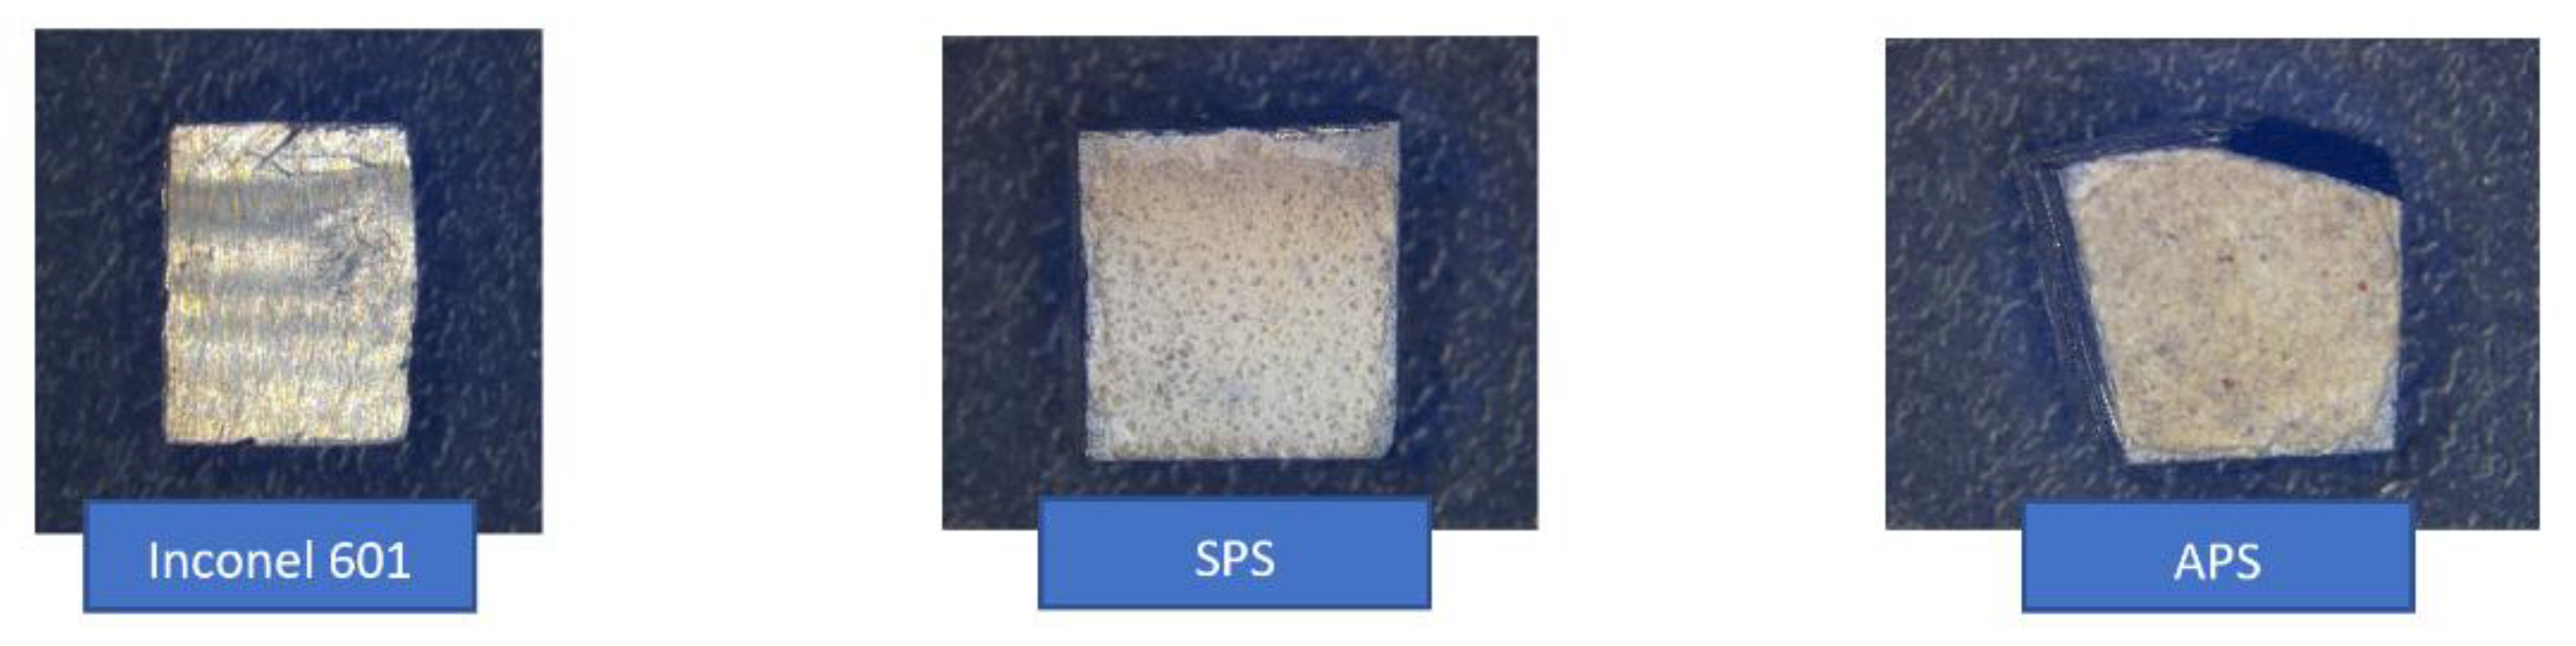
Samples adopted for this study were made of two materials. Inconel 601 was the substrate material, Yttria-Stabilized Zirconia (YSZ) based powder was selected for the ceramic coating. Two types of deposition process were utilized, respectively, APS and SPS.
Figure 5 shows the samples adopted for measurements. Samples were prepared with the aim to respect the geometrical characteristics requested in Standards and to create uniform heating on the surface sample. Substrate geometry was a flat sample with 2 mm thickness and 5 × 5 mm square surface. Three specimens per samples were tested and at least three replications for each measurement were performed.
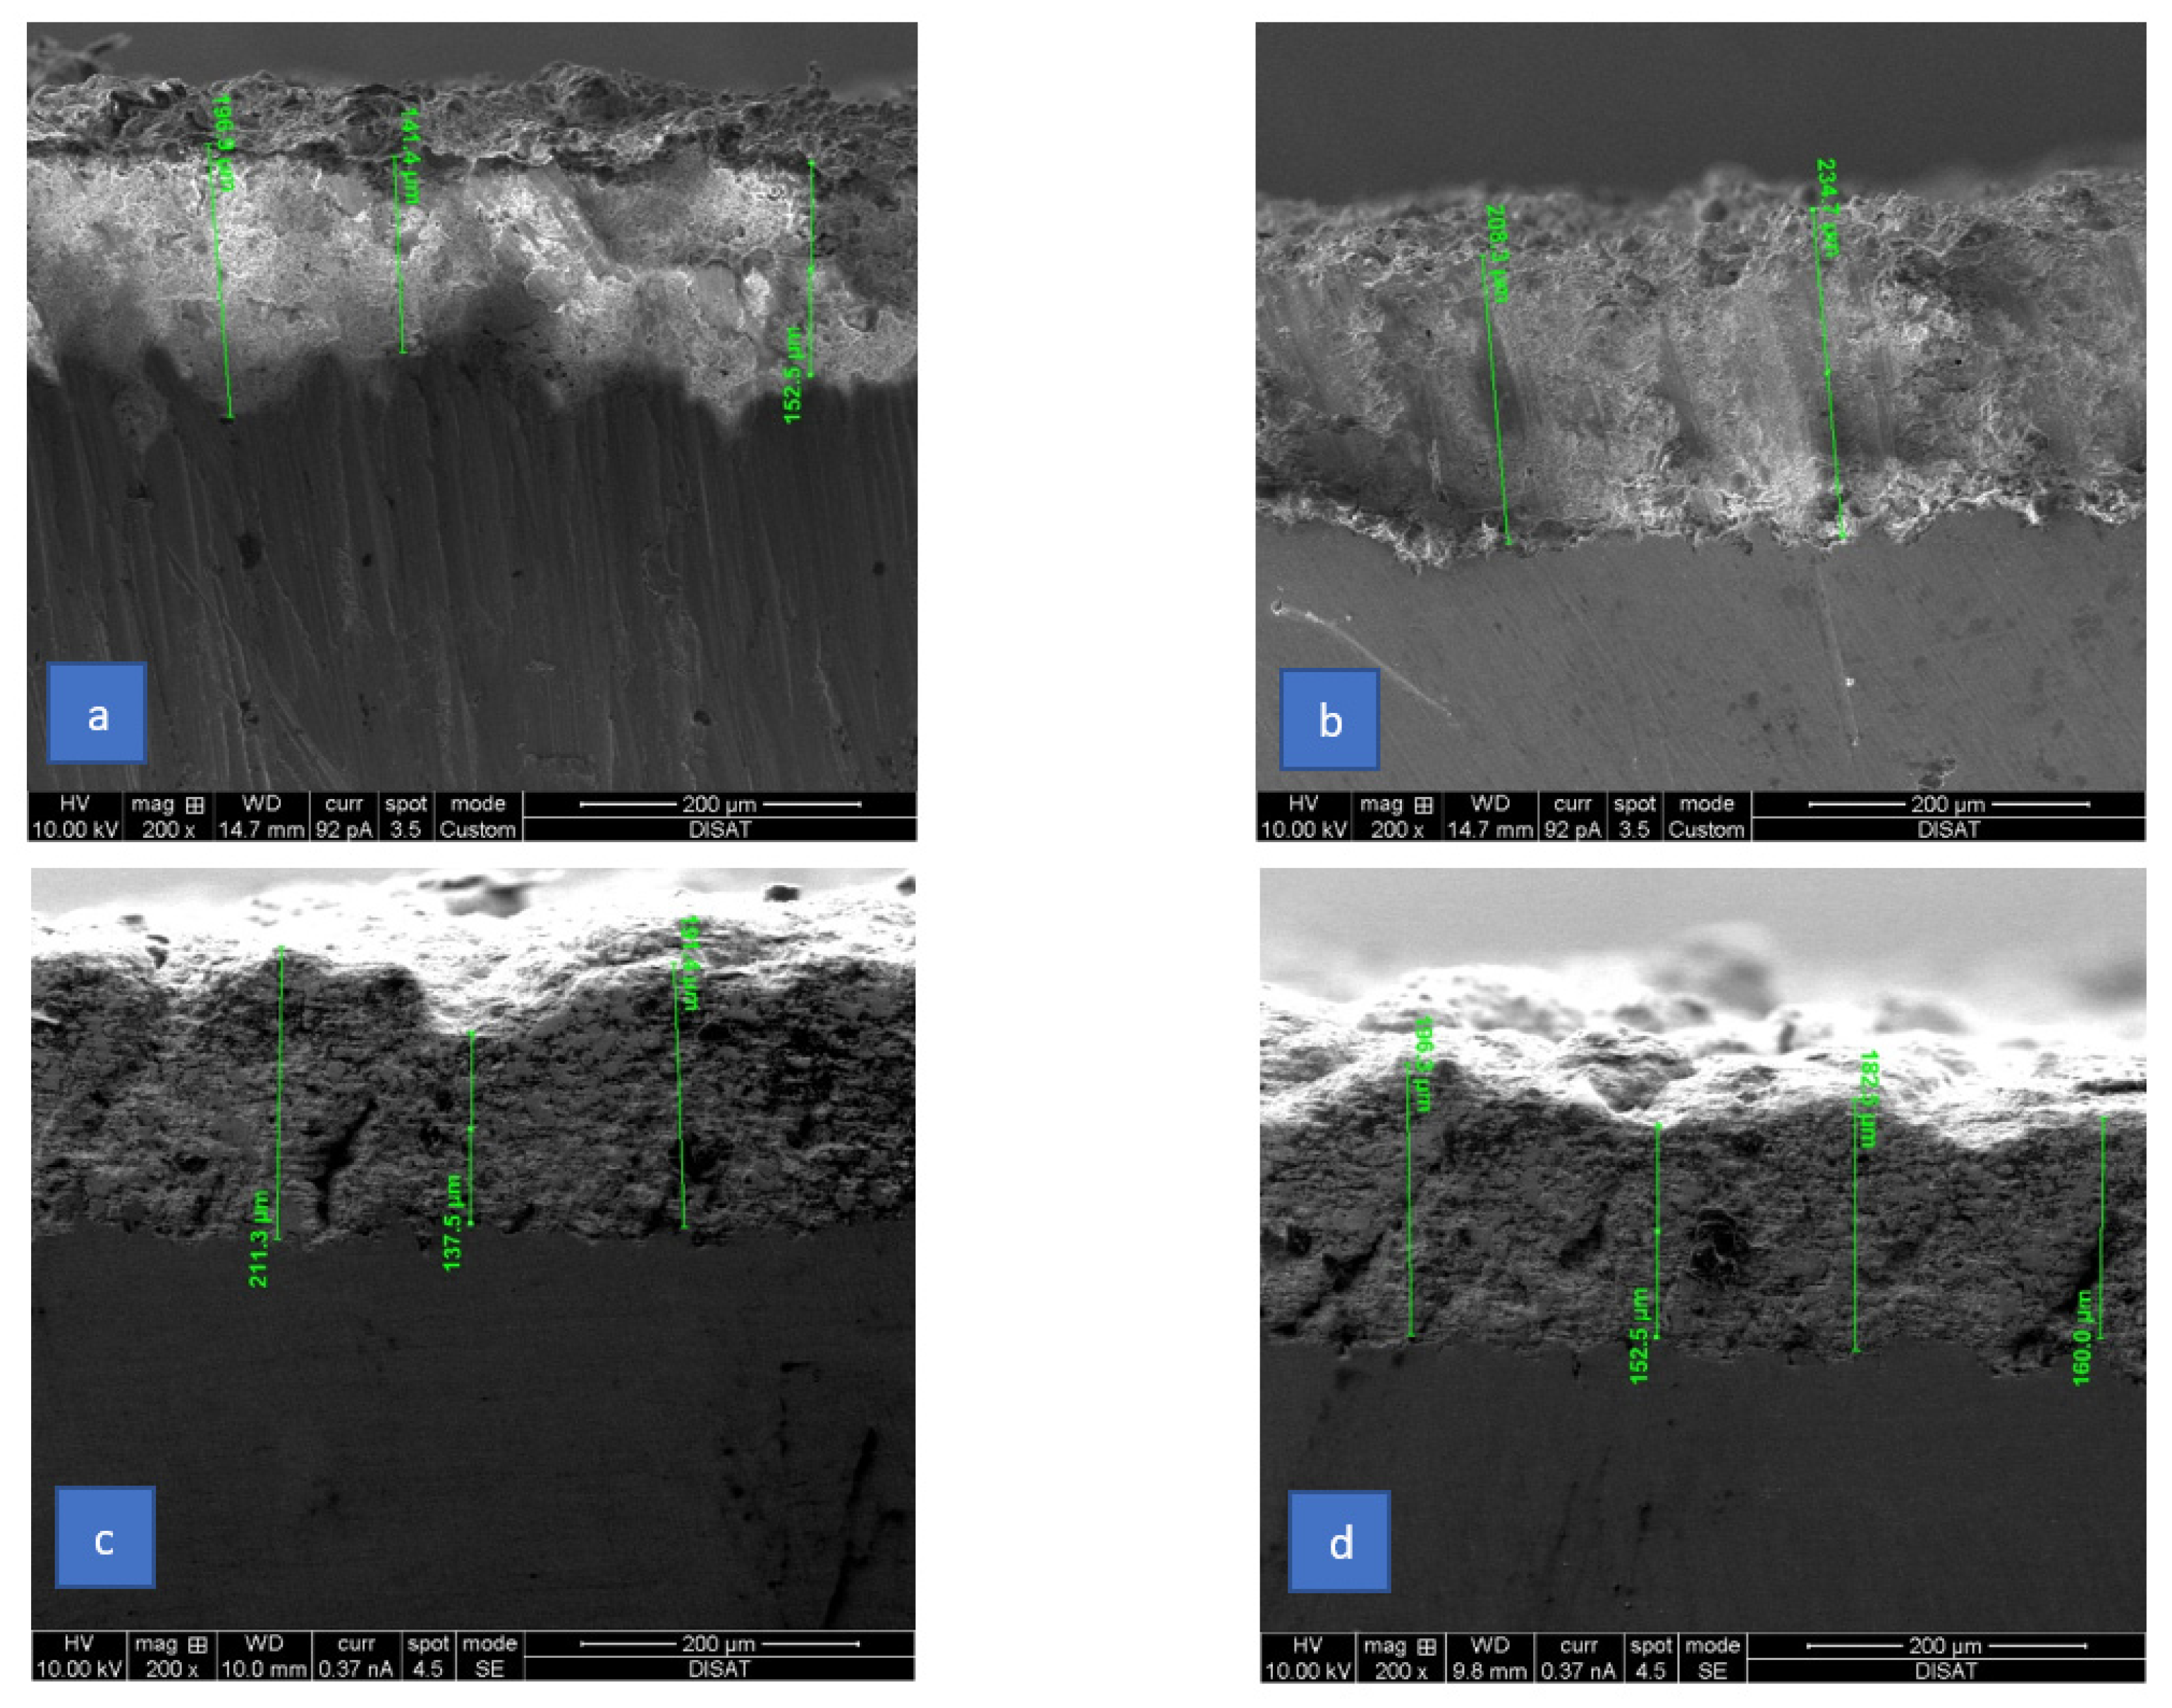
A SEM analysis was performed to evaluate both structure and thickness of coatings, generated by APS and SPS deposition processes. Thickness values were necessary to calibrate experimental set up parameters.
Figure 6 shows SEM images of APS and SPS specimens, emphasizing both stiffnesses of Inconel 601 and coatings and the structure of coatings. SEM images refer to different zones of the same specimen (1 and 2 for APS, 3 and 4 for SPS).
Physical characteristics values (density
ρ and specific heat
c) adopted for the estimation of thermal conductivity may be found in [
24] for substrate (Inconel 601) and in [
25] for coatings (see
Table 1). Inconel 601 data are useful to check this procedure.
A dedicated experimental configuration and apparatus were setup to carry out the experimental tests following the procedure described in [
15,
17], but by means of different equipment, as was stated in the previous sections. The experimental equipment was composed by a thermal camera, a laser excitation source, and a PC control unit.
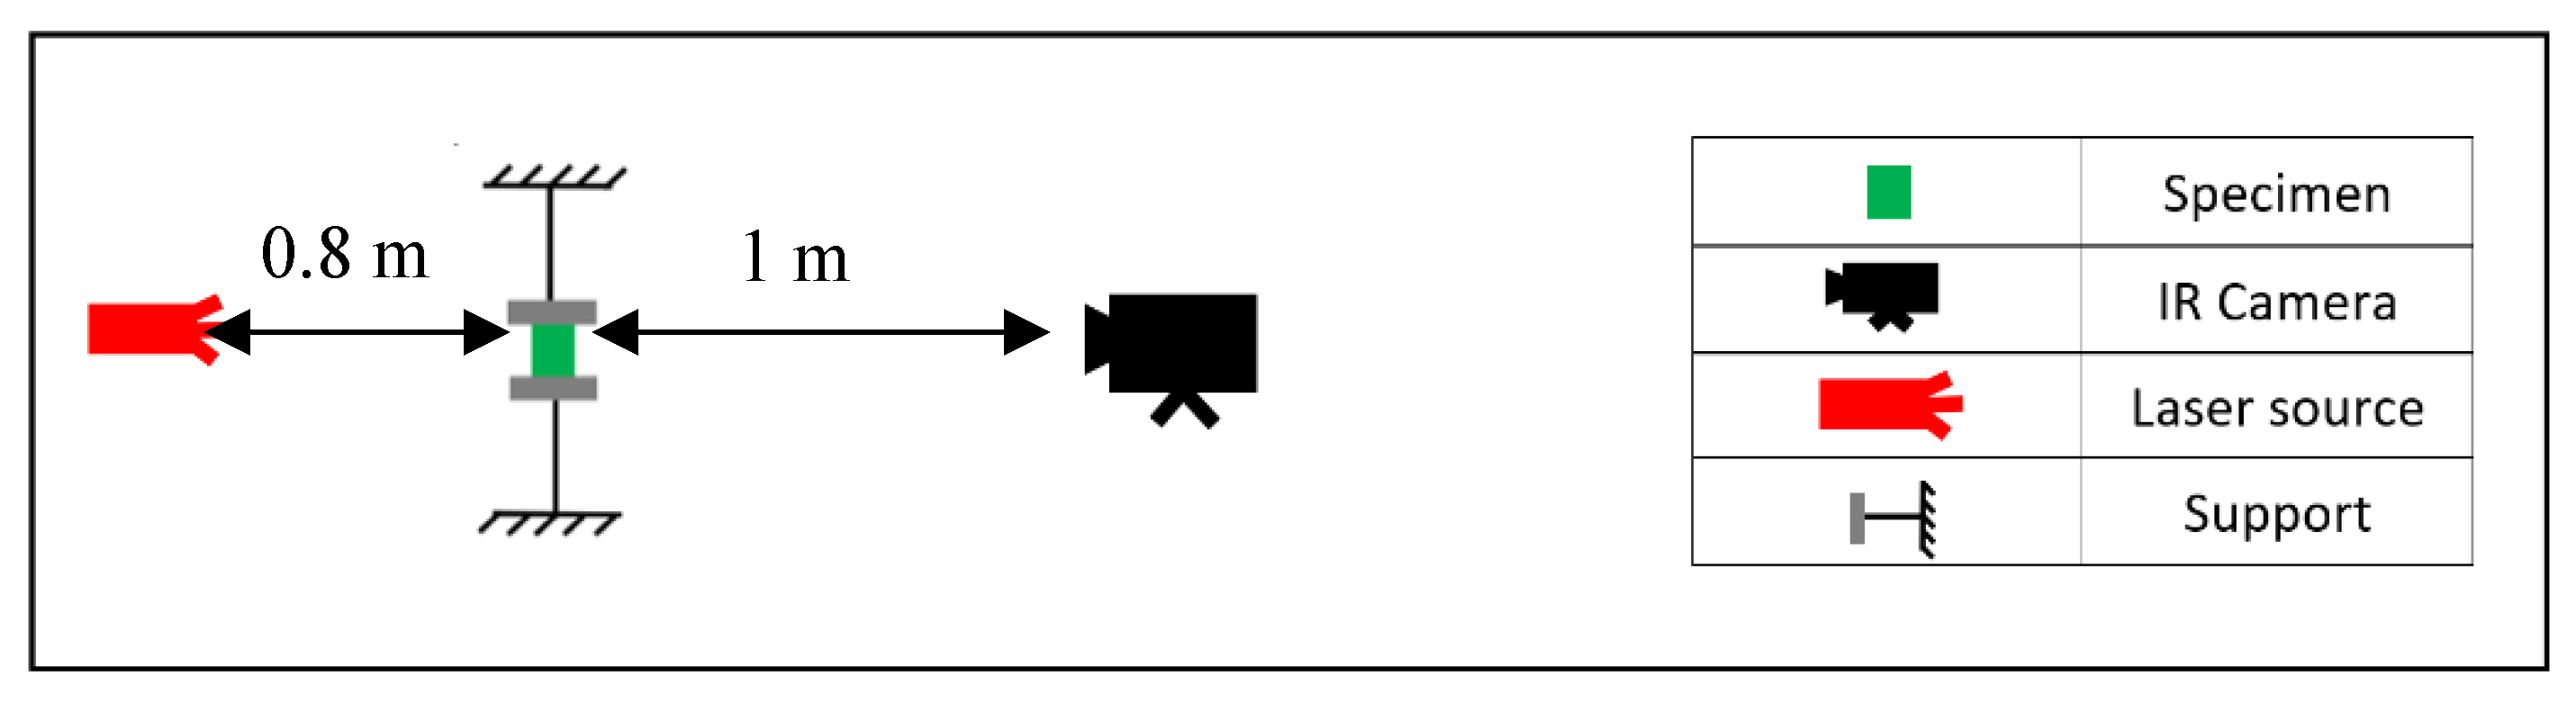
A transmission-mode configuration was utilized, where samples were positioned between the laser source and thermal camera. Distances between the thermal camera and sample and between the laser source and sample were 0.8 m and about 0.1 m, respectively. Samples were clamped in a device with two polymeric supports to reduce the possible heat transmission.
Figure 7 shows the schematic experimental configuration.
Laser excitation and acquisition parameters (frame rate) were tuned both for the substrate and coatings. The substrate material (Inconel 601) was heated with a pulse period of 50 ms at the maximum power, while coated samples were heated with a pulse period of 5 ms at the maximum power. As a matter of fact, the substrate material requires more energy to increase its surface temperature, due to the high conductivity characteristic. Acquisition rates were chosen at 785.67 Hz for the substrate and 600 Hz for the specimen with the coating, respectively.
To extract the temperature profile from thermograms, the evaluation of the emissivity of each sample was done, according to Standard ISO 18434 [
26].
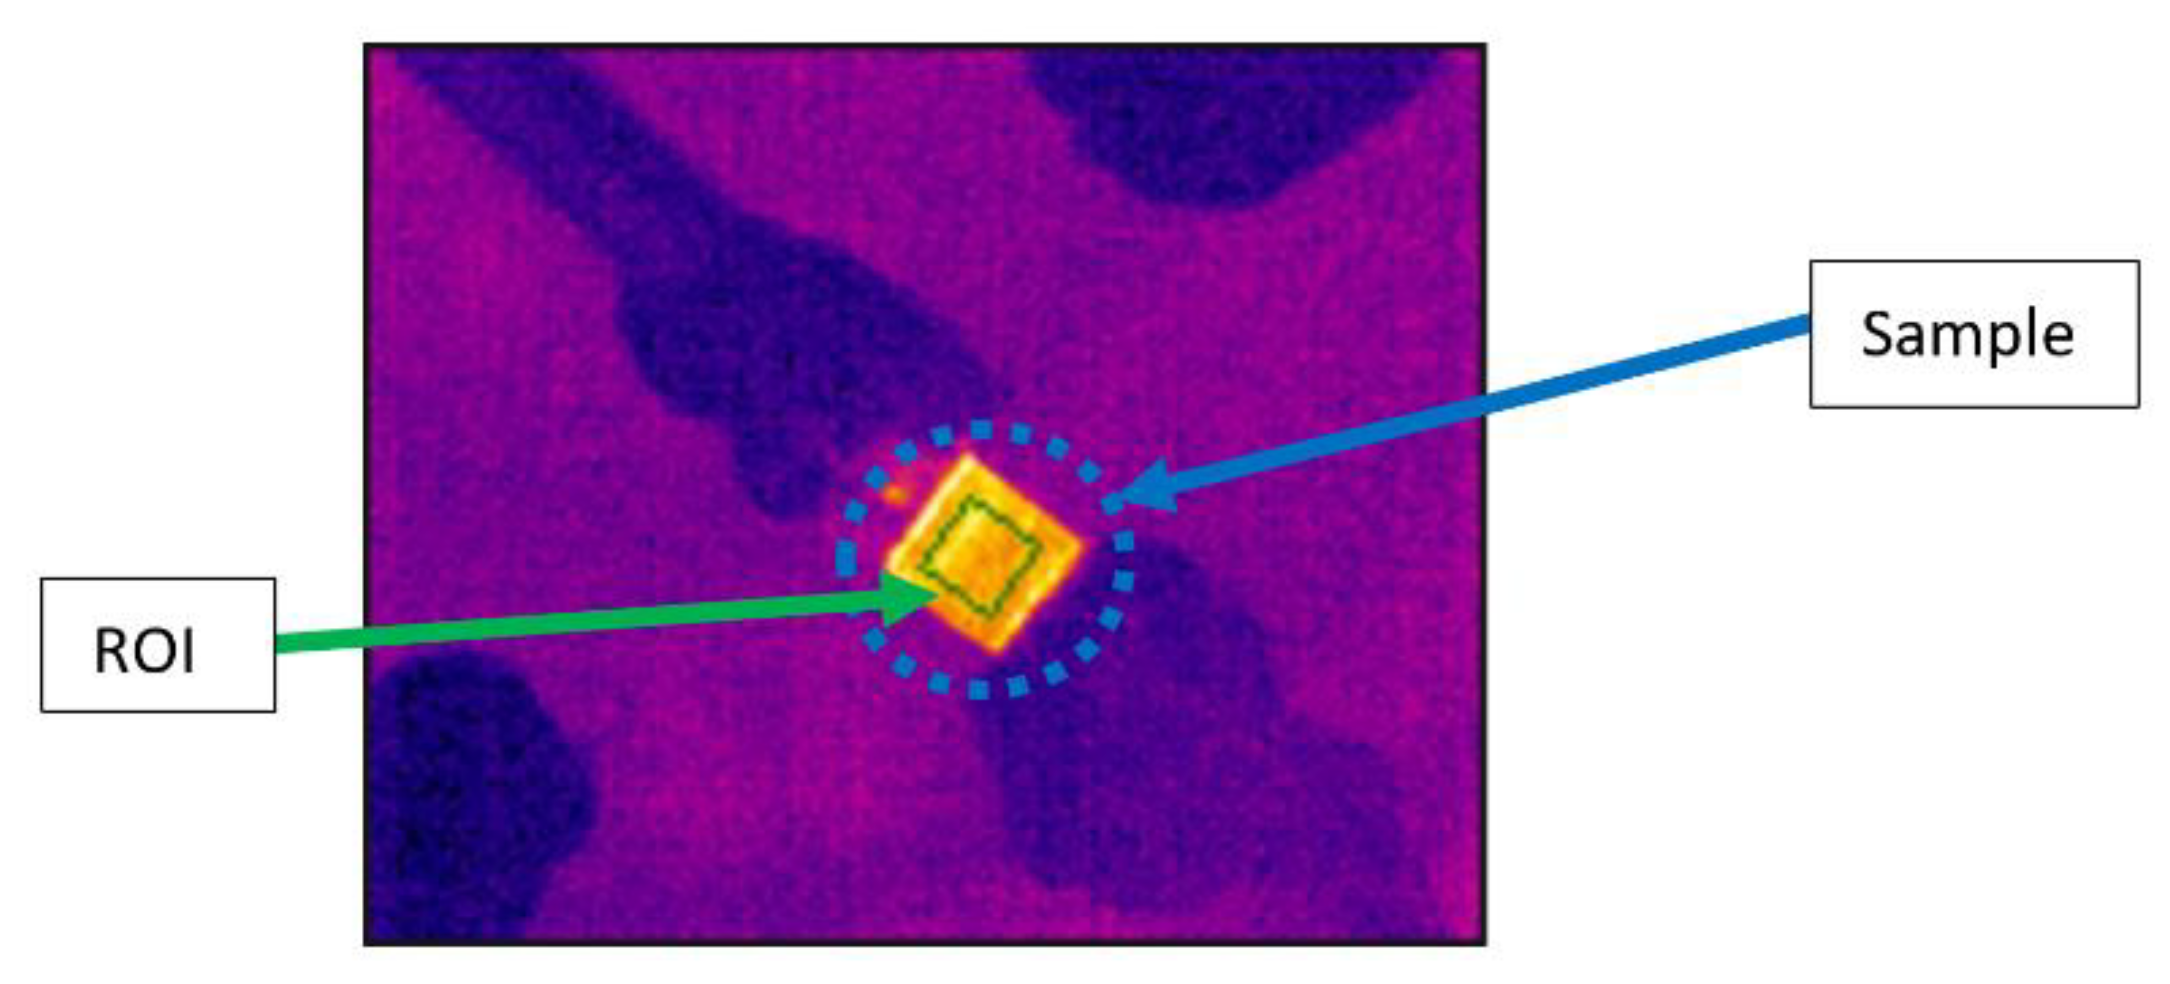
The extraction of temperature profiles was done by using ResearchIR Software. A Region Of Interest (ROI) was chosen to extract the temperature profiles from the corresponding thermogram. As an example,
Figure 8 illustrates the thermal image and the corresponding ROI for the Inconel 601 sample. In general, the ROI is located at the specimen center in order to reduce possible external contour influences.
As already observed, tests performed on Inconel 601 allowed to characterize the base material from the thermal point of view (thermal conductivity) and to verify the methodology reliability (experimental set up and data processing).
4. Results
The experimental activity carried on by the above-described dedicated methodology provided an estimation of thermal diffusivity and conductivity values of both substrate and coating materials, based on Standards approaches [
15,
17]. Temperature profiles obtained for all specimens, substrate and coating, allowed to obtain the thermal characteristics of interest.
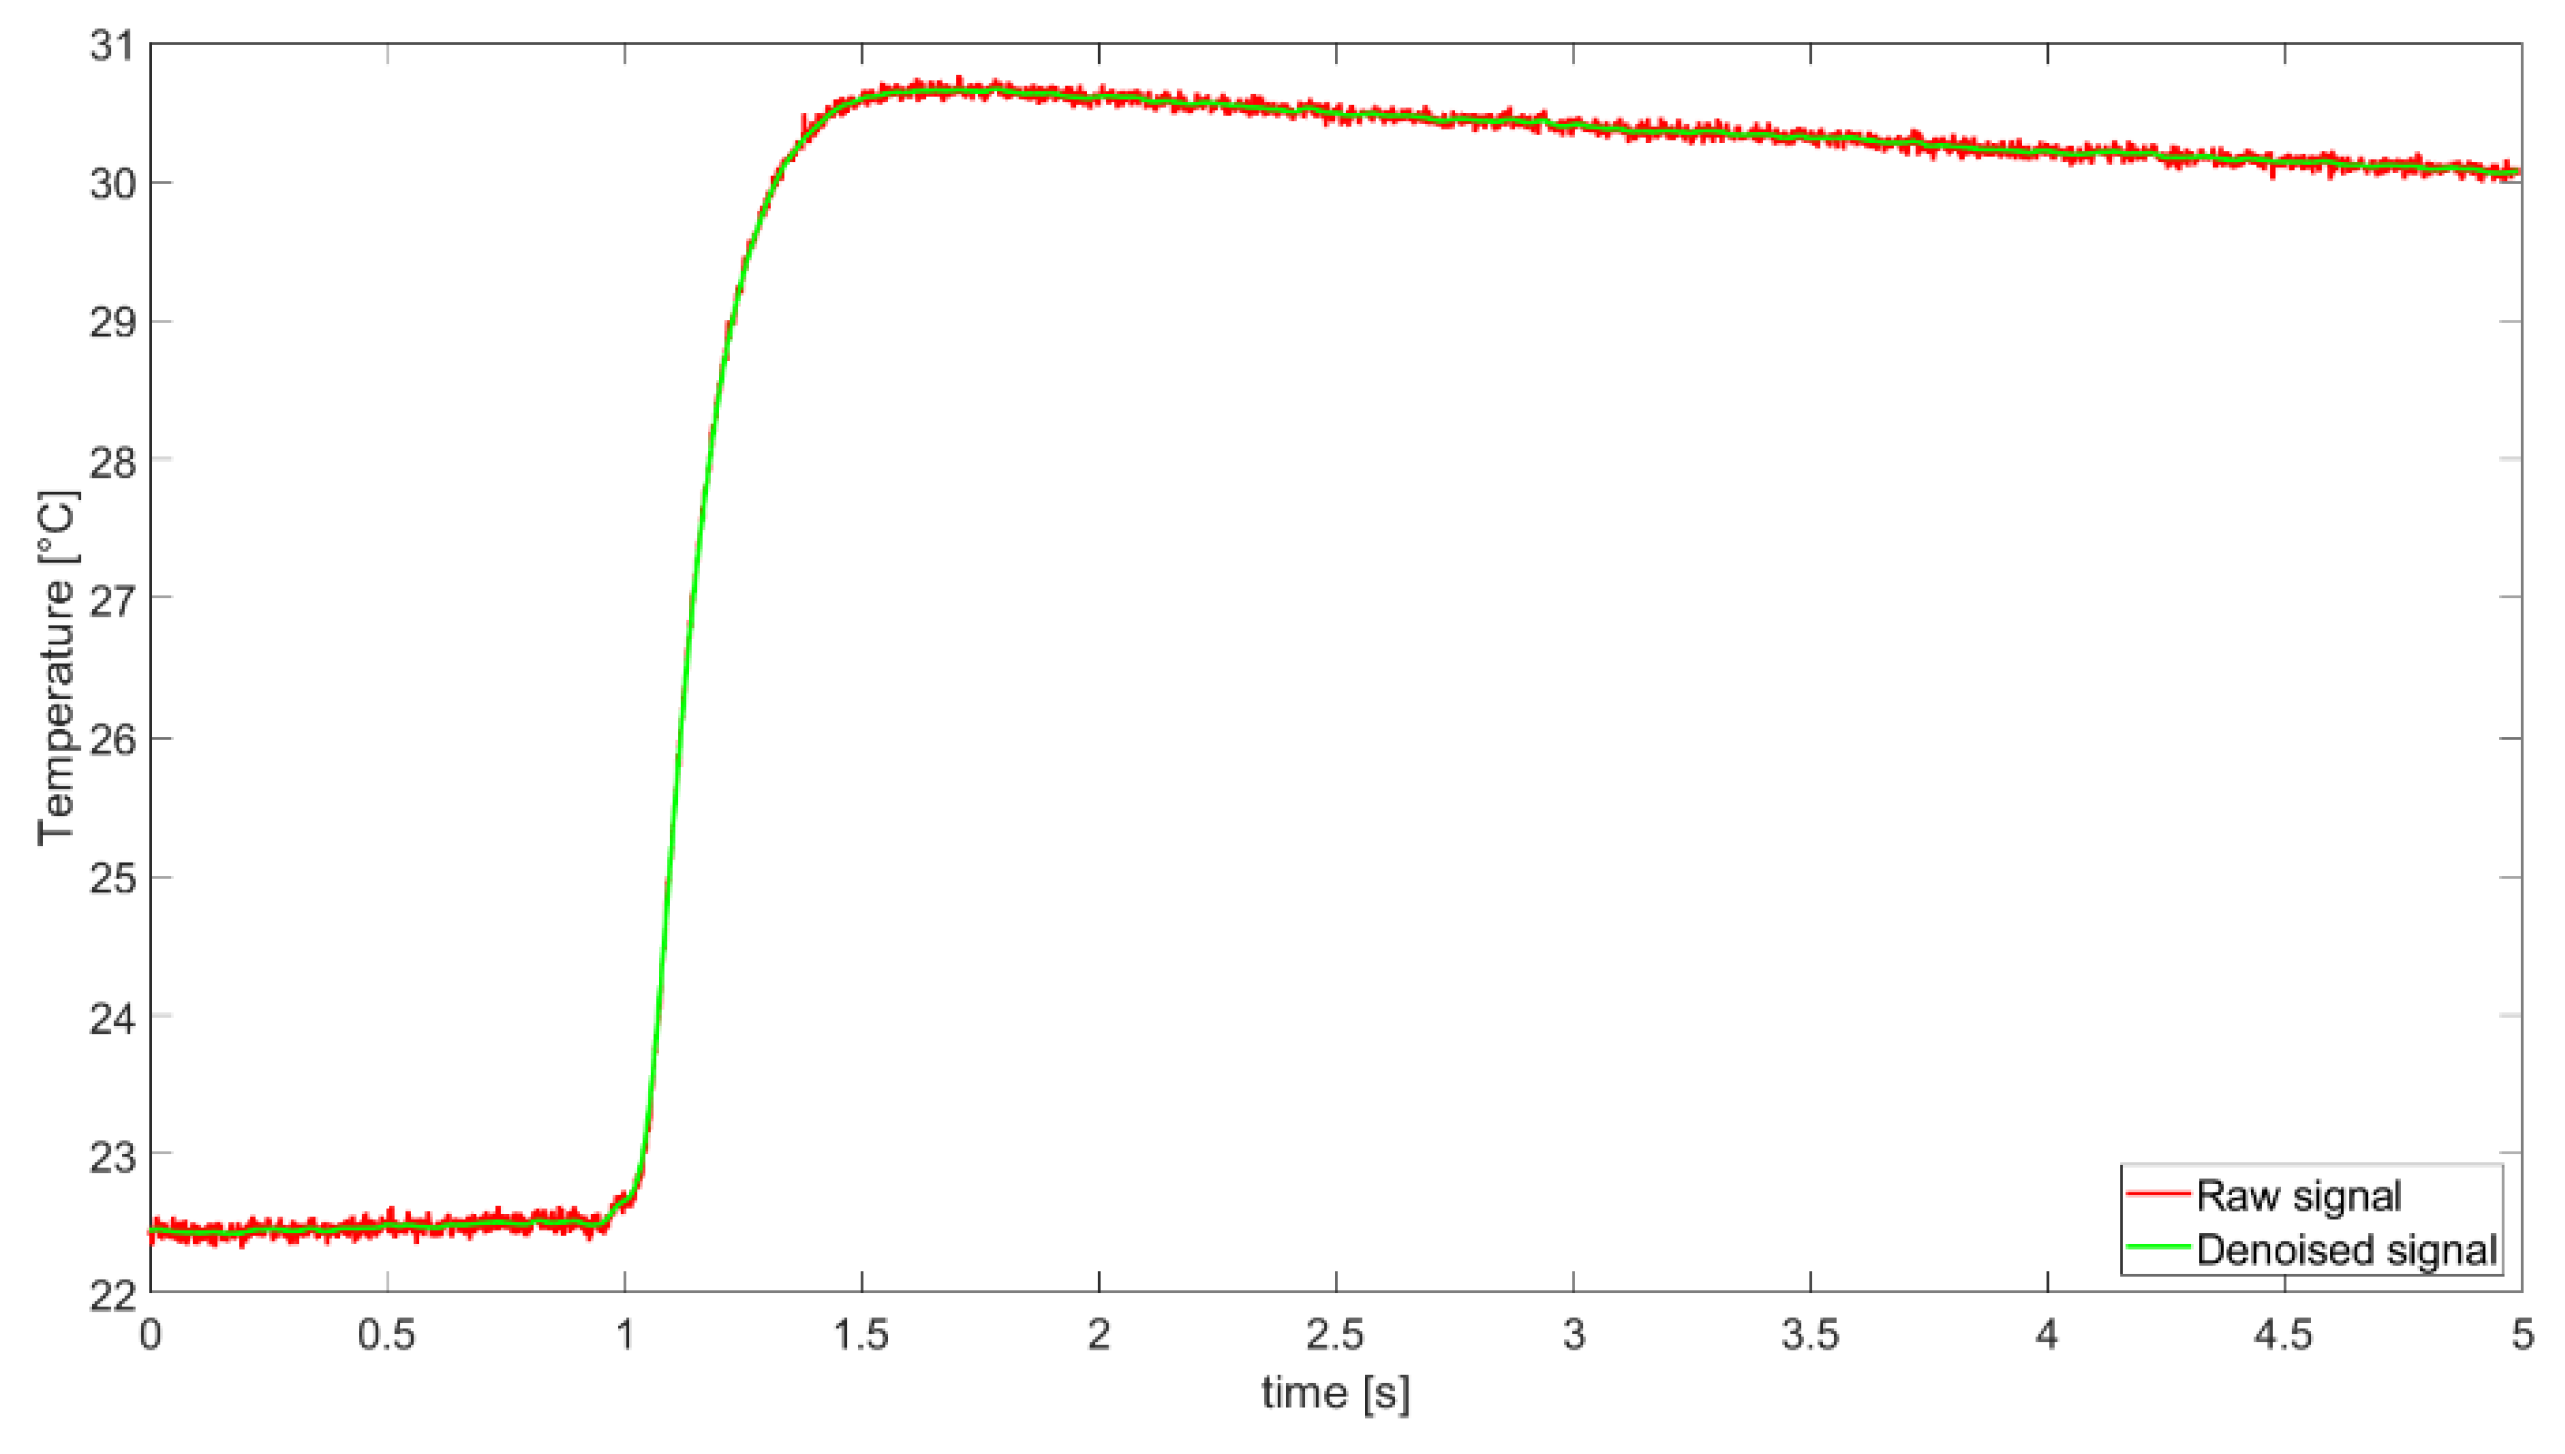
A filtering process (Gaussian filter) was applied to raw signals in order to reduce the effects of high acquisition frame rates. This way, the temperature increment after the laser excitation was correctly identified, without altering the original profile. An example of comparison between unfiltered and filtered temperature profiles (row and denoised signals) for Inconel 601 is illustrated in
Figure 9.
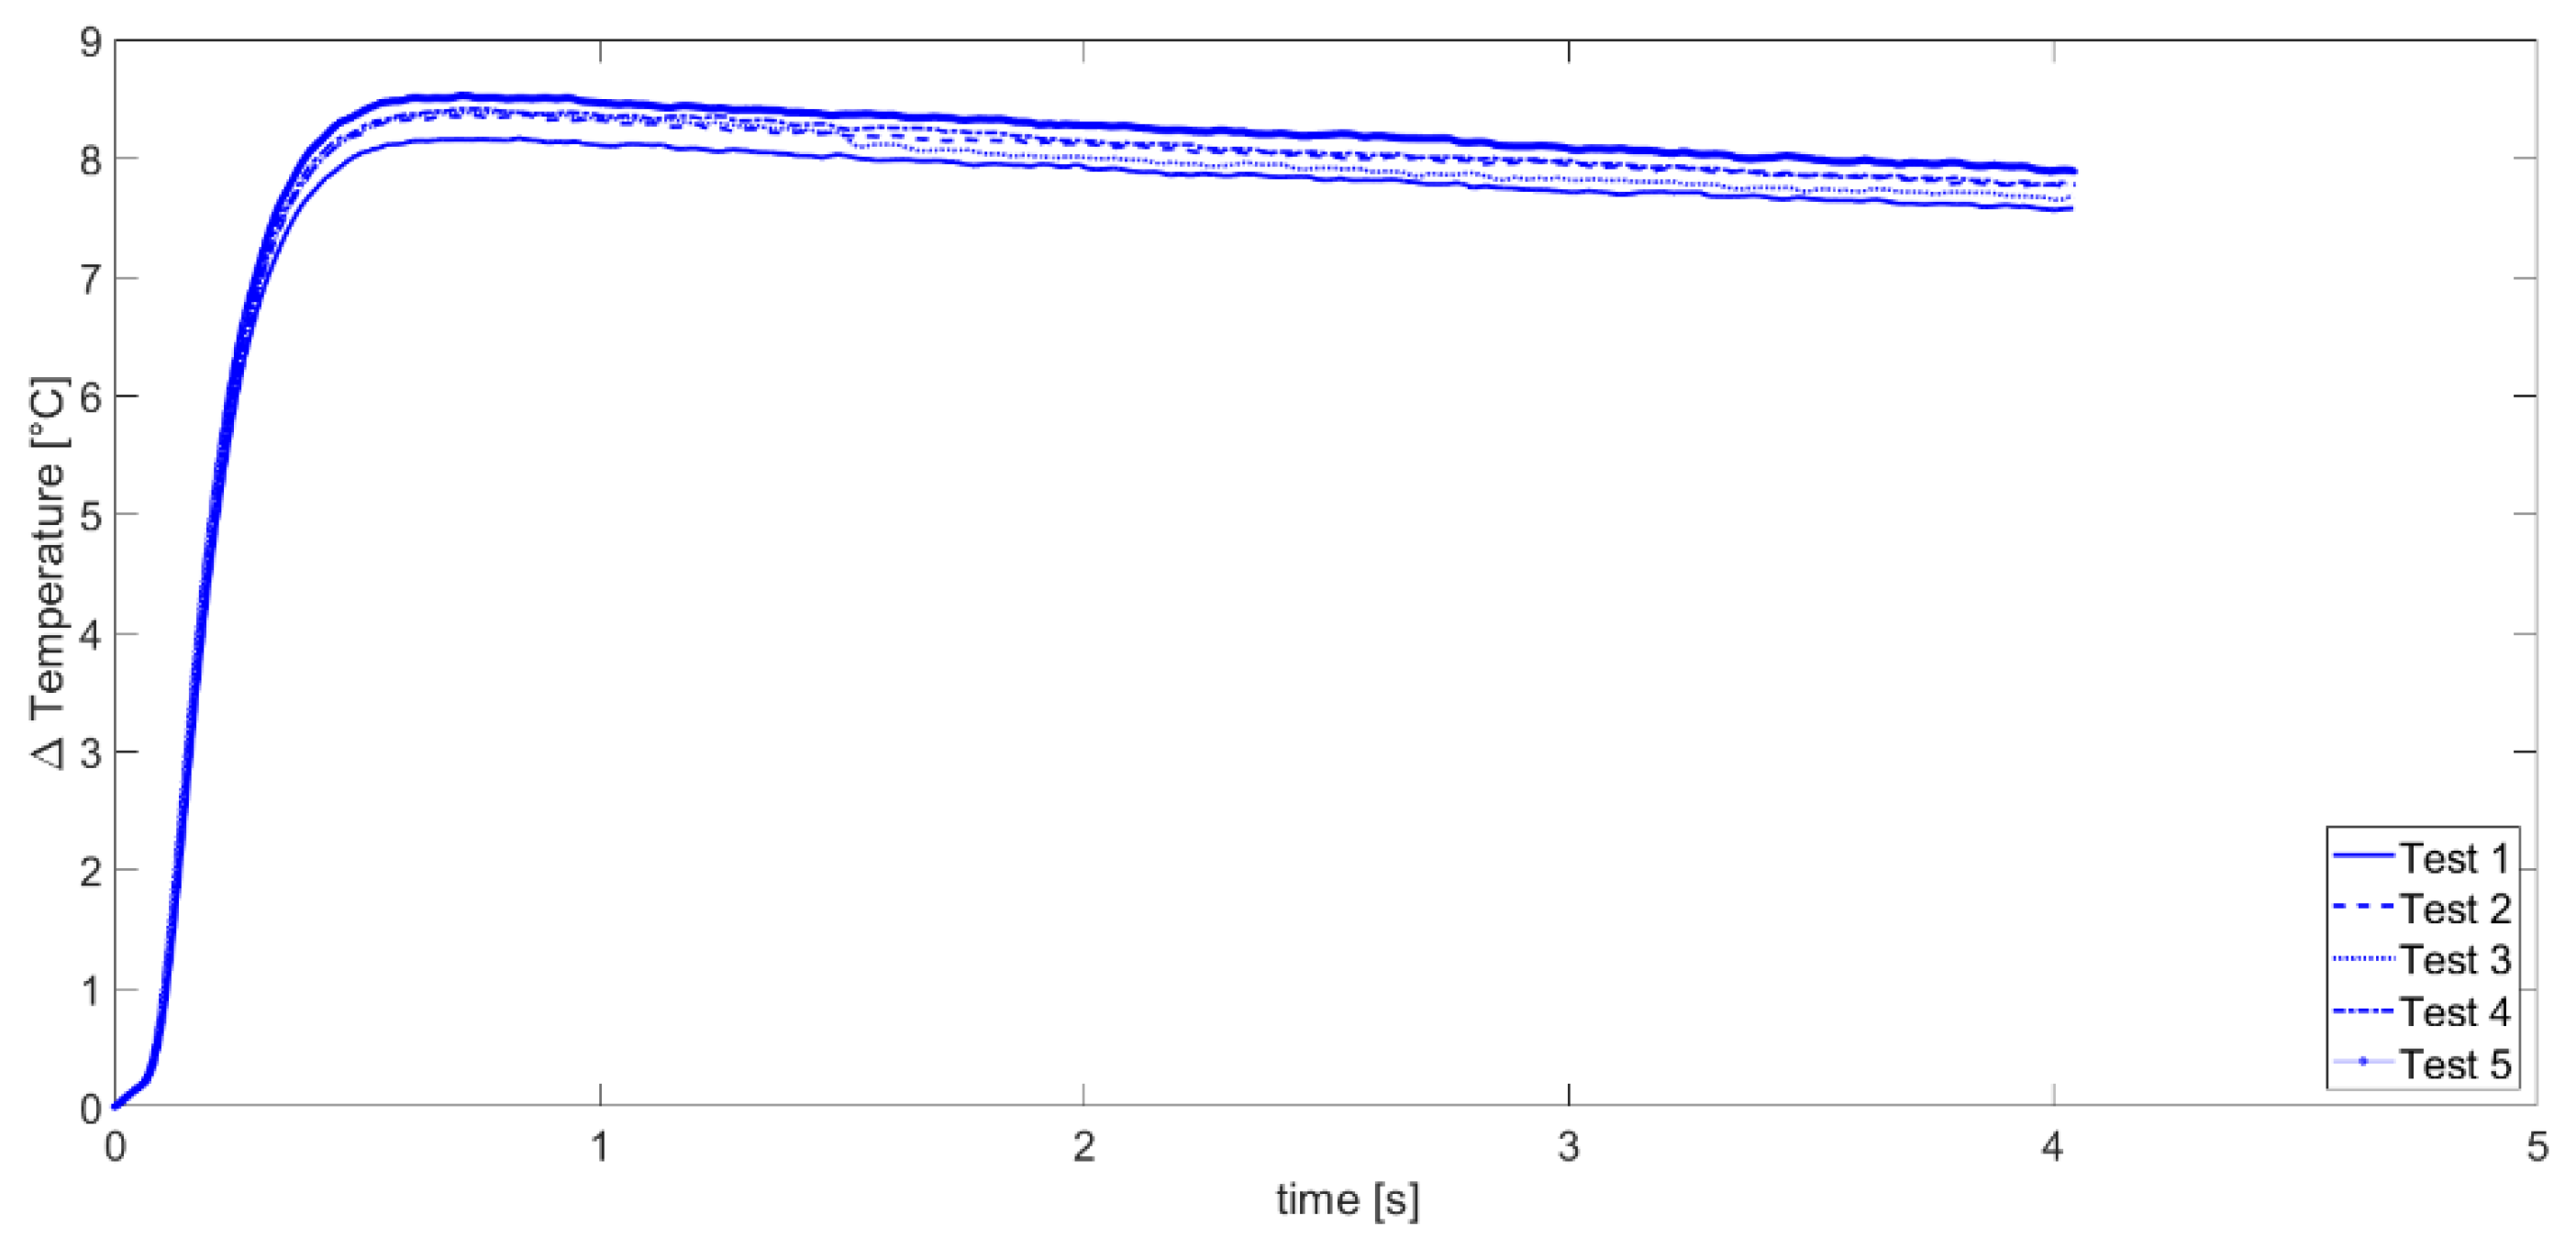
Figure 10 shows denoised signals corresponding to Inconel 601 relative temperatures Δ
Temperature (difference between measured temperature
T referred to the ambient temperature
Tamb, Δ
Temperature =
T −
Tamb) [°C].
Five test replications were performed for the base material (Inconel 601).
Relative temperature profiles Δ
Temperature, according to Standards [
15,
16,
17], were processed in a time range up to its maximum relative temperature rise.
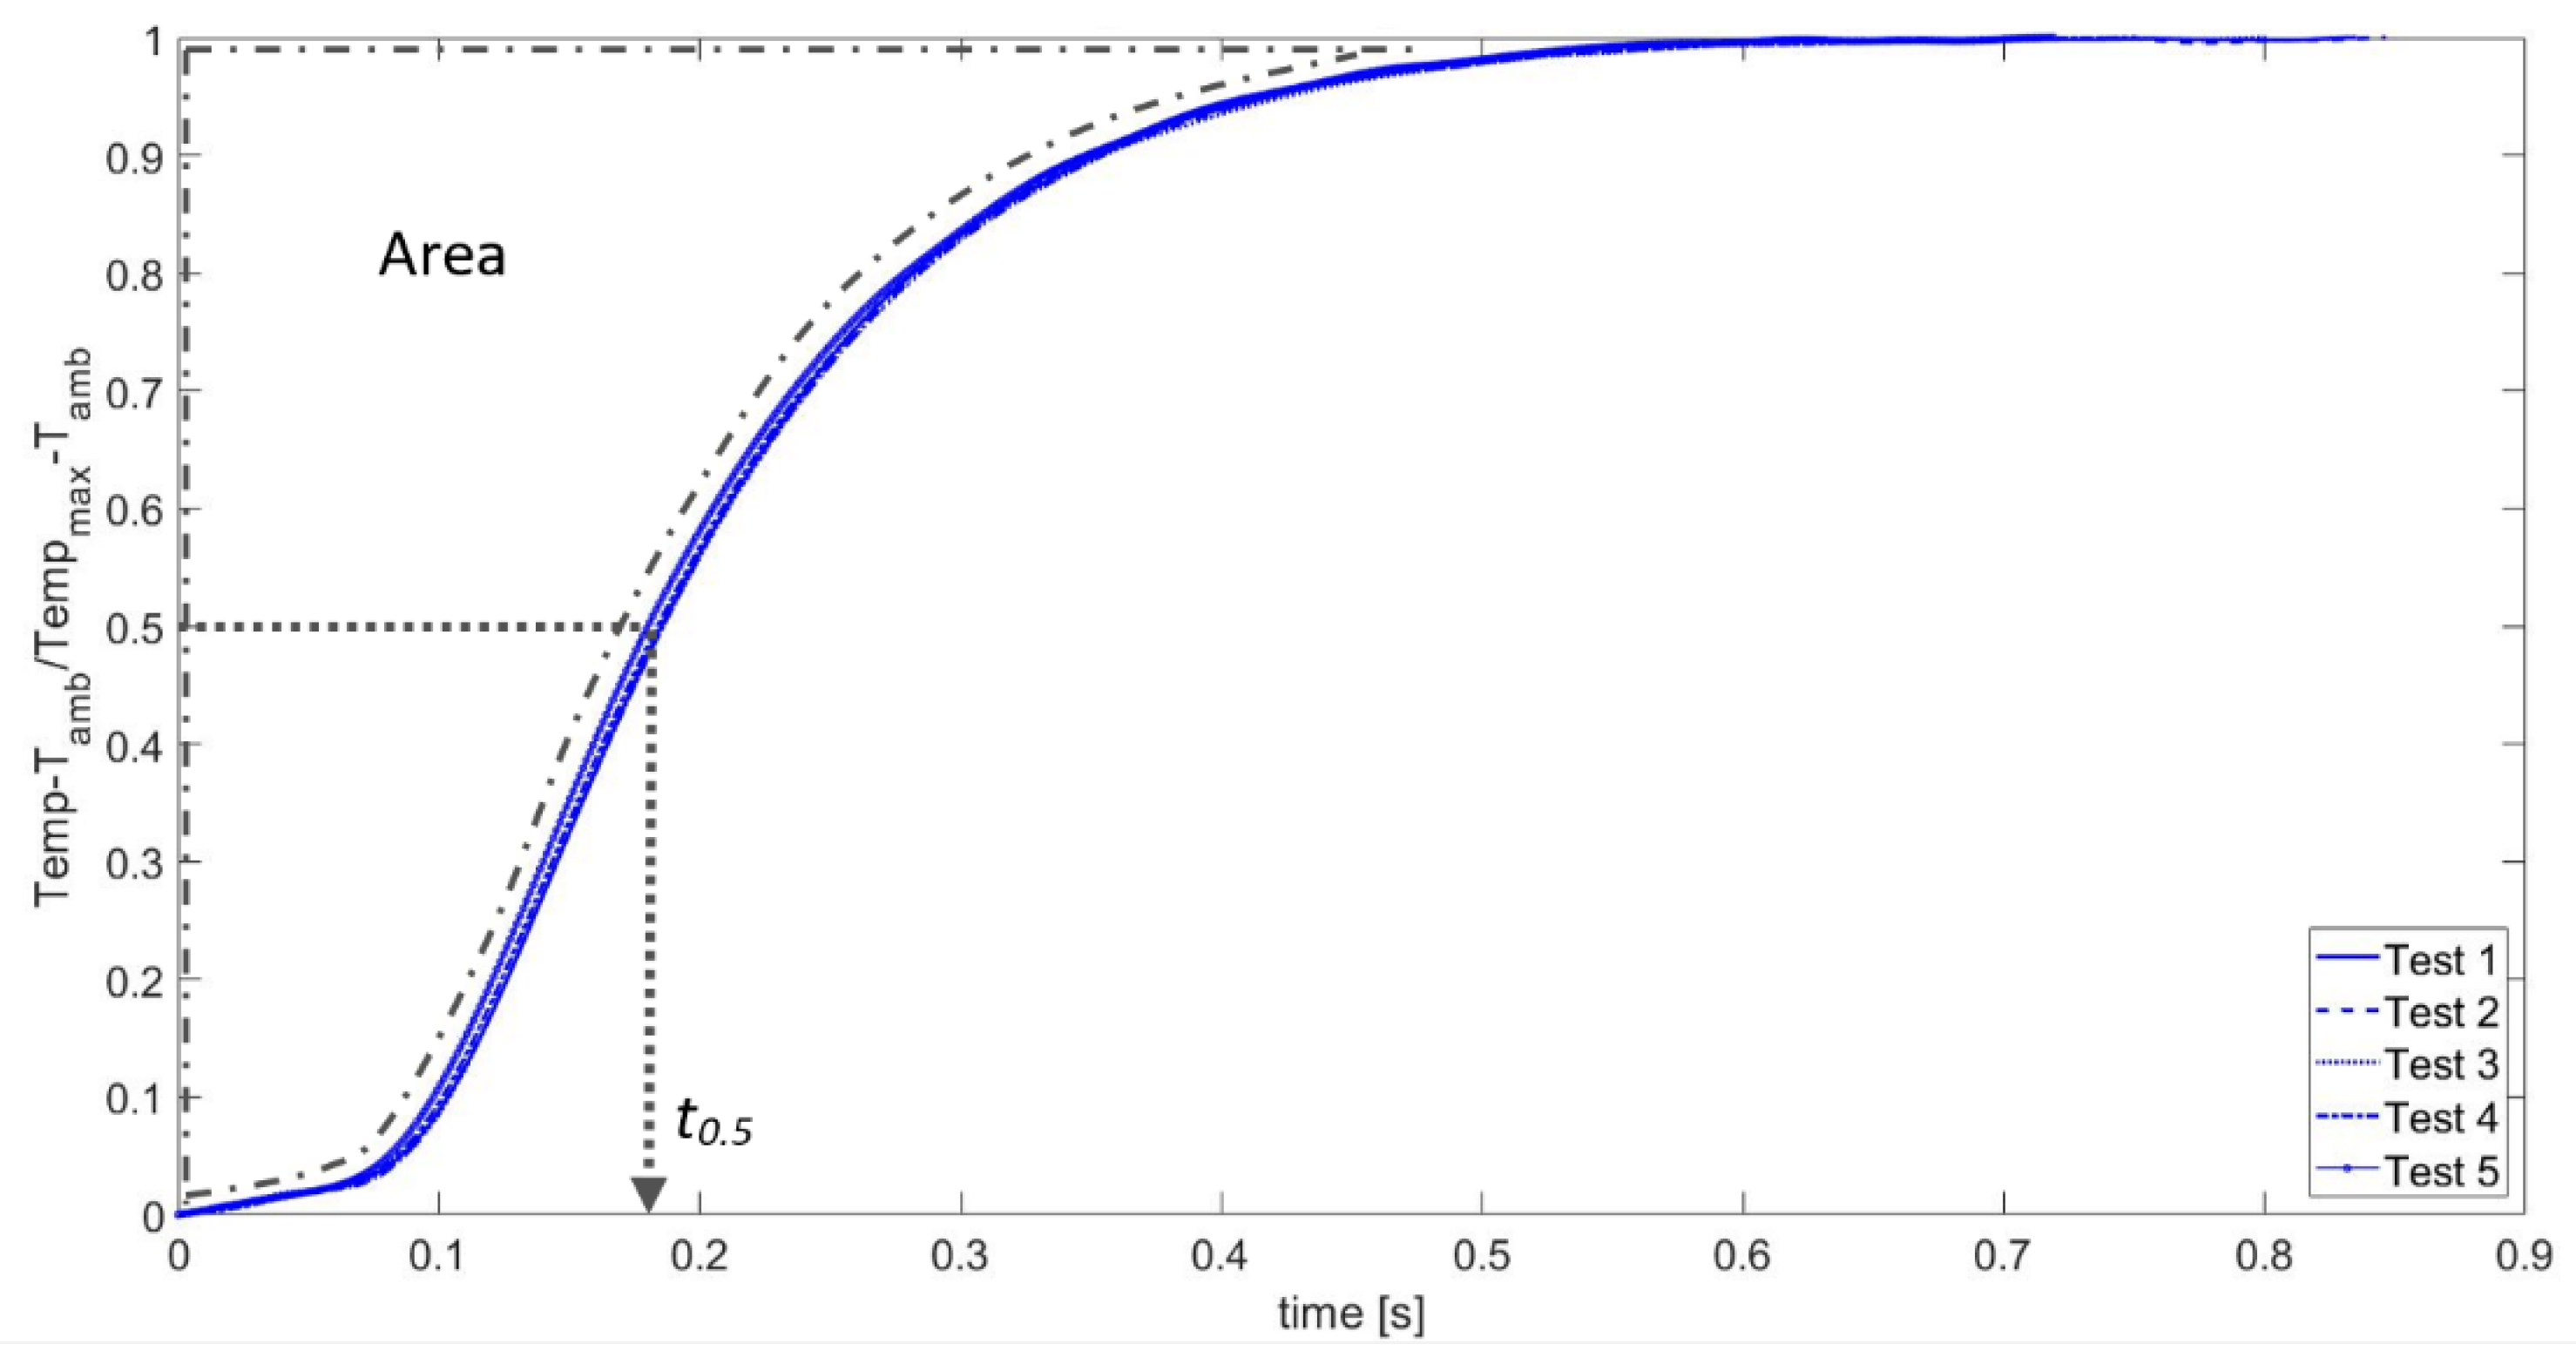
Figure 11 shows the normalized temperature rise [
15] for Inconel 601. In particular, this plot represents the same relative temperature profiles Δ
Temperature shown in
Figure 10, here normalized with respect to maximum relative value for each curve (
Tmax −
Tamb). In the same
Figure 11, the parameters of interest (area and half rise time
t0.5) useful for thermal characterization are illustrated.
Thermal diffusivity and conductivity were computed by using Equations (1)–(3) and (6), reported in [
15,
17], and by applying the corrections suggested in Standard [
17], as the Centroid method (to correct the finite pulse period of the excitation source) and the Cowen method (to correct the heat losses) [
15,
17].
Table 2 resumes all results related to the thermal characterization of the substrate (Inconel 601) (averaged values of all replications) by applying Standards [
15,
17] formula.
In particular,
Table 2 can be thought as divided into two parts: the left side concerns results obtained by applying to the substrate a monolayer ceramic material model (ISO18755 [
17]), while the right one concerns the results that refer to a multilayer material model (ISO18555 [
15]).
In more detail, on the left side (ISO18755 [
17]), the calculated values of ideal thermal diffusivity and conductivity (α
ideal e
kideal) as they are defined in [
17], which is the diffusivity and conductivity calculated by means of the half rise method, and the corresponding values corrected by the Cetroid Method (α
tc e
ktc) and by the Cowen Method are presented (α
Cowen5,
kCowen5, α
Cowen10, and
kCowen10) (respectively, 5 and 10 times the half rise time “
t0.5”).
On the right side (ISO18555 [
15]), the calculated values of ideal thermal diffusivity and conductivity obtained by considering the Inconel 601 as a monolayer material (α
1-ideal and
k1-ideal) are shown.
Finally,
Table 2 reports the calculated heat diffusion time of the substrate (
τ1), useful for thermal characterization of APS and SPS coatings.
From the analysis of
Table 2, it can be observed that for Inconel 601, both Standard analytical formula ([
15,
17]) provide similar diffusivity and conductivity values. These values are in a good agreement with the corresponding provided by the material producer (
k =11.2 to 12.7 W/m °C).
Table 3 shows a comparison between thermal conductivity values of Inconel 601 shown in
Table 2 and those available in the literature [
24].
In particular,
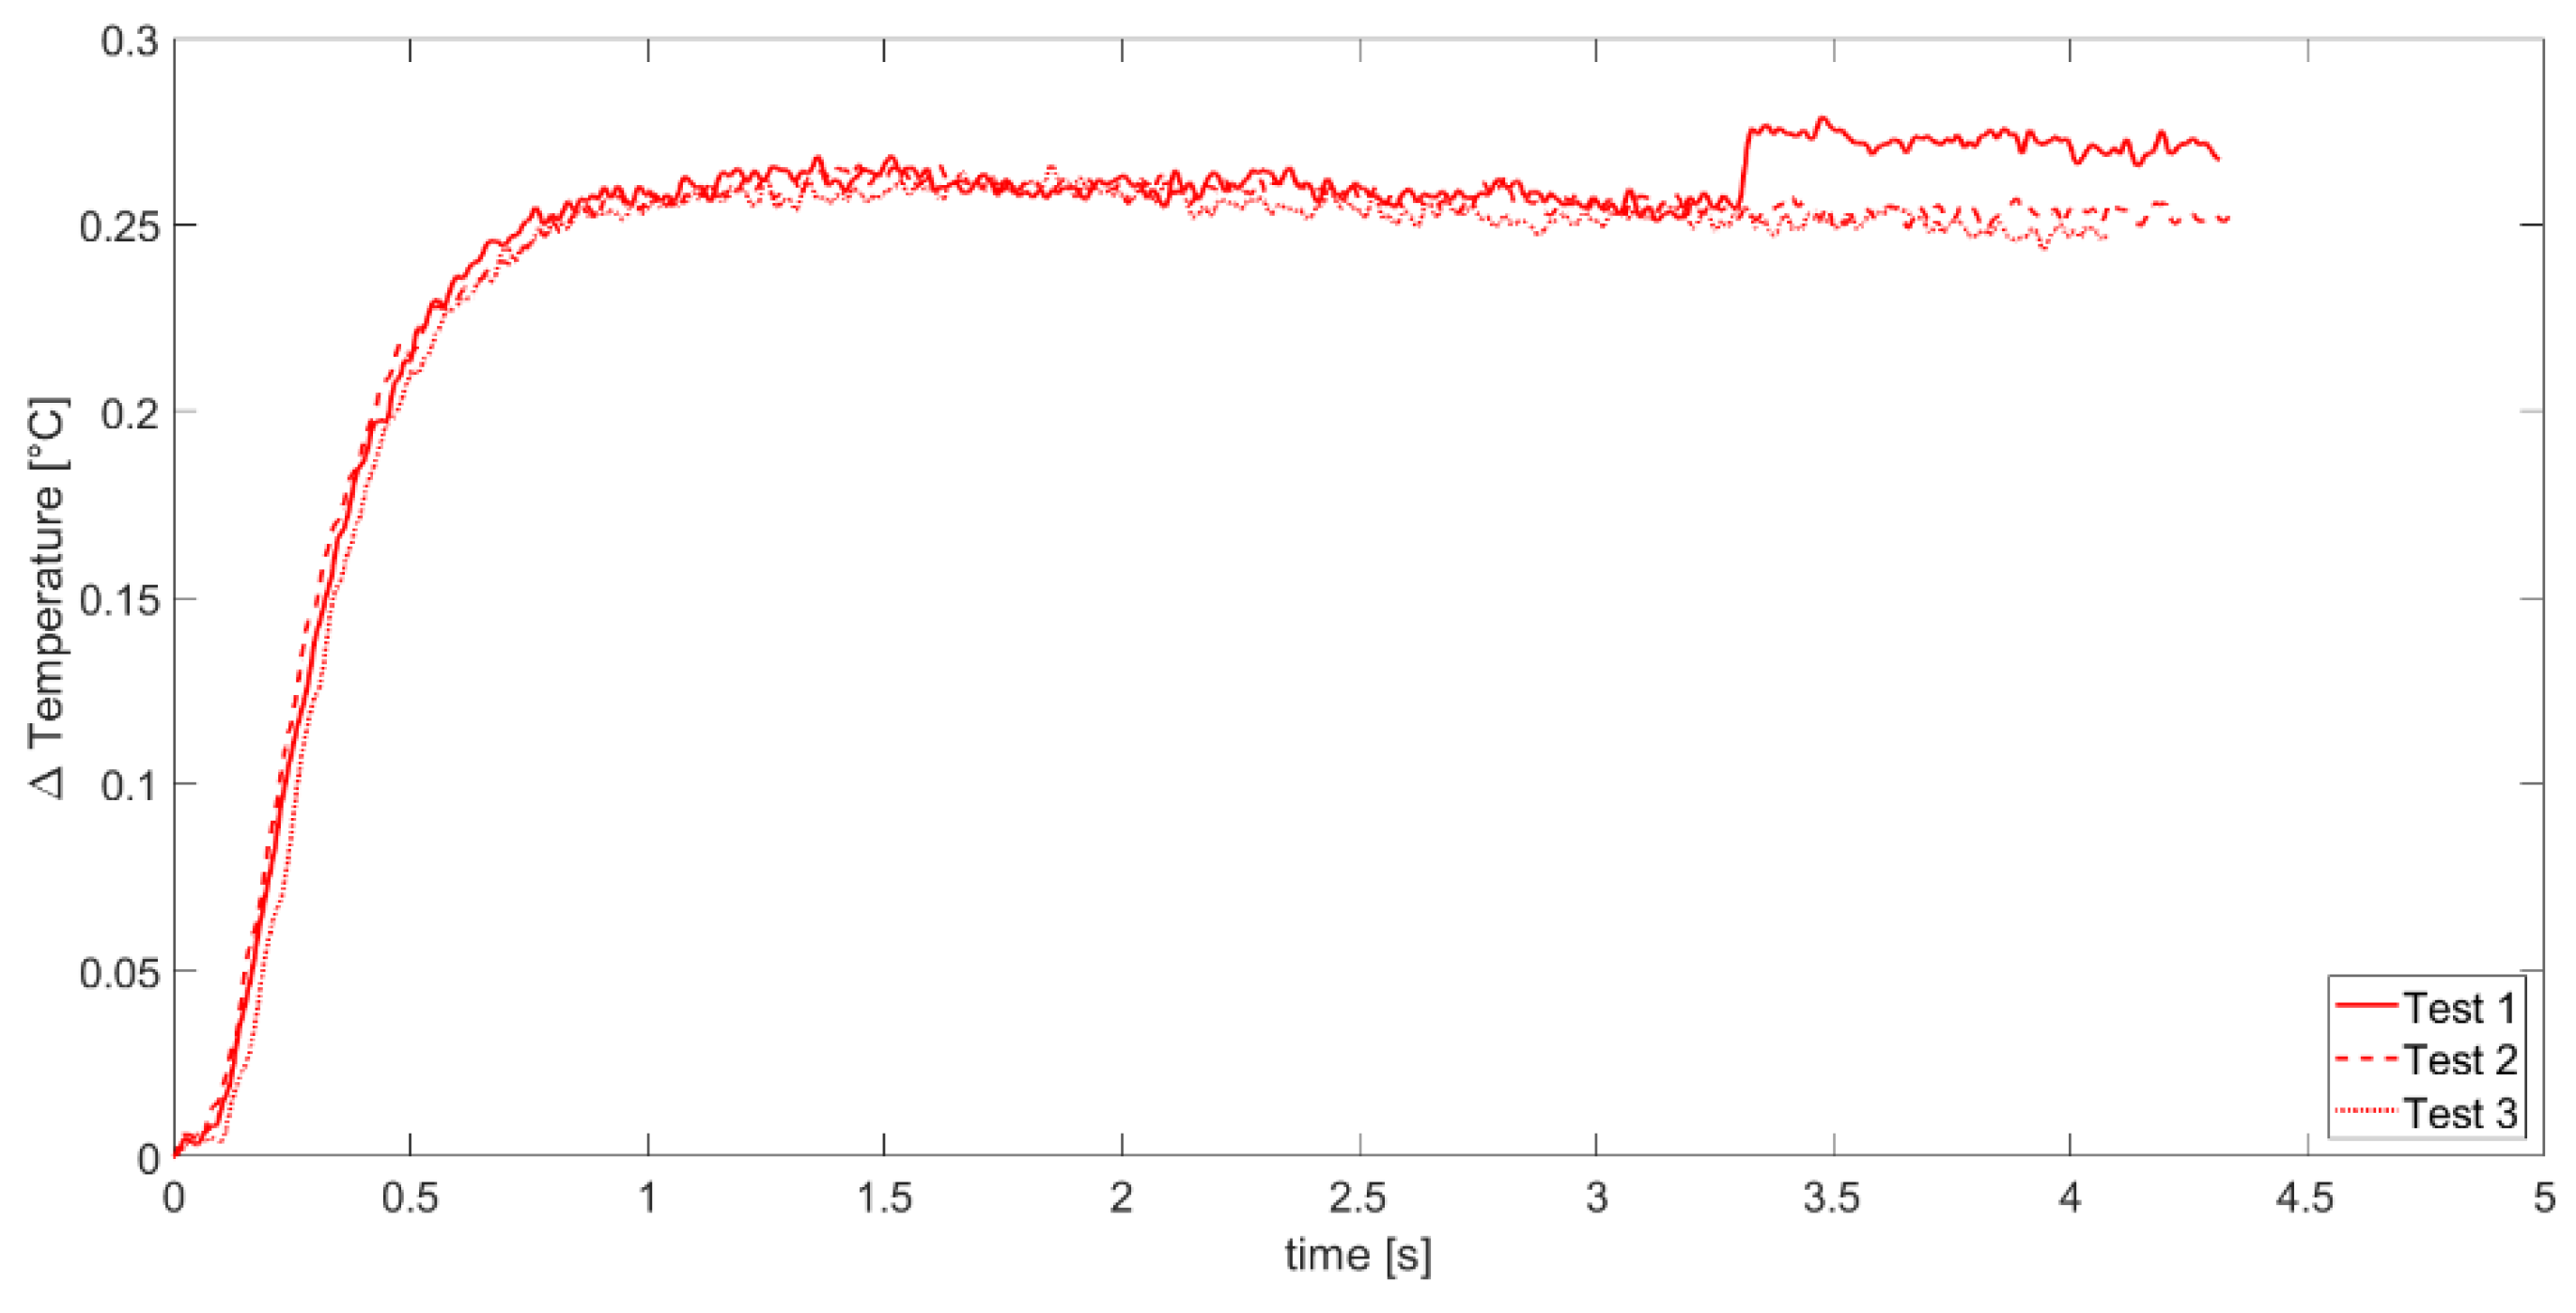
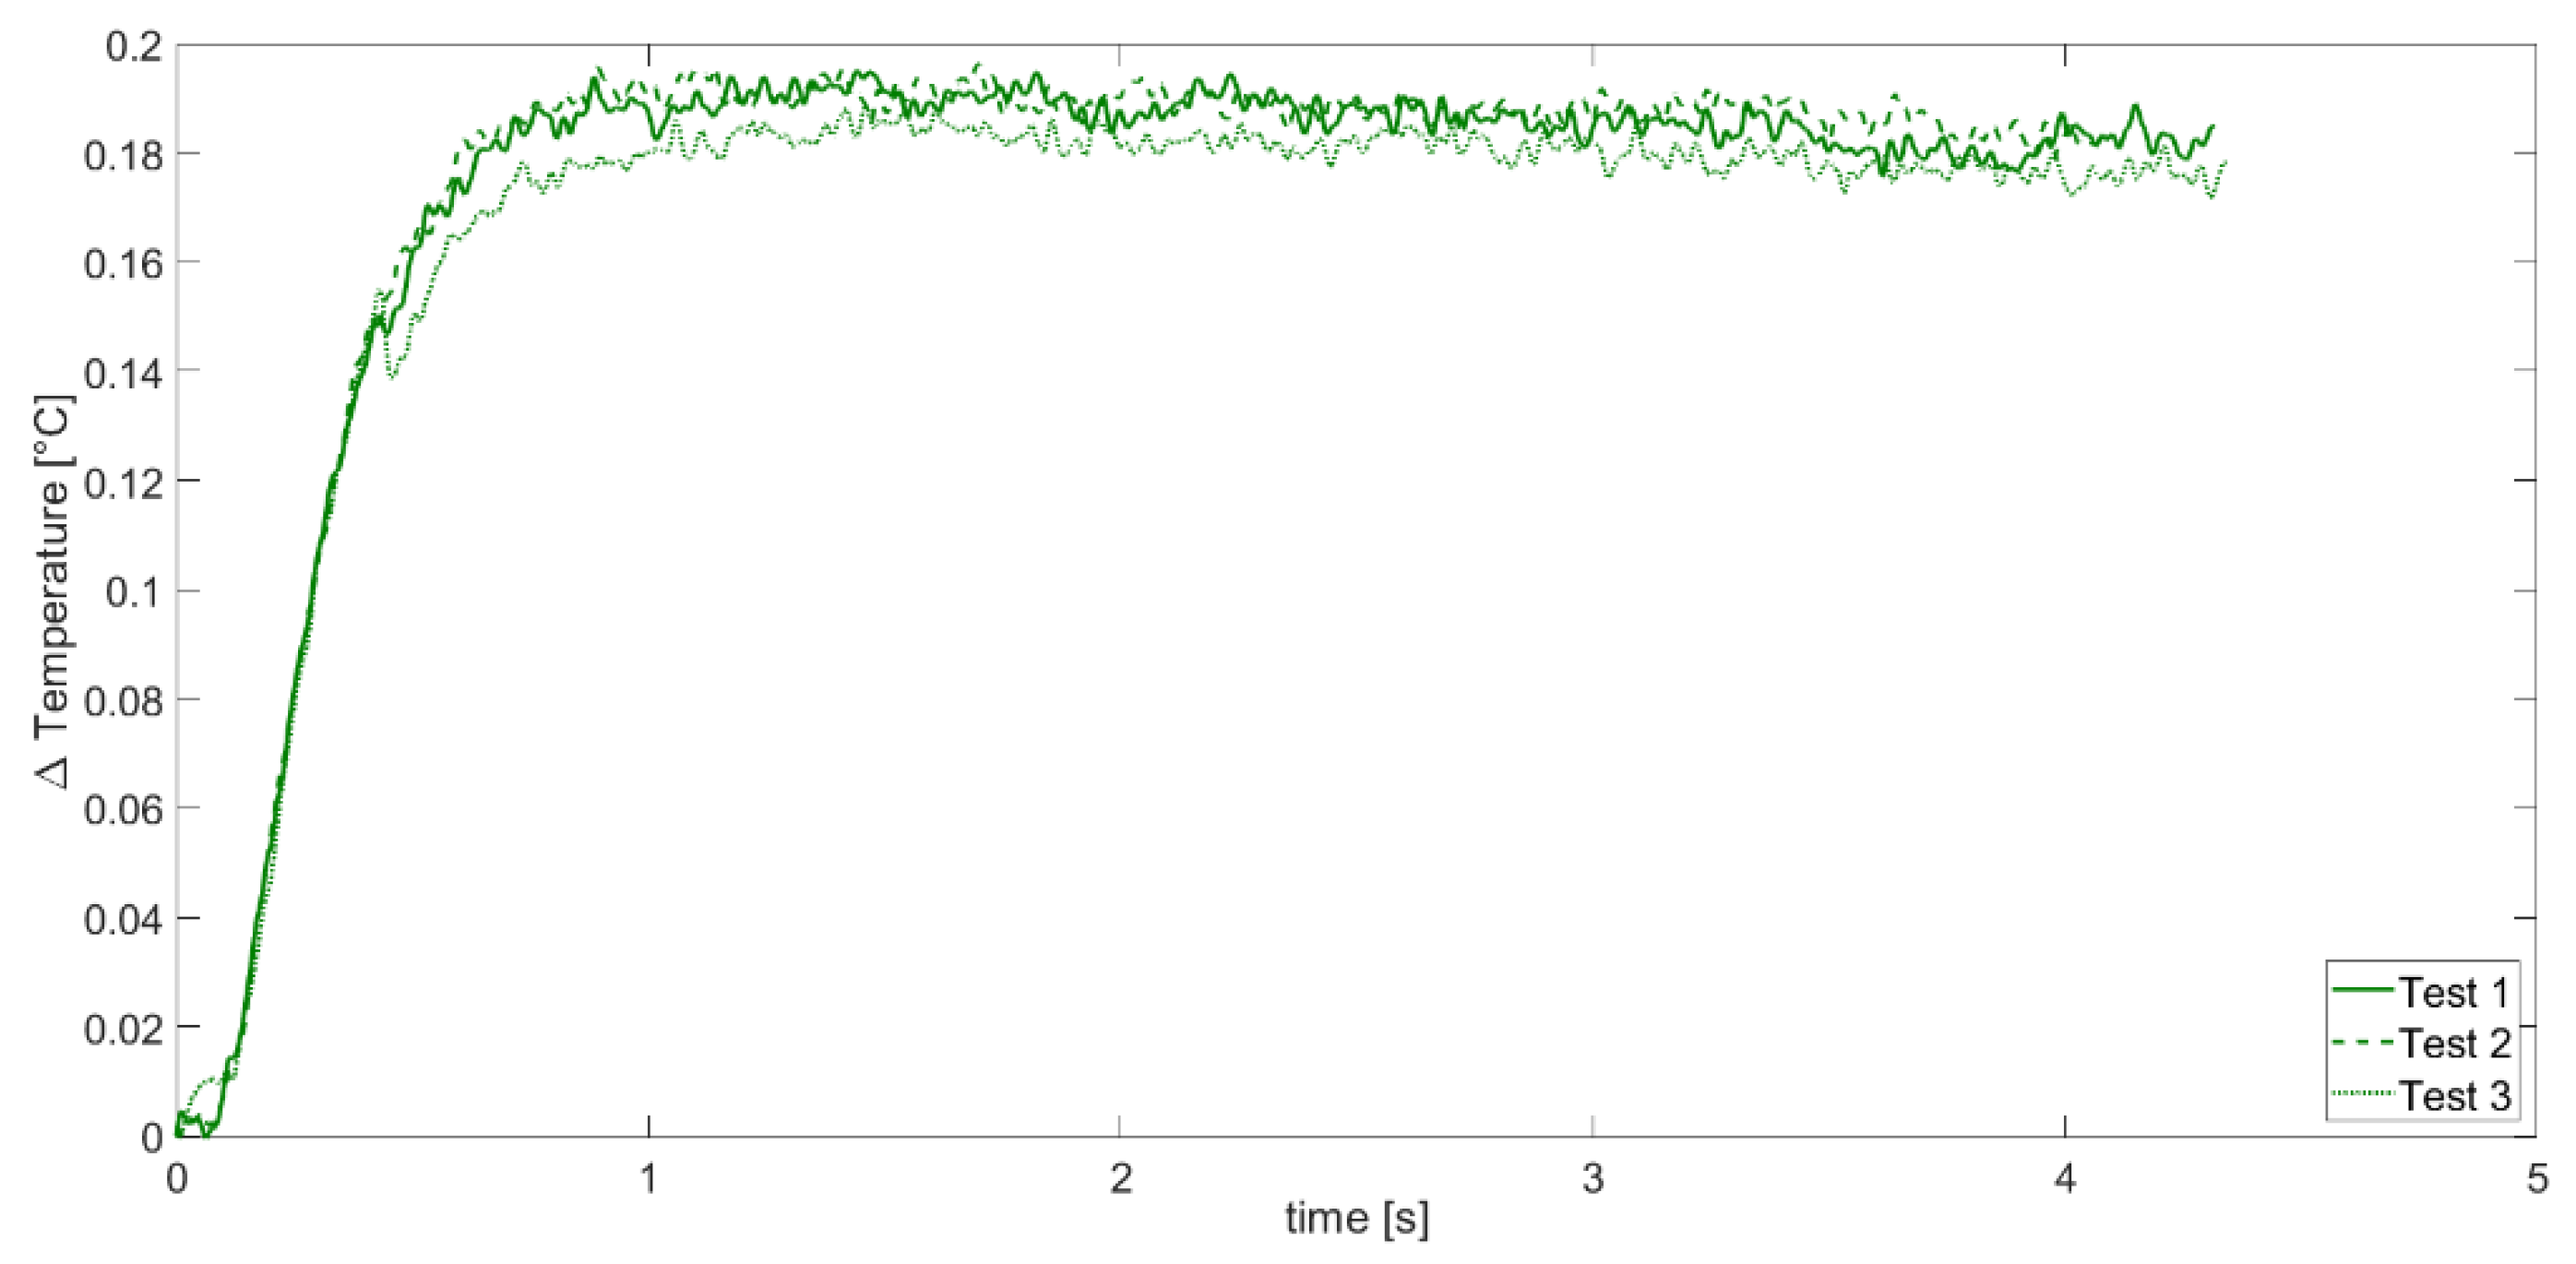
Figure 12 and
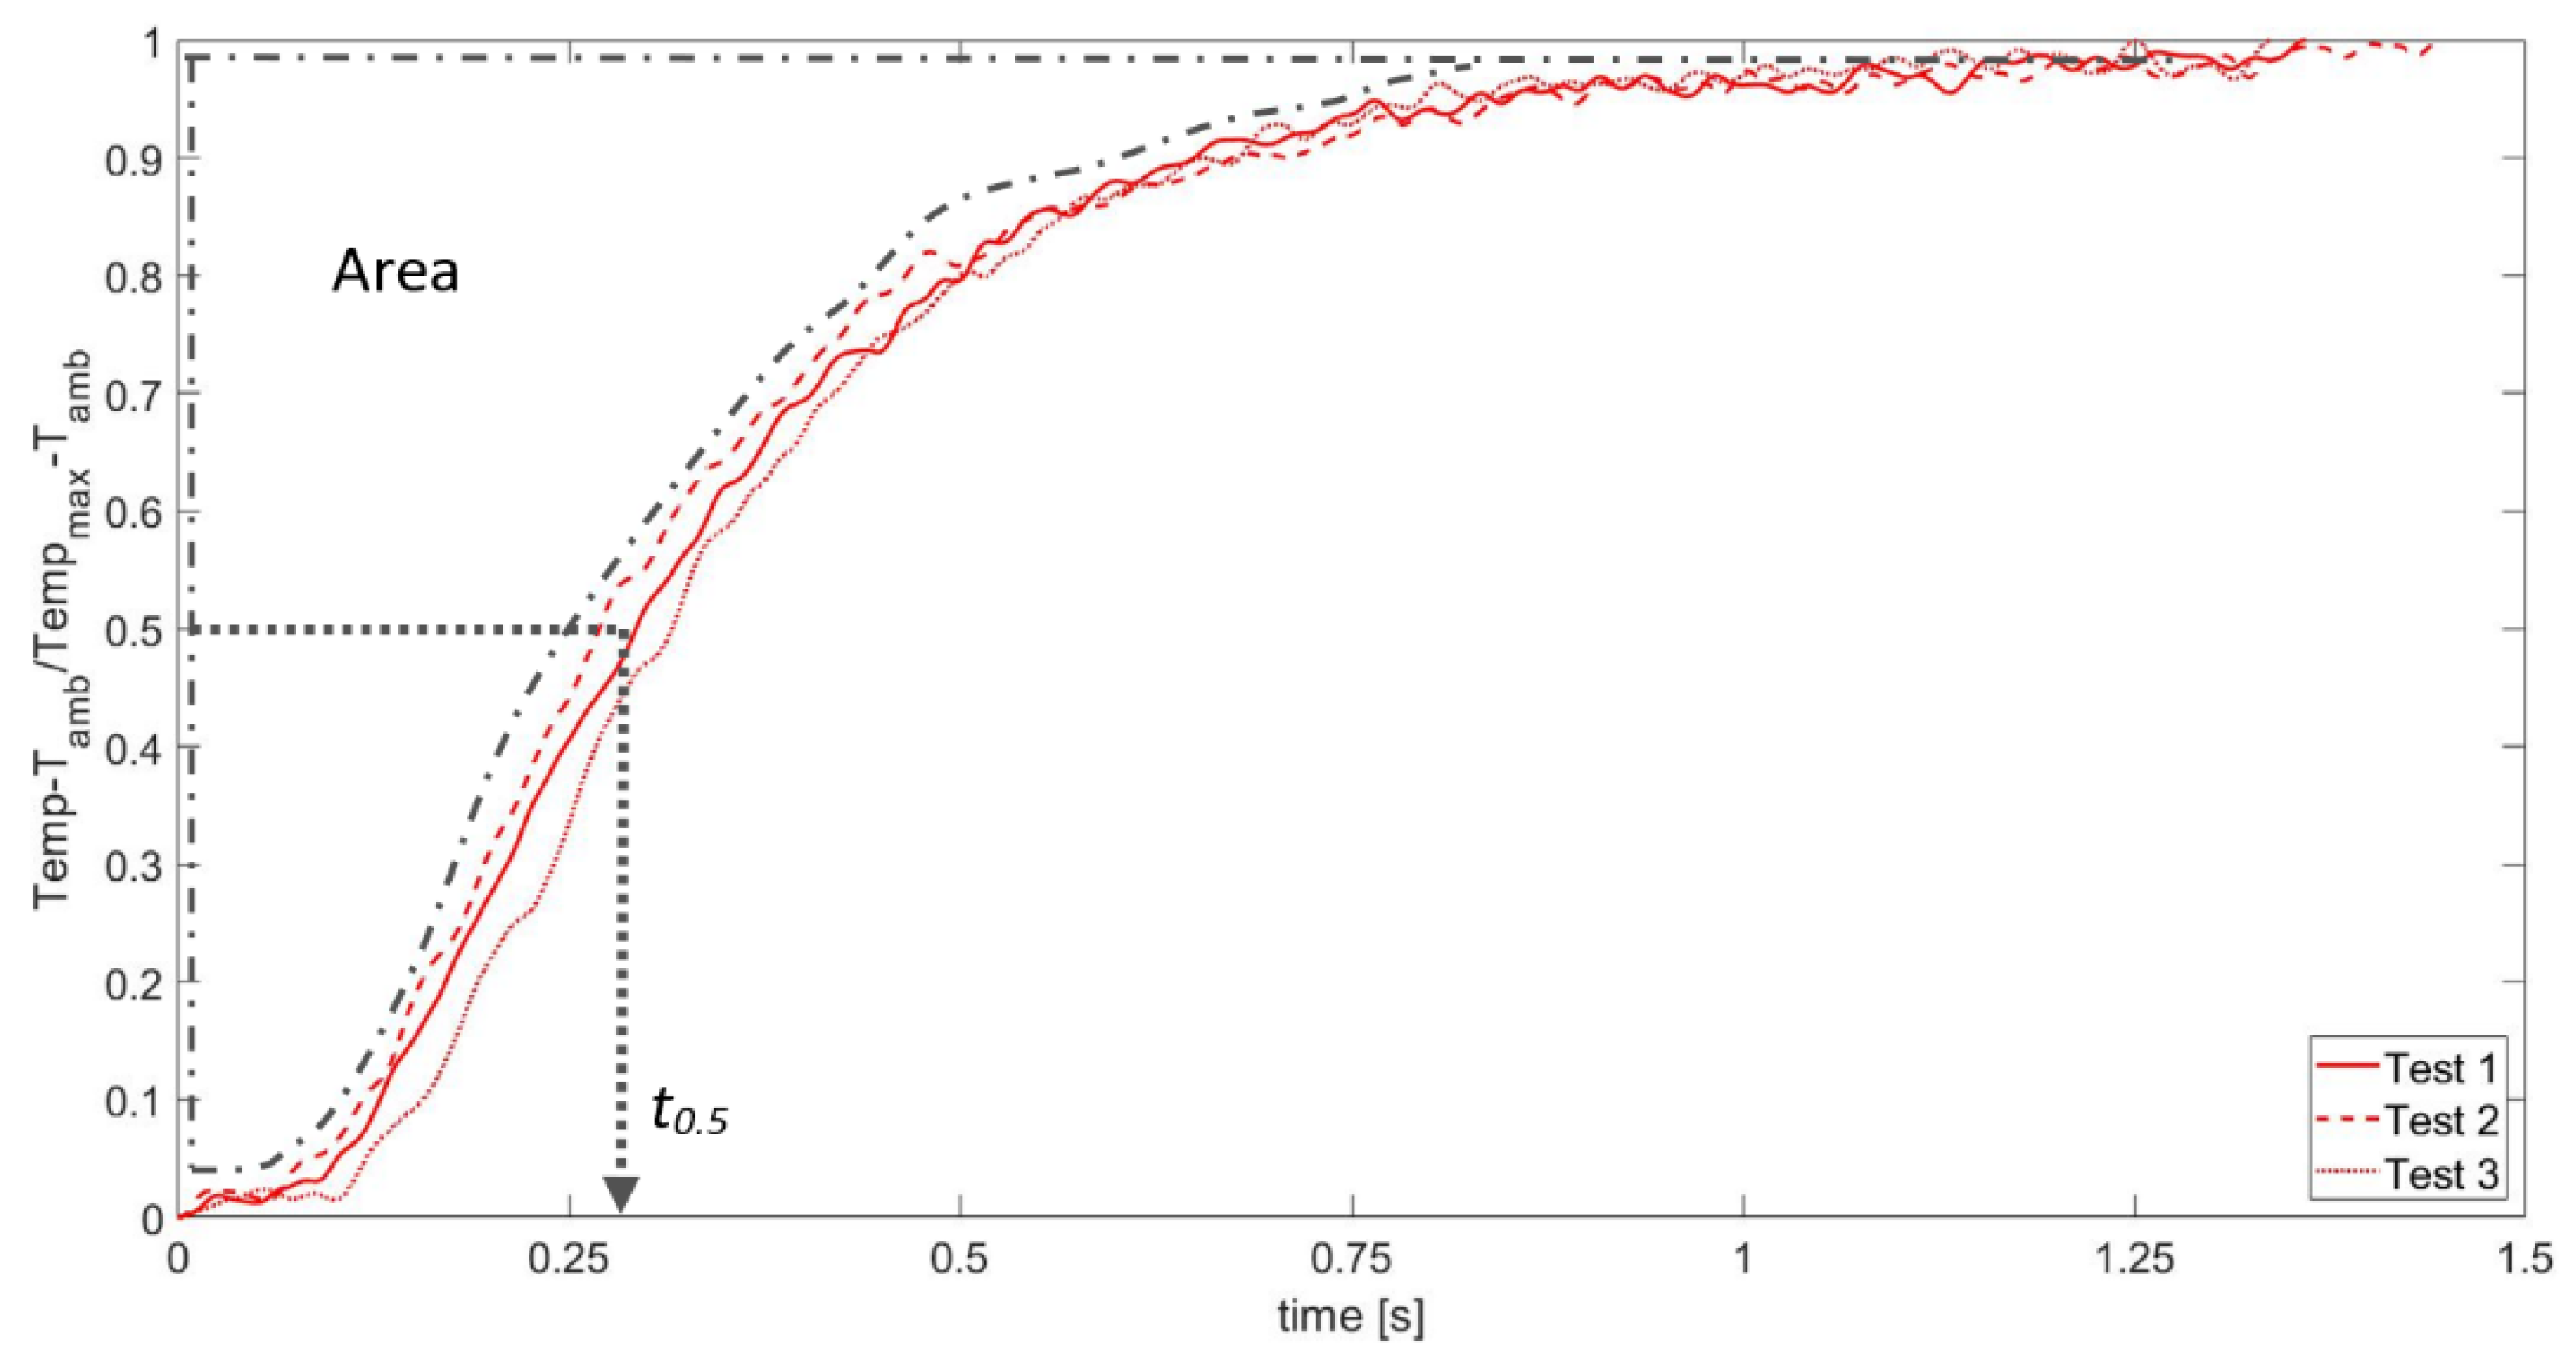
Figure 14 show the denoised relative temperature profiles, respectively, for APS and SPS coatings.
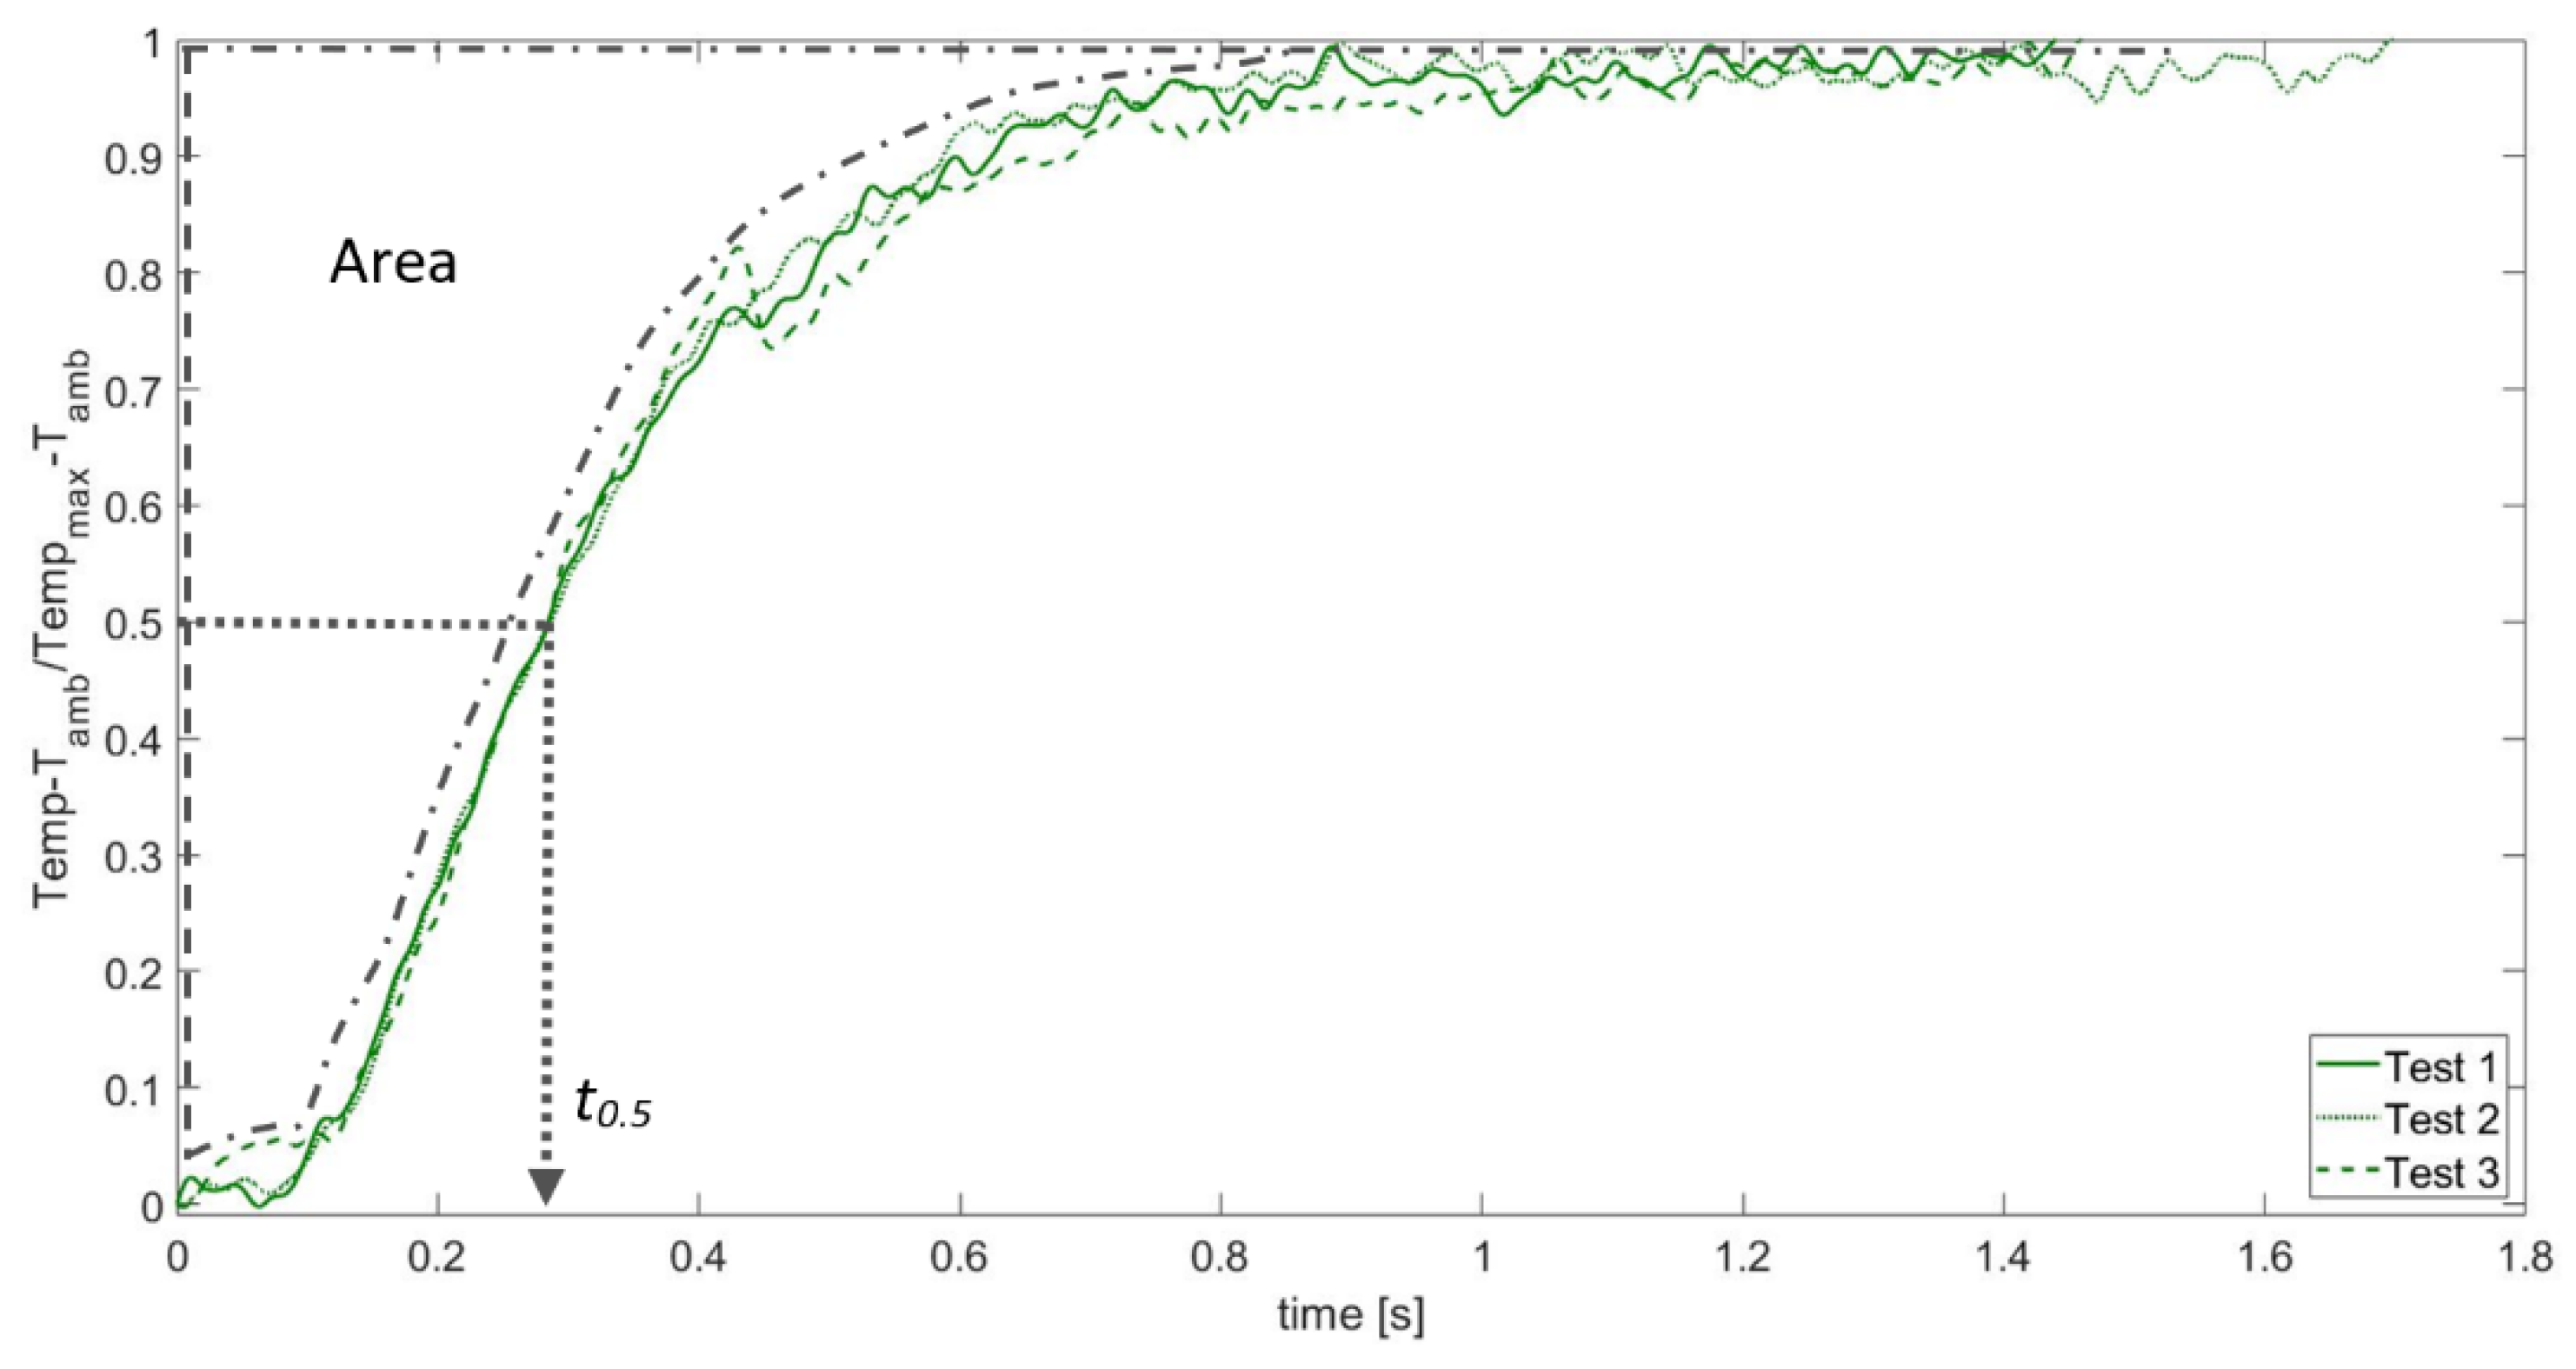
Figure 13 and
Figure 15 report the normalized temperature rises with respect to maximum relative value for each curve (
Tmax −
Tamb) and the parameters of interest (area and half rise time
t0.5) for APS and SPS coatings.
Finally,
Table 4 resumes all thermal diffusivity and conductivity values for APS and SPS coatings, organized as
Table 2.
Real and apparent (substrate and coating respectively, two layers material) thermal diffusivities and thermal conductivities of APS and SPS coatings were obtained from Equations (1), (2), and (4)–(6) ([
15,
17]), taking into account the mean value of calculated variables as for Inconel 601. Computation of coatings thermal characteristics required the thickness information, obtained by the SEM analysis as averaged thickness values. The thermal conductivity evaluation is based on an estimation of the physical properties of the coating (density and specific heat), as already described.
Tests performed on these specimens allowed us to characterize both SPS and APS coatings, once the heat diffusion time (
τ1) of the substrate was calculated (see
Table 2).
All results related to coated specimens (substrate and TBCs) and averaged on all replications are resumed in
Table 4, organized with the same layout of
Table 2 (left side and right side refer, respectively, to ISO18755 Standard [
17] and ISO18555 Standard [
15] approaches).
In particular, respectively, for APS and SPS coated specimens, the following results are shown on the left side of
Table 4: ideal apparent thermal diffusivity values (α
app-ideal), apparent thermal diffusivity values corrected by both Centroid method (α
app-tc) and Cowen Method (α
app-Cowen5 and α
app-Cowen10, respectively, 5 and 10 times the half rise time “
t0.5”).
The right side of the same table shows: ideal apparent thermal diffusivity values (α
app-ideal) of substrate + coatings, ideal thermal diffusivity and conductivity values of coatings (α
2-ideal and k
2-ideal), obtained based on the heat diffusion time of Inconel 601 (
τ1) (see
Table 2).
As already commented for
Table 2, a similar consideration can be stated referring to TBCs results, based on the analysis of
Table 4. In more detail, it can be concluded that obtained thermal parameters values for SPS and APS coatings are comparable to those available in the literature [
3] (
k = 0.6 to 1 W/m °K) as order of magnitude. A great tuning of data is difficult to be reached due to the variability of TBC thickness that strongly influences the obtained values.
5. Conclusions
The results obtained in the present work allow us to draw the following conclusions.
The experimental procedure defined and set up the thermal characterization of industrial TBCs, based on active thermography, provided very good results, comparable to those available in the literature. As wished and hypothesized, this methodology can be thought as a fast and reliable method, alternative to the consolidated one described in International Standards ISO18755 and ISO18555, for which is required dedicated equipment.
The classical active thermography apparatus utilized in this research activity, consisting of a thermal camera and a fast thermal excitation source, was able to measure thermal profiles suitable to be processed and analyzed following the International Standards requirements.
Moreover, the developed technique, together with its processing algorithms, provided a robust method to be easily used in the industrial environment.
From the coatings point of view, it can be conclude that, despite the difficulty in defining samples with quite constant thickness, obtained thermal diffusivity and conductivity values are representative of the actual behavior of TBCs obtained by different production processes. Similar considerations may be drawn for base materials characterization.
Finally, particularly for concerns of the present industrial application, it can be concluded that SPS and APS coatings show similar thermal behavior and the choice to employ one of these can be left to production and business choices.


