Article

Ultrasonic Characterization of Nanoparticle-Based Ceramics Fabricated by Spark-Plasma Sintering

1
Institute of Thermomechanics, Czech Academy of Sciences, Dolejškova 5, 182 00 Prague 8, Czech Republic
2
Faculty of Mathematics and Physics, Charles University, Ke Karlovu 5, 121 16 Prague 2, Czech Republic
3
Department of Mechanical and Materials Engineering, Florida International University, Miami, FL 33174, USA
*
Author to whom correspondence should be addressed.
Ceramics 2021, 4(2), 135-147; https://doi.org/10.3390/ceramics4020012
Submission received: 11 December 2020 / Revised: 7 March 2021 / Accepted: 18 March 2021 / Published: 29 March 2021
(This article belongs to the Special Issue Spark Plasma Sintering Technology)

Abstract

:
Resonant ultrasound spectroscopy was used to determine elastic constants and internal friction parameters of bulk nanoparticle-based ceramic materials compacted by spark plasma sintering. Boron nitride-based and boron carbon nitride-based materials were studied, and the results were compared with similar bulk materials prepared from graphene nanoplatelets. The results showed that such nanoparticle-based materials can be strongly anisotropic, and can have very different elastic constants depending on the nanoparticles used. From the temperature dependence of the internal friction parameters, the activation energy for sliding of the individual monolayers along each other was determined for each material. Very similar values of the activation energy were obtained for boron nitride, boron carbon nitride, and graphene, ranging from 15 to 17 kJ/mol.

1. Introduction

Nanoparticles of two-dimensional (2D) materials are often used as fillers in advanced ceramic-matrix composites prepared by spark-plasma sintering (SPS, [1,2,3]). In particular, graphene-based particles [4,5,6] increase the fracture toughness of the ceramic, mainly by crack bridging and crack energy dissipation due to particle pull-out, but they may also significantly improve electric and heat conductivity of the composite [7,8,9], as well as its tribologic performance [10] or machinability [11]. Among other two-dimensional (2D) materials, boron nitride (BN, [12,13,14,15]) can be utilized, having a similar impact on fracture toughness, machinability and tribologic performance, but without affecting the transport properties.
If the 2D materials are used in form of flat nanoparticles (nanoplatelets, nanoflakes), they tend to arrange dominantly along the planes perpendicular to the SPS compression axis, which leads to anisotropization of the resulting composite, both in its transport properties and its mechanical response, including the elastic constants [16]. The 2D materials exhibit an extraordinarily high in-plane elastic stiffness, ranging up to 1 TPa for graphene and boron-nitride monolayers [17,18]. However, in the composites the nanoplatelets are typically folded between the ceramic grains, so this high in-plane modulus does not contribute to the macro-scale elastic response [16,19]. Instead, the anisotropic elastic constants of the composite can be closely approximated by elastic constants of the matrix material with oriented spheroidal voids [20]. The elastic behavior of the nanoparticles themselves is, thus, hard to assess, as they are just very weakly reflected by the measurable properties of the composites. Nevertheless, this behavior is important for understanding the micromechanics of the composites and calls for a dedicated experimental analysis.
A possible approach to assessing elastic properties of the fillers is by preparing bulk SPSed materials composed of the fillers only [21,22]. In such materials, one can expect the fillers to be folded and anchored in a similar way as between the ceramic grains in the composite material. Hence, the macroscale properties of such compacts can be assumed as good approximations of individual particles or their small agglomerates inside the ceramic matrix. The stiffness of the bulk material is then dominantly given by the properties of the individual particles, their spatial arrangement, and the elastic stiffness of the bondings between them.
In [23], we used ultrasonic wave propagation and resonant ultrasound spectroscopy to determine the elastic constants and acoustic attenuation parameters of pure graphene nanoplatelets (GNPs) consolidated by SPS. The results revealed extremely strong anisotropy of the properties, although the in-plane elastic stiffness of the compact was by two orders of magnitude smaller than what expected for a graphene monolayer. This confirmed that the in-plane extensions and contractions of the bulk material were mainly due to unfolding or mutual sliding of the platelets, i.e., the same mechanisms as assumed for a nanoparticle inside a ceramic matrix, not by the in-plane elastic straining of graphene itself. The much lower elastic modulus in the out-of-plane direction results from the week van der Waals bonds between the monolayers and additional softening due to oriented porosity. In this paper, we adopt a similar approach for two other types of nanofillers: boron-nitride nanosheets (BNNS), and boron carbon nitride (BCN) nanoparticles that are synthetized during the sintering from a mixture of GNP and BNNS. Bulk SPSed ceramic materials fabricated from these particles are studied using ultrasonic methods with the aim to determine their effective elastic constants.
In addition, we focus also on the internal friction in these materials. As shown in [16], the presence of the fillers strongly affects the shear internal friction parameters of the composite. Mutual sliding of the individual layers of the 2D materials along each other and the accordion-like folding are strongly dissipative processes; this means that the particles may serve as absorbers of the mechanical energy. An important parameter for the internal friction is the activation energy, which is the energy needed for triggering a thermally activated dissipative process. As shown by [24,25], the internal friction in graphene sheets is exponentially increasing with temperature, which indicates that it is a thermally activated process, as also discussed in [26]. Here we measure the temperature dependence of the internal friction of BNNS- and BCN-based materials and compare the results with those obtained for the GNP-based material. By these experiments, we show that the internal friction mechanism has a very similar activation energy in all studied materials, i.e., not dependent on the used nano-particles, and not correlated with the macro-scale elastic constants.

2. Theoretical Background

Resonant ultrasound spectroscopy (RUS, [27,28,29]) is an experimental method capable of accurate determination of elastic constants of anisotropic solids. The method is based on measuring resonant spectra of free elastic vibrations of a small prismatic sample of the examined material. The resonant frequencies and the elastic constants are related to each other in a non-trivial way; one has to use a numerical model of elastic vibrations to calculate the resonant frequency of the n th vibrational mode f n cal ( d i , ρ , c i j * ) for the given dimensions of the sample d i = 1 , 2 , 3 , given mass density ρ , and some guesses of the elastic constants c i j * . Then, for resonant frequencies f n exp of N modes ( n = 1 , , N ) taken from the experiment, the elastic constants are determined by minimizing an objective function
F ( c i j * ) = n = 1 N f n cal ( d i , ρ , c i j * ) f n exp 2 min ,
where the correct pairing between the experimental and calculated modes is ensured either by recording the modal shapes by a scanning laser vibrometer [30] or by machine learning-based algorithms [31]. The method enables, in principle, all 21 independent elastic constants of a generally anisotropic material to be determined; if the material exhibits a certain class of symmetry, the number of sought parameters is reduced, and the objective function (1) is simplified.
As first discussed by Sumino et al. [32], the resonant spectra from RUS measurements can be utilized for determining the internal friction parameters of the examined material. The quality factor Q of the individual resonant peak is given by the full width at half-maximum of the peak (denoted hereafter as FWHM ) as
Q = f FWHM ,
where f is the resonant frequency. Typically, if there is a single (or dominant) internal friction mechanism in the examined sample, and if this mechanism is related with some soft shearing mode of the material, the Q factors of the lowest resonant peaks are approximately the same and are given by energy dissipation through this internal friction mechanism, as the dissipation leads to broadening of the peak. The internal friction in the materials can be then expressed by a single scalar parameter Q 1 [33].
For the examined nanoparticle-based materials, we can assume that there is a particularly soft shearing mechanism associated with sliding of the monolayers along each other (cf. [17]), and that this sliding is also the main source of energy dissipation in the vibrating sample. In the individual materials, the respective values of Q 1 depend of the number of platelets sliding along each other, the sliding area, the sliding amplitudes, and the height of the energy barrier against the sliding, where the later is characterized by the activation energy U.
According to the theory of relaxation damping [33], the Q 1 parameter for any thermally activated internal friction mechanism can be expressed as
Q 1 ( T ) = Q 0 1 exp U R T ,
where Q 0 1 is a constant (representing the density and strength of dissipation sources in the material), U is the activation energy for the mechanism, and R is the molar gas constant. Hence, the activation energy can be calculated by linear regression of an experimentally obtained plot of log ( Q 1 ) versus T 1 , where the effect of Q 0 1 is separated from the temperature-dependent part. The activation energy is then a well-defined physical parameter, representing the resistance of the monolayers against sliding; this parameter will allow us to compare the sliding mechanisms in the individual materials.
Alternatively to RUS, the elastic constants as well as the internal friction parameters can be assessed also using ultrasonic methods based on propagating waves [23,34,35]. For porous materials, however, the propagating waves experience additional attenuation due to scattering at the pores, and the scattering losses may also affect the measured elastic constants [33]. As shown in [23], these effects can be considerably strong in the bulk nanoparticle-based materials, where pores are strongly anisotropic due to the preferred orientation of the flat particles. In contrast, the RUS method can be reliably applied to porous materials [36,37,38], as its results are not affected by the scattering at all. High quality of the peaks (i.e., small internal friction coefficients Q 1 ) can be achieved even in cellular materials with open porosity above 50% [39], provided that there is no energy dissipating mechanism in the material (cf. also [40]). Hence, the effect of porosity in RUS measurements is restricted only to the decrease of the elastic constants due to the presence of the pores. A material including highly oriented flat pores is expected to become elastically very soft against tensile loading in direction perpendicular to the pores. In the examined nanoparticle-based materials we can expect the porosity to lower significantly the Young’s modulus in direction parallel to the SPS compression axis. Together with the already strong elastic anisotropy of the individual platelets (strong covalent bonds in the in-plane directions versus weak van der Waals bonds in the out-of-plane directions), this leads to the extreme anisotropy of the studied materials.

3. Materials and Methods

3.1. Examined Materials

Three bulk nanoparticle-based materials were studied: bulk boron nitride nanosheets, bulk boron-carbon nitride, and bulk graphene nanoplatelets. We will henceforth use the denotation BNNS-material, BCN-material and GNP-material for them, respectively. True densities of all used powders as well as of the bulk materials were determined using a Helium pycnometer; the densities of bulk materials were then confirmed by Archimedes method.
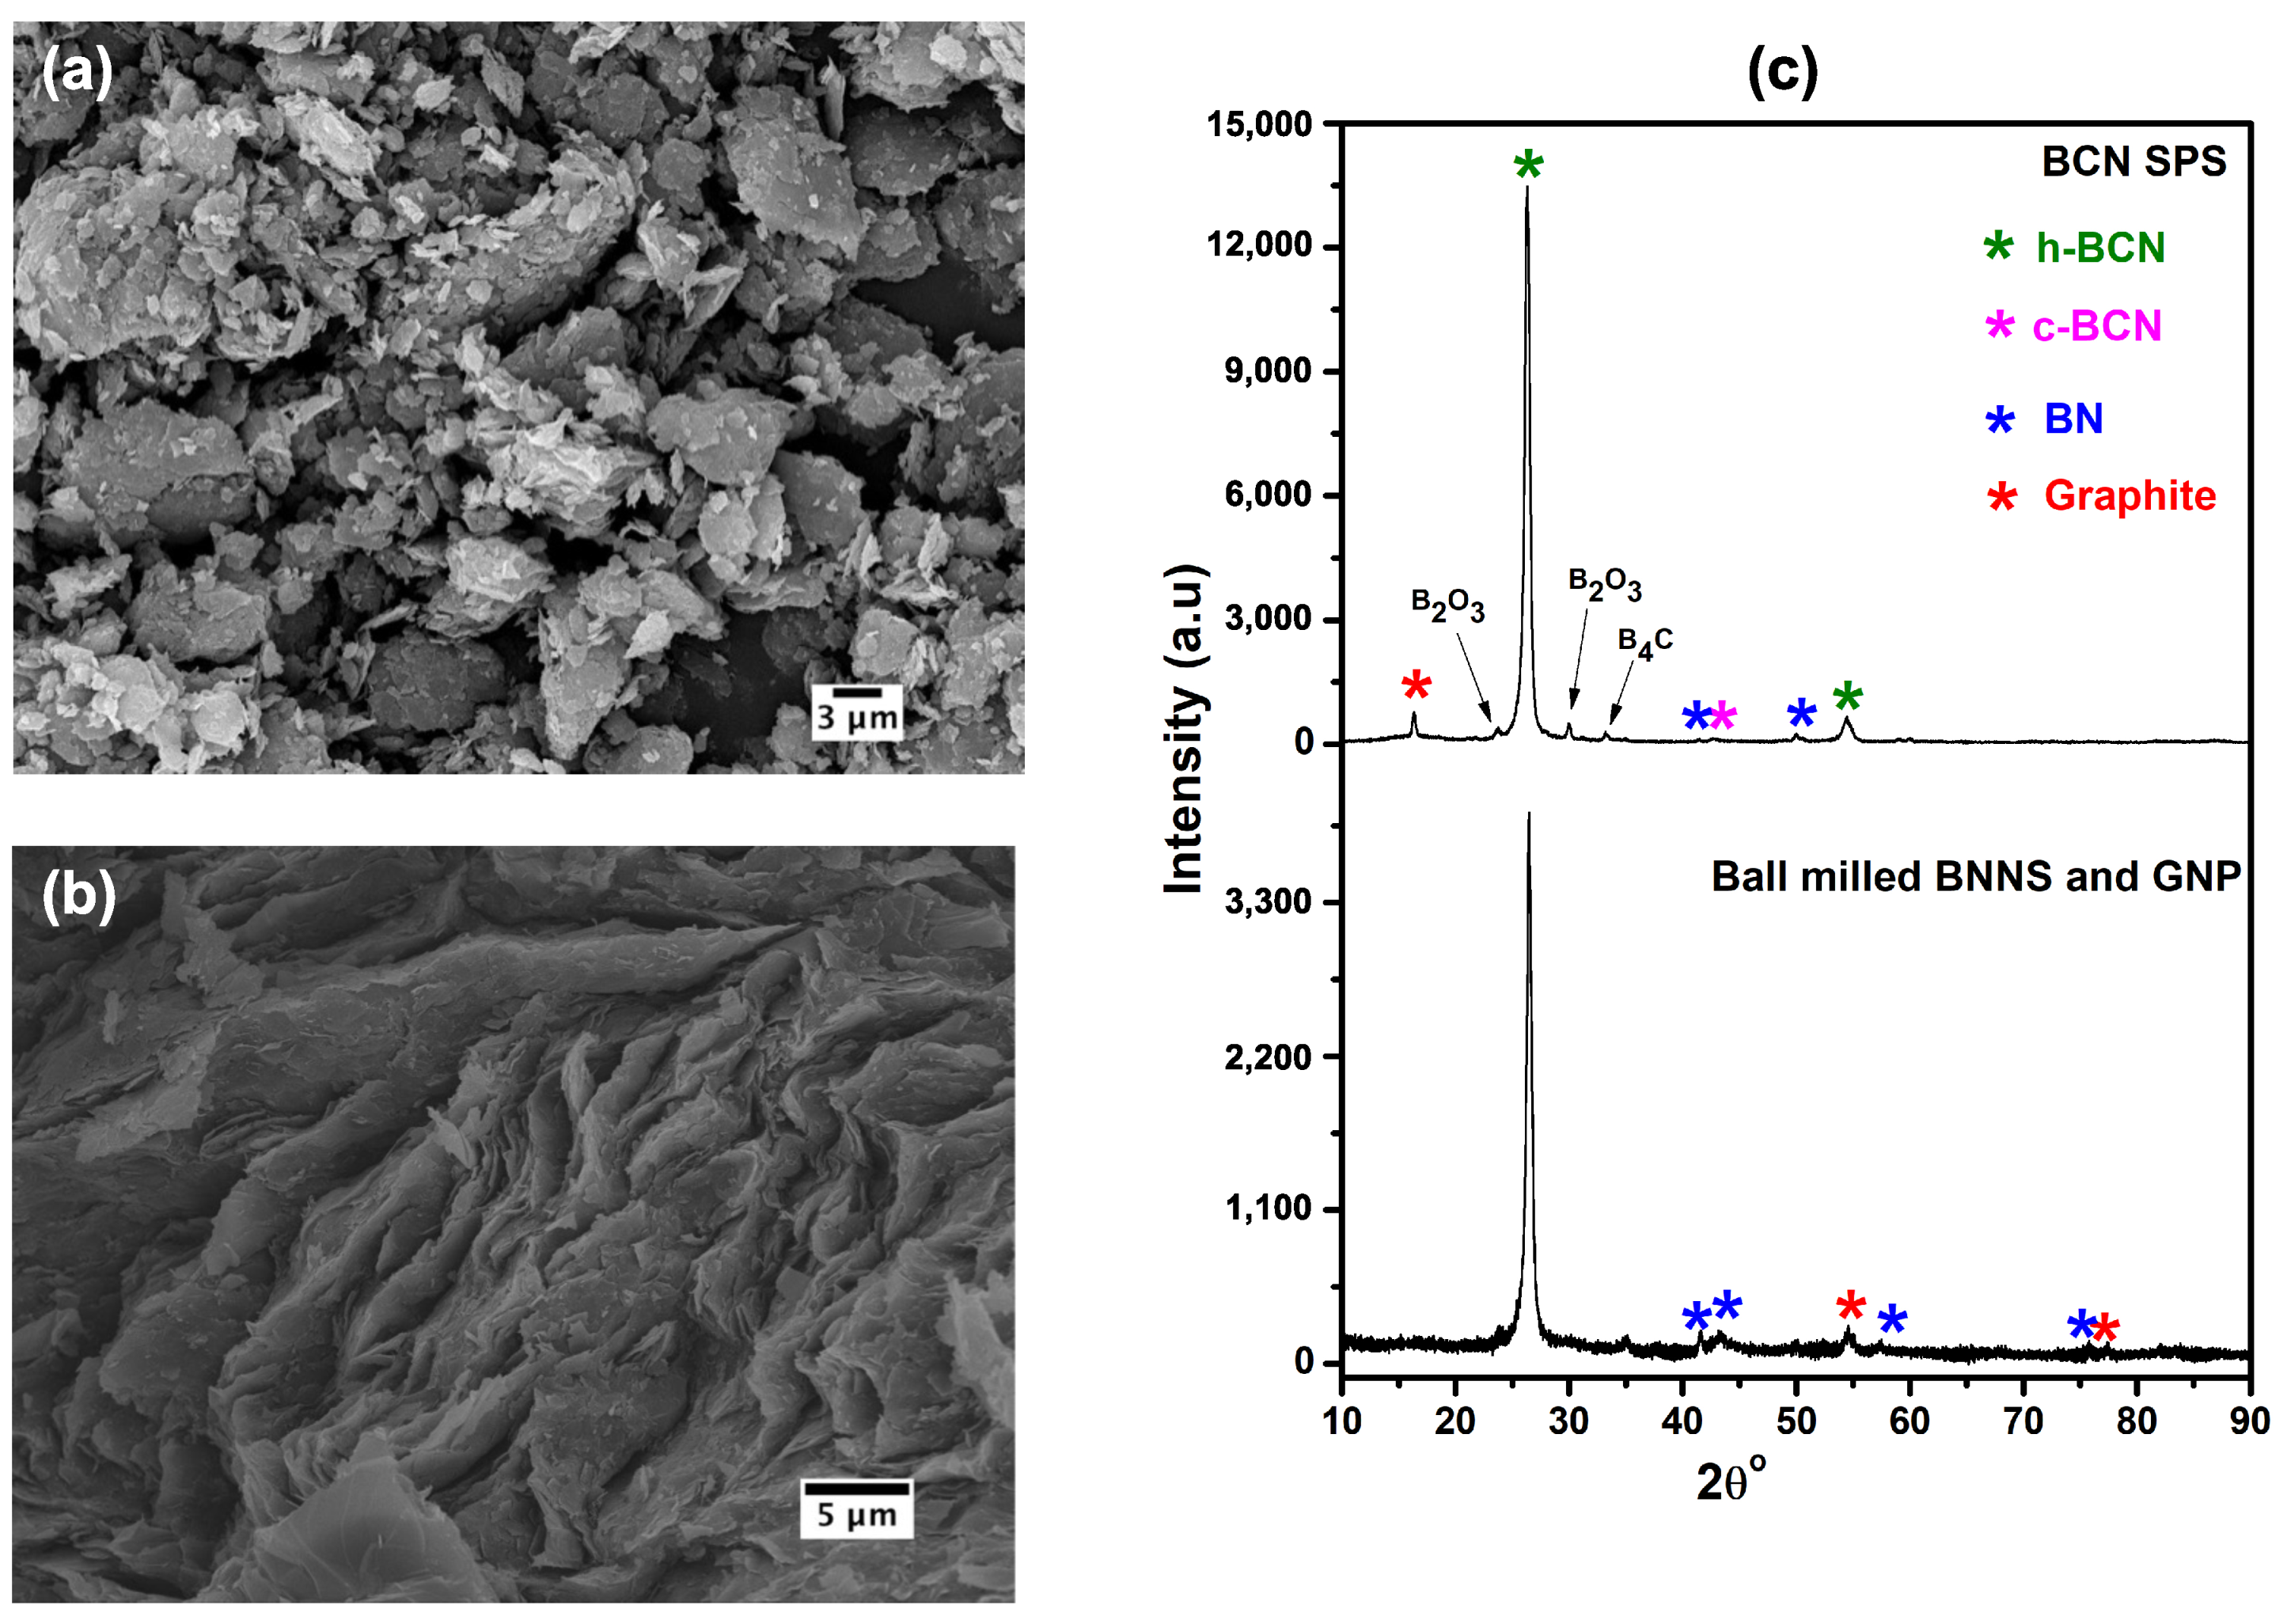
For the BNNS-material, the SPS processing parameters as well as the main properties of the resulting compact can be in detail found in [22], here, we bring just a brief summary: The BN nanosheets (particle size from 100 nm to 3 μ m, thickness 40 to 60 nm, see Figure 1a) were consolidated at 1650 C for 20 min at the heating rate of 100 C/min with the pressure of 50 MPa. Figure 1b displays the preferential orientation of BN nanosheets in the bulk form. The resulting anisotropy was confirmed by nanonidentation on the top surface and on a cross-section, respectively. These measurements showed that the reduced elastic modulus along the SPS compression direction (∼30 GPa) was significantly lower than in the perpendicular direction (∼40 GPa). The measured true density of the initial powder was 2.72 g/cm 3 , and the resulting density of the compact was 2.53 g/cm 3 (i.e.,∼8% porosity, see [22] for more details). Let us note that the true density of both the powder and the compact were higher than the theoretical density of pure hexagonal boron nitride (h-BN) due to the impurity contents, primarily the carbon and oxygen. The X-ray diffraction (XRD) results display the presence of B 4 C phase in the as-received powders, and B 2 O 3 and B 4 C phases in the sintered compact, as shown in Figure 1c.
The BCN-material was prepared from a mixture of BN nanosheets (the same parameters as above) and GNPs (particle size 3 to 15 μ m, thickness of 6 to 8 nm). The mixture was homogenized by ball milling for 30 min (the resulting powder is shown in Figure 2a). Then, the material was compacted using SPS (1750 C for 20 min at the heating rate of 100 C/min with pressure of 50 MPa) which resulted in a reaction synthesis of BNNS and GNPs leading to formation of BCN. X-ray diffraction was used to confirm that the reaction was accomplished. As seen from the results (Figure 2c), the final compacted material consisted mainly of the hexagonal BCN (h-BCN) phase, with some small amounts of cubic BCN (c-BCN), B 4 C, B 2 O 3 and graphite. Local variations of the preferred orientation of the particles were observed, as seen in Figure 2b. However, the nano-indentation tests gave the reduced elastic modulus along the SPS compression axis as E R SPS = ( 17.13 ± 1.60 ) GPa and E R perp = ( 22.73 ± 2.93 ) GPa in the perpendicular direction, i.e., the ratio E R perp / E R SPS was exactly the same as for the BNNS-material. Measured true density of the mixed powder was 2.38 g/cm 3 , and the resulting density of the compact was 2.25 g/cm 3 . Assuming the theoretical density of pure h-BCN equal to 2.45 g/cm 3 [41], this resulting density of the compact indicates the porosity of approximately 8 %.
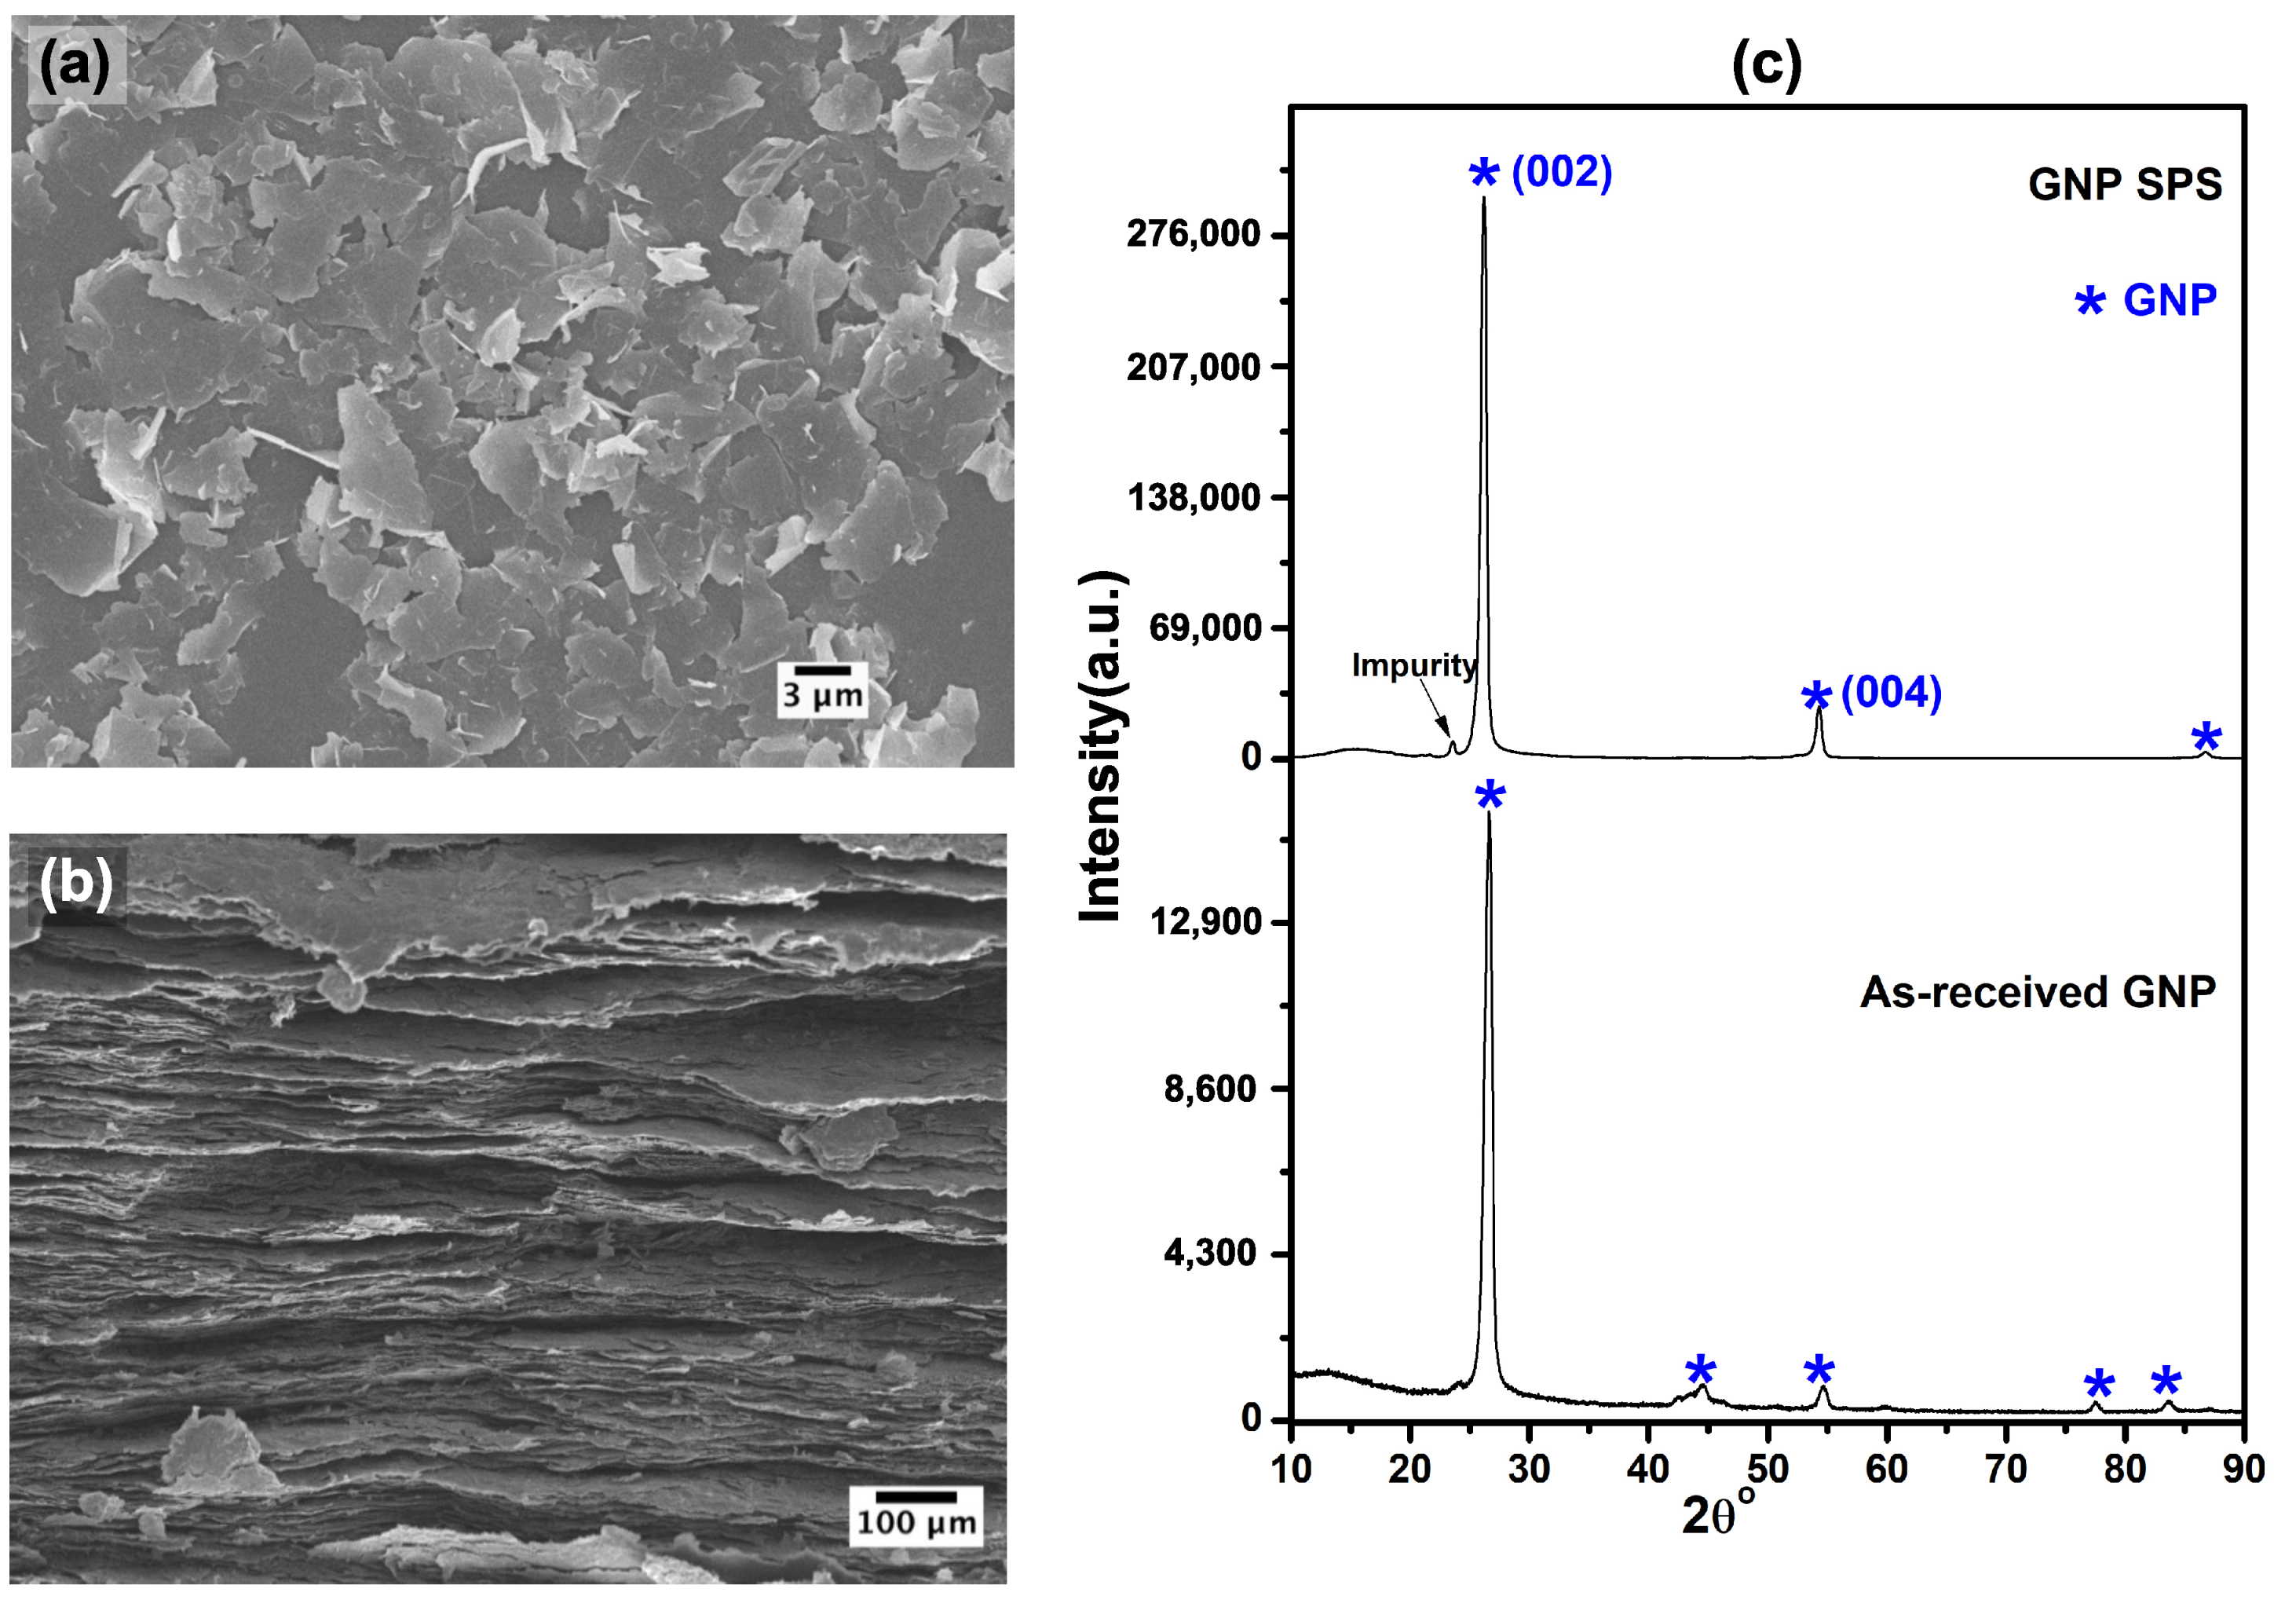
The fabrication and properties of the GNP-material were in detail described in our previous works [21,23]. Similarly as for the BNNS-material, we present only the main parameters here: The GNPs of average diameter 15 μ m and average thickness 6 nm, as shown in Figure 3a, were compacted using a holding pressure of 80 MPa, a temperature of 1850 C, and a hold time of 10 min. The density of the resulting compact was 2.11 g/cm 3 (∼7% porosity), and the GNPs inside the compact had a strongly preferred orientation (Figure 3b), which was confirmed both by nano-indentation measurements [21] and the elastic constants [23].
To quantify the degree of orientation of the particles in all materials and the effect of SPS sintering on it, the Lotgering orientation factor L ( 00 l ) was evaluated from the XDR data for both the initial powders and the bulk materials. This factor is defined as [42,43]
L ( 00 l ) = P P 0 1 P 0 ,
where
P = I ( 00 l ) I ( h k l )
is the ratio between the sum of peak intensities for ( 00 l ) planes ( ( 002 ) and ( 004 ) were taken for the calculation) and the sum of all intensities from the experimental spectrum. P 0 is the same ratio for a completely randomly oriented material; the values of P 0 for all materials were taken from standard JCPDS files.
The results are tabulated in Table 1. It is seen that all materials exhibited a high level of orientation already in the initial powders, and the orientation factor was further increased by the sintering. Notice that the Lotgering factor for the BCN-material was approximately the same as for the BNNS- and GNP-material, despite of local variations of BCN-particles orientation observed on the fracture surface. This is in a good agreement with the above mentioned nano-indentation results, as well as with the elastic constants reported in Section 4.2, which both confirmed strong anisotropy of the BCN-material.
For all materials, samples of dimensions approximately 3 × 2 × 1 mm 3 were cut from the central part of the SPS pellet. The 2 mm-long edge was always oriented along the SPS compression axis. The largest face of the sample was always sputtered by approximately 30 nm of aluminum to make it laser-reflective.

3.2. Ultrasonic Measurements

The elastic constants and internal friction parameters of the examined materials were determined using RUS. We used a laser-based contactless arrangement of RUS [29], utilizing laser beams for both generation and detection of the vibrations. The experiments were performed in a temperature chamber and under low-pressure (20 mbar) nitrogen atmosphere. The RUS spectra were recorded in the frequency range 10 kHz–1 MHz.
Firstly, the temperature was set to 22.0 C (control accuracy ±0.05 C) and the RUS vibrational spectrum of the sample was recorded in a 20×20 mesh of points covering the largest face of the sample, which enabled an identification of more than 30 resonant peaks for each sample. By using the inverse numerical procedure described in detail in [29], the resonant frequencies and the corresponding modal shapes were utilized for determination of all elastic constants of the materials. Note that these room-temperature measurements were performed only for the BNNS- and BCN-materials, as the room-temperature elastic constants of the GNP-material were already known previously [23]. For all examined materials, we assumed a transversely isotropic elastic behavior, i.e., a behavior invariant with respect to rotation about the SPS-compression axis, which follows well both the symmetry of the processing and the observed arrangement of the particles in the BNNS- and GNP-materials. Under such rotational invariance, the elastic behavior can be fully described by five independent elastic constants. In a Cartesian coordinate system with the x 3 axis lying along the SPS-compression axis, these elastic constants are c 11 , c 12 , c 13 , c 33 , and c 44 . The other non-zero elastic constants are c 22 = c 11 , c 23 = c 13 , c 55 = c 44 , and c 66 = ( c 11 c 12 ) / 2 . These elastic constants also enable the elastic modulus (Young’s modulus) to be calculated in any direction between x 3 and the x 1 x 2 -plane [16], which we will use for the graphical representation of the constants in the next section.
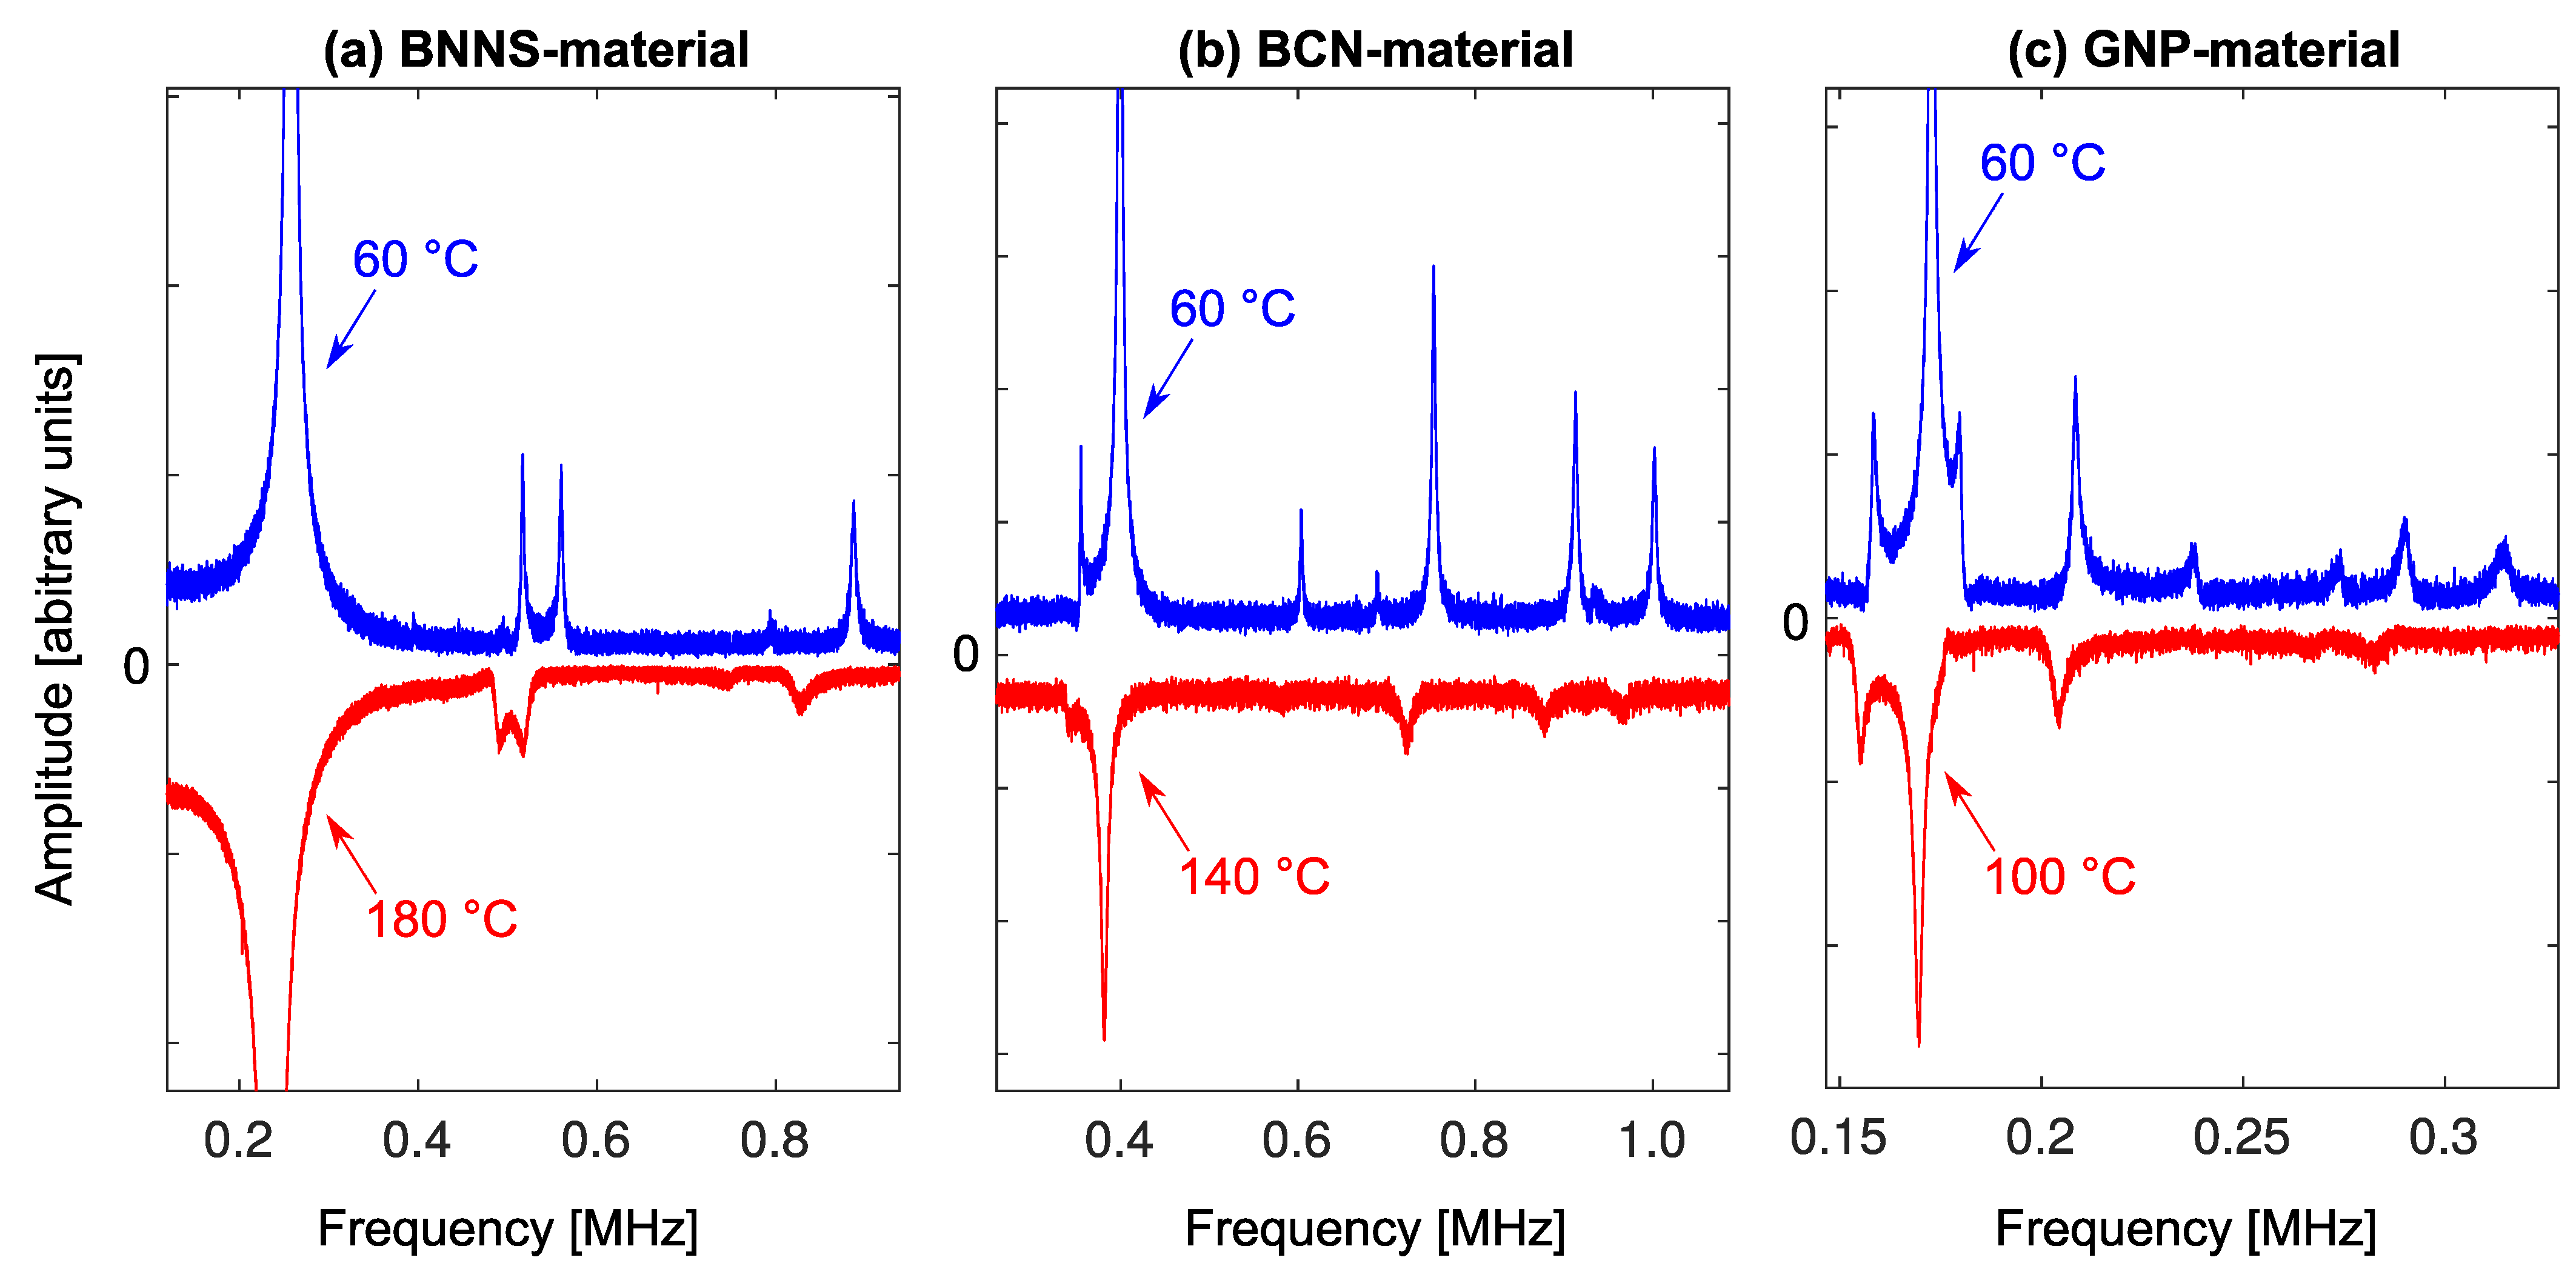
Secondly, the RUS spectra were recorded at elevated temperatures in order to analyze the temperature-dependence of the internal friction. In these temperature-resolved measurements, the vibrational response of the sample was recorded only in a single point (i.e., without scanning). This was completely sufficient for the internal friction analysis, where the shapes of the peaks were analyzed. The first measurement was done at 60 C, and the temperature was subsequently increased with a 20 C step (±0.1 C temperature stabilization) and series of RUS spectra were recorded. A rapid increase of the widths of the resonant peaks (indicating increase of the internal friction, as explained below) with increasing temperature was observed. The experiment was terminated when the internal friction was so strong that it was impossible to identify more than five resonant modes. For the BNNS-material, this threshold was reached above T max = 180 C, for the BCN-material above T max = 140 C and for the GNP-material above T max = 100 C. The comparison of the single-point RUS spectra at 60 C and at T max for all materials is given in Figure 4. It is seen that with the increasing temperature the peaks are shifting to lower frequencies, which means elastic softening of the material, and also the peaks are getting broader, neighboring peaks are merging, and the signal-to-noise ratio is decreasing.
For each temperature, the recorded RUS spectrum was processed as follows. All clearly detectable peaks were fitted by Lorenzian masks [16], which enabled separation of overlapping and merging peaks. Using this fit, the FWHM parameter was determined for each peak, and the corresponding quality factor Q was calculated using the Formula (2). For each material, three most clearly detectable resonant modes were chosen, and the evolution Q 1 ( T ) for these modes was determined from the temperature evolution of the spectrum.
By this approach, the energies U were determined for all examined materials. The most reliable fit was obtained for the BNNS-material, where 8 points were available for the regression (from one room-temperature spectrum and seven spectra at elevated temperatures); the least reliable fit was obtained for the GNP-material.

4. Results and Discussion

4.1. Elastic Constants

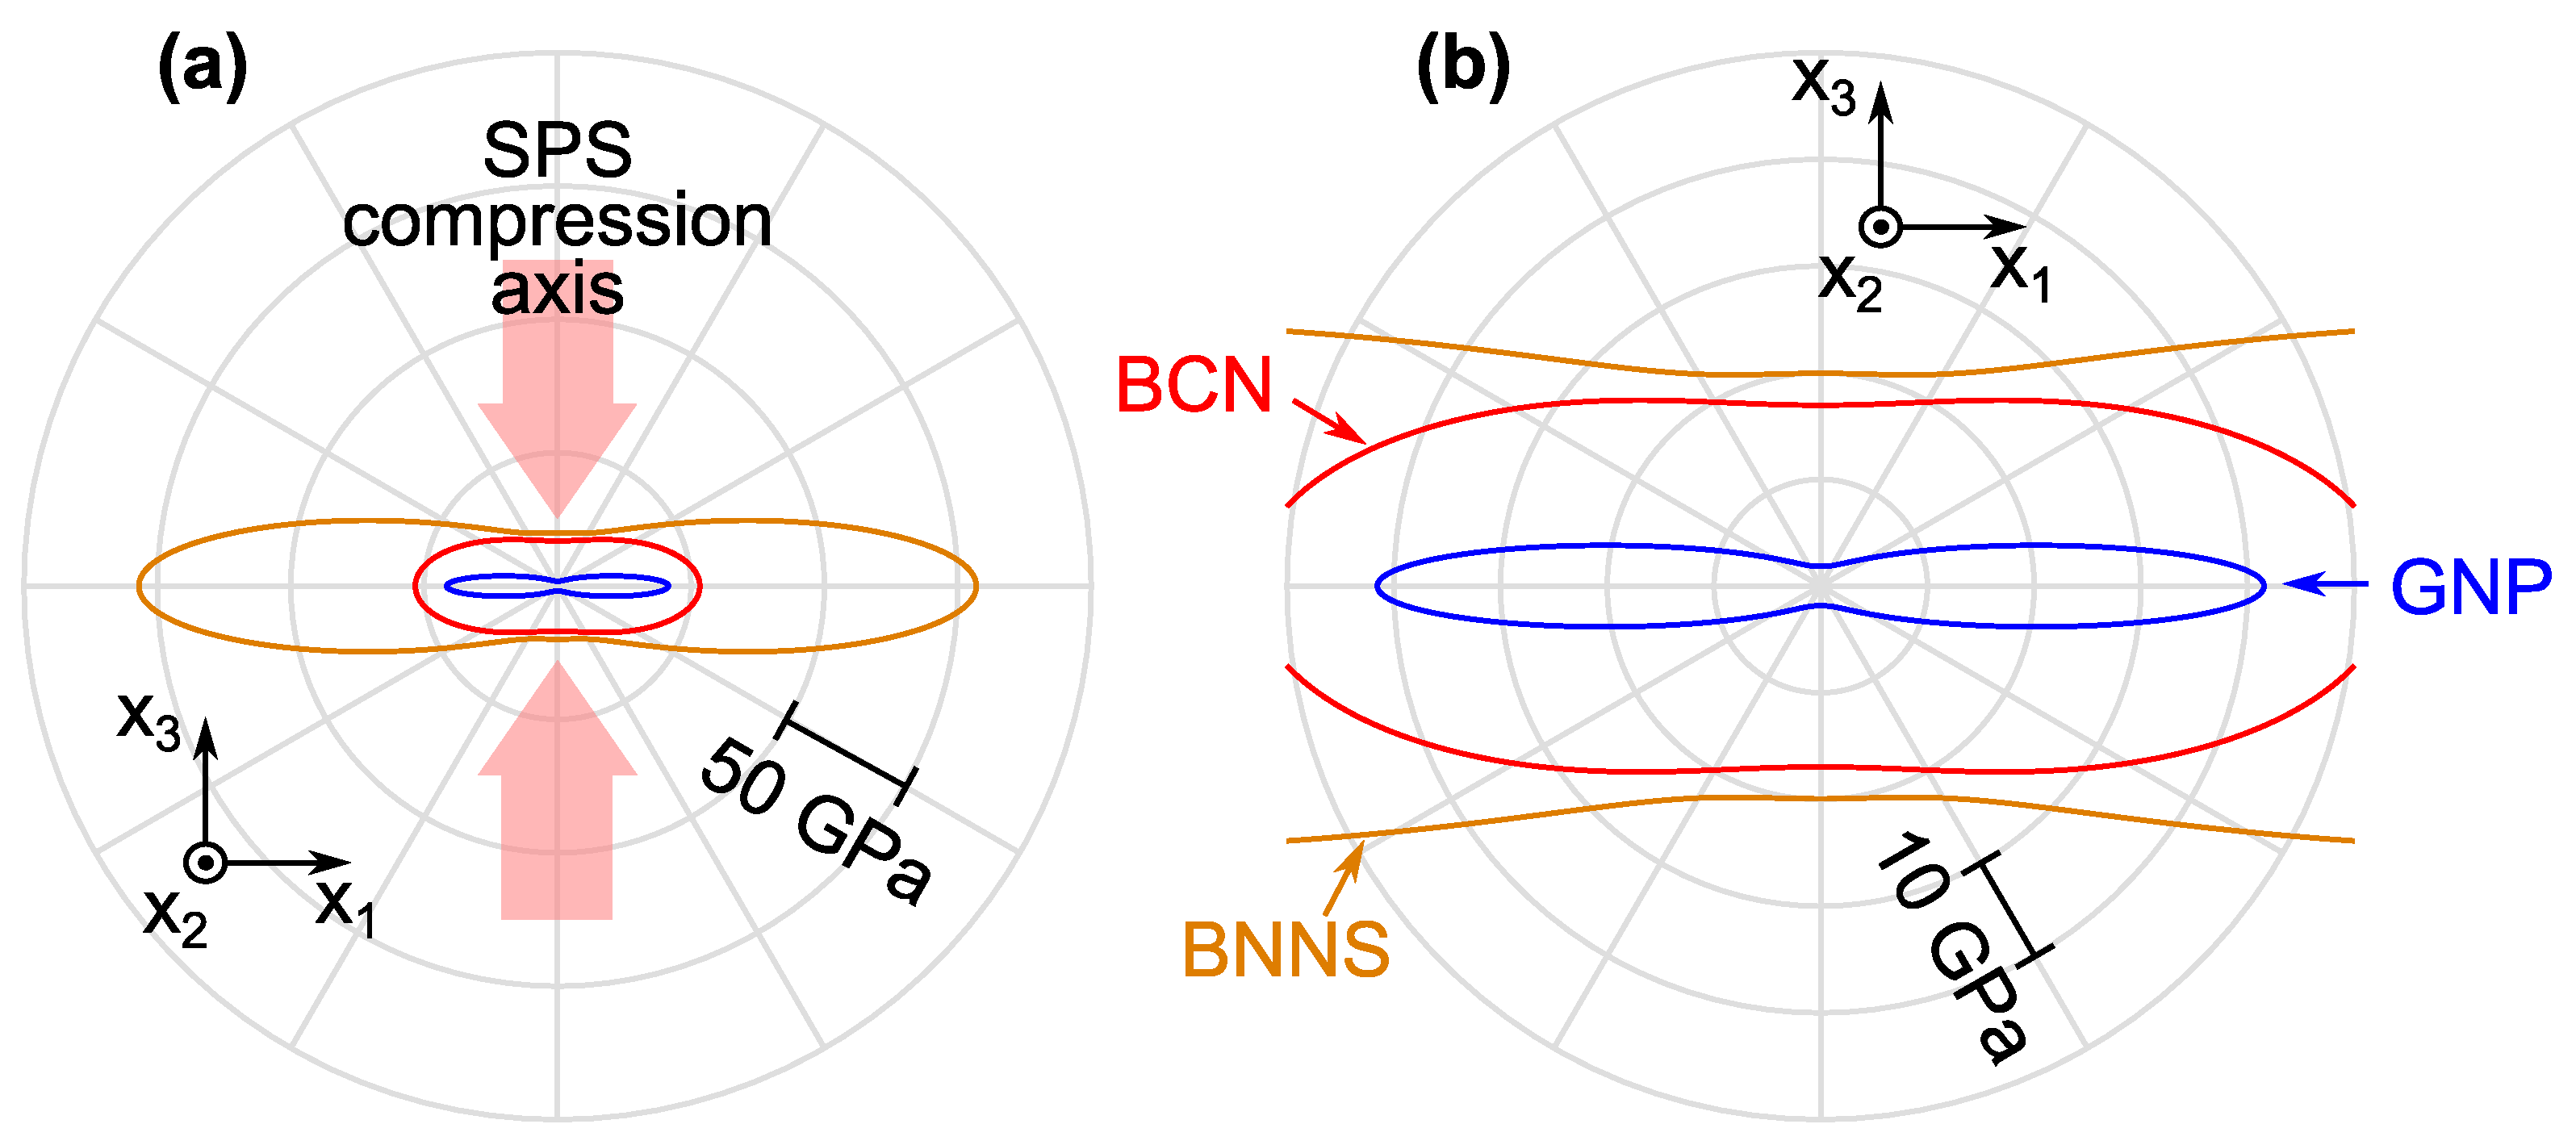
The elastic constants of all examined materials are listed in Table 2 (for the GNP-material, the results are from [23]). It is seen that all materials exhibit some level of elastic anisotropy, with the longitudinal modulus along the SPS-compression axis ( c 33 ) being always significantly softer than the in-plane longitudinal modulus ( c 11 ). A similarly strong difference is observed between the soft shearing coefficient ( c 44 ) corresponding to the sliding of the layers along each other, and the hard shearing coefficient ( c 66 ) corresponding to the shear deformation of the layers with an in-plane shearing vector. There are, however, also very strong differences between the elastic constants of the individual materials in general. These differences are visualized in Figure 5 by plots of the directional dependence of Young’s moduli. It is clearly seen that the in-plane moduli are the highest for all materials, but while this modulus reaches above 150 GPa for the BNNS-material, it is below 50 GPa for the GNP-material. The strongest anisotropy is observed for the GNP-material and the weakest for the BCN-material. This agrees well with the fact that, although the L ( 00 l ) factor for this material is quite close to 1, the fracture surface for the BCN-material reveals significant deviations of the orientation of the particles. Nevertheless, this material is still quite strongly anisotropic, having the in-plane Young’s modulus more than three times higher than the out-of-plane modulus. The elastic stiffness of the BCN-material appears to be in general between the elastic stiffness of the BNNS-material and the GNP-material, as if the BCN-material was just a mixture of these two. This is rather unexpected, because the X-ray diffraction analysis confirmed a nearly complete synthesis of GNP and BNNS into the hexagonal (dominantly) and cubic BCN phases, plus some additional chemical compounds. However, as the hexagonal boron nitride and graphene have very similar lattice parameters, and also several other properties of these 2D materials are quite similar, one can expect the mechanical properties of the hexagonal BCN 2D material to be some combination of the properties of BN and graphene. This is probably also reflected in the bulk material.
The observed differences between the elastic constants of the individual materials can be ascribed to the different bonding quality in the compacts, which may result either from the chosen SPS processing conditions, or from the properties of the used nanoparticle powders. As shown in [18], the in-plane elastic modulus of a multi-layer boron nitride does not significantly decrease with increasing number of layers, as it does for multi-layer graphene. Hence, one can expect the BNNS material to be much stiffer than the GNP-material, which is in a perfect agreement with our results.
Notice also that the mass densities of all materials were very similar, ranging from 2.11 to 2.55 g/cm 3 , which means that the strikingly different elastic moduli cannot be ascribed to different porosity. The specific elastic moduli ( E / ρ , where E is Young’s modulus and ρ is the mass density) are indeed significantly higher for the BNNS-material than for the GNP-material. For the out-of-plane modulus, i.e., the modulus along the SPS compression axis, this difference is of an order of magnitude.

4.2. Internal Friction

By utilizing the Equation (3), the activation energies for temperature-activated internal friction in the studied materials were determined. Figure 6 shows the linear fit for the dominant RUS frequency for each material. It is seen that for all materials the log ( Q 1 ( T ) ) dependence exhibits a clear linear trend with 1 / T . The resulting values of the activation energy are listed in Table 3, together with the average coefficient of determination R 2 for each material. For all materials, the activation energy falls between 14 kJ/mol and 19 kJ/mol (taking into account the error ranges), with a relatively small experimental scatter and with R 2 very close to 1. There are some differences between the R 2 coefficients for different materials, the same is seen for the scatter in U, but this is obviously given mainly by the different number of the used temperature points and different lengths of the used temperature intervals. For the GNP-material, where just four points are used for each fit, the average coefficient of determination is the highest (i.e., the individual fits agree most accurately with the experimental data), but the scatter between the fits for different modes is the largest.
It is rather surprising that, despite of the strongly different elastic coefficients, the activation energies are very similar for all materials. This may indicate that the main source of the internal friction may be the same for all these materials. Most plausibly, this mechanism is the sliding of the individual layers of the 2D materials along each other. The value U 16 kJ/mol is remarkably low, nearly by an order of magnitude lower than in bulk graphite [44], or graphite-reinforced metal-matrix composites [45]. For graphene and hexagonal boron nitride, the available literature data on friction are mostly from molecular-dynamics calculations [18,26,46], and do not include any estimates of the activation energy. Nevertheless, as shown in [18], the sliding energy per unit cell is very similar for stress-free graphene and stress-free boron nitride, which is in agreement with our observation.

5. Conclusions

The results reported in this work show how the RUS method can be utilized for a characterization of nanoparticles used as fillers in ceramic-matrix composites. For such characterization, the nanoparticles need to be compacted into bulk materials, which was done here using SPS. The nanoparticle-based ceramics reflect, to some extent, the properties of the used 2D materials, but are also strongly influenced by the spatial arrangement of the nanoparticles, the bonding quality, etc.. Hence, the mechanical response of these materials can be assumed as a good approximation of the behavior of the fillers inside a ceramic-matrix composite.
Three materials examined within this study exhibited very different elastic properties. As expected, a very strong elastic anisotropy was observed for materials with a pronounced preferential orientation of the particles. The BNNS-based material was shown to be much elastically stiffer than the GNP-based material, although the elastic constants of BN and graphene monolayers can be assumed as approximately the same. We explained this difference by the fact that the elastic moduli of graphene decrease quite rapidly with the number of layers, which is not the case for boron nitride. The BCN-material behaved effectively as a mixture of BNNS- and GNP-materials, but with a weaker elastic anisotropy.
Regarding the internal friction, all materials exhibited very similar temperature dependences of the Q 1 factors. This means that the activation energy for the dominant internal friction mechanism in all materials was approximately the same, despite of the very different elastic constants. A very low value of the activation energy ( U 16 kJ/mol) was determined. This may indicate an easy sliding of the layers of the 2D materials along each other, which is probably also the main internal friction mechanism in the ceramic-matrix composites (cf. [16]).
The main aim of this paper was to determine the elastic constants and internal friction parameters of particles of 2D materials under similar conditions as when the particles are used in ceramic-matrix composites as fillers. To some extent, the same behavior can be expected also in metal-matrix composites and polymer-matrix composites. In these materials, however, it must be taken into account that the elastic constants of the matrix are usually much softer than for the ceramics, and may even become comparable to the elastic constants of the particles. As a result, the matrix-void approximation [20] may not be valid, and the elasticity of the particles may, indeed, actively contribute to the macro-scale mechanical response of the composite. Similarly, the internal friction in metals or polymers can be much higher than for the ceramics, and thus, the sliding of the layers inside the particles may become just a very marginal component of the macro-scale energy dissipation.

Author Contributions

Conceptualization, H.S., P.S. and A.A.; investigation, M.J., M.K., A.L.; resources, A.A.; data curation, M.J. and K.S.; writing—original draft preparation, H.S. and K.S.; writing—review and editing, K.S. and A.A. All authors have read and agreed to the published version of the manuscript.

Funding

This work was financially supported by the Czech Science Foundation (project No.20-12624S). K.S. acknowledges financial support by ERDF under the project no. CZ.02.1.01/0.0/0.0/ 15003/0000485.

Data Availability Statement

Data is contained within the article.

Conflicts of Interest

The authors declare no conflict of interest.

References

  1. Biesuz, M.; Saunders, T.; Ke, D.; Reece, M.J.; Hu, C.; Grasso, S. A review of electromagnetic processing of materials (EPM): Heating, sintering, joining and forming. J. Mater. Sci. Technol. 2021, 69, 239–272. [Google Scholar] [CrossRef]
  2. Biesuz, M.; Grasso, S.; Sglavo, V.M. What’s new in ceramics sintering? A short report on the latest trends and future prospects. Curr. Opin. Solid State Mater. Sci. 2020, 24, 100868. [Google Scholar] [CrossRef]
  3. Munir, Z.A.; Anselmi-Tamburini, U.; Ohyanagi, M. The effect of electric field and pressure on the synthesis and consolidation of materials: A review of the spark plasma sintering method. J. Mater. Sci. 2006, 41, 763–777. [Google Scholar] [CrossRef]
  4. Viswanathan, V.; Laha, T.; Balani, K.; Agarwal, A.; Seal, S. Challenges and advances in nanocomposite processing techniques. Mater. Sci. Eng. R Rep. 2006, 54, 121–285. [Google Scholar] [CrossRef]
  5. Nieto, A.; Bisht, A.; Lahiri, D.; Zhang, C.; Agarwal, A. Graphene reinforced metal and ceramic matrix composites: A review. Int. Mater. Rev. 2017, 62, 241–302. [Google Scholar] [CrossRef]
  6. Gao, C.; Feng, P.; Peng, S.; Shuai, C. Carbon nanotube, graphene and boron nitride nanotube reinforced bioactive ceramics for bone repair. Acta Biomater. 2017, 61, 1–20. [Google Scholar] [CrossRef] [PubMed]
  7. Centeno, A.; Rocha, V.G.; Alonso, B.; Fernández, A.; Gutierrez-Gonzalez, C.F.; Torrecillas, R.; Zurutuza, A. Graphene for tough and electroconductive alumina ceramics. J. Eur. Ceram. Soc. 2013, 33, 3201–3210. [Google Scholar] [CrossRef]
  8. Ramírez, C.; Vega-Diaz, S.M.; Morelos-Gómez, A.; Figueiredo, F.M.; Terrones, M.; Osendi, M.I.; Belmonte, M.; Miranzo, P. Synthesis of conducting graphene/Si3N4 composites by spark plasma sintering. Carbon 2013, 57, 425–432. [Google Scholar] [CrossRef]
  9. Miranzo, P.; García, E.; Ramírez, C.; González-Julián, J.; Belmonte, M.; Osendi, M.I. Anisotropic thermal conductivity of silicon nitride ceramics containing carbon nanostructures. J. Eur. Ceram. Soc. 2012, 32, 1847–1854. [Google Scholar] [CrossRef]
  10. Llorente, J.; Román-Manso, B.; Miranzo, P.; Belmonte, M. Tribological performance under dry sliding conditions of graphene/silicon carbide composites. J. Eur. Ceram. Soc. 2016, 36, 429–435. [Google Scholar] [CrossRef] [Green Version]
  11. Malek, O.; González-Julián, J.; Vleugels, J.; Verauwera, W.; Lauwers, B.; Belmonte, M. Carbon nanofillers for machining insulating ceramics. Mater. Today 2011, 14, 496–501. [Google Scholar] [CrossRef]
  12. Hotta, M.; Goto, T. Densification and microstructure of Al2O3-cBN composites prepared by spark plasma sintering. J. Ceram. Soc. Jpn. 2008, 116, 744–748. [Google Scholar] [CrossRef] [Green Version]
  13. Yue, C.; Liu, W.; Zhang, L.; Zhang, T.; Chen, Y. Fracture toughness and toughening mechanisms in a (ZrB2-SiC) composite reinforced with boron nitride nanotubes and boron nitride nanoplatelets. Scr. Mater. 2013, 68, 579–582. [Google Scholar] [CrossRef] [Green Version]
  14. Li, Y.-L.; Li, R.-X.; Zhang, J.-X. Enhanced mechanical properties of machinable Si3N4/BN composites by spark plasma sintering. Mater. Sci. Eng. A 2008, 483–484, 207–210. [Google Scholar] [CrossRef]
  15. Sedlák, R.; Kovalčíková, A.; Balko, J.; Rutkowski, P.; Dubiel, A.; Zientara, D.; Girman, V.; Múdra, E.; Dusza, J. Effect of graphene platelets on tribological properties of boron carbide ceramic composites. Int. J. Refract. Met. Hard Mater. 2017, 65, 57–63. [Google Scholar] [CrossRef]
  16. Seiner, H.; Sedlák, P.; Koller, M.; Landa, M.; Ramírez, C.; Osendi, M.I.; Belmonte, M. Anisotropic elastic moduli and internal friction of graphene nanoplatelets/silicon nitride composites. Compos. Sci. Technol. 2013, 75, 93–97. [Google Scholar] [CrossRef]
  17. Michel, K.H.; Verberck, B. Theory of the elastic constants of graphite and graphene. Phys. Status Solidi (B) Basic Res. 2008, 245, 2177–2180. [Google Scholar] [CrossRef]
  18. Falin, A.; Cai, Q.; Santos, E.J.G.; Scullion, D.; Qian, D.; Zhang, R.; Yang, Z.; Huang, S.; Watanabe, K.; Taniguchi, T. Mechanical properties of atomically thin boron nitride and the role of interlayer interactions. Nat. Commun. 2017, 8, 15815. [Google Scholar] [CrossRef] [PubMed] [Green Version]
  19. Seiner, H.; Ramirez, C.; Koller, M.; Sedlák, P.; Landa, M.; Miranzo, P.; Belmonte, M.; Osendi, M.I. Elastic properties of silicon nitride ceramics reinforced with graphene nanofillers. Mater. Des. 2015, 87, 675–680. [Google Scholar] [CrossRef]
  20. Kachanov, M. On the concept of approximate elastic symmetry and its application to materials with defects. Int. J. Fract. 1995, 74, R33–R38. [Google Scholar] [CrossRef]
  21. Nieto, A.; Lahiri, D.; Agarwal, A. Synthesis and properties of bulk graphene nanoplatelets consolidated by spark plasma sintering. Carbon 2012, 50, 4068–4077. [Google Scholar] [CrossRef]
  22. Loganathan, A.; Sharma, A.; Rudolf, C.; Zhang, C.; Nautiyal, P.; Suwas, S.; Boesl, B.; Agarwal, A. In-situ deformation mechanism and orientation effects in sintered 2D boron nitride nanosheets. Mater. Sci. Eng. A 2017, 708, 440–450. [Google Scholar] [CrossRef]
  23. Koller, M.; Seiner, H.; Landa, M.; Nieto, A.; Agarwal, A. Anisotropic elastic and acoustic properties of bulk graphene nanoplatelets consolidated by spark plasma sintering. Acta Phys. Pol. A 2015, 128, 670–674. [Google Scholar] [CrossRef]
  24. Liu, X.; Metcalf, T.H.; Robinson, J.T.; Perkins, F.K.; Houston, B.H. Internal friction and shear modulus of graphene films. Solid State Phenom. 2012, 184, 319–324. [Google Scholar] [CrossRef]
  25. Liu, X.; Metcalf, T.H.; Robinson, J.T.; Houston, B.H.; Scarpa, F. Shear modulus of monolayer graphene prepared by chemical vapor deposition. Nano Lett. 2012, 12, 1013–1017. [Google Scholar] [CrossRef] [PubMed]
  26. Dong, Y.; Wang, F.; Zhu, Z.; He, T. Influences of out-of-plane elastic energy and thermal effects on friction between graphene layers. AIP Adv. 2019, 9, 045213. [Google Scholar] [CrossRef] [Green Version]
  27. Migliori, A.; Sarrao, J.L.; Visscher, W.M.; Bell, T.M.; Lei, M.; Fisk, Z.; Leisure, R.G. Resonant ultrasound spectroscopic techniques for measurement of the elastic moduli of solids. Phys. B Phys. Condens. Matter 1993, 183, 1–24. [Google Scholar] [CrossRef] [Green Version]
  28. Leisure, R.G.; Willis, F.A. Resonant ultrasound spectroscopy. J. Phys. Condens. Matter 1997, 9, 6001–6029. [Google Scholar] [CrossRef]
  29. Sedlák, P.; Seiner, H.; Zídek, J.; Janovská, M.; Landa, M. Determination of All 21 Independent Elastic Coefficients of Generally Anisotropic Solids by Resonant Ultrasound Spectroscopy: Benchmark Examples. Exp. Mech. 2014, 54, 1073–1085. [Google Scholar] [CrossRef]
  30. Ogi, H.; Sato, K.; Asada, T.; Hirao, M. Complete mode identification for resonance ultrasound spectroscopy. J. Acoust. Soc. Am. 2002, 112, 2553–2557. [Google Scholar] [CrossRef]
  31. Ghosh, S.; Matty, M.; Baumbach, R.; Bauer, E.D.; Modic, K.A.; Shekhter, A.; Mydosh, J.A.; Kim, E.-A.; Ramshaw, B.J. One-component order parameter in URu2Si2 uncovered by resonant ultrasound spectroscopy and machine learning. Sci. Adv. 2020, 6, eaaz4074. [Google Scholar] [CrossRef] [Green Version]
  32. Sumino, Y.; Ohno, I.; Goto, T.; Kumazawa, M. Measurement of elastic constants and internal frictions on single-crystal mgo by rectangular parallelepiped resonance. J. Phys. Earth 1976, 24, 263–272. [Google Scholar] [CrossRef] [Green Version]
  33. Nowick, A.S.; Berry, B.S. Anelastic Relaxation in Crystalline Solids; Academic Press: New York, NY, USA, 1972. [Google Scholar]
  34. François, M.; Geymonat, G.; Berthaud, Y. Determination of the symmetries of an experimentally determined stiffness tensor: Application to acoustic measurements. Int. J. Solids Struct. 1998, 35, 4091–4106. [Google Scholar] [CrossRef] [Green Version]
  35. Evans, A.G.; Tittmann, B.R.; Ahlberg, L.; Khuri-Yakub, B.T.; Kino, G.S. Ultrasonic attenuation in ceramics. J. Appl. Phys. 1978, 49, 2669–2679. [Google Scholar] [CrossRef]
  36. Karunarathne, A.; Jodha, K.S.; Priyadarshan, G.; Griggs, J.A.; Gladden, J.R. Low pressure dependent elasticity of porous ceramics. J. Am. Ceram. Soc. 2020, 103, 1312–1320. [Google Scholar] [CrossRef]
  37. Roy, S.; Gebert, J.-M.; Stasiuk, G.; Piat, R.; Weidenmann, K.A.; Wanner, A. Complete determination of elastic moduli of interpenetrating metal/ceramic composites using ultrasonic techniques and micromechanical modelling. Mater. Sci. Eng. A 2011, 528, 8226–8235. [Google Scholar] [CrossRef]
  38. Shyam, A.; Lara-Curzio, E.; Watkins, T.R.; Parten, R.J. Mechanical characterization of diesel particulate filter substrates. J. Am. Ceram. Soc. 2008, 91, 1995–2001. [Google Scholar] [CrossRef]
  39. Kruisová, A.; Seiner, H.; Sedlák, P.; Landa, M.; Román-Manso, B.; Miranzo, P.; Belmonte, M. Acoustic metamaterial behavior of three-dimensional periodic architectures assembled by robocasting. Appl. Phys. Lett. 2014, 105, 211904. [Google Scholar] [CrossRef]
  40. Wanner, A. Elastic modulus measurements of extremely porous ceramic materials by ultrasonic phase spectroscopy. Mater. Sci. Eng. A 1998, 248, 35–43. [Google Scholar] [CrossRef]
  41. Nehate, S.D.; Saikumar, A.K.; Prakash, A.; Sundaram, K.B. A review of boron carbon nitride thin films and progress in nanomaterials. Mater. Today Adv. 2020, 8, 100106. [Google Scholar] [CrossRef]
  42. Zhang, Z.; Duan, X.; Qui, B.; Chen, L.; Zhang, P.; Cai, D.; He, P.; Zhang, H.; Wei, Z.; Yang, Z.; et al. Microstructure evolution and grain growth mechanisms of h-BN ceramics during hot-pressing. J. Eur. Ceram. Soc. 2020, 40, 2268–2278. [Google Scholar] [CrossRef]
  43. Ni, D.W.; Zhang, G.J.; Kan, Y.M.; Sakka, Y. Highly textured ZrB2-based ultrahigh temperature ceramics via strong magnetic field alignment. Scr. Mater. 2009, 60, 615–618. [Google Scholar] [CrossRef]
  44. Wei, J.N.; Huang, T.C.; Zhao, L.; Yu, J.M.; Xie, W.J.; Li, G.M. Internal friction characterization of graphite. J. Mater. Sci. 2008, 43, 5470–5473. [Google Scholar] [CrossRef]
  45. Wei, J.N.; Li, Y.L.; Song, S.H.; Ji, G.C.; Ma, M.L.; Zhang, D.Q.; Han, F.S. Grain boundary peak in macroscopic graphite participates reinforced Zn-Al metal matrix composite. Phys. Status Solidi Appl. Res. 2004, 201, 923–928. [Google Scholar] [CrossRef]
  46. Reguzzoni, M.; Fasolino, A.; Molinari, E.; Righi, M.C. Friction by shear deformations in multilayer graphene. J. Phys. Chem. C 2012, 116, 21104–21108. [Google Scholar] [CrossRef] [Green Version]
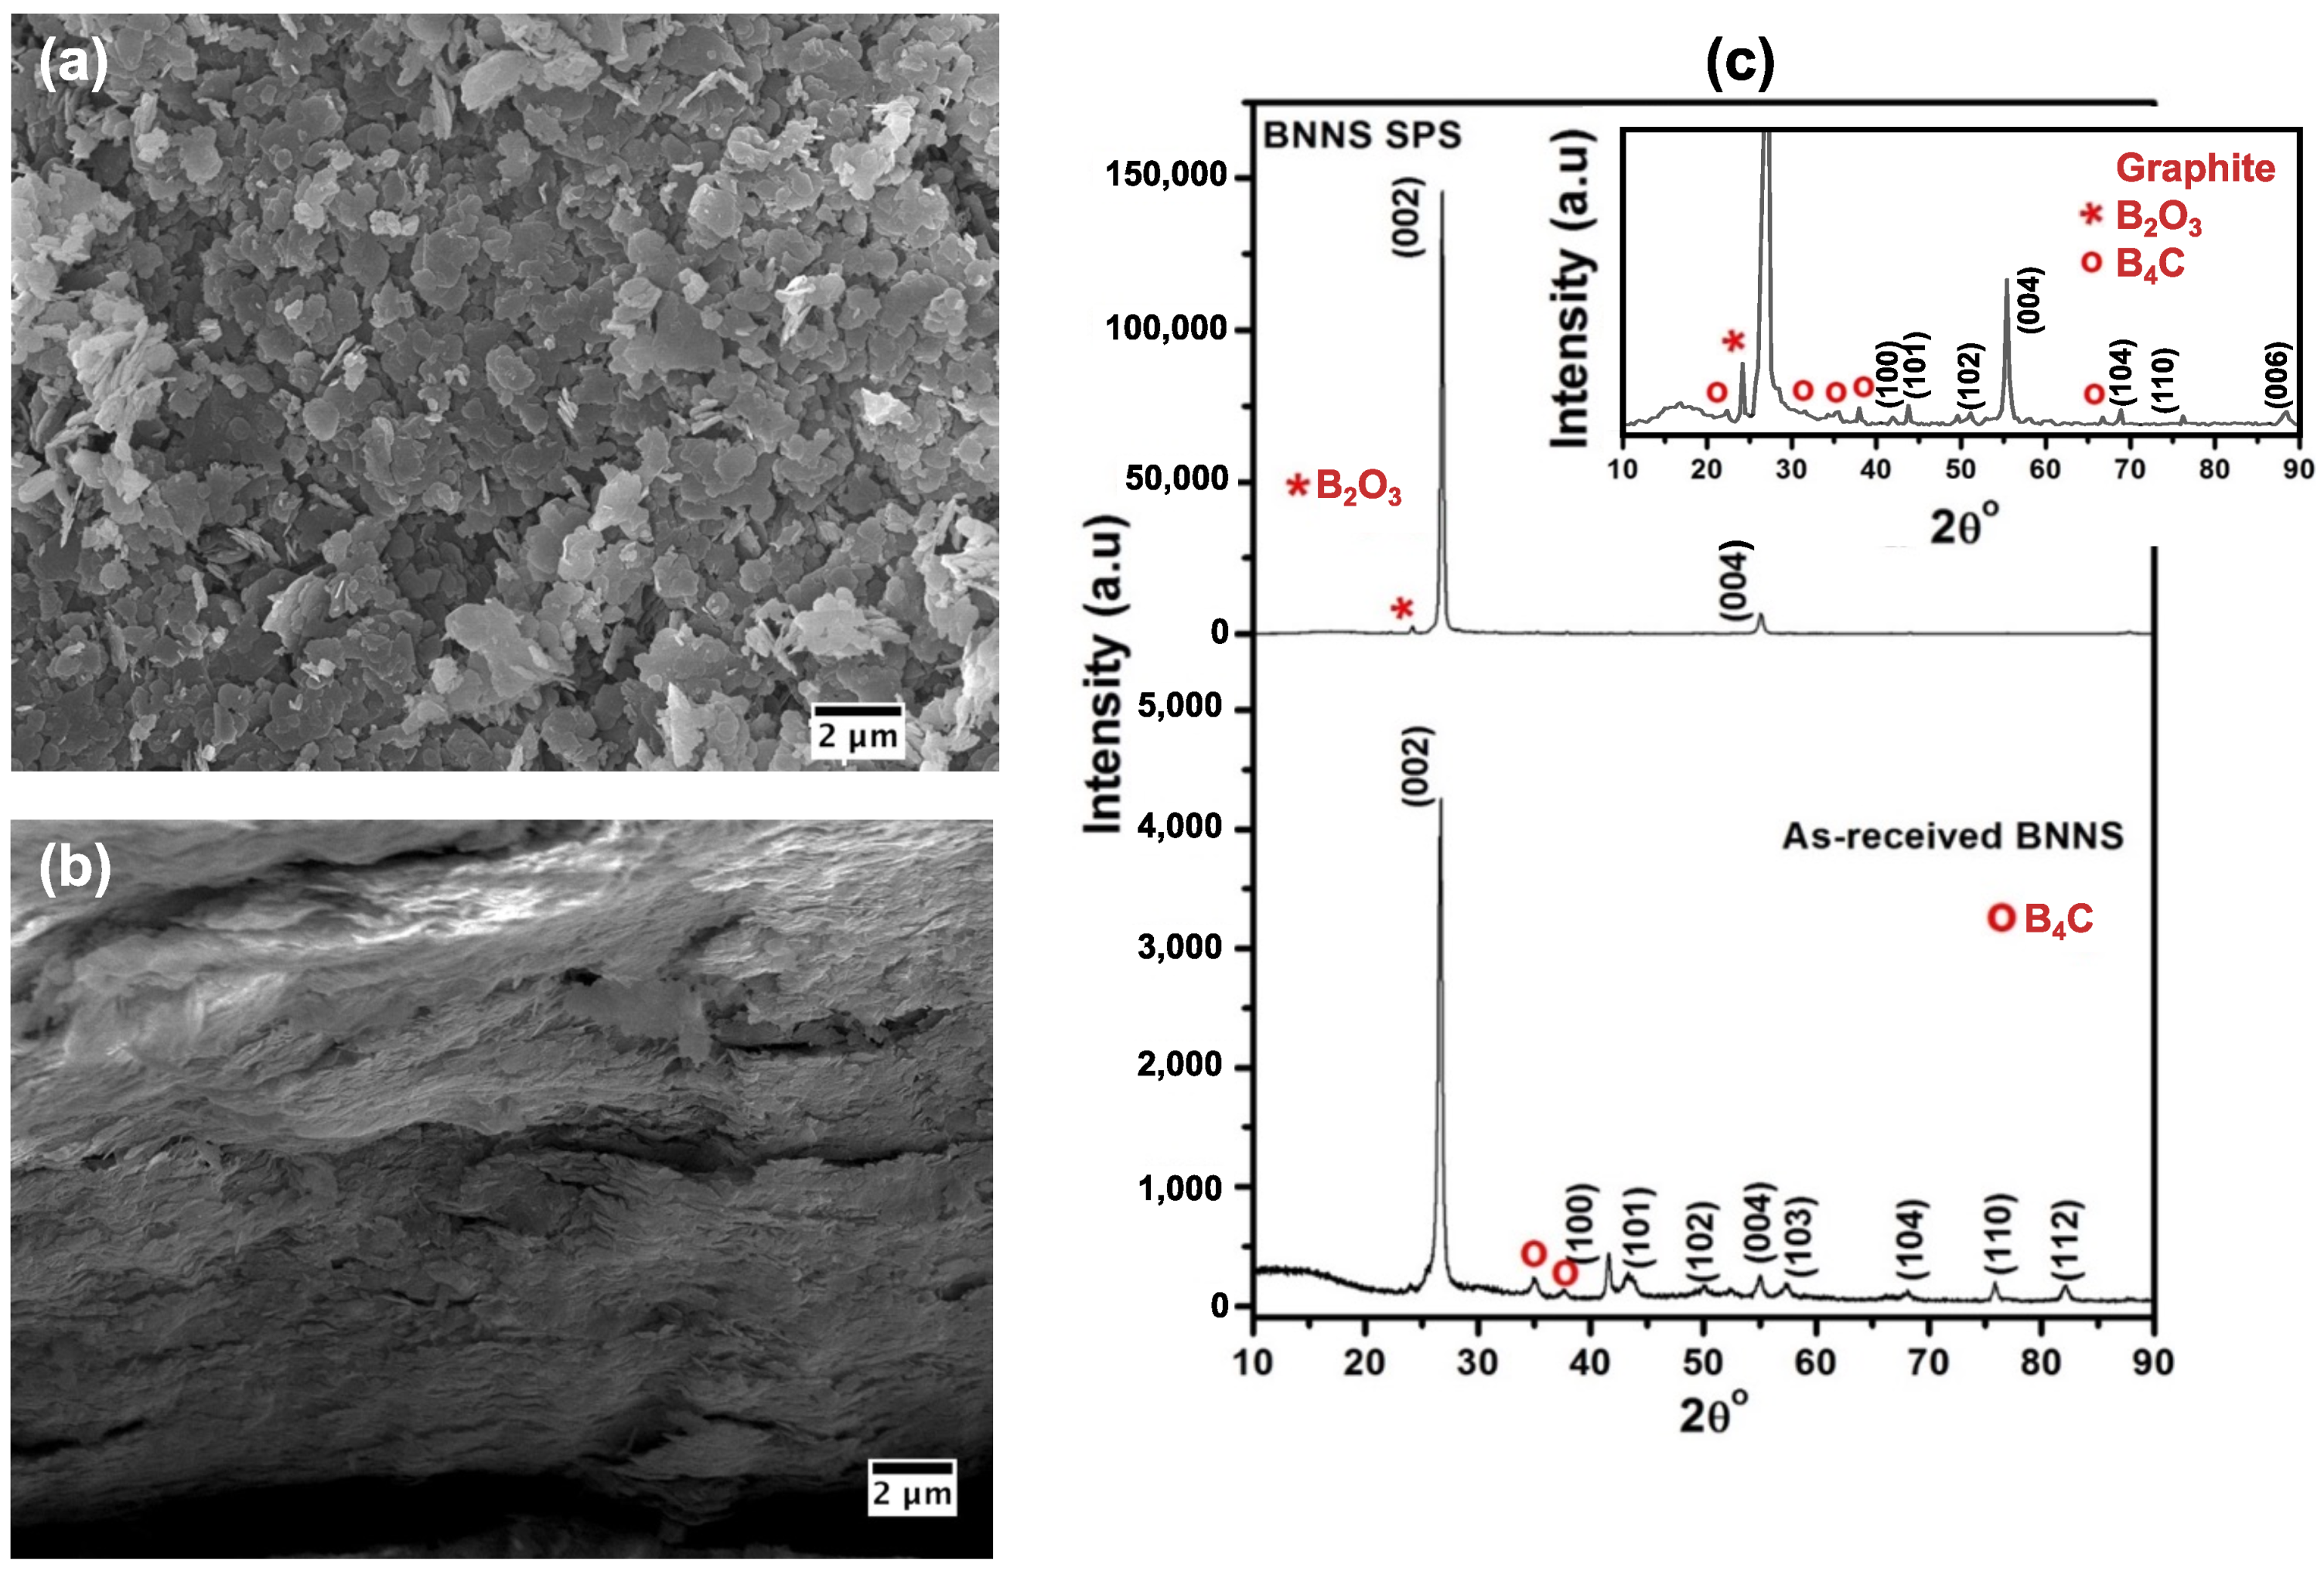
Figure 1. Scanning electron microscopy images of (a) as-received powder and (b) fracture surface of bulk BNNS documenting the preferred orientation of the platelets. (c) XRD patterns of the powder and bulk BNNS (Inset shows the XRD pattern of bulk BN nanosheets at a lower intensity). See [22] for more details.
Ceramics 04 00012 g001
Figure 2. Scanning electron microscopy images of (a) ball-milled powder and (b) fracture surface of bulk BCN-material documenting the random orientation of the platelets in the material. (c) XRD patterns of the ball-milled powder and bulk BCN-material documenting the BCN-phase formation.
Ceramics 04 00012 g002
Figure 3. Scanning electron microscopy images of (a) as-received powder and (b) fracture surface of bulk GNP documenting the preferred orientation of the platelets. (c) XRD patterns of the powder and bulk GNP. See [21,23] for more details.
Ceramics 04 00012 g003
Figure 4. Selected parts of the single-point RUS spectra at 60 C and the maximum temperature T max . For lucidity, the spectra for T max are plotted upside-down.
Ceramics 04 00012 g004
Figure 5. Anisotropic Young’s moduli calculated from the elastic constants given in Table 2: (a) directional dependencies of the moduli visualized using polar plots with respect to the loading direction in the x 1 x 3 plane; (b) a zoomed area of (a) showing the details close to E = 0 . The labeling in (b) is valid for both (a,b). The vertical axis ( x 3 ) corresponds to the SPS compression axis, the elastic behavior of all material is assumed as invariant with respect to rotation about this axis.
Ceramics 04 00012 g005
Figure 6. The log ( Q 1 ) versus 1 / T plots for the determination of the activation energy shown for one selected resonant mode for each material. The dots are the experimental data, the lines are the results of the linear regression. In each plot area, the experimentally recorded shape of the given mode is shown.
Ceramics 04 00012 g006
Table 1. Orientation factors L ( 00 l ) for the used powders and resulting SPSed bulk materials; the last column lists the P 0 parameters used for the calculation.
Lotgering Orientation Factor L ( 00 l ) P 0
PowderBulk(JCPDS)
BNNS-material0.7780.9810.716
BCN-material0.8770.9780.458
GNP-material0.8010.9750.760
Table 2. Elastic constants of the examined materials. The errorbars for the individual constants were estimated based on the RUS spectra analysis, using the numerical procedure described in [29].
c 11 [GPa] c 12 [GPa] c 13 [GPa] c 33 [GPa] c 44 [GPa] c 66 [GPa] (a)
BNNS-material186.1560.0521.3123.6211.2863.05
± 2.88± 4.55± 2.44± 0.92± 0.09
BCN-material58.348.809.6419.729.8424.77
± 1.23±1.72± 1.50± 0.74± 0.07
GNP-material [23]66.1730.659.143.571.1517.76
(a) calculated as ( c 11 c 12 ) / 2 .
Table 3. Activation energies for internal friction in the studied materials, determined from Q 1 ( T ) evolutions of three dominant resonant modes for each sample. The error for U reflects the differences between the linear regressions for these three modes. For each material, the number of used temperature points ( N T ) and the average coefficient of determination ( R 2 ) for the linear regression are shown.
U [kJ/mol] N T R 2
BNNS-material 15.28 ± 0.52 80.9953
BCN-material 15.20 ± 0.99 60.9975
GNP-material 16.44 ± 1.80 40.9999
Publisher’s Note: MDPI stays neutral with regard to jurisdictional claims in published maps and institutional affiliations.