Sintering of Cermets: A Case Study of Sintering Ni–Co Ferrite with Ag-, Cu- and Ni-Dispersed Alloy Particles

 ,
,
Abstract
:1. Introduction
2. Materials and Methods
2.1. Production and Characterization of Cu–Ni and Ag–Ni Metallic Powders
2.2. Production and Characterization of the Sintered Metal–Ferrite Samples
3. Results
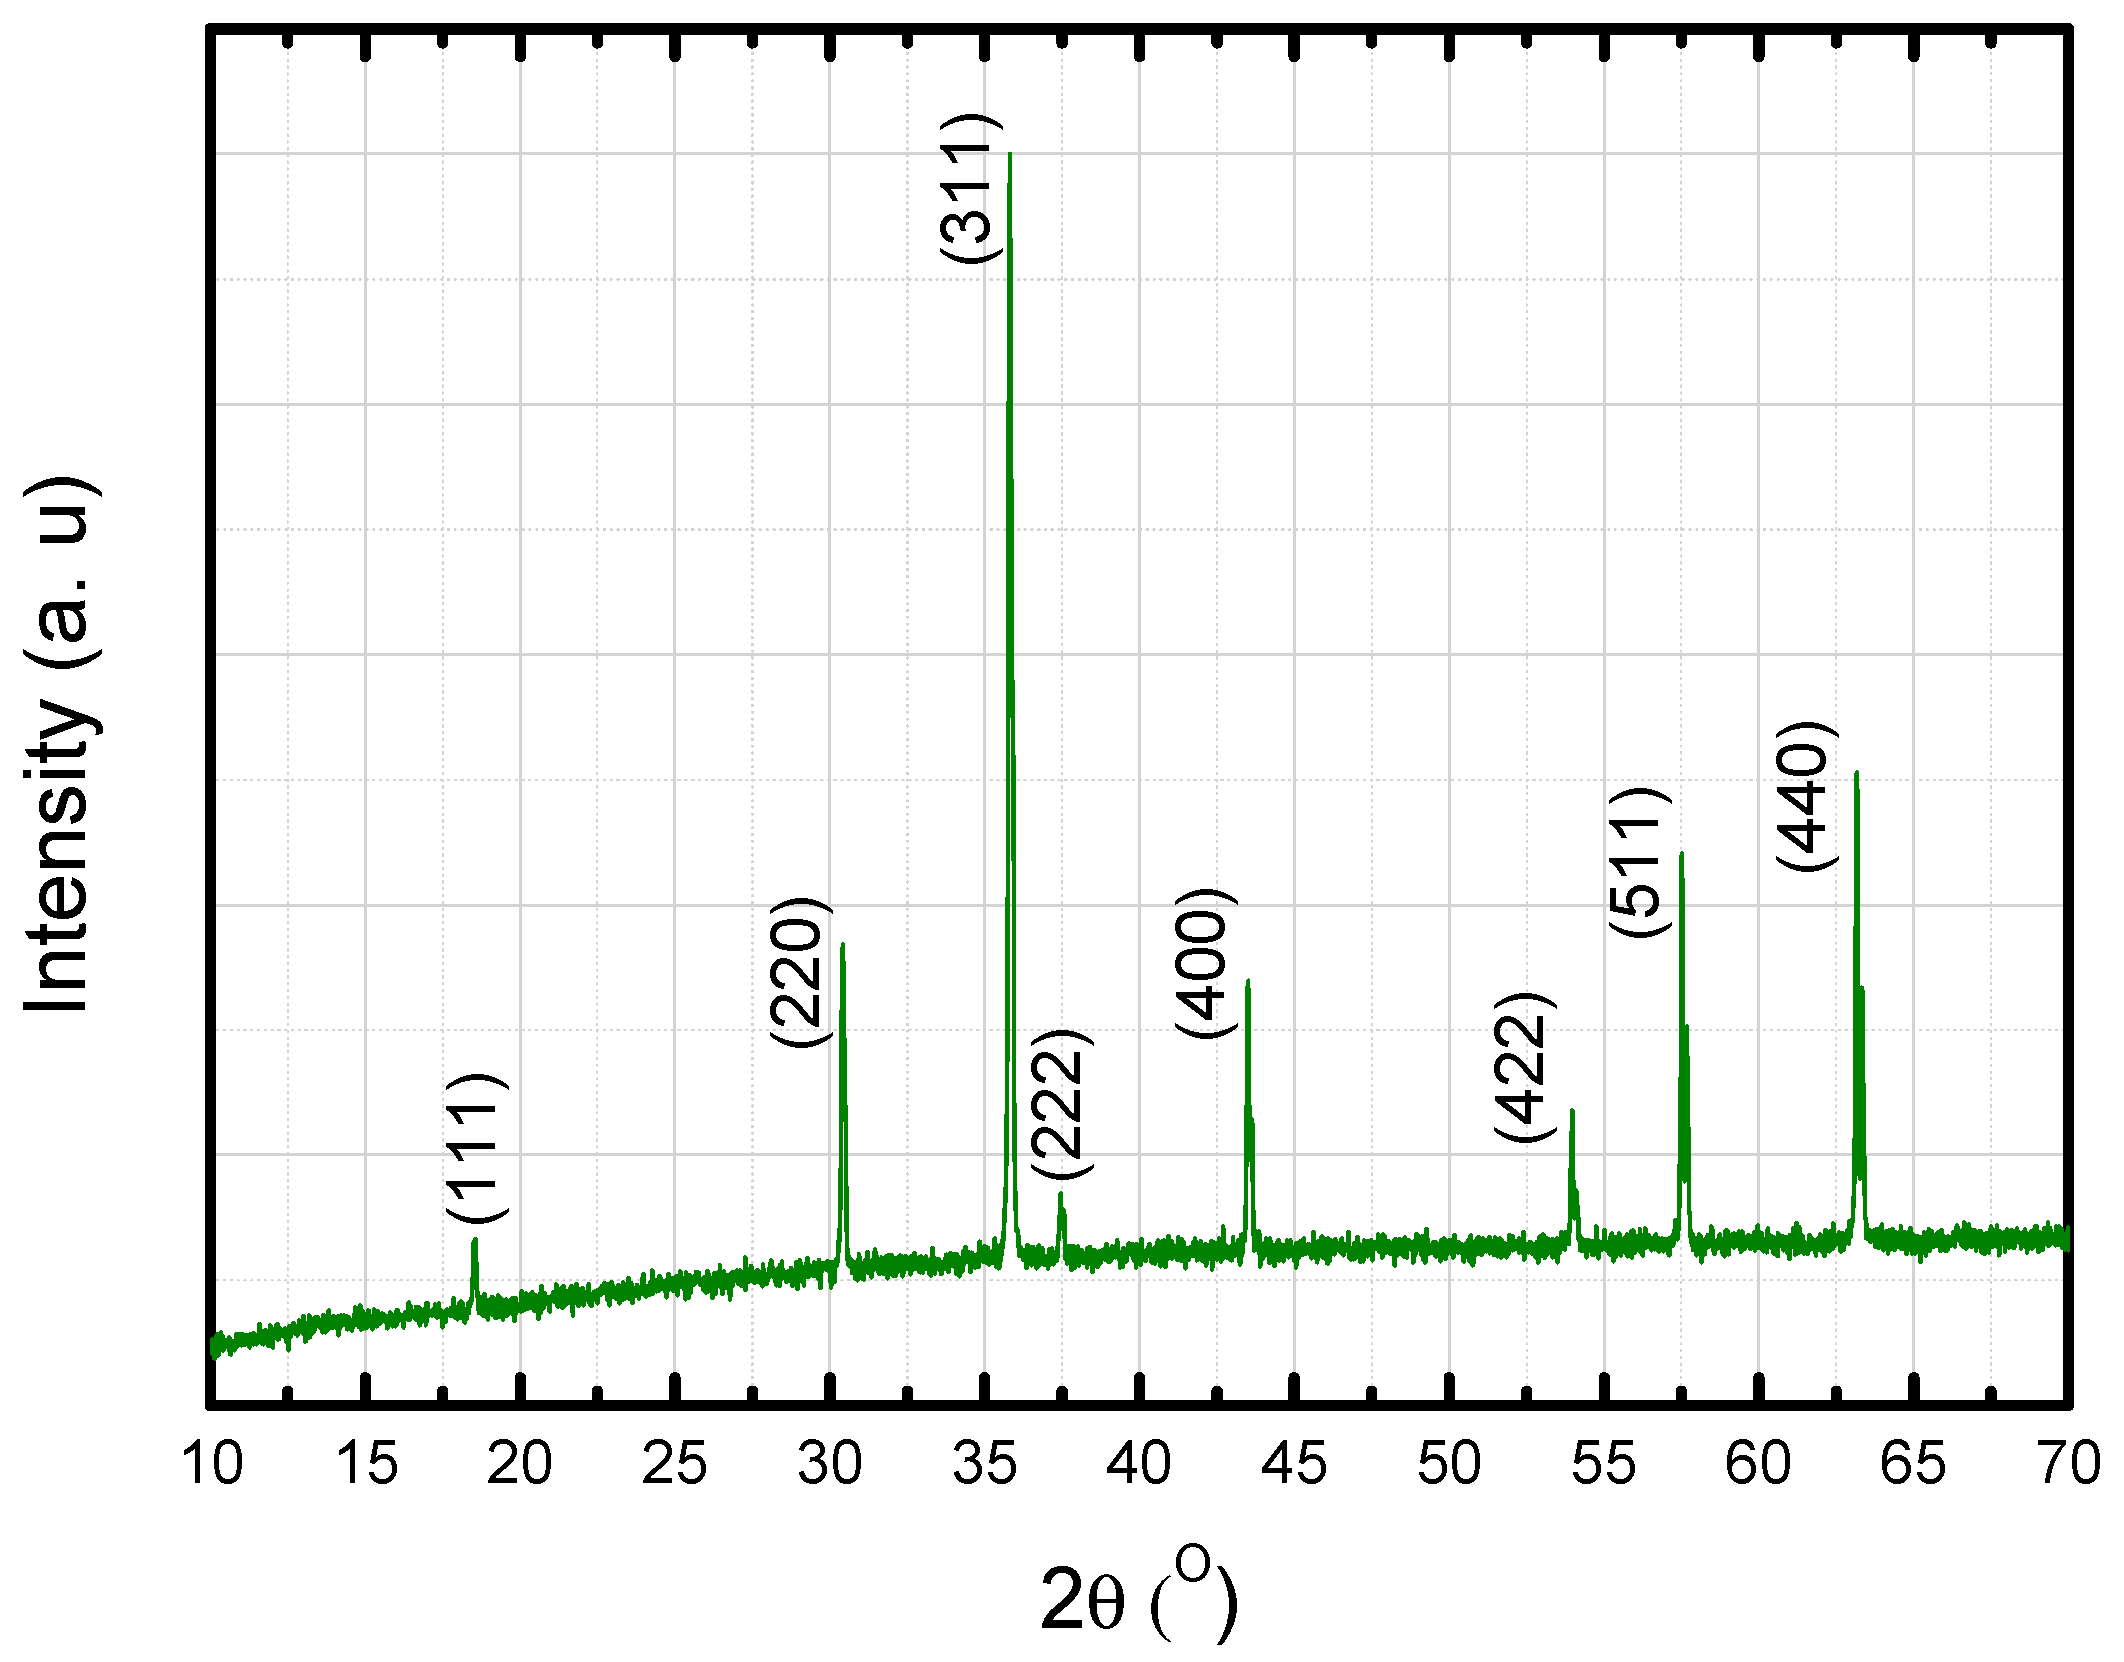
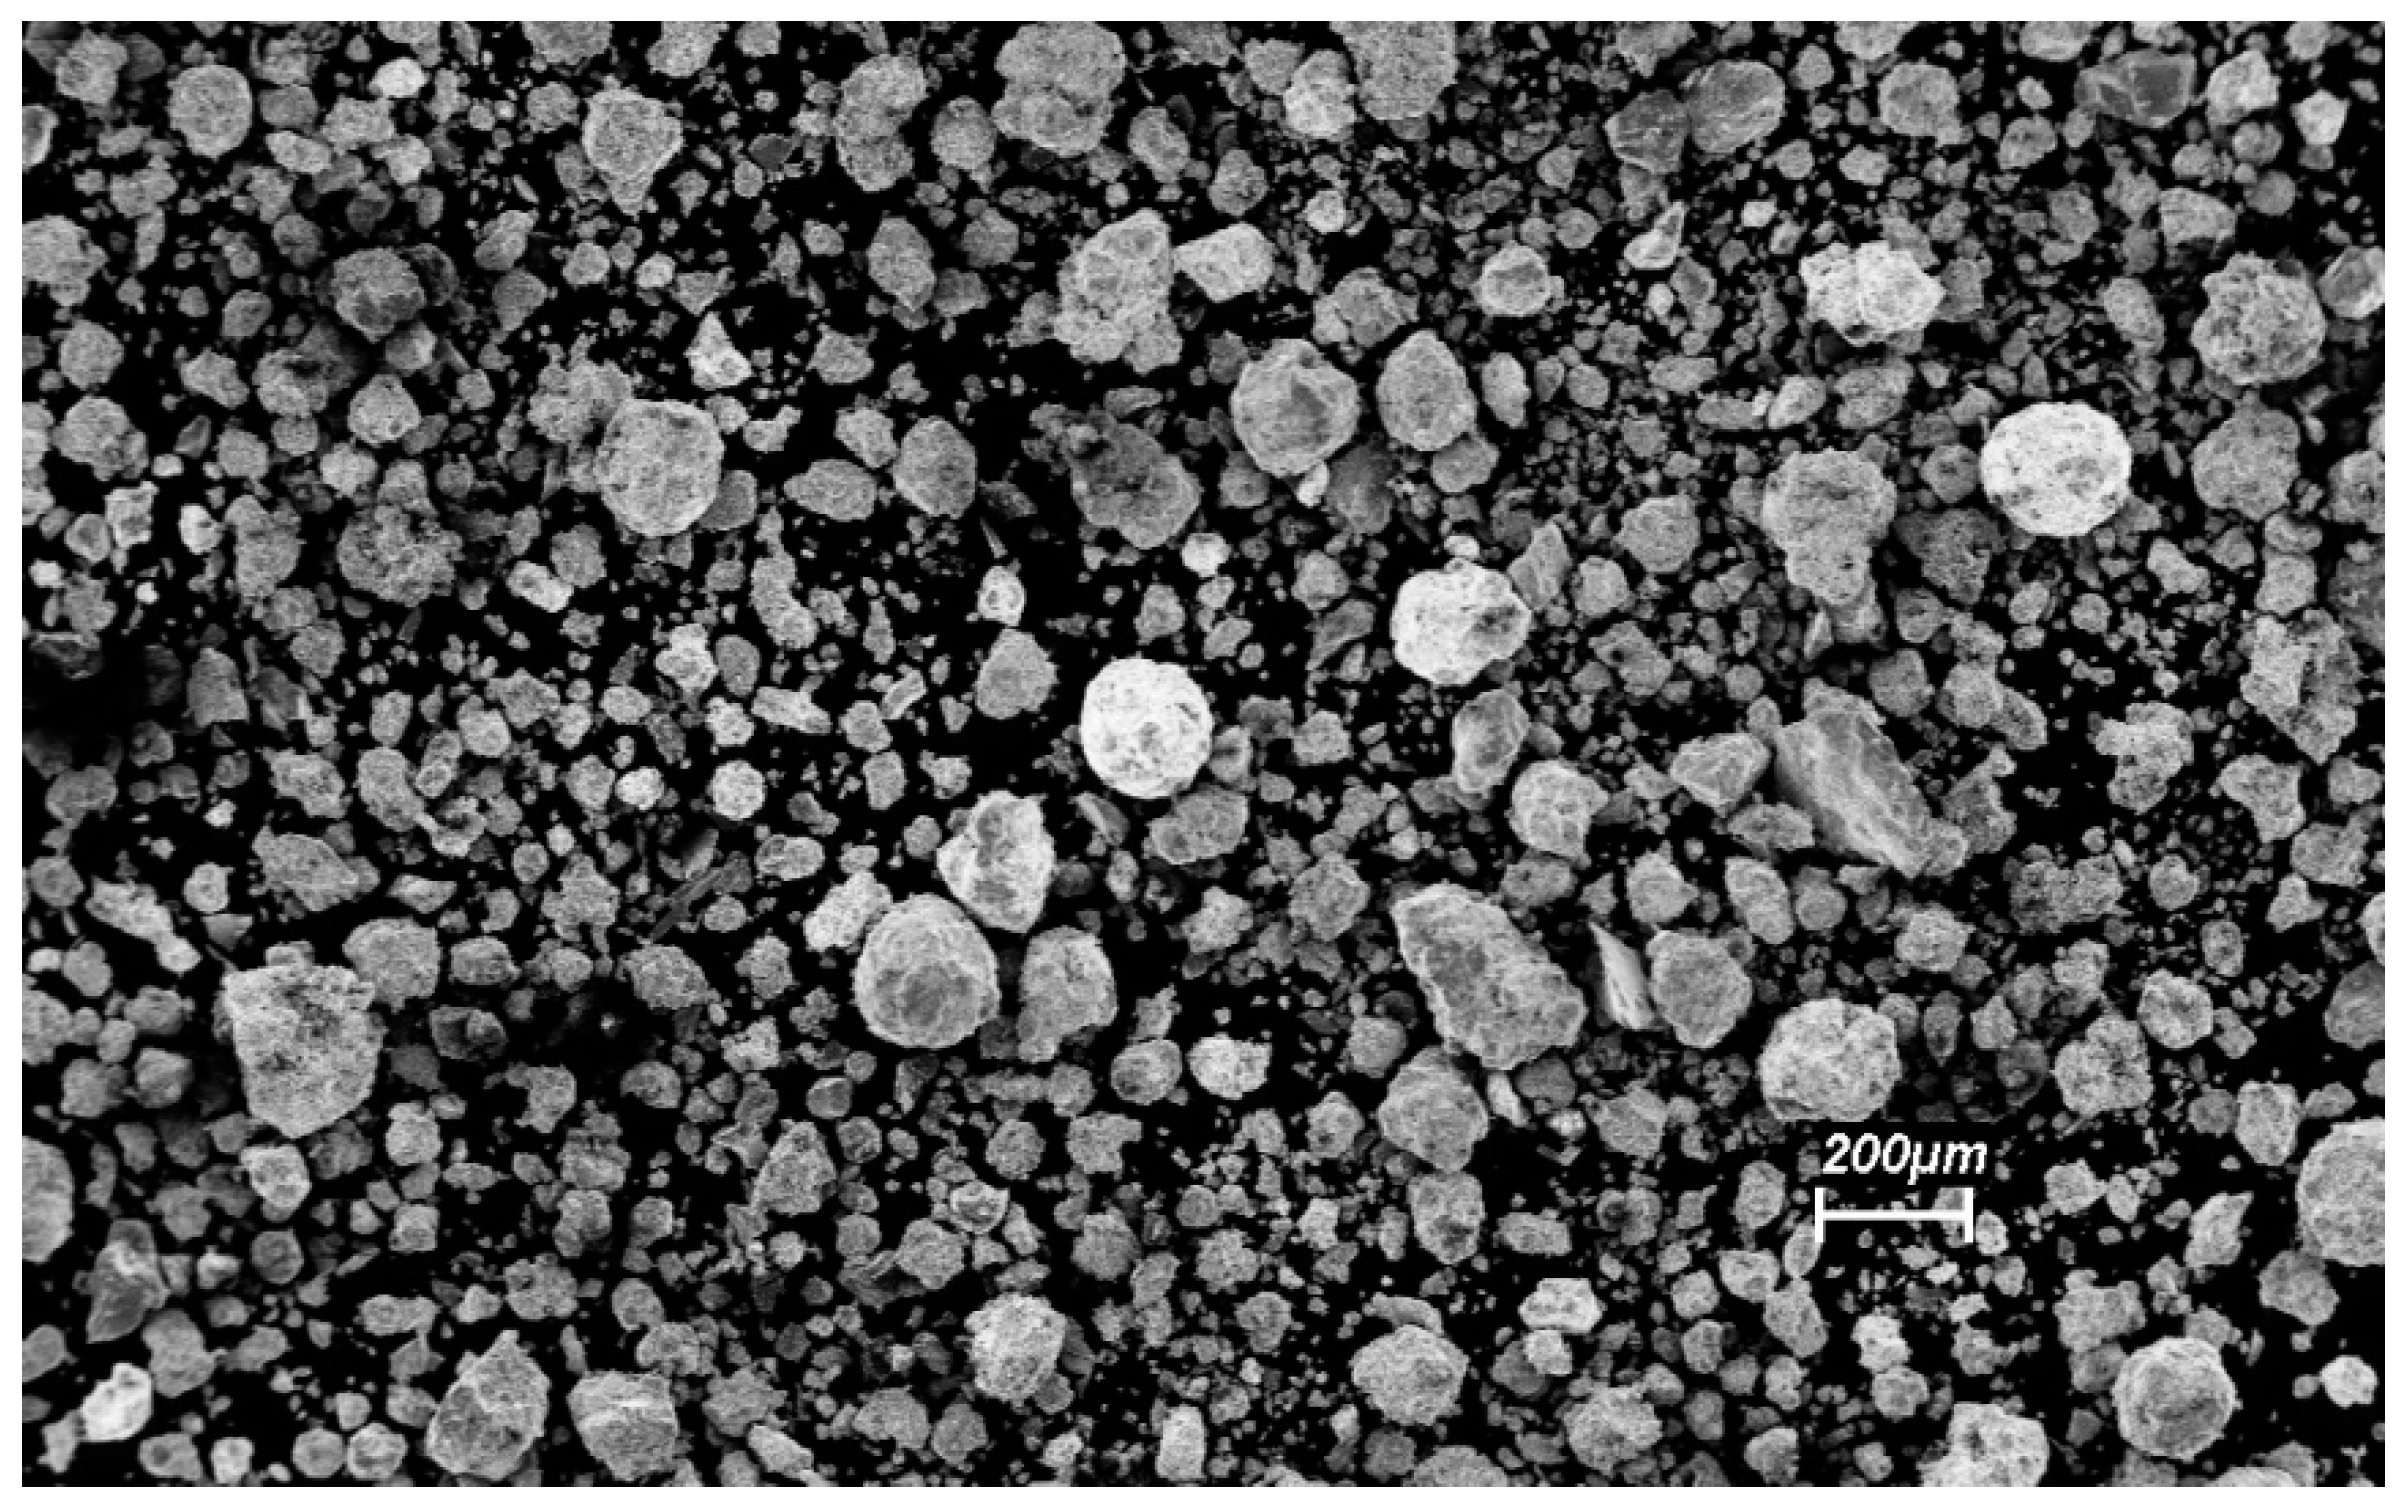
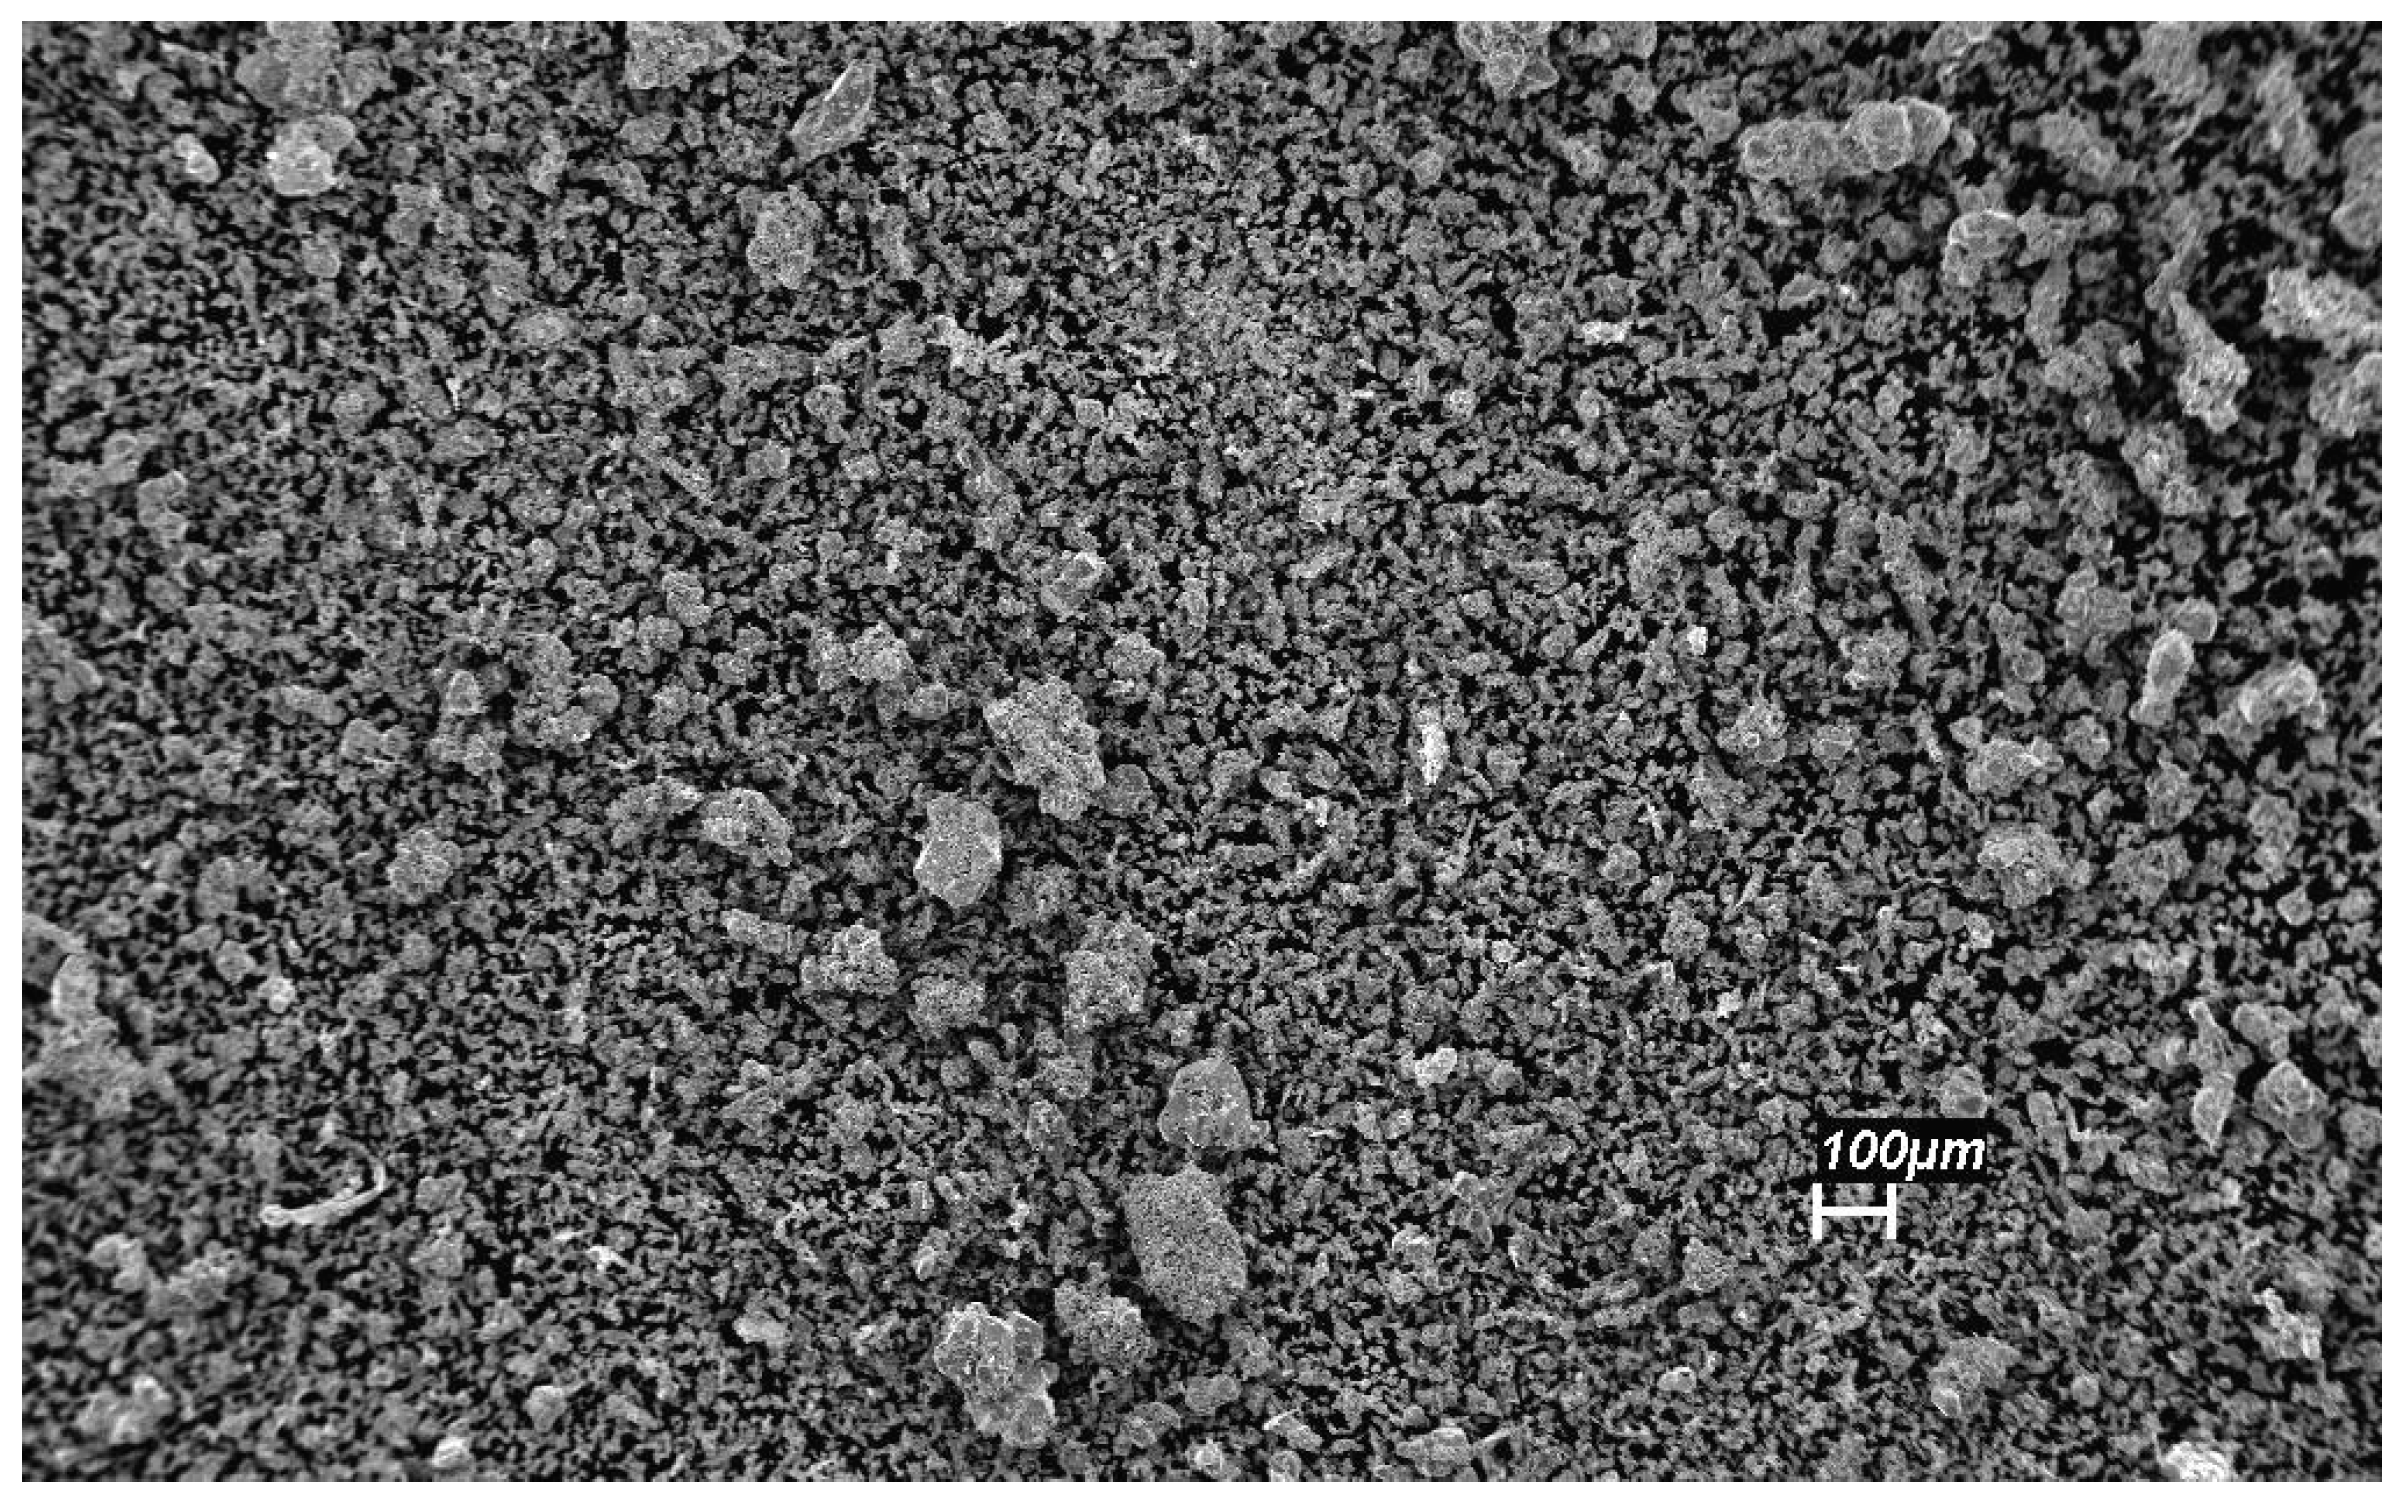
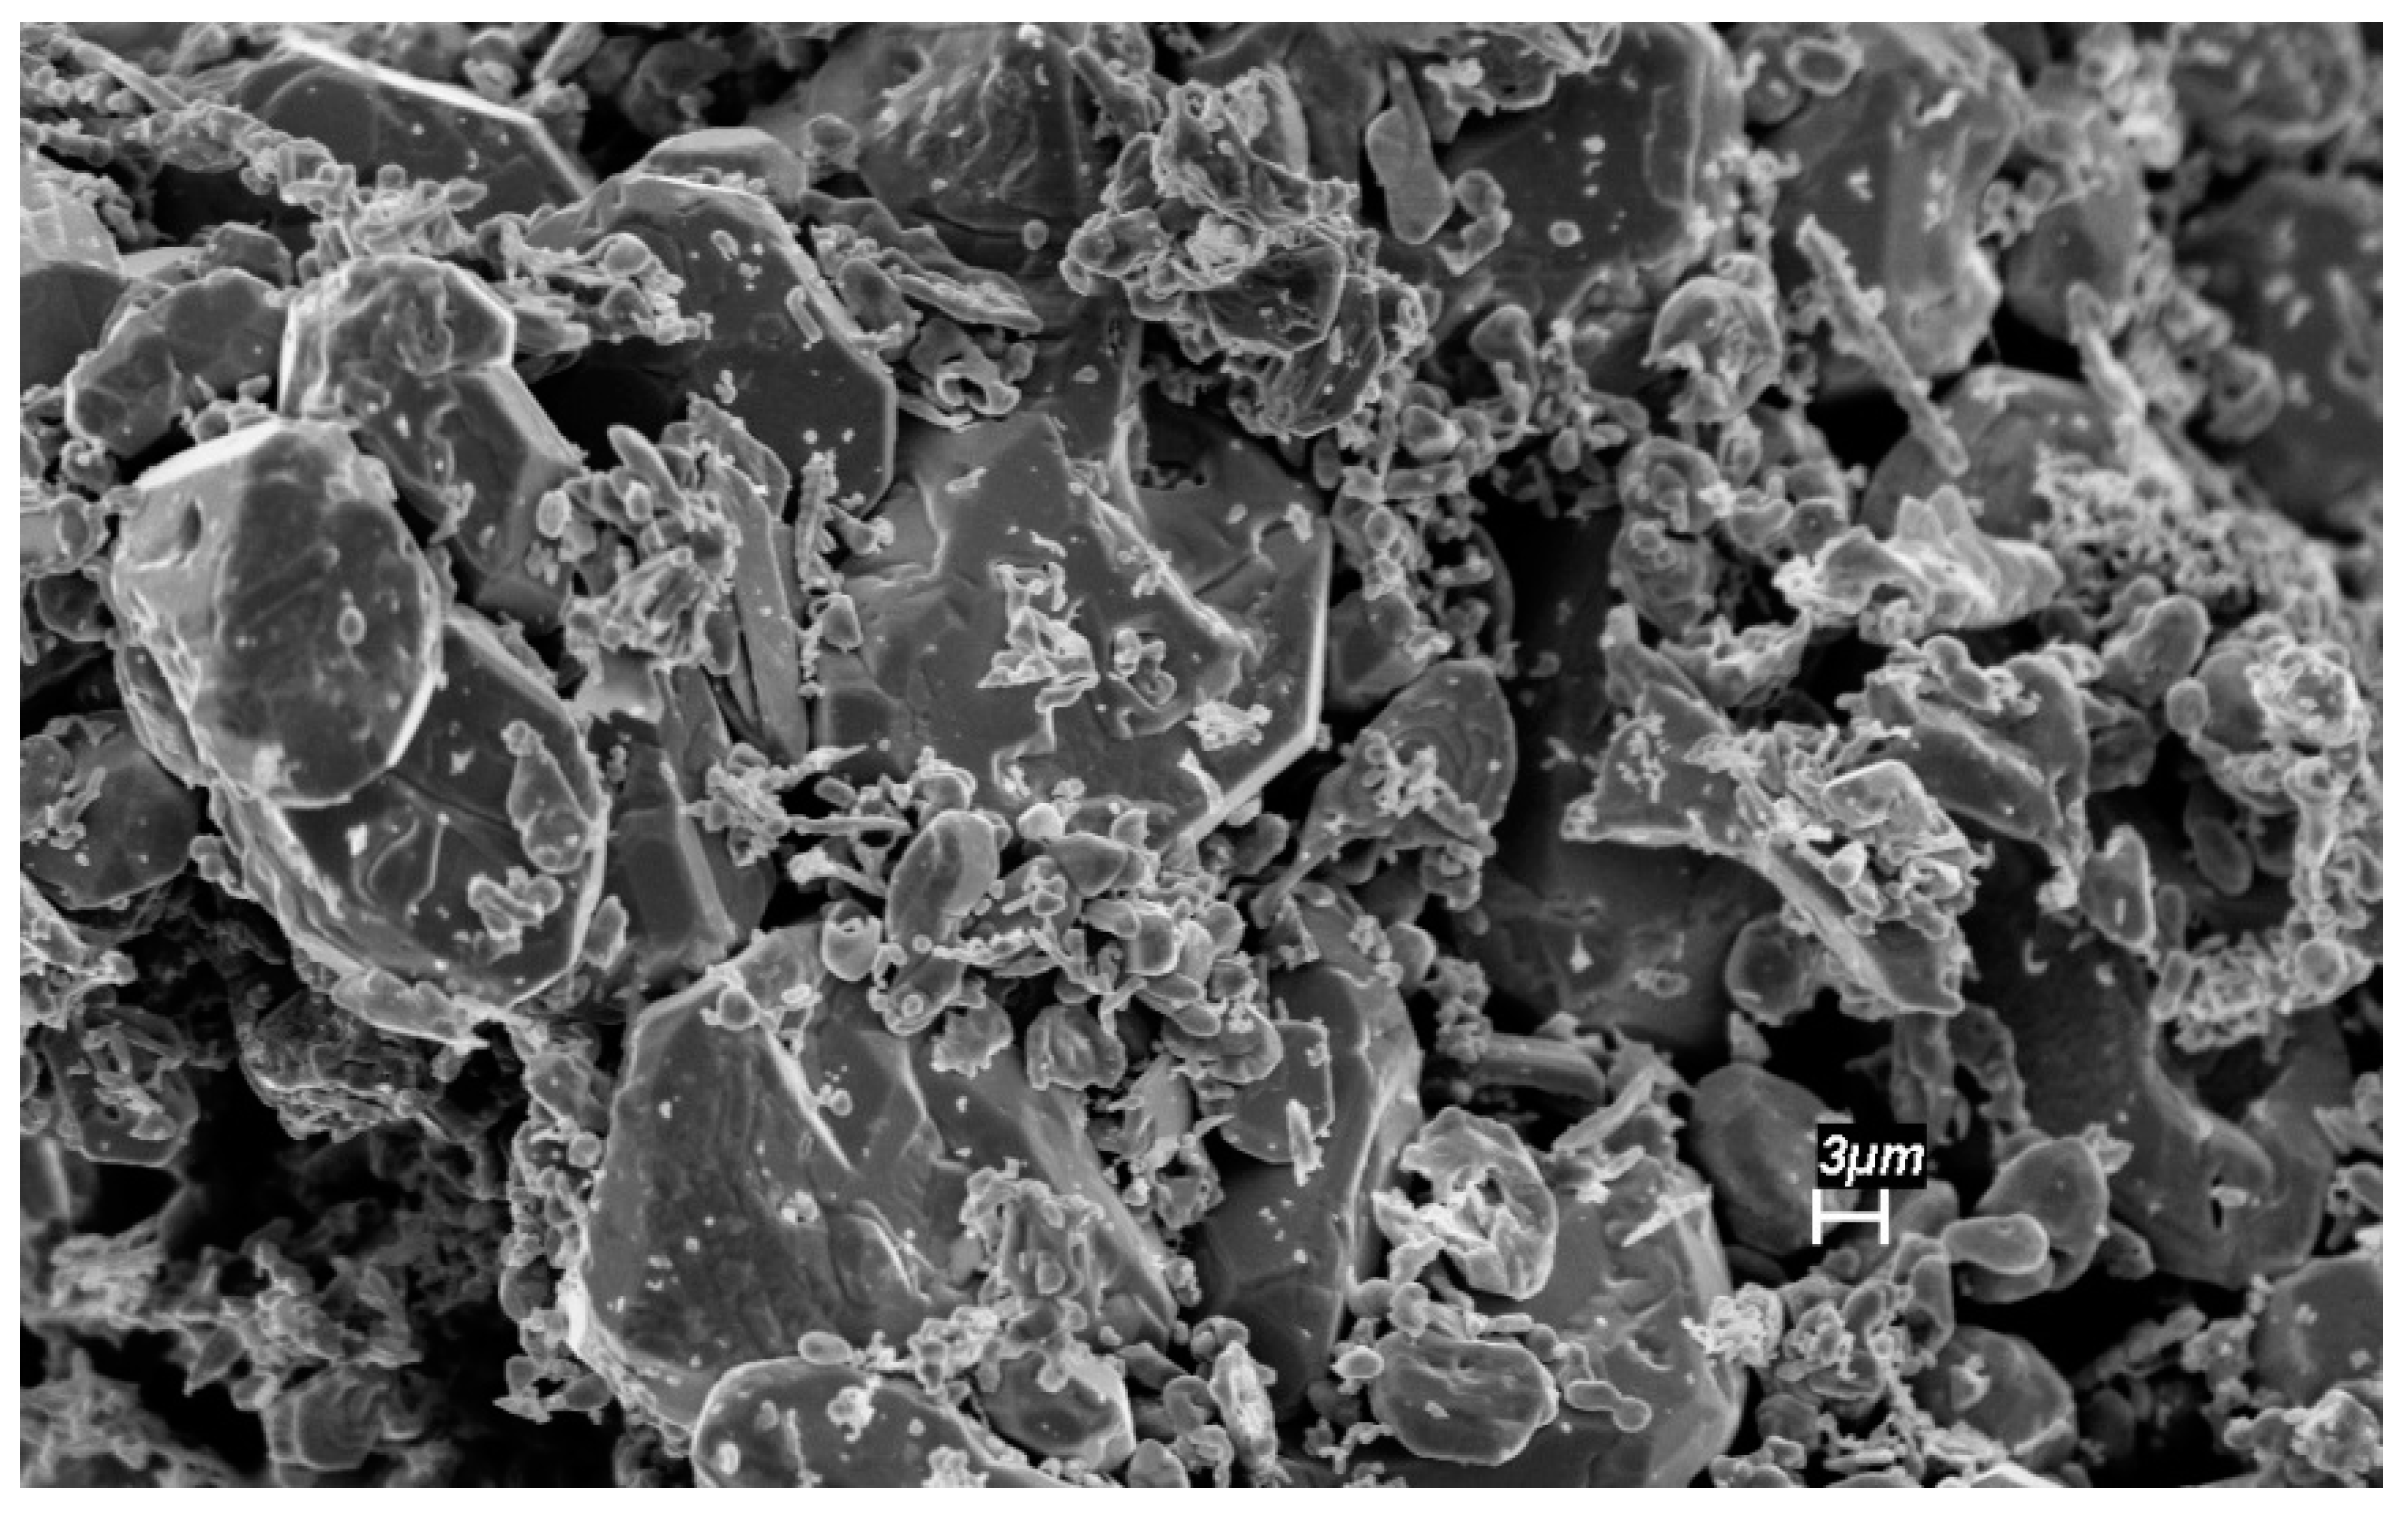
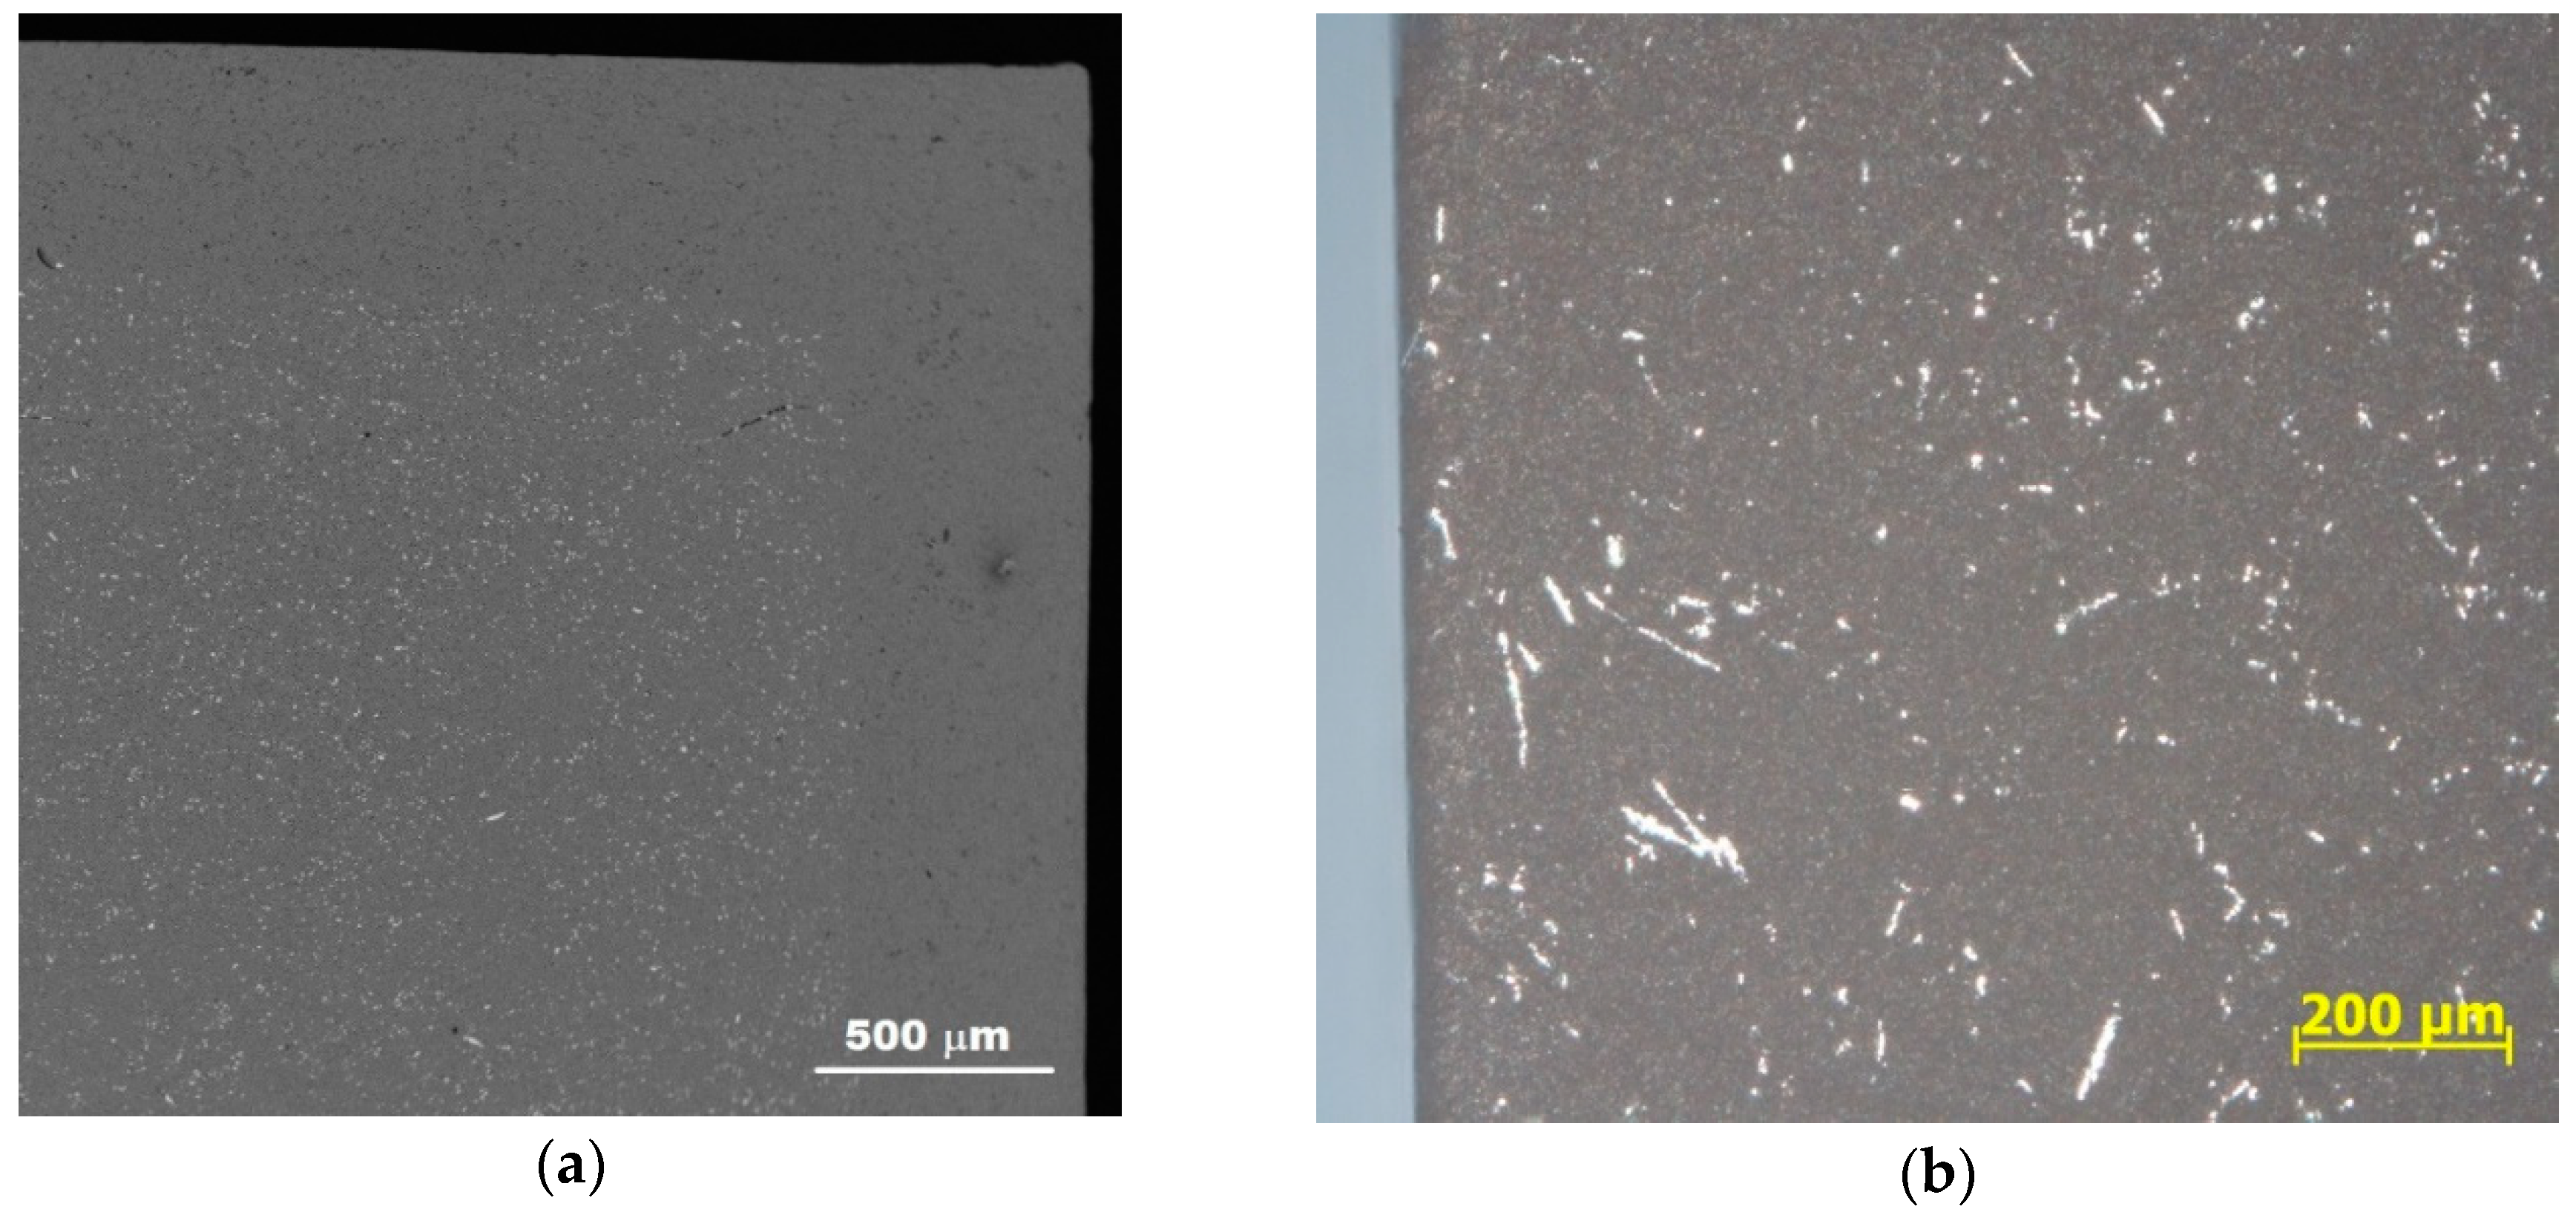
3.1. Characterization of the Sintered Ferrite Sample
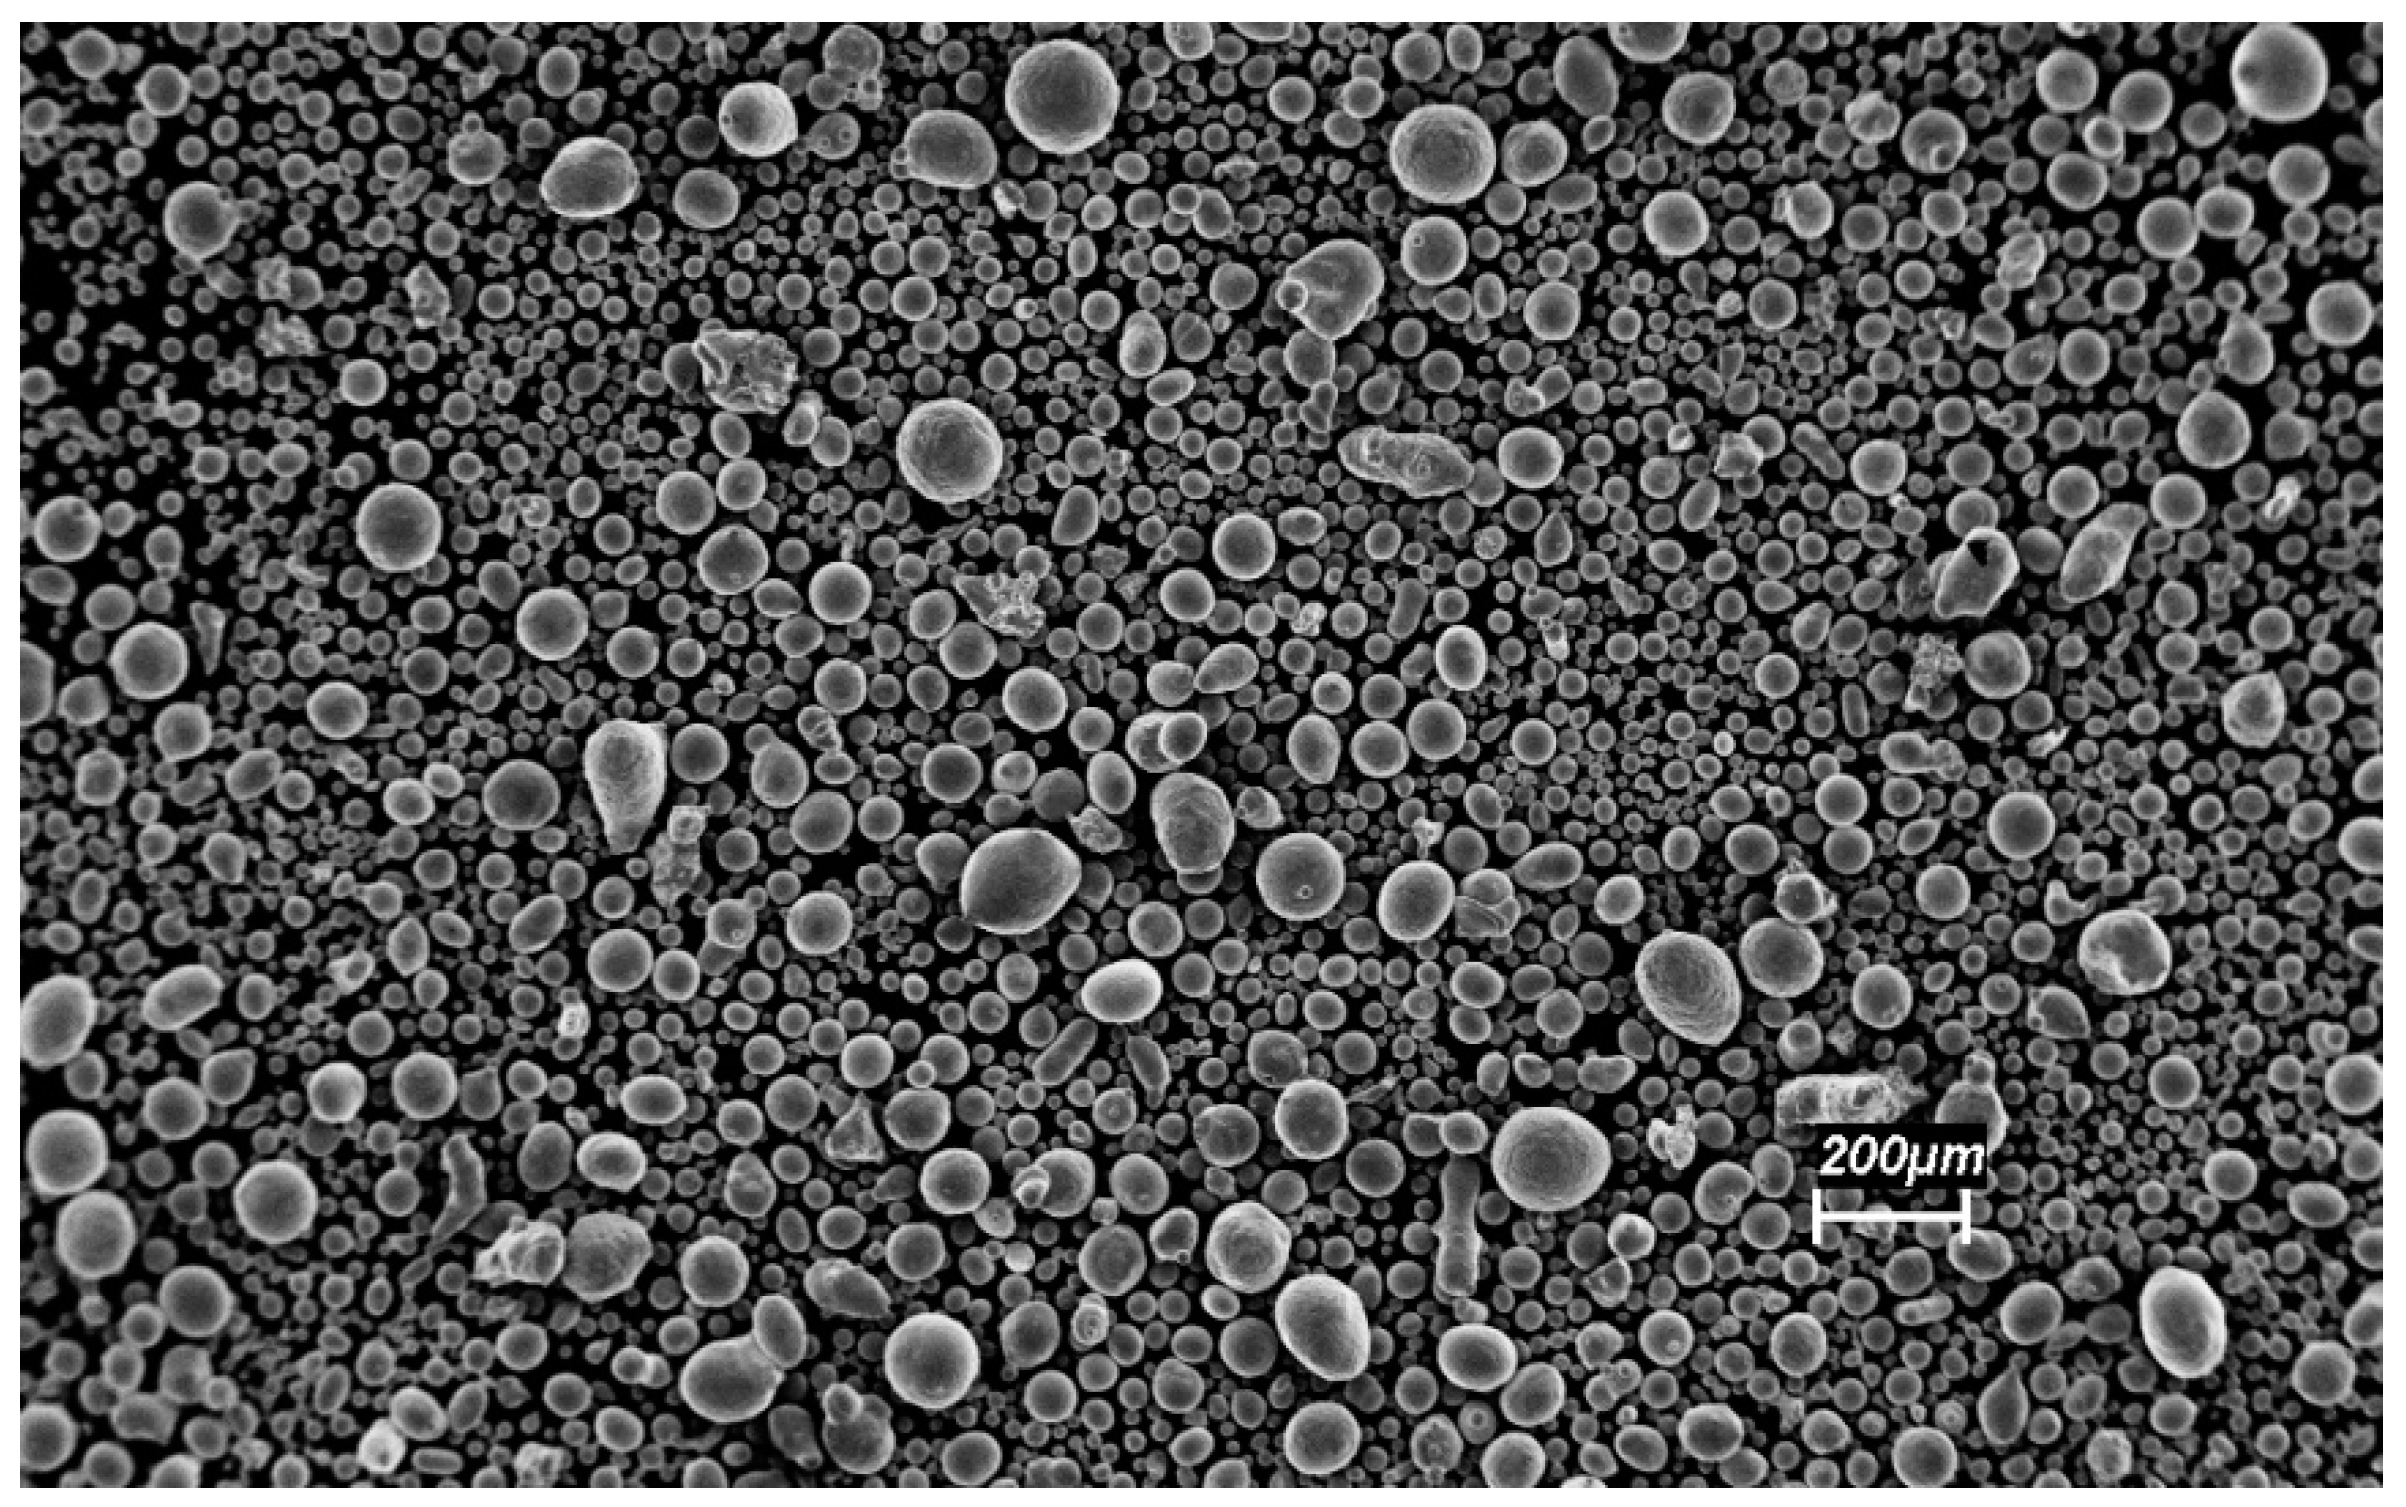
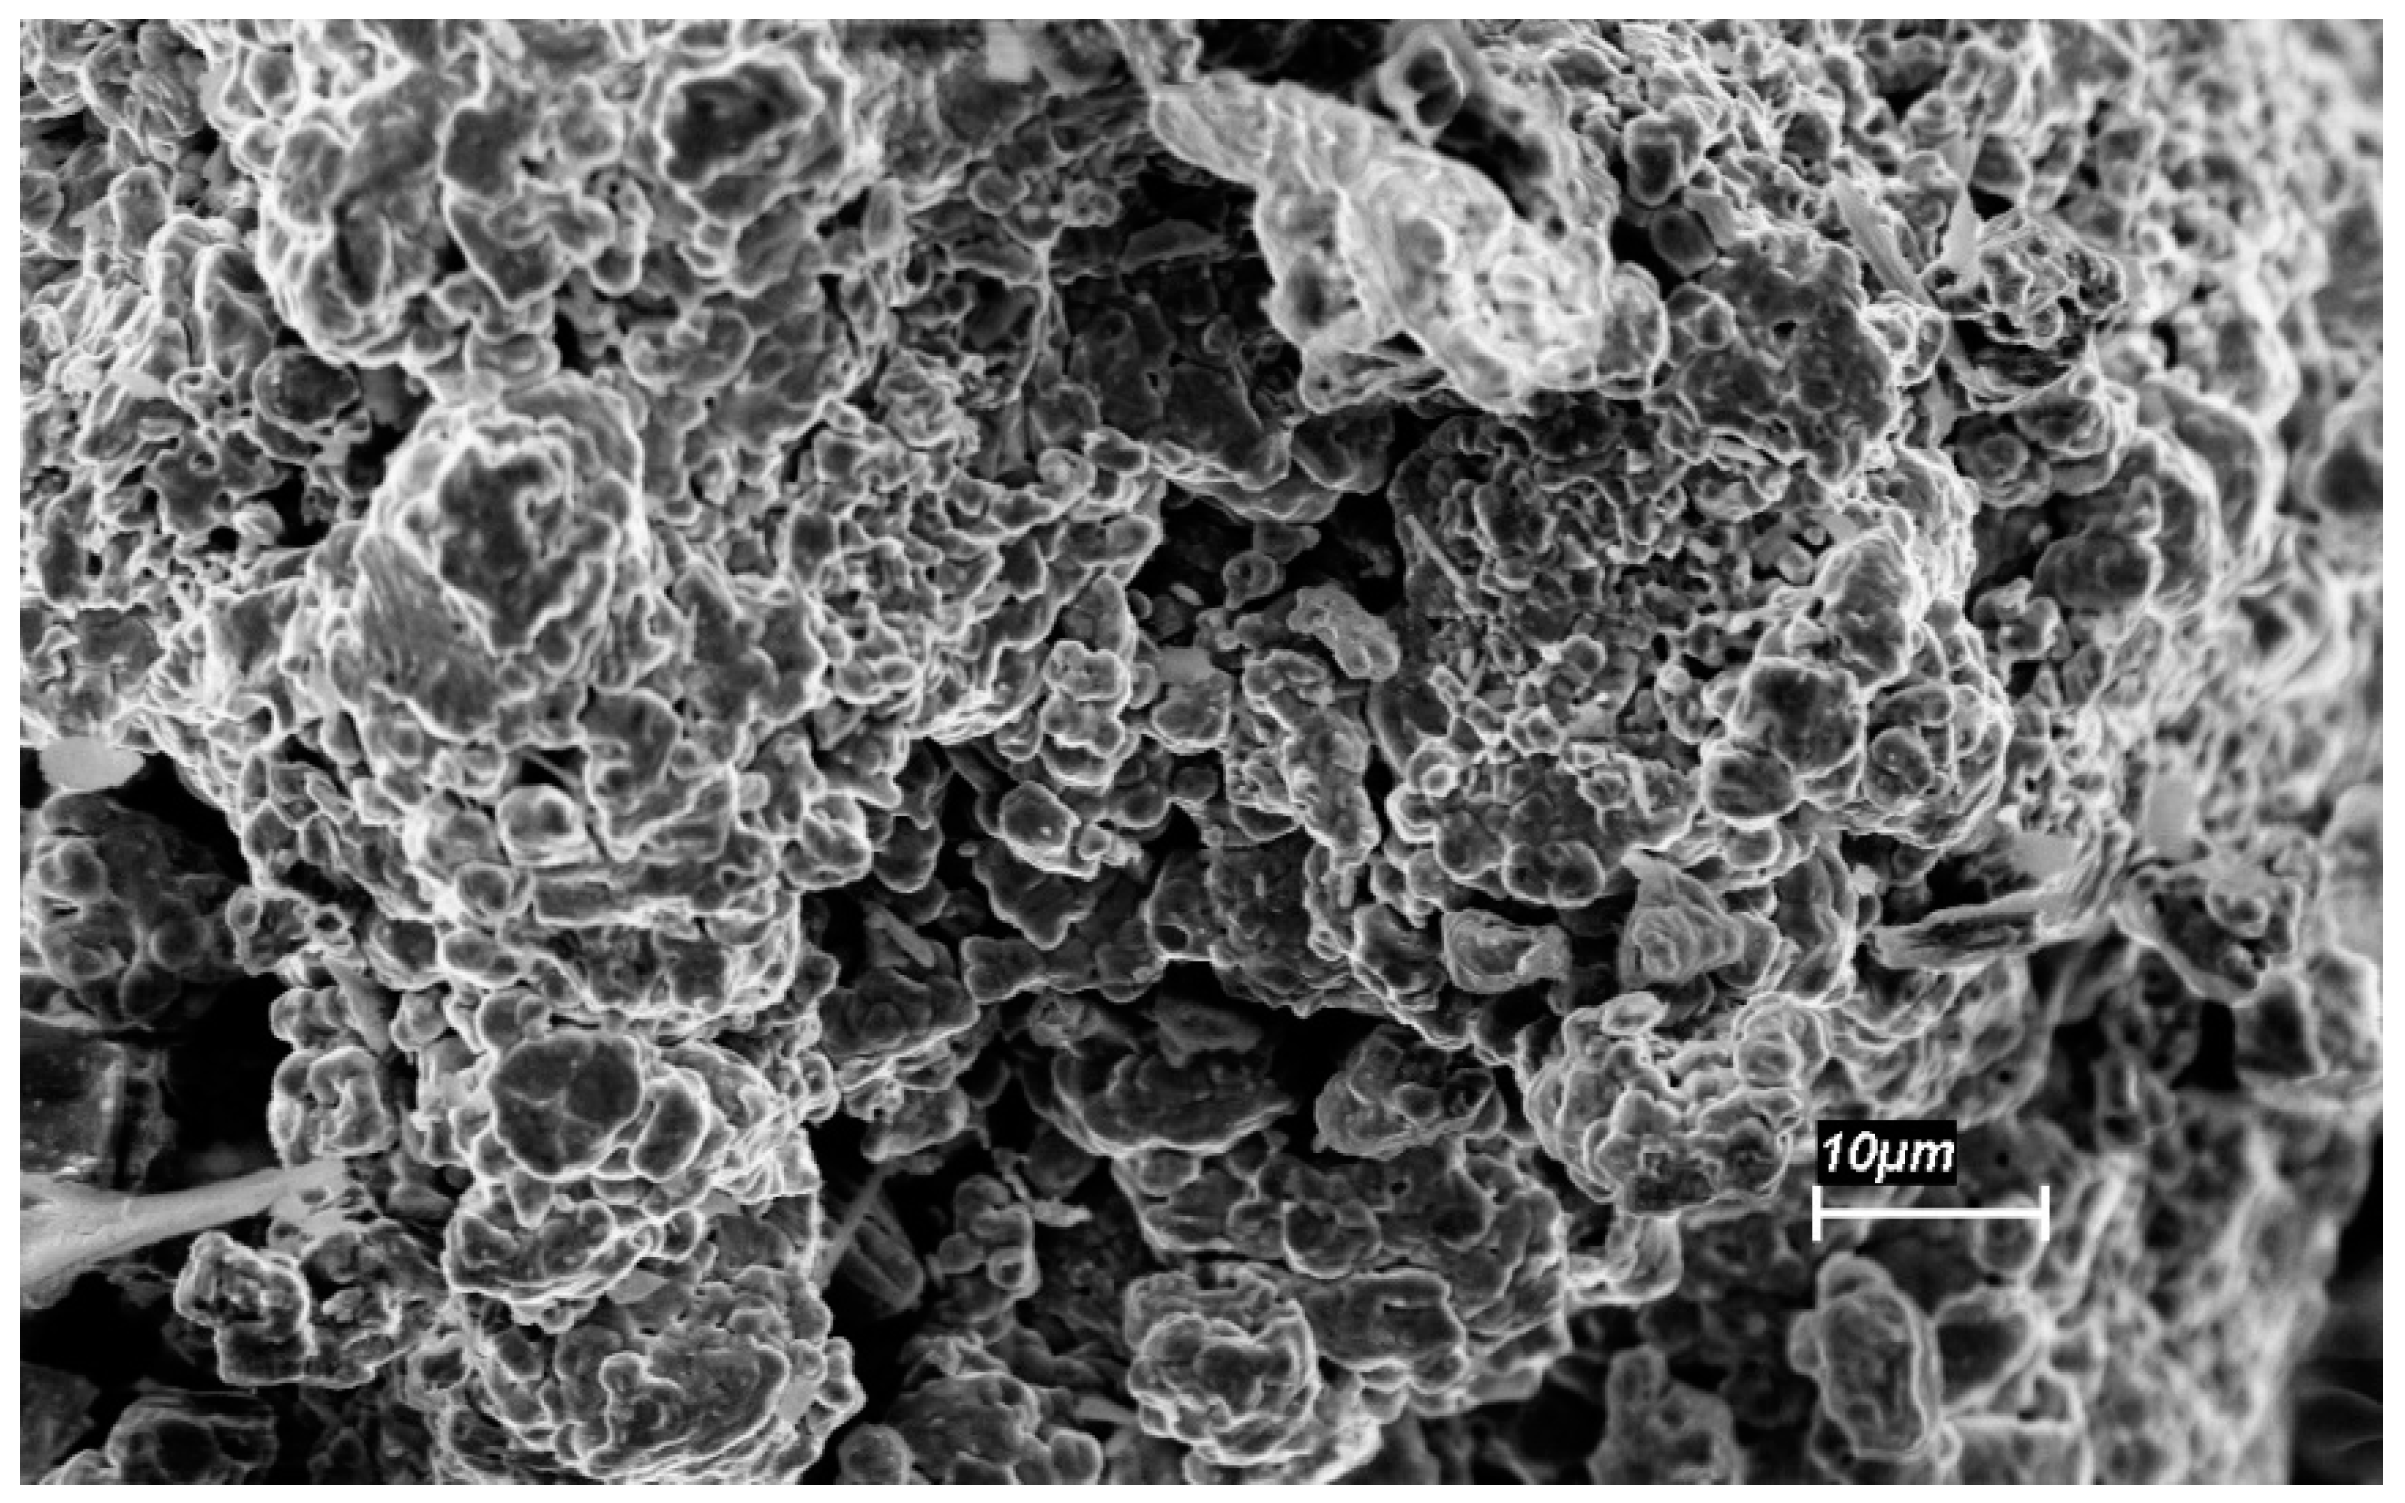
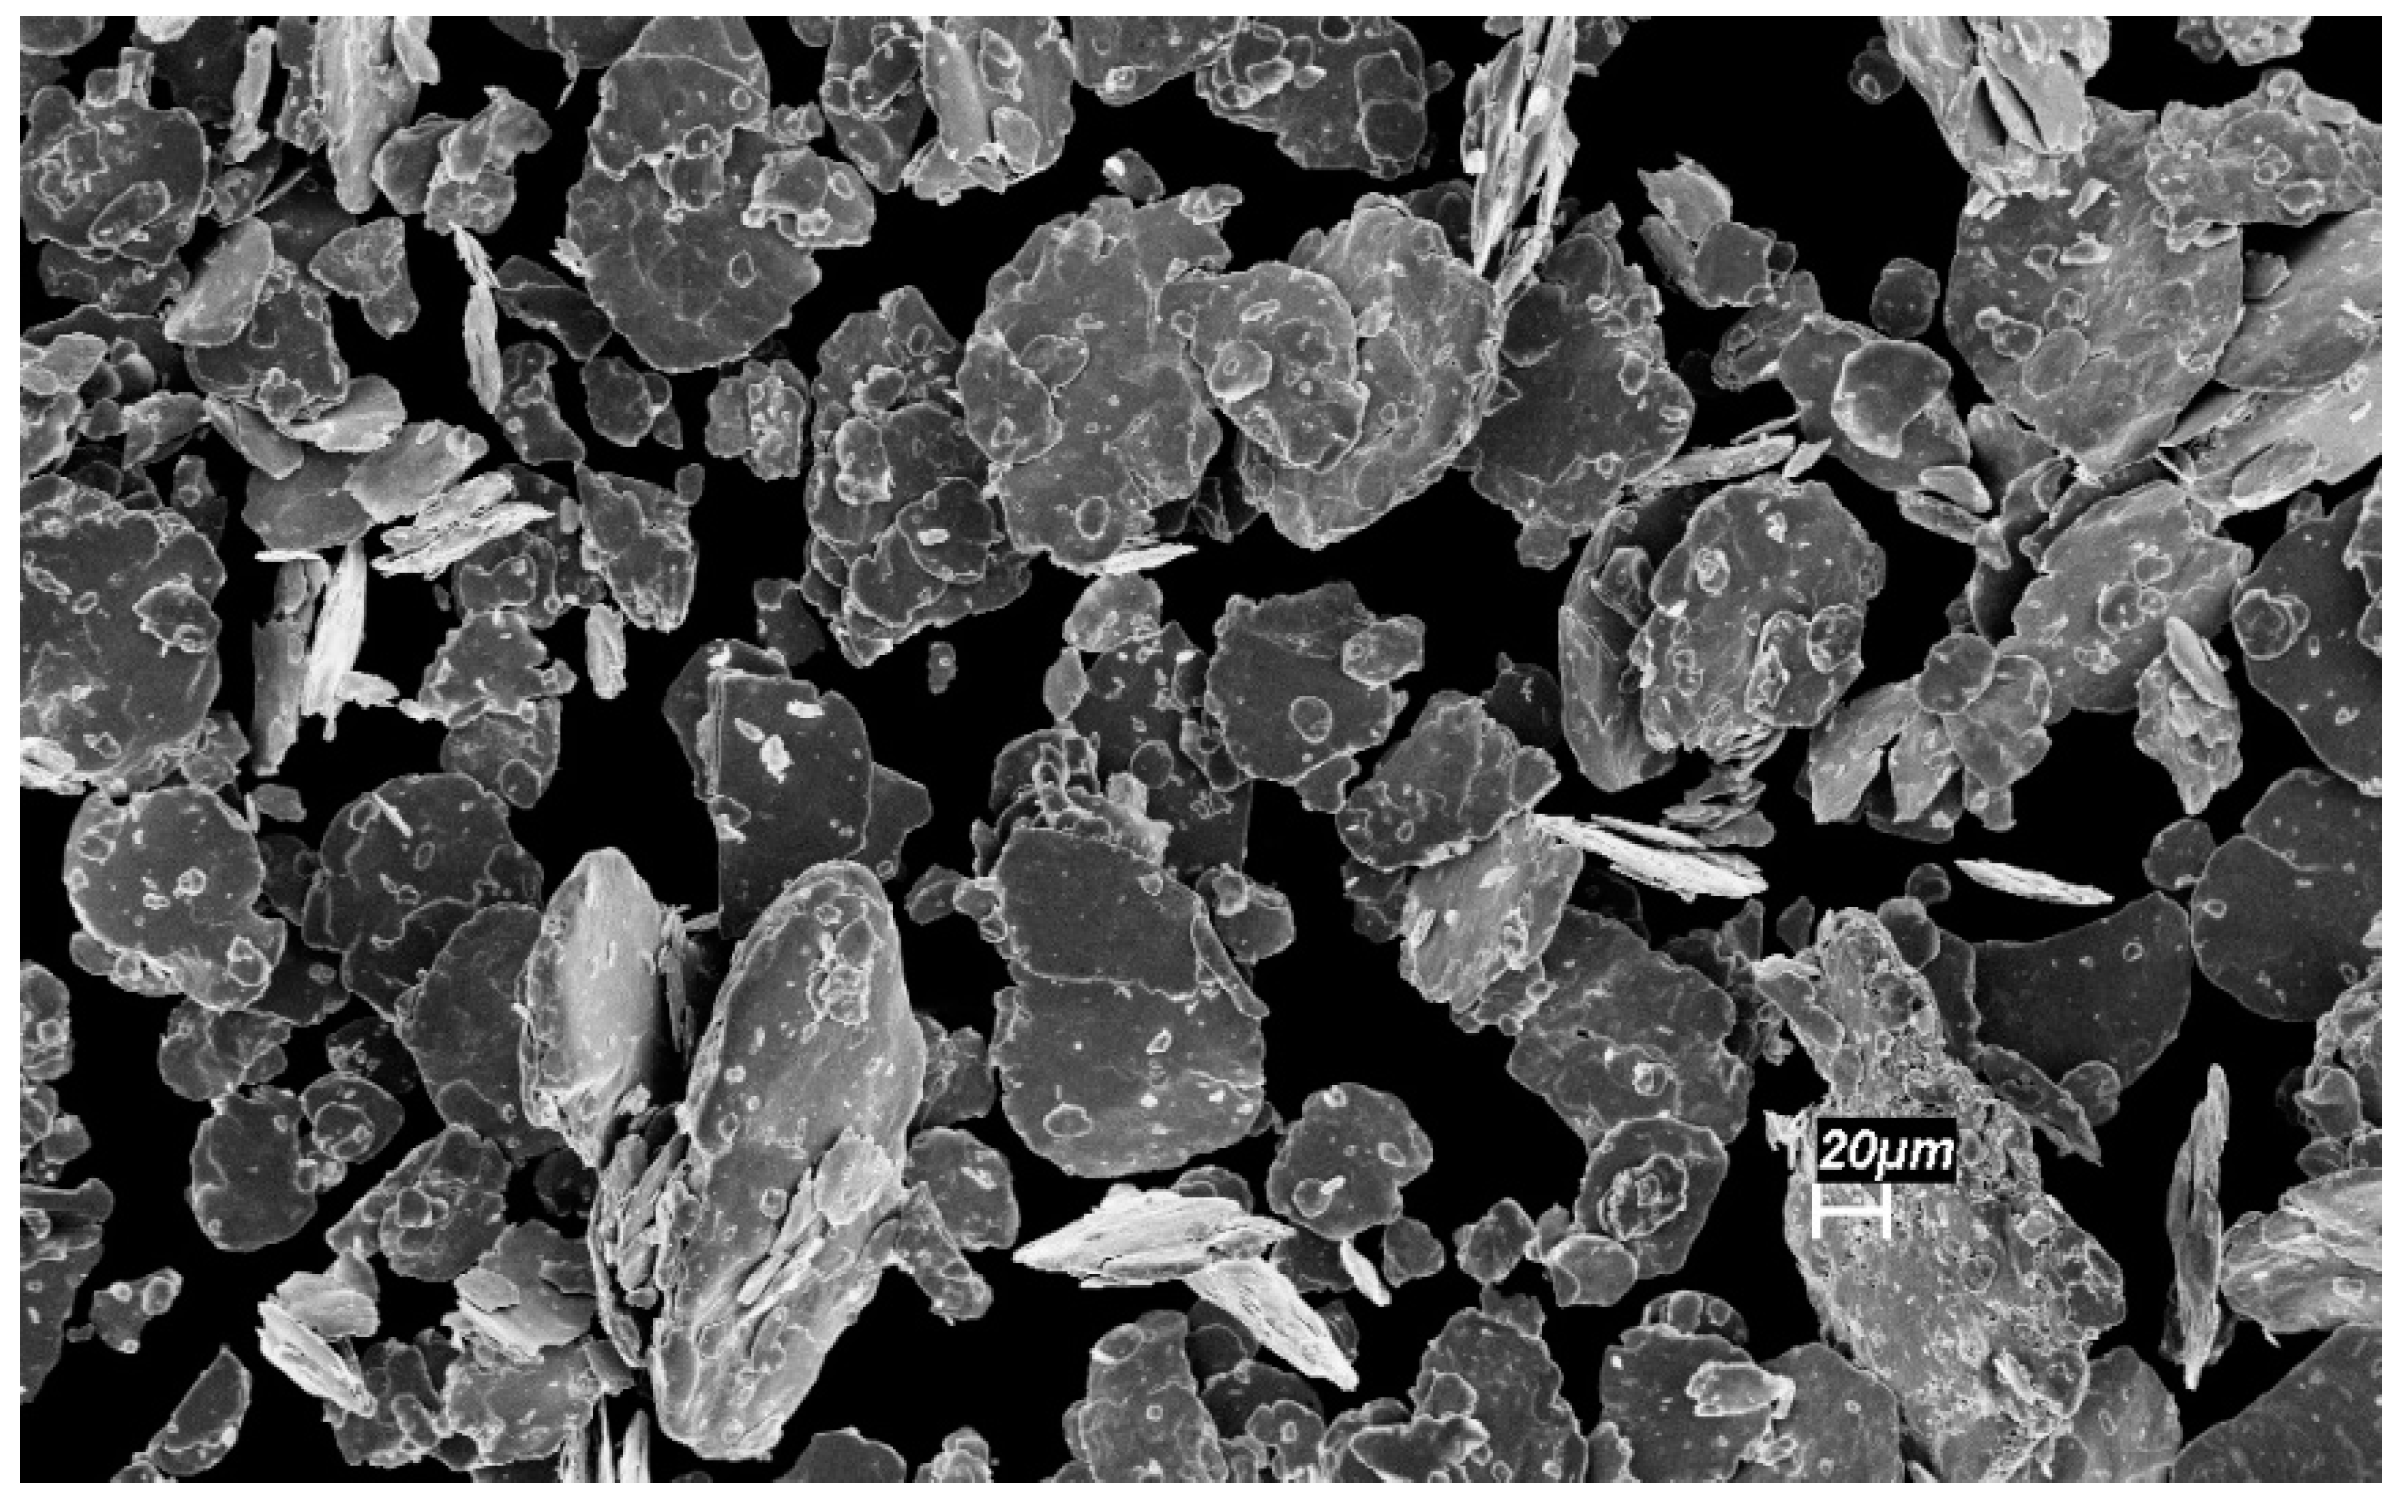
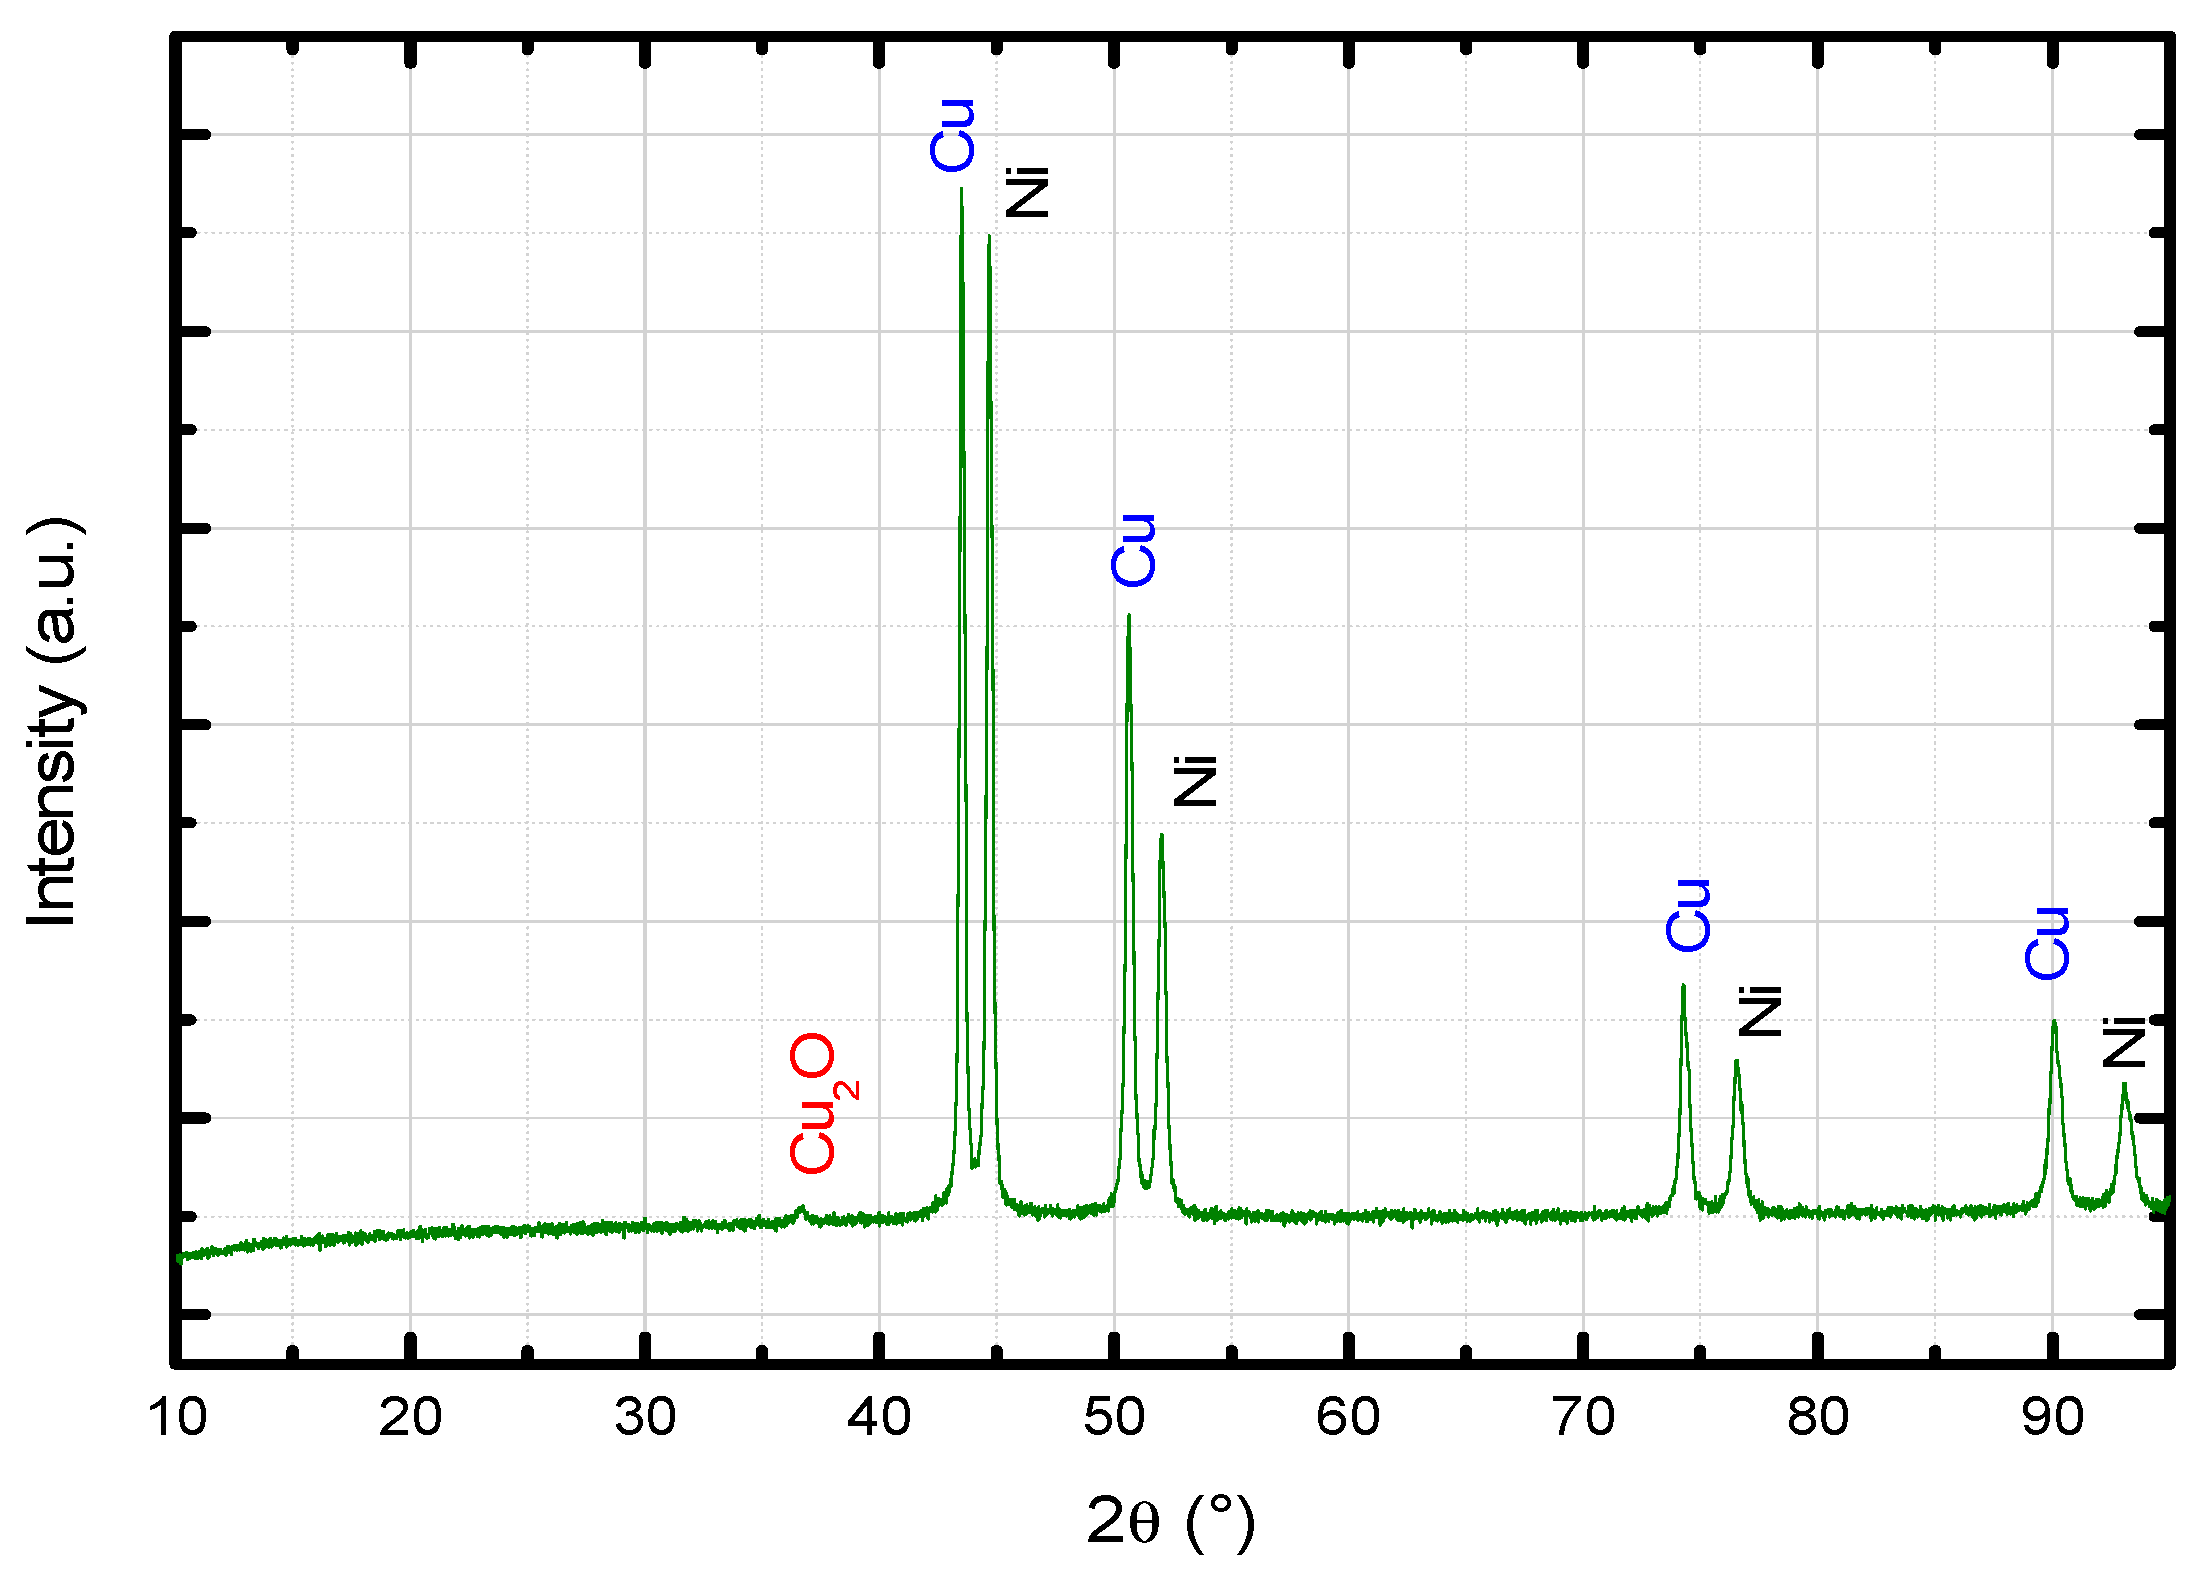
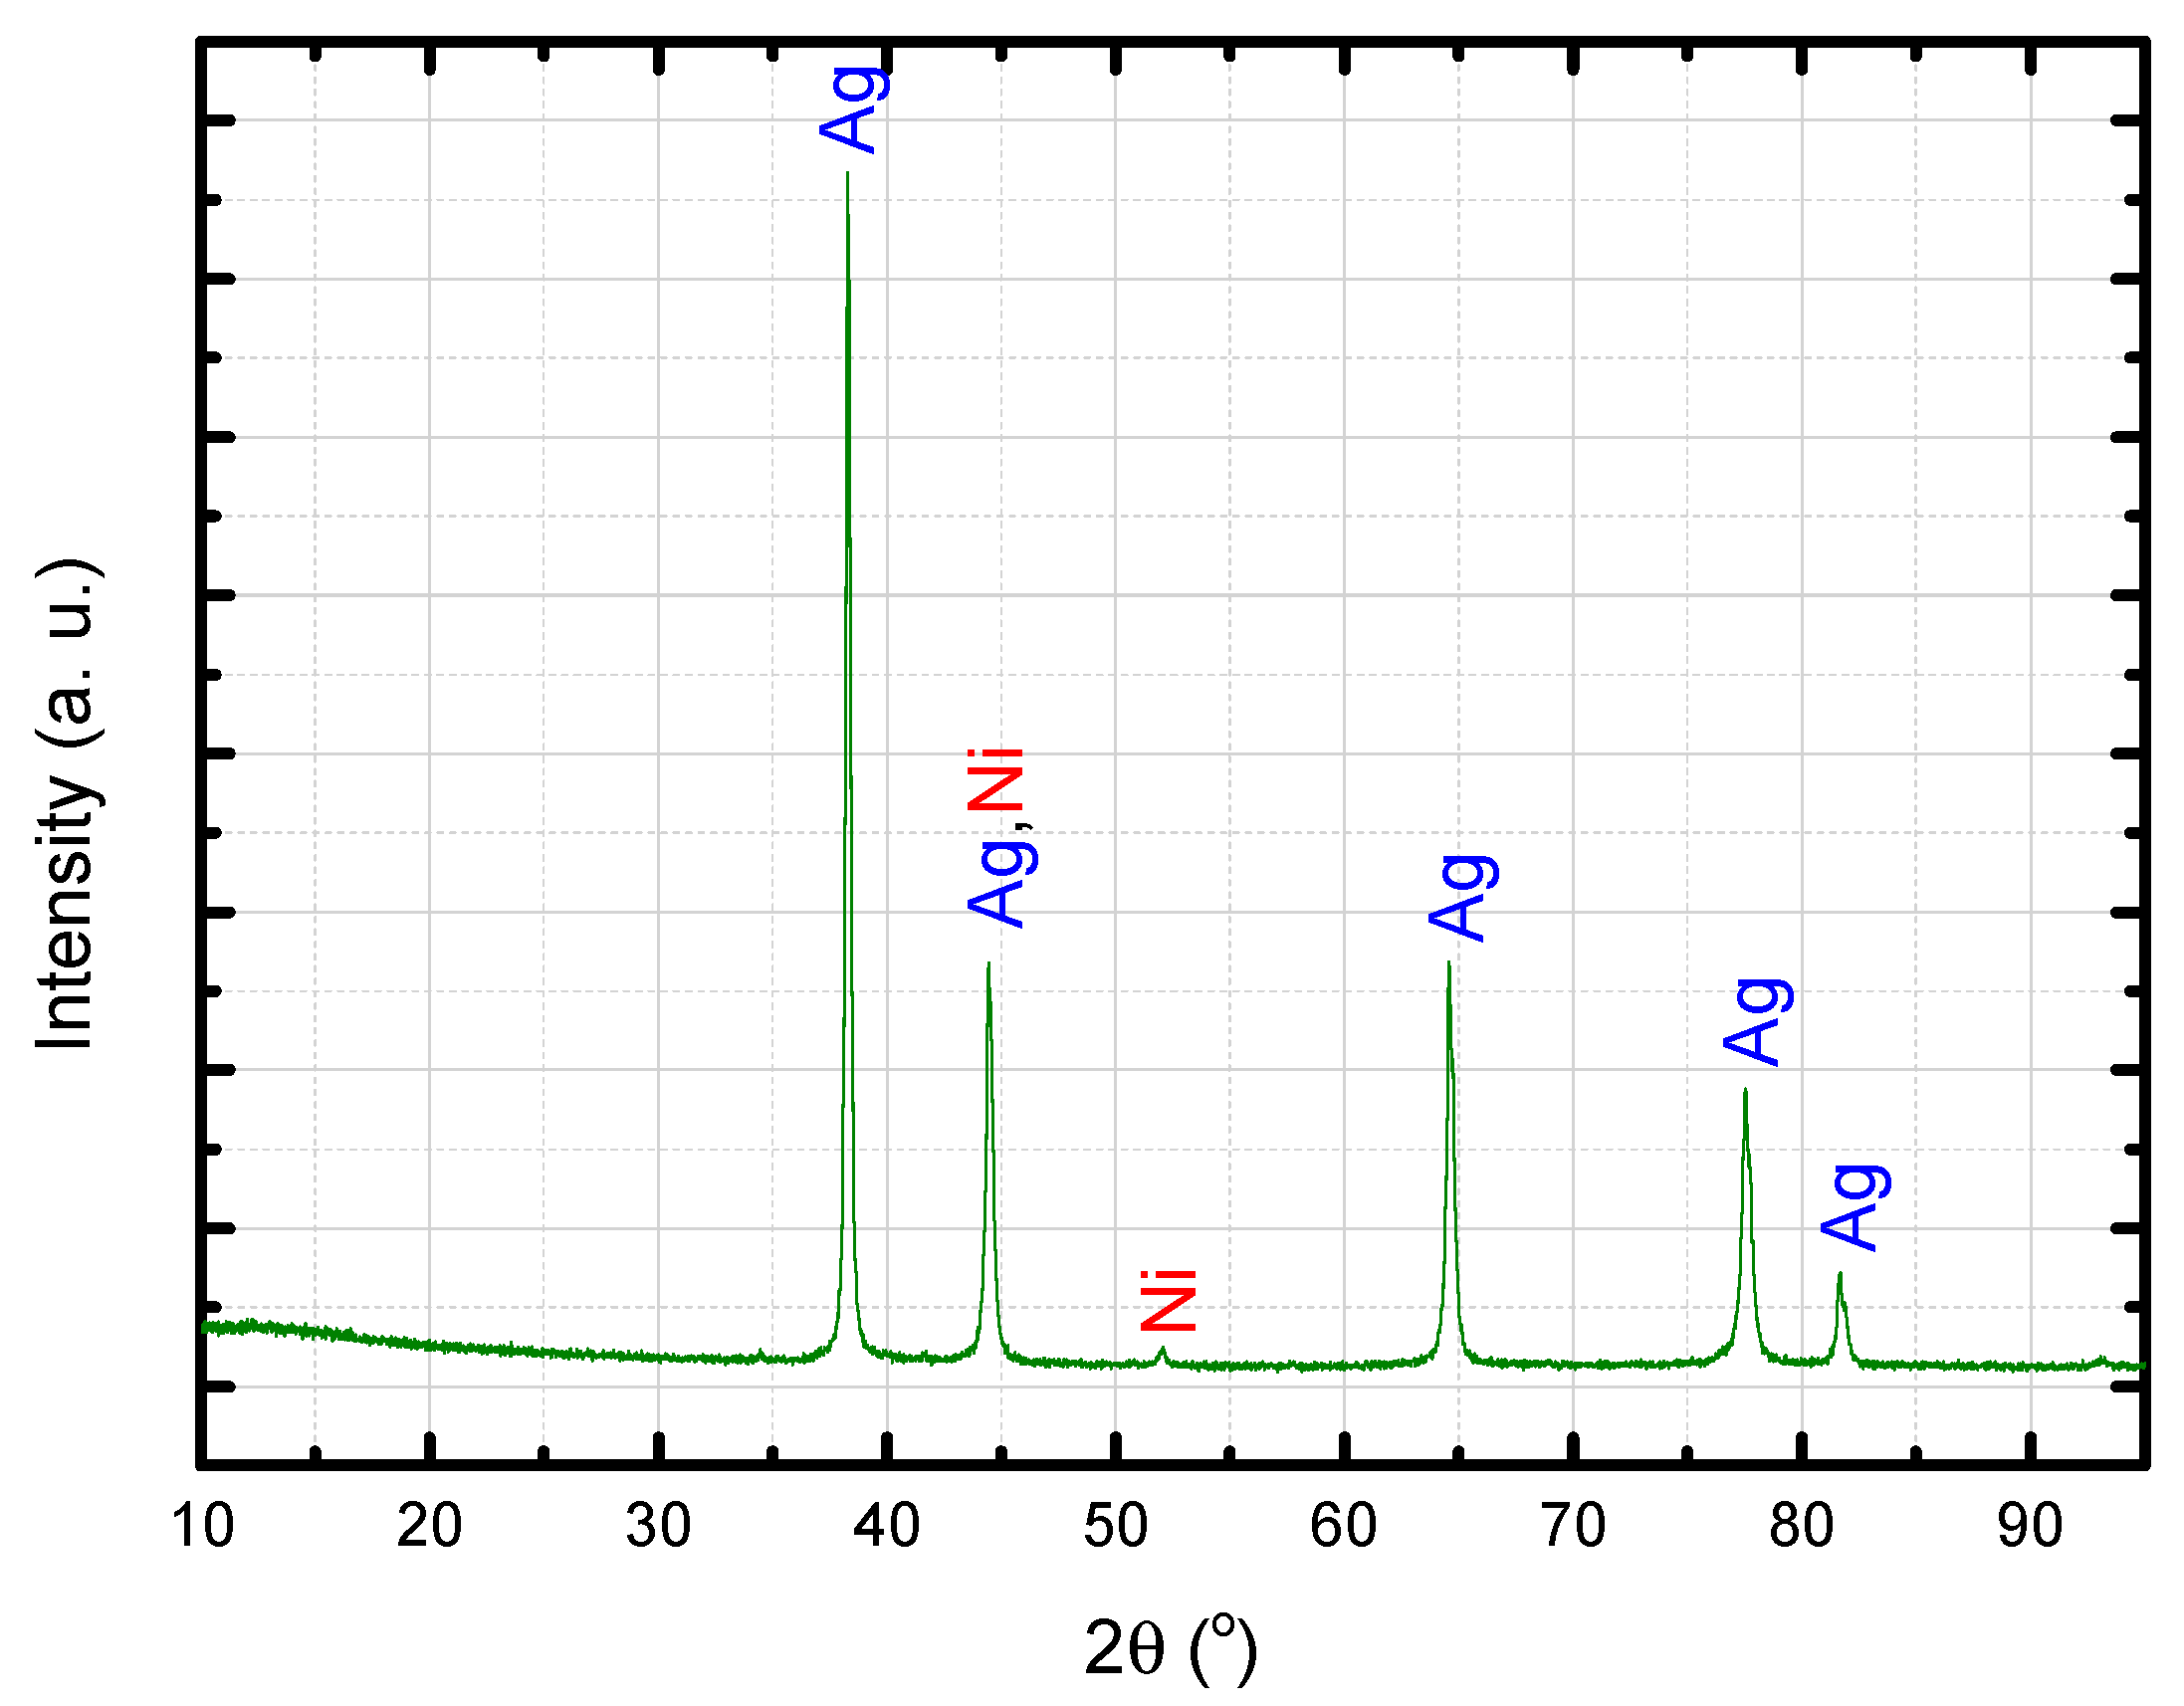
3.2. Characterization of the Mechanically-Alloyed Ag–Ni and Cu–Ni Powders
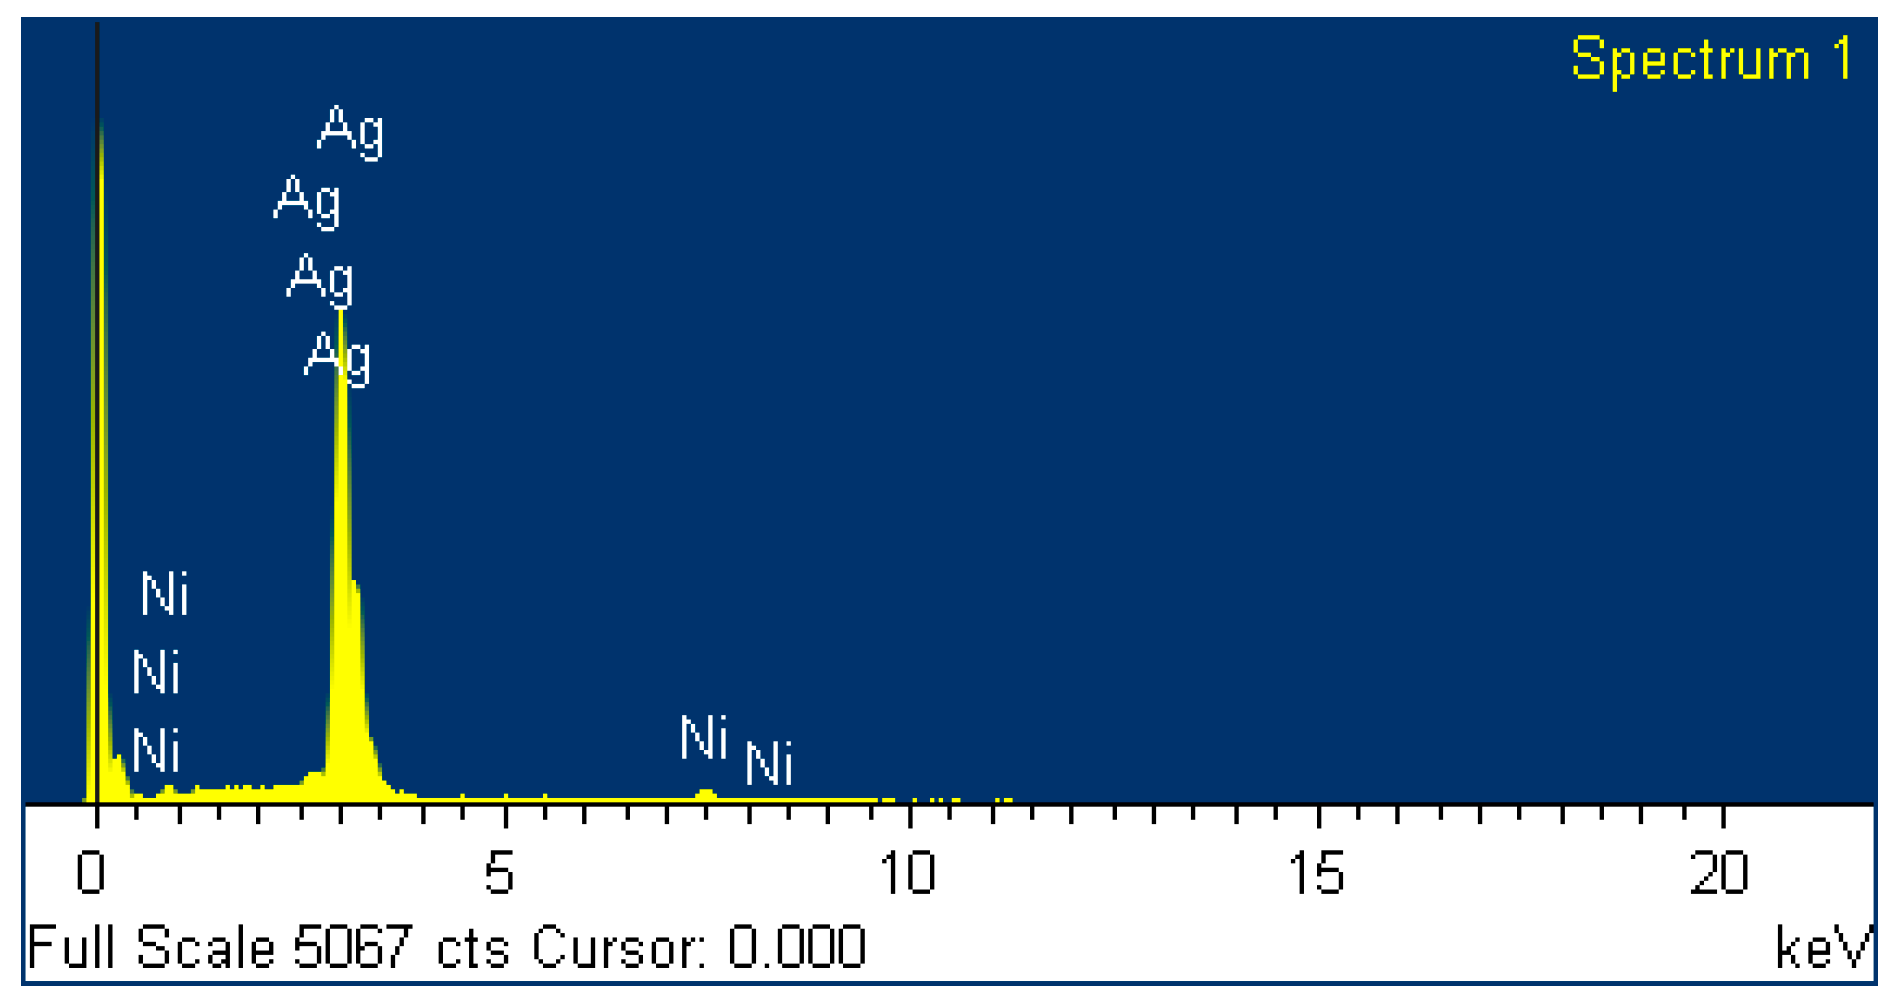
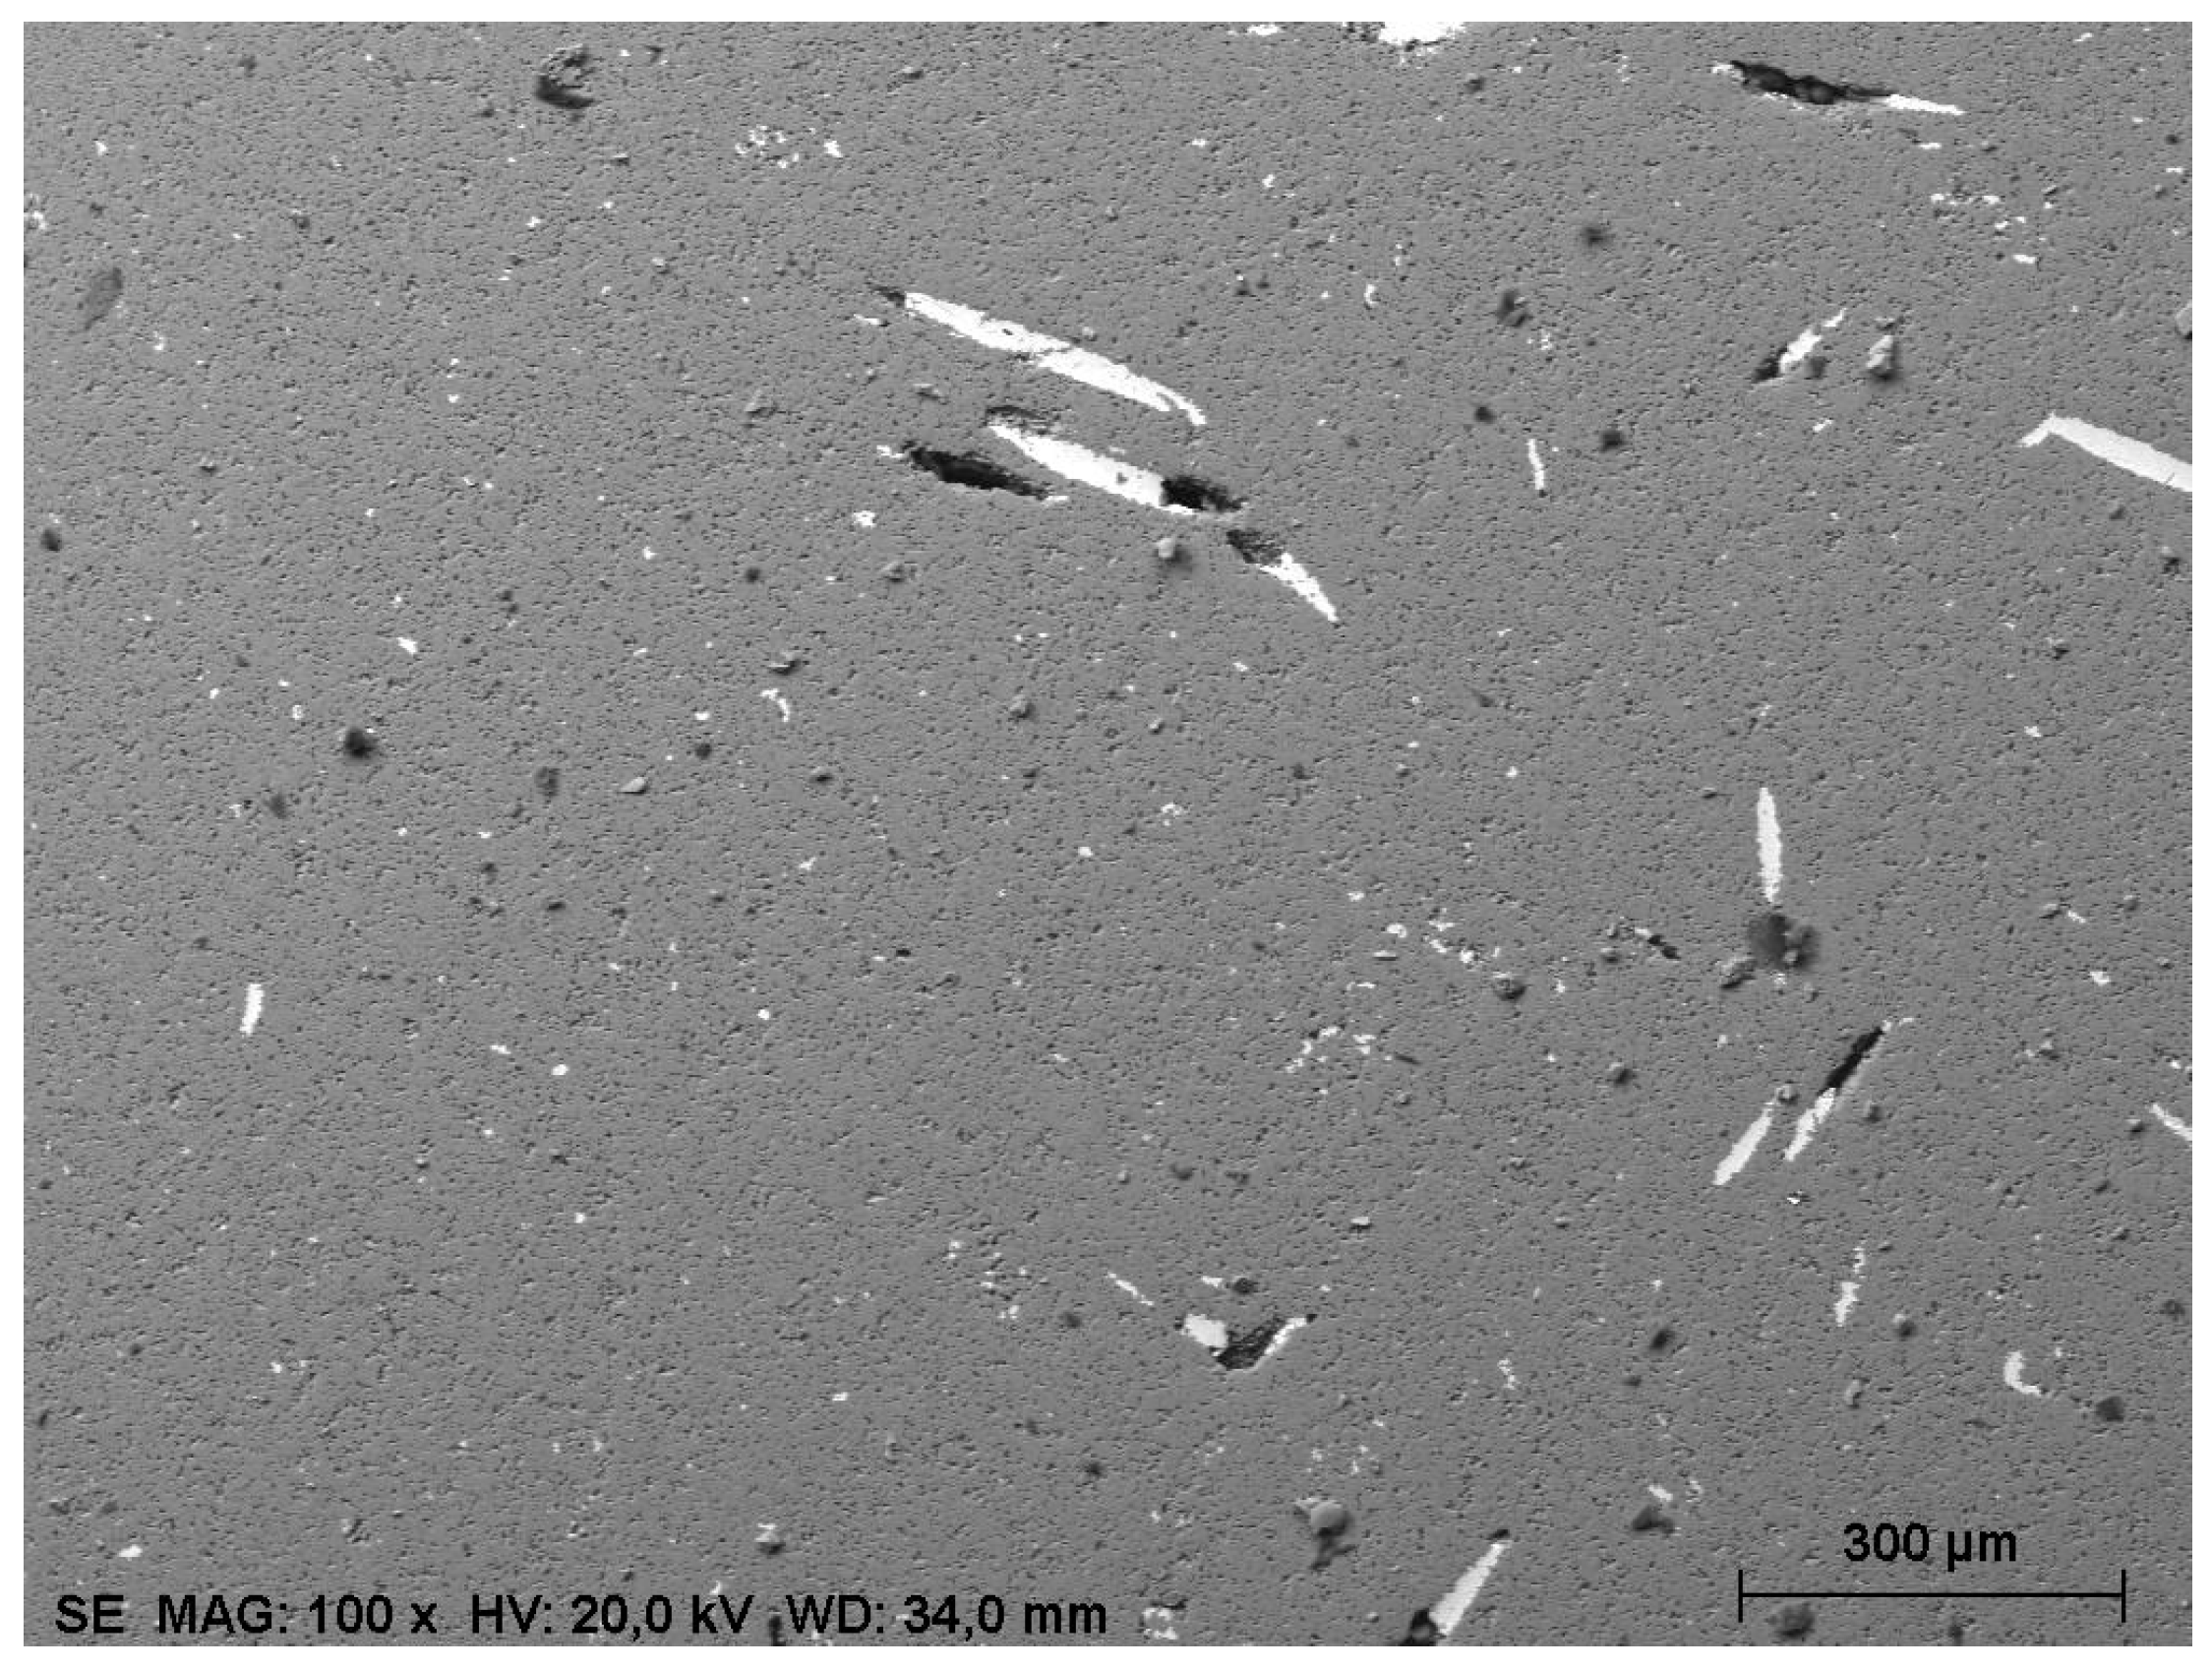
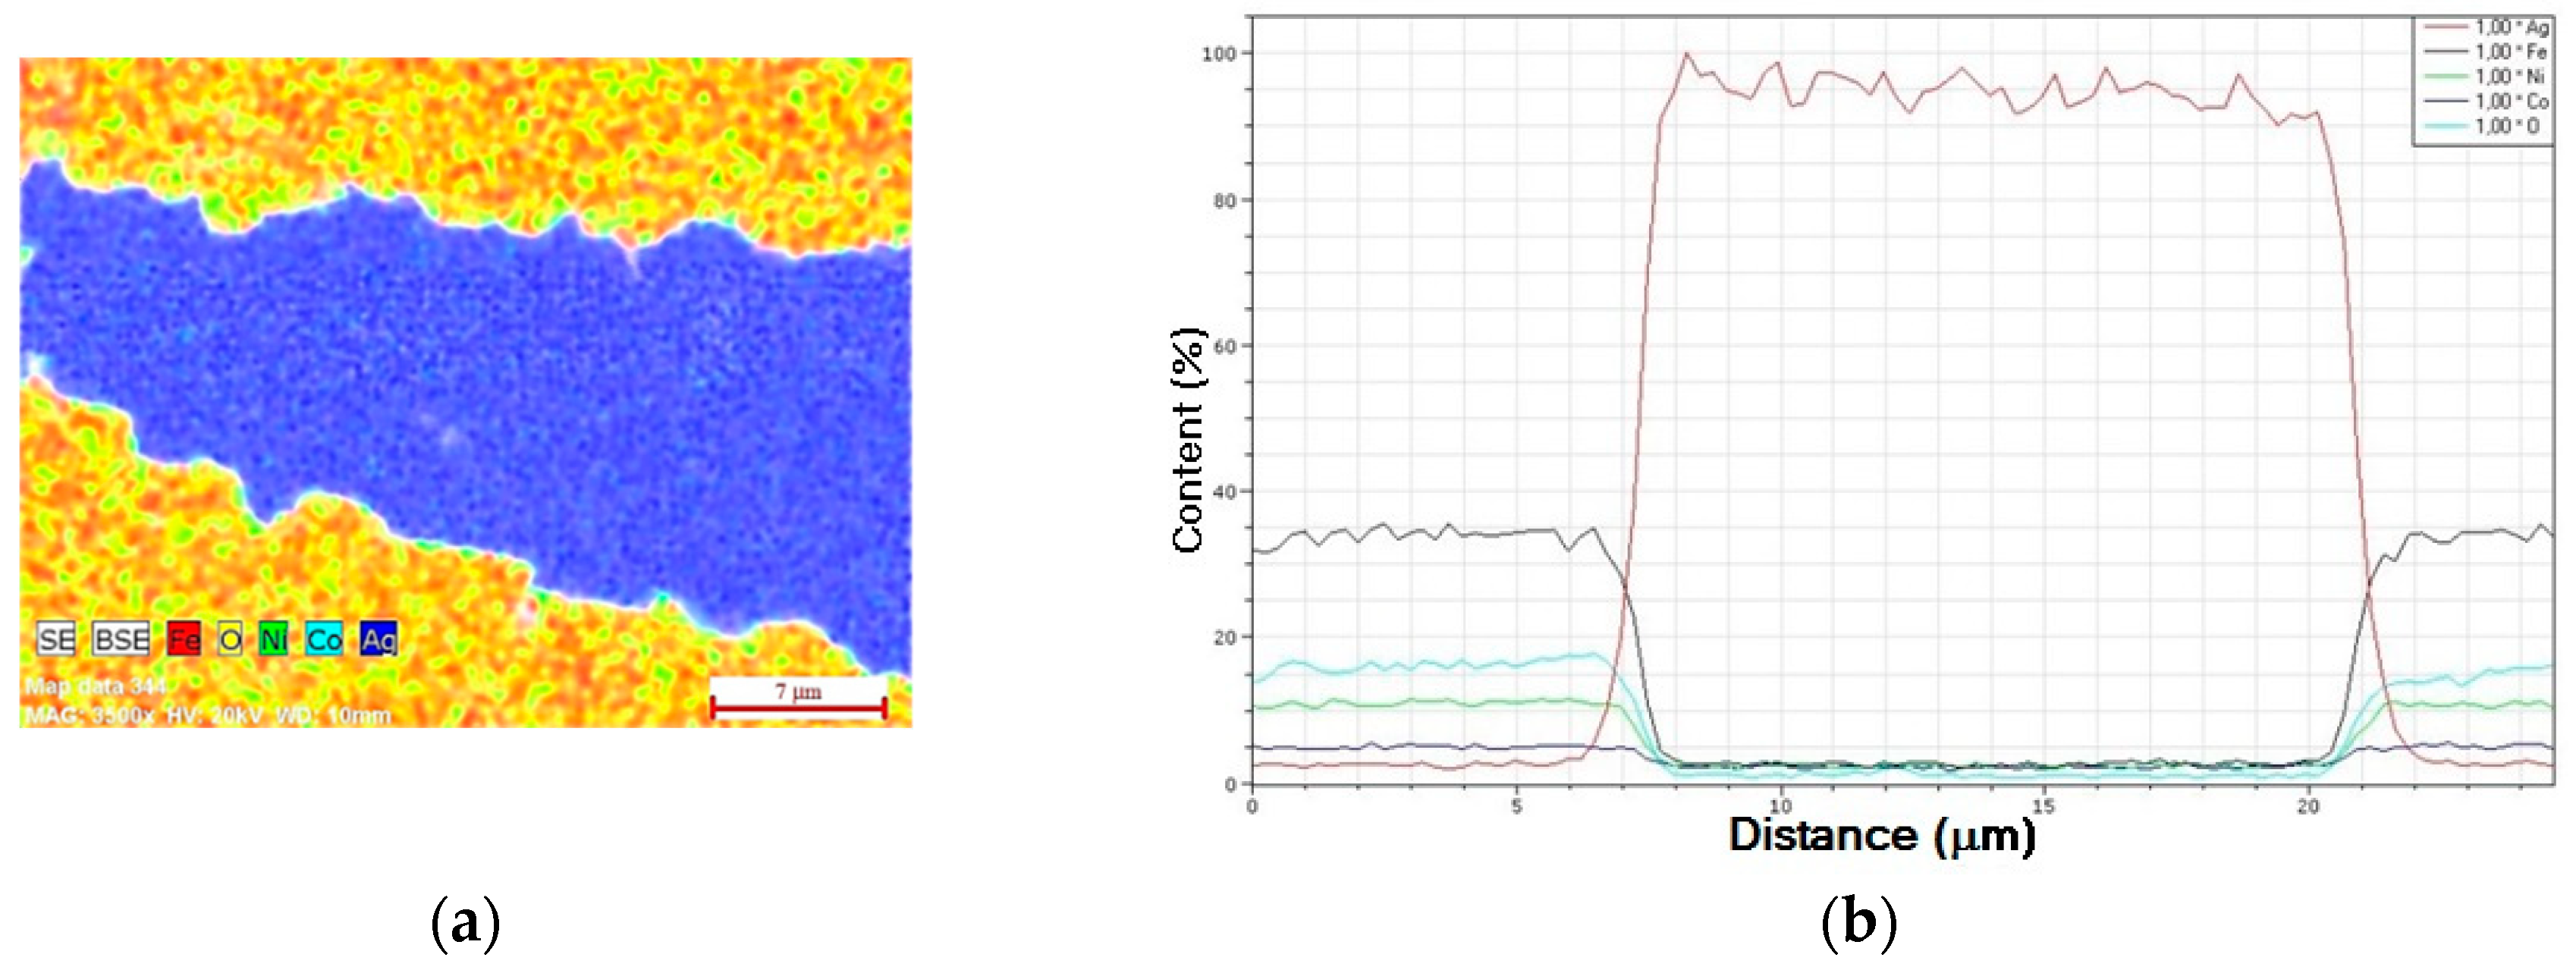
3.3. Ag–Ni Cermet
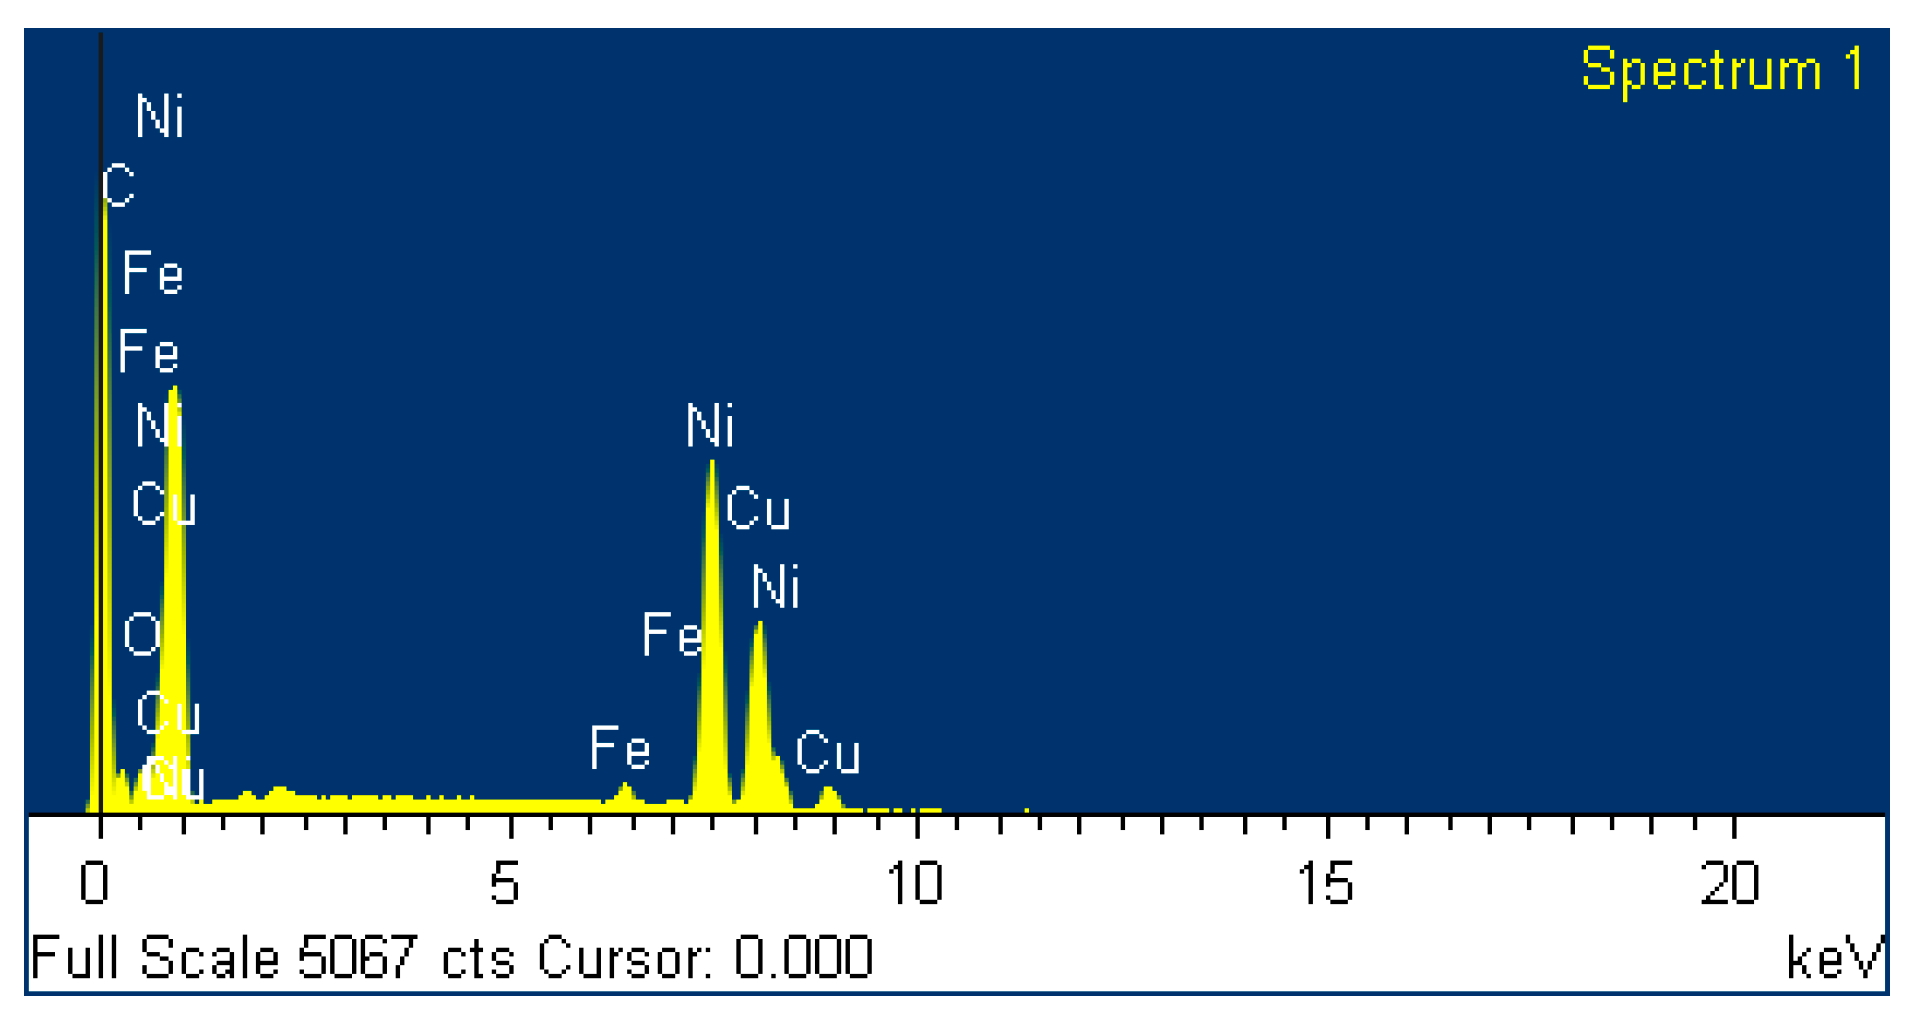
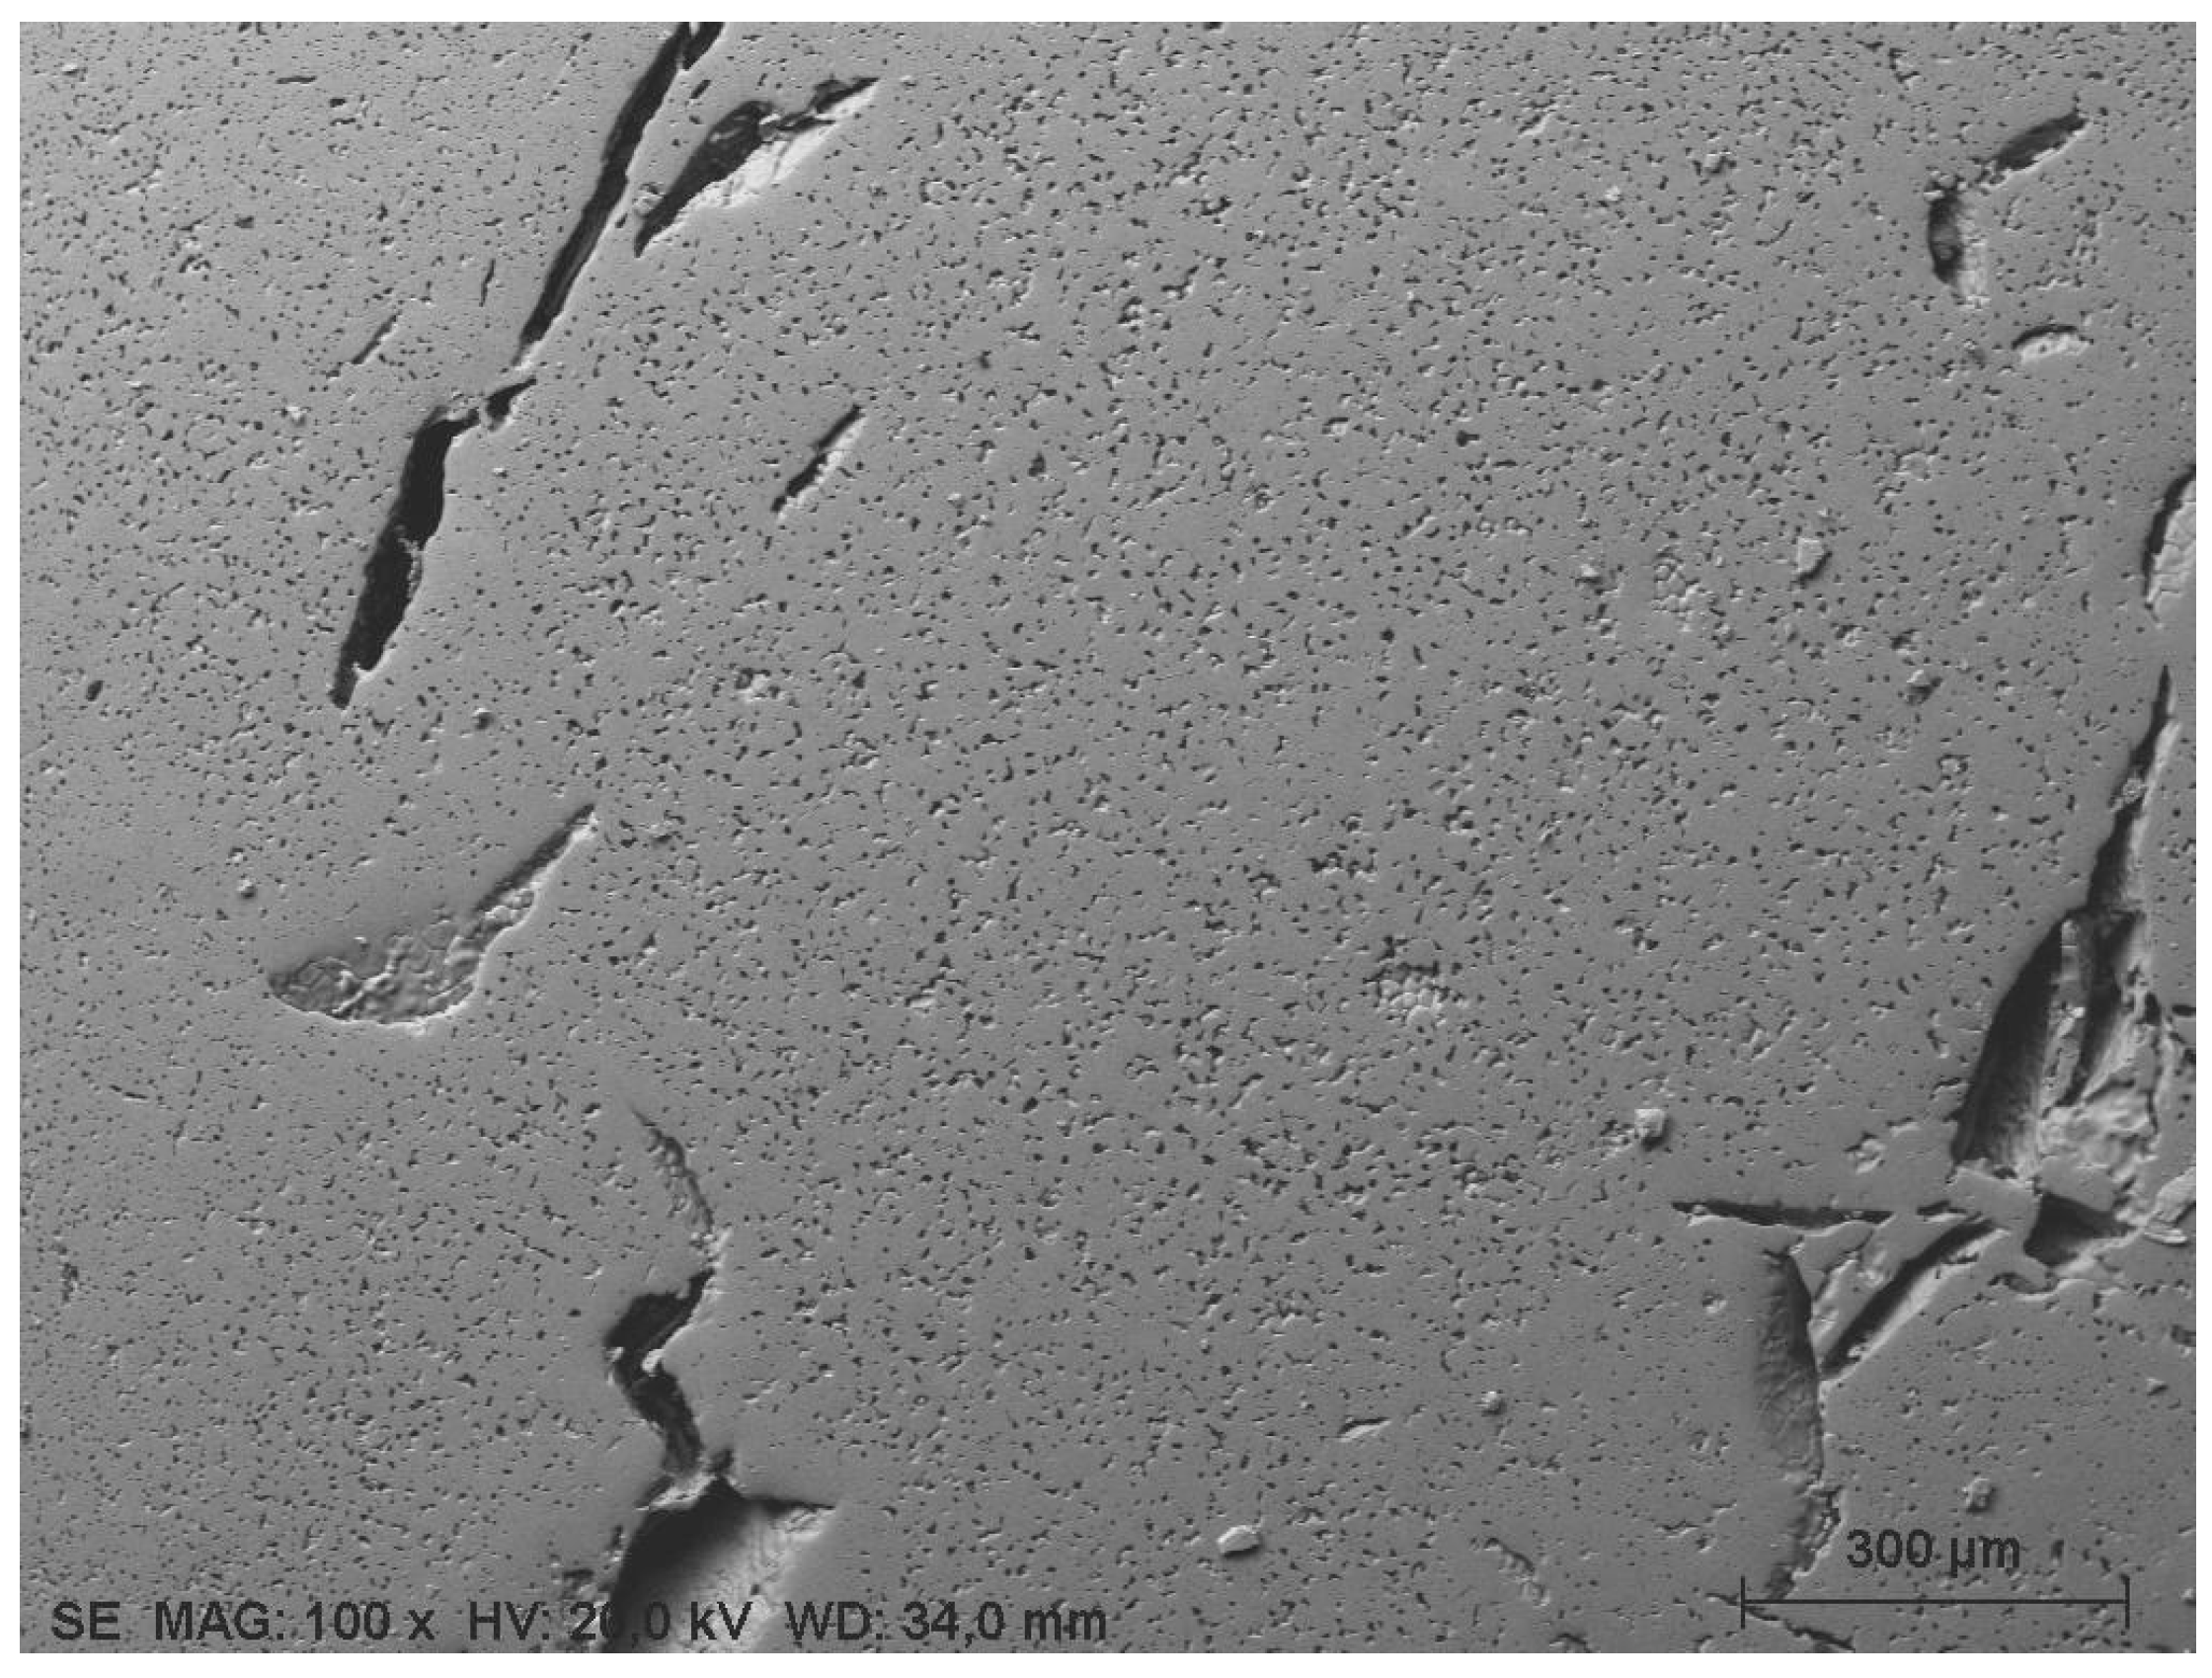
3.4. Cu–Ni Cermet
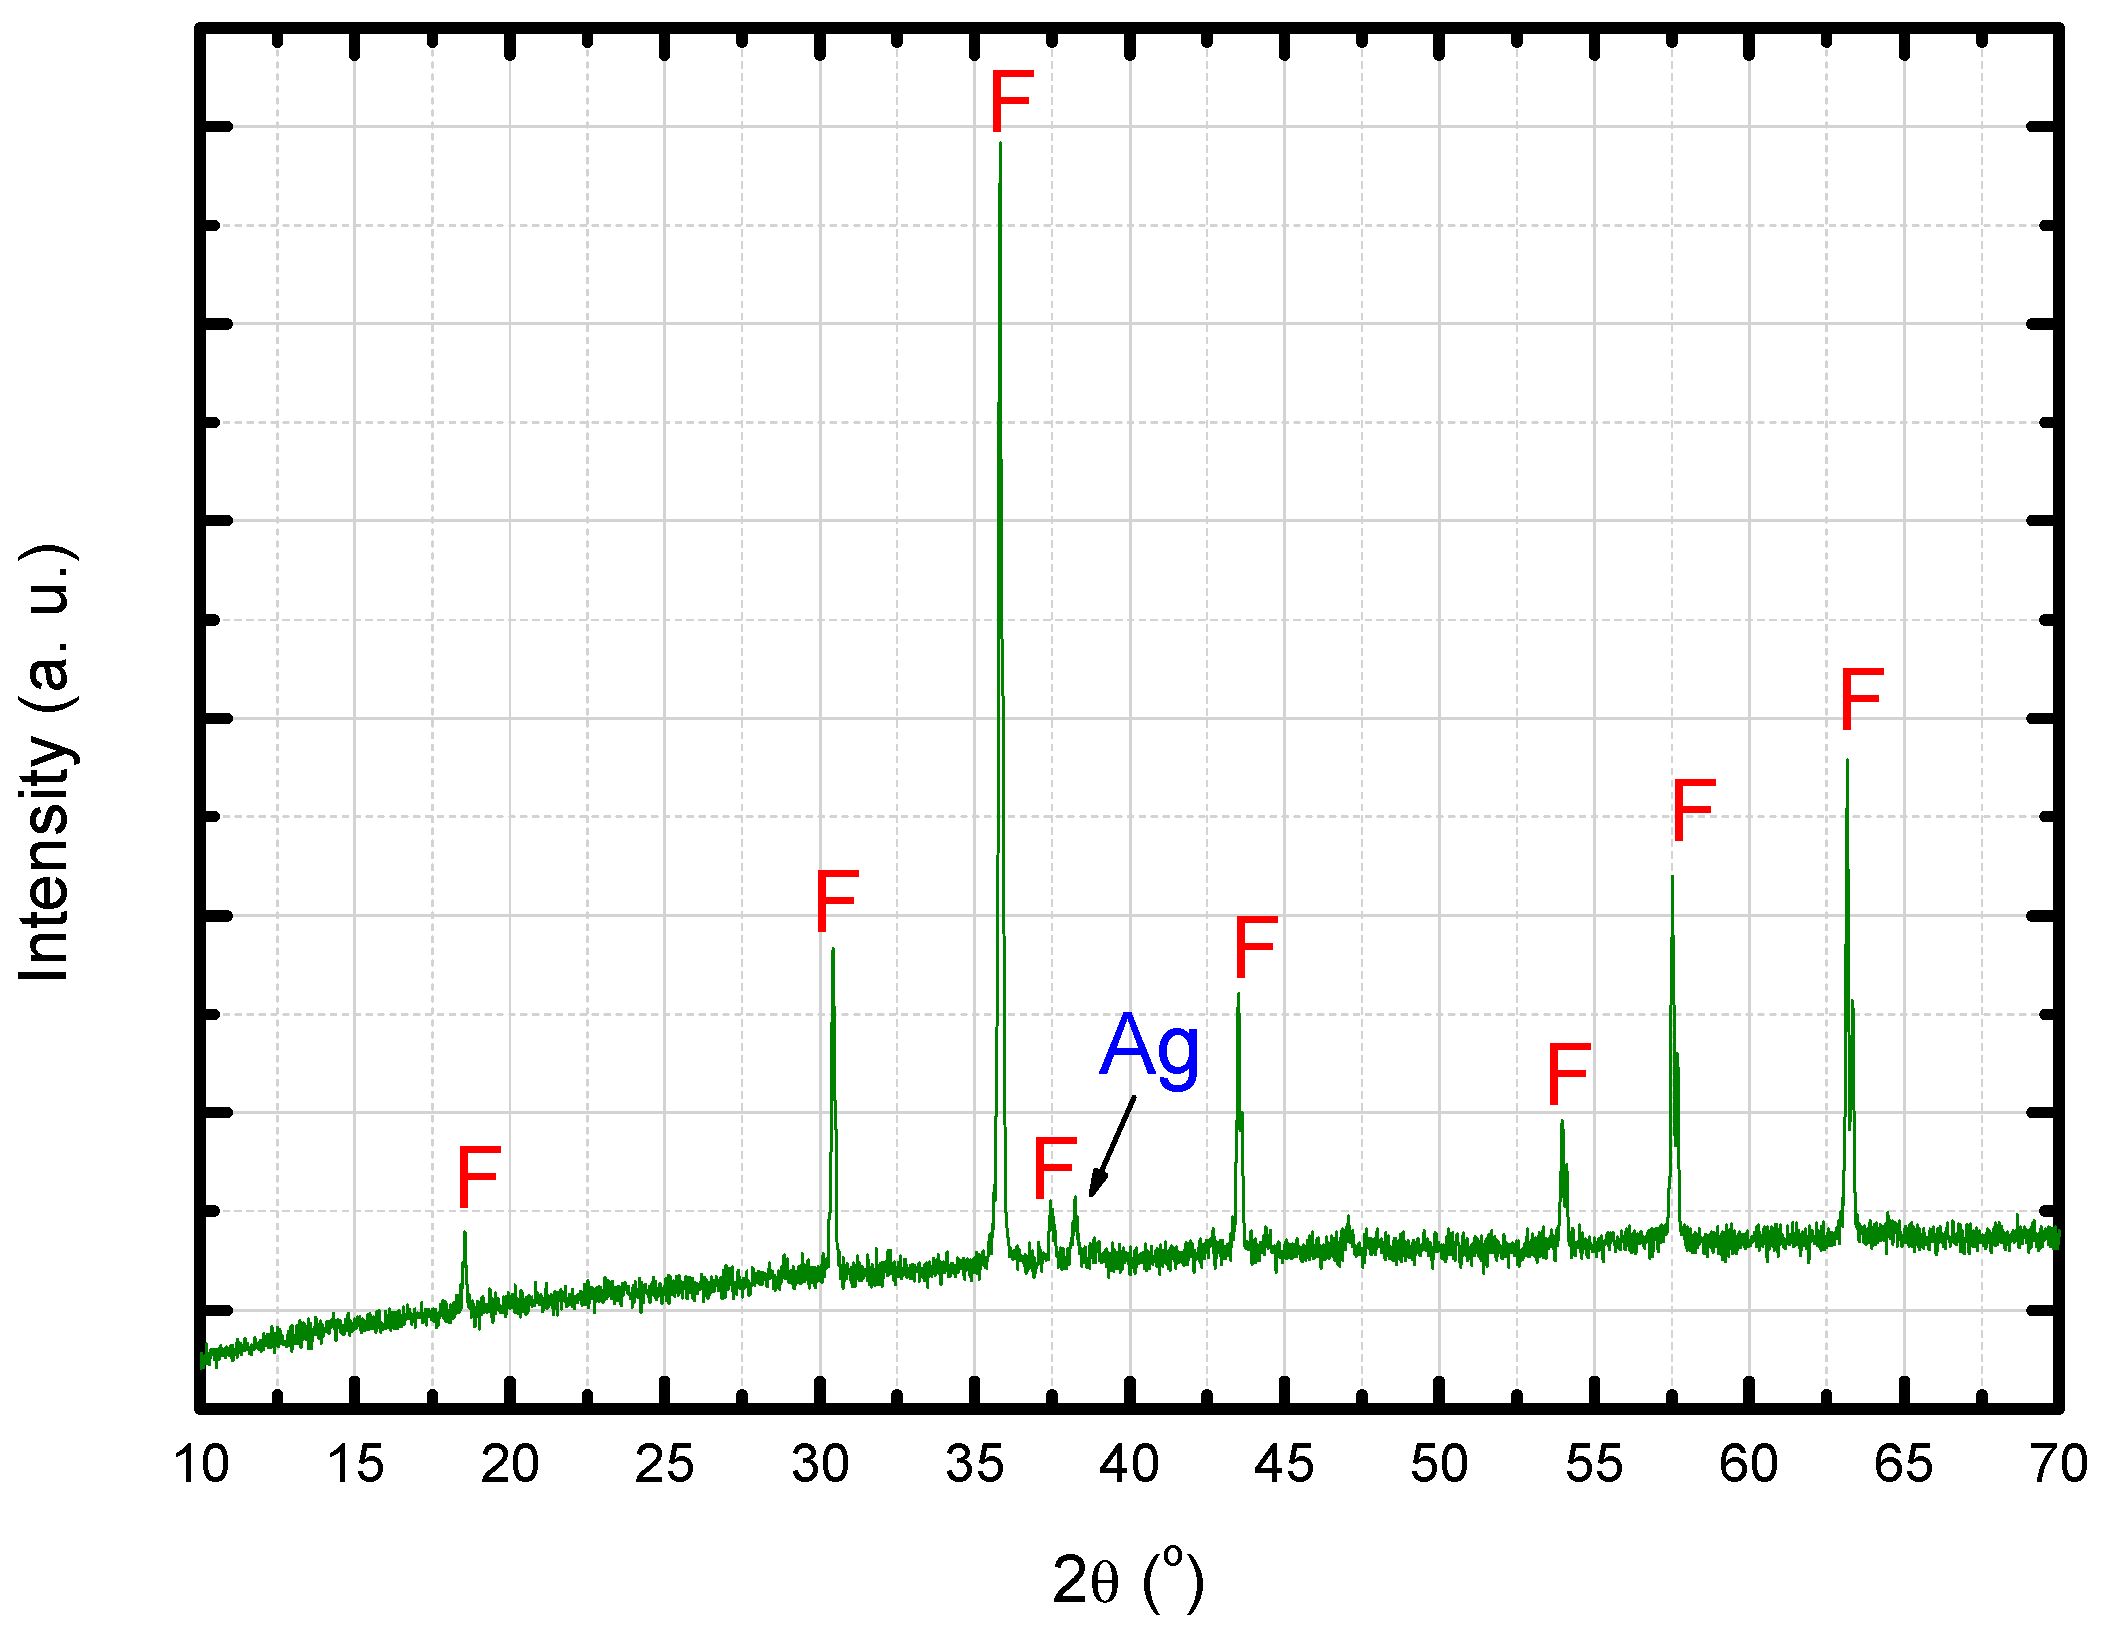
- second phases are present but in very low fractions, below the detection limit of the equipment;
- second phases have spinel structure, with lattice parameters similar to the ferrite matrix. In this case, the diffraction pattern of the second phase is very similar to the pattern of the ferrite matrix;
- the metallic phase totally diffused to the ferrite matrix, without precipitation of second phases (this hypothesis may be refuted according to the results presented in Figure 18).
3.5. Ag–Cu Cermet
3.6. Ag Cermet
4. Discussion
5. Conclusions
- appropriate choice of the chemical composition of the metallic phase, in order to minimize the change in the composition of the ferrite and to obtain adequate melting point and wettability of the metal. It is suggested to use a metallic phase with melting point within the temperature range of the first sintering stage of the ferrite;
- selection of metallic powders with small and homogeneous particle size, in order to prevent high stresses during sintering, when the metal melts.
Author Contributions
Funding
Acknowledgments
Conflicts of Interest
References
- Travitzky, N. Processing of ceramic-metal composites. Adv. Appl. Ceram. 2010, 111, 286–300. [Google Scholar] [CrossRef]
- Kim, Y.H.; Hashi, S.; Ishiyama, K.; Arai, K.I.; Inoue, M. Remote temperature sensing system using reverberated magnetic flux. IEEE Trans. Magn. 2000, 35, 3643–3645. [Google Scholar] [CrossRef]
- De Brito, V.L.O.; Migliano, A.C.C.; Lemos, L.V.; de Melo, F.C.L. Ceramic processing route and characterization of a Ni-Zn ferrite for application in a pulsed-current monitor. Prog. Electromagn. Res. 2009, 91, 303–318. [Google Scholar] [CrossRef]
- Bichurin, M.I.; Petrov, V.; Petrov, R.; Kiliba, Y.V.; Bukashev, F.; Smirnov, A.Y.; Eliseev, D.N. Magnetoelectric sensor of magnetic field. Ferroelectrics 2002, 1, 199–202. [Google Scholar] [CrossRef]
- Bergs, R.; Islam, R.A.; Vickers, M.; Stephanou, H.; Priya, S. Magnetic field anomaly detector using magnetoelectric composites. J. Appl. Phys. 2007, 101, 024108. [Google Scholar] [CrossRef]
- Stucki, F.F. Ferrimagnetic pressure transducer. Patent Office of London Patent 1.168.861, 29 October 1969. [Google Scholar]
- Somaiah, N.; Jayaraman, T.V.; Joy, P.A.; Das, D. Magnetic and magnetoelastic properties of Zn-doped cobalt-ferrites-CoFe2-xZnxO4 (x=0, 0.1, 0.2, and 0.3). J. Magn. Magn. Mater. 2012, 324, 2286–2291. [Google Scholar] [CrossRef]
- De Brito, V.L.O.; Cunha, S.A.; Lemos, L.V.; Bormio-Nunes, C. Magnetic properties of liquid-phase sintered CoFe2O4 for application in magnetoelastic and magnetoelectric transducers. Sensors 2012, 12, 10086–10096. [Google Scholar] [CrossRef] [PubMed]
- Ray, S.; Rapp, R.A. Composition Suitable for Use as Inert Electrode Having Good Electrical Conductivity and Mechanical Properties. U.S. Patent 4,454,015, 12 June 1984. [Google Scholar]
- Tailhades, T.; Rousset, A.; Gabriel, A.; Laurent, V.; Baco-Carles, V.; Lamaze, A. Inert anode for the production of aluminium by fused bath electrolysis and method of making this anode. U.S. Patent US2007/0056848 A1, 15 March 2007. [Google Scholar]
- De Brito, V.L.O.; Cunha, S.A.; Araújo, F.F.; Machado, J.P.B.; Bormio-nunes, C.; Silva, M.R. Processing and characterization of a Ni-Co ferrite for sensor applications. Cerâmica 2015, 61, 341–349. [Google Scholar] [CrossRef]
- Sedlar, M.; Matejec, V.; Paulicka, I. Optical fibre magnetic field sensor using ceramic magnetostrictive jackets. Sens. Actuators A 2000, 84, 297–302. [Google Scholar] [CrossRef]
- Chen, Y.; Jiles, D.C. The magnetomechanical effect under torsional stress in a cobalt ferrite composite. IEEE Trans. Magn. 2000, 36, 3244–3247. [Google Scholar] [CrossRef]
- Chen, Y.; Schwichtenberg, C.R.; Snyder, J.E.; Dennis, K.W.; McCallum, R.W.; Jiles, D.C. Metal-bonded Co-ferrite composites for magnetostrictive torque sensor applications. IEEE Trans. Magn. 1999, 35, 3652–3654. [Google Scholar] [CrossRef]
- Choi, H.S.; Kim, K.D.; Jang, J.S. Design for reliability of ferrite for electronics materials. Electron. Mater. Lett. 2011, 7, 63–70. [Google Scholar] [CrossRef]
- Tajima, T.; Asano, K.; Furuya, T.; Iida, S.; Ishi, Y.; Kijima, K.; Kokura, S.; Mitsunobu, S.; Takahashi, T.; Takashina, H. Bonding of a microwave-absorbing ferrite, TDK IB-004, with copper for the HOM damper of the KEK B-factory SC cavities. In Proceedings of the Sixth Workshop on RF Superconductivity, Newport News, VA, USA, 4–8 October 1993. [Google Scholar]
- Wang, Y.; Zhang, H. Low temperature brazing of chip inductors by abnormal glow discharge plasma. IEEE Trans. Compon. Packag. Technol. 2006, 29, 350–354. [Google Scholar] [CrossRef]
- Chojnaki, E.; Gruber, T.; Sherwood, N.; Alton, W.J. Beamline RF load development at Cornell. In Proceedings of the 1999 Particle Accelerator Conference, New York, NY, USA, 29 March–2 April 1999. [Google Scholar]
- Jin, H.; Ma, Y.; Wang, D. Growth of lead-free welding films on ferrite substrate by magnetron sputtering. J. Vac. Sci. Technol. 2008, 28, 341–345. [Google Scholar]
- Kajiwara, K.; Hakayama, M.; Kunito, Y.; Ikeda, Y.; Hayashi, K.; Aso, K.; Ishida, T. Analysis of metal-ferrite interface in metal-in-gap heads. IEEE Trans. Magn. 1990, 26, 2978–2982. [Google Scholar] [CrossRef]
- Hardy, J.S.; Kim, J.Y.; Thomse, E.C.; Weil, K.S. Improved wetting of mixed ionic/electronic conductors used in electrochemical devices with ternary air braze filler metals. J. Electrochem. Soc. 2007, 154, 32–39. [Google Scholar] [CrossRef]
- Dong, W.Z.; Lin, Q.Q.; Li, Y.T.; Huang, W. Effect of sintering pressure on hot press sintering of 17Ni/(10NiO-NiFe2O4) cermet. Mater. Res. Innov. 2014, 18, 510–513. [Google Scholar] [CrossRef]
- Huchet, G.; Boussuge, M.; Maurel, V.; Roustan, H. Mechanical properties of a spinel-ferrite-based cermet: Effects of temperature and oxidation. J. Mater. Sci. 2013, 48, 3264–3271. [Google Scholar] [CrossRef]
- Tao, Y.; Li, Z.; Zhang, D.; Xiong, H.; Zhou, K. Microstructural evolution of a nickel ferrite—Copper alloy cermet during sintering and high-temperature oxidation. J. Am. Ceram. Soc. 2012, 95, 3031–3036. [Google Scholar] [CrossRef]
- Rioult, F.; Pijolat, M.; Valdivieso, F. High-temperature oxidation of a Cu-Ni cermet: Kinetic and microstructural study. J. Am. Ceram. Soc. 2006, 89, 996–1005. [Google Scholar] [CrossRef]
- Suryanarayana, C. Mechanical alloying and milling. Prog. Mater. Sci. 2001, 46, 1–184. [Google Scholar] [CrossRef]
- Benjamin, J.S.; Volin, T.E. The mechanism of mechanical alloying. Metall. Trans. 1974, 5, 1929–1934. [Google Scholar] [CrossRef]
- Van Vlack, L.H. Princípios de Ciência dos Materiais; Edgard Blücher: São Paulo, Brazil, 1970; pp. 233–235. [Google Scholar]
- American Society for Metals. ASM Handbook: Alloy Phase Diagrams; ASM: Materials Park, OH, USA, 1992; Volume 3. [Google Scholar]
- Hieda, M.S. Desenvolvimento de Cermets de Ferrita Ni-Co Aplicáveis em Sensores Magnetomcânicos. Master’s Dissertation, Instituto Tecnológico de Aeronáutica, São José dos Campos, Brazil, 2015. [Google Scholar]
- Jaimeewong, P.; Ngernchuklin, P.; Khamman, O.; Dechakput, T. Sintering properties and microstructure of NiMn2O4-silver composites. Ferroelectrics 2013, 457, 153–158. [Google Scholar] [CrossRef]
- Wachtman, J.B. Mechanical Properties of Ceramics, 1st ed.; John Wiley & Sons Inc.: New York, NY, USA, 1996. [Google Scholar]
- Zhang, Z.; Liu, Y.; Yao, G.; Zu, G.; Wu, D.; Hao, Y. Synthesis and characterization of dense and fine nickel ferrite ceramics through two-step sintering. Ceram. Int. 2012, 38, 3343–3350. [Google Scholar] [CrossRef]


| Metallic Phase | Sintering Schedules |
|---|---|
| Cu–Ni | 1350 °C/30 min |
| Ag–Ni | 1350 °C/30 min |
| Ag | 1350 °C/3 h, 1000 °C/30 min, 1000 °C/4 h |
| Ag–Cu | 1000 °C/30 min |
| Raw Material | Cu | Ni | Fe | O | Mn | Si | Ag |
|---|---|---|---|---|---|---|---|
| Ni | - | 84.41 | 2.10 | 10.36 | 1.46 | 1.67 | - |
| Cu | 86.54 | - | - | 13.46 | - | - | - |
| Ag | - | - | - | - | - | - | 100 |
| Element | Expected | Ag–Ni Cermet | Pure Ferrite Sample [30] |
|---|---|---|---|
| Fe | 28.22 | 34.79 ± 0.85 | 36.63 ± 0.95 |
| Ni | 12.76 | 13.29 ± 0.36 | 13.73 ± 0.44 |
| O | 56.43 | 48.42 ± 5.95 | 48.49 ± 7.58 |
| Co | 1.41 | 1.59 ± 0.07 | 1.64 ± 0.11 |
| Ag | 1.18 | 0.44 ± 0.03 | --- |
| Al | --- | 1.47 ± 0.12 | 1.52 ± 0.15 |
| Element | Area Analysis (338.11 µm × 253.58 µm) | Point Analysis Inside a Void |
|---|---|---|
| Fe | 33.88 ± 0.86 | 30.36 ± 0.25 |
| Ni | 13.82 ± 0.08 | 12.37 ± 0.58 |
| O | 47.93 ± 6.07 | 52.87 ± 3.04 |
| Co | 1.48 ± 0.07 | 1.28 ± 0.11 |
| Cu | 1.28 ± 0.07 | 1.21 ± 0.12 |
| Al | 1.61 ± 0.12 | 1.89 ± 0.11 |
© 2019 by the authors. Licensee MDPI, Basel, Switzerland. This article is an open access article distributed under the terms and conditions of the Creative Commons Attribution (CC BY) license (http://creativecommons.org/licenses/by/4.0/).
Share and Cite
de Brito, V.L.O.; Hieda, M.S.; Silva, E.d.O., Júnior; Ferreira, J.A.N.; Machado, J.P.B. Sintering of Cermets: A Case Study of Sintering Ni–Co Ferrite with Ag-, Cu- and Ni-Dispersed Alloy Particles. Ceramics 2019, 2, 190-207. https://doi.org/10.3390/ceramics2010017
de Brito VLO, Hieda MS, Silva EdO Júnior, Ferreira JAN, Machado JPB. Sintering of Cermets: A Case Study of Sintering Ni–Co Ferrite with Ag-, Cu- and Ni-Dispersed Alloy Particles. Ceramics. 2019; 2(1):190-207. https://doi.org/10.3390/ceramics2010017
Chicago/Turabian Stylede Brito, Vera Lúcia Othéro, Mônica Sumie Hieda, Eduardo de Oliveira Silva, Júnior, Jessica Aparecida Nascimento Ferreira, and João Paulo Barros Machado. 2019. "Sintering of Cermets: A Case Study of Sintering Ni–Co Ferrite with Ag-, Cu- and Ni-Dispersed Alloy Particles" Ceramics 2, no. 1: 190-207. https://doi.org/10.3390/ceramics2010017
APA Stylede Brito, V. L. O., Hieda, M. S., Silva, E. d. O., Júnior, Ferreira, J. A. N., & Machado, J. P. B. (2019). Sintering of Cermets: A Case Study of Sintering Ni–Co Ferrite with Ag-, Cu- and Ni-Dispersed Alloy Particles. Ceramics, 2(1), 190-207. https://doi.org/10.3390/ceramics2010017