Article

Resilience Oriented Distribution System Service Restoration Considering Overhead Power Lines Affected by Hurricanes

by
Kehkashan Fatima
1,*,
Hussain Shareef
1,2,* and
Flavio Bezerra Costa
3
1
Department of Electrical and Communication Engineering, United Arab Emirates University, Al Ain P.O. Box 15551, United Arab Emirates
2
Emirates Center for Mobility Research, United Arab Emirates University, Al Ain P.O. Box 15551, United Arab Emirates
3
Department of Electrical and Computer Engineering, Michigan Technological University, Houghton, MI 49931, USA
*
Authors to whom correspondence should be addressed.
Appl. Syst. Innov. 2025, 8(5), 149; https://doi.org/10.3390/asi8050149
Submission received: 3 September 2025 / Revised: 29 September 2025 / Accepted: 2 October 2025 / Published: 9 October 2025

Abstract

In recent years, there has been an increase in the frequency of severe weather events (like hurricanes). These events are responsible for most power outages in power distribution systems (PDSs). Particularly susceptible to storms are overhead PDSs. In this study, the dynamic Bayesian network (DBN)-based failure model was developed for different hurricane scenarios to predict the line failure of overhead lines. Based on the outcomes of the DBN model, a service restoration model was formulated to maximize restored loads and minimize power losses using Particle Swarm Optimization (PSO)-based distributed generation (DG) integration and system reconfiguration. Three different case studies based on the IEEE 33 bus system were conducted. The overhead line failure prediction and service restoration model findings were further used to calculate resilience metrics. With reconfiguration the load restored from 90.3% to 100% for Case 1 and from 34.994% to 80.35% for Case 2. However, for Case 3, reconfiguration alone was not sufficient to show any improvement in performance. On the other hand, DG integration successfully restored load to 100% in all three cases. These results demonstrated that the combined DBN-based failure modeling and PSO-driven optimal restoration strategy under hurricane-induced disruptions can effectively strengthen system resilience.

1. Introduction

1.1. Motivation

In recent years, there has been an increase in the frequency of severe weather events (also called High-Impact Low-Probability events—HILP), including floods and hurricanes [1,2]. These extreme weather events are responsible for most power outages in power distribution systems (PDSs) [3,4], while earthquakes can be responsible for damaging substations [5] and, in a few circumstances, can affect the generators and transmission system [6]. Compared to the power transmission system, the PDSs that deliver electricity to individual customers from neighboring substations are more susceptible to damage and are more likely to cause consumers to lose power during severe weather events [7].
Hurricanes are among the most damaging of these natural disasters [8], causing significant damage to homes, towns, and infrastructure [9,10,11]. PDSs can be significantly and permanently impacted by hurricanes, which can have a significant impact on public safety, economic output, and general quality of life [12,13,14,15,16]. Because PDSs are so important to society, it is necessary to have a thorough understanding of how hurricanes affect these systems and to create practical plans for making them more resilient [17,18].
Particularly susceptible to storms are overhead PDSs, such as conductors and wood utility poles [19], where strong winds, storm surges, and heavy precipitation can cause prolonged outages and interfere with the power supply [20]. For example, Hurricanes Wilma and Katrina in 2005 damaged approximately 12,000 poles, and Hurricane Hugo in 1989 caused over 15,000 pole failures [21]. The main causes of this increased susceptibility are the quick deterioration of wood and significant exposure to wind pressures. Over the past ten years, risk assessment and life cycle cost analysis have received much attention in response to this problem. These methods seek to assess system weaknesses and develop economic management plans. The likelihood of failure for each component, such as wood utility poles, must be estimated to carry out risk assessments.

1.2. Literature Review

PDS automation and distributed mobile devices form the foundation for improving resilience to HILP events [22,23,24,25]. Numerous resources, like communication devices, switches, static energy resources (like Distributed Energy Resources), and mobility resources (like repair trucks and Mobile Power Sources), are involved in the post-disaster restoration process.
PDS communication devices are necessary for the functioning of PDS. Using fault indicators, the PDS operator finds the fault, and with the help of remote-controlled switches (RCS), regulates the line switching status [26]. In a typical PDS, there are multiple feeders. The RCS is divided into normally open (tie switches) and normally closed (sectionalizing switches). The entire system is constructed in radial topology, as the design of protection devices is based on radial topology [26]. In urban PDS, Distributed Energy Resources typically relate to small-scale, geographically stationary energy sources, such as battery energy storage systems (BESSs), solar (PV) systems, and fuel-based distributed generation (DG). Fuel-based DGs and BESSs are dispatchable DERs, whereas PV systems are typically non-dispatchable DERs [24,26].
Fuel-based DG, which includes natural gas and diesel generators, is also known as a micro-turbine generator [24]. Fuel-based DGs offer the advantage of steady power generation as compared to renewable energy sources. The generator can be promptly activated to supply the local load after the system has been islanded. One drawback is that the generator makes a lot of noise when it is running [27]. For photovoltaic systems, it is reasonable to assume that they are constantly operating at maximum power. There is no operational cost for the PV. However, the sun’s irradiation may fluctuate during severe weather conditions (such as hurricanes). Therefore, stable power production for post-fault restoration cannot be guaranteed by distributed PV systems [26,27]. As far as BESSs are concerned, their benefits include safe operation, consistent power output, and adjustable sizing. However, because of its energy capacity, a battery can only last for a maximum of four hours when discharged at the rated power. To reduce power production fluctuations and provide stable power output, BESSs should work together with PV systems [26,27].
During the post-disaster recovery, the resilient operation of PDS focuses on minimizing economic losses caused by unserved load through the optimal utilization of existing PDS resources. The resilience enhancement operational approaches, termed as outage management strategies (OMS) by researchers Farzin et al. [28,29], are implemented across two critical phases: pre- and post-disaster restoration. Pre-disaster resource allocation involves finding strategic positions for mobile resources (e.g., repair crews, Mobile Power Sources (MPSs)) to enable the dispatch of resources within a smaller area after the event [30,31,32]. Post-disaster restoration involves dispatching Distributed Energy Resources (DERs)/MPSs and reconfiguration of the network to restore services [19,20]. Also, Arif et al. [33] have integrated the two critical phases to achieve a hybrid methodology.
Current models for overhead line failures are reactive, relying on post-event damage assessments. These models fail to forecast spatiotemporal overhead line failures proactively ahead of time, leaving utilities unprepared for cascading outages. Review of resilience framework studies by Hughes et al. [34] and M. Li et al. [35] indicated that traditional failure models ignore proactive spatiotemporal forecasting in favor of post-event recovery. Existing probabilistic models (e.g., Markov chains) lack granularity in capturing spatial-temporal interdependencies during hurricanes, limiting their utility for preemptive actions. These authors emphasized the need for predictive tools to anticipate failures, a gap this paper addresses through dynamic Bayesian networks (DBNs). In this paper, DBN was used to predict the failure probability of overhead lines five time steps ahead. This gives sufficient time to prepare proactively to avoid cascading outages due to overhead line failure.
Recent studies that have focused on resilience-oriented service restoration mostly treat network reconfiguration and distributed generation (DG) deployment as isolated solutions. Shen et al. [36] and Kahouli et al. [37] proposed reconfiguration strategies for service restoration, underscoring the need for complementary solutions like DG deployment. Moradi & Abedini [38] optimized DG placement for resilience but ignored reconfiguration. However, a few studies by Bie et al. [39], Haider et al. [40], Vai et al. [41], and Gallego Pareja et al. [42] also used reconfiguration along with DG placement, but they lack understanding of their relative effectiveness under varying HILP scenarios (minor, major, and worst-case hurricane conditions). In this paper, the proposed model estimated the impact of several scenarios (minor, major, and worst) on the PDS and how to overcome this challenge by testing both reconfiguration and DG deployment strategies under dynamic HILP-induced failures. Utilities lack guidance on whether reconfiguration or DG placement performs better, a limitation this paper overcomes by testing both strategies under dynamic HILP-induced failures.
Resilience is often assessed using traditional metrics (e.g., SAIDI, SAIFI) that do not capture the phased degradation and recovery dynamics unique to hurricanes. Operators lack metrics to evaluate how reconfiguration or DG deployment accelerates recovery in time-critical HILP scenarios. Bie et al. [39] introduced the resilience trapezoid framework for PDS. However, their metrics lack integration with predictive models, a gap the proposed method bridges by linking to DBN forecasts.

1.3. Paper Contribution

The primary goal of this paper is to propose a practical and efficient resilience-oriented service restoration model for PDS in response to unprecedented HILP events. The specific objectives of this research are as follows:
  • To develop a spatiotemporal dynamic Bayesian network (DBN) model with a step-ahead predictive time horizon for probabilistic risk assessment of overhead power distribution line failures during hurricanes.
  • To develop a service restoration model based on the results of the DBN failure model, incorporating two independent service restoration strategies, PSO-based reconfiguration and PSO-optimized DG placement.
  • To test the scenario-wise performance of overhead line failure and service restoration models on modeled test systems.
  • To assess the operational resilience of PDS using resilience metrics.
This work advances hurricane resilient distribution operation in the following keyways. First, a DBN model that learns spatiotemporal hurricane behavior was used to deliver one-hour-ahead linefailure probabilities information that conventional static fragility models cannot provide. Next, these probabilistic outages drive a two-stage service-restoration model. The first stage reconfigures the feeder topology using PSO, and the second stage performs PSO-based optimal DG siting/sizing, ensuring radiality, loss minimization, and maximum load pick-up. The integrated DBN and PSO framework was validated on three escalating hurricane cases (minor, major, blackout). Finally, resilience metrics were used to quantify severity, recovery efficiency, and phased adaptability, offering a holistic benchmark for future research.

1.4. Paper Organization

The paper is organized as follows. Section 1 explains the study and the background related to pre- and post-event system restoration. Section 2 presents the overhead line failure and service restoration modeling developed and the quantification of resilience of the system using resilience metrics. The case studies are introduced in Section 3. Results and discussion are presented in Section 4. Finally, the conclusion is presented in Section 5.

2. Materials and Methods

The performance evaluation of the proposed method was performed on the standard IEEE 33 bus test network. The electrical data for the test system can be found in [43]. A PDS is composed of various geographic regions [44]. In this work, therefore, a disruptive event consisting of hurricanes of different categories was set up for the test system. Figure 1 presents an outline of the proposed methodology.
In Figure 1, step i (structural learning) was the creation of the Bayesian network model for the IEEE 33 bus system. The output of this step was a graphical model representing pole failure parameters and interdependencies. In step ii, the static BN developed was transformed into a DBN. In this step, parameter learning was performed. In parameter learning, the prior probabilities and conditional probability tables (CPTs) of nodes in the DBN were assigned probabilistic values, between 0 and 1, to each node in the developed structure of the BN model. The prior probabilities are for root nodes (nodes without parents), while CPTs are for nodes with parents. CPTs were defined at time slice = 0, while for time slice = 1, transition probabilities were defined. The outcome of this step was the temporal BN model, which provided the changes in quantitative variables based on time. In step iii, Bayesian inference was performed to update the probabilistic beliefs of different time steps. The outcome of this step was the posterior probabilities or line failure probabilities for three different cases. Any line found to have a failure probability greater than 0.5 was assumed to suffer an outage. The faulted line information was used to identify which buses (downstream buses) were isolated and how much load they required. Accordingly, the constraints and the objective function were defined with the purpose of PSO-based service restoration.

2.1. Overhead Line Failure Prediction Model (Preliminaries)

Overhead line failure is mainly due to extreme winds and falling trees. In this study, overhead line failure due to extreme winds was addressed. Evaluating overhead line’s failure probability as a result of pole bending failure was the goal. When the maximum stress from the wind load surpasses the poles’ fiber strength, pole failure takes place. The corresponding failure probability for a specific failure mode is given by the following [45]:
F P = P G x i 0
where G ( x i ) is a measure known as the limit state function, which assesses survival or failure, and x i is a set of random variables involved. In the context of pole structural reliability, the limit state function, G , can be represented as follows [45]:
G = R S
where S represents wind stress/pressure applied and R represents the resistance offered by the pole. For the wind scenario, according to the National Electrical Safety Code (NESC) (IEEE 2017), the value of S on poles can be computed as follows [46]:
S = 0.5   ρ a k z G C f U p 2
where U p is projected 3 s gust wind speed ( U p = [30, 70] m/s), C f is the force coefficient ( C f = 1); G = 0.88 , represents the gust response factor, k z is the velocity pressure exposure coefficient ( k z = 1.1), and ρ a is air density ( ρ a = 1 ). Due to the lack of design details, these parameters have been adopted from [46]. Assuming the material of conductors to be aluminum conductor steel reinforced material (ACSR), the breaking strength of ACSR wire was taken equal to 406.5 Mpa. The failure probability of poles can be derived by Equation (4) [21]:
F P =   t . P [ G ( x i ) < 0 ] f σ ( t ) d t
where the fragility function, P [ G ( x i ) < 0 ] , defines the conditional failure probability. The wind speed is denoted by σ and the probability density function (PDF) of wind speed is defined by f σ ( t ) . The Poisson process of constant rate describes hurricane events. Exponential distribution is commonly employed in Poisson processes to simulate the time between extreme events, such as the intervals between successive pole failures [46]. The failure rate, a precise figure determined from statistical data, is typically a constant rate that can be used to illustrate the failure features [47]. Consequently, if λ h represents the i t h pole’s failure rate, such that:
λ h =   A i × e B i × σ
where A i and B i denote the pole coefficients [47], then the probability function is expressed by Equation (6) [48]:
f σ ( t ) = λ h e λ h t ,          t 0            0 ,          t < 0
In this study, the FP for poles was a function of failure stress (σ) of HWSI [49] and is expressed as follows:
F P σ = 1 e ( σ σ 0 ) m
where F P σ is the pole’s FP, σ 0 represents the reference value of stress, and m represents the statistical Weibull modulus. The reference value of σ 0 = 60.95 and m = 3.862 were adopted from [50].
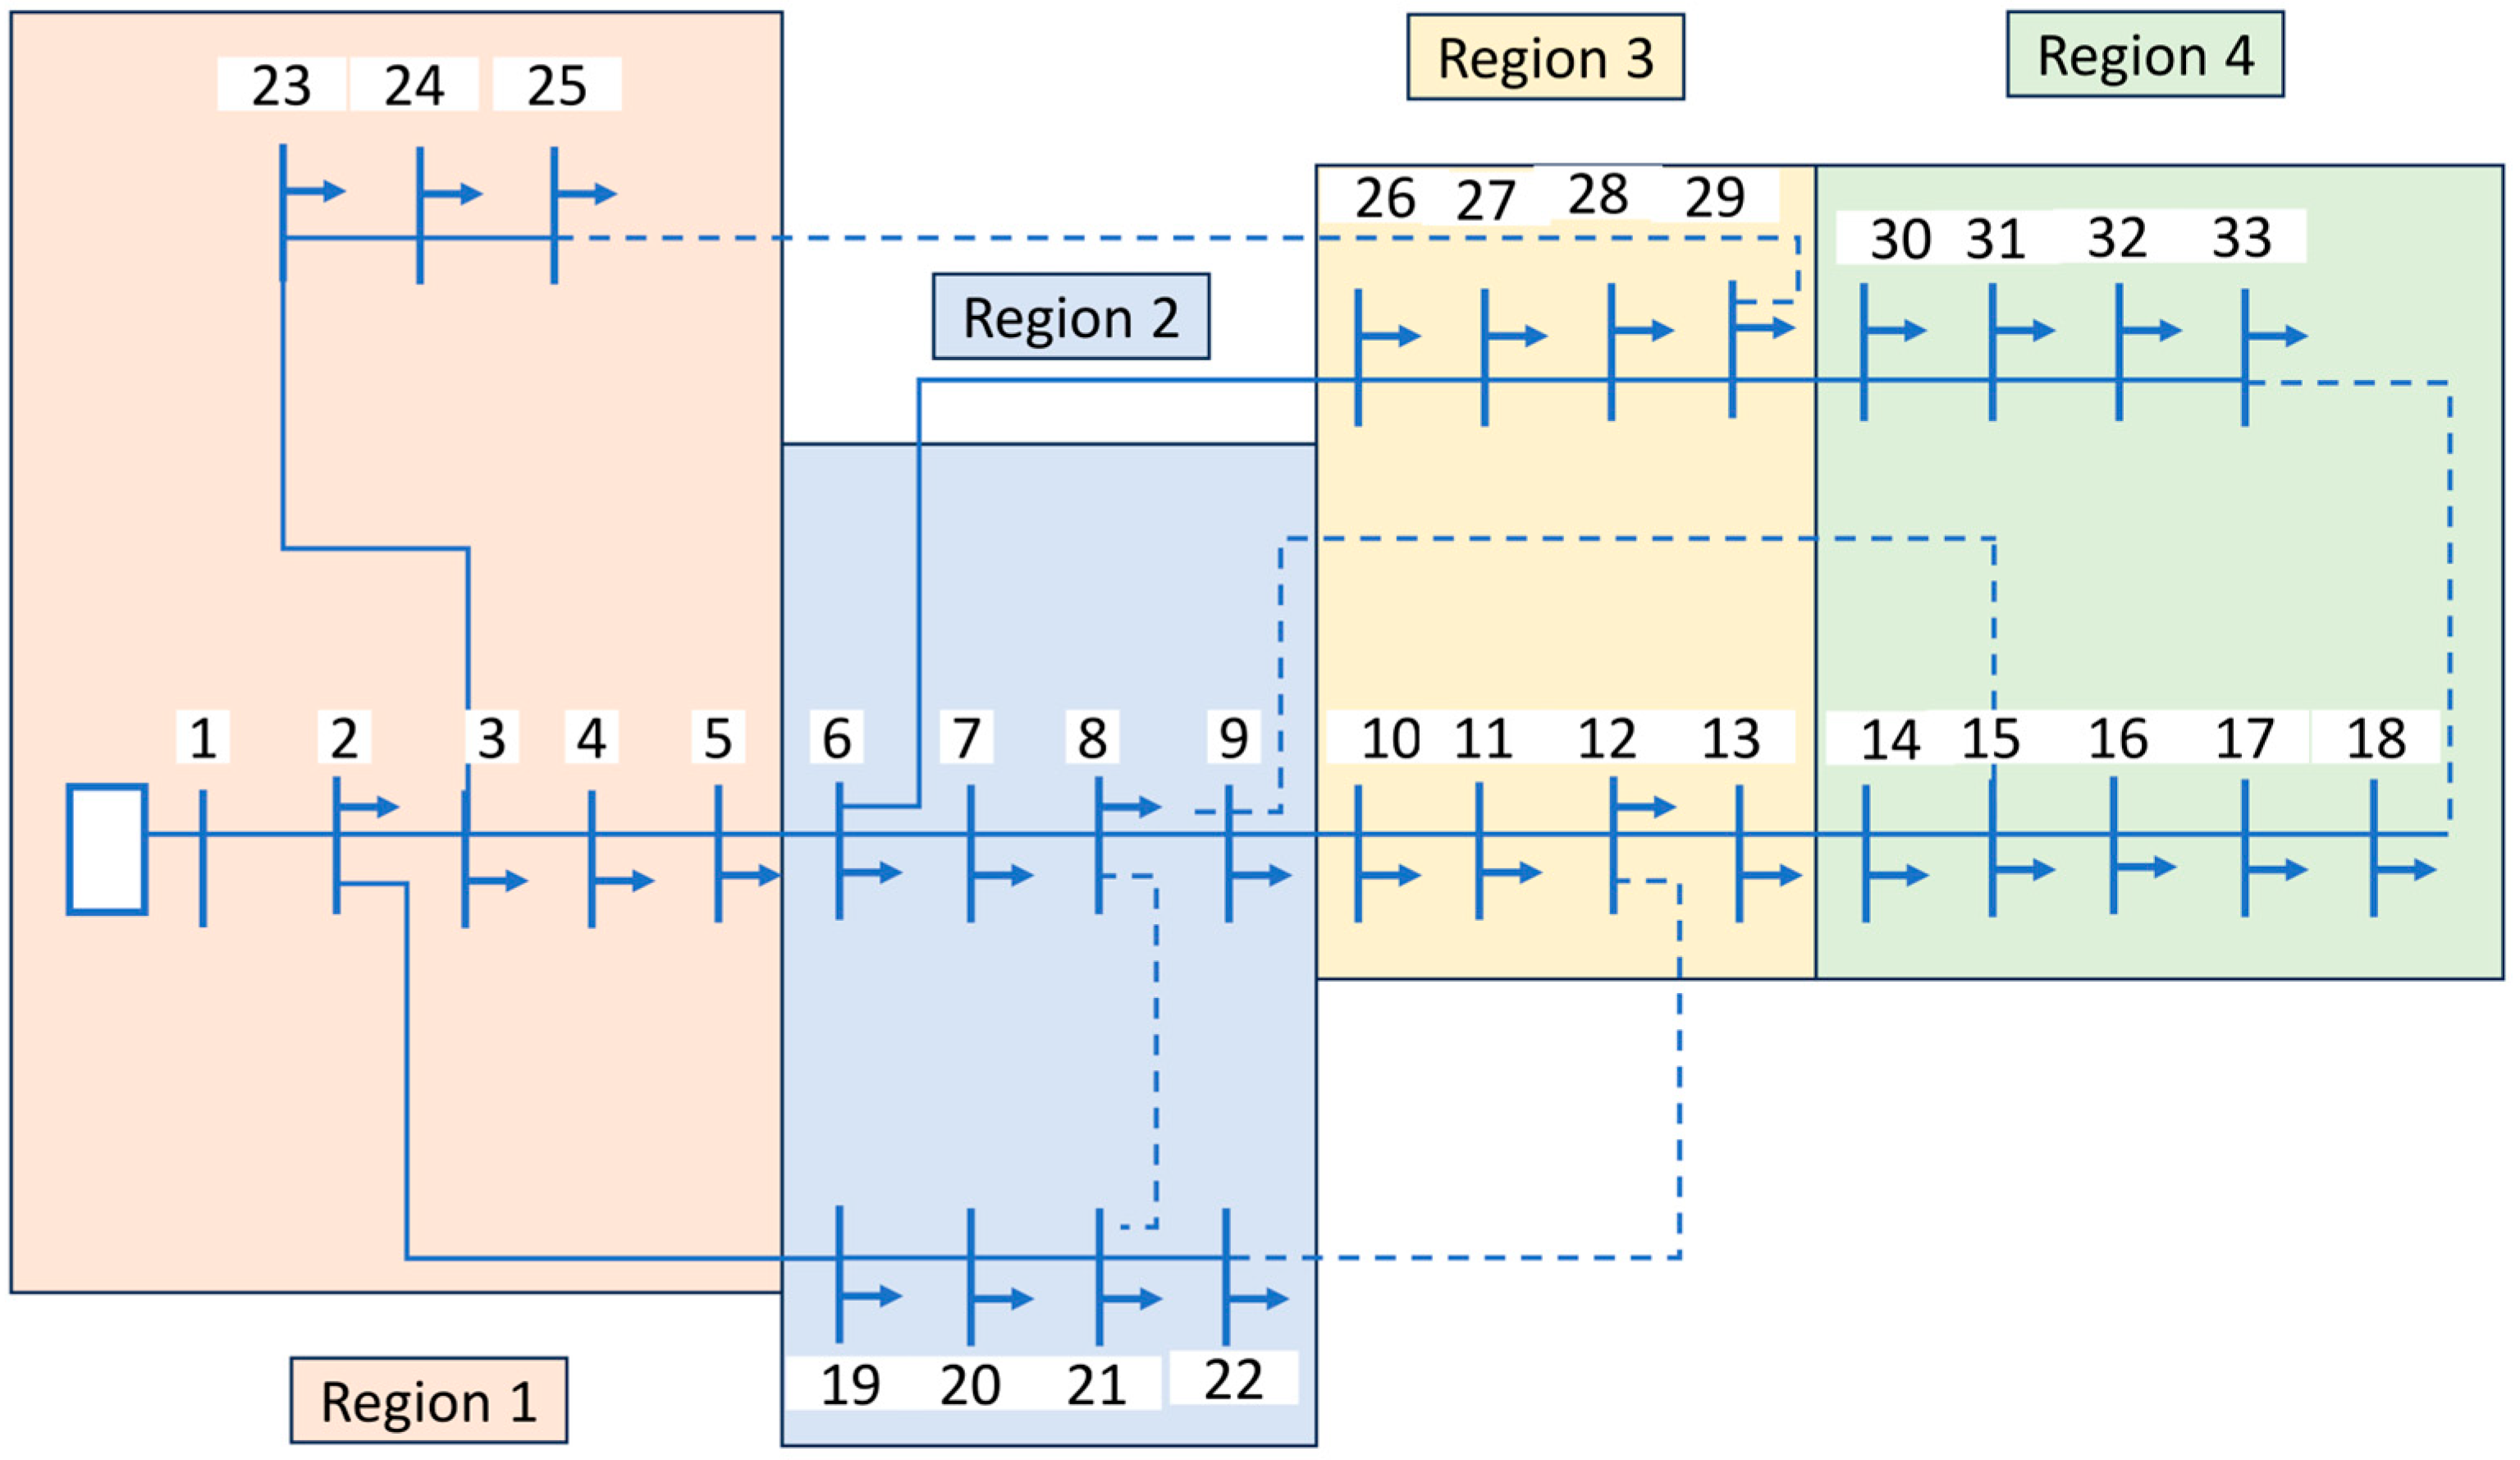
The effects of HWSI on the grid at specific times and locations were considered. As illustrated in Figure 2, the standard IEEE 33 bus system was divided into four sections depending on the number of buses. There were eight buses for regions 1, 2, and 3 each, while there were nine for region 4. Regions 1, 2, 3, and 4 were affected by hurricanes of 4, 3, 2, and 1 category, respectively.
To determine the line failure due to bending of poles, the dynamic Bayesian network overhead line failure model used by Fatima & Shareef [49] for the test system shown in Figure 2 has been adopted. The model was developed using Genie 4.1 software [51]. The transition probabilities between two time instants/steps in a DBN are given by the following [52]:
P ( X t + t i = 0 | X t i = 0 ) =   e λ t
P ( X t + t i = 1 | X t i = 0 ) = 1 e λ t
P ( X t + t i = 0 | X t i = 1 ) = 1 e μ t
P ( X t + t i = 1 | X t i = 1 ) = e μ t
where λ represents the failure rate and μ represents the repair rate, t denotes the current time, and Δt denotes the time interval between two time slices. Figure 3 shows the graphical representation of time slices in a DBN.

2.2. Service Restoration Model (Main Methodology)

The service restoration model in this study was formulated as a constrained optimization task aimed at maximizing restored loads and minimizing the power losses while adhering to the physical and operational limits of the PDS. The mathematical model incorporates the following assumptions:
  • Balanced Three-Phase AC System: The distribution network was assumed to operate under balanced conditions, allowing the use of single-phase equivalent models for power flow analysis. Power generated should be capable of supplying the demand capacity and the system losses [40]. For this, the following equations should be satisfied for each bus in Figure 4.
    P G , i P D , i j = 1 N V i V j | Y i j | cos θ i θ j θ i j = 0
    Q G , i Q D , i j = 1 N V i V j | Y i j | sin θ i θ j θ i j = 0
    i ∈ 1, 2, 3…N
    where V j is the voltage at bus j , P G , i is the active power generation at bus i , P D , i is the active power demand at bus i , Q G , i is the reactive power generation at bus i , Q D , i is the reactive power demand at bus i , Y i j   is the admittance of the line connecting buses i   a n d   j , and | Y i j | is the magnitude of the admittance.
  • Radial Topology: The restored PDS must maintain a radial structure to ensure protection coordination and avoid loop currents and should satisfy [43].
    N n o d e   N b r = 1
    where N n o d e   is the count of nodes in the system and N b r is the total count of the network’s branches.
  • Operational Limits: Voltage magnitudes at all buses must remain within permissible bounds. The generator voltage will be the bus/load voltage in addition to the voltage drop caused by the impedance of the line and the power flow along the line. The generator voltage must increase with increasing impedance and power flow to maintain a constant bus/load voltage. Because the resistive elements of the distribution network’s lines are higher than those of other lines, the increased active power flows have a significant effect on the voltage level. Instead of the more common number of 5 on transmission networks, this results in an X/R ratio of roughly 1 [40]. Based on the American National Standards Institute (ANSI C84.1), the voltage limits expressed in Equation (15) were to ensure voltage stability and power quality.
    V i , m i n V i V i , m a x
    where V i , m a x and V i , m i n are the maximum (+5% of the nominal voltage) and minimum (−5% of the nominal voltage) limits at the sending end node of the i th branch, respectively.
The problem formulation has the following objective function:
m a x i r e s t o r e d   b u s e s P i s e r v e d + Q i s e r v e d y i + m i n i N b r R i P i 2 + Q i 2 V i 2
where P i s e r v e d is the active load demand restored at the node i , Q i s e r v e d is the reactive load demand restored at node i , and y i is a binary variable representing the operational status of the bus i . The variable is 1 if the bus is in service and 0 if the bus is out of service. R i is the i t h branch resistance, V i is the voltage at the bus i , P i is the active power at the sending end of the i t h branch, and Q i is the reactive power at the sending end of the i t h branch.
The first term in the objective function emphasizes the maximization of the load to be restored. The second term symbolizes the minimization of power losses. In an AC power system, the active power, P i and reactive power, Q i can be expressed using the bus voltage magnitudes, |V|, and angles, θ , along with the network’s admittance matrix, Y = G + j B (where G is the conductance and B is the susceptance). The power flow equations for an N bus system are represented as follows:
P i =   | V i | 2 G i i +   j = 1 , j i N | V i | | V j | [ G i j cos ( θ i θ j ) + B i j cos ( θ i θ j ) ]
Q i = V i 2 B i i + j = 1 , j i N V i | V j | [ G i j sin ( θ i θ j ) B i j cos ( θ i θ j ) ]
where | V i | and | V j | are the voltage magnitudes at buses i and j , θ i and θ j are the voltage angles at buses i and j , G i j is the conductance between buses i and j (real part of admittance Y i j ), and B i j is the susceptance between buses i and j (reactive part of admittance Y i j ).

2.3. Particle Swarm Optimization

The Particle Swarm Optimization (PSO) algorithm uses swarming to identify the optimal solution among a set of problems and was developed iteratively. A higher number of iterations results in better convergence of the problem. At each iteration, a particle, which is also referred to as an individual, updates its position. The PSO algorithm begins by randomly generating particles in the function domain’s search space. The symbols x and v stand for the particle’s present position and velocity, respectively. The initial particle positions and velocities were created at random. For PSO, a maximum of 100 iterations ( i t e r m a x ) with 30 particles (N) were utilized in this study. The PSO convergence conditions were X i k + 1 X i k < ε or i t e r = i t e r m a x .

2.4. Reconfiguration of PDS

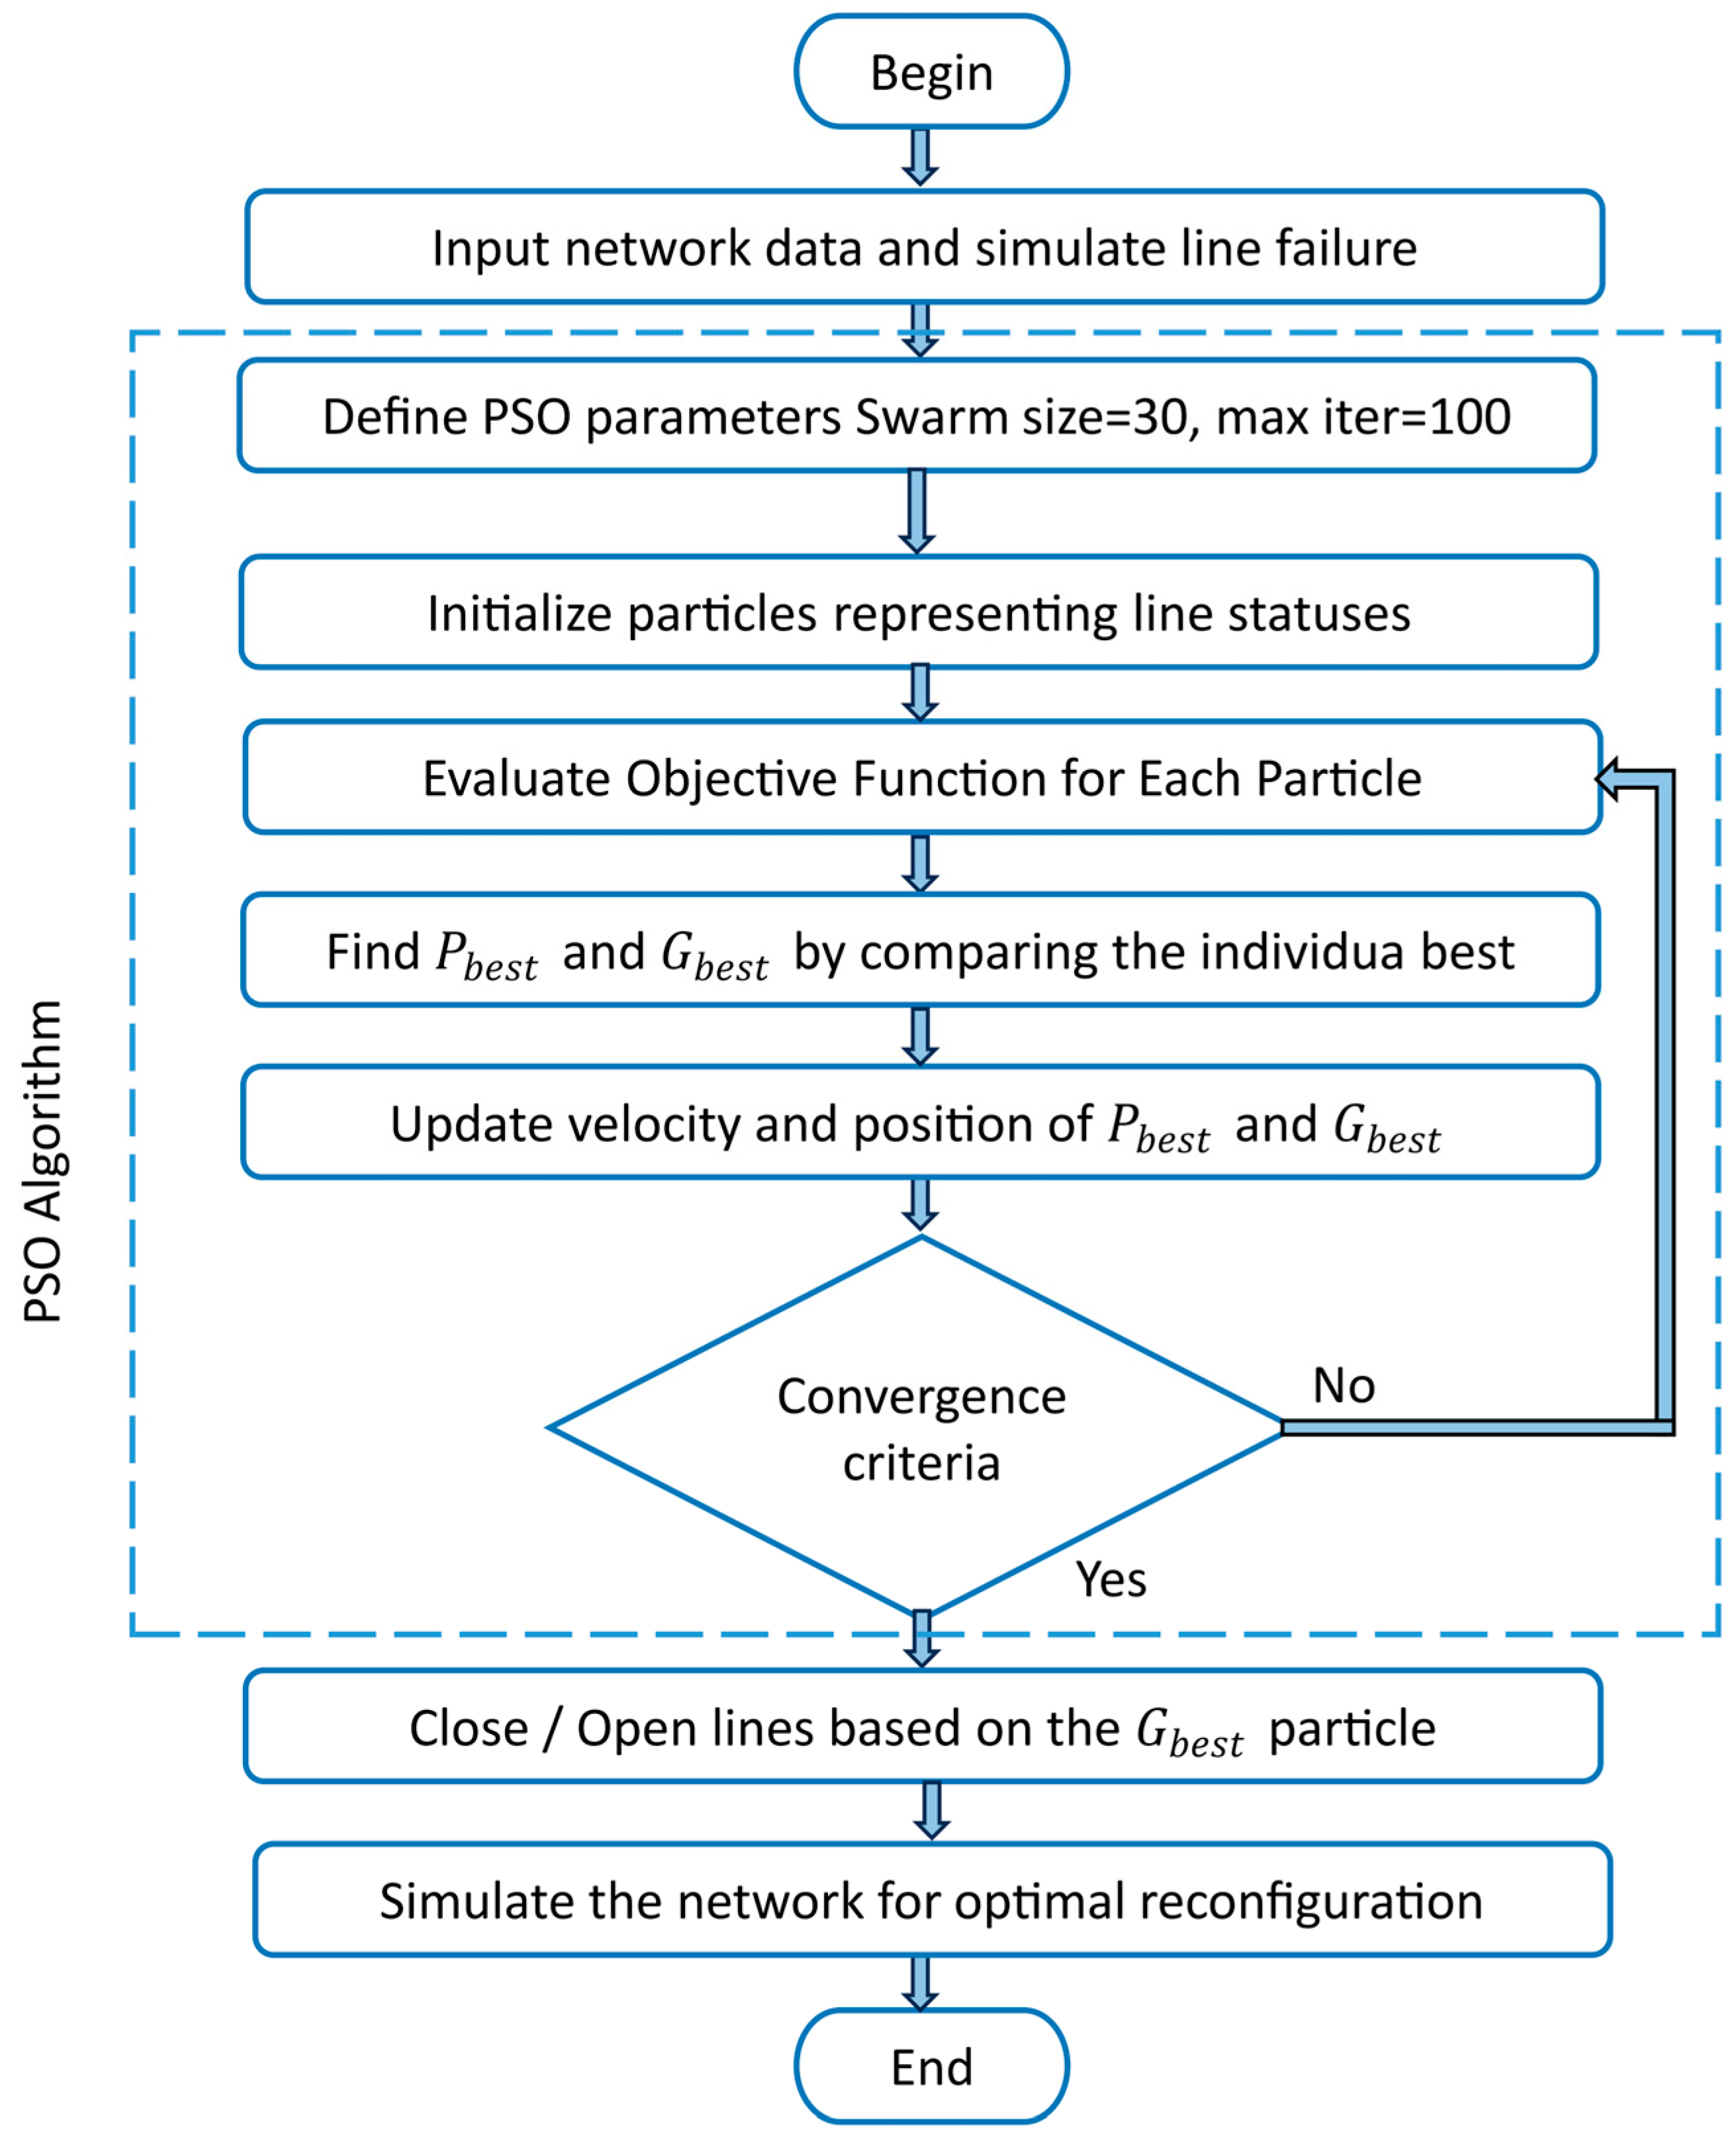
In this study, the IEEE 33 bus system taken into consideration consisted of 5 tie switches and 32 sectionalizing switches. It was a 12.66 kV PDS with a total of 3750 KW active and 2300 KVAR reactive demand. A PSO-based network reconfiguration was used, where specific tie lines and sectionalizing lines were closed and opened automatically using the PSO algorithm, changing the distribution network topology. The objective was to find an optimal solution for the system after the fault occurrence, such that power losses were minimized and the load restored was maximized. Figure 5 shows the flow chart for PSO-based network reconfiguration used in the IEEE 33 bus PDS.
An optimized PDS was achieved by developing without violating any discussed constraints and evaluating the objective of the goal for all possible radial designs of the given network.

2.5. DG Units Placement

In this study, DGs were incorporated into the network of the IEEE 33 bus system following a system line failure due to a hurricane. The aim was to minimize power loss and boost load performance by maximizing the restored load. The optimization algorithm used in this study to integrate DGs into the network was the PSO algorithm. The energy resources available at any specific point inherently limit DG capacity. It is therefore necessary to constrain the capacity between the maximum and minimum levels [38], as follows:
P G , i m i n P G , i P G , i m a x
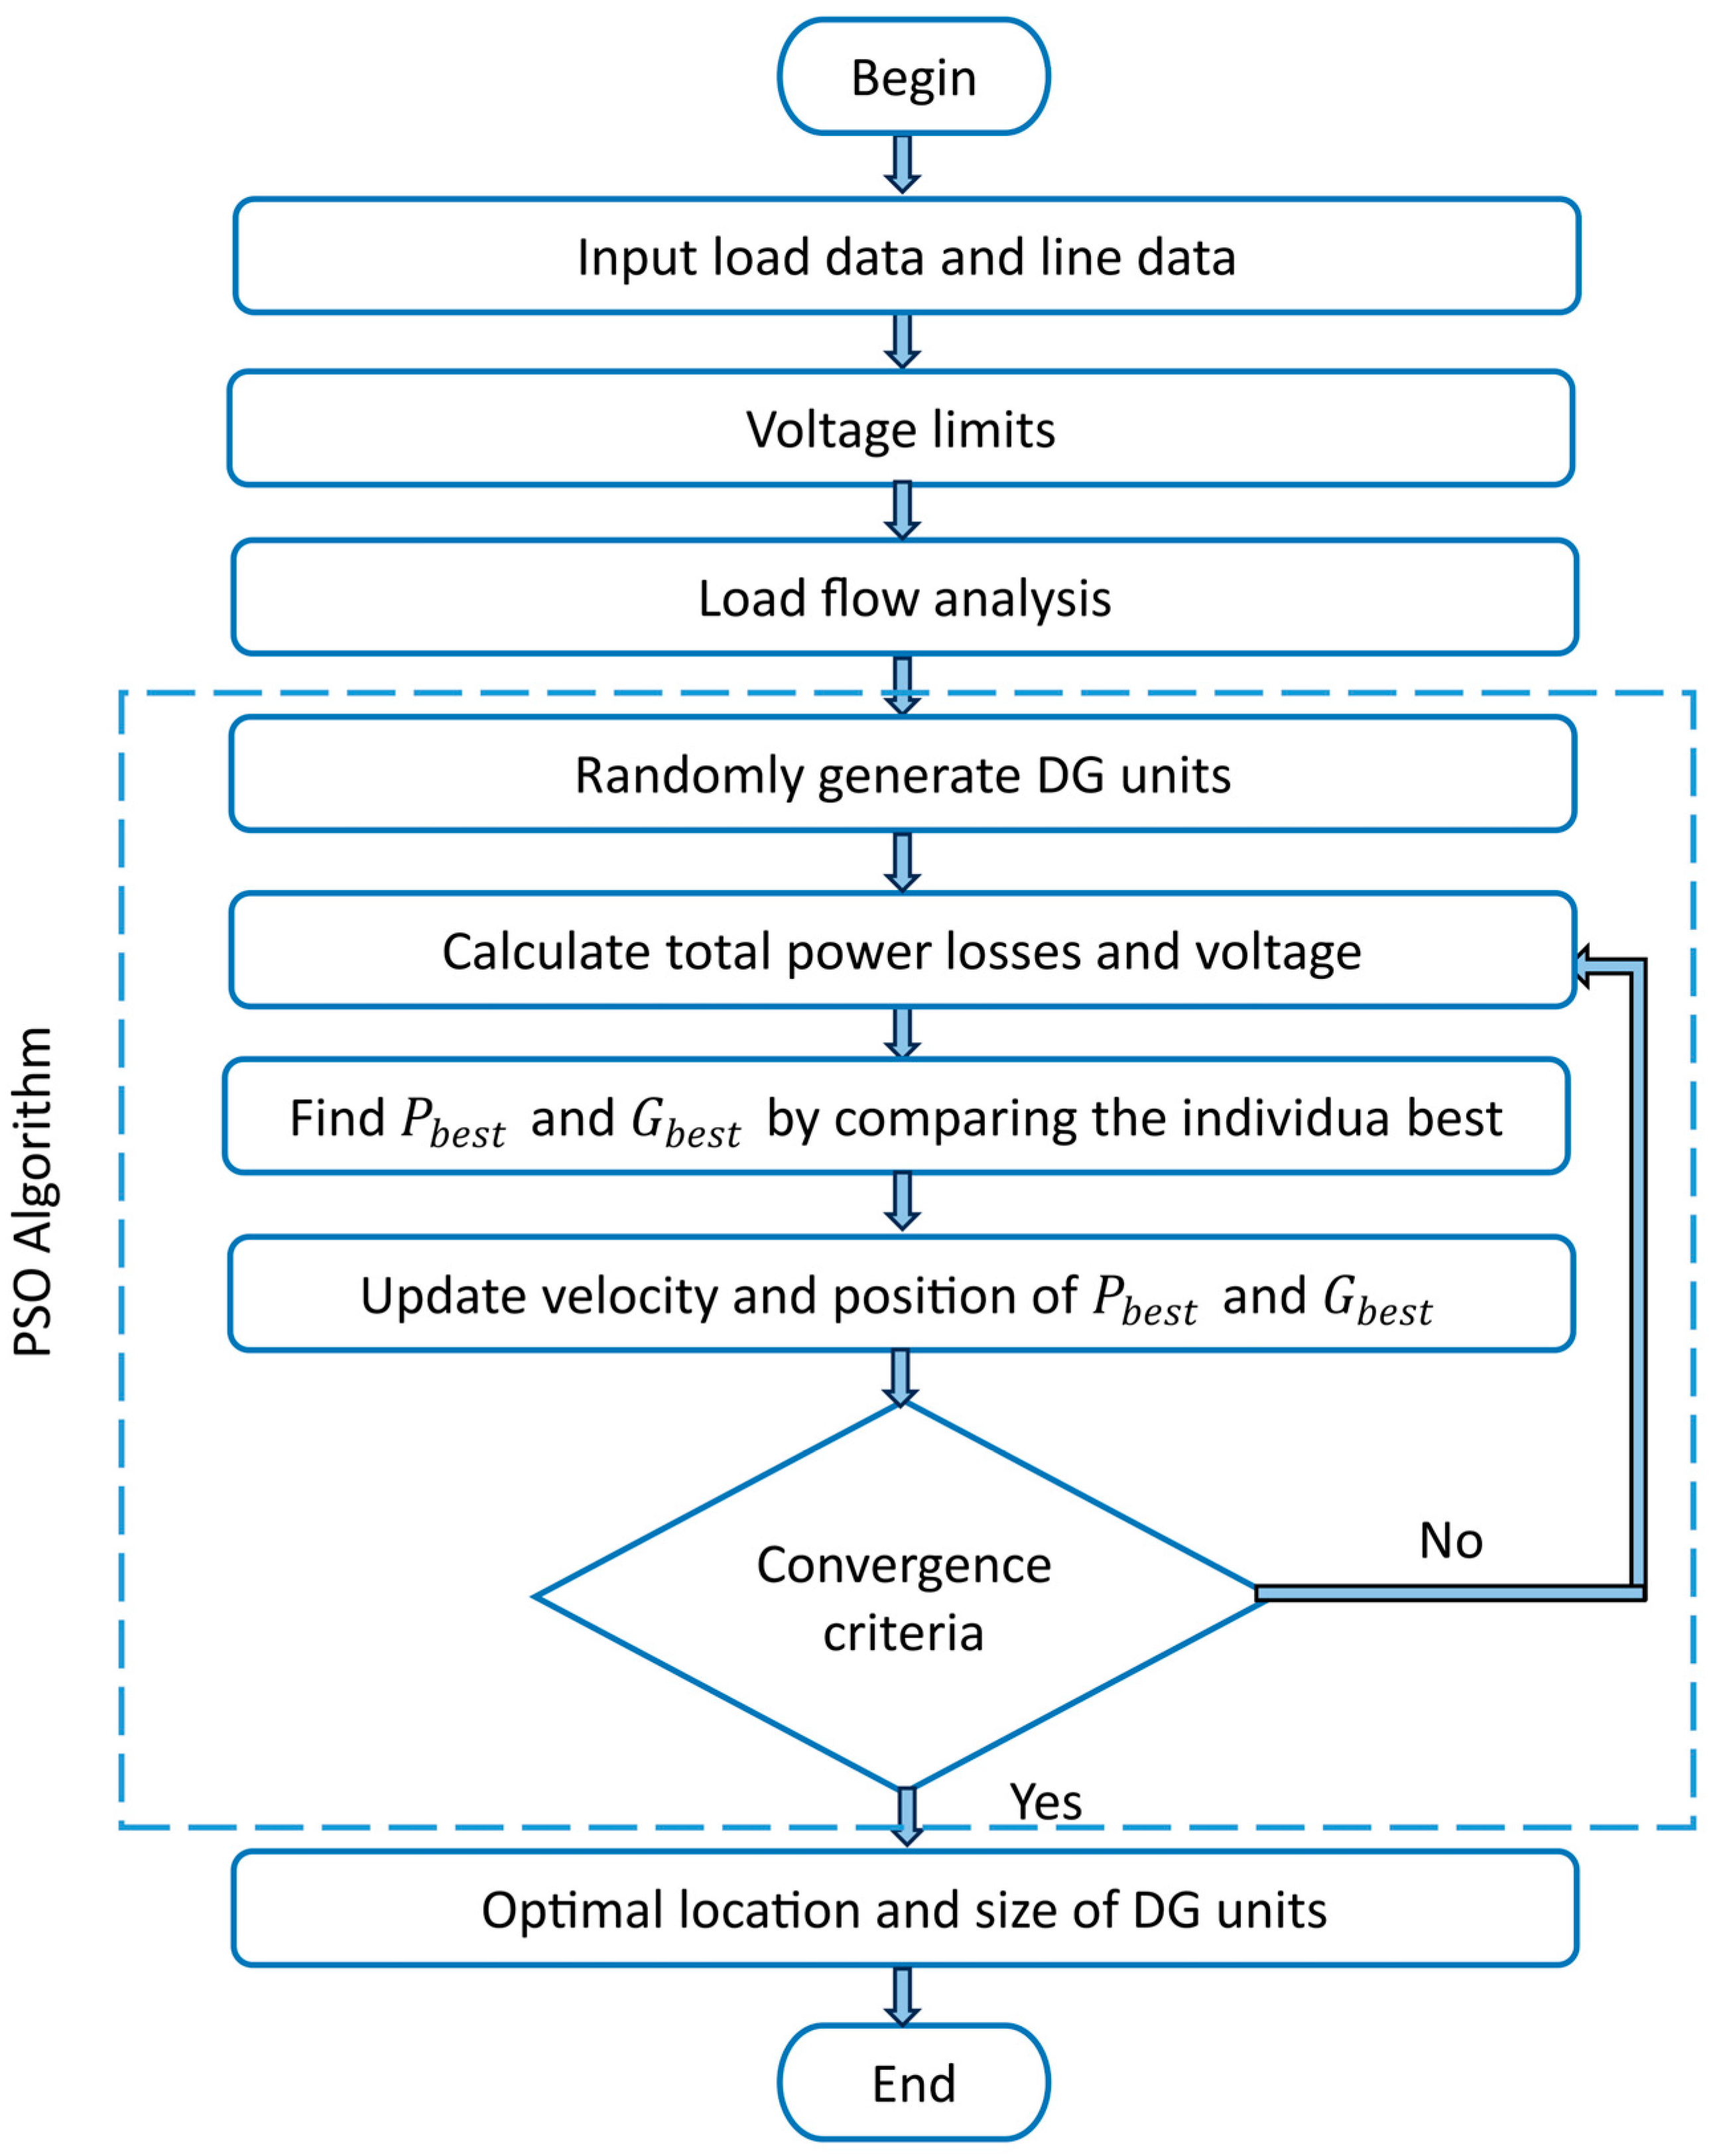
where P G , i m i n is the minimum active power generation limit of DG and P G , i m a x is the maximum active power generation limit of DG. The DGs were modeled in pandapower (an open-source Python 3.11.2 library designed for power system analysis and optimization) using the “gen” element, which represents PV (voltage-controlled) generators. Each DG injected a specified active power output (within the range: 0.1   M W D G   c a p a c i t y 1.5   M W ) while maintaining its bus voltage at the nominal value 1.0 p.u. The reactive power was adjusted automatically by the solver. This setup reflects dispatchable DGs (e.g., micro turbines or inverter-based units with voltage control). Figure 6 displays the PSO algorithm’s flow chart for the optimal DG placement.
In this study, it was the DG units’ position and size that were generated randomly and then adjusted in compliance with Equations (20) and (21).
X i = ( x i , 1 ,     x i , 2 ,   ,   x i , N )
V i = ( v i , 1 ,   v i , 2 ,   ,   v i , N )
P b e s t , which may be computed using Equation (22), is the problem’s personal best position in the search space. The global best position, or G b e s t given by Equation (23), indicates which particle is the best among all the particles in the group. The particle that yields the most accurate findings for each individual will be displayed.
P b e s t , i = P b e s t , i 1 ,   P b e s t , i 2 ,   ,   P b e s t , i N
G b e s t , i = G b e s t , i 1 ,   G b e s t , i 2 ,   ,   G b e s t , i N
The different scenarios that were investigated in this study are discussed below:
  • Scenario 0—Base System: In scenario 0 (S0), the IEEE 33 bus radial PDS before the fault was investigated for the line power losses using Newton–Raphson power flow analysis.
  • Scenario 1—System After the Fault: In scenario 1 (S1), the system was investigated after the occurrence of a line fault.
  • Scenario 2—Reconfigured PDS: In scenario 2 (S2), the system, after a fault, undergoes the optimal reconfiguration process using the PSO algorithm.
  • Scenario 3—PDS with DG Placement: In scenario 3 (S3), the system, after a fault, undergoes the optimal DG placement and sizing using the PSO algorithm.
  • Scenario 4—PDS with Reconfiguration and DG Placement: In scenario 4 (S4), the system, after a fault, undergoes reconfiguration with optimal DG placement and sizing using the PSO algorithm.
In all the above-mentioned scenarios, the total real power losses were computed, and voltage profiles were obtained to look for any improvement. Also, the amount of load restored was calculated for each scenario and the line power loss profile was obtained to look for maximization of load restored and power loss minimization. The power flow analysis was performed using a Newton–Raphson-based power flow approach to calculate the power losses and the load restored in the network.

2.6. Resilience Metric

In this section, the resilience metrics that have been used to measure the capability of the grid in restoring the service to normal after the occurrence of a fault have been discussed. According to Bajwa et al. [44], to incorporate different classes of loads (critical, semi-critical, and non-critical), a resilience metric R 1 has been proposed by Luo et al. [53] in which each load class is assigned to weight according to its priority and is given by the following:
R 1 = 1 L o s s
where
L o s s = 0 t 1 M i = 1 M p ( x i ) P 0 d t
where p ( x i ) is the total weighted load lost, P 0 is the total weighted load before the disruptive events, M   is the sampling number, and x i is a fault scenario.
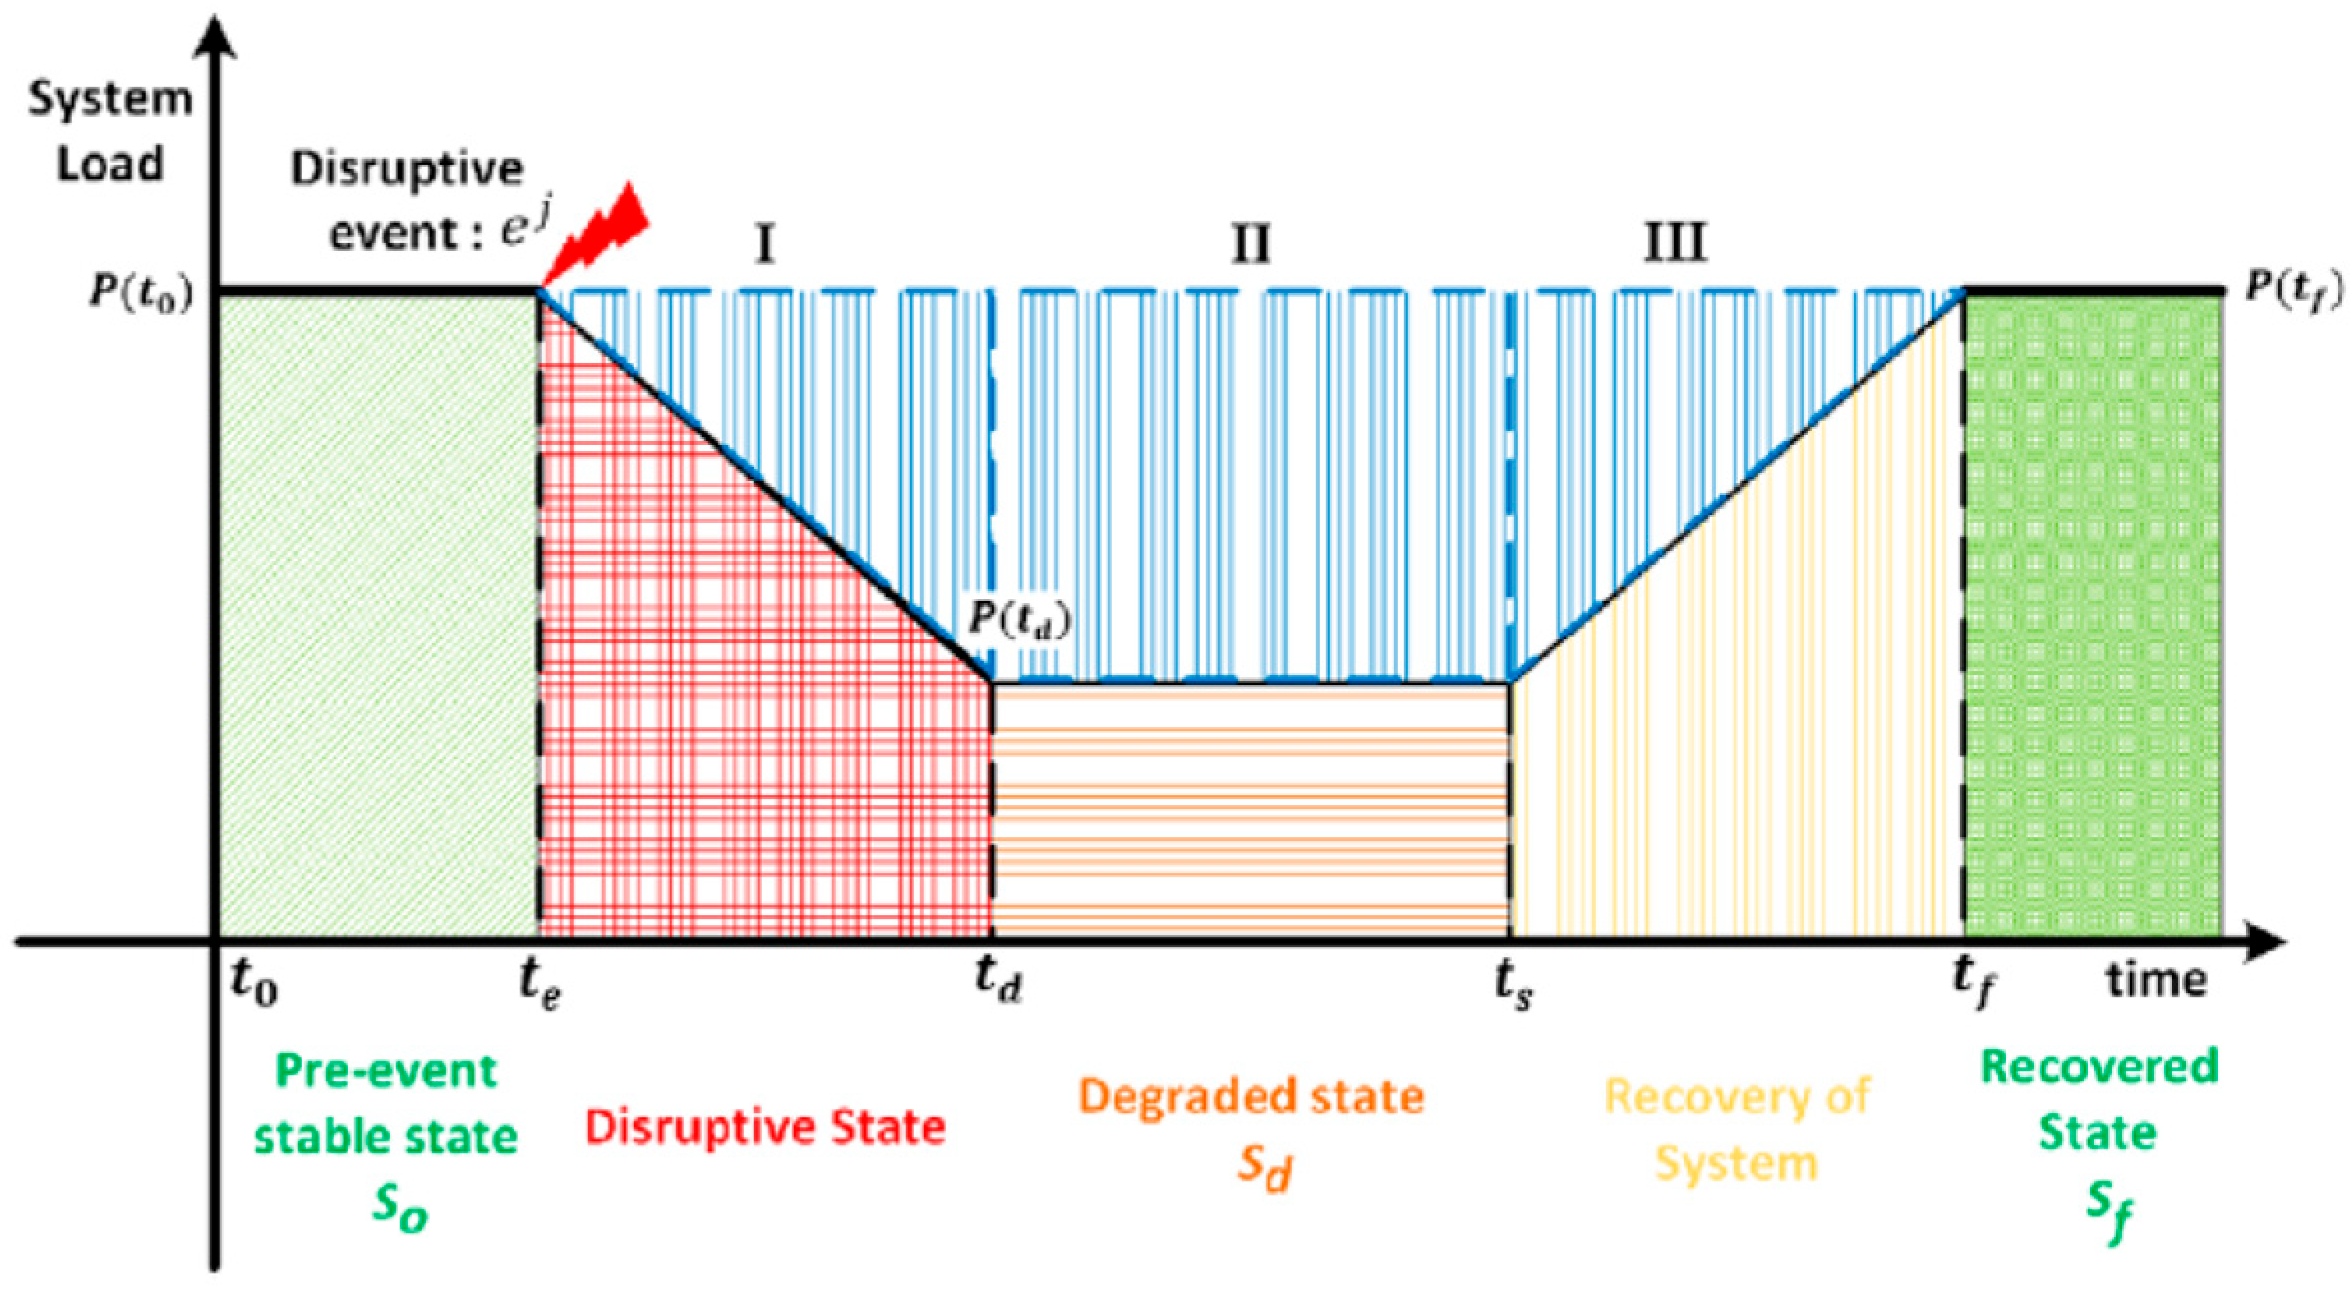
Almoghathawi & Barker [54] proposed a metric, R 2 , for evaluating network resilience based on the network operation transition stages. Figure 7 displays the network’s transition states. The function which measures the network’s performance under certain operational phases is denoted by P(t). So, if S 0 denotes the network’s stable operation state before the event occurrence, S d is the network’s degraded operation state after the event occurrence e j , and S f is the network’s stable operation state after the restoration process; so, the resilience metric, R 2 which is defined as the time-dependent ratio of recovery over loss, is given by:
R 2 = P t f e j P t d e j P t 0 e j P t d e j
where P t f e j measures the performance of the network after the restoration process restores the system to a desired level, P t d e j measures the network’s performance in a degraded state following a disruptive event, and P t 0 e j measures the network’s performance in a stable state before a disruptive event. At each given time t, following a disruptive event, the resilience metric R 2 value ranges from 0 to 1. When the network’s R 2 value is 1, it means that it is completely resilient; when it is 0, it means that it is not.
Liu et al. [55] put forward a metric to evaluate the power system’s operational resilience. The resilience trapezoid in Figure 7 is also the basis for the suggested metric. The disturbance phase, post-disturbance phase, and restoration phase are the three system stages for which the authors suggested distinct metrics. The areas of two right-angled triangles and one rectangle, shown by the blue lines in Figure 7 and designated I, II, and III, can also be added to combine these metrics.
Equation (27) provides an illustration of the metric for phase I, which represents system degradation. The system following degradation is represented by phase II, during which the network operator will evaluate the system damage and create a restoration strategy. Equation (28) provides an illustration of Phase II. System restoration is represented by phase III, when the network operator carries out the repair plan. Equation (29) provides an illustration of phase III. Equations (27)–(30) illustrate the combined resilience measure, R 3 .
I = P t 0 e j P t d e j ( t d t e ) 2
I I = P t 0 e j P t d e j ( t s t d )
I I I = P t f e j P t d e j ( t f t s ) 2
R 3 = I + I I + I I I
Our contribution is an integrated DBN-guided restoration framework. First, a DBN provided hour-ahead failure probabilities, which were converted into outage sets. Second, a PSO-based service restoration model was developed using the outage outcomes of the DBN model. The objective of service restoration was to maximize served load and minimize losses using two different strategies: (i) PSO-based optimal reconfiguration and (ii) PSO-based optimal DG placement. Finally, resilience metrics were used to quantify performance over the disturbance assessment restoration phases.

3. Case Studies

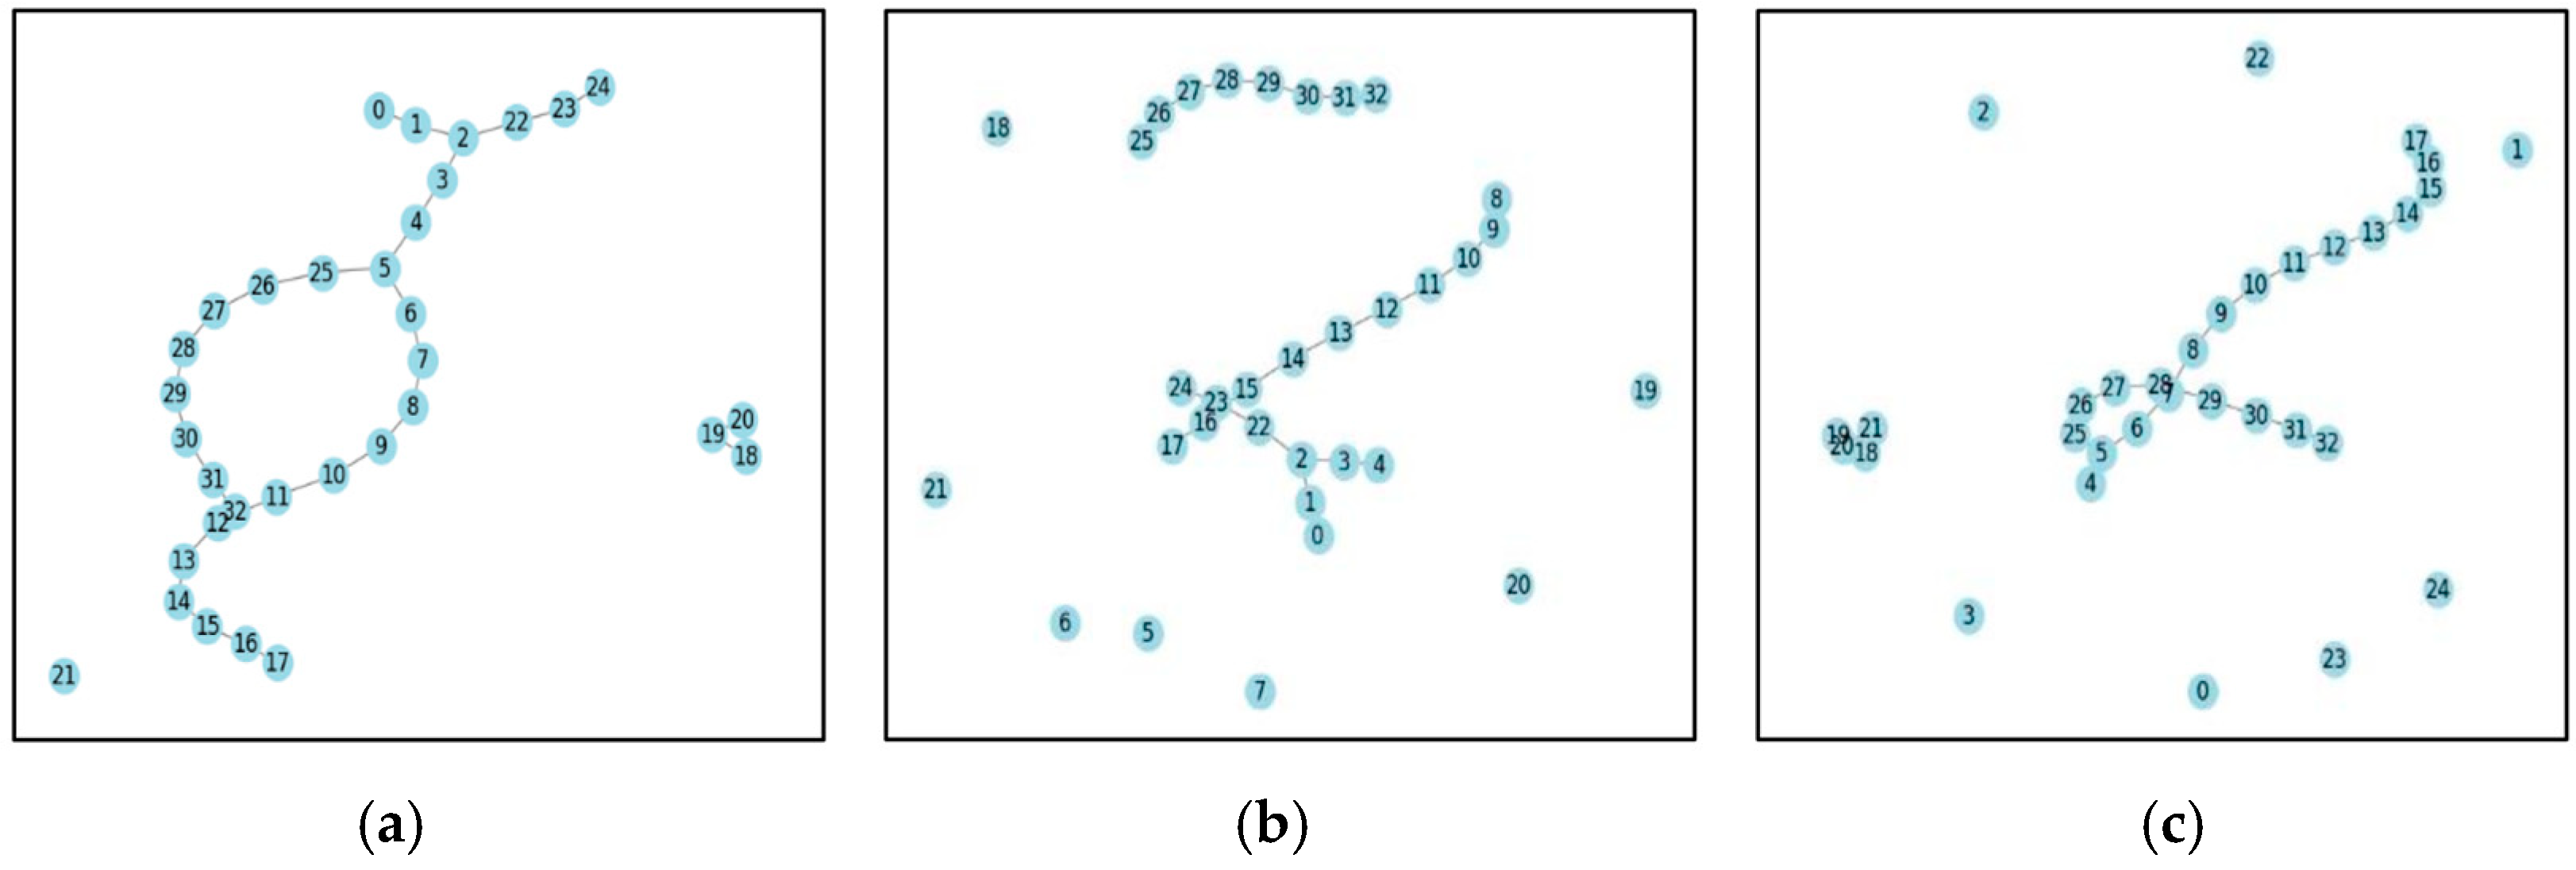
This section familiarizes the details of various case studies carried out in this study. The DBN model was run for two time steps, resulting in three different cases. The outage prediction for these three cases is given in Table 1, and it represents minor, major, and worst-case scenarios depending upon the number of buses being isolated/unserved because of these faulty lines. Case 1 (faulted lines: 18, 21), representing minor scenario, corresponds to Region 2 affected by category 3 hurricane at time instant t = 0, while Case 2 (faulted lines: 5, 6, 7, 8, 18, 19, 20, 21, 25, and 33), representing major scenario, corresponds to Region 2 affected by category 3 hurricane at time instant t = 1, and Case 3 (faulted lines: 1, 2, 3, 4, 18, 22, 23, and 24), representing worst-case scenario, (blackout) corresponds to Region 1 affected by category 4 hurricane at time instant t = 0. Table 1 also lists the connection between different buses (i.e., a system line) and the HWSI affecting the different system lines of the IEEE 33 test system. Also, due to the unavailability of actual critical load data, a representative assumption was made by designating buses 19 and 5 as critical nodes.
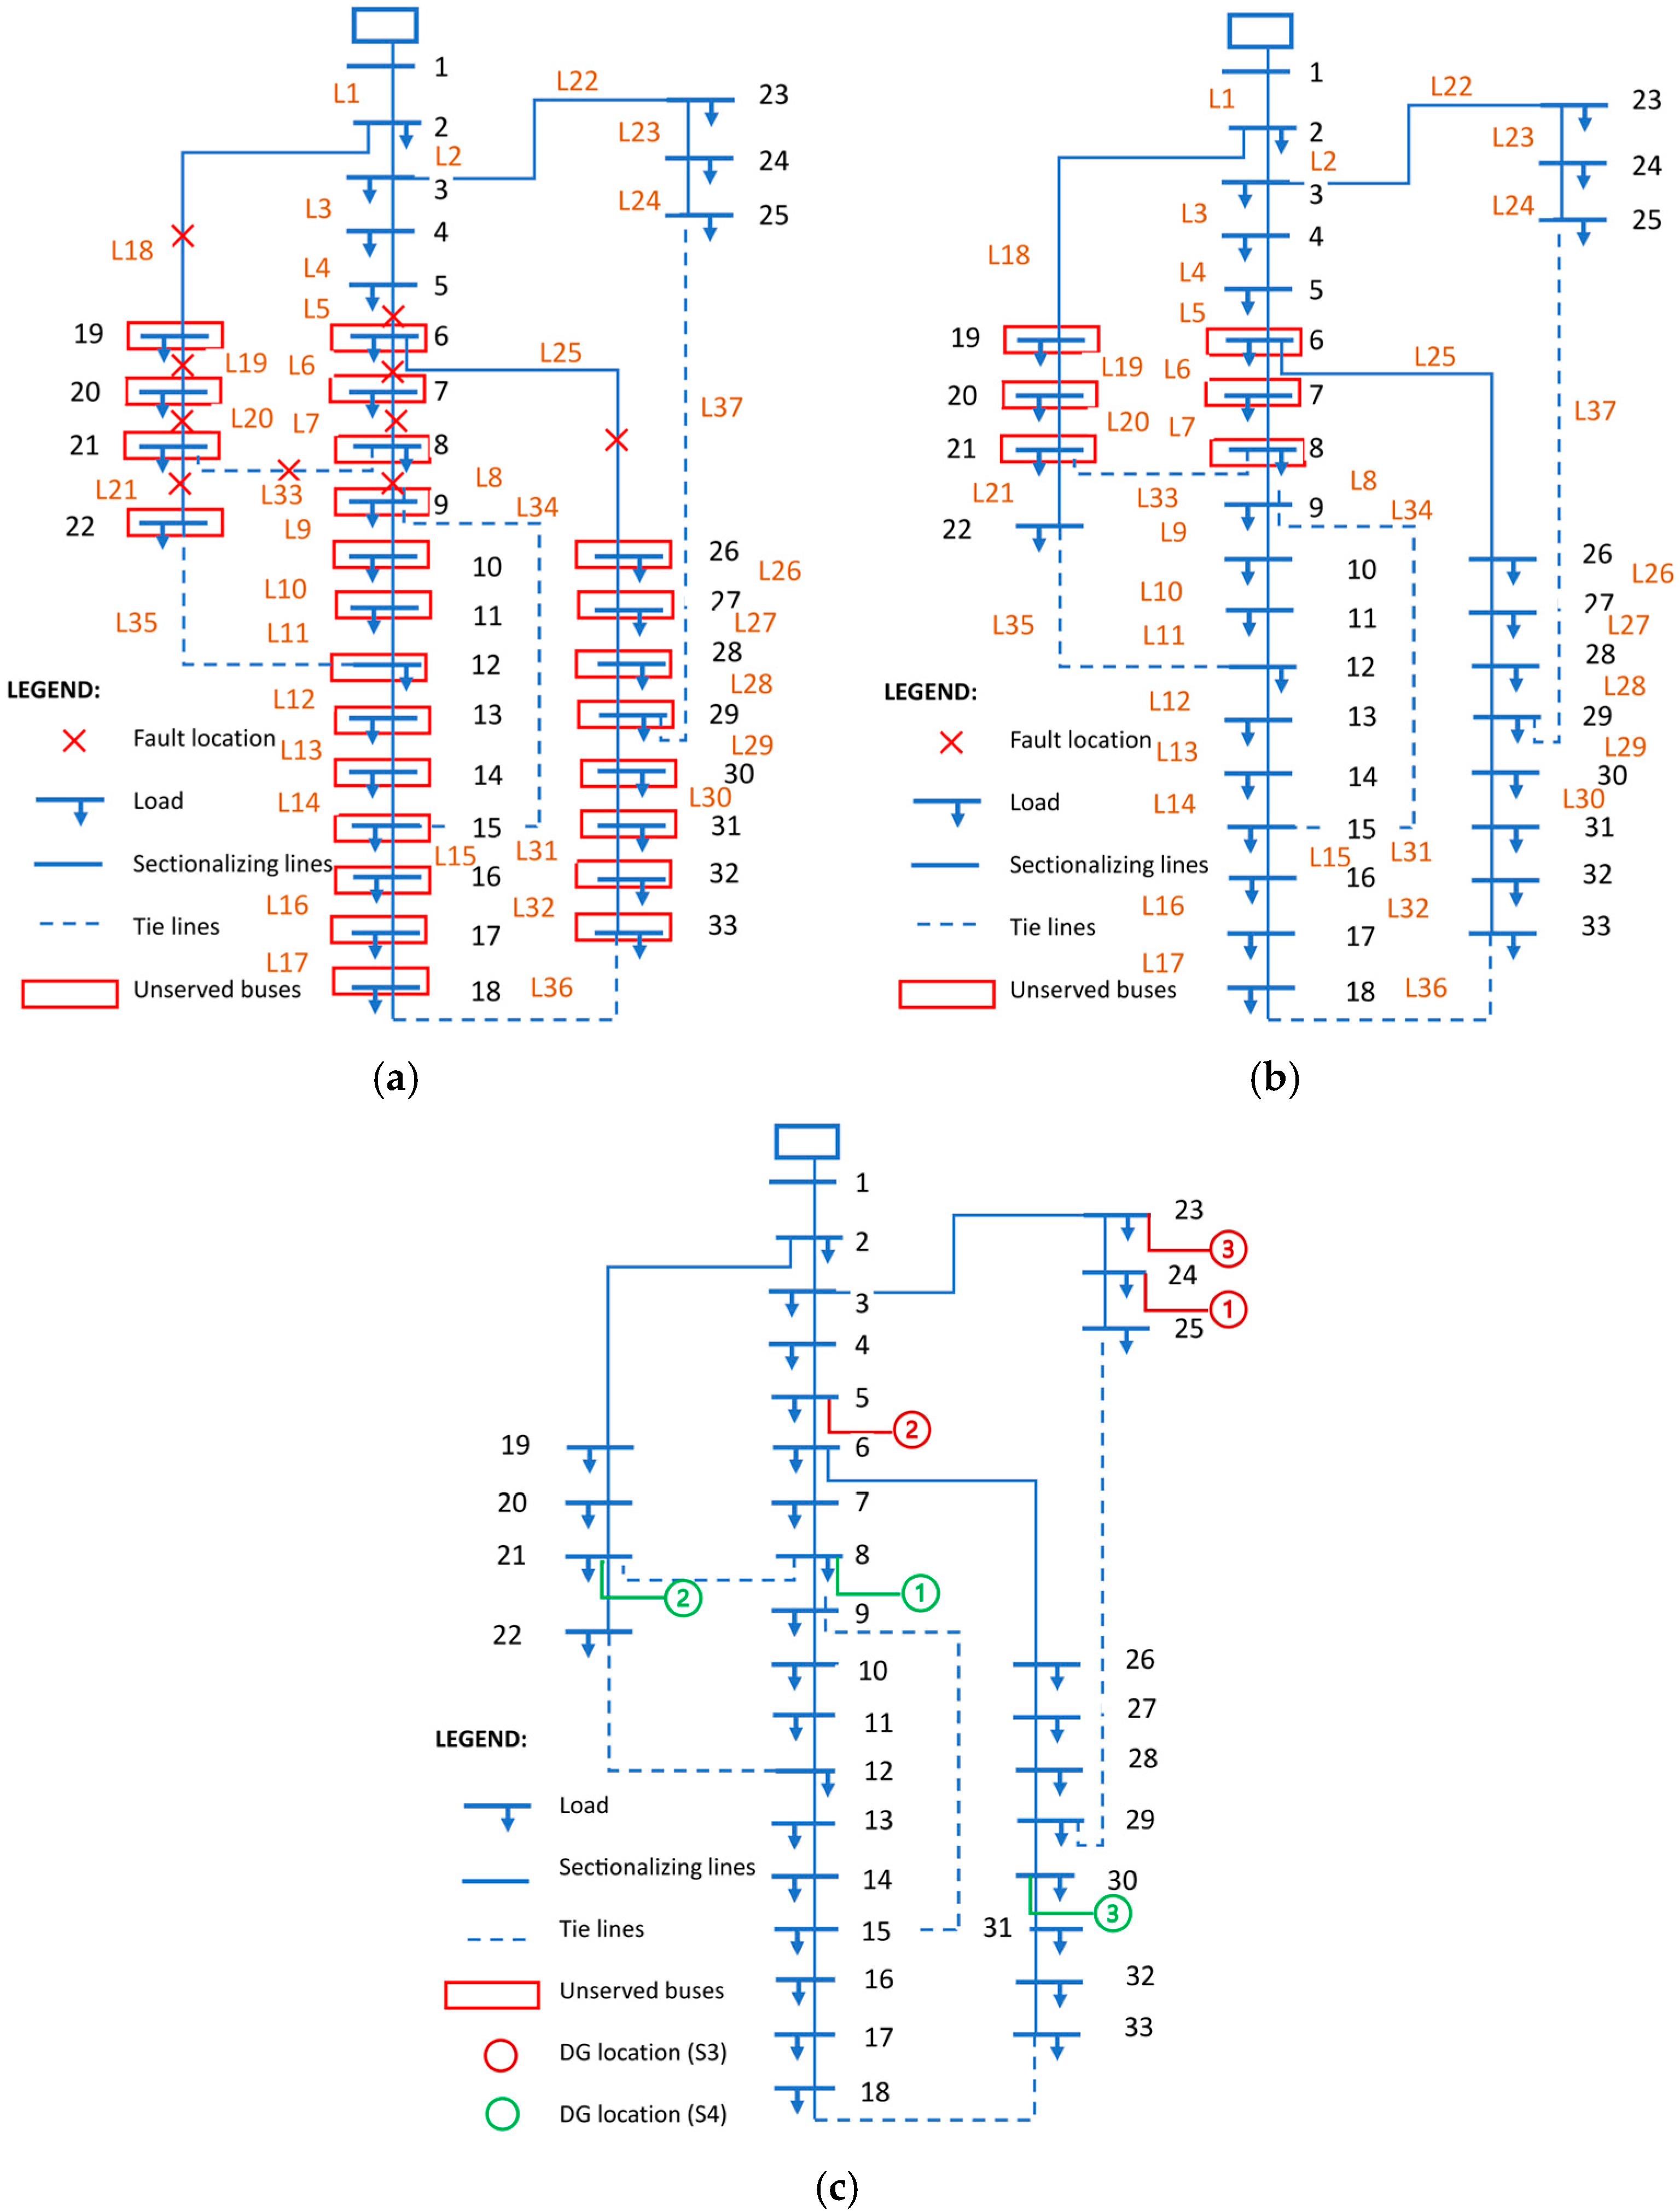
Figure 8 shows the number of unserved/isolated buses caused due to the faulty lines for the three cases. Due to programming conventions and zero-based indexing in Python, the numbering of the IEEE 33 bus system starts from 0 instead of 1. This means that disconnected buses 18, 19, 20, and 21, shown in Figure 8a, have bus numbers 19, 20, 21, and 22, respectively. The same is true for the rest of the cases as well.

4. Results and Discussion

In this section, the test results for different cases of the PDS are presented and discussed. All cases were programmed using Python (in Jupyter notebook), and simulations were carried out on an Intel Core i5 processor, 8 GB RAM platform.

4.1. Case 0

Base System (Scenario S0)

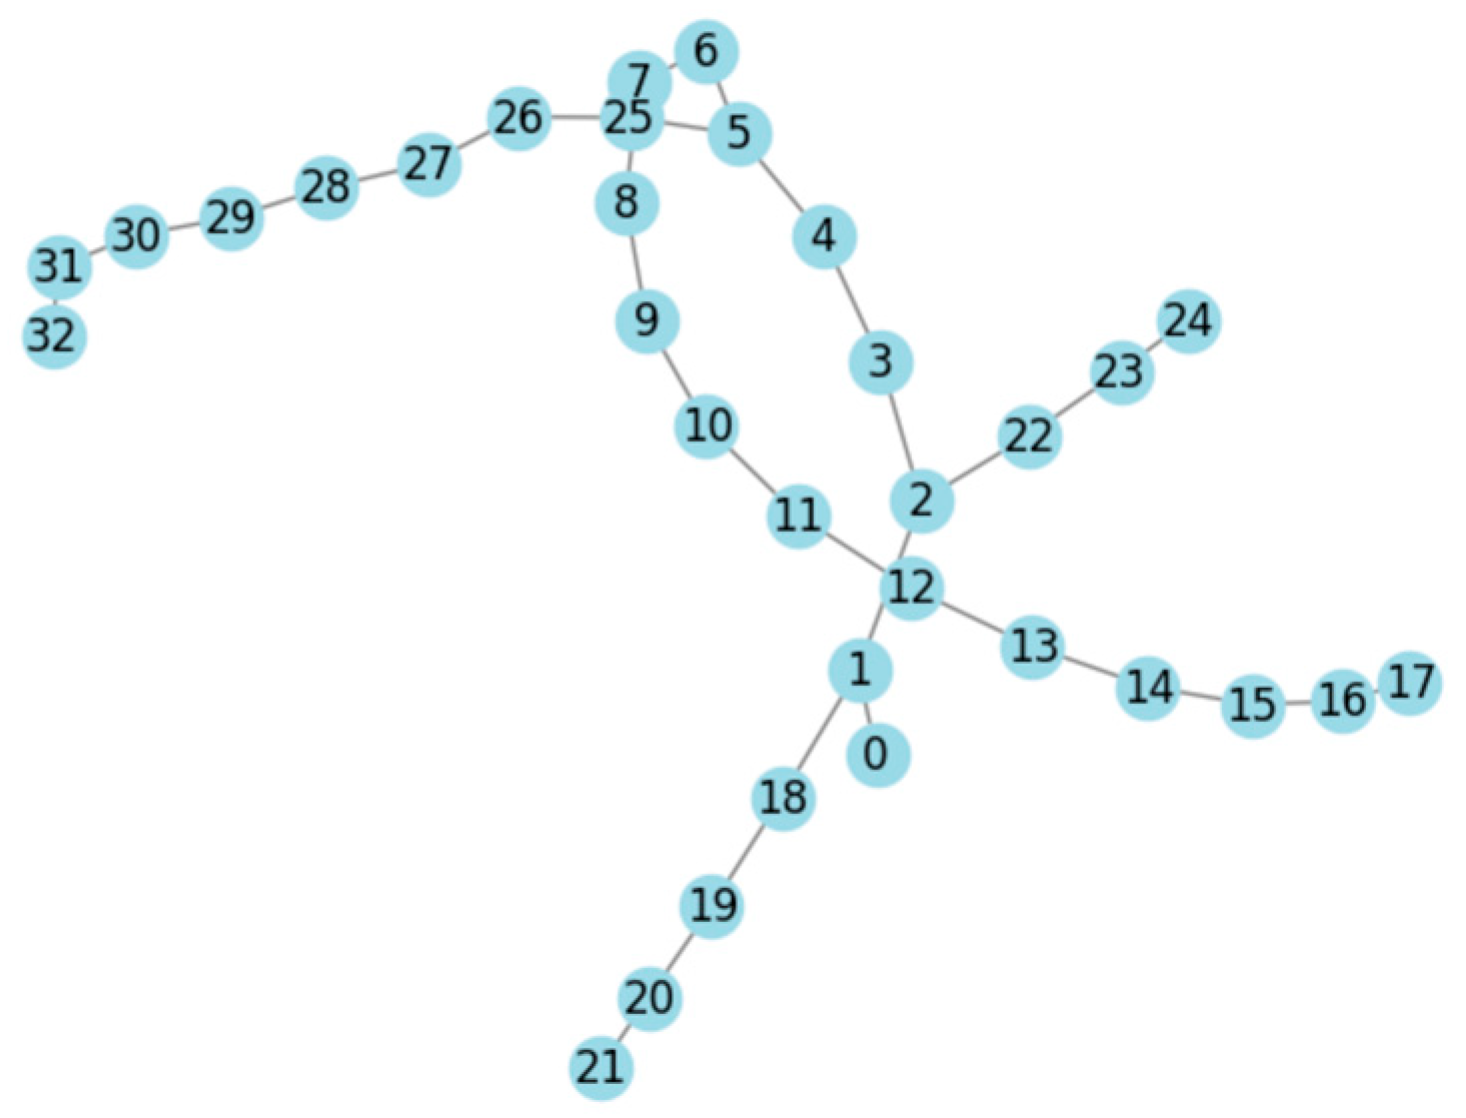
For the Base System (No Faults), the total real power loss after running the Newton–Raphson power flow analysis was found to be 202.677 KW. The minimum voltage on bus 18 was 0.9131 p.u. In this case, the system was fully operational, supplying all buses, and the network was fully connected, as shown in Figure 9, and power flows optimally through all lines. Since all loads were being served, ( I 2 R ) losses were relatively higher compared to other faulty scenarios.

4.2. Case 1

4.2.1. Faulty System (Scenario S1)

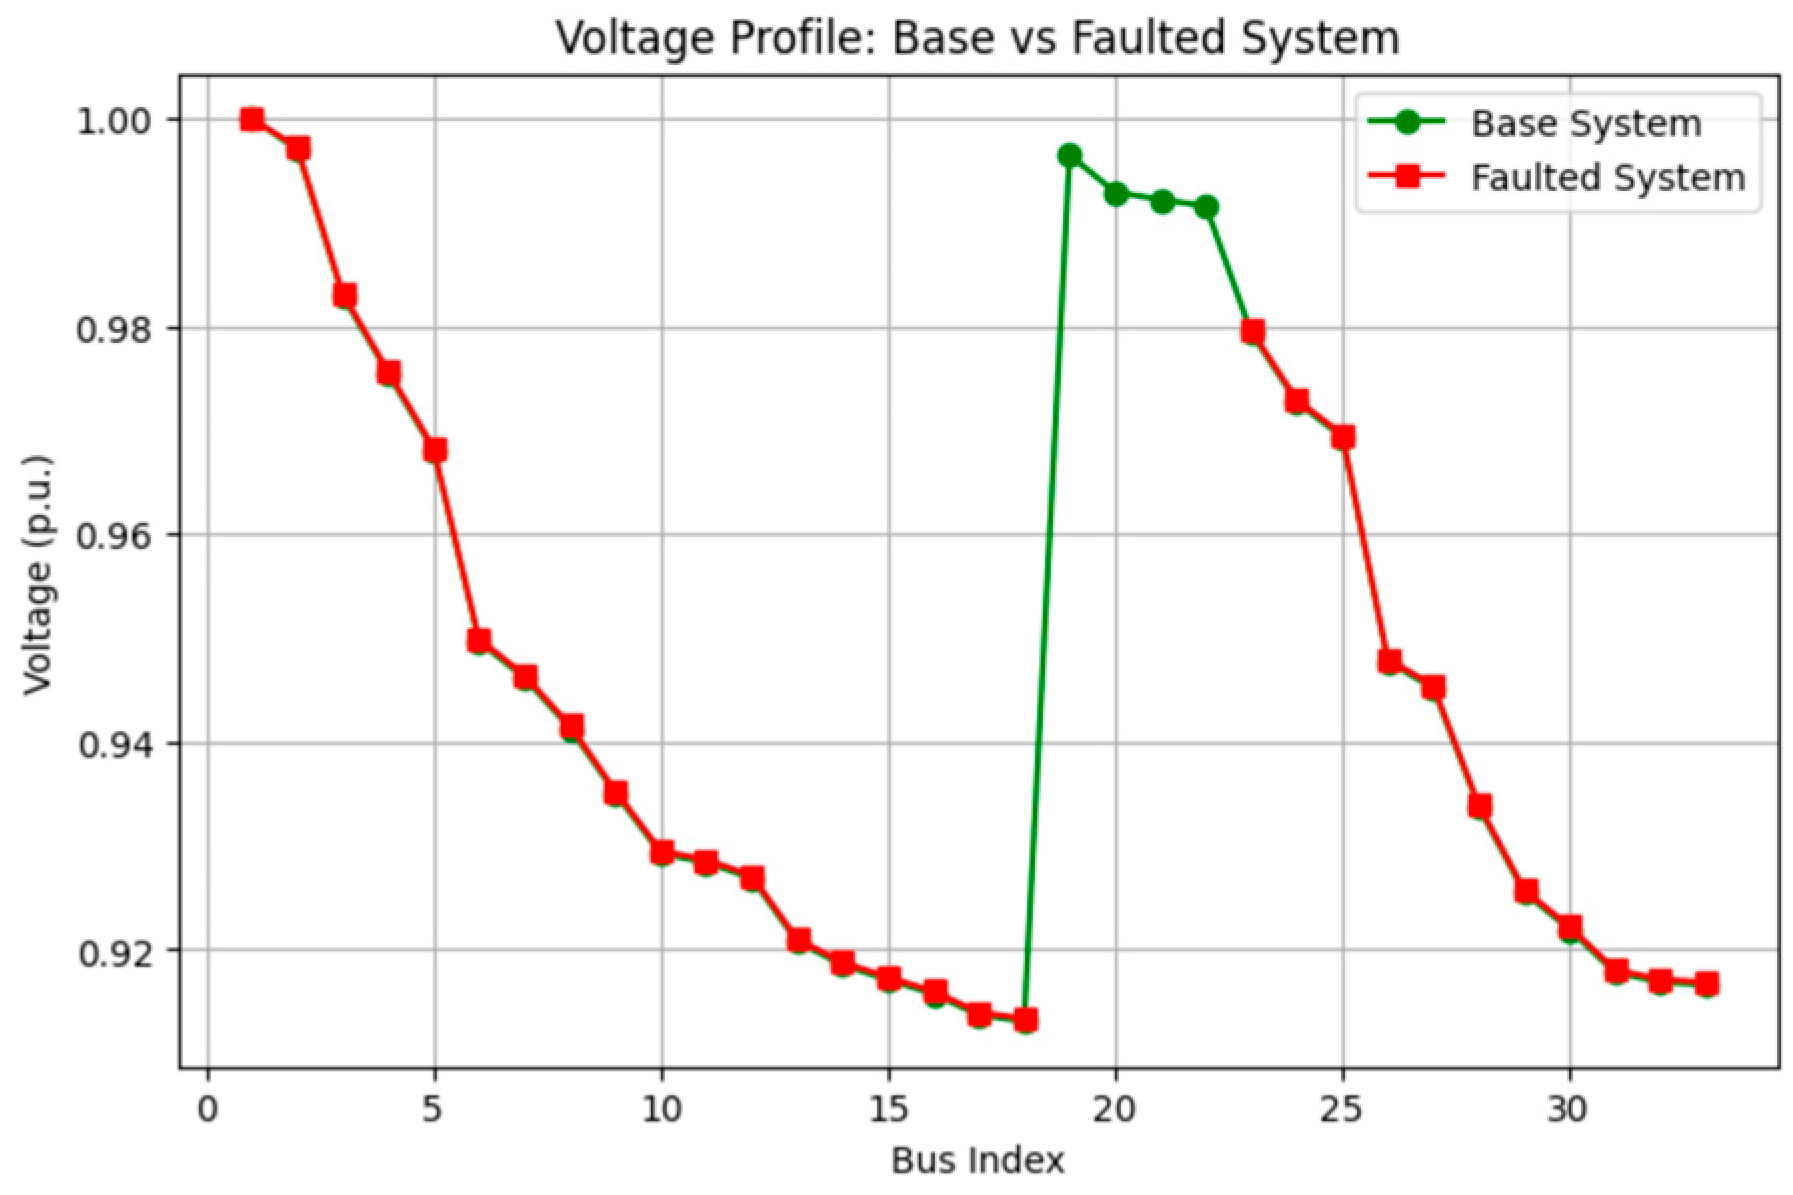
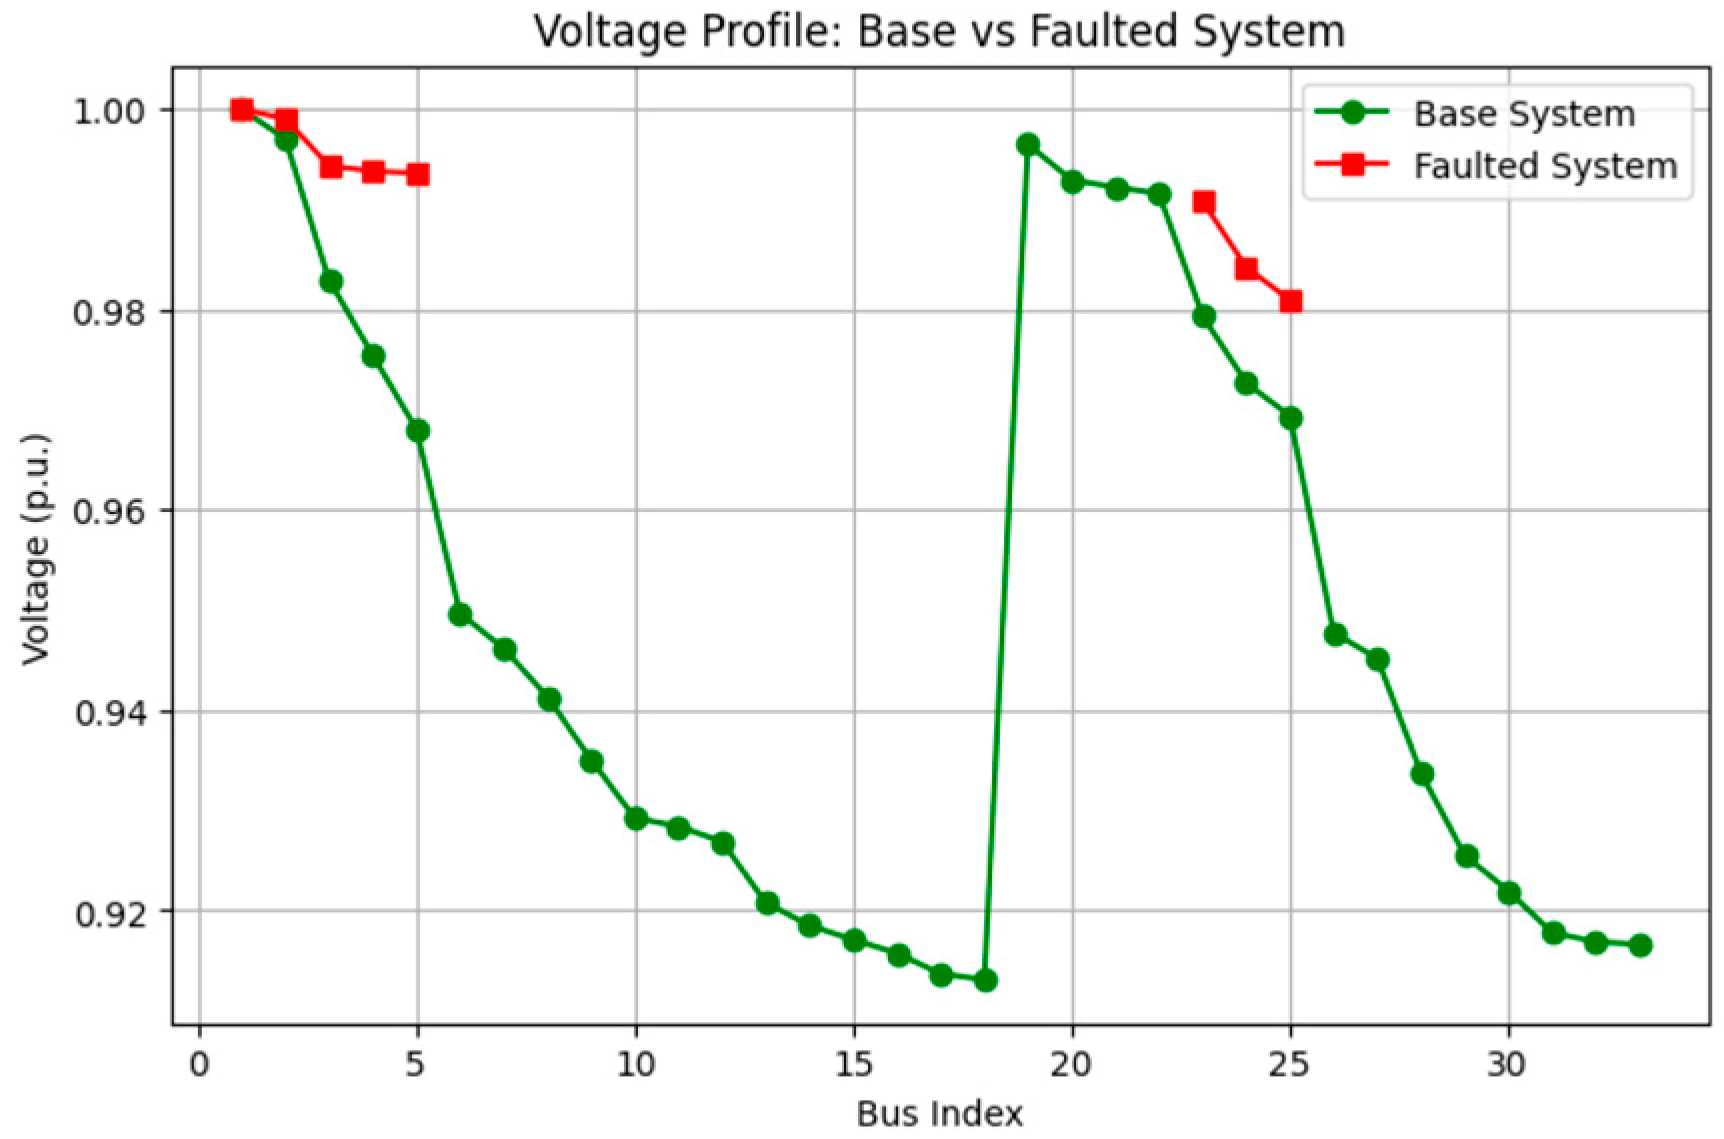
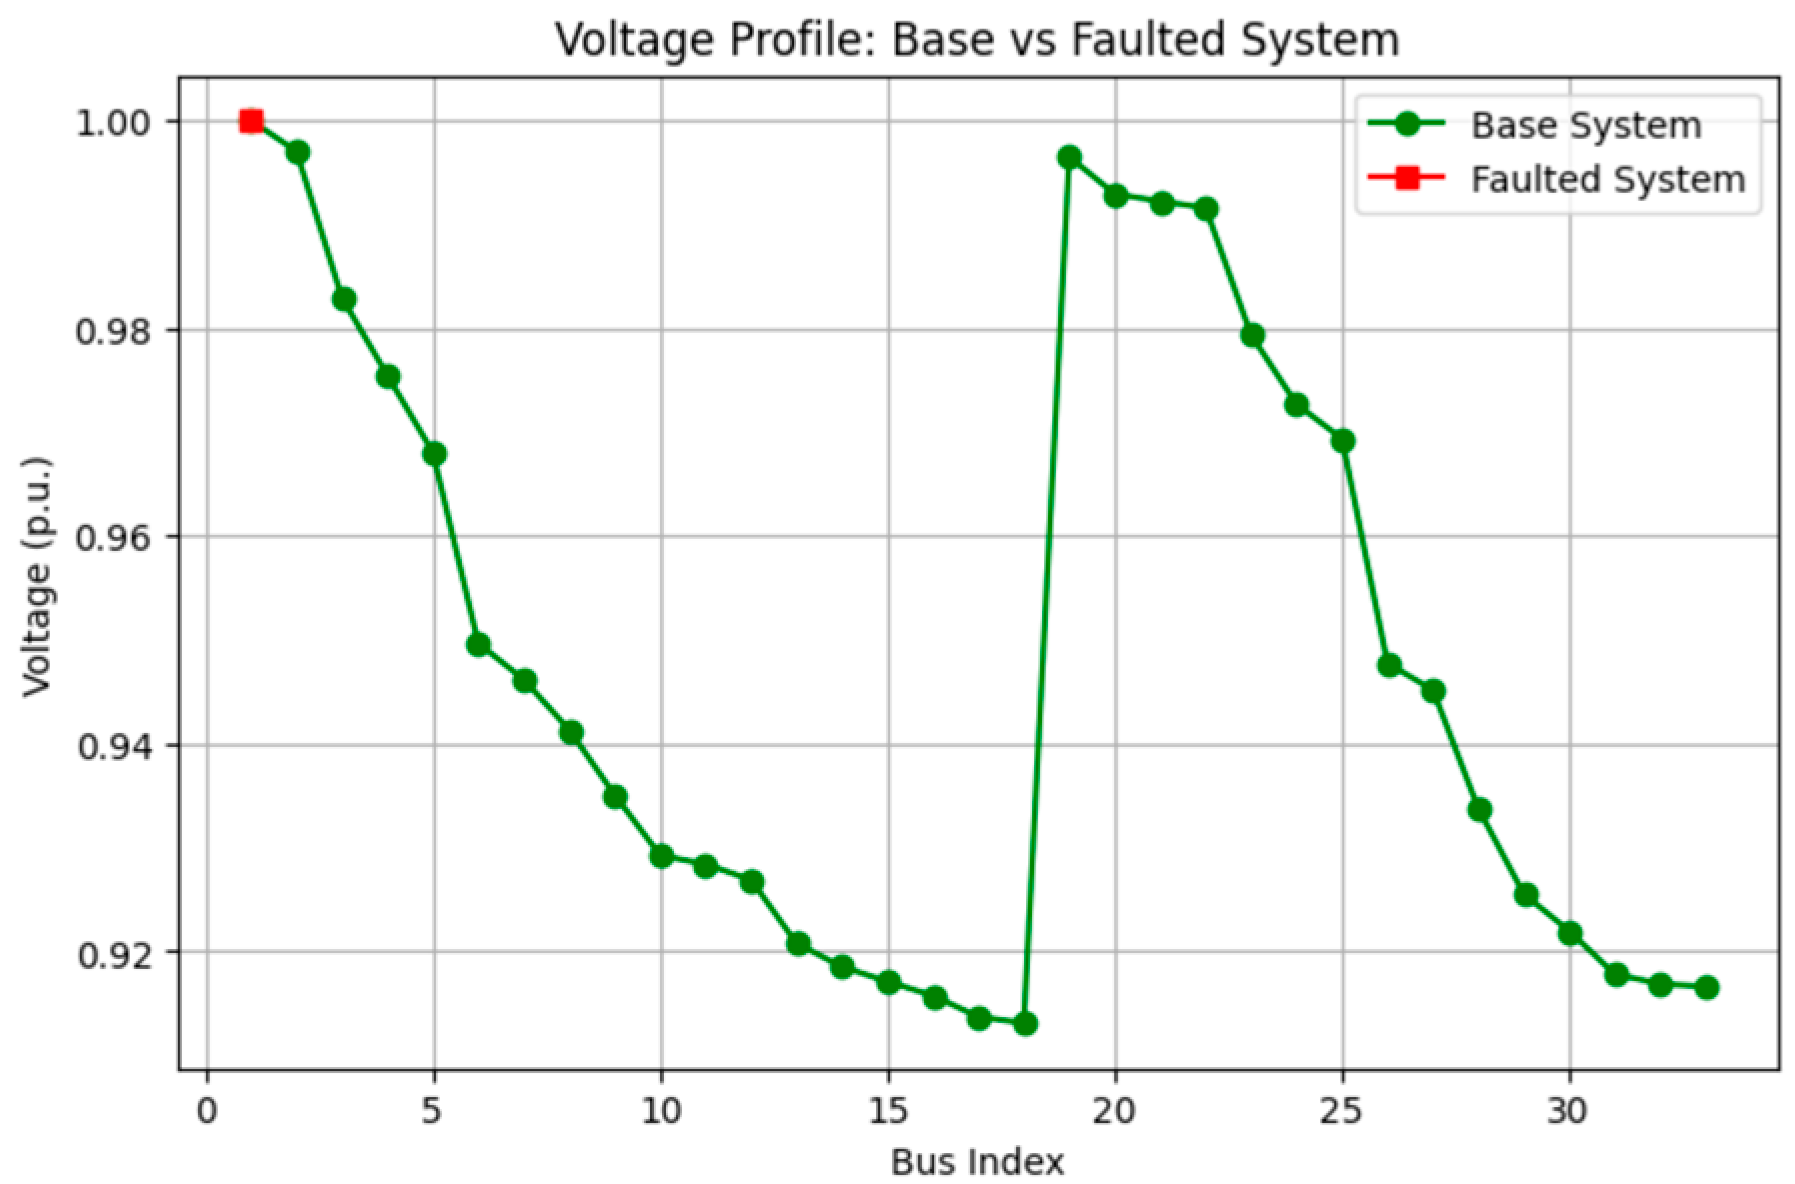
For scenario 1, the total power loss after running the power flow analysis was found to be 0.1880 MW. The faulty lines in Case 1 (C1) were 18 and 21, because of which only four buses (19, 20, 21, 22) were isolated or unserved, as shown in Figure 8a, meaning most of the network was still active and serving the load. These four buses were disconnected, which means less power was flowing through the system, leading to a small reduction in ( I 2 R )   losses (−15.1 KW from the base case). However, since a significant portion of the load was still being served, power loss remained close to the base case. So, the system was still mostly operational, with a minor drop in power loss due to losing only a small part of the load, as is evident from Figure 10. But still, the system requires restoration strategies through either network reconfiguration or DG placement.

4.2.2. Only Reconfiguration (Scenario S2)

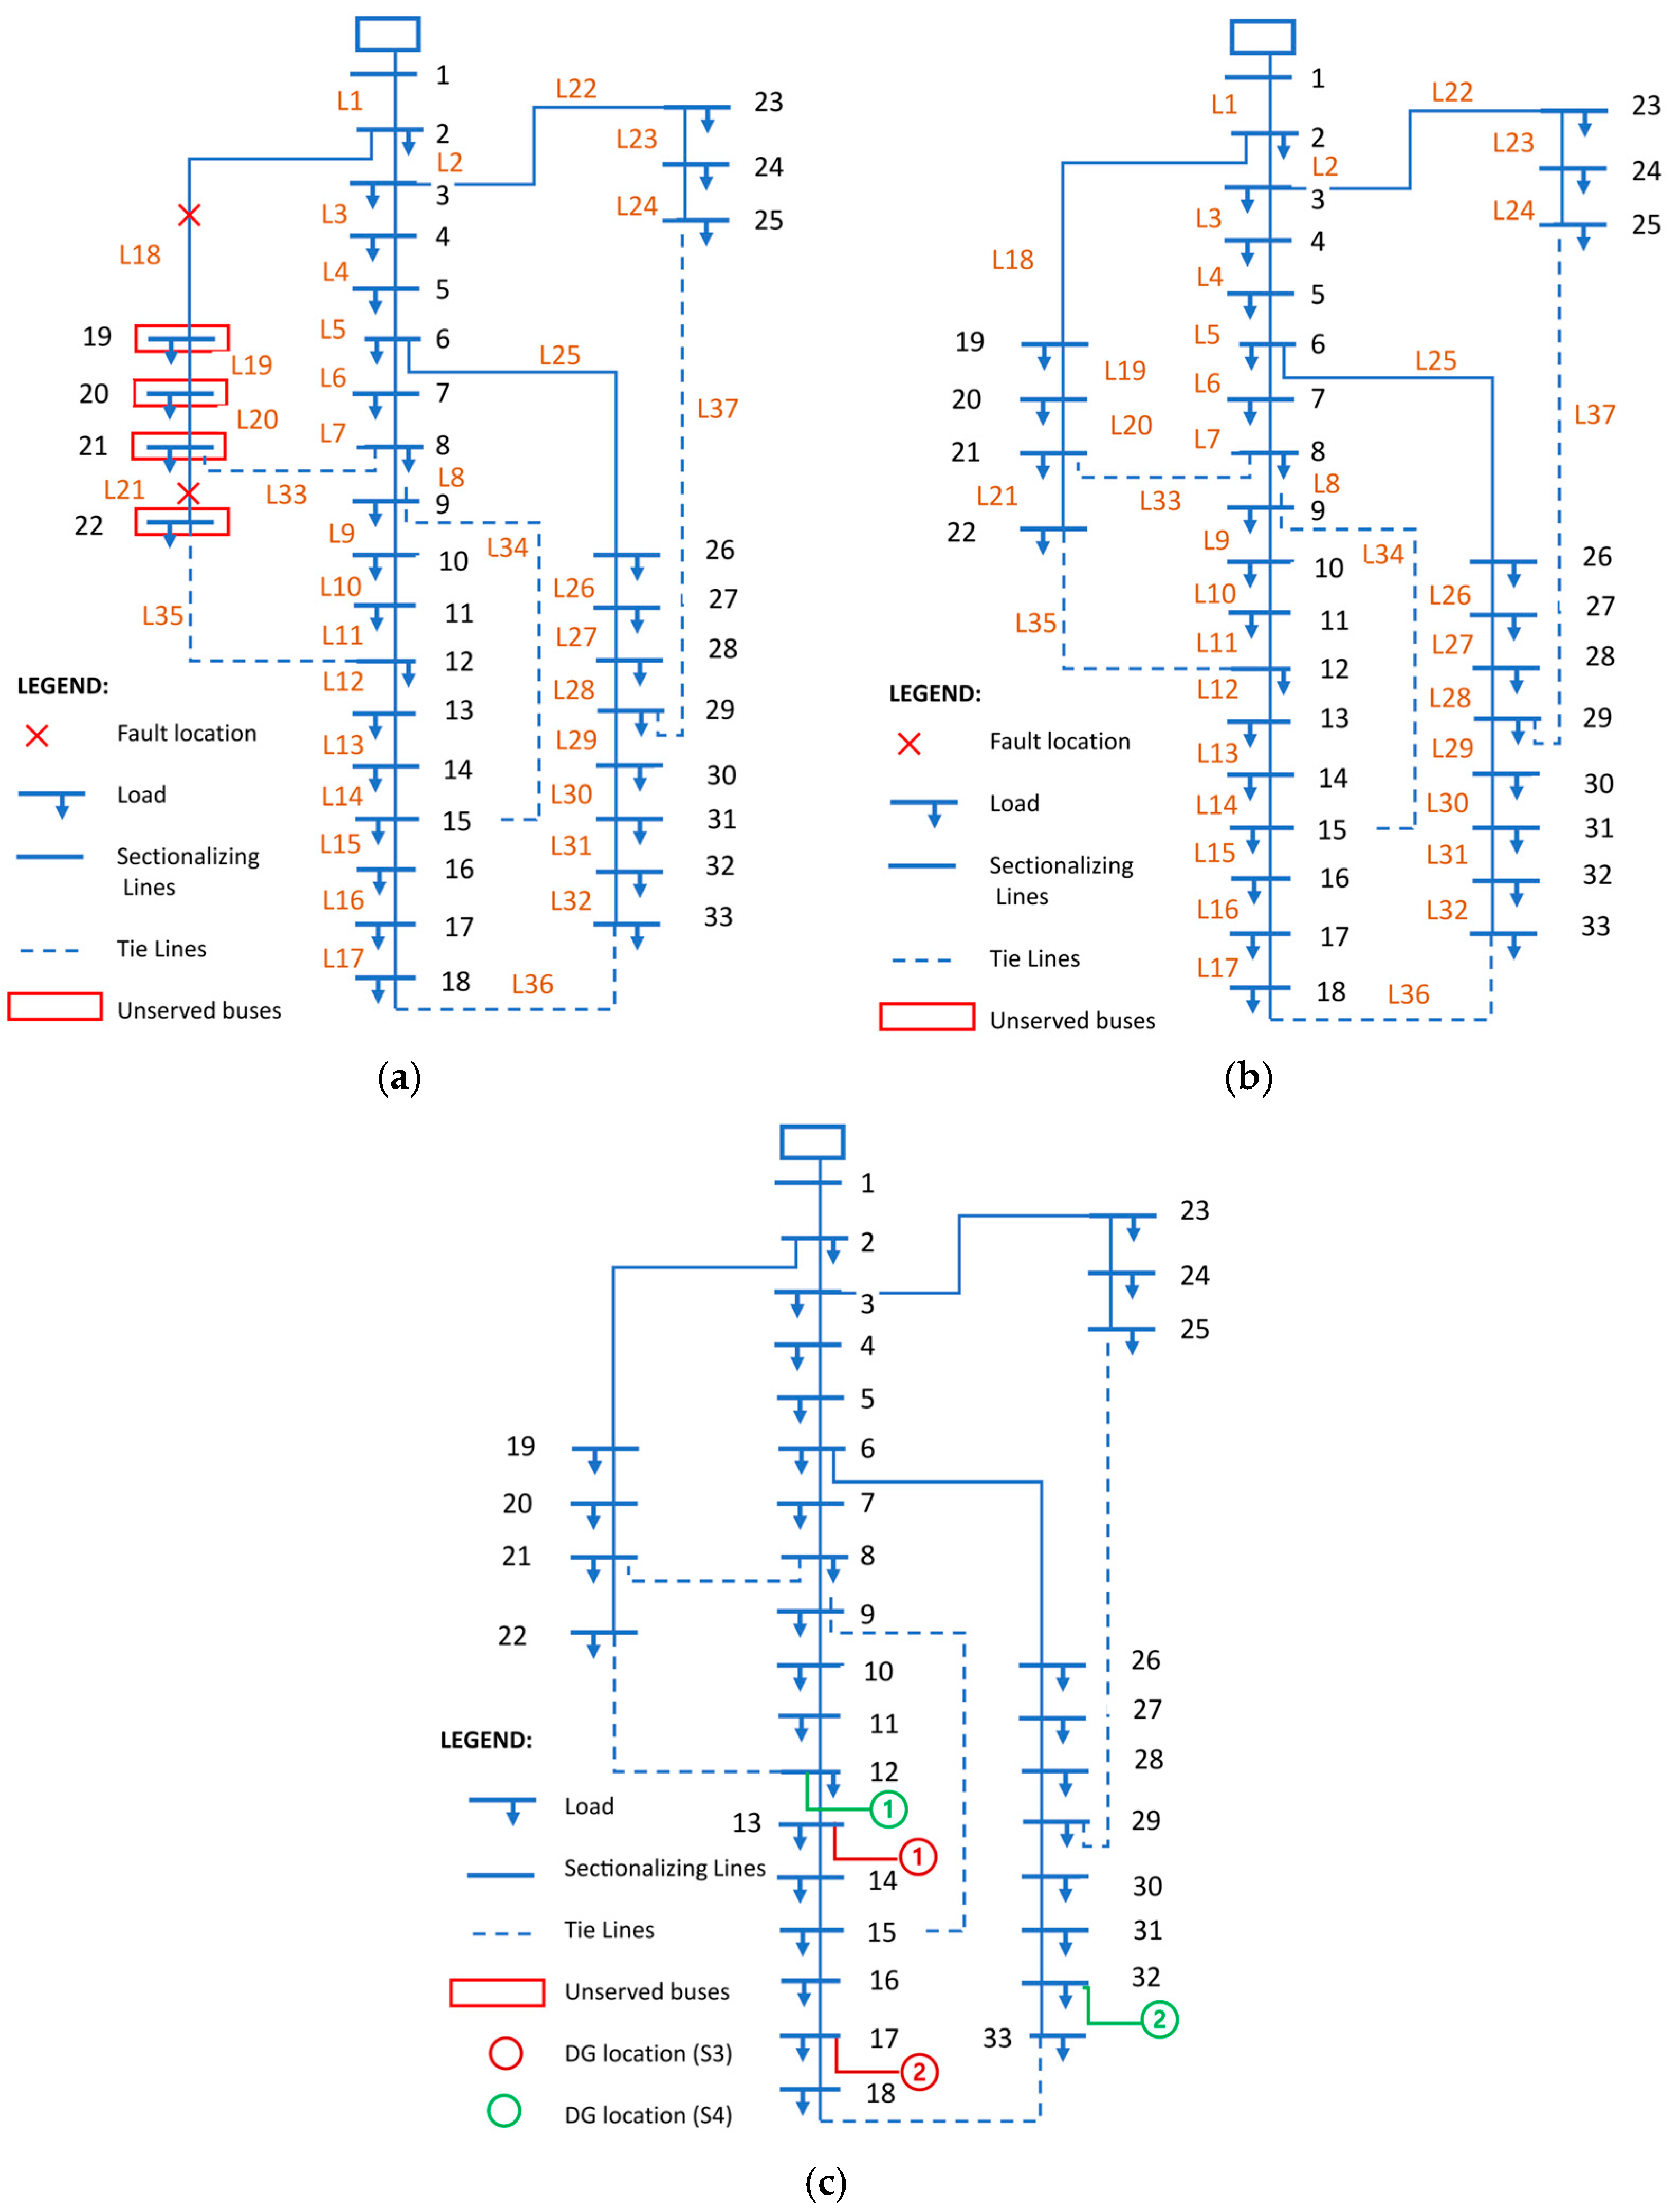
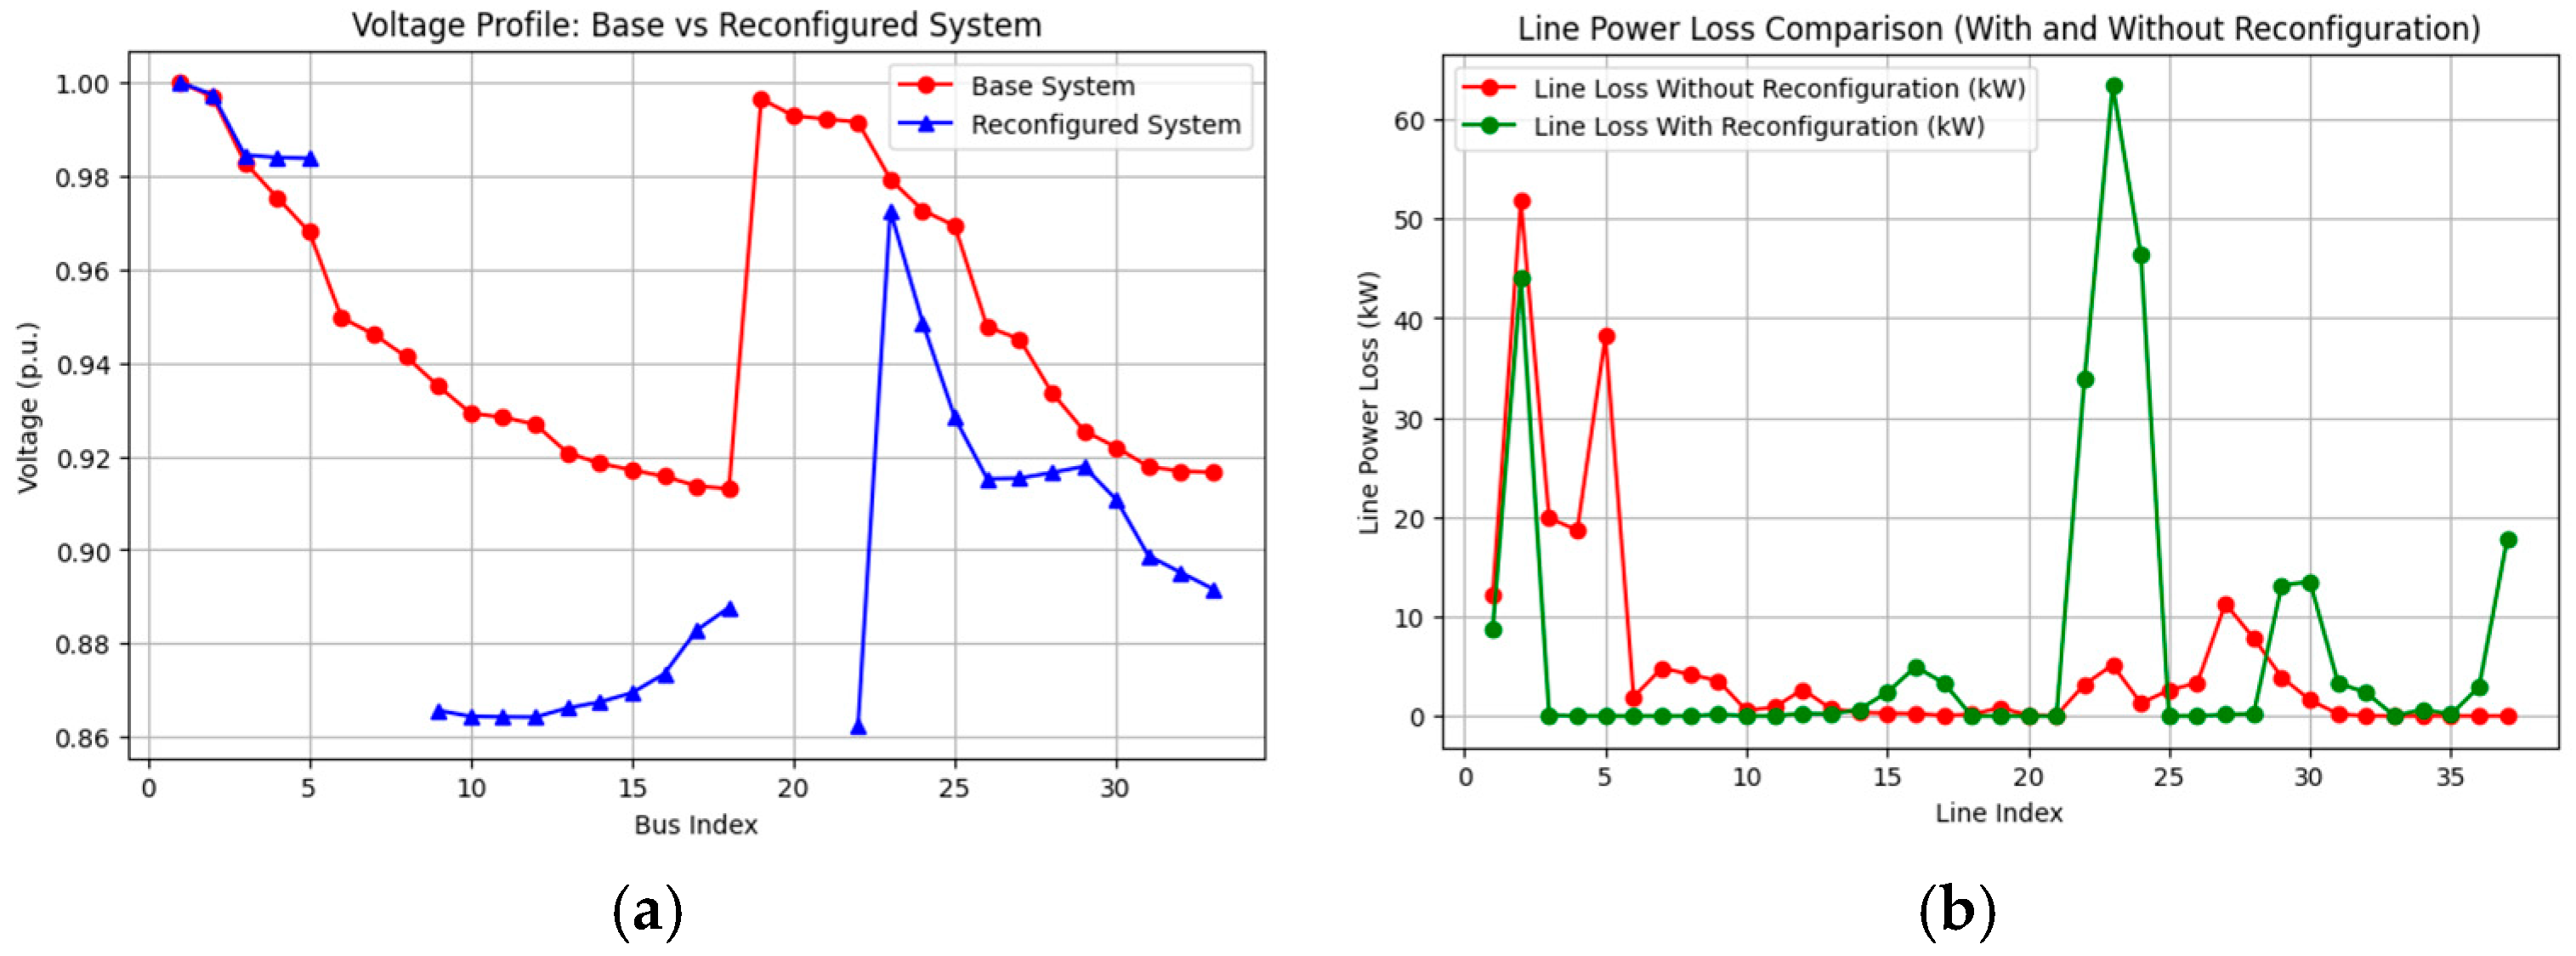
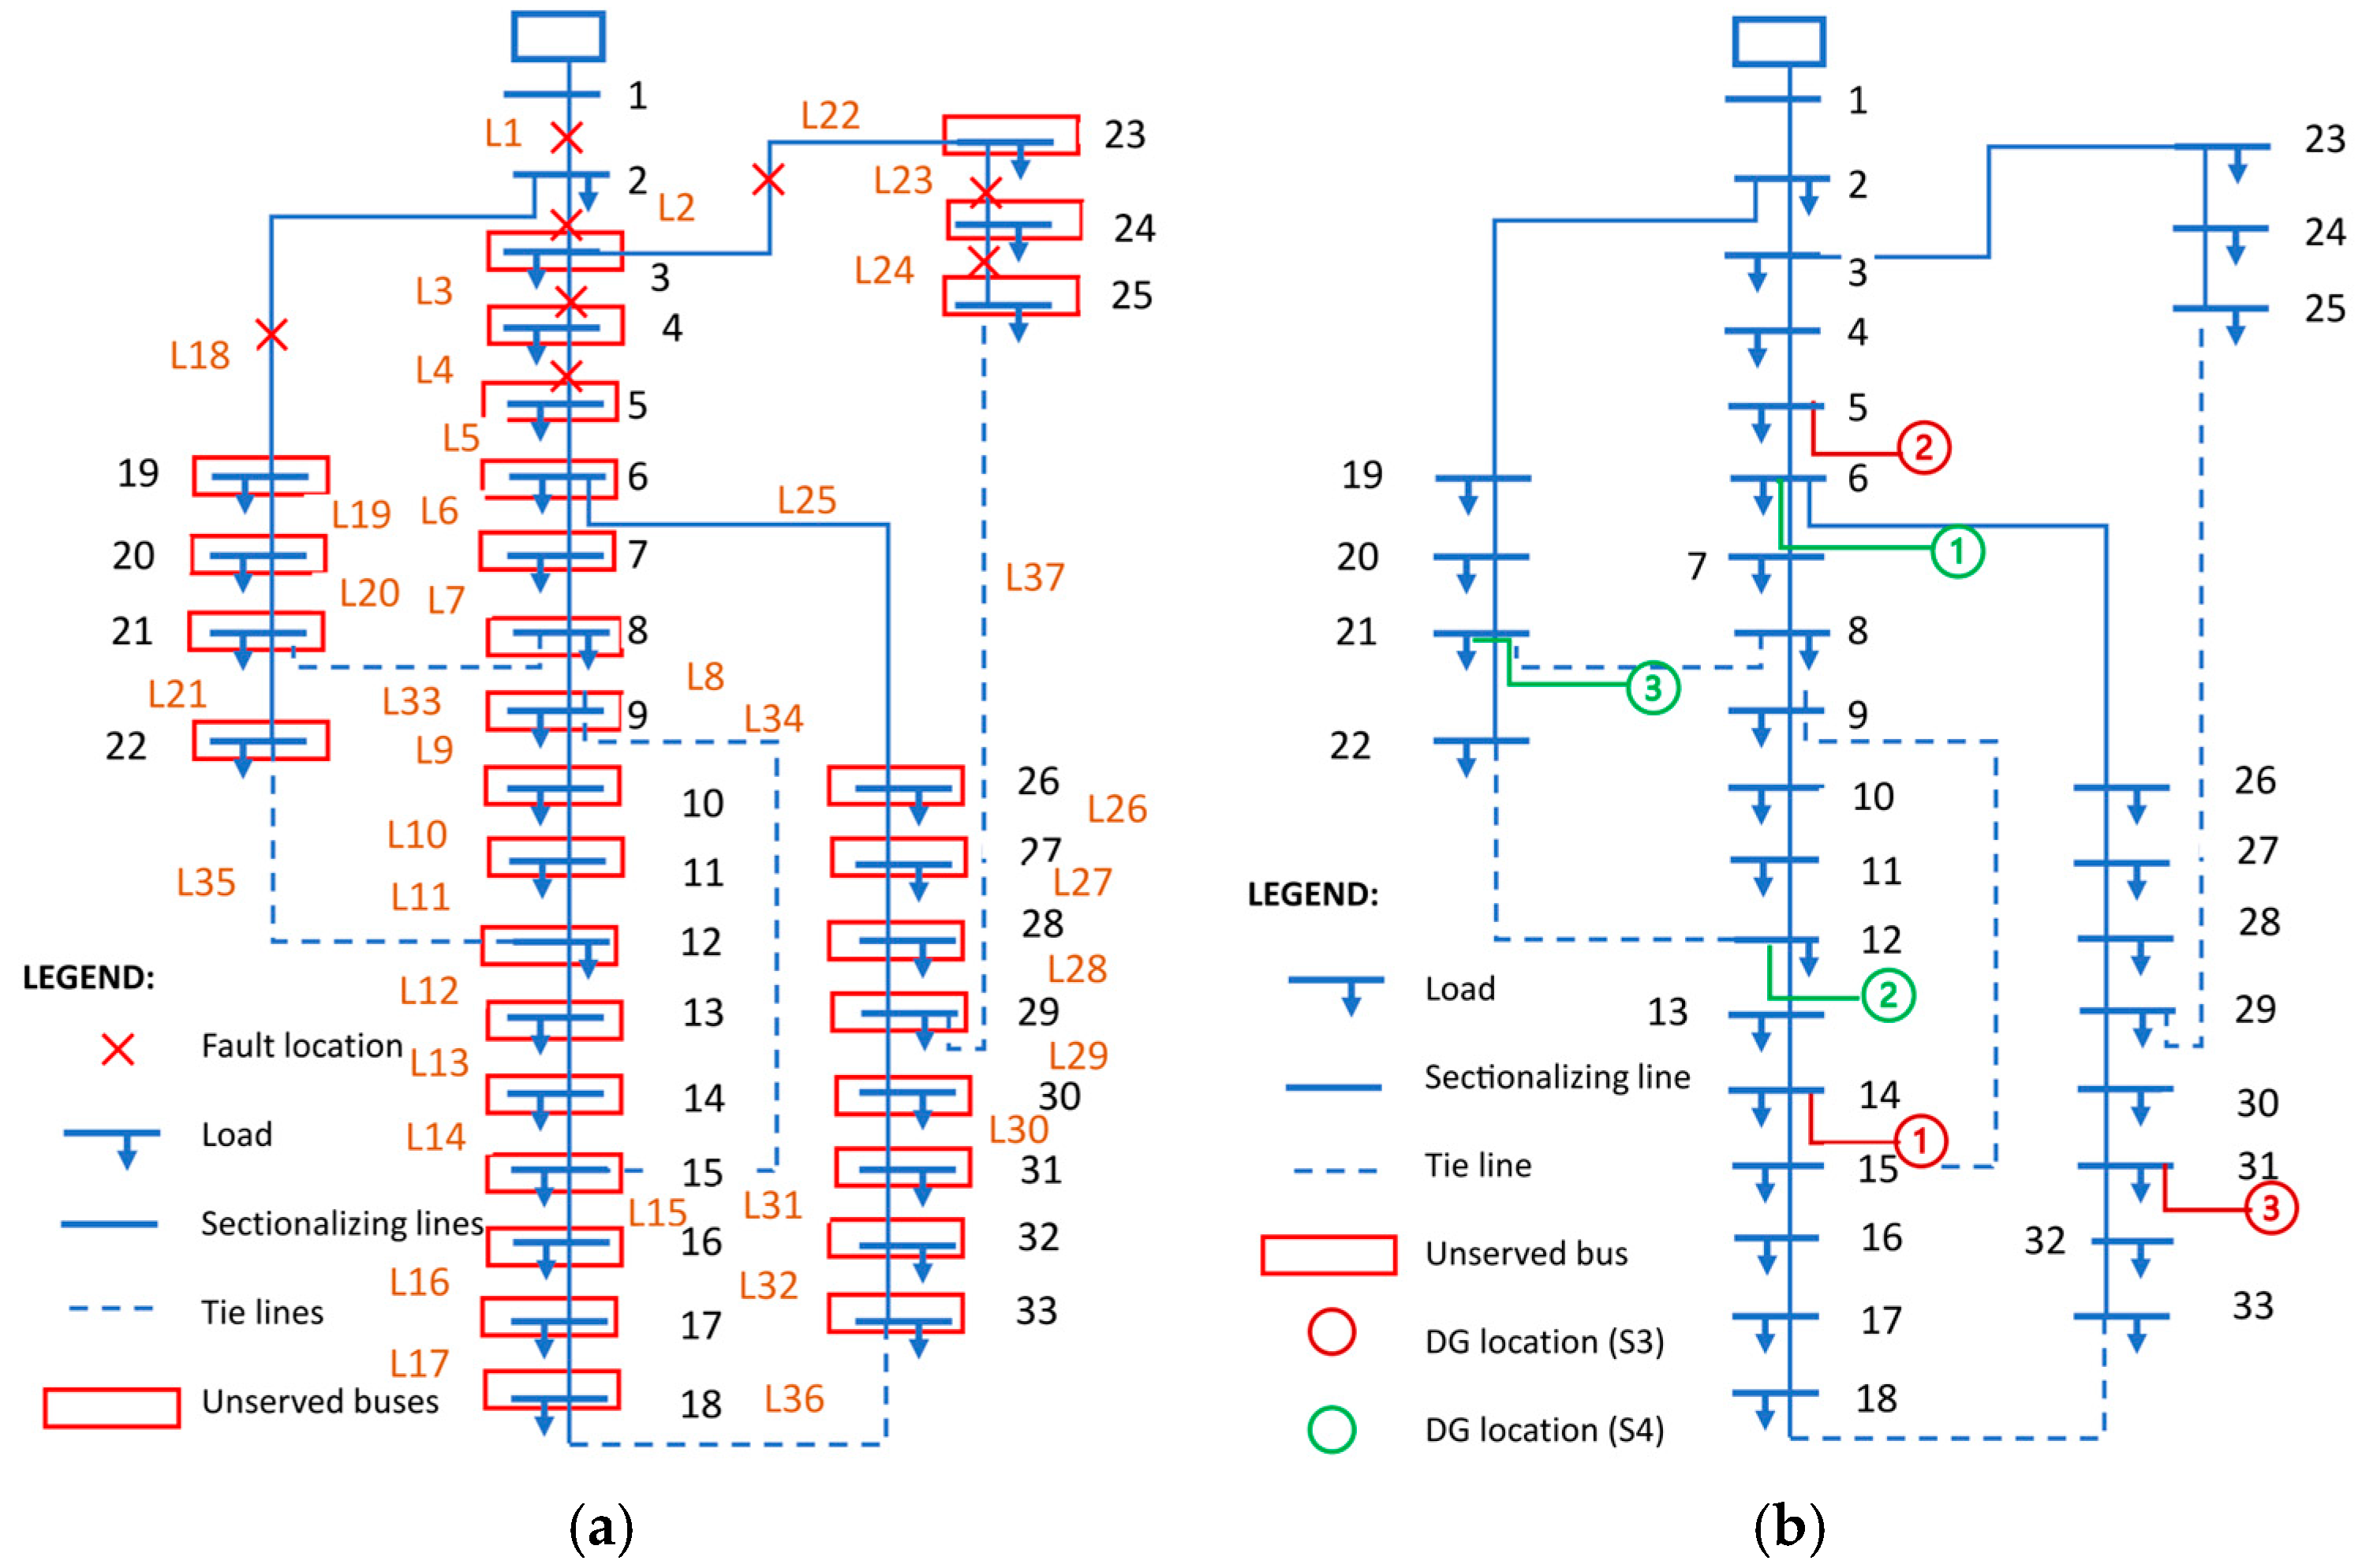
A PSO algorithm was used for reconfiguration, where tie lines were closed and sectionalizing lines were opened, changing the distribution network topology as shown in Figure 11. The system was also checked for radiality. The tie lines closed during the reconfiguration process included lines 33, 34, 35, 36, and 37, while the sectionalizing lines opened included lines 9, 16, and 23. In scenario 2, after the reconfiguration of the test system, the active and reactive power losses were 197.85 kW and 132.54 kVAR, respectively. This means that there was an active power loss reduction of approximately 2.38%. Figure 12a compares the voltage profiles of the base system (normal) and reconfigured system across all buses in the IEEE 33 bus network. For the base system, there was a smooth decline as the buses moved farther from the substation. It is seen that loads of buses 19, 20, 21, and 22 were unserved/isolated because of the fault; therefore, the voltage magnitude was missing in the voltage profile plot of the faulty system in Figure 10. It was found that reconfiguration was successful in restoring power to all four unserved buses (including the critical node 19), and the voltage profile also improved. The voltages at several buses have increased, but fluctuations indicate that further optimization (e.g., DG placement) may be needed. The lowest value of the bus voltage magnitude after reconfiguration was measured to be 0.9335 p.u. at bus 22, while for the base system, the minimum bus voltage was 0.9131 p.u. at bus 18. Figure 12b shows the line power losses for both the reconfigured and base test systems.

4.2.3. Only DG (Scenario S3)

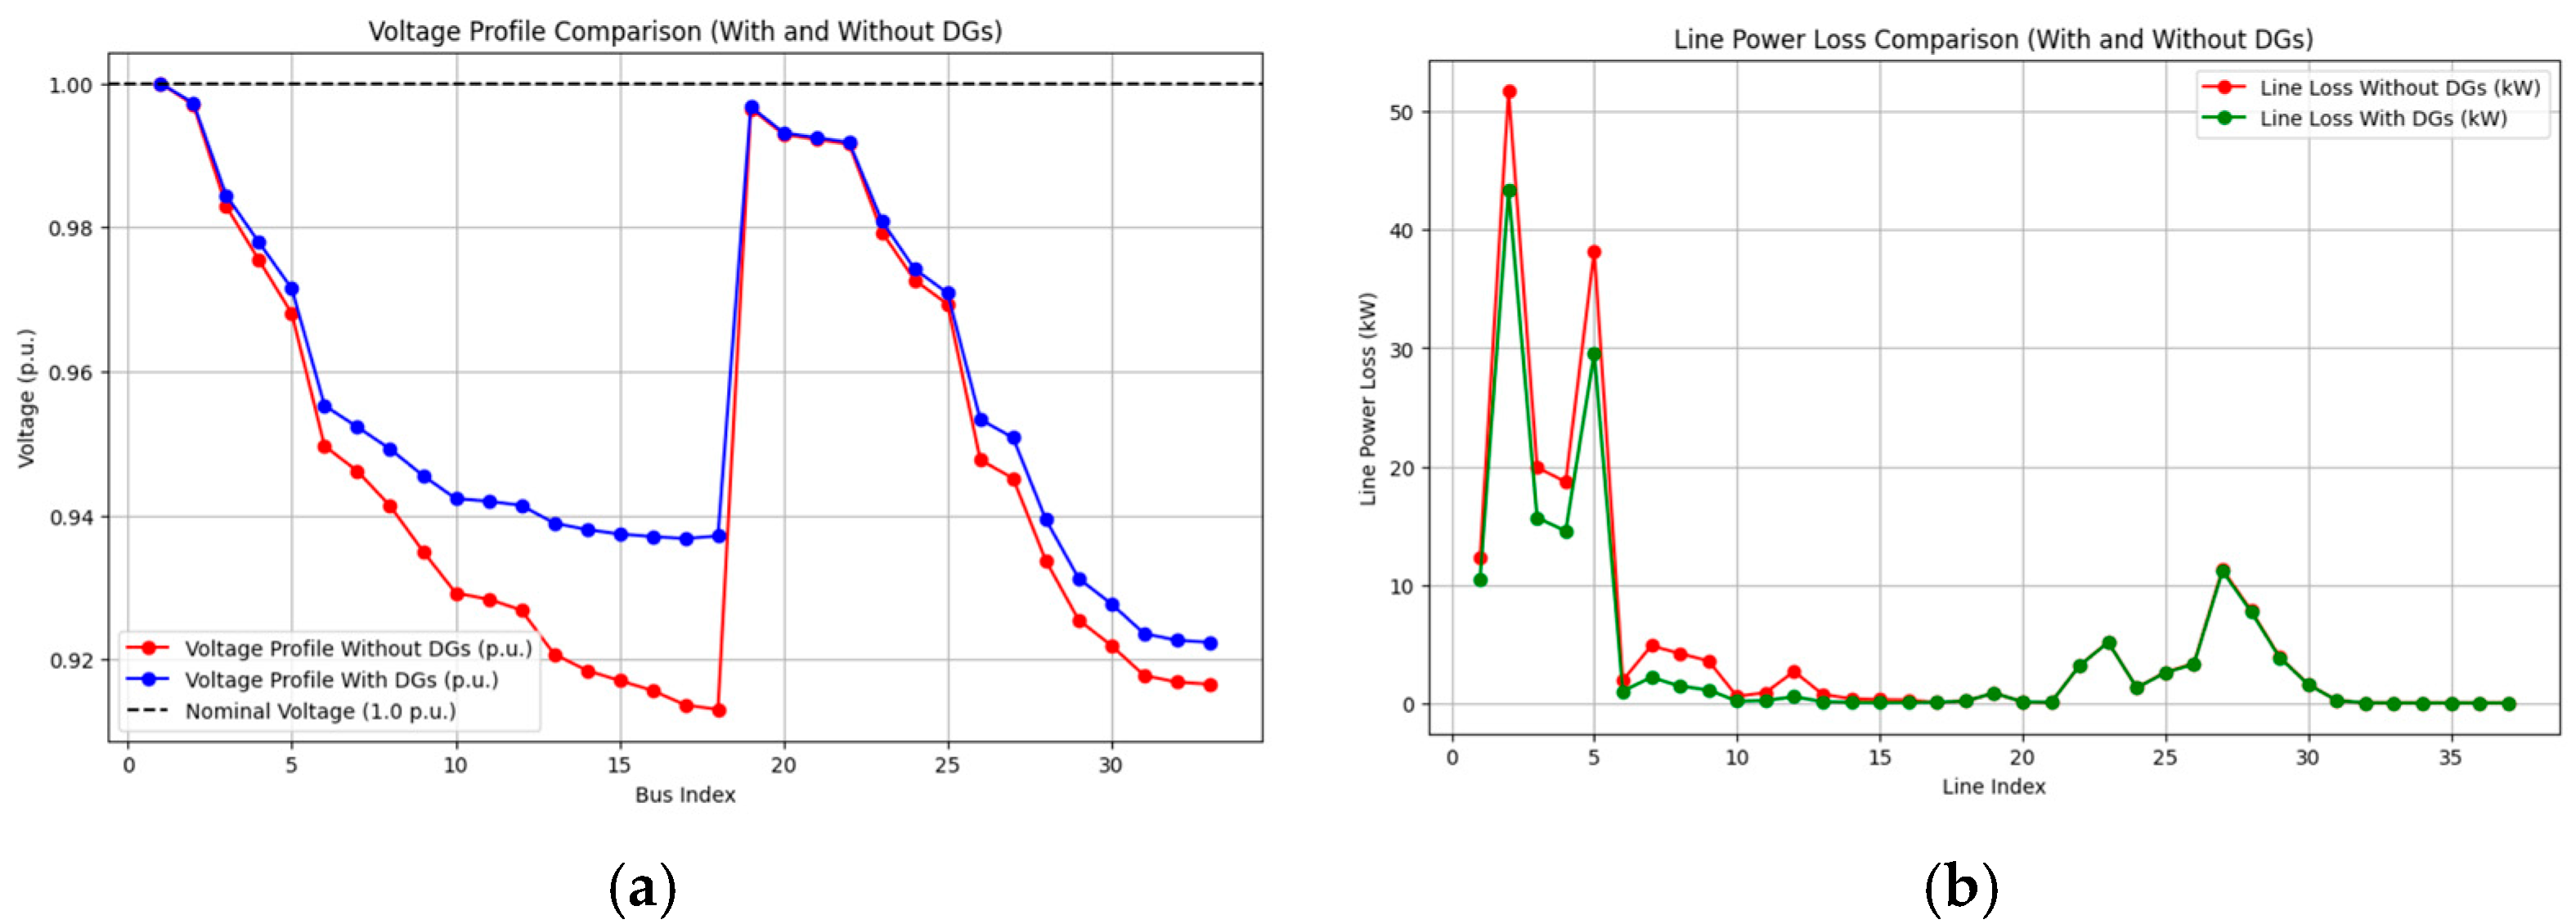
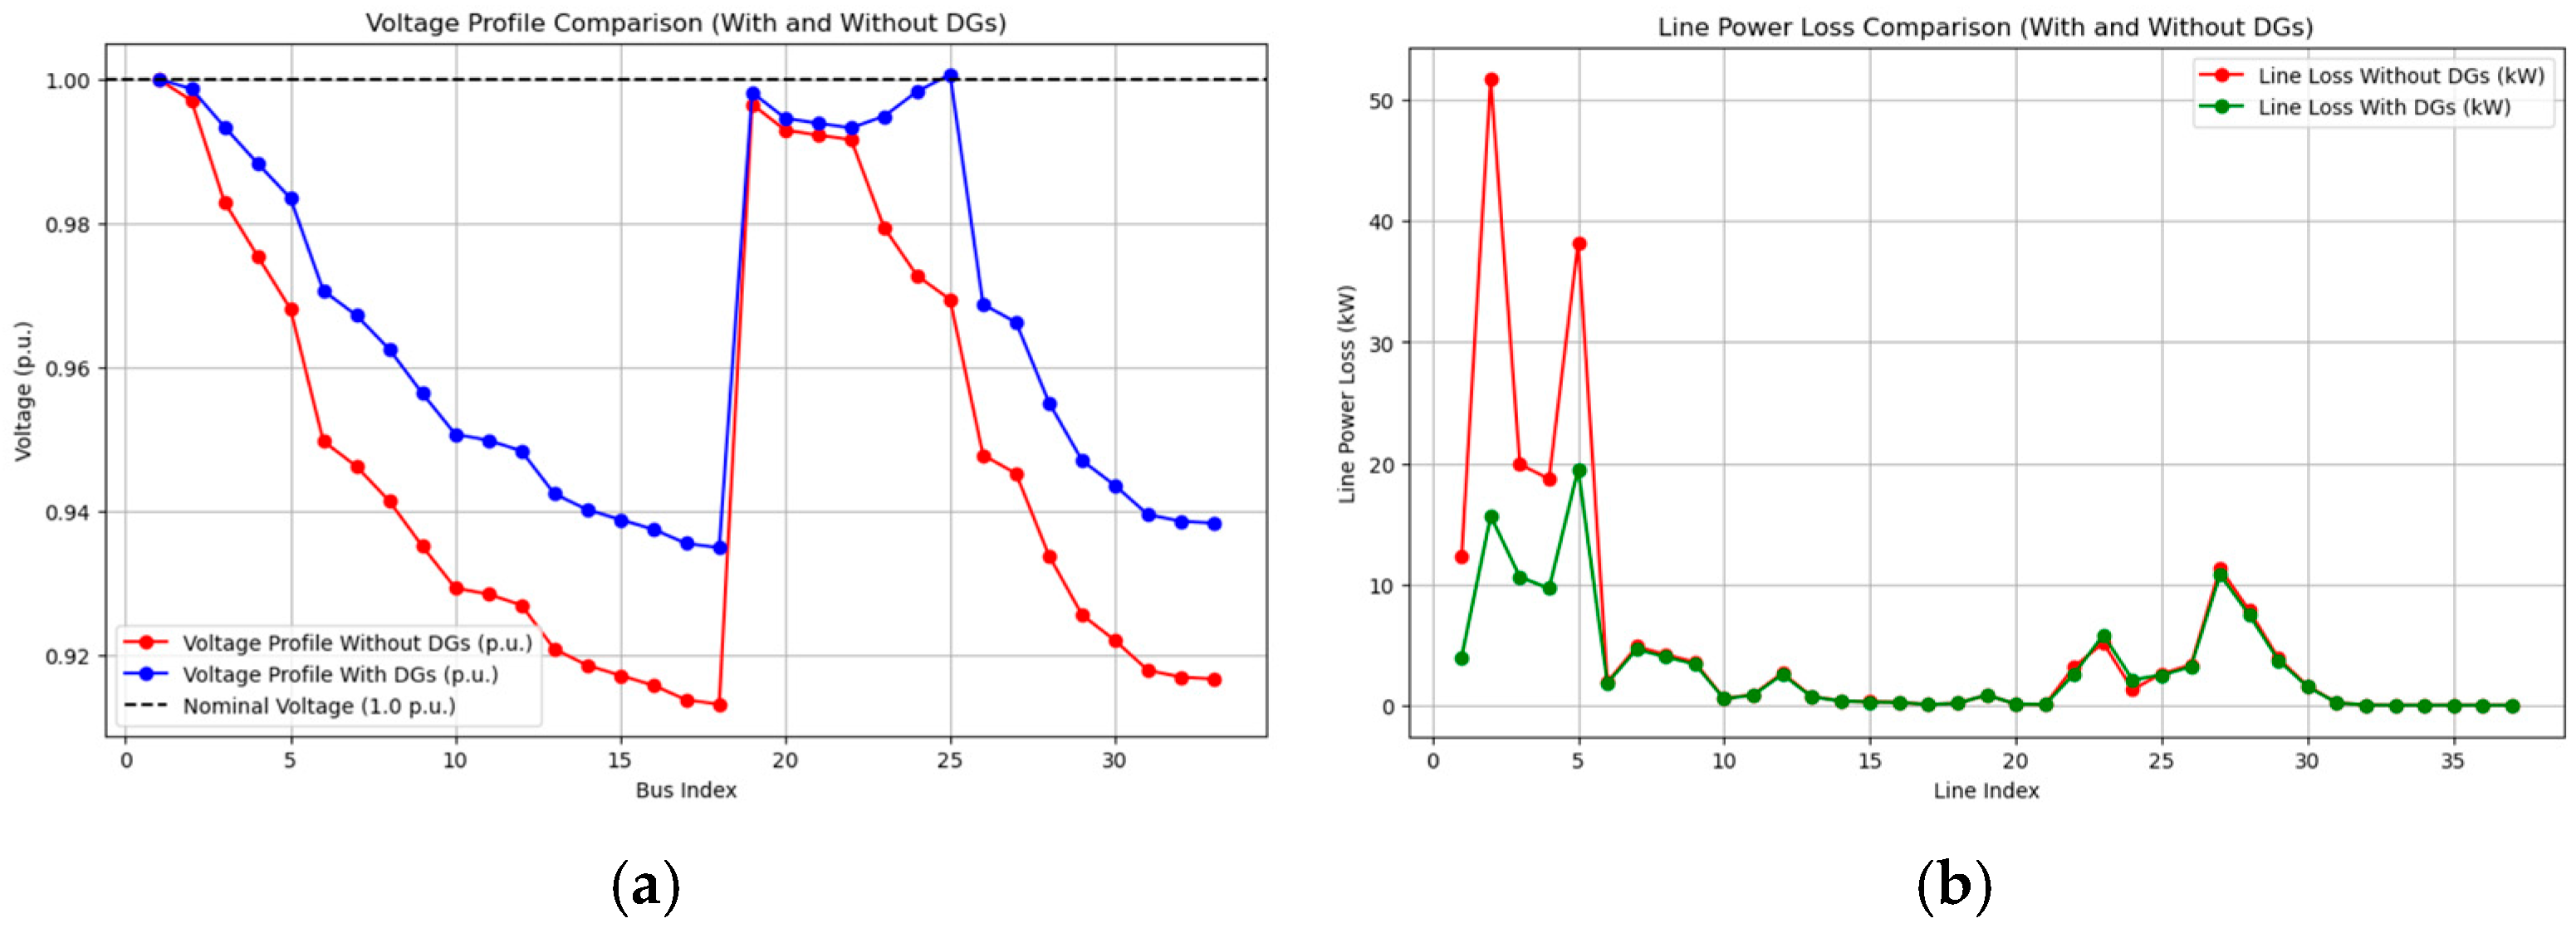
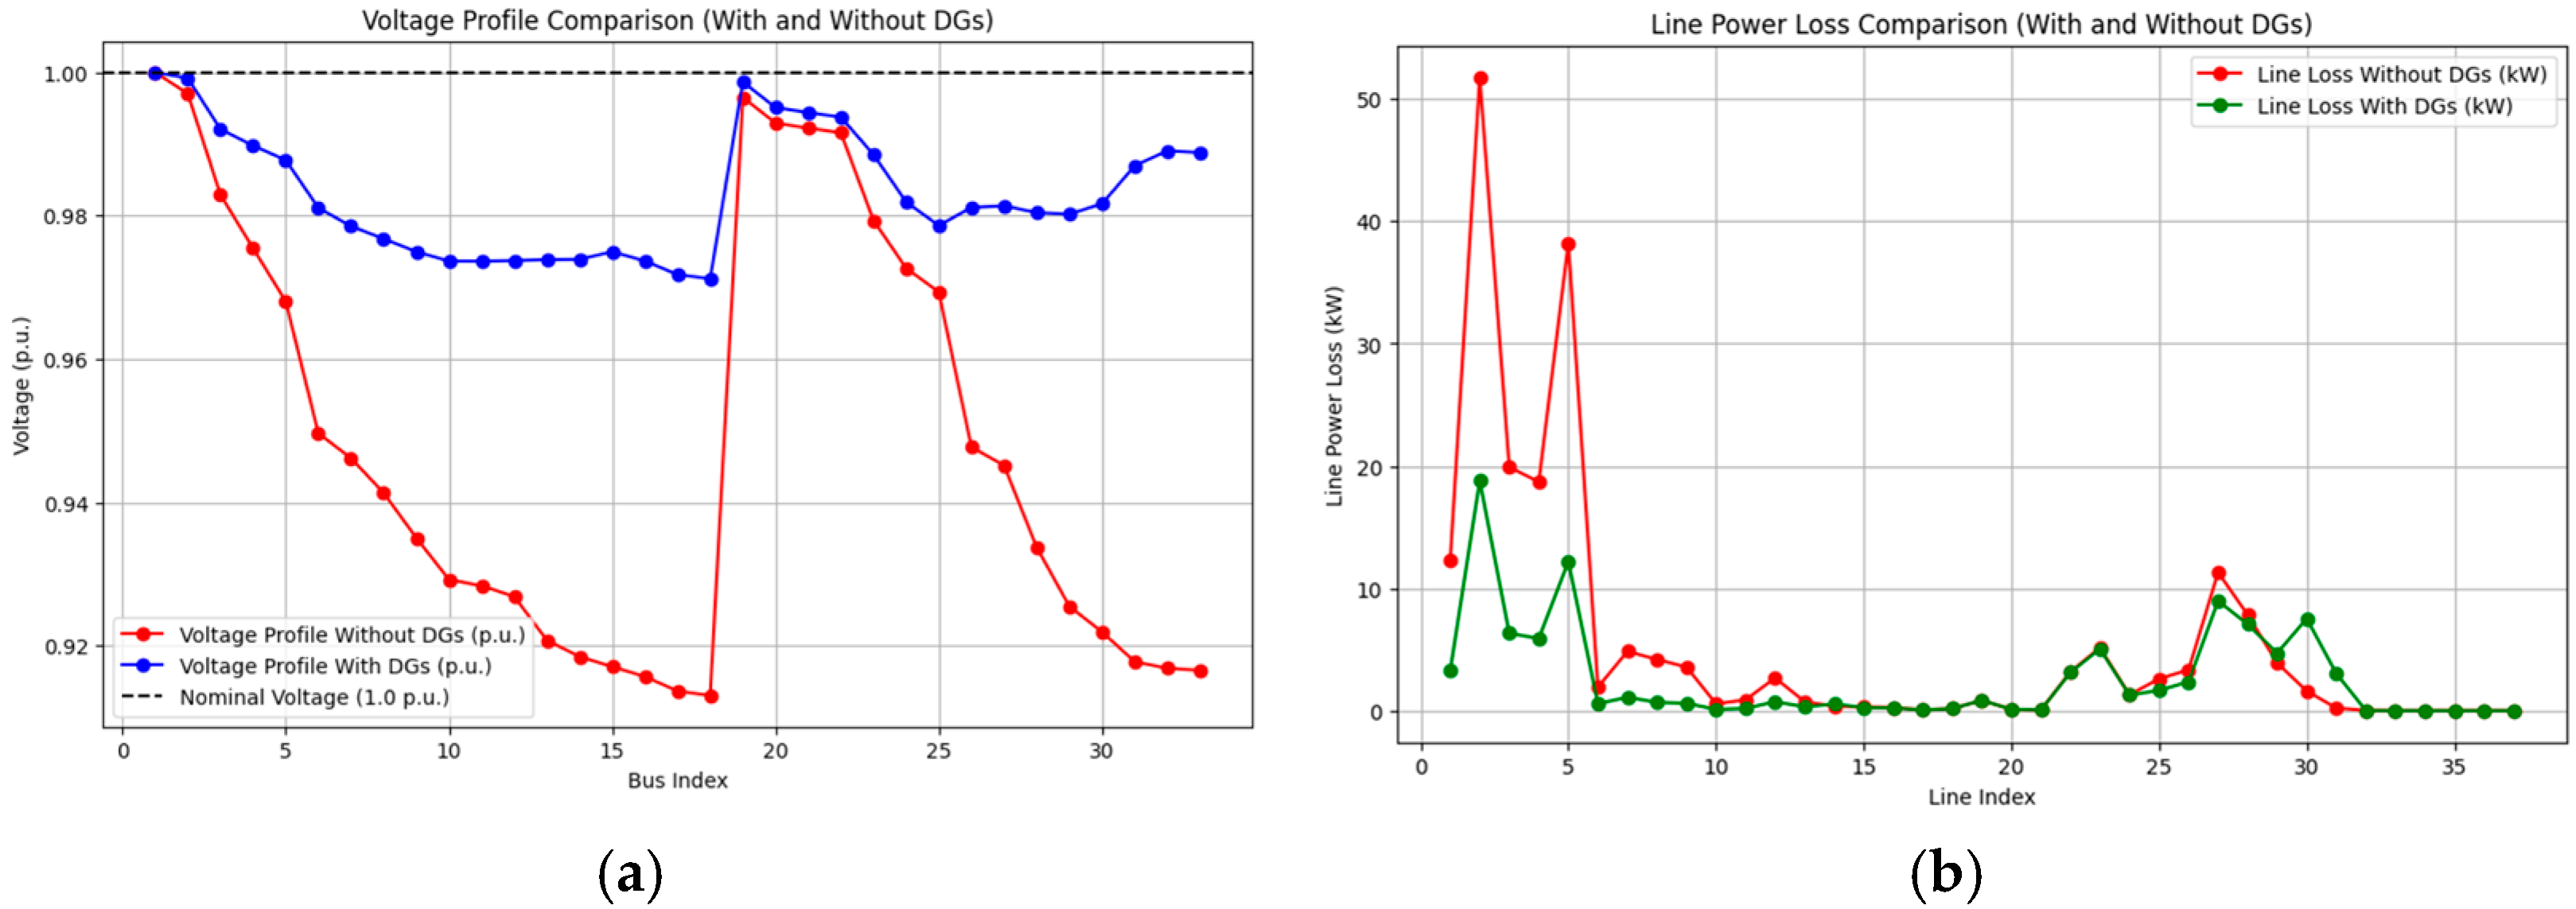
In scenario 3, the optimal DG placement was decided by PSO algorithm to provide power to unserved buses. The optimized locations for DG1 and DG2 were buses 13 and 17, with an optimized size of 162.685 KW and 197.314 KW, respectively. The system topology is shown in Figure 11c with DG placement shown in red. In scenario 3, the active and reactive power losses were reduced to 161.63 KW (20.25%) and −106.71 kVAr (21.04%), respectively. Active power was locally injected into a system by the integration of a DG. Consequently, the integration of DGs reduced the net power from a substation. The power loss dropped to 161.63 KW as a result of the DGs’ integration, and the minimum bus voltage was 0.9224 p.u. at bus 33. DG placement successfully restored power to previously unserved buses (including the critical node 19). Voltage profiles improved significantly and are shown in Figure 13a. The power loss profile is shown in Figure 13b.

4.2.4. Reconfiguration and DG (Scenario S4)

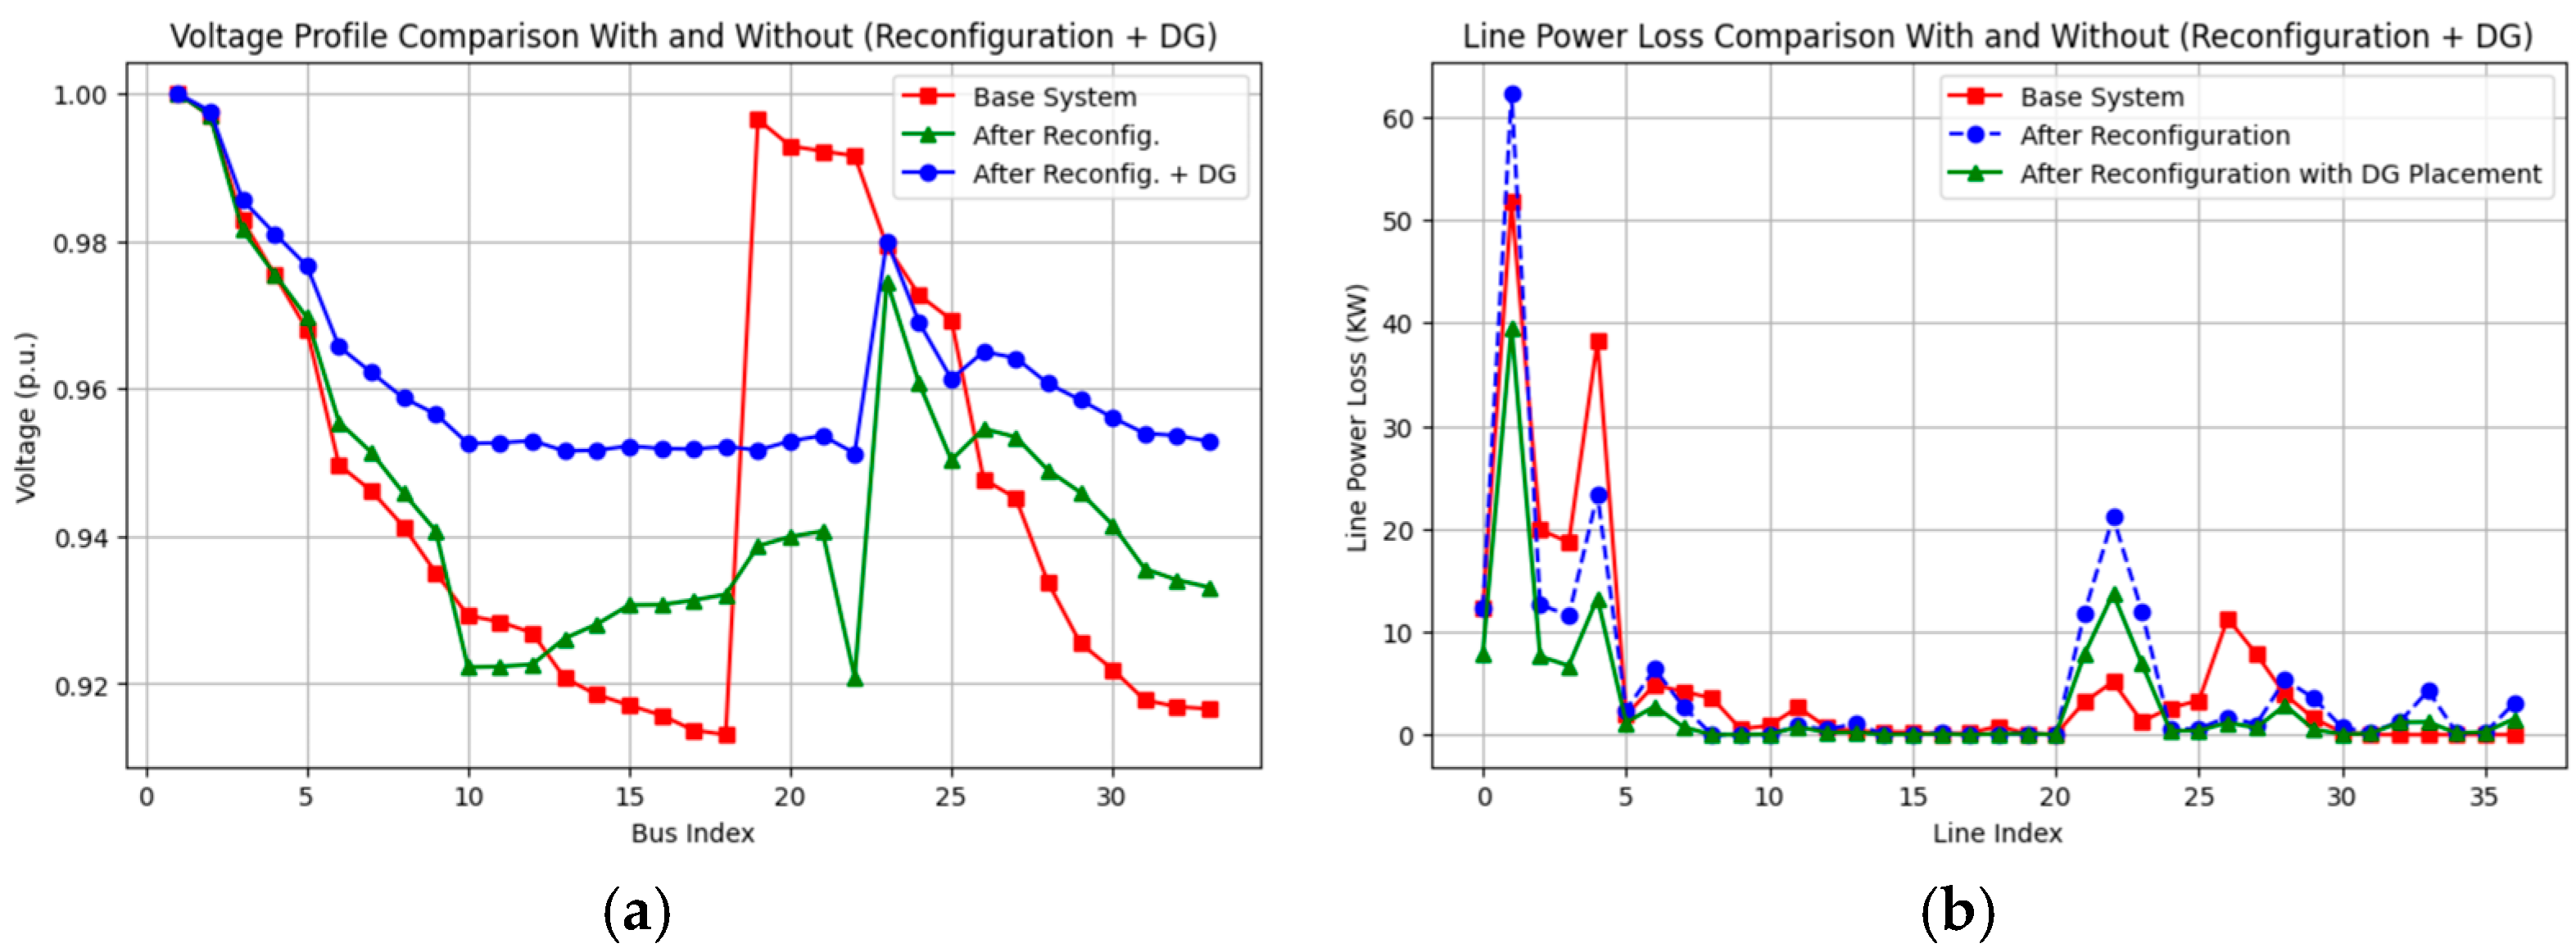
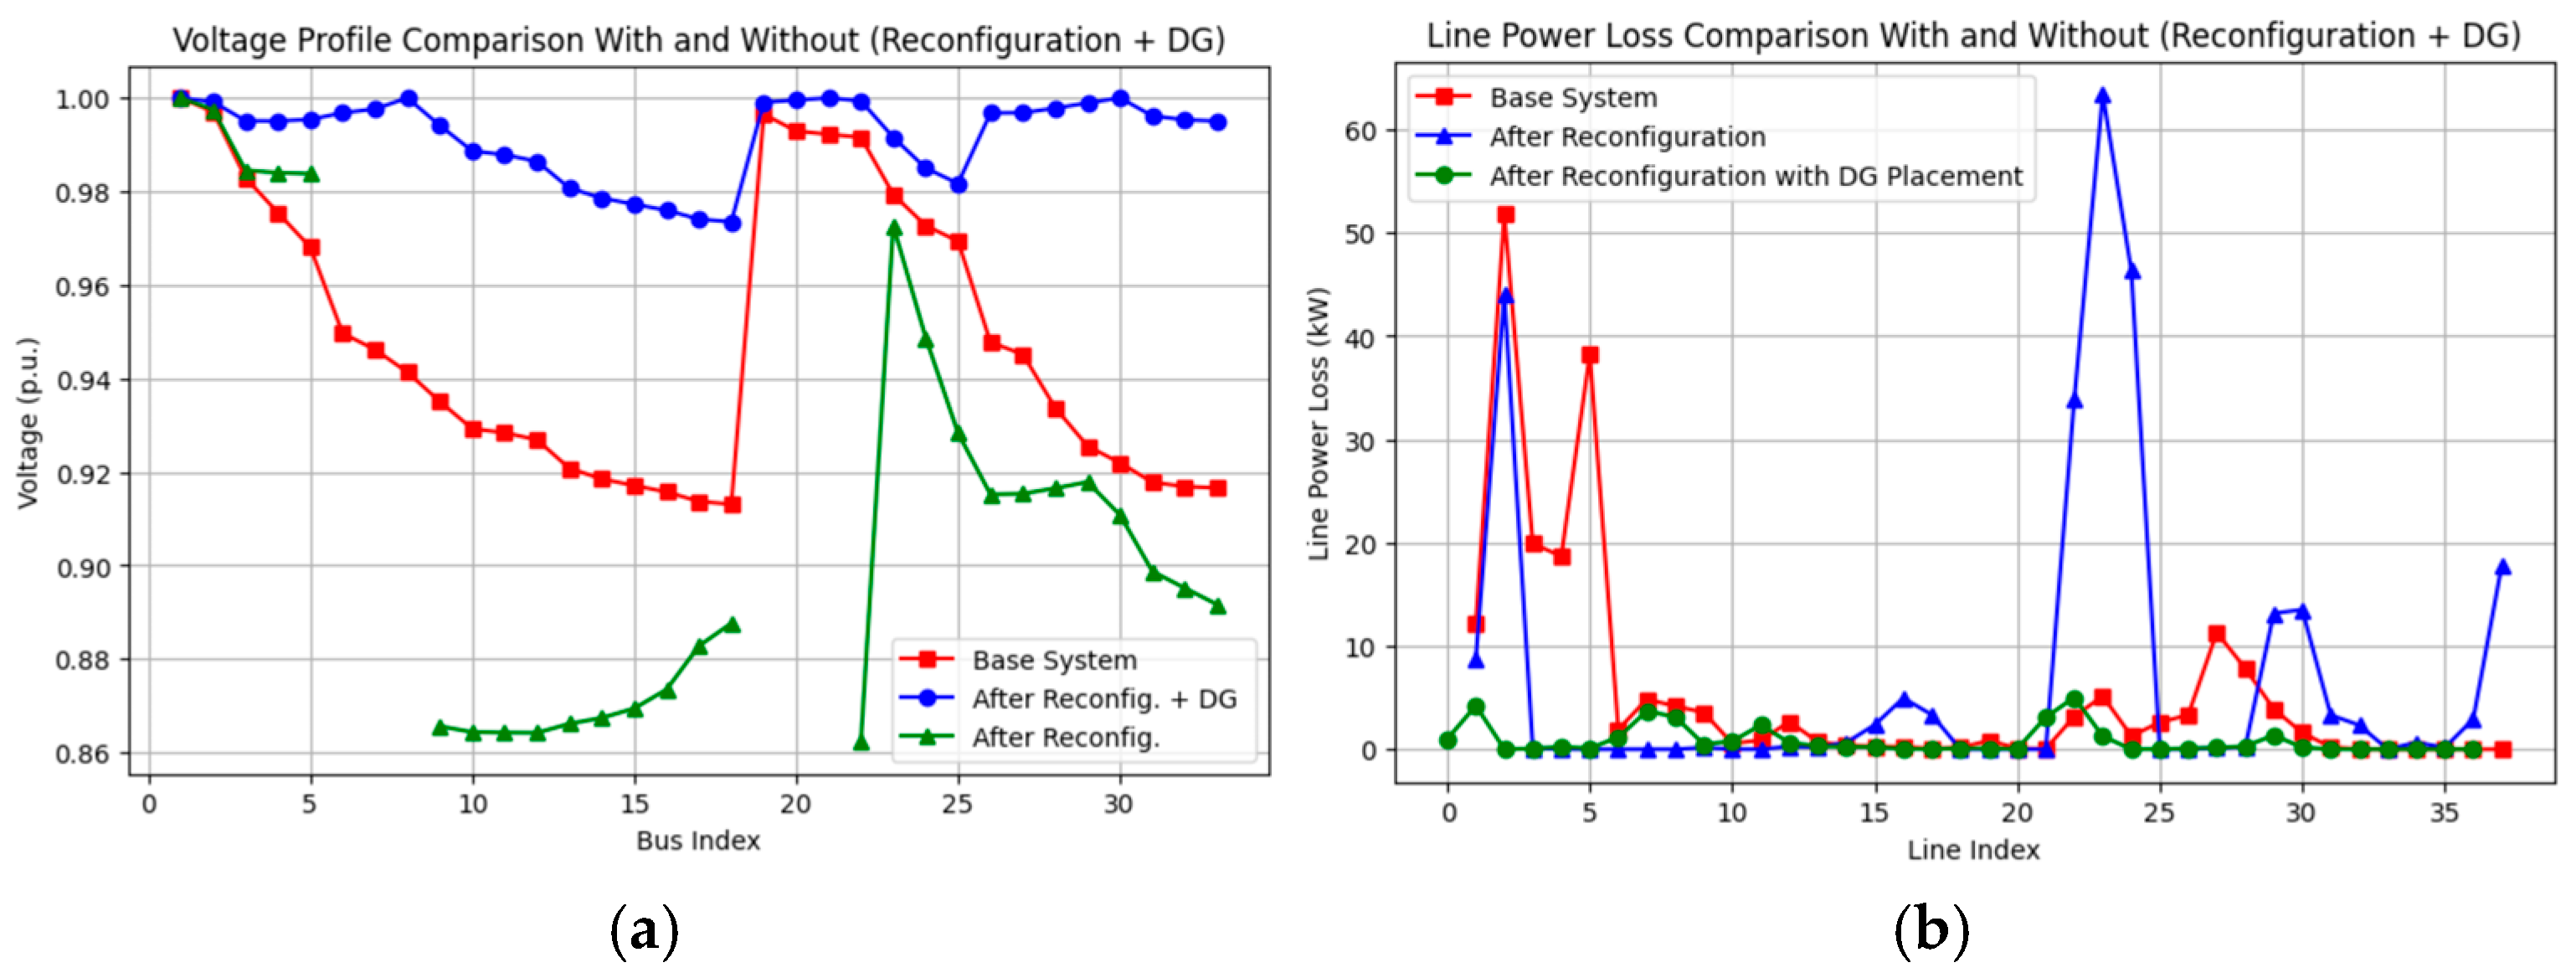
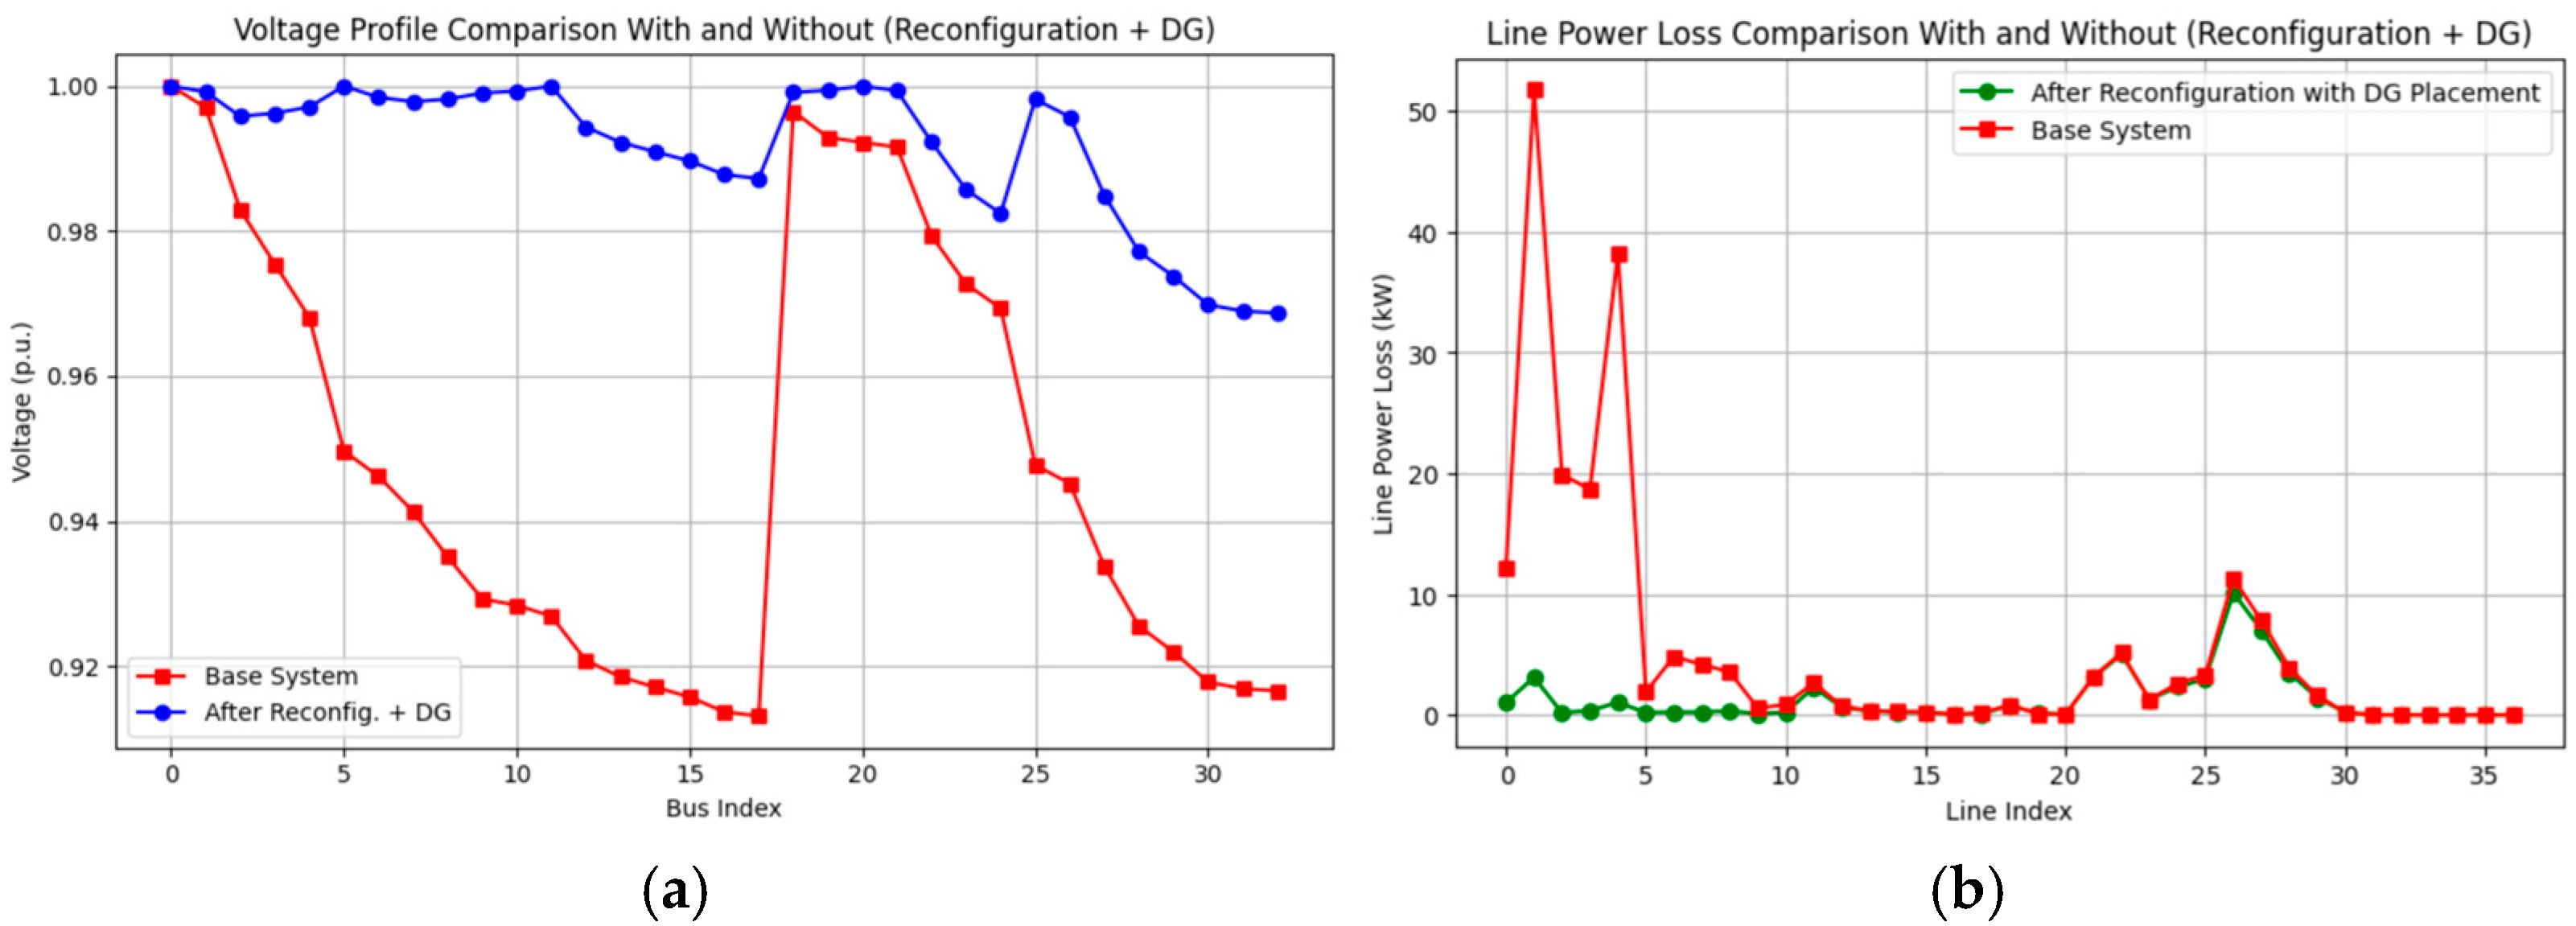
As discussed in Section 4.2.2, the reconfiguration successfully restored the power to all four (19, 20, 21, and 22) unserved buses (including the critical node 19). However, in scenario S4, to optimize the results further, PSO-based optimal DG placement was performed on the already reconfigured network. The optimized locations for DG1 and DG2 were buses 12 and 32, with an optimized size of 0.5 MW each. The system topology for scenario S4 is shown in Figure 11c with DG placement shown in green. In S4, the active and reactive power losses were 120.06 kW and 79.79 kVAr, respectively. The minimum bus voltage was 0.951 p.u. on bus 23. Voltage profiles for reconfiguration with DG placement are given in Figure 14a. It shows significant improvement over the reconfiguration alone scenario. The power loss profile for this case is shown in Figure 14b.

4.3. Case 2

4.3.1. Faulty System (Scenario S1)

For Case 2 (C2), the total power loss after running the power flow analysis was found to be 0.0152 MW. The faulty lines in C2 caused 25 out of 33 buses to lose power, which means a huge portion of the system was disconnected, as shown in Figure 8b. Since most of the load was not being served, there was very little current flowing in the system. As a result, line losses decreased drastically because the remaining active network carried almost no load. The small remaining loss (0.0152 MW) was likely due to a few buses still receiving power, as shown in the voltage profile in Figure 15, but it is nearly negligible. This was an extreme case where almost the entire system was lost, leading to minimal power loss because hardly any power was flowing.

4.3.2. Only Reconfiguration (Scenario S2)

In scenario 2, after reconfiguring the test system, the active and reactive power losses were 262.80 kW and 198.05 kVAR, respectively. This means that there was an active power loss reduction of approximately −29.66%. The tie lines closed in S2 include lines 33, 34, 35, 36, and 37, while the sectionalizing lines opened included lines 11, 12, 14, 24, and 27. The system topology is shown in Figure 16b. Figure 17a compares the voltage profiles of the base case (normal) and reconfigured system across all buses in the IEEE 33 bus network for C2. Figure 17b shows the line power losses for both the reconfigured and base test systems. It was seen that loads of buses 6, 7, 8, 9, 10, 11, 12, 13, 14, 15, 16, 17, 18, 19, 20, 21, 22, 26, 27, 28, 29, 30, 31, 32, and 33 were unserved/isolated because of the fault; therefore, the voltage magnitude was missing in Figure 17. However, with the help of network reconfiguration, some of the loads of these unserved buses were restored, as is evident from the voltage profile in Figure 17a. The lowest voltage magnitude after reconfiguration was measured to be NaN at bus 6. The remaining unserved buses, which could not be restored by reconfiguration, include buses 6, 7, 8, 19, 20, and 21, totaling 0.73 MW of unrestored power. However, in S3, the critical node 19 was not recovered. Since reconfiguration was not able to restore the power of unserved buses completely, the next step was the restoration of power using optimal DG placement.

4.3.3. Only DG (Scenario S3)

In scenario 3, the optimal DG placement was decided by PSO algorithm to provide power to unserved buses. The optimized locations for DG1, DG2, and DG3 were buses 24, 5, and 23 with an optimized size of 1000 KW, 969.876 KW, and 775.123 KW, respectively. The system topology is shown in Figure 16c with DG placement shown in red. In scenario 3, the active and reactive power losses were reduced to 119.689 KW and 36,815.476 kVAr, respectively. The minimum bus voltage was 0.93485 p.u. at bus 18. DG placement successfully restored power to previously unserved buses (including the critical node 19, which was not restored in S2). Voltage profiles improved significantly and are shown in Figure 18a. The power loss profile for this case is shown in Figure 18b.

4.3.4. Reconfiguration and DG (Scenario S4)

As discussed in Section 4.3.2, there were still some unserved buses that could not be restored after the reconfiguration (including the critical node 19). Therefore, in scenario S4, power restoration for the remaining unserved buses (6, 7, 8, 19, 20, and 21) was achieved using PSO-based optimal DG placement. For S4, the optimized locations for DG1, DG2, and DG3 were buses 8, 21, and 30 with an optimized size of 1.341 MW, 0.365 MW, and 0.858 MW, respectively. The network topology is shown in Figure 16c with DG placement shown in green. In S4, the active and reactive power losses were 43.9 KW and 35.0 kVAr, respectively. The minimum bus voltage was 0.9518 p.u. on bus 18. Reconfiguration, along with DG placement, successfully restored power to previously unserved buses. Voltage profiles improved significantly and are shown in Figure 19a. The power loss profile for this case is shown in Figure 19b.

4.4. Case 3

4.4.1. Faulty System (Scenario S1)

For Case 3 (C3), the total power loss after running the power flow analysis was found to be 0.00 MW. The faulty lines in C3 rendered the entire system practically disconnected, as shown in Figure 8c and Figure 20, leaving only bus 1 (the substation) as active. No current was flowing because no loads were being served at all. Since power loss was proportional to current ( I 2 R ) and I = 0 , the power loss was also 0 MW. This was the worst-case scenario, where the system was completely blacked out with no load being served, leading to zero power loss (but also zero functionality).

4.4.2. Only Reconfiguration (Scenario S2)

Since the system was completely blacked out, reconfiguration alone was not able to restore power in this case, as shown in Figure 21a. The power loss came out to be 0 MW because no loads were being served. Also, both the critical nodes 19 and 5 were affected and not restored. In such situations, DGs play a critical role in restoring supply to unserved buses.

4.4.3. Only DG (Scenario S3)

For C3, the optimized locations for DG1, DG2, and DG3 were buses 14, 5, and 31 with an optimized size of 629.376 KW, 1485.624 KW, and 1500 KW, respectively. In scenario 3, the active and reactive power losses were 97.5897 KW and 36,719.720 kVAr, respectively. The system topology is shown in Figure 21b with DG placement shown in red. The minimum bus voltage was 0.9712 p.u. at bus 18. DG placement successfully restored power to previously unserved buses. Voltage profiles improved significantly and are shown in Figure 22a, while Figure 22b shows the line power losses for Case 3 before and after DG placement.

4.4.4. Reconfiguration and DG (Scenario S4)

In Case 3, reconfiguration alone was not sufficient to restore power to any unserved buses. However, even under such blackout conditions, the configuration derived from the PSO-based reconfiguration remains relevant, as it provides the structural backbone for subsequent DG placement. The optimized tie-line closures included lines 33, 34, 35, 36, and 37, and the sectionalizing lines opened were 19, 11, 21, 32, and 30, forming a radial base for DG-based recovery. For S4, the optimized locations for DG1, DG2, and DG3 were buses 6, 12, and 21 with an optimized size of 1.5 MW, 0.822 MW, and 0.1 MW, respectively. The system topology is shown in Figure 21b with DG placement shown in green. In S4, the active and reactive power losses were 48.8 KW and 37.2 kVAr, respectively. The minimum bus voltage was 0.9687 p.u. (at bus 33). Scenario S4 successfully restored power to previously unserved buses, including the critical nodes (19 and 5). Voltage profiles improved significantly and are shown in Figure 23a. The power loss profile for this case is shown in Figure 23b.
Figure 24 shows the percentage load restored for every case and scenario. Table 2 summarizes the results of the service restoration model. Objective 1 tells us about the amount of load of unserved buses restored, while Objective 2 tells us about the total power loss in the system for different scenarios.

4.5. Resilience Metric Results

Three resilience indicators, discussed in Section 2.3, were used to measure the resilience of the restoration model outcomes. The findings of the overhead line failure model and the service restoration model were used to calculate resilience measures. The outcomes of the resilience metric computations for various scenarios are displayed in Table 3. The system degradation period, which in this case was the length of the catastrophic occurrence, was represented by the term tdte. The time it takes the system operator to evaluate damage, calculate a solution, and begin implementation was represented by tStd. It is the amount of time needed for the restoration model to produce a solution in this investigation, which in these scenarios came out to be in seconds. The time required to apply the solution and restore the system was represented by tfts. This time in this study depends on how many switching operations were performed for each case. According to the assumptions by Bajwa et al. [44], it was expected that operating a single manual switch would take an hour in the interim. The time tStd, is mentioned in hours in Table 3 to keep the time scale the same with that of tdte and tfts. Additionally, the other parameters required for the computation of the resilience metrics include degraded and restored system percentages.
Degradation times (tdte) for cases 1, 2, and 3 were assumed to correspond to the time step. Since each step in this study was assumed to be a 1 h duration, the (tdte) duration for cases 1, 2, and 3 was 1, 2, and 1 h, respectively. The values of tfts, referring to the time taken for implementing the obtained solution, were based on the number of switching sequences. For example, in scenario 2, cases 1 and 2, five tie lines were closed and three and five sectionalizing lines were opened, respectively. This means that a total of 8 and 10 switching operations for Case 1 and Case 2, respectively, need to be implemented to restore the system. Therefore, the value of tfts for scenario 2 and cases 1 and 2 was 8 and 10, respectively. The values of R1, R2, and R3 were calculated for all three cases, substituting the parameters, i.e., degraded system state, restored system state, tdte, tStd, and tfts, into their respective equations discussed previously in Section 2.3.
The metrics R 1 , R 2 , and R 3 were calculated using the parameters in Table 3. A range of values for R 1 and R 3 were obtained. Whenever the system was not able to restore power at all, an infinite value for R 1 and a 0 value for R 2 were obtained. When the network’s R 2 value was 1, the system was completely resilient, and it was otherwise when the value of R 2 was 0 [44]. The value of R 3 decreased from 415.182 to 150 for Case 1 and Case 3, respectively, for scenario 2, indicating a maximum restoration in Case 1 to partial restoration in Case 2 and minimum/no restoration in Case 3. On the other hand, the value of R 3 increased from 153.942 to 200 for Case 1 to Case 3, respectively, for scenario 3, indicating a minimum requirement of DG placement for load restoration for Case 1, to partial in Case 2, and maximum requirement of DG placement in Case 3 for full/maximum restoration. For scenario 4, the value of R 3 decreased from 415.182 to 300 for cases 1 to 3, respectively. In the blackout scenario (Case 3), R3 is minimized in scenarios 1 and 2 due to zero recovery but increased in scenarios 3 and 4 as distributed generation restores energy supply, improving system-wide resilience.

5. Conclusions

In conclusion, this comprehensive study has provided valuable insights into the operational measures of pre- and post-hurricane disasters for the PDS. Unlike conventional approaches, this work uses a DBN-based prediction model, enabling the failure probability of overhead lines one time step ahead. Furthermore, the integration of reconfiguration and an optimal DG placement-based service restoration model strengthen the practical relevance of this methodology.
The key findings of this research are as follows:
  • A dynamic Bayesian network (DBN) was used to model the evolution of overhead line failures across a predictive time horizon. The model was run for two time steps (time step was assumed to be of 1 h duration) to obtain failure probability for time instants t = 0 and t = 1, and accordingly, three different cases were considered. Case 1 depicts a minor case scenario and corresponds to region 2 affected by a category 3 hurricane (49.38–57.72 m/s) at time instant t = 0. Case 2 depicts a major case scenario and corresponds to region 2 affected by category 3 hurricanes at the time instant, i.e., t = 1. Case 3 depicts a blackout and corresponds to region 1 affected by a category 4 hurricane (57.72–69.65 m/s) at time instant t = 0. Regions 3 and 4 did not experience any outages due to category 2 and 1 hurricanes, respectively; therefore, no case was considered for regions 3 and 4. Any line found to have a failure probability greater than 0.5 using the DBN model was assumed to suffer an outage.
  • Depending on the DBN’s outage predictions results, three independent restoration strategies, reconfiguration, optimal DG placement, and reconfiguration with optimal DG placement using PSO, were formulated for the IEEE 33 bus system. The objective was to ensure maximal load recovery with minimal power losses. The integration of DG only, reconfiguration only, and reconfiguration along with DG placement restored the load from 90.3% to 100% for Case 1 (t = 0). For Case 2 (t = 1), reconfiguration only restored the load from 34.994% to 80.35%, while DG only and reconfiguration with DG placement restored the load from 34.994% to 100%. For Case 3 (t = 0), reconfiguration was insufficient in restoring the load, while DG placement restored the load from 0% to 100% in scenarios 3 and 4. The case studies demonstrated that integrating DGs achieved superior restoration outcomes compared to reconfiguration alone.
  • The findings of the overhead line failure model and the service restoration model were used to calculate resilience metrics. While R 2 and R 3 were derived from the resilience trapezoid framework, evaluating recovery efficiency and phased performance, R 1 provided a complementary perspective by quantifying cumulative losses across all nodes. Together, these metrics holistically assess resilience in terms of severity ( R 1 ), restoration success ( R 2 ), and phased adaptability ( R 3 ).
This paper highlights the value of decentralized resources like DGs in HILP scenarios where traditional reconfiguration was insufficient due to grid fragmentation. Thus, the DBN-based overhead line failure analysis, combined with reconfiguration and optimal DG placement-based service restoration, improved load recovery and reduced power losses by one time step ahead. Future work may include the incorporation of real-time data (like IoT sensors) and other factors (like the effect of falling trees on overhead lines). Also, including the objectives such as restoration time, cost of restoration, and the time during which the distributed generators can keep servicing the restored loads may result in a more pragmatic solution.

Author Contributions

Conceptualization, K.F. and H.S.; methodology, K.F. and H.S.; software, K.F.; validation, K.F.; formal analysis, K.F.; investigation, K.F.; writing—original draft preparation, K.F.; writing—review and editing, H.S. and F.B.C.; visualization, K.F. and H.S.; supervision, H.S. All authors have read and agreed to the published version of the manuscript.

Funding

This research received no external funding.

Institutional Review Board Statement

Not applicable.

Informed Consent Statement

Not applicable.

Data Availability Statement

The original contributions presented in this study are included in the article. Further inquiries can be directed to the corresponding authors.

Acknowledgments

The authors gratefully acknowledge the support of the Department of Electrical and Communication Engineering, United Arab Emirates University, Al-Ain, UAE. During the preparation of this manuscript, the author(s) used ChatGPT 5 to edit the English language professionally. After using this tool, the authors have reviewed and edited the output and take full responsibility for the content of this publication.

Conflicts of Interest

The authors declare no conflicts of interest.

References

  1. Fatima, K.; Shareef, H.; Costa, F.B.; Bajwa, A.A.; Wong, L.A. Machine Learning for Power Outage Prediction during Hurricanes: An Extensive Review. Eng. Appl. Artif. Intell. 2024, 133, 108056. [Google Scholar] [CrossRef]
  2. Stürmer, J.; Plietzsch, A.; Vogt, T.; Hellmann, F.; Kurths, J.; Otto, C.; Frieler, K.; Anvari, M. Protecting the Texas Power Grid from Tropical Cyclones: Increasing Resilience by Protecting Critical Lines. arXiv 2023, arXiv:2301.13793. [Google Scholar] [CrossRef]
  3. Daeli, A.; Mohagheghi, S. Power Grid Infrastructural Resilience against Extreme Events. Energies 2023, 16, 64. [Google Scholar] [CrossRef]
  4. Fatima, K.; Sefid, M.; Anees, M.A.; Rihan, M. An Investigation of the Impact of Synchrophasors Measurement on Multi-Area State Estimation in Active Distribution Grids. Aust. J. Electr. Electron. Eng. 2020, 17, 122–131. [Google Scholar] [CrossRef]
  5. Liu, X.; Xie, Q.; Liang, H.; Zhang, X. Post-Earthquake Recover Strategy for Substations Based on Seismic Resilience Evaluation. Eng. Struct. 2023, 279, 115583. [Google Scholar] [CrossRef]
  6. Salman, A.M.; Li, Y.; Stewart, M.G. Evaluating System Reliability and Targeted Hardening Strategies of Power Distribution Systems Subjected to Hurricanes. Reliab. Eng. Syst. Saf. 2015, 144, 319–333. [Google Scholar] [CrossRef]
  7. Zhai, C.; Chen, T.Y.; White, A.G.; Guikema, S.D. Power Outage Prediction for Natural Hazards Using Synthetic Power Distribution Systems. Reliab. Eng. Syst. Saf. 2021, 208, 107348. [Google Scholar] [CrossRef]
  8. Martinez-Amaya, J.; Radin, C.; Nieves, V. Advanced Machine Learning Methods for Major Hurricane Forecasting. Remote Sens. 2023, 15, 119. [Google Scholar] [CrossRef]
  9. Klauberg, C.; Vogel, J.; Dalagnol, R.; Ferreira, M.P.; Hamamura, C.; Broadbent, E.; Silva, C.A. Post-Hurricane Damage Severity Classification at the Individual Tree Level Using Terrestrial Laser Scanning and Deep Learning. Remote Sens. 2023, 15, 1165. [Google Scholar] [CrossRef]
  10. Cheng, P.-H.; Lin, C.C.-H.; Morton, Y.T.J.; Yang, S.-C.; Liu, J.-Y. A Bagged-Tree Machine Learning Model for High and Low Wind Speed Ocean Wind Retrieval From CYGNSS Measurements. IEEE Trans. Geosci. Remote Sens. 2023, 61, 4201910. [Google Scholar] [CrossRef]
  11. Moeini, M.; Memari, A.M. Hurricane-Induced Failure Mechanisms in Low-Rise Residential Buildings and Future Research Directions. Nat. Hazards Rev. 2023, 24, 03123001. [Google Scholar] [CrossRef]
  12. Faramarzi, D.; Rastegar, H.; Riahy, G.H.; Doagou-Mojarrad, H. A Three-Stage Hybrid Stochastic/IGDT Framework for Resilience-Oriented Distribution Network Planning. Int. J. Electr. Power Energy Syst. 2023, 146, 108738. [Google Scholar] [CrossRef]
  13. McCann, Z.H.; Szaflarski, M. Differences in County-Level Cardiovascular Disease Mortality Rates Due to Damage Caused by Hurricane Matthew and the Moderating Effect of Social Capital: A Natural Experiment. BMC Public Health 2023, 23, 60. [Google Scholar] [CrossRef]
  14. Liang, D.; Ewing, B.; Cardella, E.; Song, L. Probabilistic Modeling of Small Business Recovery after a Hurricane: A Case Study of 2017 Hurricane Harvey. Nat. Hazards Rev. 2023, 24, 05022012. [Google Scholar] [CrossRef]
  15. Friedman, E.; Solecki, W.; Troxler, T.G.; Paganini, Z. Linking Quality of Life and Climate Change Adaptation Through the Use of the Macro-Adaptation Resilience Toolkit. Clim. Risk Manag. 2023, 39, 100485. [Google Scholar] [CrossRef]
  16. Fatima, K.; Shareef, H.; Bajwa, A.A. An Insight into Power System Resilience and Its Confounding Traits. In Proceedings of the 2022 International Seminar on Application for Technology of Information and Communication (iSemantic), Semarang, Indonesia, 17–18 September 2022; IEEE: Piscataway, NJ, USA, 2022; pp. 226–231. [Google Scholar]
  17. Xu, Y.; Xing, Y.; Huang, Q.; Li, J.; Zhang, G.; Bamisile, O.; Huang, Q. A Review of Resilience Enhancement Strategies in Renewable Power System under HILP Events. Energy Rep. 2023, 9, 200–209. [Google Scholar] [CrossRef]
  18. Schmidt, D.H.; Garland, K.; Quebedeaux, L.K. Resilient Recovery Strategies: Lessons from the Local Nonprofit Sector Following Hurricane Ike. In Case Studies in Disaster Recovery; Elsevier: Amsterdam, The Netherlands, 2023; pp. 33–51. [Google Scholar]
  19. Hou, G.; Muraleetharan, K.K.; Panchalogaranjan, V.; Moses, P.; Javid, A.; Al-Dakheeli, H.; Bulut, R.; Campos, R.; Harvey, P.S.; Miller, G. Resilience Assessment and Enhancement Evaluation of Power Distribution Systems Subjected to Ice Storms. Reliab. Eng. Syst. Saf. 2023, 230, 108964. [Google Scholar] [CrossRef]
  20. Li, X.; Fu, D.; Nielsen-Gammon, J.; Gangrade, S.; Kao, S.C.; Chang, P.; Morales Hernández, M.; Voisin, N.; Zhang, Z.; Gao, H. Impacts of Climate Change on Future Hurricane Induced Rainfall and Flooding in a Coastal Watershed: A Case Study on Hurricane Harvey. J. Hydrol. 2023, 616, 128774. [Google Scholar] [CrossRef]
  21. Darestani, Y.M.; Shafieezadeh, A. Multi-Dimensional Wind Fragility Functions for Wood Utility Poles. Eng. Struct. 2019, 183, 937–948. [Google Scholar] [CrossRef]
  22. Hosseini, M.M.; Parvania, M. Quantifying Impacts of Automation on Resilience of Distribution Systems. IET Smart Grid 2020, 3, 144–152. [Google Scholar] [CrossRef]
  23. Lei, S.; Member, S.; Wang, J.; Member, S.; Chen, C.; Hou, Y.; Member, S. Mobile Emergency Generator Pre-Positioning and Real-Time Allocation for Resilient Response to Natural Disasters. IEEE Trans. Smart Grid 2018, 9, 2030–2041. [Google Scholar] [CrossRef]
  24. Wang, Z.; Wang, J. Self-Healing Resilient Distribution Systems Based on Sectionalization into Microgrids. IEEE Trans. Power Syst. 2015, 30, 3139–3149. [Google Scholar] [CrossRef]
  25. Fatima, K.; Idrisi, A.H.; Mourad, A.-H.I. LabView Based Conrol System Design for VTOL Aircraft System. In Proceedings of the 2020 Advances in Science and Engineering Technology International Conferences (ASET), Dubai, United Arab Emirates, 4 February–9 April 2020; IEEE: Piscataway, NJ, USA, 2020; pp. 1–5. [Google Scholar]
  26. Shi, Q.; Liu, W.; Zeng, B.; Hui, H.; Li, F. Enhancing Distribution System Resilience Against Extreme Weather Events: Concept Review, Algorithm Summary, and Future Vision. Int. J. Electr. Power Energy Syst. 2022, 138, 107860. [Google Scholar] [CrossRef]
  27. Marnay, C.; Chard, J.S.; Hamachi, K.S.; Lipman, T.; Moezzi, M.M.; Ouaglal, B.; Siddiqui, A.S. Modeling of Customer Adoption of Distributed Energy Resources. 2001. Available online: https://escholarship.org/uc/item/5x9154mg (accessed on 1 January 2023).
  28. Farzin, H.; Fotuhi-Firuzabad, M.; Moeini-Aghtaie, M. Role of Outage Management Strategy in Reliability Performance of Multi-Microgrid Distribution Systems. IEEE Trans. Power Syst. 2017, 33, 2359–2369. [Google Scholar] [CrossRef]
  29. Farzin, H.; Fotuhi-Firuzabad, M.; Moeini-Aghtaie, M. Enhancing Power System Resilience through Hierarchical Outage Management in Multi-Microgrids. IEEE Trans. Smart Grid 2016, 7, 2869–2879. [Google Scholar] [CrossRef]
  30. Arab, A.; Khodaei, A.; Khator, S.K.; Ding, K.; Emesih, V.A.; Han, Z. Stochastic Pre-Hurricane Restoration Planning for Electric Power Systems Infrastructure. IEEE Trans. Smart Grid 2015, 6, 1046–1054. [Google Scholar] [CrossRef]
  31. Gao, H.; Chen, Y.; Mei, S.; Huang, S.; Xu, Y. Resilience-Oriented Pre-Hurricane Resource Allocation in Distribution Systems Considering Electric Buses. Proc. IEEE 2017, 105, 1214–1233. [Google Scholar] [CrossRef]
  32. Wang, H.; Liu, Y.; Fang, J.; He, J.; Tian, Y.; Zhang, H. Emergency Sources Pre-Positioning for Resilient Restoration of Distribution Network. Energy Rep. 2020, 6, 1283–1290. [Google Scholar] [CrossRef]
  33. Arif, A.; Wang, Z.; Wang, J.; Chen, C. Power Distribution System Outage Management with Co-Optimization of Repairs, Reconfiguration, and DG Dispatch. IEEE Trans. Smart Grid 2017, 9, 4109–4118. [Google Scholar] [CrossRef]
  34. Hughes, W.; Zhang, W.; Bagtzoglou, A.C.; Wanik, D.; Pensado, O.; Yuan, H.; Zhang, J. Damage Modeling Framework for Resilience Hardening Strategy for Overhead Power Distribution Systems. Reliab. Eng. Syst. Saf. 2021, 207, 107367. [Google Scholar] [CrossRef]
  35. Li, M.; Hou, H.; Yu, J.; Geng, H.; Zhu, L.; Huang, Y.; Li, X. Prediction of Power Outage Quantity of Distribution Network Users under Typhoon Disaster Based on Random Forest and Important Variables. Math. Probl. Eng. 2021, 2021, 1–14. [Google Scholar] [CrossRef]
  36. Shen, Y.; Gu, C.; Ma, Z.; Yang, X.; Zhao, P. A Two-Stage Resilience Enhancement for Distribution Systems under Hurricane Attacks. IEEE Syst. J. 2020, 15, 653–661. [Google Scholar] [CrossRef]
  37. Kahouli, O.; Alsaif, H.; Bouteraa, Y.; Ben Ali, N.; Chaabene, M. Power System Reconfiguration in Distribution Network for Improving Reliability Using Genetic Algorithm and Particle Swarm Optimization. Appl. Sci. 2021, 11, 3092. [Google Scholar] [CrossRef]
  38. Moradi, M.H.; Abedini, M. A Combination of Genetic Algorithm and Particle Swarm Optimization for Optimal DG Location and Sizing in Distribution Systems. Int. J. Electr. Power Energy Syst. 2012, 34, 66–74. [Google Scholar] [CrossRef]
  39. Bie, Z.; Lin, Y.; Li, G.; Li, F. Battling the Extreme: A Study on the Power System Resilience. Proc. IEEE 2017, 105, 1253–1266. [Google Scholar] [CrossRef]
  40. Haider, W.; Ul Hassan, S.J.; Mehdi, A.; Hussain, A.; Adjayeng, G.O.M.; Kim, C.H. Voltage Profile Enhancement and Loss Minimization Using Optimal Placement and Sizing of Distributed Generation in Reconfigured Network. Machines 2021, 9, 20. [Google Scholar] [CrossRef]
  41. Vai, V.; Suk, S.; Lorm, R.; Chhlonh, C.; Eng, S.; Bun, L. Optimal Reconfiguration in Distribution Systems with Distributed Generations Based on Modified Sequential Switch Opening and Exchange. Appl. Sci. 2021, 11, 2146. [Google Scholar] [CrossRef]
  42. Gallego Pareja, L.A.; López-Lezama, J.M.; Carmona, O.G. A Mixed-Integer Linear Programming Model for the Simultaneous Optimal Distribution Network Reconfiguration and Optimal Placement of Distributed Generation. Energies 2022, 15, 3063. [Google Scholar] [CrossRef]
  43. Gallego Pareja, L.A. ElectricalSystemsDataForReconfiguration. Available online: https://github.com/LuisGallego2019/ElectricalSystemsDataForReconfiguration (accessed on 1 January 2023).
  44. Bajwa, A.A.; Mokhlis, H.; Mekhlief, S.; Mubin, M.; Azam, M.M.; Sarwar, S. Resilience-Oriented Service Restoration Modelling Interdependent Critical Loads in Distribution Systems with Integrated Distributed Generators. IET Gener. Transm. Distrib. 2021, 15, 1257–1272. [Google Scholar] [CrossRef]
  45. Ryan, P.C.; Stewart, M.G.; Spencer, N.; Li, Y. Reliability Assessment of Power Pole Infrastructure Incorporating Deterioration and Network Maintenance. Reliab. Eng. Syst. Saf. 2014, 132, 261–273. [Google Scholar] [CrossRef]
  46. Hou, G.; Muraleetharan, K.K. Modeling the Resilience of Power Distribution Systems Subjected to Extreme Winds Considering Tree Failures: An Integrated Framework. Int. J. Disaster Risk Sci. 2023, 14, 194–208. [Google Scholar] [CrossRef]
  47. Khomami, M.S.; Sepasian, M.S. Pre-Hurricane Optimal Placement Model of Repair Teams to Improve Distribution Network Resilience. Electr. Power Syst. Res. 2018, 165, 1–8. [Google Scholar] [CrossRef]
  48. Ouyang, M.; Duenas-Osorio, L. Multi-Dimensional Hurricane Resilience Assessment of Electric Power Systems. Struct. Saf. 2014, 48, 15–24. [Google Scholar] [CrossRef]
  49. Fatima, K.; Shareef, H. Dynamic Bayesian Network Model for Overhead Power Lines Affected by Hurricanes. Forecasting 2025, 7, 11. [Google Scholar] [CrossRef]
  50. Omogoye, O.S.; Folly, K.A.; Awodele, K.O. Enhancing the Distribution Power System Resilience against Hurricane Events Using a Bayesian Network Line Outage Prediction Model. J. Eng. 2021, 2021, 731–744. [Google Scholar] [CrossRef]
  51. GeNIe Modeler by BayesFusion, LLC. Available online: https://www.bayesfusion.com/genie/ (accessed on 2 February 2024).
  52. Guo, Y.; Wang, H.; Guo, Y.; Zhong, M.; Li, Q.; Gao, C. System Operational Reliability Evaluation Based on Dynamic Bayesian Network and XGBoost. Reliab. Eng. Syst. Saf. 2022, 225, 108622. [Google Scholar] [CrossRef]
  53. Luo, D.; Xia, Y.; Zeng, Y.; Li, C.; Zhou, B.; Yu, H.; Wu, Q. Evaluation Method of Distribution Network Resilience Focusing on Critical Loads. IEEE Access 2018, 6, 61633–61639. [Google Scholar] [CrossRef]
  54. Almoghathawi, Y.; Barker, K. Component Importance Measures for Interdependent Infrastructure Network Resilience. Comput. Ind. Eng. 2019, 133, 153–164. [Google Scholar] [CrossRef]
  55. Liu, X.; Shahidehpour, M.; Li, Z.; Liu, X.; Cao, Y.; Bie, Z. Microgrids for Enhancing the Power Grid Resilience in Extreme Conditions. IEEE Trans. Smart Grid 2016, 8, 589–597. [Google Scholar] [CrossRef]
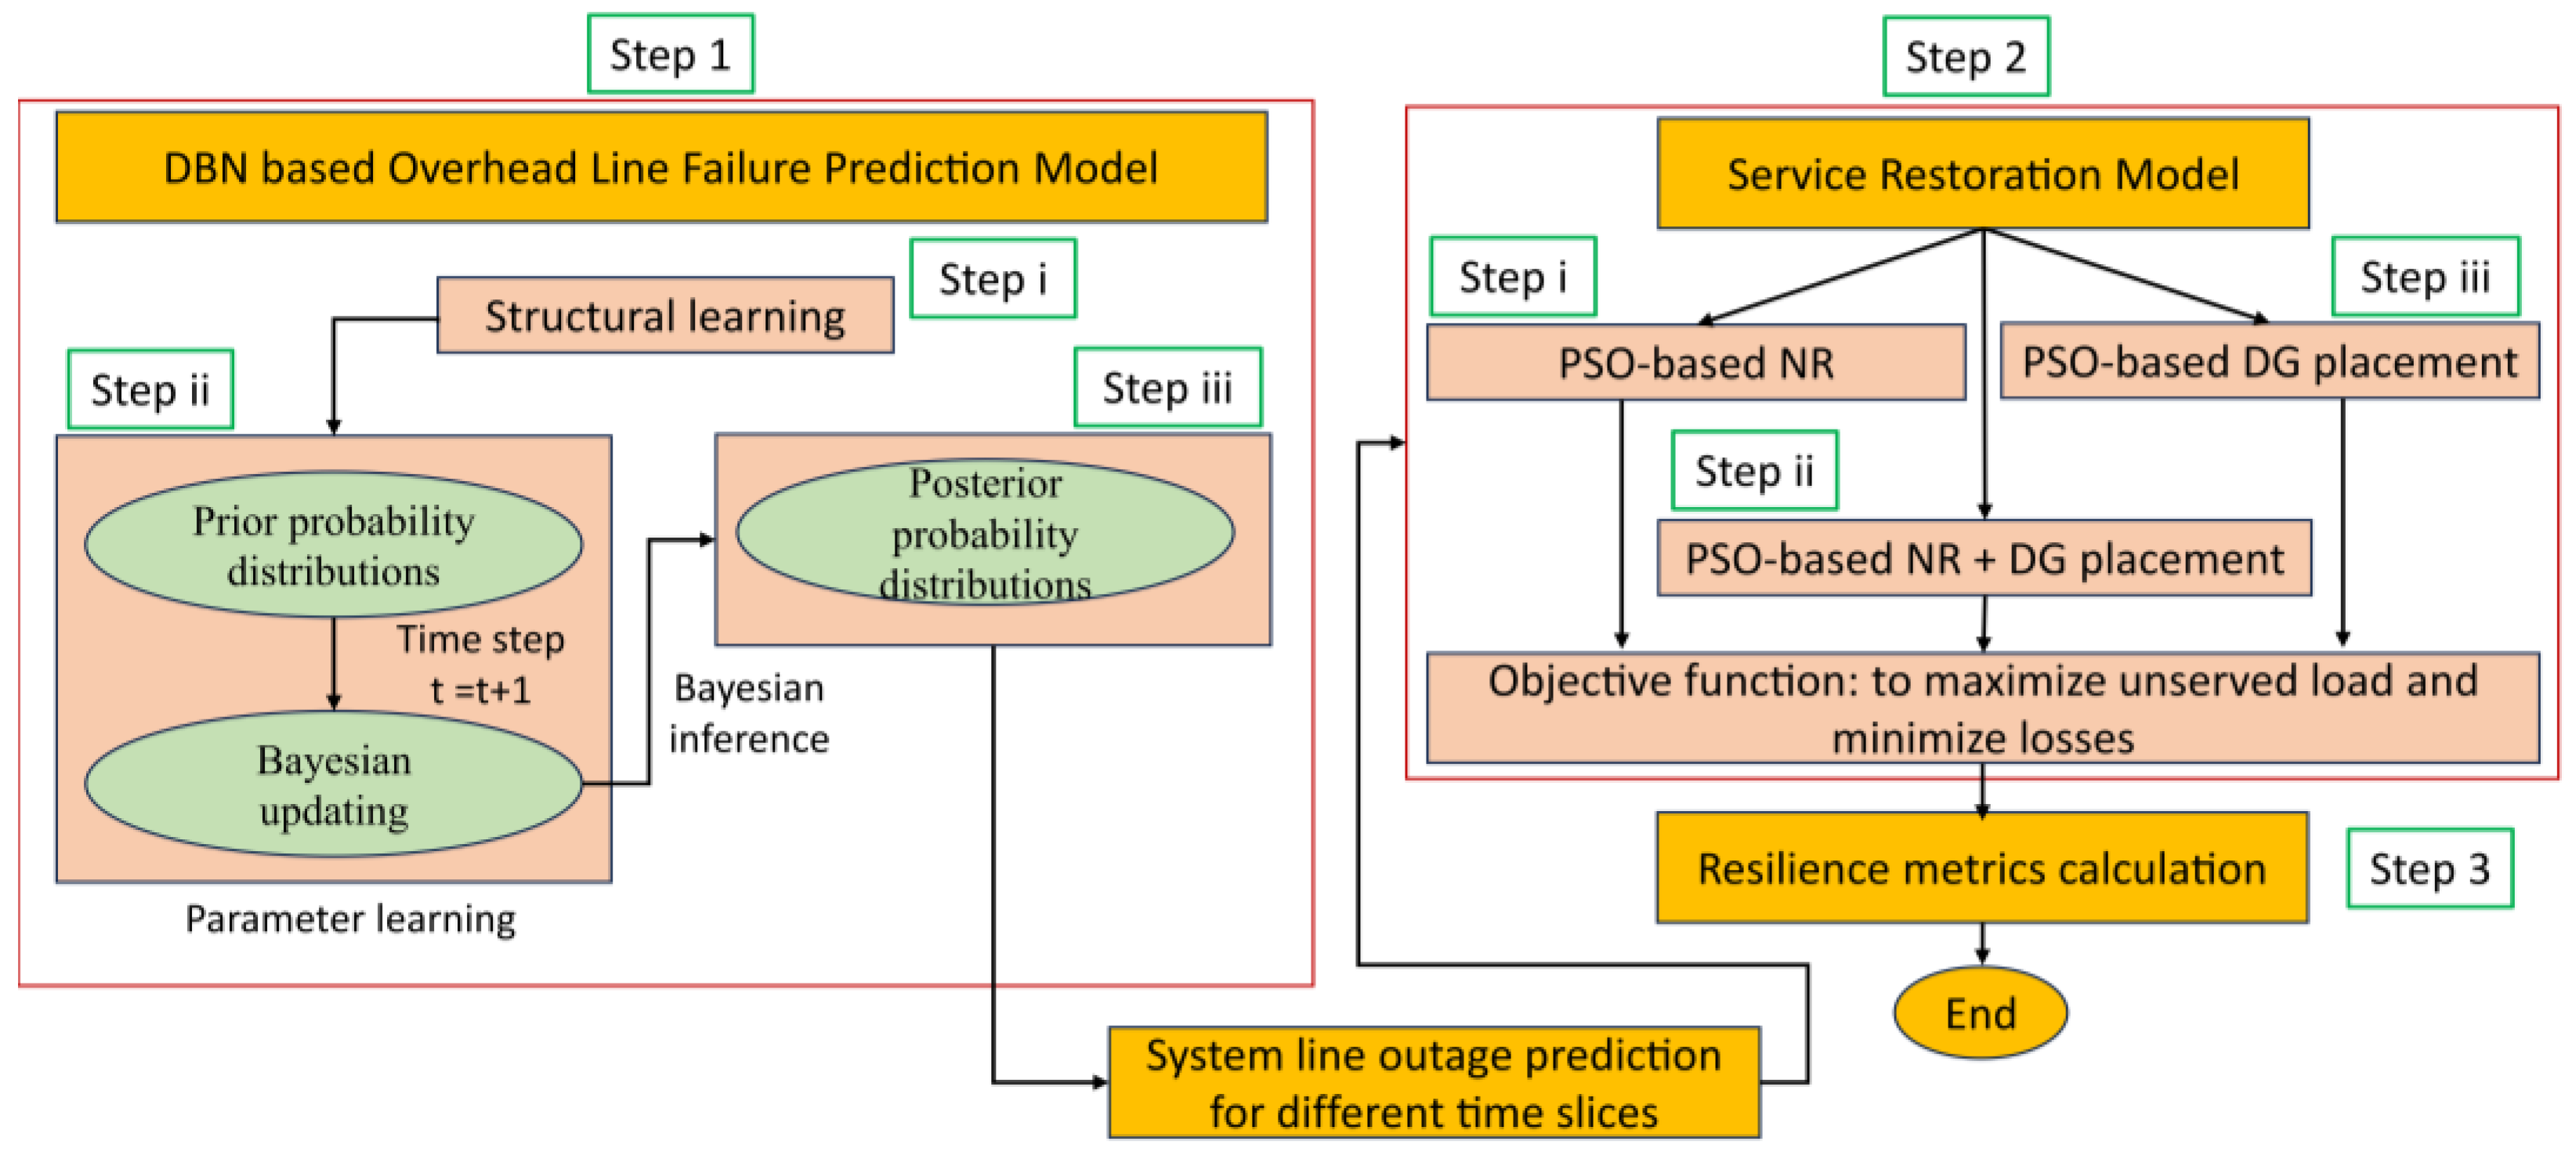
Figure 1. Overview of proposed methodology.
Asi 08 00149 g001
Figure 2. A disruptive event set up for the IEEE 33 bus radial PDS [49].
Asi 08 00149 g002
Figure 3. DBN model for N time slices: a graphical representation.
Asi 08 00149 g003
Figure 4. A representation of two bus radial PDS.
Asi 08 00149 g004
Figure 5. Flow chart for PSO-based network reconfiguration in PDS.
Asi 08 00149 g005
Figure 6. Flow chart of PSO algorithm for optimal DG placement in distribution network.
Asi 08 00149 g006
Figure 7. Resilience curve representing network operation states [44].
Asi 08 00149 g007
Figure 8. Network connectivity graph under system line failures: (a) Case 1, (b) Case 2, and (c) Case 3.
Asi 08 00149 g008
Figure 9. Network connectivity graph under normal operating conditions.
Asi 08 00149 g009
Figure 10. Voltage profiles for the base and faulted system for Case 1.
Asi 08 00149 g010
Figure 11. Network topology for Case 1: (a) faulty system; (b) after reconfiguration; (c) with DG placement (red) and with reconfiguration and DG placement (green).
Asi 08 00149 g011
Figure 12. Case 1 before and after reconfiguration: (a) voltage profile, (b) line power losses.
Asi 08 00149 g012
Figure 13. Case 1 before and after DG placement: (a) voltage profile, (b) line power losses.
Asi 08 00149 g013
Figure 14. Case 1 before and after reconfiguration with DG placement: (a) voltage profile, (b) line power losses.
Asi 08 00149 g014
Figure 15. Voltage profiles for the base and faulted system for Case 2.
Asi 08 00149 g015
Figure 16. Network topology for Case 2: (a) faulty system; (b) after reconfiguration; (c) with DG placement (red) and with reconfiguration and DG placement (green).
Asi 08 00149 g016
Figure 17. Case 2 before and after reconfiguration: (a) voltage profile, (b) line power losses.
Asi 08 00149 g017
Figure 18. Case 2 before and after DG placement: (a) voltage profile (b) line power losses.
Asi 08 00149 g018
Figure 19. Case 2 before and after reconfiguration with DG placement: (a) voltage profile, (b) line power losses.
Asi 08 00149 g019
Figure 20. Voltage profiles for the base and faulted system for Case 3.
Asi 08 00149 g020
Figure 21. Network topology for Case 3 (a) before and after reconfiguration; (b) with DG placement (red) and with reconfiguration and DG placement (green).
Asi 08 00149 g021
Figure 22. Case 3 before and after DG placement: (a) voltage profile, (b) line power losses.
Asi 08 00149 g022
Figure 23. Case 3 before and after reconfiguration with DG placement: (a) voltage profile, (b) line power losses.
Asi 08 00149 g023
Figure 24. Percentage load restored for different scenarios.
Asi 08 00149 g024
Table 1. Results of overhead line failure prediction for Case 1, Case 2, and Case 3.
System LinesFrom Bus to BusHWSI (m/s)CASE 1 (t = 0)CASE 2 (t = 1)CASE 3 (t = 0)
11–258.115110
22–359.903110
33–461.691110
44–563.479110
55–650.068101
66–750.962101
77–851.856101
88–952.750101
99–1042.915111
1010–1143.586111
1111–1244.257111
1212–1344.927111
1313–1433.528111
1414–1534.422111
1515–1635.316111
1616–1736.210111
1717–1837.104111
182–1959.903000
1919–2054.538101
2020–2155.433101
2121–2256.327001
223–2361.691110
2323–2467.056110
2424–2568.844110
256–2650.962101
2626–2746.268111
2727–2846.939111
2828–2948.056111
2929–3037.998111
3030–3138.892111
3131–3239.786111
3232–3340.680111
338–2152.750101
349–1542.915111
3512–2244.927111
3618–3342.468111
3725–2949.397111
Table 2. Results of the service restoration model.
CaseScenarioObjective 1 (MW)Objective 2 (kW)Min. Voltage (p.u.)
C0S03.715202.6770.9131 (Bus 18)
C1S13.355188.00-
S23.715197.850.9335 (Bus 22)
S33.715161.630.9224 (Bus 33)
S43.715120.060.9510 (Bus 22)
C2S11.315.20-
S22.985262.80-
S33.715119.6890.9348 (Bus 18)
S43.71543.900.9518 (Bus 18)
C3S100.00-
S200.00-
S33.71597.5890.9712 (Bus 18)
S43.71527.00.9687 (Bus 33)
Table 3. Results of resilience metrics.
ParameterCaseScenario
1234
Degraded19.699.699.699.69
system 265.00665.00665.00665.006
state (%)3100100100100
Restored 190.31100100100
system 234.99480.35100100
state (%)300100100
tdte(hr)11111
22222
31111
tStd(hr)100.010.010.01
200.010.010.01
300.010.010.01
tfts(hr)10808
2010010
3010010
R115.3195.0546.1868.329
265.7893.8058.35422.779
3infinf10.24737.037
R210111
200.697711
30011
R31329.717415.182153.942415.182
2115.006249.451164.656189.626
3150150200300
Disclaimer/Publisher’s Note: The statements, opinions and data contained in all publications are solely those of the individual author(s) and contributor(s) and not of MDPI and/or the editor(s). MDPI and/or the editor(s) disclaim responsibility for any injury to people or property resulting from any ideas, methods, instructions or products referred to in the content.