Article

Advanced Vehicle Electrical System Modelling for Software Solutions on Manufacturing Plants: Proposal and Applications

by
Adrià Bosch Serra
1,*,
Juan Francisco Blanes Noguera
1,
Luis Ruiz Matallana
2,
Carlos Álvarez Baldo
2 and
Joan Porcar Rodado
2
1
Instituto ai2, Universitat Politècnica de València, 46022 València, Spain
2
Ford Motor Company, 46440 Valencia, Spain
*
Author to whom correspondence should be addressed.
Appl. Syst. Innov. 2025, 8(5), 134; https://doi.org/10.3390/asi8050134
Submission received: 25 July 2025 / Revised: 8 September 2025 / Accepted: 15 September 2025 / Published: 17 September 2025
(This article belongs to the Section Information Systems)

Abstract

Mass customisation in the automotive industry has exploded the number of wiring harness variants that must be assembled, tested and repaired on the shop floor. Existing CAD or schematic formats are too heavy and too coarse-grained to drive in-line, per-VIN validation, while supplier documentation is heterogeneous and often incomplete. This paper presents a pin-centric, two-tier graph model that converts raw harness tables into a machine-readable, wiring-aware digital twin suitable for real-time use in manufacturing plants. All physical and logical artefacts—pins, wires, connections, paths and circuits—are represented as nodes, and a dual-store persistence strategy separates attribute-rich JSON documents from a lightweight NetworkX property graph. The architecture supports dozens of vehicle models and engineering releases without duplicating data, and a decentralised validation pipeline enforces both object-level and contextual rules, reducing initial domain violations from eight to zero and eliminating fifty-two circuit errors in three iterations. The resulting platform graph is generated in 0.7 s and delivers 100% path-finding accuracy. Deployed at Ford’s Almussafes plant, the model already underpins launch-phase workload mitigation, interactive visualisation and early design error detection. Although currently implemented in Python 3.11 and lacking quantified production KPIs, the approach establishes a vendor-agnostic data standard and lays the groundwork for self-aware manufacturing: future work will embed real-time validators on the line, stream defect events back into the graph and couple the wiring layer with IoT frameworks for autonomous repair and optimisation.

1. Introduction

The current shift from mass production to mass customisation [1] and highly personalised products [2] is redefining the automotive industry. A single vehicle model can now be assembled in thousands of wiring harness variants, each adapted to a specific market, driving position, powertrain, or optional equipment. While this variety increases customer value, it also multiplies the effort required to validate every electrical function of every car that leaves the line.

1.1. From End-of-Line Checks to On-Process Validation

Traditional quality control relies on end-of-line (EoL) inspections: a completed car is removed from the line, partially disassembled, diagnosed and finally repaired. This approach is slow and expensive. An emerging on-process validation paradigm tackles those limitations by embedding test and repair activities directly in the assembly flow. Detecting faults as early as possible shortens diagnostic paths, reduces cycle time and cuts the cost per unit.
For on-process validation to work under mass customisation, the production system must be product-aware: test benches, robots and human operators need to know the exact wiring architecture of the very car they are handling—no matter how unique that car is. Providing this knowledge in real time is not trivial, because of the following:
  • Wiring data are scattered across multiple supplier documents, often in incompatible formats;
  • Harness options are encoded through Boolean rules that must be evaluated for each serial number;
  • Existing CAD formats are too heavy for shop floor software that must answer queries in milliseconds.

1.2. Digitalisation Challenges in Modern Manufacturing

The transition towards Industry 4.0 and the emerging Industry 5.0 paradigm underlines the strategic importance of software-driven, data-centric production [3]. Flexible and resilient factories must adapt to rapidly changing demand, component shortages and unforeseen disruptions [4]. Advanced digital solutions ranging from predictive maintenance to autonomous decision making enable unprecedented levels of customisation and agility, allowing real-time adjustment of production lines and seamless integration of new technologies [5].
One of the critical issues manufacturers face on this journey is the lack of a unified data source in a format suitable for efficient software development on the shop floor [6]. This gap hampers the ability to streamline processes and to deploy advanced solutions seamlessly across equipment and organisational silos. High-quality, standardised data are therefore essential. As noted in [7], the rising complexity of both manufacturing systems and products demands robust, reliable information flows to ensure smooth integration between multiple subsystems and engineering disciplines.

1.3. Contribution of This Work

This paper introduces a methodology and wiring model structure that goes beyond mere data storage. Its main contributions are as follows:
  • Process-ready representation. The two-level graph model is designed not only for archival purposes but also for direct consumption by shop-floor devices and on-process validation stations, enabling real-time querying and decision making.
  • Foundation for future tools. By exposing a clean API over a standard data structure, the model accelerates the development of new diagnostic algorithms, complexity metrics, path-finding routines and other software components required by next-generation validation processes.
  • Standard display format. The graph provides a consistent view of every harness variant, simplifying human-centred visualisation and interactive debugging across engineering and maintenance teams.
  • Digitalisation requirements for suppliers. The proposed format acts as a de facto specification that suppliers can target, ensuring that incoming documentation is machine-readable and immediately integrable into the plant’s information systems.
Implemented in Python with NetworkX, the model converts heterogeneous wiring sources into a domain-driven, multilayer graph that supports digital twins, AI-assisted fault prediction and dynamic re-scheduling, thereby fostering flexibility and resilience in modern manufacturing environments.

1.4. Objectives

Building on the methodology and data standard outlined above, this research is guided by four concrete objectives:
1.
Faithful representation through complex systems theory. Apply concepts and formalisms from complex systems and network science to model the vehicle wiring harness with a level of granularity and accuracy that mirrors physical reality.
2.
Multilayer extensibility. Design the wiring layer so that it can seamlessly link to future models describing higher-level vehicle communication networks (e.g., CAN, LIN, Automotive Ethernet), ultimately enabling an integrated, multi-layer digital twin.
3.
Stable and scalable data standard. Provide a technology-agnostic, vendor-independent format that is reusable across different vehicle platforms and model years, facilitating supplier compliance and long-term maintainability.
4.
Graph-based analytics. Leverage characteristic graph functions, such as path-finding, centrality, community detection and redundancy analysis, to solve practical problems in validation, diagnostics and optimisation.

1.5. State-of-the-Art

The study of complex systems has become an increasingly important field, particularly for its applications in analysing and modelling intricate networks such as electrical grids. Complex systems are characterised by numerous interconnected components that interact in non-linear ways, resulting in emergent behaviours that cannot be easily predicted from the properties of individual components alone. This inherent complexity is prevalent in various domains, including biological systems, social networks, and technological infrastructures [8].
One of the most significant applications of complex systems theory is in the analysis and modelling of electrical grids [9]. Electrical grids are quintessential examples of complex networks, comprising a vast array of generators, transformers, substations as nodes and transmission lines as edges [10]. The intricate interconnections and dependencies within these networks necessitate sophisticated modelling techniques to ensure their reliability, efficiency, and resilience. Traditional approaches often fall short in capturing the dynamic and non-linear interactions present in these systems.
Following the study reported by [11] various methodologies for modelling electrical networks have been developed to understand their topological and physical properties. These methodologies include the use of graph theory to analyse node degree distribution, betweenness centrality, and clustering coefficients, which provide insights into the structural robustness and vulnerability of the grid. Different types of modelling approaches, such as Random Graphs, Small-world Graphs, Preferential Attachment models, R-MAT, Copying Models, Forest Fire models, and Kronecker Graphs, have been utilised to study the evolution of network topologies. Additionally, incorporating physical parameters such as line impedances and power flows into these models allows for a more accurate representation of the grid’s behaviour under different conditions. These modelling techniques are essential for enhancing the efficiency, resilience, and reliability of electrical networks.
Other works such as [10,12,13] prove that graph theory provides a powerful framework for representing and analysing the topological structure of electrical grids. By modelling the grid as a graph, where nodes represent components such as substations and edges represent transmission lines, it becomes possible to apply a range of analytical techniques to study the network’s properties. These techniques can identify critical nodes, optimise network topology, and simulate the impact of failures or targeted attacks. For example, measures such as node degree distribution, betweenness centrality, and clustering coefficients offer insights into the structural robustness and vulnerability of the grid.
In the vehicle modelling field, reference [14] provides a compelling example of applying graph theory to vehicle systems, particularly automotive sensor networks. The study highlights the importance of defining interconnections between subsystems and components in complex systems. Using graph theory, the research proposes a matrix algebraic method to determine and characterise these interconnections. Furthermore, reference [15] presents another example of the application of graph theory to vehicle systems. This study focuses on the generation of wire paths within a vehicle using a multi-objective evolutionary algorithm. The researchers discretise the free space within a vehicle into a graph structure, representing each part as a node and the potential wire paths as edges.
As the survey [16] relates, recent advancements have also explored the potential utility of machine learning techniques, such as neural networks, in conjunction with graph-based models. Neural networks can learn complex patterns and relationships within the grid, making them useful for tasks such as fault detection, load forecasting, and predictive maintenance. By leveraging large datasets, these models can continuously improve their accuracy and adapt to changing conditions within the grid.
The utility of these approaches is underscored by their ability to provide actionable insights and enhance decision-making processes. Some examples presented in [17], show that graph-based models can predict potential points of failure before they occur, allowing for preemptive maintenance and reducing downtime. They can also optimise the flow of electricity through the grid, enhancing efficiency and reducing energy losses [18]. Furthermore, the integration of these models with real-time data from smart grids facilitates dynamic response to fluctuations in demand and supply, thereby improving the overall resilience of the electrical grid.
In summary, the application of complex systems theory and advanced modelling techniques to the analysis of electrical grids represents a significant advancement in our ability to manage and optimise these critical infrastructures. These approaches offer valuable tools for enhancing the reliability, efficiency and sustainability of electrical grids, aligning with the broader goals of Industry 5.0 to create resilient and human-centric manufacturing systems.
To translate these high-level modelling capabilities into actionable, shop-floor intelligence, rich and trustworthy field data are required. In the automotive electrical domain, Radio Frequency Identification (RFID) has emerged as a prime candidate for supplying that data. Recent work continues to broaden the use-case spectrum of RFID technologies inside the vehicle. Basic et al. [19] employ short-range NFC to retrieve temperature and voltage data from battery cells while embedding ECDSA-based anti-counterfeiting, whereas Chen et al. [20] achieve centimetre-level strain sensing at distances above three metres through a semi-active, dual-interrogation UHF tag. Complementing such sensor-centric approaches, Wu et al. [21] survey crack-monitoring tags and highlight the absence of system-level data integration. At the vehicle–infrastructure boundary, Kaur and Kamboj [22] fuse RFID, GPS and camera feeds to prioritise emergency vehicles, but still rely on flat CSV exports. All four studies confirm the technological feasibility of RFID/NFC for electrical and structural monitoring; however, none provide a machine-oriented data backbone that (i) keeps a single JSON instance per component while (ii) representing multiple wiring topologies concurrently. The dual-store graph proposed in this paper is purpose-built to fill that gap and to feed future on-process validators or ITS services through a uniform REST interface.

2. Materials and Methods

This section presents, in logical order, all the specifications and procedures needed to construct the proposed wiring model. It begins with a description of the data landscape where the source files come from and how they are acquired and pre-processed before turning to the core Domain-Driven Modelling strategy. Guided by Domain-Driven Design principles, we define every object that belongs to the vehicle wiring domain and the rules that govern their behaviour, so that the resulting graph is a faithful digital counterpart of the physical harness. We then describe the complete modelling workflow, from parsing and option filtering to graph construction, and continue with the persistence strategy that guarantees both efficient storage and low-latency access. The section concludes with the validation framework that ensures data integrity and model correctness.

2.1. Data Sources and Acquisition

Figure 1 outlines the data acquisition layer, which follows classic software architecture guidelines chiefly separation of concerns, single responsibility and loose coupling. Each processing step is encapsulated in an independent module so that any future change (for example, a new supplier file format) requires modifying only one well-bounded component.
Data sources. In the present programme two flat-table datasets are available:
  • “wires” table that lists every individual conductor together with its start and end destinations;
  • “components and pin-outs” table that enumerates each harness component (ECUs, Grounds, shields) and the logical pins it exposes.
Connector records are synthesised by joining these two tables: geometric and electrical attributes come from the component table, while occupancy and wiring details are taken from the wires table. Thanks to the modular design, if a dedicated connectors database becomes available in the future, only the corresponding extractor block must be replaced; the remainder of the pipeline stays untouched.
Raw documents are parsed by type-specific extractors, each of which writes its output to a dedicated artefact store. In our implementation, an “artefact store” is a lightweight Python class that behaves like a document-oriented mini-database. Each domain entity—wires, connectors, splices, and so on—has its own dedicated store (e.g., WireStore). The store handles persistence (serialising to JSONL or Parquet), runs type-specific validation, and exposes a uniform CRUD interface. This repository-style abstraction decouples the rest of the pipeline from the underlying data source: swapping a supplier format or migrating to an external database requires only replacing the corresponding store class, leaving all downstream modelling code unchanged.
All cross-references are mediated through the attribute “id”; the value is globally unique and immutable, guaranteeing referential integrity across stores. Most entities also carry a human-readable name field, whose sole purpose is debugging, search and visualisation it has no key semantics and is therefore exempt from uniqueness constraints.
Design principles enforced:
  • No duplication: Normalised stores keyed by “id” prevent inconsistent copies of the same entity.
  • Open-closed: New extractors or storage back-ends can be introduced without altering existing code.
  • DRY and high cohesion: Validation rules live next to the extractor that generates the data they verify.
Type-aware validation—schema checks, cardinality rules, domain constraints—is executed on each artefact store; the specifics of these checks are discussed later in the Validation subsection. The resulting, sanitised datasets constitute the sole inputs admitted into the Domain-Driven Modelling pipeline described in Section 2.3.

2.2. Domain-Driven Modelling

Domain modelling in this work follows the philosophy of Domain-Driven Design (DDD) [23,24]: We start by capturing the wiring experts own vocabulary, then translate that ubiquitous language into explicit software artefacts. The approach delivers two key advantages traceability, because every graph element maps unambiguously to a real-world counterpart, and maintainability, because changes in business rules affect only the bounded context in which they live. The remainder of this section is organised accordingly: we first outline the two-level graph architecture that grounds the model and then define the set of domain objects that populate each layer.

2.2.1. Graph Architecture

The model is a two-tier shadow graph in which every real-world artefact—whether a component or a conductive element—appears as a node; edges are reserved for the simplest “touches/connects” relationships only. By treating wires, circuits and paths as nodes rather than edges, we can map them cleanly across layers and keep the graph uniform. The two different layers are described as follows:
  • Wiring layer: The shadow of an ECU at this tier is the set of its physical terminations: pins, splices, … Conductive elements themselves are also nodes: each Wire node is linked by plain connect edges to the two Pin nodes it terminates on (or to a Pin and a Splice node, and so forth). This yields an accurate representation of the harness while preserving a one-type-of-edge policy.
  • Access layer: The same ECU casts a coarser shadow: a single Component node. Functional bundles are represented explicitly as Path and Circuit nodes; they connect to Component nodes via simple connect edges as well. Thus, a Path node can fan out to several Component nodes without overloading the edge semantics.
On the other hand, interlayer edges tie every higher-level node to the exact set of lower-level nodes that realise it: a Path node owns the collection of Wire nodes that implement it, and an ECU shadow owns the Pin nodes that form its footprint. Because both conductive elements and functional bundles are modelled as nodes, these owns links work symmetrically in either direction, enabling seamless traversal from schematic-level reasoning down to physical detail and back.
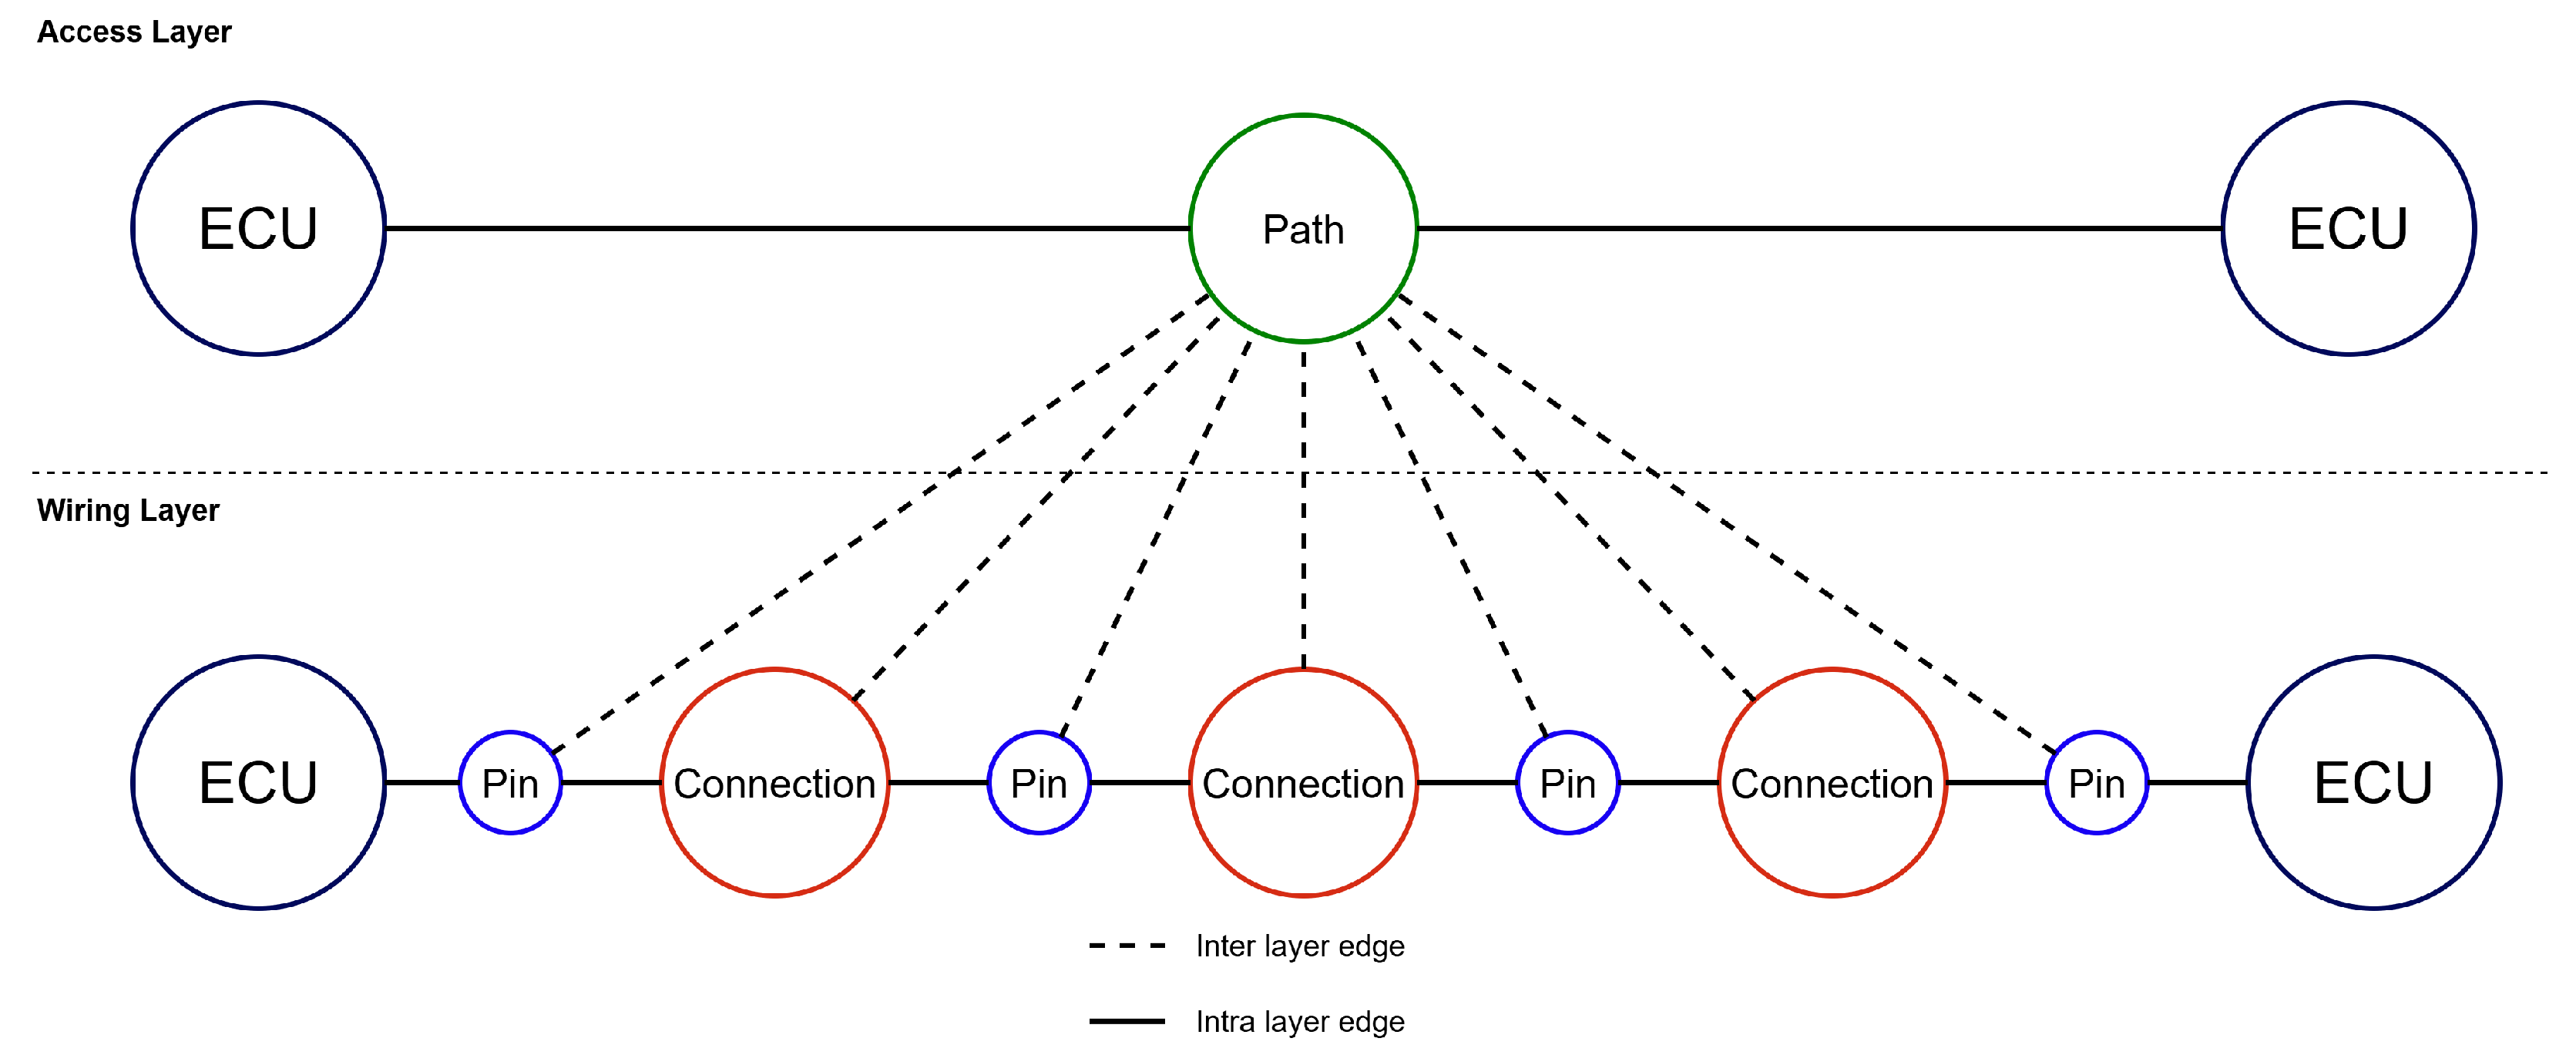
Figure 2 visualises the arrangement: two ECU shadows on Level 2 are connected by a Path node, while the edges show how that Path is implemented by a handful of Wire nodes, Pin nodes and connection nodes on Level 1.

2.2.2. Domain Objects Definition

Within the two-tier shadow graph every tangible or logical artefact of the harness is represented by a node whose behaviour is governed by a small, clear set of invariants. The following paragraphs describe each node type and the rules it must satisfy.
  • Component.
A component node is the shadow of a real electronic unit, such as an ECU or a ground stud. Because the same physical part can appear at several resolutions, a component casts one shadow per tier: the coarse-grain shadow lives in the abstraction layer, whereas the fine-grain shadow is dissolved into its pins in the wiring layer. A component node can never be isolated; in the wiring layer it must be connected to at least one of its own ComponentPin nodes, while in the abstraction layer it must participate in at least one Circuit or Path. The node represents the essence of the part; therefore, design variants that merely rearrange pin-outs do not spawn new component nodes.
  • Wire.
A wire node stands for one and only one physical conductor in the vehicle. By definition, it has exactly two neighbours—its two Endpoint nodes—and therefore, cannot be replicated, branched or left unconnected.
  • Endpoint.
Every location where a wire terminates is abstracted as an endpoint node. Three concrete sub-types exist:
  • Splice: The junction where three or more wires meet;
  • ConnectorPin: The terminal located in a cavity of a plug or inline connector;
  • Shield: The single lug that grounds a cable braid.
Splices and connector pins must each have at least two neighbours, whereas a shield may legally have only one because it simply sinks the braid to ground. A connector pin may connect to its wire, to another connector pin (inline connectors) or to a ComponentPin, but never directly to a component.
  • ComponentPin.
A component pin node represents a single electrical terminal on an ECU or other device. It is authorised to connect only to its parent component and to exactly one ConnectorPin. In effect, the component pin is the hinge that links the physical harness to the logical device.
  • Connection.
A connection node models a permanent crimp, weld or solder joint that hard-links two pins. The node is allowed exactly two neighbours and cannot be left dangling.
  • Circuit.
At the abstraction layer a circuit node groups several components that share a functional conductor set—for instance, the CAN + or CAN − lines of the vehicle bus. A circuit must be attached to at least two component nodes and must own the collection of underlying Wire, Endpoint and ComponentPin nodes that physically realise it in the lower tier.
  • Path.
A path node refines a circuit by denoting the specific linkage between a pair of components inside that circuit. Thus, a CAN + circuit that spans three ECUs will contain three component pairs and therefore 3 2 = 3 distinct path nodes. Each path owns the precise subset of wires that carry the signal between its two endpoints and must be connected both to those components and to the parent circuit node. An example of Access level relations is shown in Figure 3.
Together, these invariants ensure that every node behaves consistently across the entire model, enabling automated validation of real harness data and safe navigation between schematic-level reasoning and physical detail.
The reference graph is deliberately “maximal”: it embeds every valid configuration of a given vehicle platform—left-hand drive, right-hand drive, optional infotainment packages, and so on inside a single structure. When a harness for an individual car is needed, a configuration filter is applied that prunes away every node and edge not present in that specific build. After this reduction, a stricter rule set comes into force: each ComponentPin and each ConnectorPin must now terminate in exactly one Connection, and within any Circuit no more than one Path may link a given pair of Components. These additional constraints guarantee that the resulting per-vehicle sub-graph remains both unambiguous and physically feasible.

2.3. Graph Construction

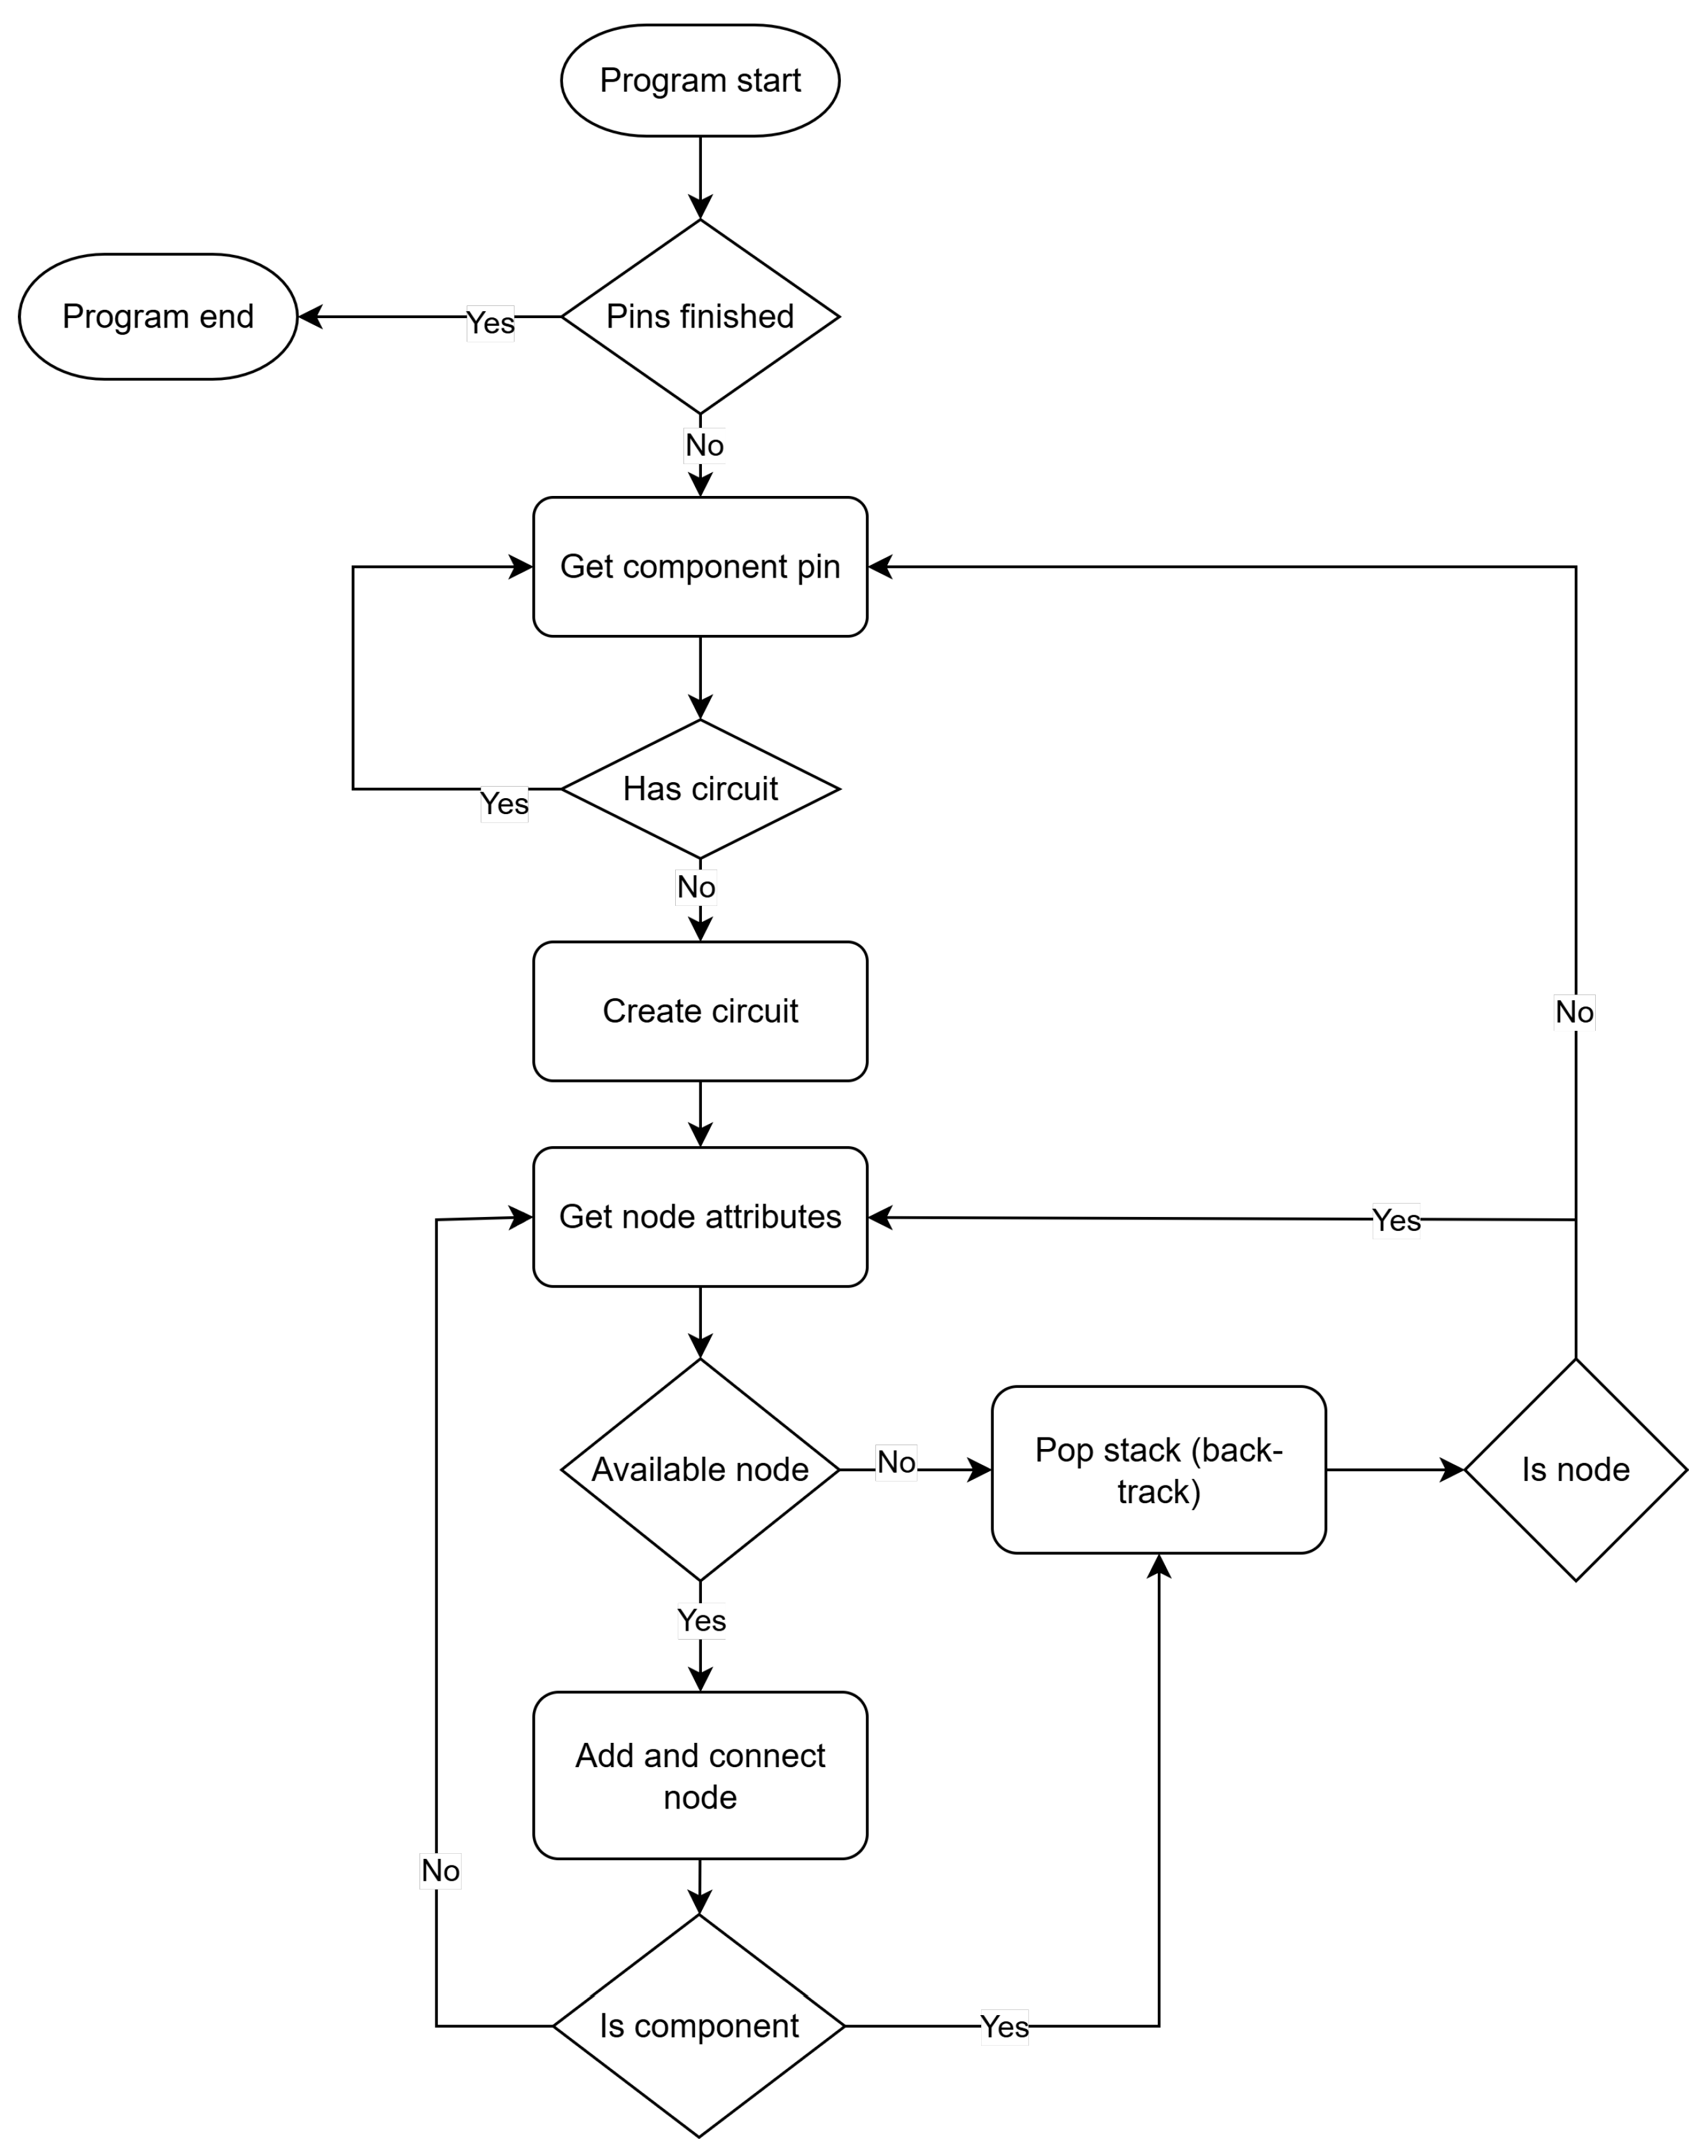
The construction of circuits and paths is carried out by a depth-first traversal that combines ordinary path-finding with on-the-fly cycle detection. The overall control flow, reproduced in Figure 4, is summarised below.

2.3.1. Seed Selection

The algorithm iterates over every ComponentPin of every Component. Whenever it encounters a pin that is not yet assigned to a Circuit, it spawns a new circuit node and initialises the traversal queue with that pin.

2.3.2. Guided Exploration

Traversal proceeds as a constrained DFS. The current node’s role (wire, splice, connector pin, etc.) determines the legal kinds of neighbours it may visit next; these rules are exactly the invariants stated in Section 2.2.2. If a candidate neighbour is already tagged with the active circuit’s identifier the edge is skipped (cycle detected); otherwise the neighbour is annexed to the circuit and pushed onto the DFS stack.

2.3.3. Component Encounter and Path Bookkeeping

When the search reaches a second Component node, the traversal between the two endpoint components is recorded as a Path. If an identical pair of components is already connected by an existing path inside the same circuit, the algorithm merely appends the newly found set of physical nodes to the path’s owns relation; no duplicate path node is created.

2.3.4. Back-Tracking and Completion

Upon exhausting all admissible neighbours of the current node, the algorithm pops the DFS stack and resumes exploration from the previous node. Back-tracking continues until the stack empties, at which point the circuit is complete. The outer loop then selects the next unassigned ComponentPin and repeats the procedure until every pin in the graph belongs to exactly one circuit.

2.3.5. On-the-Fly Synthesis of Connection Nodes

Physical joints that are implicit in the raw data (for example, two pins that are internally shorted inside a junction box) are materialised during traversal when the algorithm detects twin pins that share identical connectivity signatures yet lack an explicit intermediary. A new Connection node is inserted, and the incident edges are rewired accordingly before traversal continues.

2.4. Per-Vehicle Filtering

After the maximal platform graph has been built, a configuration filter prunes away every node and edge not present in the target build. The reduced subgraph is then re-validated under the stricter per-vehicle rules (single termination per pin, unique path between any two components within a circuit, etc.) described at the end of Section 2.2.2.

2.5. Persistence Strategy

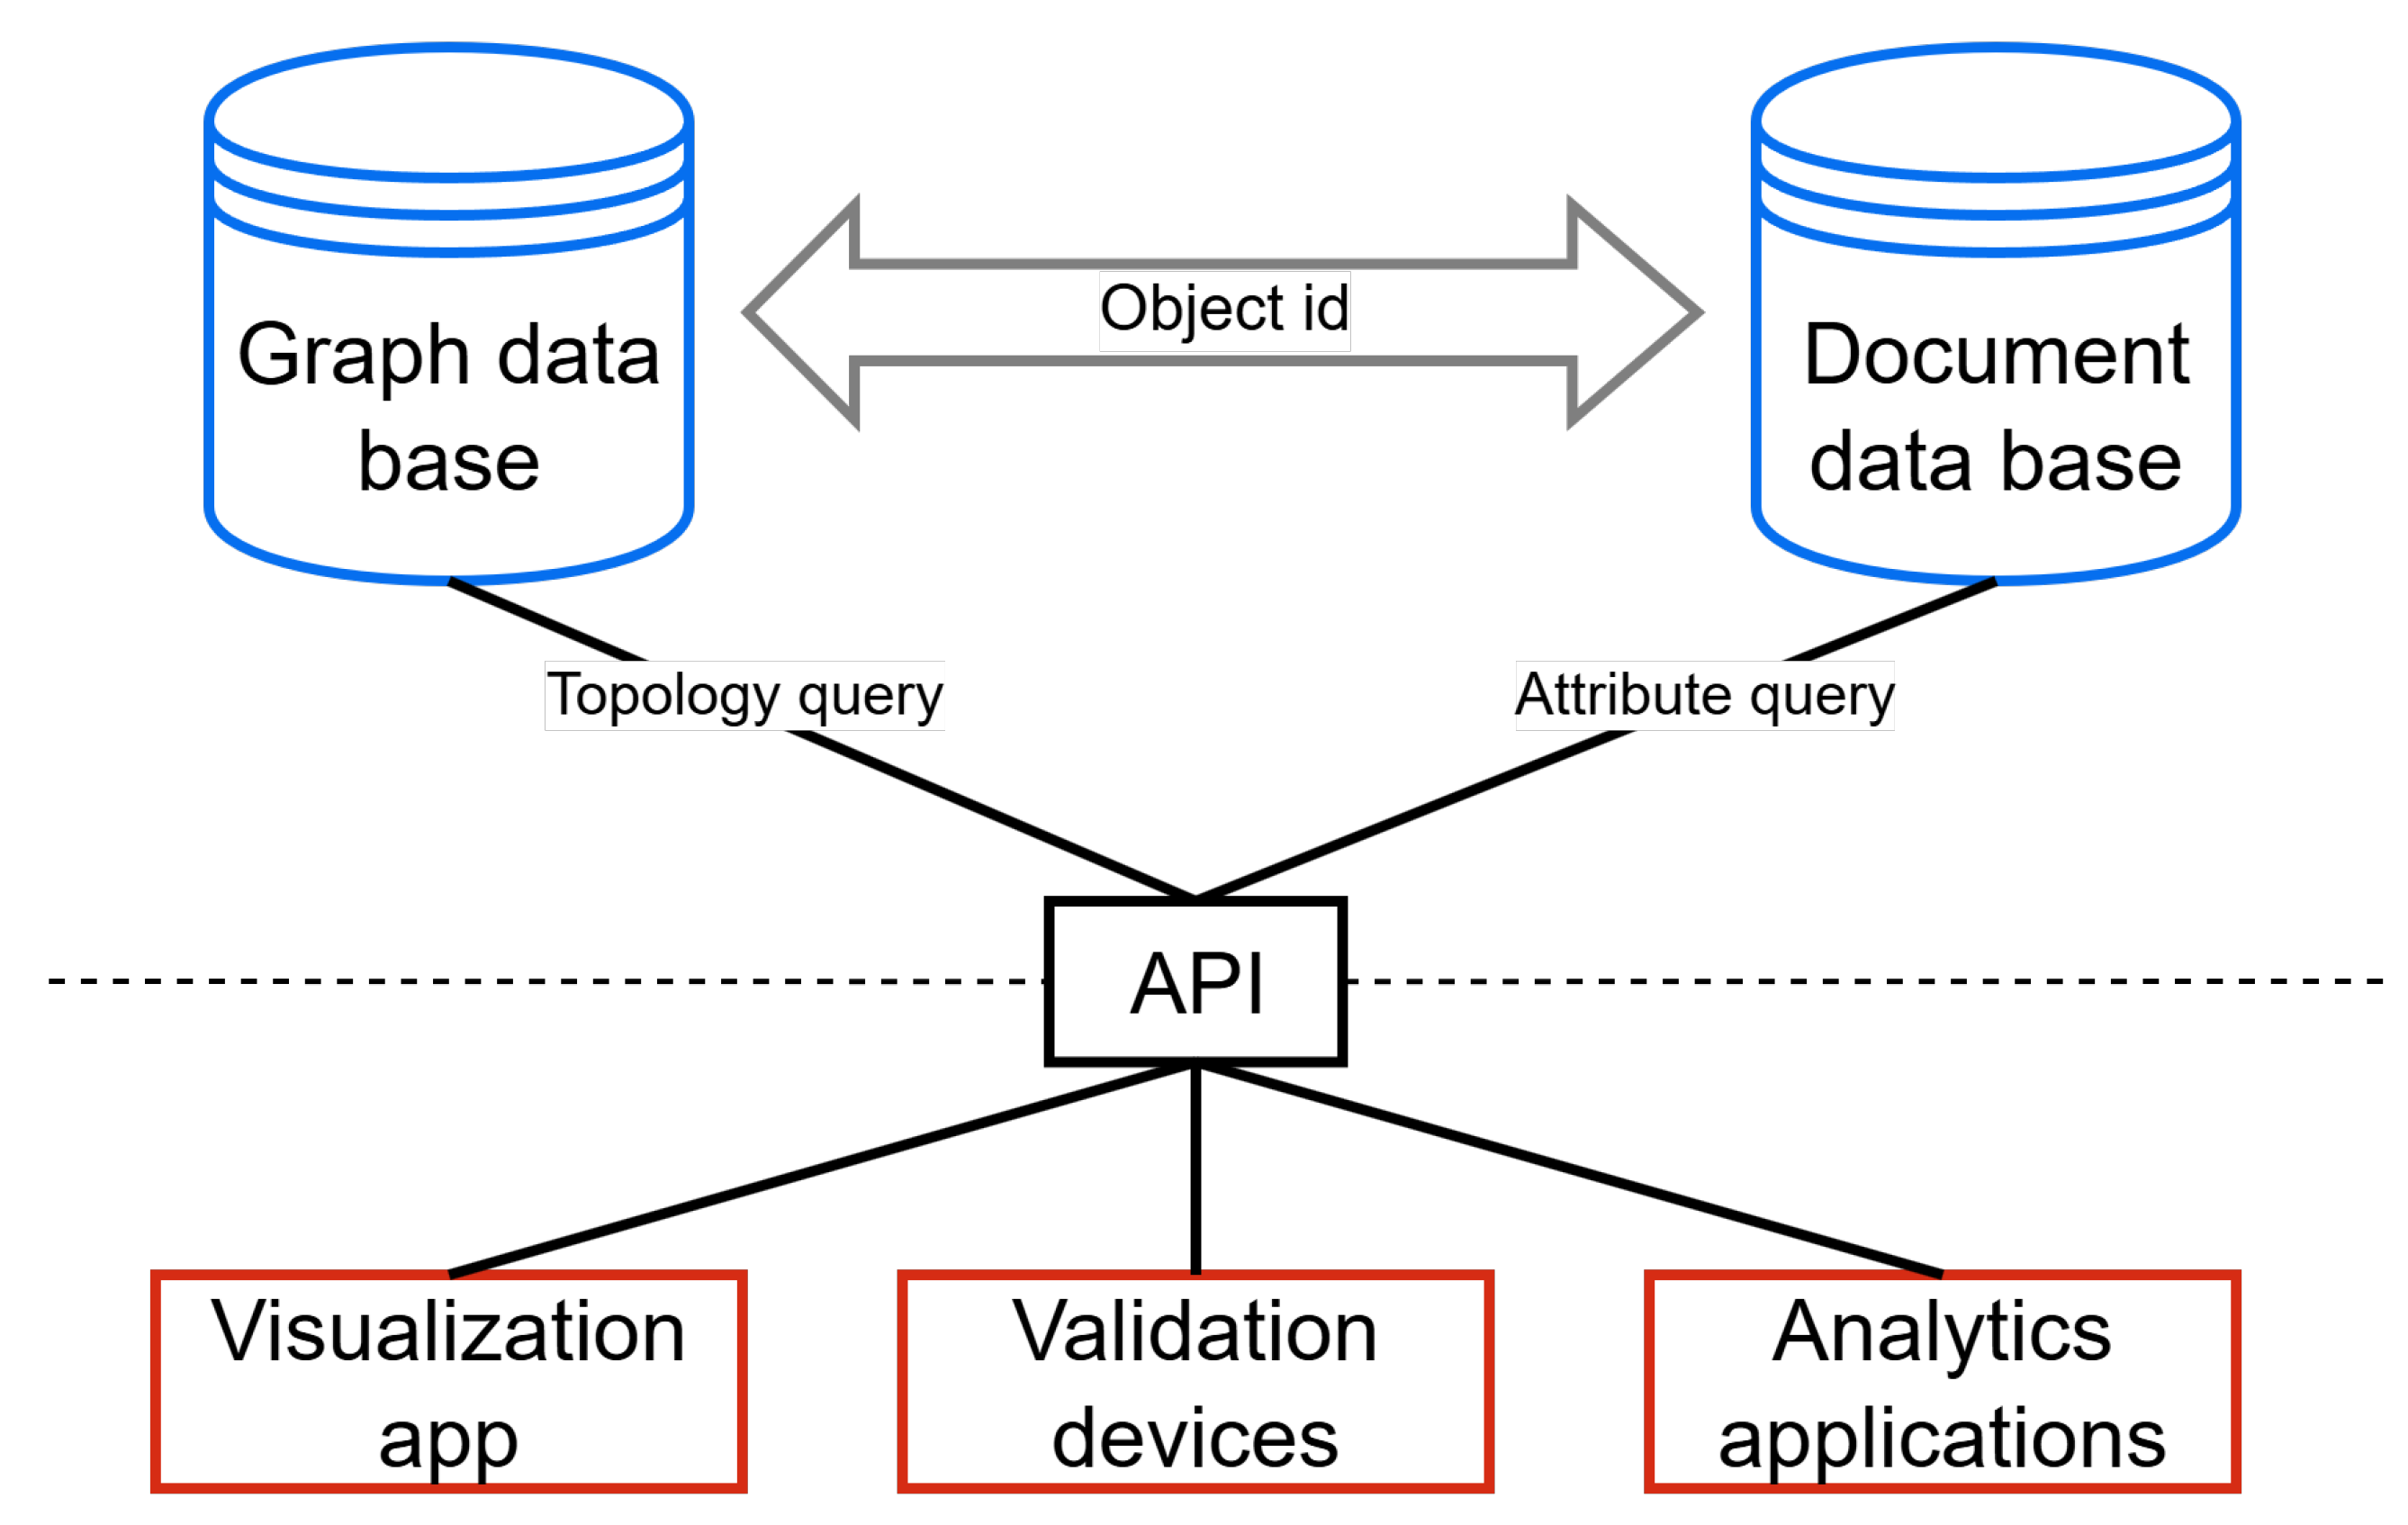
The model lives in a dual-store architecture that separates heavy, attribute-rich payloads from lightweight, high fan-out relationships. The architecture is shown in Figure 5.

2.5.1. Document Store

Every domain artefact—component, wire, splice, circuit, etc.—is serialised as a JSON document and kept in a schemaless, non-relational database (e.g., MongoDB). The document bears the master identifier _id plus the full set of immutable and mutable attributes: part number, gauge, colour, connector series, design notes, timestamps, audit metadata, and so on. Because documents are stored once and shared by all graph layers, attribute updates never require touch-ups in the graph itself.

2.5.2. Graph Store

Topological information—“who touches whom and on what layer”—is held in a dedicated property graph built with networkx. Although networkx is an in-memory library rather than a server-side DBMS, it was chosen for its maturity, rich algorithmic arsenal and friction-less integration with Python-based engineering workflows.
Every node in the graph carries a minimal, self-sufficient descriptor:
{
  "doc_id" : <Mongo _id>,   % foreign key to the document store
  "layer"  : "WIRING" | "ACCESS",
  "kind"   : "Wire" | "Component" | "Path" | ... ,
  "name"   : <human-readable label>
}
Edges remain semantically simple—mere connects relations—and therefore, need only the default identifier pair ( u , v ) .

2.5.3. Multi-Layer Workaround

Because networkx does not provide explicit multi-layer graphs, the layer attribute serves as a logical partition key. Algorithms that operate on a single tier invoke G.subgraph([ n for n,d in G.nodes(data=True) if d["layer"] == "WIRING"]) to obtain a virtual view, while cross-layer traversals simply ignore that filter.

2.5.4. Durability and Exchange

At checkpoint time the graph is serialised to portable GraphML or JSON-Graph files and committed to the same object store that hosts the JSON documents; this guarantees atomic snapshots of both topology and payload. If future scalability demands a server-side engine, the very same node and edge schema can be migrated losslessly to Neo4j, ArangoDB or JanusGraph because all domain semantics already reside in node properties rather than in bespoke edge types.
The resulting arrangement delivers the best of both worlds: the document store handles bulky, evolving attribute sets with indexed queries, while the in-memory graph gives engineers immediate access to traversal, path-finding and analytics routines without the impedance mismatch of a remote graph server.

2.5.5. Granularity per Vehicle Model and Release

A separate graph is produced for every vehicle model and for every official engineering release of that model. All of these graphs point to the same document store: parts that are common across several vehicles (e.g., a standard fuse or connector) are stored only once and referenced by their id. If a component differs between models or releases, an additional document, with a distinct revtag or a new id is created, and only the affected graphs link to it. This separation allows part reuse, clean versioning of engineering changes and straightforward diffing between iterations without data duplication or cross-graph dependencies.

2.5.6. Access and Version Control

At present, every JSON or GraphML package is generated from the company’s official engineering documentation, and the revision code printed on the source document is copied unchanged to the exported files. Suppliers must reference that code in their own deliveries and exchange data through the controlled repositories mandated by company standards; any change; however, small, must be released under a new revision identifier, guaranteeing traceability and preventing silent tampering. Looking ahead, the objective is to replace document-centric workflows with a fully digital thread in which the JSON/GraphML artefacts themselves become the primary record. Each update will follow a semantic versioning policy, will pass an automated rule set that checks schema compliance and topological consistency, and will be accepted into the corporate repository only once it has been cryptographically signed by the build pipeline and published under the access rules defined in the same governance guideline. This roadmap preserves the existing discipline of supplier conformance while adding machine-readable version control, systematic data validation and end-to-end integrity protection for the Industry 4.0/5.0 ecosystem.

2.6. Validation

Validation is decentralised: every artefact store owns the business logic required to vet the objects it contains. The rationale is two-fold: (i) attribute semantics belong to the domain object itself, not to a global supervisor, and (ii) new object types can be introduced without touching a monolithic validator.

2.6.1. Object-Local Checks (Inside the Artefact Store)

Each store exposes a validate() method that iterates over its documents and enforces the object-specific rules declared in the domain model. For instance:
  • Wire documents verify it has an attribute name and points to two valid endpoints.
  • ConnectorPin documents confirm that cavitynumber is unique within a connector family.
  • Component documents check that every exported pin appears in the pin list.
A document that fails its local rules is rejected before it can be referenced by any graph node.

2.6.2. Contextual Checks on Circuit Objects

Circuits are special because their invariants depend on the scope of the graph that references them.
  • Platform graph (all buildable variants). A circuit may contain multiple alternative paths between the same pair of components provided that each path belongs to a different build configuration. No restriction is placed on the degree of a ComponentPin; forks for optional equipment are legal.
  • Single-vehicle graph (concrete VIN). The rules tighten considerably:
    (a)
    each ComponentPin and ConnectorPinmust terminate in exactly one Connection or wire
    deg ( n ) = 1 ;
    (b)
    at most one Path may link any two components within the same circuit;
    (c)
    no dangling wires are allowed
    deg ( n ) = 0 n { Wire } .
The CircuitStore.validate(scope) method therefore accepts a parameter that signals whether the current graph represents the maximal platform or a single vehicle, and applies the corresponding rule set.

3. Results

3.1. Model Build Time

The complete platform graph for the target vehicle was assembled and serialised in only 0.7 s. No auxiliary caching or pre-computed artefacts were used.

3.2. Validation Outcome

Table 1 shows the evolution of rule compliance during the first development cycle.
The initial 8 domain-rule violations arose mostly from nomenclature mismatches and missing wire entries. Because those flawed documents were still ingested into the topology builder, they cascaded into 52 circuit-level errors (dangling wires, duplicate paths). After correcting the JSON documents and updating the wire catalogue, all counts dropped to 0, and the artefact stores as well as the per-vehicle graphs passed the full validation pipeline.

3.3. Path-Finding Accuracy

The path-generation algorithms (breadth-first search for connection traces) executed with a 100% success rate: every requested component pair received exactly one valid Path object, and no spurious loops or shortcuts were detected. Consequently, the final graph is isomorphic to the intended electrical architecture and can be rendered directly for wiring-harness production.

3.4. Summary

The dual store architecture not only achieved sub-second build times but also enabled rapid, iterative data cleansing: three validation rounds were sufficient to reach zero errors. Once the document catalogue was consistent, all downstream graph algorithms behaved deterministically, confirming that the approach faithfully represents the vehicle without manual intervention.

4. Discussion

The modelling effort reported in this work confirms that a pin-centric, node-based representation is the most faithful and operationally useful abstraction of an automotive wiring harness.

4.1. Rejected Design Alternatives

Two alternative topologies were prototyped and discarded:
(a)
Connector-level graph. Treating the entire connector as a single node forced the path-finding algorithms to route current through connectors that were electrically valid but topologically impossible when analysed at pin resolution. Moreover, a connector is merely a mechanical envelope; the electric component is the individual pin. Therefore, a pin-level graph preserves the real degrees of freedom without overloading the physical abstraction.
(b)
Edges for wires and connections. Modelling wires and crimped connections as edges would be semantically correct—each wire links exactly two pins—but it prevents the graph from expressing higher-layer dependencies. By promoting wires and connections to first-class nodes, their state can be referenced by superordinate objects (sub-circuits, production tasks), allowing a fault in a single wire to cascade automatically to every component that relies on it.

4.2. Role of the Connection Object

Although a connection is not a tangible part, its explicit presence in the model captures a crucial physical event: the creation of electrical continuity between two conductors. The object carries attributes such as station and operator, which are indispensable for manufacturing analytics and continuous-improvement programmes. Modelling one connection per pin—rather than one per multi-pin connector—retains the granularity required to isolate quality issues and to schedule re-work effectively.

4.3. Comparison with Related Work

Earlier studies [14,15,25] concentrate on the geometric or schematic representation of harnesses—typically a 3-D CAD model or a flattened wiring diagram. Our solution goes further: it enables the design and implementation of wiring-aware intelligent systems. Because every pin, wire, connection and attribute is captured in a graph governed by complex-systems principles, upstream software (diagnostics, predictive maintenance, digital twins) can reason about the real electrical relationships inside the vehicle instead of treating the harness as an opaque black box.
In contrast with established commercial tools such as Arcadia, EPLAN Harness proD, Zuken E3 Series, RapidHarness and Siemens Capital, the platform proposed in this work has been engineered as a machine-oriented back-end rather than a design-office desktop application. It is conceived as research infrastructure for achieving on-process validation, where the shop-floor devices must understand the product structure automatically and in real-time; this requirement rules out the use of off-the-shelf CAD suites because of their vendor-specific data languages, deployment hurdles and licence or partnership constraints.
Key advantages of the proposed solution:
  • Dual-store persistence (graph + document) A single JSON definition of each component is referenced from multiple wiring graphs, so the system captures several vehicle-specific topologies while still honouring the “single-source-of-truth” principle no attribute duplication, yet full configurability across programmes.
  • Fine-grained data model Pin-, path- and circuit-level entities are addressable through an open REST schema, making it straightforward to add future layers of complexity such as in-vehicle information networks, diagnostic flows or logistics routes.
  • Native graph representation Because the wiring lives in a property graph, the full ecosystem of graph algorithms becomes directly available (e.g., path-finding, centrality, community detection). These capabilities support diverse production tasks ranging from connector heat-map analysis to automated change-impact assessment.
  • Deployment neutrality Running on standard open-source stacks (document store + graph library + REST gateway) removes dependence on vendor runtimes, proprietary plug-ins or per seat licences, facilitating integration into existing MES and IIoT platforms.
Taken together, these qualities position the platform as a lightweight yet extensible data backbone that bridges design data with shop floor validation and future analytics layers functionality that current commercial CAD environments were never intended to provide.

4.4. Future Work

Because the graph is already partitioned by layer, it can be augmented with communication and IoT overlays as explored in [26,27]. Linking the physical harness to higher-level protocol models will enable end-to-end dependability analyses and predictive maintenance strategies across the entire vehicle network.
Moreover, we plan to embed the resulting multilayer graph into a Graph Neural Network (GNN) pipeline so that structural and temporal patterns can be learned directly from the wiring topology. Following the approach demonstrated in [16,17,18], the model will be trained to flag both functional anomalies (e.g., unexpected resistance increases, intermittent opens) and cyber security intrusions that manifest as abnormal message paths. By coupling the GNN’s inference engine with the live dual-store back-end, the system could raise real-time alerts and recommend corrective actions while the vehicle is still on the production line or in service.
In summary, the chosen abstraction—pins, wires and connections as nodes, all tied together by a dual-store persistence layer—achieves electrical accuracy, manufacturing relevance and algorithmic tractability simultaneously, thereby meeting the requirements of both design engineers and plant operators.

5. Conclusions

5.1. Achievements

The proposed pin-centric, node-based graph faithfully reproduces the wiring of highly complex vehicles while remaining extensible to any number of models and revisions. It establishes a digital data standard that suppliers can already consume and has been deployed in multiple launch programmes at the Almussafes manufacturing plant, where it supports workload mitigation, visualisation of harness topology and early detection of design errors. These outcomes satisfy the objectives stated in Section 1.4.

5.2. Limitations and Improvement Opportunities

  • Implementation language. The end-to-end toolchain is written in Python for maximum development velocity, but compute-intensive parts (graph traversal, validation scans) could achieve lower latency and a smaller memory footprint if ported to C++ or Rust.
  • Persistence strategy complexity. The dual-store architecture (shared document DB + per-model graph files) adds operational complexity compared with a single monolithic database. However, its isolation of topology from attributes proved crucial for supporting dozens of car lines without data duplication; alternative stores may offer higher raw throughput but at the cost of flexibility.
  • Quantitative impact data. Although the model has been used in production, quantitative metrics—cycle-time reduction, first-time-through gains—were not available at the time of writing. Qualitative feedback nonetheless confirms its value in launch activities.

5.3. Industrial Relevance

Unlike conventional 3D or schematic representations, our graph enables wiring-aware intelligent systems: downstream software can query the electrical relationships between pins, wires and connections and act on that knowledge. No previous publication offers this level of semantic awareness, especially under a complex systems framework.

5.4. Future Work

The present data model should be viewed as the foundation for a new generation of self-aware manufacturing processes presented on Section 1. Building on the fine-grained, wiring-aware graph we plan the following:
(a)
Embed real-time validators on the assembly line so that each harness is checked against the graph as it is built, enabling immediate defect detection;
(b)
Couple the validator with guided repair logic that identifies the exact pin, wire or connection node that violates the model and prescribes the corrective action to operators or robots;
(c)
Stream validation events back into the graph as live attributes, closing the loop between digital twin and physical product and allowing the system to learn from recurring fault patterns; and
(d)
Integrate the wiring graph with higher-level IoT frameworks, so that plant MES and predictive-maintenance modules become context-aware and can schedule repairs or rebalance workloads autonomously.
These extensions will turn the current static representation into an active substrate for in-line validation, closed-loop repair and ultimately self-optimising production.
In summary, despite the noted limitations, the project delivers a scalable, wiring-aware data model that already streamlines launch operations and lays the groundwork for future error-detection and smart-factory applications.

Author Contributions

Conceptualization, A.B.S.; Methodology, A.B.S.; Investigation, A.B.S.; Project administration, J.P.R.; Resources, C.Á.B. and J.P.R.; Software, A.B.S.; Supervision, J.F.B.N., C.Á.B. and J.P.R.; Validation, L.R.M.; Writing—original draft, A.B.S.; Writing—review and editing, J.F.B.N., L.R.M. and C.Á.B. All authors have read and agreed to the published version of the manuscript.

Funding

This article was carried out with the financial support of the Generalitat Valenciana under the Specific Collaboration Agreement between the Universitat Politècnica de València and the Fundación para el Desarrollo y la Innovación (FDI).

Data Availability Statement

Dataset available on request from the authors.

Conflicts of Interest

Authors Luis Ruiz Matallana, Carlos Álvarez Baldo and Joan Porcar Rodado were employed by Ford Motor Company. The remaining authors declare that the research was conducted in the absence of any commercial or financial relationships that could be construed as a potential conflict of interest.

References

  1. Bordel, B.; Alcarria, R.; de la Cal Hacar, G.; Valladares, T.R. Efficient and Accountable Industry 5.0 Production Scheduling Mechanism for Mass Customization Scenarios. In Proceedings of the 15th International Conference on Ubiquitous Computing & Ambient Intelligence (UCAmI 2023), Riviera Maya, Mexico, 28–30 November 2023; Bravo, J., Urzáiz, G., Eds.; Springer: Cham, Switzerland, 2023; pp. 44–56. [Google Scholar]
  2. Pizoń, J.; Gola, A. The Meaning and Directions of Development of Personalized Production in the Era of Industry 4.0 and Industry 5.0. In Innovations in Industrial Engineering II; Machado, J., Soares, F., Trojanowska, J., Ivanov, V., Antosz, K., Ren, Y., Manupati, V.K., Pereira, A., Eds.; Springer: Cham, Switzerland, 2023; pp. 1–13. [Google Scholar]
  3. Maddikunta, P.K.R.; Pham, Q.V.; Prabadevi, B.; Deepa, N.; Dev, K.; Gadekallu, T.R.; Ruby, R.; Liyanage, M. Industry 5.0: A survey on enabling technologies and potential applications. J. Ind. Inf. Integr. 2022, 26, 100257. [Google Scholar] [CrossRef]
  4. Xu, X.; Lu, Y.; Vogel-Heuser, B.; Wang, L. Industry 4.0 and Industry 5.0—Inception, conception and perception. J. Manuf. Syst. 2021, 61, 530–535. [Google Scholar] [CrossRef]
  5. Akundi, A.; Euresti, D.; Luna, S.; Ankobiah, W.; Lopes, A.; Edinbarough, I. State of Industry 5.0—Analysis and identification of current research trends. Appl. Syst. Innov. 2022, 5, 27. [Google Scholar] [CrossRef]
  6. Bründl, P.; Stoidner, M.; Nguyen, H.G.; Baechler, A.; Franke, J. Challenges and Opportunities of Software-Based Production Planning and Control for Engineer-to-Order Manufacturing. In Advances in Production Management Systems. Production Management Systems for Responsible Manufacturing, Service, and Logistics Futures; Alfnes, E., Romsdal, A., Strandhagen, J.O., von Cieminski, G., Romero, D., Eds.; Springer: Cham, Switzerland, 2023; pp. 67–79. [Google Scholar]
  7. Feichtinger, K.; Meixner, K.; Rinker, F.; Koren, I.; Eichelberger, H.; Heinemann, T.; Holtmann, J.; Konersmann, M.; Michael, J.; Neumann, E.M.; et al. Industry Voices on Software Engineering Challenges in Cyber-Physical Production Systems Engineering. In Proceedings of the 2022 IEEE 27th International Conference on Emerging Technologies and Factory Automation (ETFA), Stuttgart, Germany, 6–9 September 2022; pp. 1–8. [Google Scholar] [CrossRef]
  8. Strogatz, S.H. Exploring complex networks. Nature 2001, 410, 268–276. [Google Scholar] [CrossRef]
  9. Pagani, G.A.; Aiello, M. The Power Grid as a complex network: A survey. Phys. A Stat. Mech. Its Appl. 2013, 392, 2688–2700. [Google Scholar] [CrossRef]
  10. Cuadra, L.; Salcedo-Sanz, S.; Del Ser, J.; Jiménez-Fernández, S.; Geem, Z.W. A critical review of robustness in power grids using complex networks concepts. Energies 2015, 8, 9211–9265. [Google Scholar] [CrossRef]
  11. Pagani, G.A.; Aiello, M. Power grid complex network evolutions for the smart grid. Phys. A Stat. Mech. Its Appl. 2014, 396, 248–266. [Google Scholar] [CrossRef]
  12. Chu, C.C.; Iu, H.H.C. Complex networks theory for modern smart grid applications: A survey. IEEE J. Emerg. Sel. Top. Circuits Syst. 2017, 7, 177–191. [Google Scholar] [CrossRef]
  13. Arianos, S.; Bompard, E.; Carbone, A.; Xue, F. Power grid vulnerability: A complex network approach. Chaos Interdiscip. J. Nonlinear Sci. 2009, 19, 013119. [Google Scholar] [CrossRef] [PubMed]
  14. Pokorádi, L. Methodolody of Advanced Graph Model-based Vehicle Systems’ Analysis. In Proceedings of the 2018 IEEE 18th International Symposium on Computational Intelligence and Informatics (CINTI), Budapest, Hungary, 21–22 November 2018; pp. 000325–000328. [Google Scholar] [CrossRef]
  15. Weise, J.; Benkhardt, S.; Mostaghim, S. Graph-based multi-objective generation of customised wiring harnesses. In Proceedings of the Genetic and Evolutionary Computation Conference Companion, GECCO ’19, Prague, Czech Republic, 13–17 July 2019; pp. 407–408. [Google Scholar] [CrossRef]
  16. Wu, Z.; Pan, S.; Chen, F.; Long, G.; Zhang, C.; Philip, S.Y. A comprehensive survey on graph neural networks. IEEE Trans. Neural Netw. Learn. Syst. 2020, 32, 4–24. [Google Scholar] [CrossRef] [PubMed]
  17. Liao, W.; Bak-Jensen, B.; Pillai, J.R.; Wang, Y.; Wang, Y. A review of graph neural networks and their applications in power systems. J. Mod. Power Syst. Clean Energy 2021, 10, 345–360. [Google Scholar] [CrossRef]
  18. Owerko, D.; Gama, F.; Ribeiro, A. Optimal power flow using graph neural networks. In Proceedings of the ICASSP 2020—2020 IEEE International Conference on Acoustics, Speech and Signal Processing (ICASSP), Barcelona, Spain, 4–8 May 2020; pp. 5930–5934. [Google Scholar]
  19. Basic, F.; Gaertner, M.; Steger, C. Towards Trustworthy NFC-based Sensor Readout for Battery Packs in Battery Management Systems. In Proceedings of the 2021 IEEE International Conference on RFID Technology and Applications (RFID-TA), Delhi, India, 6–8 October 2021; pp. 285–288. [Google Scholar] [CrossRef]
  20. Wang, Q.A.; Zhang, C.; Ma, Z.G.; Jiao, G.Y.; Jiang, X.W.; Ni, Y.Q.; Wang, Y.C.; Du, Y.T.; Qu, G.B.; Huang, J. Towards long-transmission-distance and semi-active wireless strain sensing enabled by dual-interrogation-mode RFID technology. Struct. Control Health Monit. 2022, 29, e3069. [Google Scholar] [CrossRef]
  21. Ran, S.C.; Wang, Q.A.; Wang, J.F.; Ni, Y.Q.; Guo, Z.X.; Luo, Y. A Concise State-of-the-Art Review of Crack Monitoring Enabled by RFID Technology. Appl. Sci. 2024, 14, 3213. [Google Scholar] [CrossRef]
  22. Kaur, G.; Kamboj, G. RFID based Intelligent Transport System with RSU Communication for Emergency Vehicles in Urbanization. In Proceedings of the 2022 4th International Conference on Inventive Research in Computing Applications (ICIRCA), Coimbatore, India, 21–23 September 2022; pp. 333–338. [Google Scholar] [CrossRef]
  23. Le, V.V.; Be, N.T.; Dang, D.H. On Automatic Generation of Executable Domain Models for Domain-Driven Design. In Proceedings of the 2023 15th International Conference on Knowledge and Systems Engineering (KSE), Ha Noi, Vietnam, 18–20 October 2023; pp. 1–6. [Google Scholar]
  24. Cao, H.; Li, J. Design and implementation of design platform for automatic generated micro-application system based on domain model. In Proceedings of the Sixth International Conference on Computer Information Science and Application Technology (CISAT 2023), Hangzhou, China, 26–28 May 2023; Volume 12800, pp. 1593–1599. [Google Scholar]
  25. Tharma, R.; Winter, R.; Eigner, M. An approach for the implementation of the digital twin in the automotive wiring harness field. In Proceedings of the DS 92: Proceedings of the DESIGN 2018 15th International Design Conference, Dubrovnik, Croatia, 21–24 May 2018; pp. 3023–3032. [Google Scholar]
  26. Modarresi, A.; Symons, J. Modeling technological interdependency in IoT-A multidimensional and multilayer network model for smart environments. In Proceedings of the 2019 11th International Workshop on Resilient Networks Design and Modeling (RNDM), Nicosia, Cyprus, 14–16 October 2019; pp. 1–7. [Google Scholar]
  27. Wu, X.; Wang, J.; Li, P.; Luo, X.; Yang, Y. Internet of things as complex networks. IEEE Netw. 2021, 35, 238–245. [Google Scholar] [CrossRef]
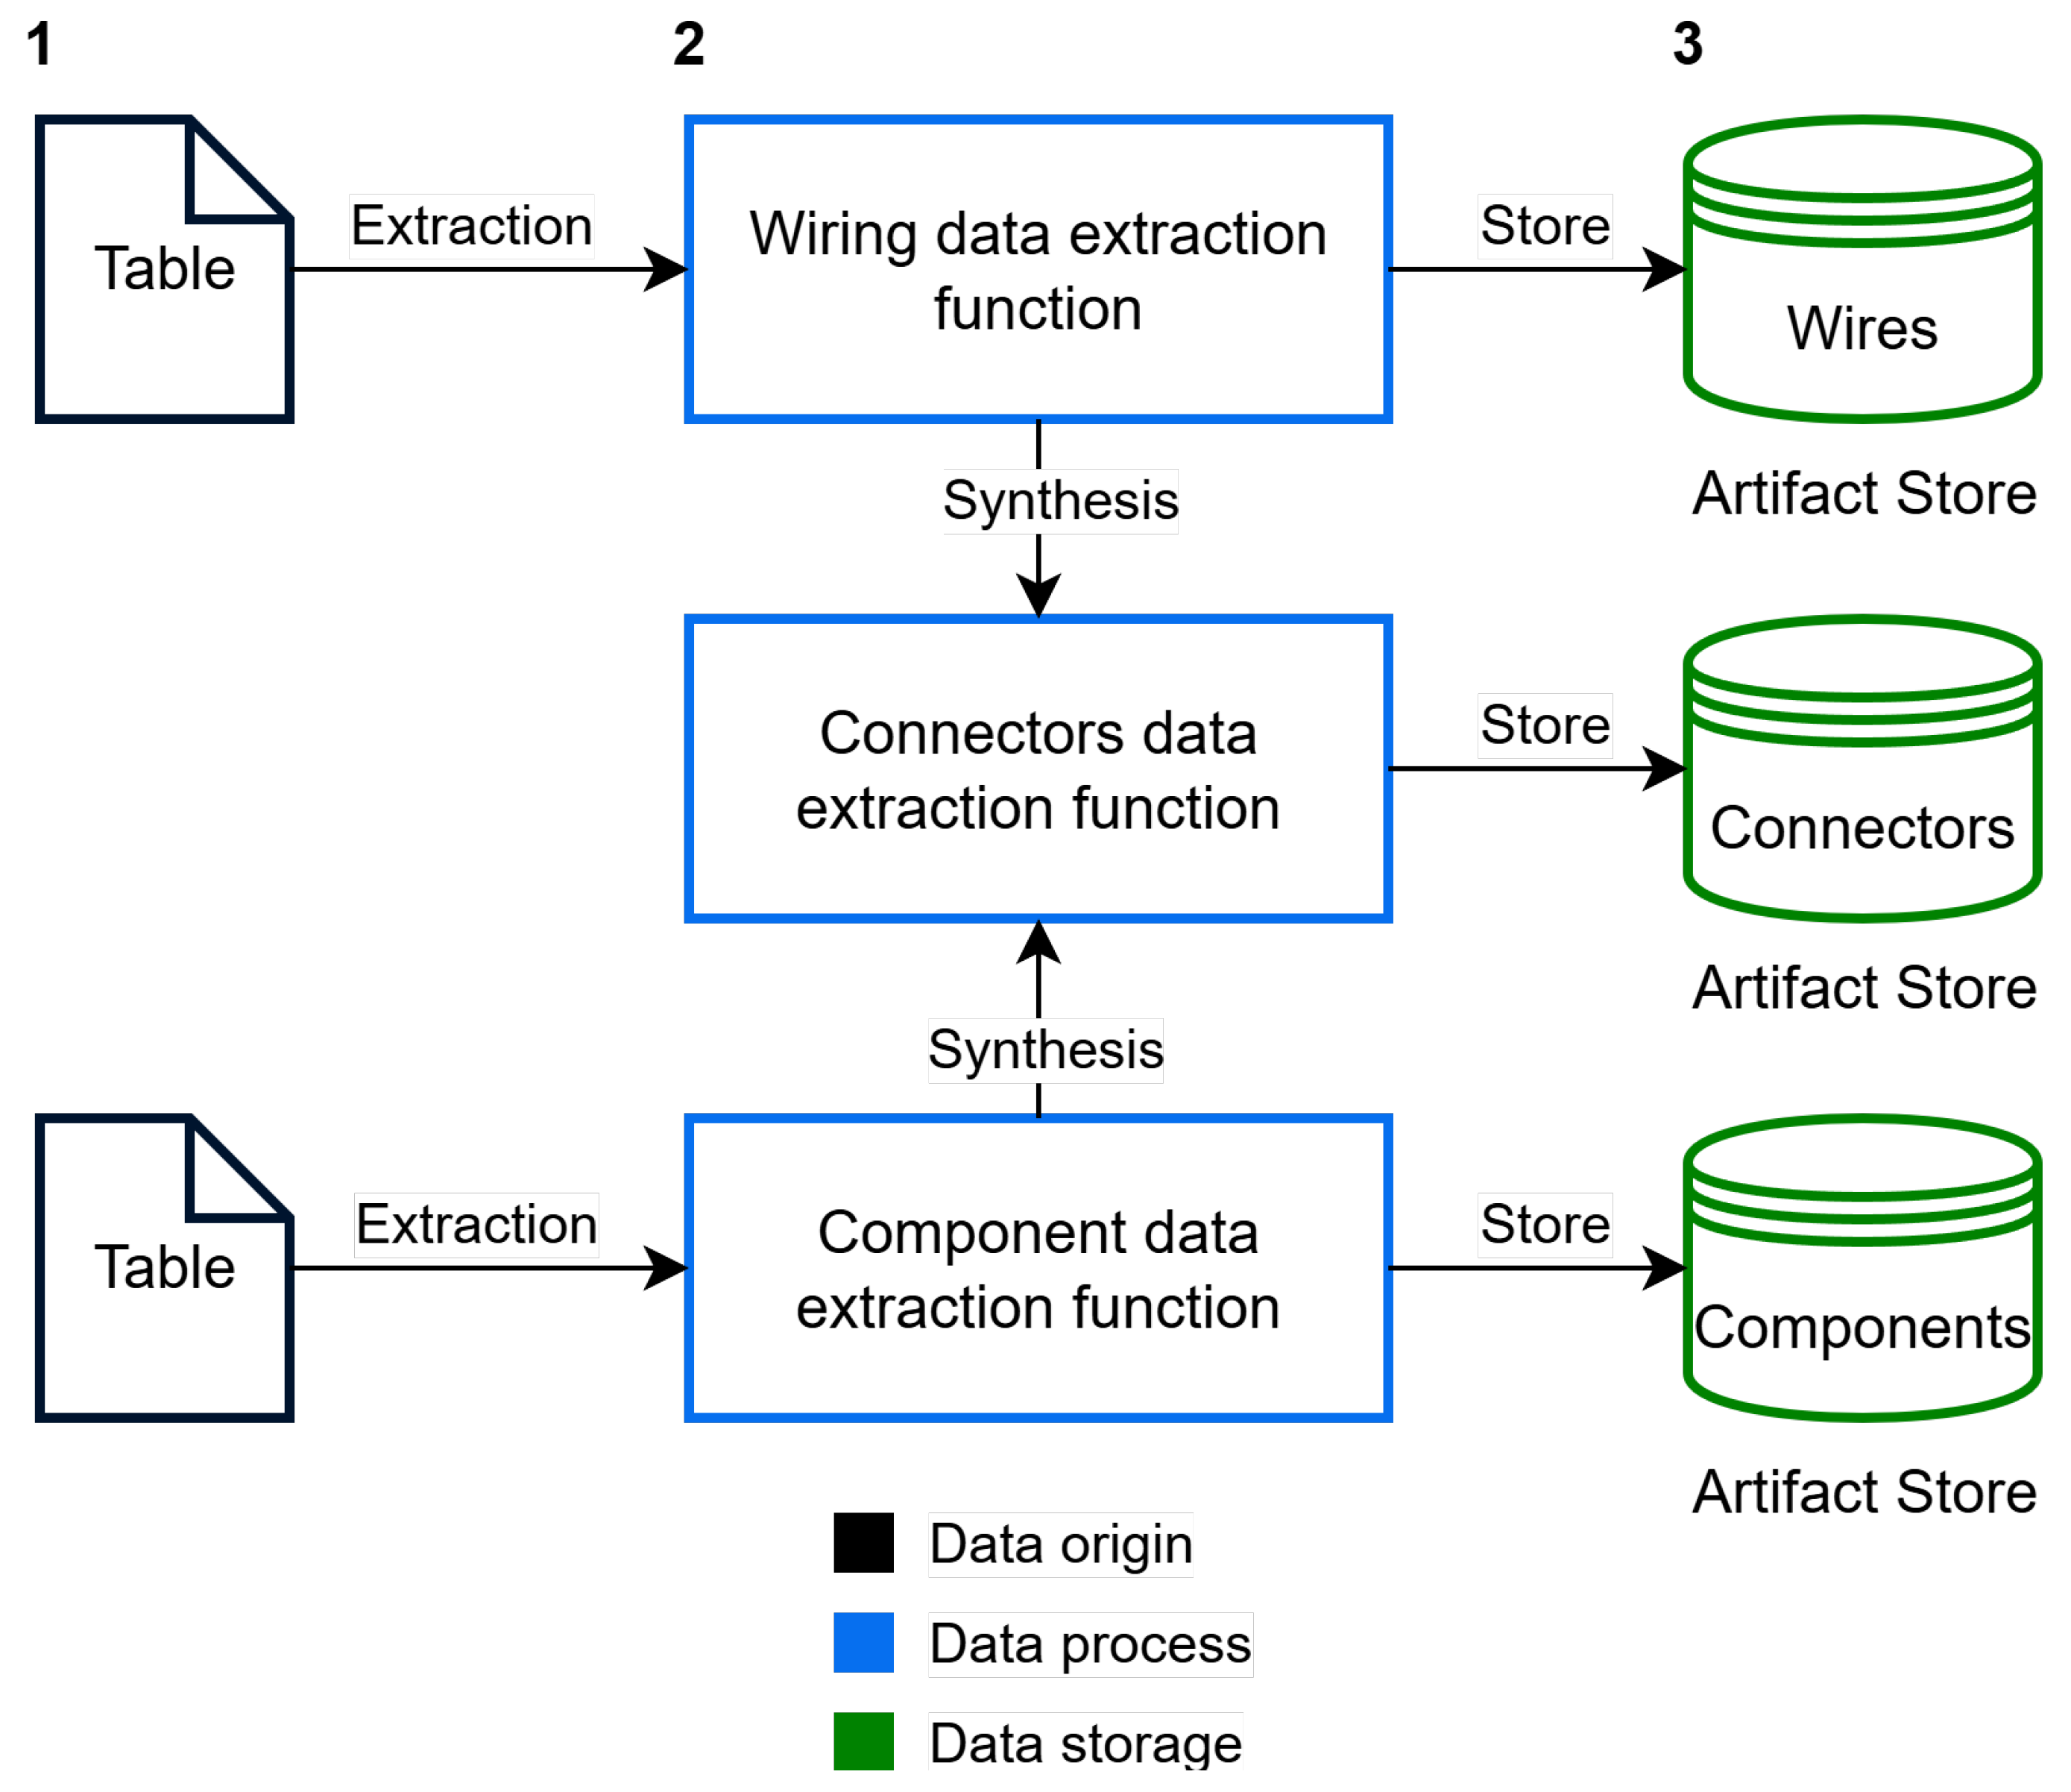
Figure 1. End -to-end data-acquisition pipeline. Step 1 (Data origin—grey tables) ingests the raw supplier spreadsheets. Step 2 (Data process—blue boxes) executes the extraction and synthesis functions that clean and normalise each domain object. Step 3 (Data storage—green cylinders) writes the validated records to their dedicated artefact stores. The arrow labels (“Extraction”, “Synthesis”, “Store”) specify the action performed as the data flow from one step to the next.
Asi 08 00134 g001
Figure 2. Cross-layer decomposition of a signal route. The single Path node (green, Access layer) aggregates the exact set of lower-layer elements that realise the connection in the physical harness: Connection nodes (red) and Pin nodes (blue) in the Wiring layer. Dashed black edges denote the inter-layer relationship that links abstract artefacts to their concrete physical counterparts; solid edges represent ordinary intra-layer relationships.
Asi 08 00134 g002
Figure 3. Access-layer view of a functional circuit. The grey rounded rectangle encloses all artefacts that belong to a single circuit (“Circuit 1”, blue outline). Within that container three Path nodes (green outline) specify the pair-wise signal routes that link the surrounding ECU components.
Asi 08 00134 g003
Figure 4. Flow diagram of the graph-modelling algorithm: seed selection, guided DFS with cycle detection, path registration, and on-the-fly synthesis of Connection nodes.
Asi 08 00134 g004
Figure 5. Dual-store architecture and data-access workflow. The graph data store on the left contains all topological relationships, whereas the document-data store on the right keeps the full attribute payload. Both repositories share a common primary key (Object id), represented by the double-headed synchronisation arrow, enabling bidirectional look-ups between attributes and topology. A central API layer (blue) mediates every request: topology queries are routed to the graph store, attribute queries to the document store. The resulting data streams feed three shop-floor services—visualisation, in-line validation devices and analytics applications—without duplicating information.
Asi 08 00134 g005
Table 1. Validation statistics across successive iterations.
Domain-Rule ViolationsCircuit ErrorsBuild Status
Iteration 1852failed
Iteration 300passed
Disclaimer/Publisher’s Note: The statements, opinions and data contained in all publications are solely those of the individual author(s) and contributor(s) and not of MDPI and/or the editor(s). MDPI and/or the editor(s) disclaim responsibility for any injury to people or property resulting from any ideas, methods, instructions or products referred to in the content.