Article

Development of a Mobile Health Monitoring and Alert Application for Agricultural Workers

Department of Mechanical Engineering, Northern Illinois University, DeKalb, IL 60115, USA
*
Author to whom correspondence should be addressed.
Appl. Syst. Innov. 2025, 8(5), 133; https://doi.org/10.3390/asi8050133
Submission received: 27 July 2025 / Revised: 4 September 2025 / Accepted: 10 September 2025 / Published: 15 September 2025
(This article belongs to the Section Medical Informatics and Healthcare Engineering)

Abstract

The health and safety of agricultural workers are critical concerns due to their exposure to extreme environmental conditions, physically demanding tasks, and limited access to immediate medical assistance. This study presents the design and development of a novel smartphone application that integrates multiple wearable physiological sensors—a fingertip pulse oximeter, a skin patch thermometer, and an inertial measurement unit (IMU)—via Bluetooth Low Energy (BLE) technology for real-time health monitoring and alert notifications. Unlike many existing platforms, the proposed system offers direct access to raw sensor data, modular multi-sensor integration, and a scalable software framework based on the Model–View–ViewModel (MVVM) architecture with Jetpack Compose for a responsive user interface. Experimental results demonstrated stable BLE connections, accurate extraction of oxygen saturation, heart rate, body temperature, and trunk inclination data, as well as reliable real-time alerts when the system detects anomalies based on predetermined thresholds. The system also incorporates automatic reconnection mechanisms to maintain continuous monitoring. Beyond agriculture, the proposed framework can be adapted to broader occupational safety domains, with future improvements focusing on additional sensors, redundant sensing, cloud-based data storage, and large-scale field validation.

1. Introduction

1.1. Motivation and Objective

The health and safety of agricultural workers are critical concerns due to their exposure to extreme environmental conditions, physically demanding tasks, and limited access to immediate medical assistance. Musculoskeletal disorders and fatigue-related incidents continue to contribute to high rates of occupational chronic pain and reduced work efficiency [1]. Climate change further exacerbates these risks, with rising temperatures leading to increased heat-related illnesses and fatalities [2]. In recent years, wearable sensor systems and mobile health (mHealth) applications have emerged as promising solutions, offering advantages such as real-time physiological data collection, portability, and improved accessibility through wireless communication [3,4,5,6]. Continuous monitoring and immediate feedback mechanisms are therefore essential to prevent injuries and enhance safety. However, many existing systems still face notable limitations, including reliance on proprietary platforms that restrict raw data access, difficulties in integrating multiple heterogeneous sensors, and short wireless communication ranges. These challenges highlight the need for a scalable and flexible health-monitoring solution tailored to the specific conditions of agricultural workers.
In this paper, we introduce a real-time health monitoring and alert system tailored for agricultural workers. Beyond data collection, the system includes an alert mechanism that triggers alerts when health metrics exceed predetermined thresholds, allowing for immediate corrective actions. Since the reliability and effectiveness of this system depend on Bluetooth Low Energy (BLE) communication, a key technology in the Internet of Things (IoT), we place particular emphasis on managing multiple BLE connections simultaneously. Ultimately, this research aims to reduce heat-related illnesses and musculoskeletal injuries among agricultural workers through a smartphone-based monitoring system.

1.2. Literature Review

The use of wearable sensors and wireless communication technologies for health monitoring has advanced significantly in recent years. Kim et al. fabricated a wearable sensor with a BLE module so it can transmit vital health metrics such as heart rate and respiratory rate, addressing limitations like data loss and user discomfort [3]. Another health-monitoring system integrated prototype sensors with RF (radio frequency) and GSM (Global System for Mobile Communications) modules to monitor vital signs and send alerts for hazardous situations [4].
Yan et al. incorporated Classic Bluetooth into an inertial measurement unit (IMU), enabling real-time monitoring of risky movements among construction workers [5]. A framework was introduced to use multiple Classic Bluetooth connections, highlighting the importance of open data frameworks for health-monitoring applications [6].
Yadav et al. used a commercial monitoring device to continuously track critical health parameters, transmitting data in real-time to a smartphone [7]. Singh and Ricke explored the use of commercial BLE sensors, creating an open messaging protocol to obtain raw data from multiple wearable sensors [8].
Recent advancements include an IoT-enhanced ECG (electrocardiogram) system for remote cardiovascular health monitoring, with data accessible via a mobile app [9]. Another solution involved using Zigbee—a wireless communication protocol—motion sensors as a wearable device to monitor and correct posture [10]. A system using an Arduino—an open-source microcontroller development board—to continuously monitor medical data and transmit it to a cloud server was developed for elderly care [11]. Other technologies, such as Wi-Fi and Lorawan, have also been employed. Mahmud et al. used Wi-Fi for communication in a health-monitoring system [12], while Taylor and Serif explored Lorawan for remote ECG monitoring [13].
To improve comfort and long-term wear, flexible wearable sensors have advanced significantly in fabrication methods [14], non-invasive health and environmental monitoring [15], and material development [16]. At the same time, artificial intelligence (AI) has recently emerged as a powerful tool in digital healthcare, gaining increasing attention for its potential to transform health monitoring systems [17,18].
The findings from the literature review highlight that wireless technologies, particularly BLE and IoT, play a crucial role in real-time health monitoring, offering comprehensive data tracking for users and healthcare professionals. While BLE remains essential, challenges persist in developing a smartphone application (app) that can handle multiple simultaneous connections from various wearable sensors.

1.3. Contributions

To address the aforementioned challenges, this study aims to develop a real-time health monitoring and alert system for agricultural workers. The main contributions of this work are as follows:
  • We propose a modular BLE sensor framework that is capable of efficiently managing multiple simultaneous connections from heterogeneous wearable sensors.
  • The framework supports the inclusion of commercial sensor devices that often lack official API support.
  • We present a scalable Android application architecture based on the Model–View–ViewModel (MVVM), designed for ease of modification and implementation.
  • We validate the developed system through experiments conducted under simulated conditions relevant to agriculture.

2. Background

2.1. Mobile Health

Mobile health, often labeled as mHealth, has significantly enhanced healthcare by leveraging smartphones and wearable devices for real-time health monitoring and data exchange. These technologies enable communication between users and healthcare providers, improving accessibility and preventive care [19]. Wireless Body Area Networks (WBANs) play a crucial role in mHealth, consisting of sensor networks that collect and transmit physiological data such as blood pressure, heart rate, and body temperature [20]. WBANs can be wearable or implantable, enabling continuous health monitoring through a hierarchical communication structure. Data transmission for WBANs can be classified into three primary tiers [21] while our study focuses on the first tier of WBAN communication in which wearable sensors transmit data to a local device, such as a smartphone.
When integrated with mHealth platforms, wearable sensors enable real-time health tracking and can provide proactive alerts for health anomalies. These sensors form the backbone of personalized healthcare solutions, contributing to early detection and response to medical conditions [22].

2.2. Wireless Communication: Bluetooth Low Energy (BLE)

Bluetooth Low Energy (BLE) is a widely adopted protocol in WBANs due to its low power consumption and broad compatibility with smartphones. Introduced in 2010, BLE enables energy-efficient communication for continuous health monitoring in wearable devices [23]. Its protocol stack consists of three main components: controller, host, and application Layer, each responsible for distinct functions (see Figure 1a) [24]. Data transmission in BLE is structured through the Attribute Protocol (ATT), which organizes data as attributes that can be accessed by clients. The Generic Attribute Profile (GATT) further refines this structure by defining services and characteristics, ensuring organized data communication within BLE-based health monitoring systems (see Figure 1b) [24].
BLE devices operate based on the Generic Access Profile (GAP), which manages how they discover, connect, and communicate. GAP defines roles such as broadcaster, observer, peripheral, and central, playing a crucial role in secure and standardized BLE communications [23].
These concepts can be exemplified by a wearable heart-rate sensor connected to a smartphone app as follows. Using GAP, the sensor advertises its presence, and the smartphone establishes a connection. ATT structures the data as attributes, while GATT organizes these into a “Heart Rate Service” with characteristics like current and maximum heart rate. Acting as the GATT Client, the smartphone reads these values from the sensor (the GATT Server) and subscribes to updates. The coordination of GAP, ATT, and GATT enables structured, real-time communication between devices.

2.3. Mobile Application Development

Mobile health applications rely on robust development frameworks to process, visualize, and manage sensor data [25]. Android, as the most widely used mobile operating system, provides an open-source platform with diverse hardware integration support, making it suitable for BLE-based mobile app development [26].
Therefore, in our development, we used Android Studio [27], the official IDE (Integrated Development Environment) for Android apps, along with Jetpack Compose, an Android-specific UI (user interface) toolkit, to simplify UI design and enhance its responsiveness. While Kotlin and Java are the two primary programming languages for Android app development, we chose Kotlin since the Jetpack Compose requires Kotlin.
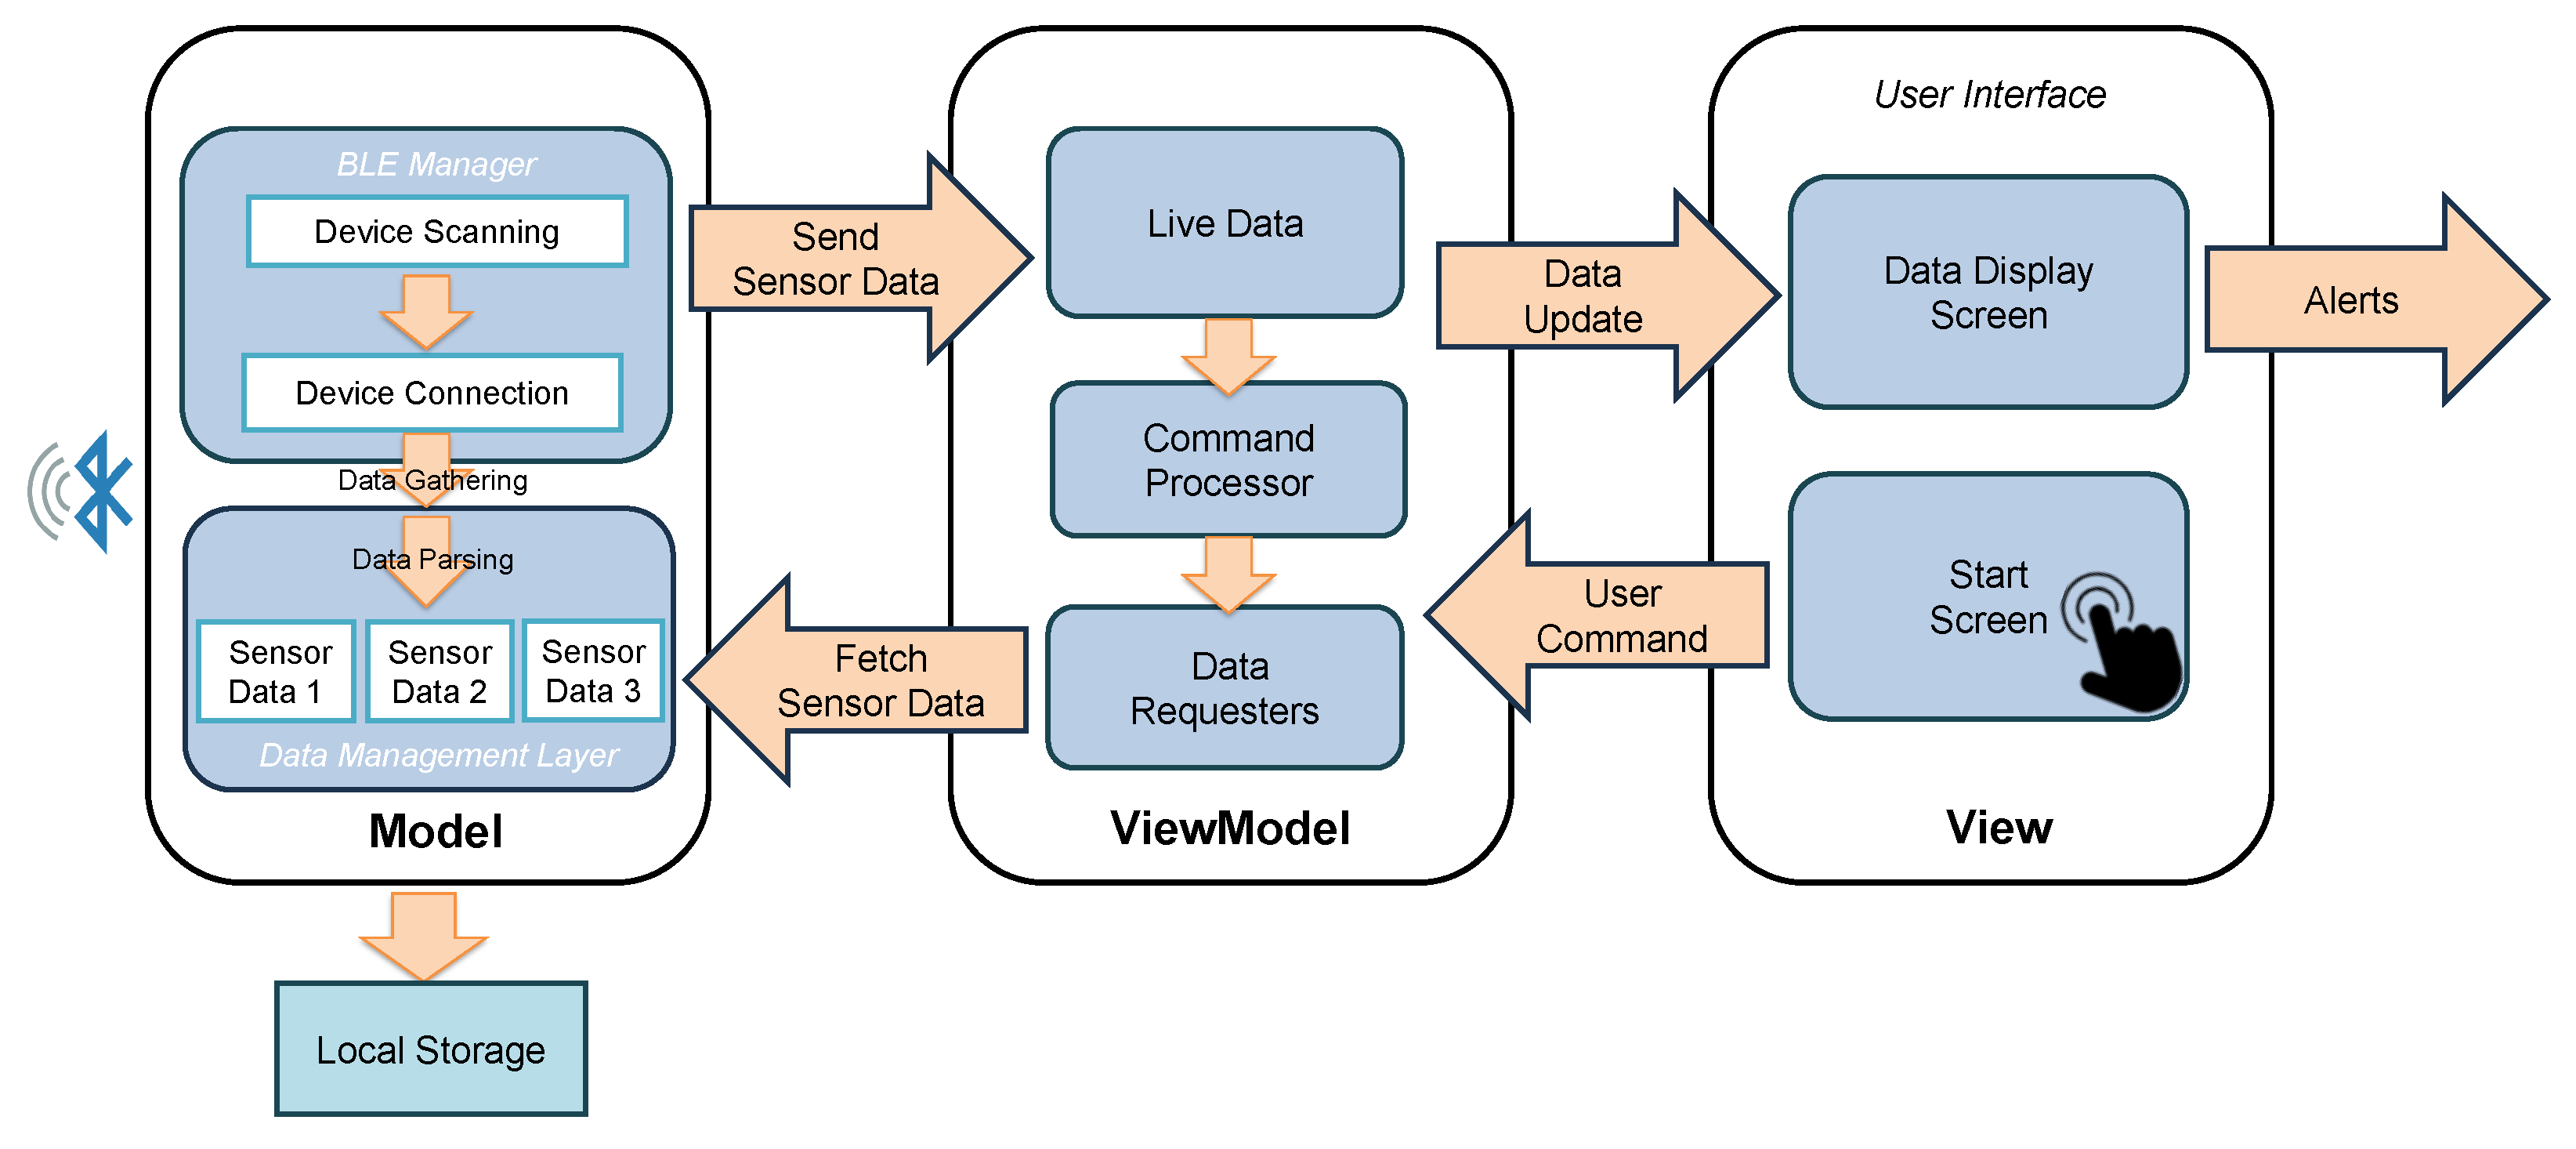
For software architecture, this study adopts the Model–View–ViewModel (MVVM) pattern, as it enables managing multiple BLE connections through a structured, maintainable, and modular codebase [28]. In the MVVM pattern, the Model manages data logic, the View handles the UI, and the ViewModel coordinates data flow and UI updates (see Figure 2), which is explained in more detail in Section 3.2.

3. Methodology: Structure and Design

This section explains the design and structure of the proposed health monitoring and alert system, including the selection criteria of wearable physiological sensors. It also details the methodologies used for managing data streams and designing the real-time alert notification.

3.1. Wearable Sensor Selection

Health monitoring for agricultural workers requires tracking of vital signs, such as heart rate, oxygen saturation, and body temperature, as well as body posture. Given the strenuous nature of agricultural work, such as lifting heavy objects, frequent bending, and prolonged sun exposure, wearable sensors should provide reliable, real-time monitoring of these conditions. To this end, we set two primary criteria for sensor selection: (i) BLE compatibility for wireless communication with mobile devices, and (ii) accessibility to raw measurement data.
Although many commercially available sensors are equipped with built-in BLE modules, few offer raw data access, with the majority relying on proprietary platforms for data transmission. To address this issue, a third-party app, LightBlue [29], was used to evaluate the accessibility and processing capability of sensors. The app displays each sensor’s BLE GATT server, which provides data channels with identifying characteristics. By selecting the relevant channel and listening to its notification, users can decode the byte array that carries measurement data. This data-extraction methodology is discussed in more detail in Section 3.4.
Through this selection process, a fingertip oximeter (JKS50C; HealthTree, China) and a skin patch thermometer (WT20; Walnut Cares, USA) were selected as suitable wearable sensors for this study, as these devices provide access to the raw data for oxygen saturation, heart rate, and body temperature. In addition, an inertial measurement unit (LPMS-B2; LP-Research, Japan) was selected based on its built-in BLE connectivity and ability to provide orientation data. This inertial measurement unit (IMU) consists of a 3-axis accelerometer, 3-axis gyroscope, and 3-axis magnetometer, providing the estimated posture angles (trunk inclination). In contrast to the oximeter and thermometer, which lacked proper documentation and required exploratory decoding, the LPMS-B2 IMU sensor is fully documented by the manufacturer for its data protocol. This enabled us to configure the IMU to transmit only the Euler angles needed for posture assessment, reducing data overhead and simplifying data packet parsing.

3.2. App Architecture Design

As mentioned in the previous section, our Android application was developed using the Model–View–ViewModel (MVVM) architecture, which divides the structure of the app into three major components: Model, View, and ViewModel. This distinct separation of each component guarantees that the complexity involved with handling multiple BLE devices is confined within the Model component, i.e., changes to connection management have no effect on the user interface layer, making the program more adaptable if the number of BLE connections increases.
The View is essentially the user interface of the app, providing the visual canvas through which users interact with its features. The main screen of the app is designed to display key health metrics—heart rate (bpm), oxygen saturation (%), and body temperature (°F). To help perform posture assessment, a visual diagram of a human figure is included, illustrating the inclination of the trunk, as shown in Figure 9 in Section 4.3.
The Model serves as the core processing layer of the app, managing multiple tasks that are not directly visible to the user. It detects nearby BLE devices, establishes stable connections, and continuously collects data streams from each device. To ensure robustness, each sensor was assigned a separate handler so that failure of one device does not interrupt data collection from the others. In addition to data acquisition, the Model organizes, processes, and stores the data locally in a structured format, enabling efficient retrieval and analysis of the data.
The ViewModel functions as an intermediary between the Model and the View, enabling communication and data transformation. It observes data changes in the Model such as updates from BLE devices and processes the raw data into a suitable format. Since raw data is often not directly usable, the ViewModel refines the data before passing it to the View for display. To handle the asynchronous nature of BLE communication, the ViewModel leverages Kotlin coroutines and streams, ensuring data transfer from the Model to the View without delays or interruptions.
Figure 3 shows the data flow and interaction within the MVVM architecture of our app. The Model in the diagram outlines the logical BLE operation sequence, starting with device scanning and ending with data storing. The arrows between the Model and the ViewModel represent continuous data flow and intermittent commands or requests, while those between the View and the ViewModel indicate data updates to the View and user interactions passed back to the ViewModel.

3.3. BLE Connection

One of the main objectives of this work was to create a framework that simplifies the integration of various BLE devices and their reliable connection to a smartphone. We created a BLEManager class in the application program, which is part of the Model in the MVVM architecture. This class is responsible for all BLE operations including initiating scans for nearby accessible BLE devices.
When one of the target devices is identified by its unique name (i.e., “LPMSB2-6F36F6” for the IMU, “OXIMETER” for the oximeter, and “Walnut” for the thermometer), it is added to a filtered list of the detected devices, creating a queue of devices ready for connection. Instead of connecting to all discovered devices simultaneously, the app establishes connections one at a time. Since each BLE connection attempt generates some level of radio frequency (RF) activity, sequential connections help minimize potential RF interference and improve the overall connection success rate.
Upon successful connection, the app initiates data exchange by listening to the notifications of the relevant data channels, so it can start a data stream whenever new data is ready. To simplify the process of managing diverse data streams, the data from each device is programmed to be encapsulated in a unique data class. The ImuData class wraps the IMU data, the OxiData class holds the oximeter data, and the TempData class is for the thermometer. The ViewModel in the MVVM architecture then interacts with these classes, observing changes in data and passing it on to the View for display.

3.4. Data Extraction and Processing

In this study, four primary datasets were selected to monitor the health condition of agricultural workers: oxygen saturation (oximeter), heart rate (oximeter), body temperature (thermometer), and trunk inclination (IMU).
Accessing raw measurement data from commercial wearable sensors is often challenging because manufacturers typically do not disclose their data protocols. However, raw data access is essential for integrating multiple heterogeneous sensors into a unified platform. The data-extraction and -processing method employed in this study is therefore described in detail in this section.
The first step is to identify the relevant BLE services and characteristics that contain the measurement data for each device. Using an independent tool such as the LightBlue app, we inspected the byte arrays transmitted by the sensors to determine which bytes corresponded to the physiological parameters.
For example, in the case of the thermometer, the device’s data, transmitted via BLE communication, was accessed through a specific service (UUID: 0xFFF0) and its associated characteristic (UUID: 0xFFF1). Inspection of the byte array indicated that the third most significant byte corresponded to the temperature reading. For instance, when the transmitted array is 0x69 01 72 01 4B 00 22 0B B0 65 in hexadecimal format, the byte 0x72 represents the temperature value. The specific relationship is given by
T c = 104 α 10 + 36
where T c denotes temperature in Celsius and α the value of the third byte in decimal. The temperature can then be further converted to Fahrenheit for display.
Similarly, for the oximeter, the service and characteristic UUIDs were identified as 0xFFE0 and 0xFFE1, respectively. By examining the data transmitted via BLE, four distinct byte arrays were observed. Among them, the byte array consistently starting with 0xFF was identified as containing the sensor readings. The fifth byte of the array corresponds to oxygen saturation and the sixth represents heart rate. For example, when an incoming byte array is given as 0xFF 44 01 00 62 4D 7B 09, the fifth byte 0x62 represents oxygen saturation (%), which is 98 in decimal, and the sixth byte 0x4D indicates the heart rate of 77 (bpm).
Unlike thermometers and oximeters, several IMU sensors are available with detailed documentation of their data packet structure provided by the manufacturers. Moreover, the IMU sensor we chose in this work further allows sensor customization to transmit only selected data. Table 1 shows the format of the IMU sensor’s data packet. In this structure, the first 7 bytes and the last 2 bytes always remain constant, allowing each packet to be identified using these boundary bytes. For our app, since we only need Euler angles to estimate the user’s trunk inclination, bytes 7 through 22 of the data packet as indicated in the table are used.
Once extracted and converted into the corresponding decimal values in standard units through the process, these processed values are then continuously compared against predetermined physiological and ergonomic thresholds to determine abnormal conditions, as detailed in Section 3.5. This resulting pipeline—spanning raw byte array decoding, packet parsing, unit conversion, threshold evaluation, and alert generation—constitutes the signal-processing design of the proposed system, which ensures real-time feedback to users while maintaining the simplicity necessary for a mobile application.

3.5. Alert Module Design

When sensor readings exceed safe limits, the system is programmed to trigger alerts using the Android Notification Compact Library. The normal range for blood oxygen saturation is typically between 94% and 100%. A saturation level below this range may indicate insufficient oxygen supply to the body’s tissues [30]. The temperature for a healthy individual should be between 97 °F and 100 °F. A temperature above 100 °F may indicate a fever, potentially suggesting an ongoing bodily response to infection or illness [31]. The normal range of heart rate for adults is between 60 and 100 bpm. Heart rates above 100 bpm could suggest tachycardia, while rates below 60 bpm could imply bradycardia, both of which may be potential indicators of heart-related concerns [32]. Therefore, by using these measurements collectively, we can evaluate an agricultural worker’s health status in real time.
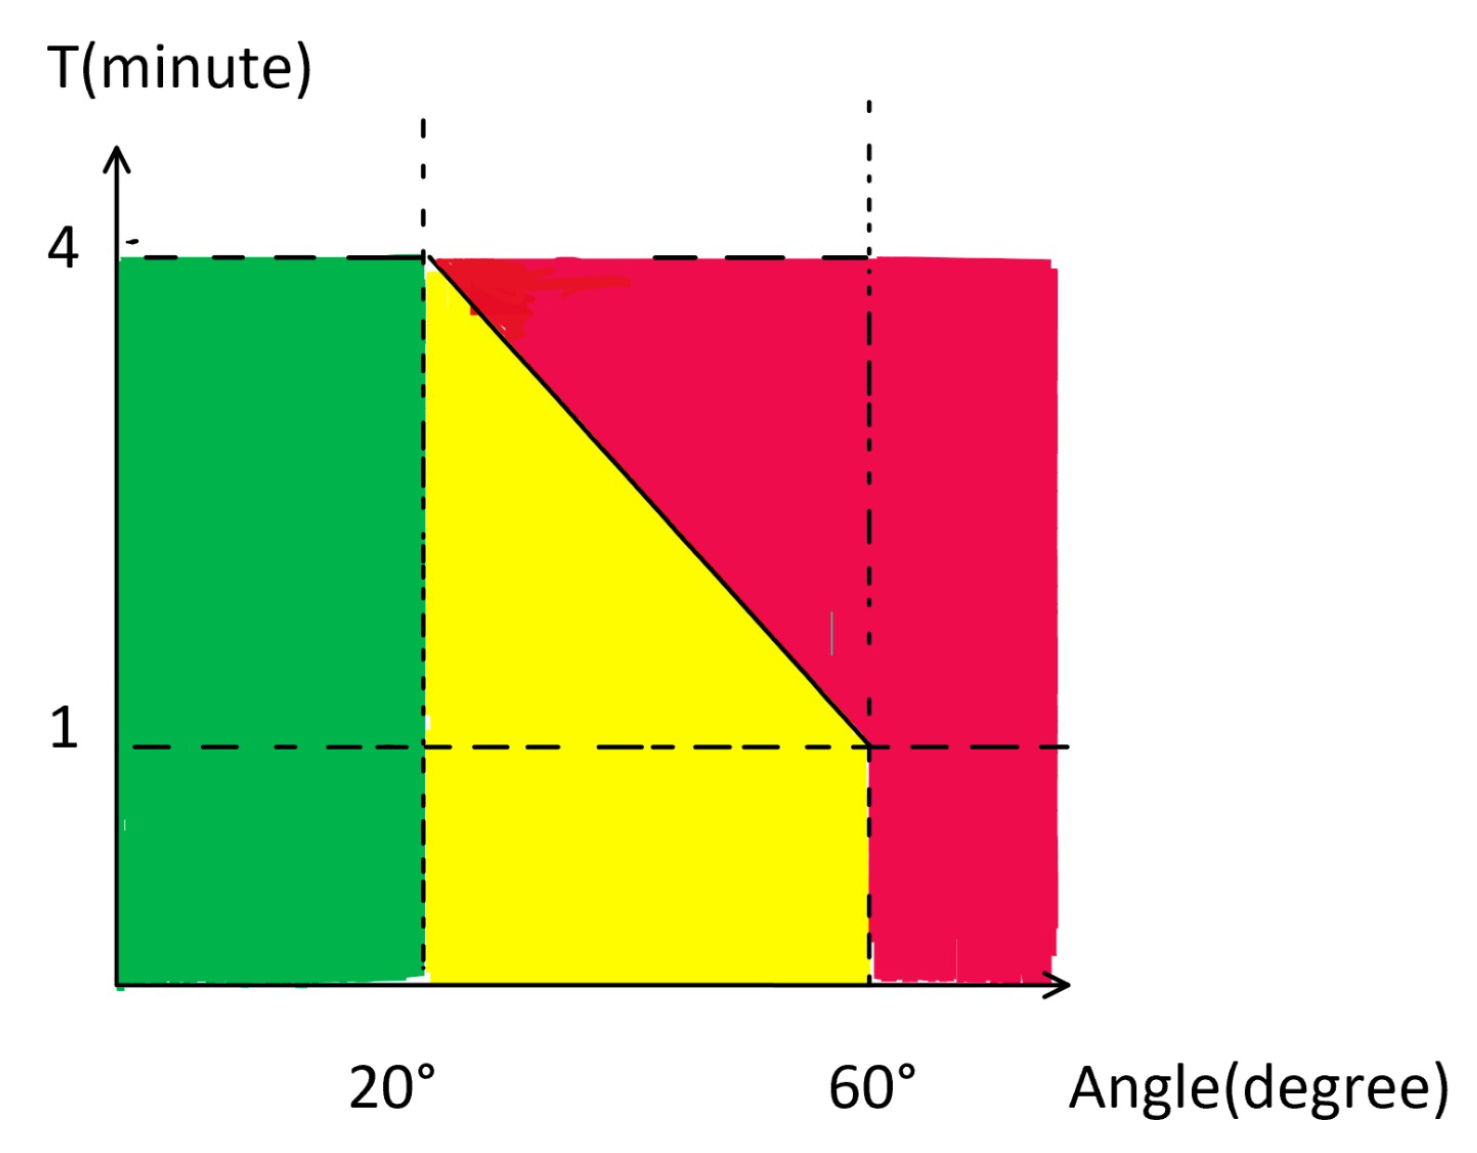
In addition to physiological parameters, body posture is another critical metric for assessing a worker’s physical condition and safety. According to ISO standards [33], a proper standing posture is defined as 0 degrees, with a permissible trunk inclination range of 0 to 20 degrees. The range of 20 to 60 degrees is tolerable for short periods, with a sustainable limit of 4 min at 20 degrees and 1 min at 60 degrees. Inclination beyond 60 degrees is considered unsafe due to the increased likelihood of musculoskeletal disorders. Figure 4 visualizes these conditions; the green area signifies an acceptable range, the yellow area depends on duration, and the red area is a non-recommended zone.
The alert mechanism compares real-time user interface data to the predetermined threshold values and includes sound, vibration, and pop-up notifications, ensuring immediate user awareness. A pop-up notification bar in the app alerts the user when a reading falls outside the range. The notification will also play a customized sound, such as “Abnormal temperature value detected”, to overcome the limitation of the text-based alert and vibrate the phone in case of noisy environments. To prevent repeated alerts from becoming overwhelming while giving timely notification, a five-second interval between alerts is implemented.

3.6. System Overview

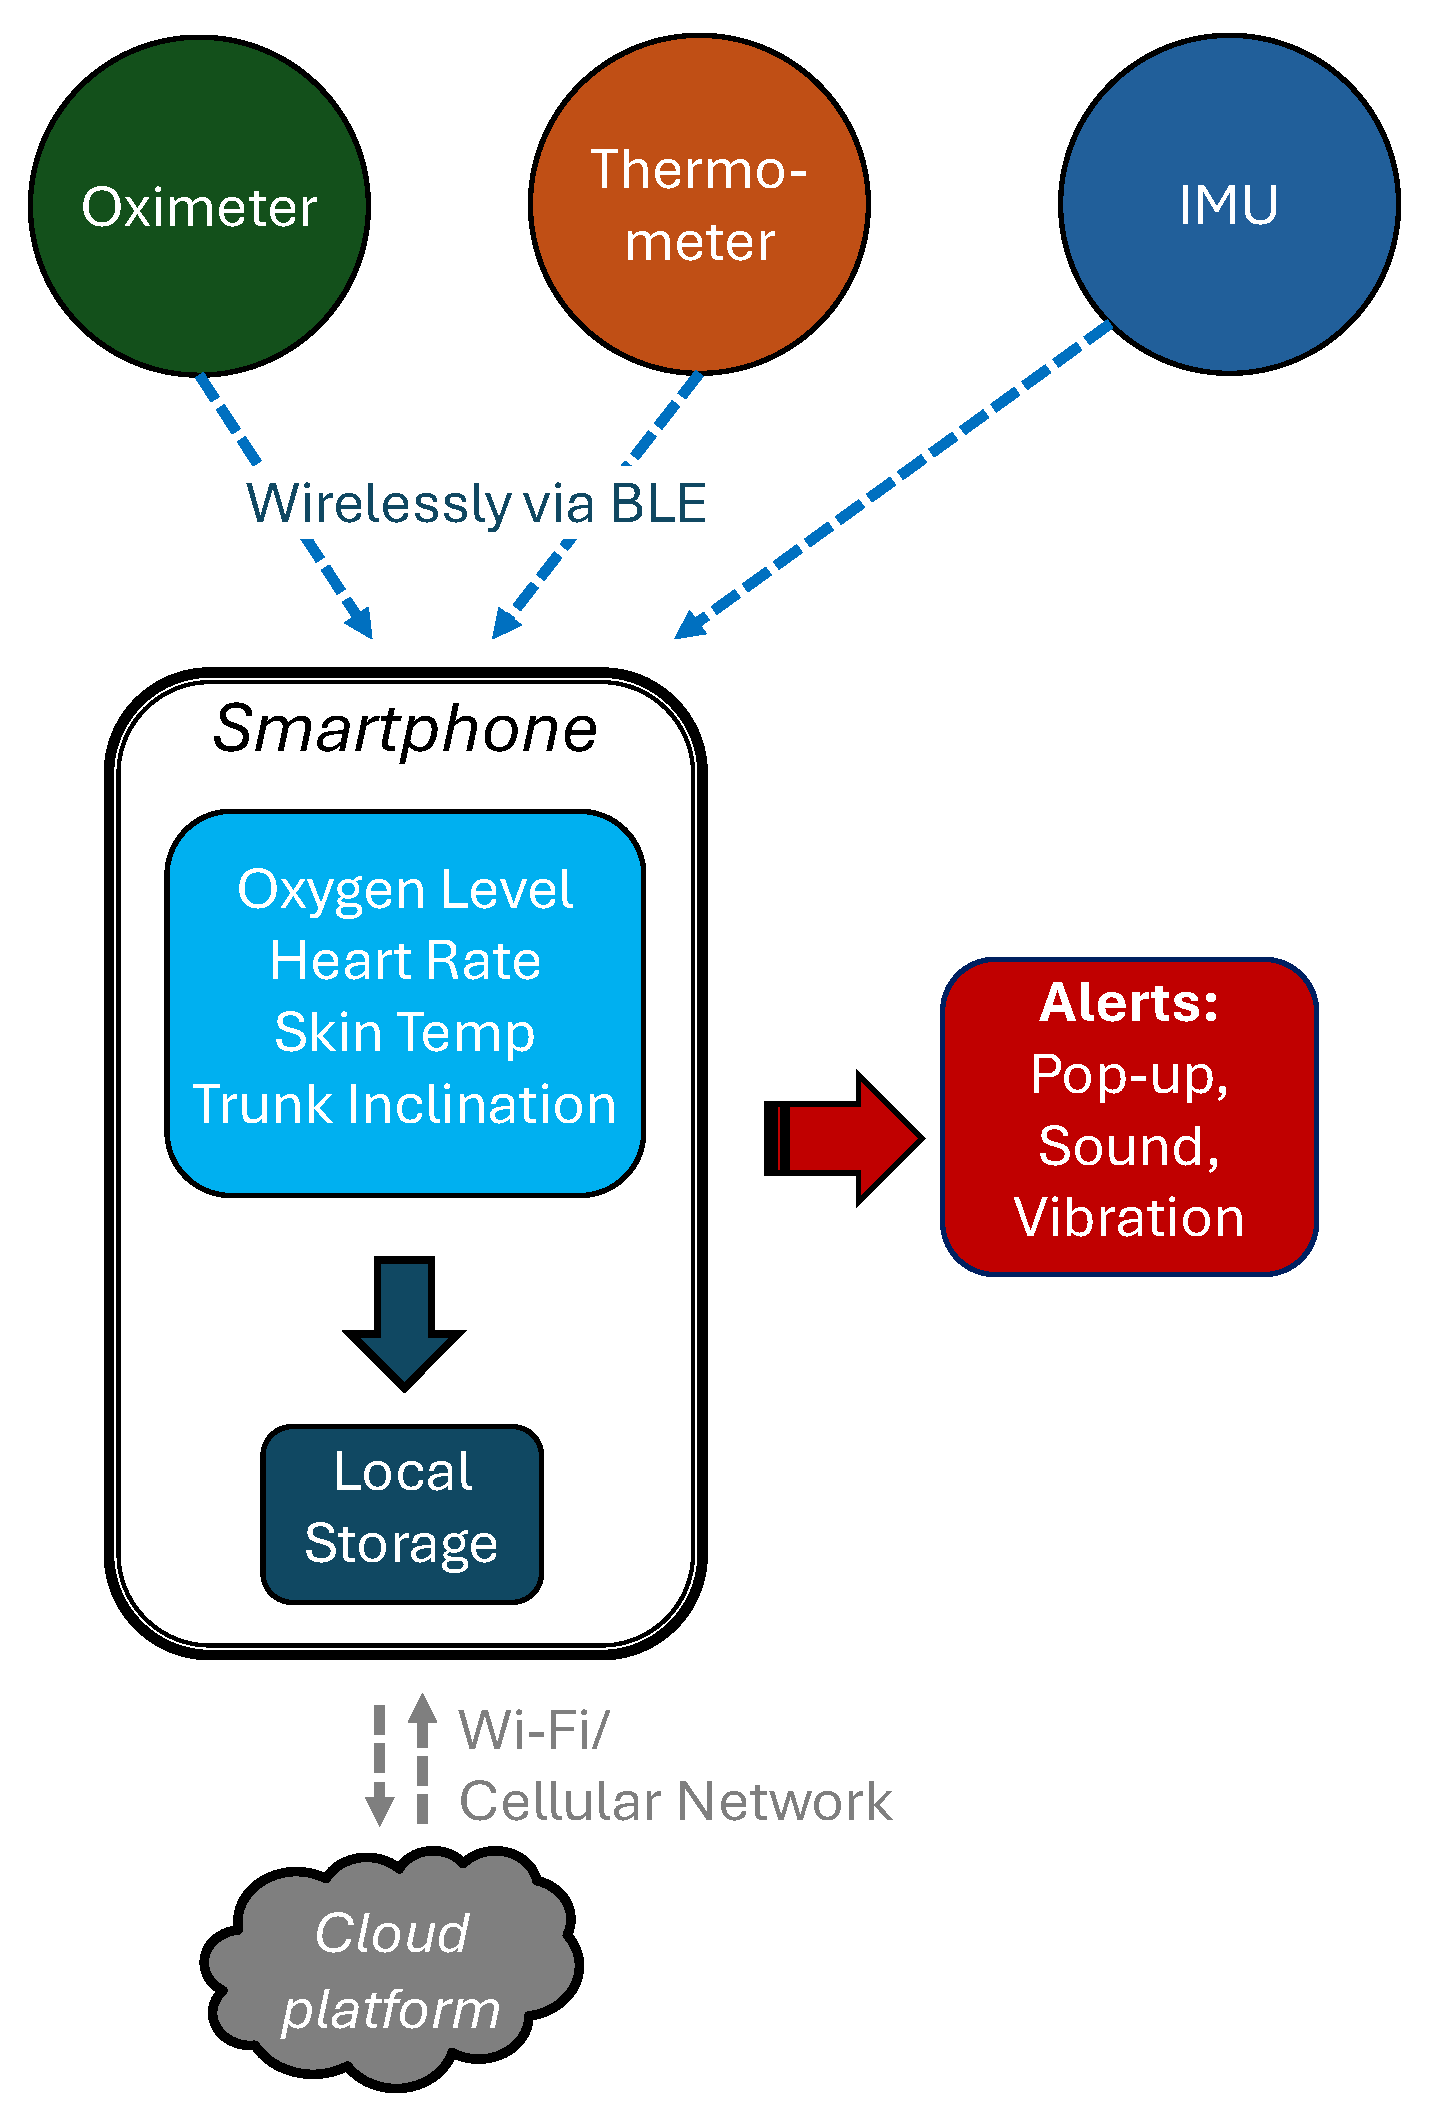
To summarize, Figure 5 illustrates the overall workflow of the proposed health-monitoring system. The wearable sensors transmit physiological and posture data wirelessly to the smartphone via BLE. The smartphone application, designed with a modular MVVM architecture, decodes, processes, and displays the data while issuing real-time alerts and storing the data locally. As a future extension, the framework will also support cloud connectivity via Wi-Fi or cellular networks for remote supervision.

4. Verification Experiments

4.1. Experimental Setup and Procedure

To demonstrate the developed mobile health monitoring and alert application, we conducted experiments using three wearable sensors: a fingertip oximeter, a chest patch thermometer, and an IMU (see Section 3.1 for model details). The developed smartphone application that integrates these sensors ran on an Android smartphone (10L; TCL, China) and on another smartphone (Galaxy S22; Samsung, Republic of Korea) to verify consistency. The data transmission rates for the oximeter and thermometer were preconfigured by the manufacturers at approximately 1 Hz, whereas the IMU sampling rate was configurable and set to 10 Hz. All the streamed sensor data was displayed in the app at a refresh rate of 2 Hz.
First, we verified the real-time sensor data extraction as follows. For the oximeter, the extracted raw data was cross-checked every 10 s for 15 samples with its own LED display showing heart rate and oxygen saturation. For the thermometer, a second thermometer (BT1; Koogeek, China) was used as a reference for comparison. While an exact match was not expected given the different manufacturers, differences were minimal and constant as shown in Table 2, ensuring correct data extraction from the thermometer. For the IMU, posture data was verified through visual observation by comparing the participant’s posture with the corresponding display on the user interface.
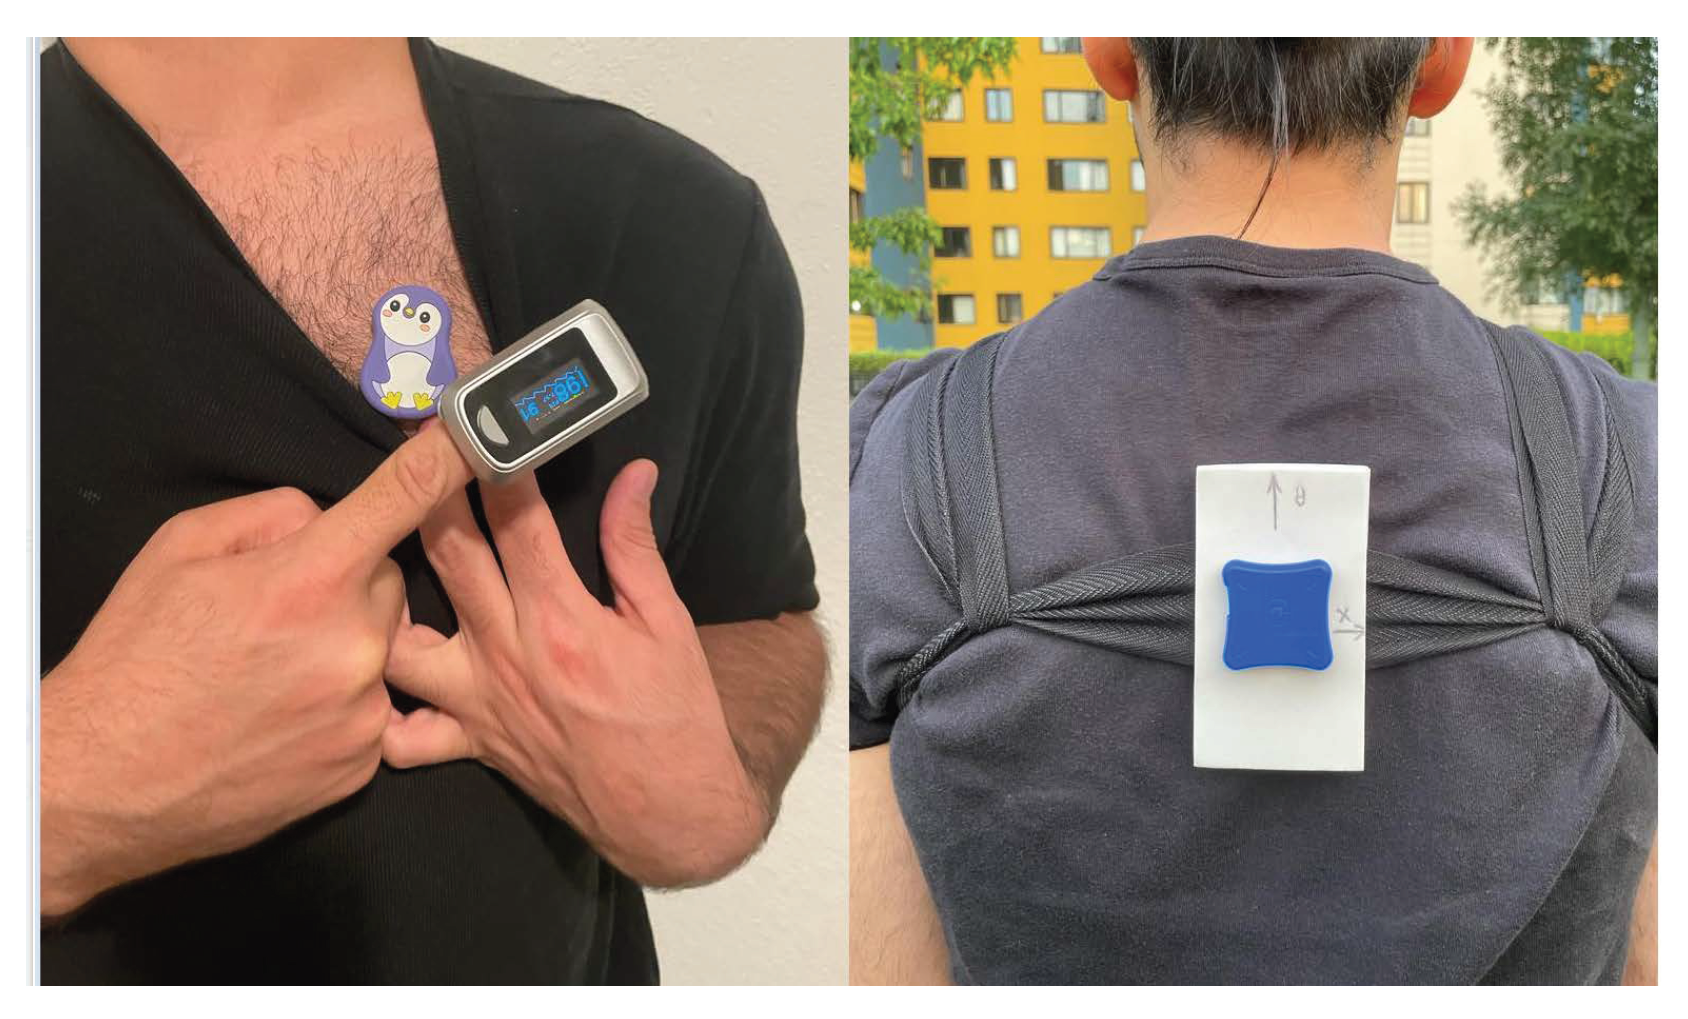
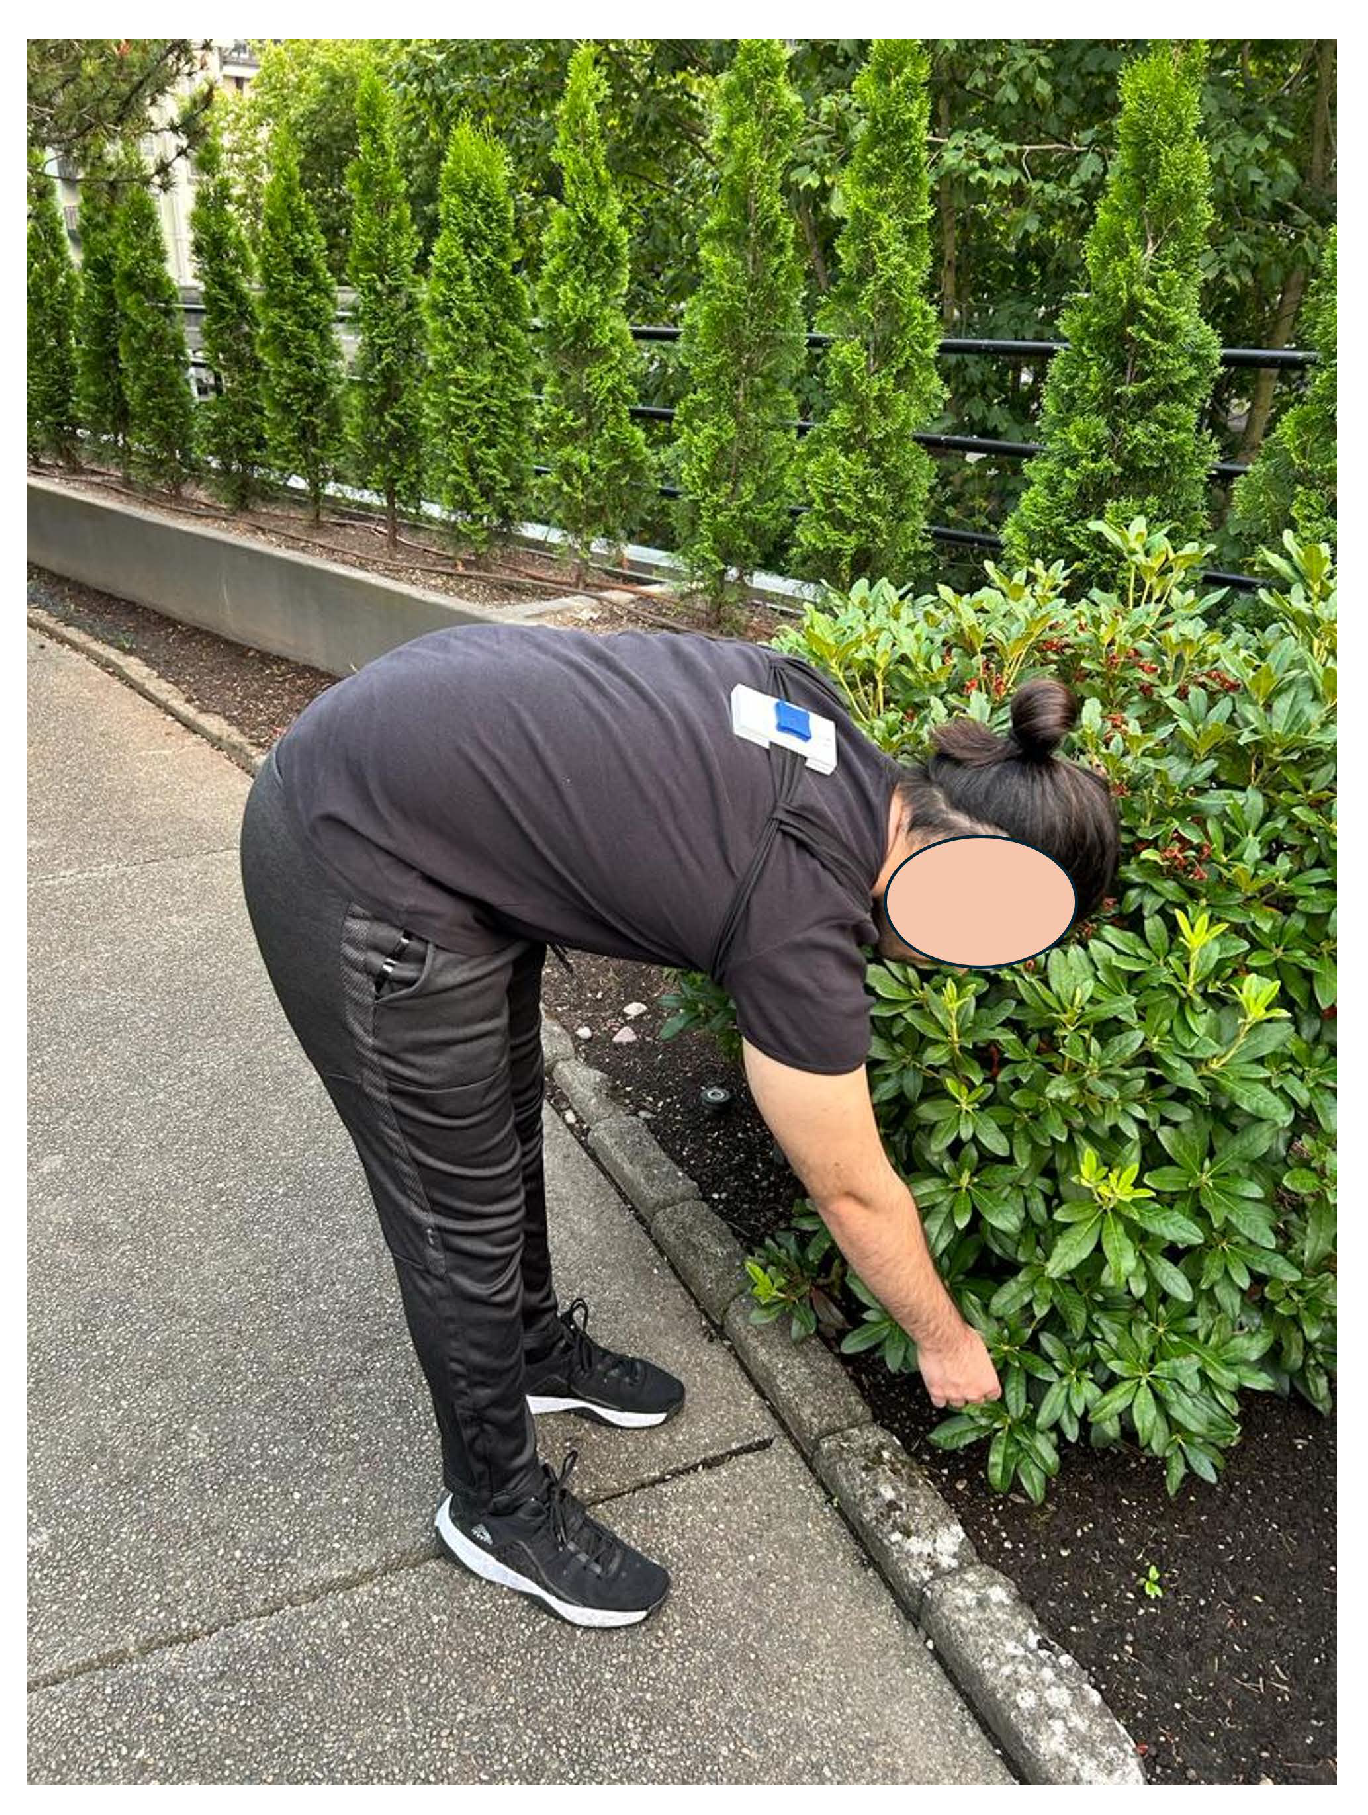
The experiments were conducted outdoors to replicate conditions experienced by agricultural workers. The thermometer was affixed to the chest, and the oximeter was attached to the participant’s index finger. The IMU was mounted to a foam plate, aligned horizontally, and secured to the user’s upper-middle back, as shown in Figure 6. This location of the IMU sensor placement was strategically chosen as it provides an ideal spot for measuring trunk inclination, a critical factor in evaluating the risk of musculoskeletal disorders among workers. The alignment of the IMU was chosen in a way that the Euler angles around the X-axis of the sensor’s coordinate frame effectively represent the trunk inclination [34].
The experimental procedure was as follows.
  • The participant wore the IMU belt, thermometer, and oximeter.
  • The app was launched on the TCL smartphone via the Android Debug Bridge (ADB) for testing.
  • The sensors began BLE advertising and were connected through the app’s start screen.
  • Sensor readings were verified using the methods described earlier.
  • The subject increased heart rate and bent the torso to test the alert mechanism.
  • Alerts were checked for proper vibration, sound, and notifications.
  • Reconnection reliability was tested by powering off or moving the devices out of the communication range.
  • The phone’s local storage was checked to confirm proper data saving.
  • The procedure was repeated with the second smartphone to verify consistency.

4.2. Data Monitoring via User Interface

The app was tested on different Android devices to evaluate its performance across different hardware configurations. Logcat [35], an Android diagnostic tool, was used to monitor BLE connections and real-time data streaming.
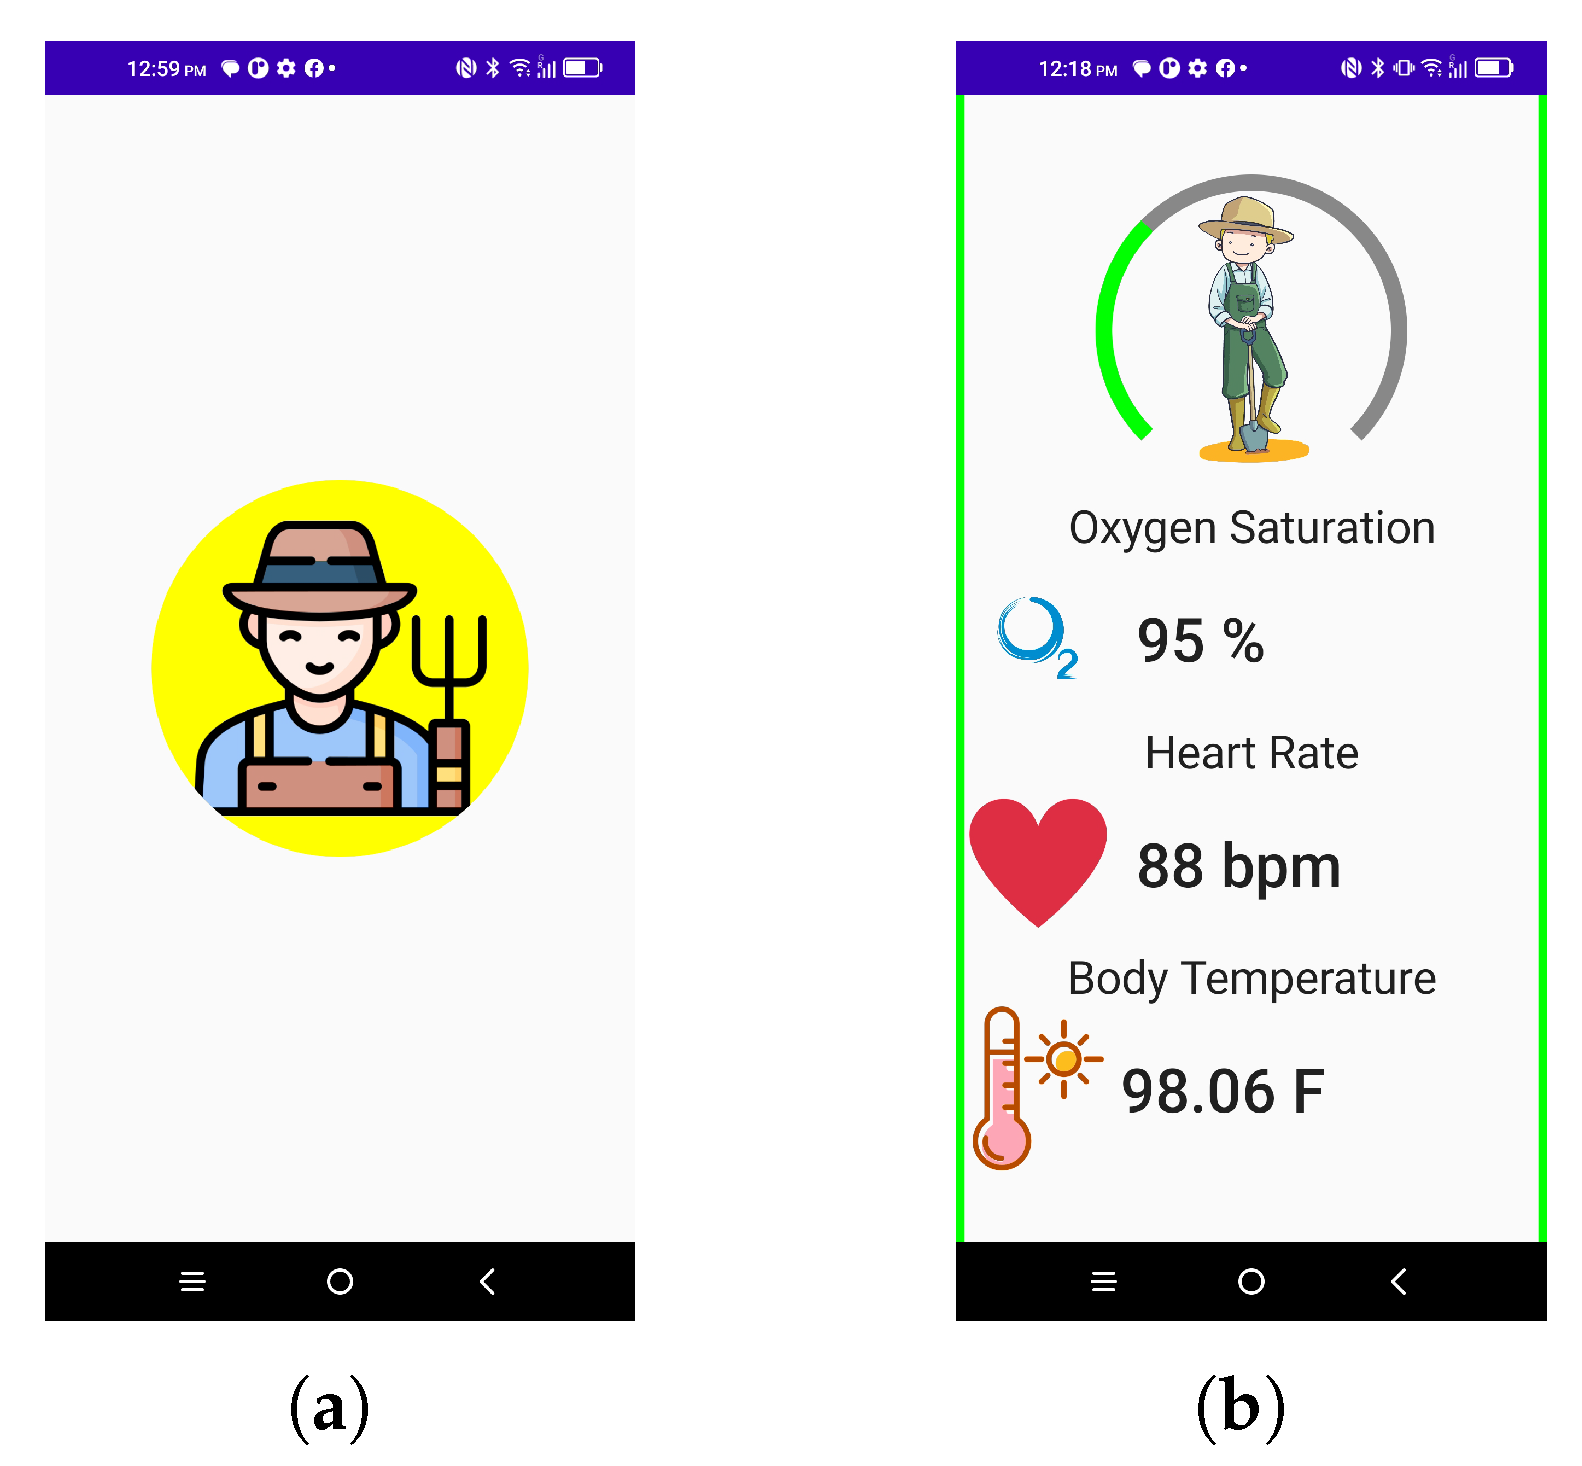
Upon launching the app’s user interface (UI), the user selects an image to initiate BLE scanning and connection on the start screen (Figure 7a). Once connected, the UI displays real-time data from all three sensors, with numerical values and visual aids (Figure 7b). The gauge-style display at the top visually represents the worker’s body posture based on the IMU data, allowing users to quickly interpret and respond to potential health risks.

4.3. Alert Mechanism and Data Storage

The alert mechanism, which is a key feature of the developed app, utilizes three different types of notification (i.e., pop-ups, sound, vibration) and a 5 s delay between repeated alerts to prevent alert fatigue, as explained in Section 3.5.
To test the IMU alert, which considers both posture angle and duration, the user maintained various trunk inclinations following the criteria indicated in Figure 4. As expected, when the user’s posture remained within the safe range of 0–20 deg, no alert was triggered. When the user bent 50 deg for over one minute, the app triggered an alert while bending beyond 60 deg caused an immediate alert, confirming proper functionality (see Figure 8).
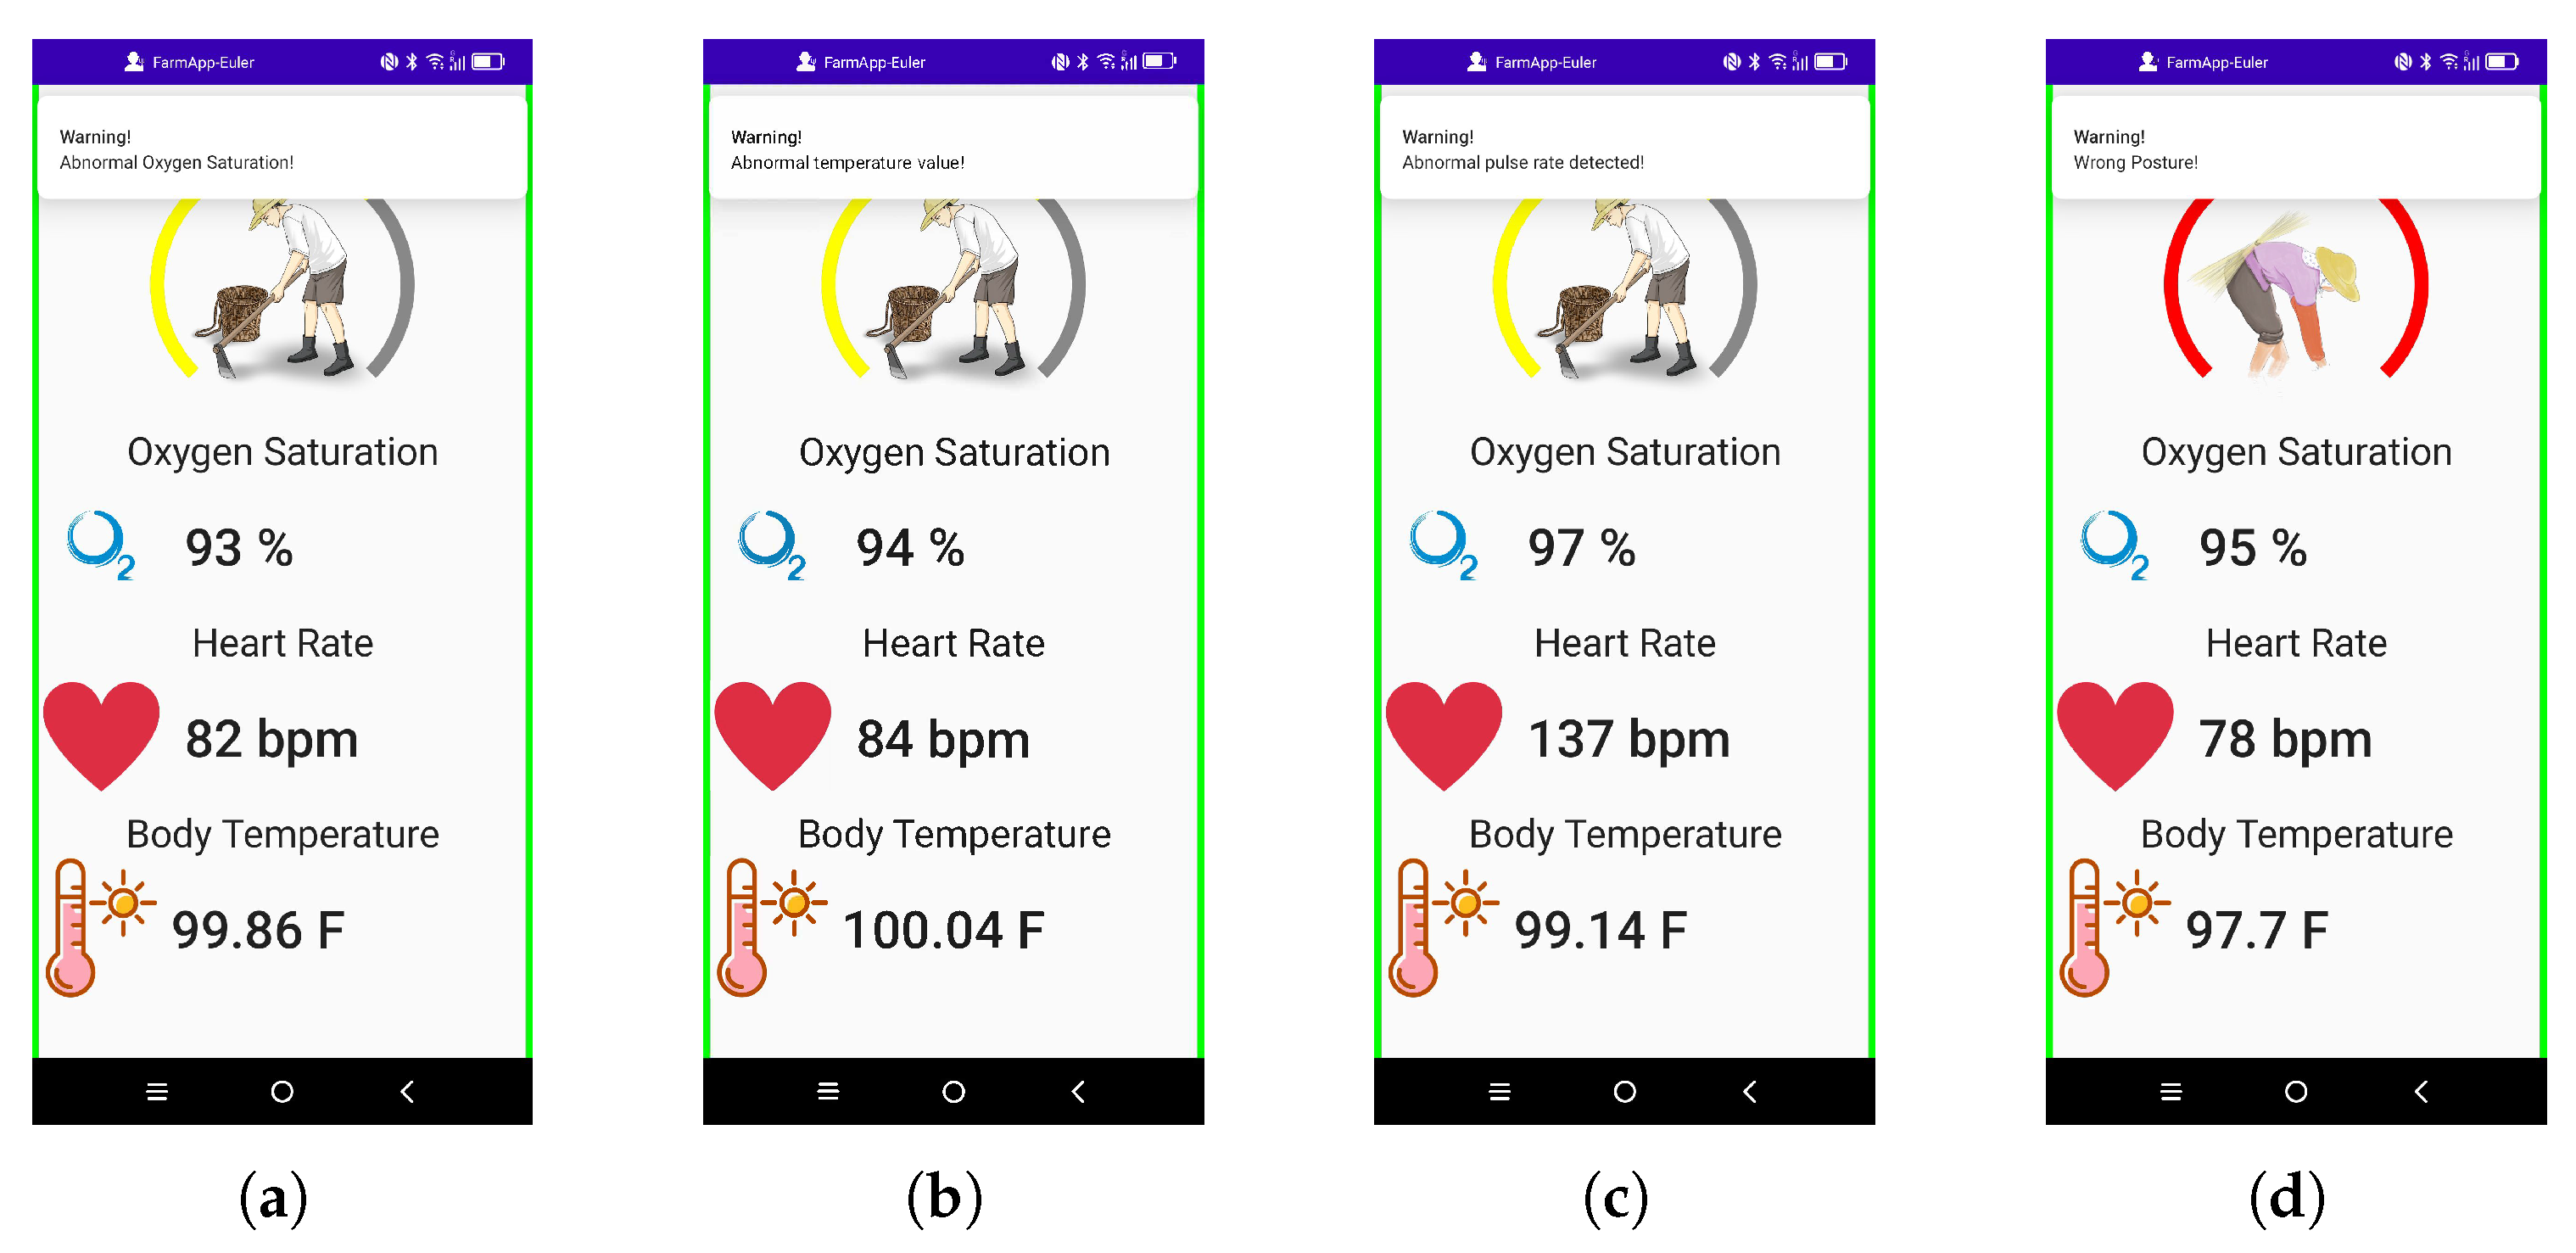
Heart-rate and oxygen-saturation alerts were also tested and successfully triggered when the heart rate exceeded 120 bpm or oxygen saturation dropped below 94%. Similarly, a temperature alert was generated when the body temperature exceeded 100 °F. To test the lower threshold conditions for heart rate and temperature, we temporarily adjusted the preset thresholds to easily trigger alerts. The screenshots of different alerts are presented in Figure 9.
The app is programmed to store data locally for future analysis and long-term health tracking. Table 3 shows a sample of the collected data. The IMU data was updated most frequently, and the storage rate for all data was approximately 1 kB/s, implying 8 h of continuous monitoring would require roughly 30 MB of storage.

5. Discussions

This study confirms the feasibility and effectiveness of using a smartphone application with wearable sensors for agricultural workers. However, selecting suitable wearable sensors poses a challenge due to the limited availability of commercially available sensors that provide access to raw data. Many sensors lack comprehensive documentation, requiring extensive testing with third-party apps to verify data accessibility. For example, a ring-type oximeter, which would be more practical for agricultural workers, was not available with open access to raw data, preventing its inclusion in this study.
While the IMU and oximeter maintained stable BLE connections, the thermometer exhibited periodic connection drops, identified as a hardware setting configured by the manufacturer. As this behavior may be a power-saving strategy used in other devices as well, a reconnection mechanism was integrated into the app to ensure continuous data collection. Initially, simple reconnection attempts caused data interference among the sensors due to their shared buffer structure. This issue was resolved by allocating distinct resource files for each sensor and employing Kotlin coroutines to asynchronously stream data.
Additional sensors can be integrated into the system using the following structured approach. New sensors are added to the connection queue to establish sequential connection. Each sensor requires a dedicated callback handler object GattCallback, an Android BLE API, to manage its data exchange, with raw data extraction guided by its respective data format table. The process involves extending the system’s architecture with additional resource files and effectively handling multiple BLE connections and multi-threading scenarios.
Another challenge is that the system currently supports only three physiological parameters (heart rate, oxygen saturation, and temperature), which may limit the comprehensive assessment of worker health. Furthermore, since this study primarily focused on the development and verification of the BLE-based smartphone application, testing has only been limited to small-scale experiments with a single subject; therefore, large-scale field validation under real working conditions remains a necessary next step.

6. Conclusions

In this work, we developed a real-time health and posture monitoring smartphone application for agricultural workers. We demonstrated that the system is capable of managing multiple BLE connections, processing sensor data, and generating real-time alerts reliably. By adopting a modular and scalable framework based on the MVVM architecture, the application enhances maintainability and enables the integration of additional sensors. Furthermore, Android Studio and Jetpack Compose were selected as the preferred IDE and UI framework due to their efficiency in developing asynchronous apps and user-friendly interfaces. The app is also designed to handle unexpected connection interruptions to ensure continuous monitoring without data loss. The smartphone application’s alert mechanism, incorporating sound, vibration, and pop-up notifications, effectively ensures user awareness of critical health conditions.
Beyond agriculture, this system has the potential to be used for occupational health monitoring in broader applications. Future research will include integrating additional wearable physiological sensors, such as those for blood pressure or respiratory rate, to provide more comprehensive health monitoring. We also plan to incorporate redundant sensing using multiple sensors to enhance system reliability, along with cloud-based data storage and advanced analytics to enable long-term tracking and remote supervision. Finally, field trials with multiple agricultural workers in real working conditions will be conducted to validate the system in practice.

Author Contributions

Conceptualization, O.O. and J.-C.R.; methodology, O.O. and J.-C.R.; software, O.O.; validation, O.O. and J.-C.R.; formal analysis, O.O. and J.-C.R.; resources, J.-C.R.; data curation, O.O. and J.-C.R.; writing—original draft preparation, O.O.; writing—review and editing, J.-C.R.; visualization, O.O. and J.-C.R.; supervision, J.-C.R.; project administration, J.-C.R. All authors have read and agreed to the published version of the manuscript.

Funding

This research received no external funding.

Institutional Review Board Statement

The study was conducted in accordance with the Declaration of Helsinki, and approved by the Institutional Review Board of Northern Illinois University (protocol code HS26-0053, 8/21/2025).

Informed Consent Statement

Informed consent was obtained from all subjects involved in the study.

Data Availability Statement

Data is available upon request.

Conflicts of Interest

The authors declare no conflicts of interest.

References

  1. Walker-Bone, K.; Palmer, K.T. Musculoskeletal disorders in farmers and farm workers. Occup. Med. 2002, 52, 441–450. [Google Scholar] [CrossRef]
  2. Gubernot, D.M.; Anderson, G.B.; Hunting, K.L. The epidemiology of occupational heat exposure in the United States: A review of the literature and assessment of research needs in a changing climate. Int. J. Biometeorol. 2014, 58, 1779–1788. [Google Scholar] [CrossRef]
  3. Kim, Y.S.; Kim, J.; Chicas, R.; Xiuhtecutli, N.; Matthews, J.; Zavanelli, N.; Kwon, S.; Lee, S.H.; Hertzberg, V. Soft Wireless Bioelectronics Designed for Real-Time, Continuous Health Monitoring of Farmworkers. Adv. Healthc. Mater. 2022, 11, 2200170. [Google Scholar] [CrossRef]
  4. Valliappan, S.; Mohan, B.P.R.; Kumar, S.R. Design of low-cost, wearable remote health monitoring and alert system for elderly heart patients. In Proceedings of the 2017 International Conference on IoT and Application (ICIOT), Nagapattinam, India, 19–20 May 2017; pp. 1–7. [Google Scholar] [CrossRef]
  5. Yan, X.; Li, H.; Li, A.R.; Zhang, H. Wearable IMU-based real-time motion warning system for construction workers’ musculoskeletal disorders prevention. Autom. Constr. 2017, 74, 2–11. [Google Scholar] [CrossRef]
  6. Banos, O.; Villalonga, C.; García, R.; Saez, A.; Damas, M.; Holgado-Terriza, J.; Lee, S.; Pomares, H.; Rojas, I. Design, implementation and validation of a novel open framework for agile development of mobile health applications. BioMedical Eng. OnLine 2015, 14, S6. [Google Scholar] [CrossRef] [PubMed]
  7. Yadav, S.; Pulekar, T.V.; Cheeran, A.; Awandekar, V.D. Wireless Emergency Patient Monitoring System. In Proceedings of the 2018 Fourth International Conference on Biosignals, Images and Instrumentation (ICBSII), Chennai, India, 22–24 March 2018; pp. 206–212. [Google Scholar] [CrossRef]
  8. Singh, N.K.; Ricke, D.O. Towards an open data framework for body sensor networks supporting bluetooth low energy. In Proceedings of the 2016 IEEE 13th International Conference on Wearable and Implantable Body Sensor Networks (BSN), San Francisco, CA, USA, 14–17 June 2016; pp. 396–401. [Google Scholar] [CrossRef]
  9. Vishwakarma, P.K.; Singh, R. A–Review on IoT-Assisted ECG Monitoring Framework for Health Care Applications. In Proceedings of the 2021 Fourth International Conference on Computational Intelligence and Communication Technologies (CCICT), Sonepat, India, 3 July 2021; pp. 203–207. [Google Scholar] [CrossRef]
  10. Petropoulos, A.; Sikeridis, D.; Antonakopoulos, T. Wearable Smart Health Advisors: An IMU-Enabled Posture Monitor. IEEE Consum. Electron. Mag. 2020, 9, 20–27. [Google Scholar] [CrossRef]
  11. Umapathy, K.; Chandramohan, S.; Muthukumaran, D.; Sivakumar, M.; Vinoth, M.; Selvakumar, S. Edge and Android Application based Health Monitor. In Proceedings of the 2023 5th International Conference on Smart Systems and Inventive Technology (ICSSIT), Tirunelveli, India, 23–25 January 2023; pp. 32–34. [Google Scholar] [CrossRef]
  12. Mahmud, M.S.; Wang, H.; Esfar-E-Alam, A.M.; Fang, H. A Wireless Health Monitoring System Using Mobile Phone Accessories. IEEE Internet Things J. 2017, 4, 2009–2018. [Google Scholar] [CrossRef]
  13. Taylor, S.A.; Sharif, H. Wearable Patient Monitoring Application (ECG) using Wireless Sensor Networks. In Proceedings of the 2006 International Conference of the IEEE Engineering in Medicine and Biology Society, New York, NY, USA, 30 August–3 September 2006; pp. 5977–5980. [Google Scholar] [CrossRef]
  14. Ali, S.M.; Noghanian, S.; Khan, Z.U.; Alzahrani, S.; Alharbi, S.; Alhartomi, M.; Alsulami, R. Wearable and Flexible Sensor Devices: Recent Advances in Designs, Fabrication Methods, and Applications. Sensors 2025, 25, 1377. [Google Scholar] [CrossRef]
  15. Tao, D.; Xie, C.; Jaffrezic-Renault, N.; Guo, Z. Flexible and wearable electrochemical sensors for health and safety monitoring. Talanta 2025, 291, 127863. [Google Scholar] [CrossRef]
  16. Dai, B.; Gao, C.; Xie, Y. Flexible wearable devices for intelligent health monitoring. View 2022, 3, 20220027. [Google Scholar] [CrossRef]
  17. Huang, G.; Chen, X.; Liao, C. AI-Driven Wearable Bioelectronics in Digital Healthcare. Biosensors 2025, 15, 410. [Google Scholar] [CrossRef]
  18. Donisi, L.; Cesarelli, G.; Pisani, N.; Ponsiglione, A.M.; Ricciardi, C.; Capodaglio, E. Wearable Sensors and Artificial Intelligence for Physical Ergonomics: A Systematic Review of Literature. Diagnostics 2022, 12, 3048. [Google Scholar] [CrossRef]
  19. Kumar, S.; Nilsen, W.; Pavel, M.; Srivastava, M. Mobile Health: Revolutionizing Healthcare Through Transdisciplinary Research. Computer 2013, 46, 28–35. [Google Scholar] [CrossRef]
  20. Bangash, J.I.; Abdullah, A.H.; Anisi, M.H.; Khan, A.W. A survey of routing protocols in wireless body sensor networks. Sensors 2014, 14, 1322–1357. [Google Scholar] [CrossRef] [PubMed]
  21. Hajar, M.S.; Al-Kadri, M.O.; Kalutarage, H.K. A survey on wireless body area networks: Architecture, security challenges and research opportunities. Comput. Secur. 2021, 104, 102211. [Google Scholar] [CrossRef]
  22. Abdulmalek, S.; Nasir, A.; Jabbar, W.A.; Almuhaya, M.A.M.; Bairagi, A.K.; Khan, M.A.; Kee, S.H. IoT-Based Healthcare-Monitoring System towards Improving Quality of Life: A Review. Healthcare 2022, 10, 1993. [Google Scholar] [CrossRef] [PubMed]
  23. Townsend, K.; Cufi Akiba, C.; Davidson, R. Getting Started with Bluetooth Low Energy: Tools and Techniques for Low-Power Networking; O’Reilly: Sebastopol, CA, USA, 2014; p. 33. [Google Scholar]
  24. Heydon, R. Bluetooth Low Energy; Pearson: Upper Saddle River, NJ, USA, 2012; pp. 38–48. [Google Scholar]
  25. Llorens-Vernet, P.; Miró, J. Standards for Mobile Health–Related Apps: Systematic Review and Development of a Guide. JMIR MHealth UHealth 2020, 8, e13057. [Google Scholar] [CrossRef] [PubMed]
  26. Radhakrishnan, M.; Misra, A.; Balan, R.K.; Lee, Y. Smartphones and BLE Services: Empirical Insights. In Proceedings of the 2015 IEEE 12th International Conference on Mobile Ad Hoc and Sensor Systems, Dallas, TX, USA, 19–22 October 2015; pp. 226–234. [Google Scholar] [CrossRef]
  27. Android Studio & App Tools, Google for Developers. Available online: https://developer.android.com/studio (accessed on 20 July 2025).
  28. Anderson, C. The Model-View-ViewModel (MVVM) Design Pattern. In Pro Business Applications with Silverlight 5; Apress: Berkeley, CA, USA, 2012; pp. 461–499. [Google Scholar]
  29. LightBlue, Punch Through Design. Available online: https://punchthrough.com/lightblue-features/ (accessed on 20 July 2025).
  30. Jubran, A. Pulse oximetry. Crit. Care 2015, 19, R11. [Google Scholar] [CrossRef]
  31. Geneva, I.I.; Cuzzo, B.; Fazili, T.; Javaid, W. Normal Body Temperature: A Systematic Review. Open Forum Infect. Dis. 2019, 6, ofz032. [Google Scholar] [CrossRef]
  32. Spodick, D.H. Normal sinus heart rate: Appropriate rate thresholds for sinus tachycardia and bradycardia. South. Med. J. 1996, 89, 666–667. [Google Scholar] [CrossRef]
  33. ISO-11226:2000; Ergonomics—Evaluation of Static Working Postures. Technical Report; International Organization for Standardization: Geneva, Switzerland, 2006.
  34. Alam, U.K.; Ryu, J.C.; Kim, J.H. IMU-based estimation of body posture: Laboratory validation in simulated commercial fishing. Int. J. Ind. Ergon. 2025, 106, 103712. [Google Scholar] [CrossRef]
  35. Logcat Command-Line Tool, Google for Developers. Available online: https://developer.android.com/tools/logcat (accessed on 20 July 2025).
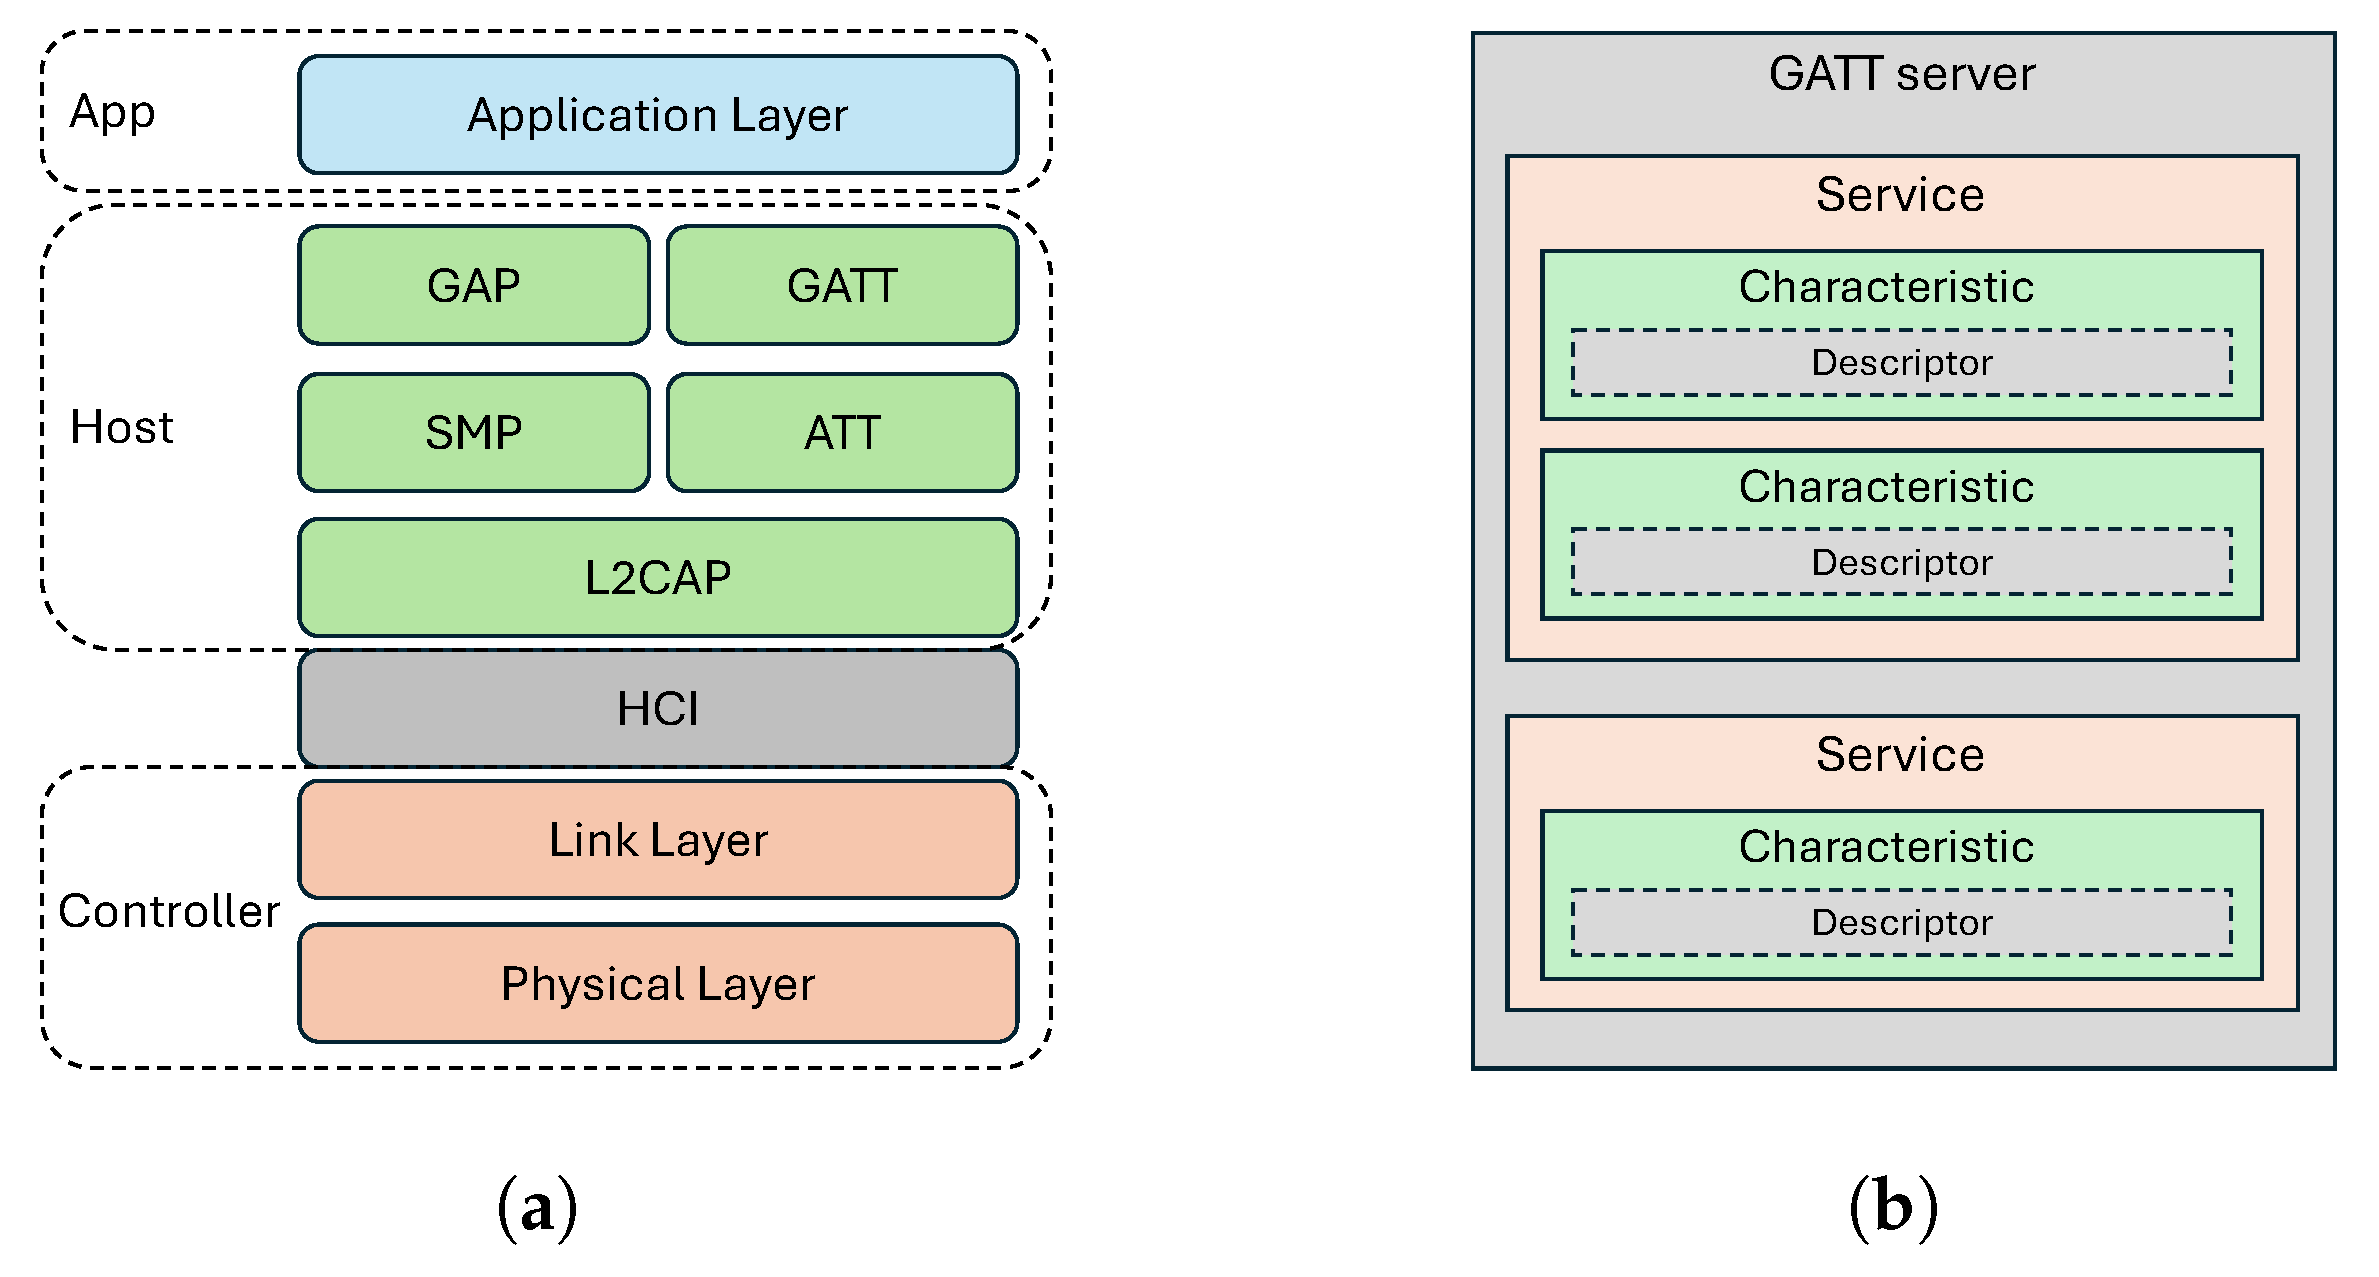
Figure 1. BLE architecture diagrams: (a) BLE Protocol stack consisting of controller, host, and application layer; (b) GATT data hierarchy defined by service, characteristic, and descriptors.
Asi 08 00133 g001
Figure 2. MVVM data flow and design pattern consisting of three components: Model, ViewModel, and View.
Asi 08 00133 g002
Figure 3. A visualization of data flow and component interactions in the MVVM architecture with BLE operations.
Asi 08 00133 g003
Figure 4. Trunk inclination limits and maximum holding time: green zone indicates safe range; yellow: short-term tolerance; red: unsafe range.
Asi 08 00133 g004
Figure 5. System architecture: wearable sensors transmit data via BLE to the smartphone, which processes, displays, and stores the data locally and triggers alerts; optional cloud-based data storage is shown for future extension.
Asi 08 00133 g005
Figure 6. Sensor placement: Thermometer positioned on the chest, oximeter attached to the finger, and IMU mounted on the upper back.
Asi 08 00133 g006
Figure 7. User interface of the app: (a) Home screen for initiating BLE connections; (b) Real-time data monitoring screen.
Asi 08 00133 g007
Figure 8. Trunk inclination exceeding the 60-degree threshold triggers an immediate posture alert.
Asi 08 00133 g008
Figure 9. Different alert cases with corresponding pop-ups: (a) Oxygen saturation below 94%; (b) body temperature > 100 °F; (c) heart rate > 120 bpm; (d) trunk inclination > 60 deg.
Asi 08 00133 g009
Table 1. Data packet format of the IMU sensor (data in bytes 7 through 64 are variable).
Byte No.Data (in Hex)Description
03APacket start
101OpenMAT ID LSB (ID = 1)  
200OpenMAT ID MSB
309Command no. LSB
400Command no. MSB
534Data length LSB (56 bytes)
600Data length MSB
7–105F 37 2A 00Timestamp
11–14CD CC 4C 3FEuler data x-axis
15–1866 66 86 3AEuler data y-axis
19–229A 99 99 3DEuler data z-axis
6312Check sum LSB
6434Check sum MSB
650AMessage end byte 2
660DMessage end byte 1
Table 2. Temperature reading comparison for data-extraction verification.
Time (s)Walnut
Temperature (F)
Koogeek
Temperature (F)
Difference
097.5297.700.18
2097.5297.700.18
4097.7097.700.00
6097.7097.700.00
8097.7097.880.18
10097.7097.880.18
Table 3. Health data records: retrieved from mobile device’s local storage.
Time (s)Body
Temperature (°F)
Oxygen
Saturation (%)
Heart
Rate (bpm)
Trunk
Inclination (deg)
10.35497.52979448.33
10.44697.52979447.78
10.58397.52979446.64
10.66197.52969546.23
10.75997.52969546.70
10.84997.52969548.01
Disclaimer/Publisher’s Note: The statements, opinions and data contained in all publications are solely those of the individual author(s) and contributor(s) and not of MDPI and/or the editor(s). MDPI and/or the editor(s) disclaim responsibility for any injury to people or property resulting from any ideas, methods, instructions or products referred to in the content.