Article

Residential Load Flow Modeling and Simulation

1
Faculty of Technical Sciences, University of Novi Sad, 21000 Novi Sad, Serbia
2
Schneider Electric LLC, 21000 Novi Sad, Serbia
3
Faculty of Sciences, University of Novi Sad, 21000 Novi Sad, Serbia
*
Author to whom correspondence should be addressed.
Appl. Syst. Innov. 2025, 8(5), 130; https://doi.org/10.3390/asi8050130
Submission received: 1 August 2025 / Revised: 3 September 2025 / Accepted: 10 September 2025 / Published: 12 September 2025

Abstract

In recent years, home energy management systems (HEMSs) have emerged as critical components within the concept of smart cities and grids. Within HEMSs, load flow analysis represents one of the fundamental tools for smart grid studies, forming the basis for a wide range of advanced applications, including state estimation, fault diagnosis, and optimal power flow computation. To achieve high levels of load flow accuracy and reliability, HEMSs must incorporate detailed models of all electrical elements found in modern residential units, including appliances, wiring, and energy resources. This paper proposes a load flow solution for smart home networks, featuring detailed models of wiring, appliances, and on-site generation systems. Moreover, a detailed appliance model derived from smart meter data, capable of representing both static-load devices and complex appliances with time-varying consumption profiles, is introduced. Additionally, a measurement-based validation of residential electrical wiring model is presented. The proposed models and calculation procedures have been verified by comparing the simulated results with the literature, yielding a deviation of approximately 0.7%. Analyses of a large-scale network have shown that this approach is up to six times faster compared to state-of-the-art procedures. The developed solution demonstrates practical applicability for use in industry-grade smart power management software.

1. Introduction

1.1. Motivation

Smart buildings and homes have become key components of the modern distribution-level smart grid paradigm. Besides consuming energy, they can also generate it through renewable energy sources such as photovoltaic (PV) systems, wind turbines, and other distributed generation (DG) technologies [1,2]. In that case, they can be called prosumers. Consequently, the traditionally passive nature of low voltage (LV) distribution networks (DNs) is evolving into an active, bidirectional system. In this context, prosumers contribute to the overall energy balance by partially meeting their own consumption demands and, in many cases, by exporting surplus energy back to the utility grid. To effectively manage these interactions, the development of advanced home energy management systems (HEMSs) [1,2] is essential. Such systems must integrate and coordinate a diverse range of residential loads (including smart appliances such as refrigerators, washing machines, televisions, and electric vehicle (EV) charging units) with on-site renewable energy resources (ERs) [3,4,5,6,7,8,9]. Those resources are expected to play an increasingly significant role for two primary reasons: first, the rapid population growth in both developed and developing countries is contributing to a substantial rise in energy demand and second, the cost of electricity supplied by large-scale distribution systems is increasing, largely due to the uneven expansion of infrastructure relative to consumption growth [9]. HEMSs are therefore used to manage on-site generation and consumption, to influence the demands in the energy market on user behalf, and to improve efficiency in both consumption and generation of the local communities. Additionally, there is a growing need for detailed and accurate models of residential ERs, which often employ complex control strategies under varying operating conditions [4,5,6].
Home electrical wiring systems vary globally due to differences in line section configurations. In European countries, single-phase two-wire and three-phase four-wire systems are predominantly utilized [7]. In these systems, the voltage between the neutral and the live (phase) conductor is typically 230 V, while the inter-phase voltage in a three-phase system is approximately 400 V, with a phase angle difference of 120 degrees. On the other hand, in countries such as the United States and Taiwan, single-phase three-wire systems are commonly employed [7]. In this configuration, the voltage between the neutral (grounded) wire and either of the two ungrounded (live) wires is approximately 110 V, with a phase angle difference of 180 degrees. The voltage between the two ungrounded wires is around 220 V. This configuration may originate from a split-phase system (110/220 V) or from a three-phase four-wire delta system. The adoption of such multi-wire configurations offers several advantages, including reduced line losses, voltage drops, and the need for fewer wires to supply equivalent areas within residential or commercial buildings.
Load flow analysis [5,7,8] is one of the most widely utilized functions in power system studies as it serves as the foundation for numerous advanced techniques such as state estimation, fault analysis, and optimal power flow. Consequently, HEMSs depend on accurate modeling of residential grid parameters and a reliable load flow calculation procedure which incorporates more detailed models of smart home wiring systems and appliances.

1.2. Literature Review

In recent years, numerous load flow algorithms have been developed to support distribution-level smart grid applications [4,5,8,10,11,12,13,14,15,16,17,18,19,20,21,22,23,24,25]. These methods address several key challenges inherent to DNs, including the following: (i) low X/R ratios, which are characteristic of distribution line segments and can affect numerical stability in power flow solutions [10,11]; (ii) multiphase line configurations that require more complex modeling techniques [12]; (iii) large-scale distribution network representations aimed at enabling real-time computational performance; (iv) unbalanced operating conditions, which necessitate more detailed and accurate network models to reflect phase asymmetries and load diversity [12]. Furthermore, the topology of DNs is generally more susceptible to structural changes compared to transmission networks. As a result, load flow solutions originally developed for transmission systems are often not directly applicable to DNs due to their distinct operational and structural characteristics [5,8]. In the context of distribution systems, load flow models are typically categorized as either node-oriented or branch-oriented, each offering specific advantages in terms of modeling flexibility and computational efficiency. Node-oriented load flow methods include Newton-based approaches [4,18,19], the Implicit Zbus method [22,23,24], and the Current Injection method [25]. In contrast, branch-oriented methods primarily comprise the backward–forward sweep (BFS) algorithm [12,13,15,16], Loop Impedance Matrix-based Load Flow [7], and the Distribution System Load Flow Solution (DADS) [11,21]. Among these, BFS techniques have demonstrated notable performance advantages in radial and weakly meshed DNs. This is largely due to their independence from matrix-based formulations, including the following: (i) the Bus Admittance Matrix [4]; (ii) the Bus-Injection to Branch-Current (BIBC) and Branch-Current to Bus-Voltage (BCBV) matrices [21]; (iii) the Branch Impedance Matrix [12]. Additionally, the simplicity and computational efficiency of BFS methods make them particularly attractive for industrial applications [5,12,26]. However, a known limitation of the BFS approach is the need for special handling of mesh structures in weakly meshed systems, which can lead to increased iteration counts and longer convergence times. Finally, linear models are used when performing distribution network (DN) planning and operation. These linearized models are approximate and allow the study of realistic (large-scale) networks. When dealing with virtual power plants and microgrids [27], it is important to have a precise simulator of residential units. To address highly uncertain parameters and to simplify the model, the utilization of a linear power flow model along with the adoption of a backward–forward sweep algorithm has been presented in [28].
Accurate and detailed models of residential networks offer numerous benefits, supporting both load flow analyses and grid-interactive efficient building applications [29,30]. Specialized load flow methods have been developed to address the specific requirements of residential networks across different regions of the world [7,29,30]. Paper [31] proposes a method to evaluate building energy consumption using the energy consumption monitoring index which is obtained from different functional sectors. It is based on energy consumption monitoring data, and it uses the linear regression model to predict the overall consumption. The study of HEMS with battery storage systems for peak load shaving was considered in [32]. The model includes PV with battery storage which is externally connected to the load. This model does not include any other types of consumers or electric installations in the home network. The impact of the voltage imbalance on the LV distribution networks is considered in [33]. The authors stated that the voltage imbalances could seriously damage the distribution equipment and speed up the equipment replacement cycle. Among all effects, the following ones are highlighted: extra power loss, safety deficiency, motor failure, and life-cycle attenuation. The higher the voltage imbalance, the greater the power consumption. Again, these imbalances were not considered in smart home wiring systems. The urgent need for smart energy coordination of residential homes is stated in [34]. The smart grid technology must be intelligent to coordinate small- and large-scale energy generation for the consumers since the rapid employment of DG units and Energy Storage Systems (ESSs) cannot be operated by standard system operators. This technology must be based on real-time control implementation which would improve the reliability, security, and efficiency of the distribution network. Additionally, in [34], the residential home is considered as a single consumer without concern for the impact of individual home appliances, DGs, and ESSs on the internal home power grid.
Paper [35] performs the assessment of household devices and appliances in terms of their power usage. The results show that modern appliances are changing the reactive load flow. This is due to the increasing usage of switching-mode power supplies. The measurement has not been performed over a longer period of time and covers the single-phase three-wire system only. Measurement in real time are necessary since some of the appliances can have different power load profiles. Paper [36] gave realistic load profiles of individual appliances based on the power consumption measurement over a longer period of time. This approach is more suitable for load flow modeling of the home network since it gives the opportunity to make more realistic models of the consumers. Both papers [35,36] do not use the load flow analysis based on the consumer profiles and they also did not consider the home wiring as an important smart home component.
The comparison of different load flow methods in distribution and residential networks has been presented in Table 1.

1.3. Research Gaps

To the best of our knowledge, references [7,10,29,30] represent the only studies that examine the electrical networks of residential and commercial buildings where appliances are modeled with time-invariant active and reactive power load profiles. Reference [7] investigates systems in both the United States and Taiwan, focusing exclusively on single-phase three-wire configurations. In contrast, references [10,29,30] are restricted to the modeling of European household electrical networks. The load flow algorithms presented in the rest of the referenced literature generally disregard the internal electrical networks of residential and commercial buildings, treating them instead as aggregated consumer nodes characterized by specified active and reactive power values. However, for a HEMS to operate with high accuracy, it is essential to develop detailed models that account for individual electrical appliances and the typical wiring infrastructure found in modern residential dwellings, which are largely absent from the power flow methodologies reviewed. Additionally, DGs are often modeled as standalone units connected directly to the distribution network, rather than as integrated components of a prosumer’s local network. When implementing HEMS optimization strategies [37,38,39], comprehensive and precise simulations of the dwelling unit are imperative. A proposed load flow approach that incorporates residential wiring layouts, appliance-level consumption profiles, and local generation sources is therefore a critical component of such simulations.

1.4. Contributions

To address the identified research gaps, this paper proposes a novel power flow calculation procedure tailored to a detailed electrical network model of residential buildings. The key contributions of this work are as follows:
  • Development of line models for single-phase two-wire, single-phase three-wire, and three-phase four-wire installation systems suitable for load flow calculations in various types of installations, such as smart homes across Taiwan, America, and Europe. Measurements used to determine the series and shunt parameters of residential wiring sections validate the modeling of home electrical networks.
  • Prosumer-based models for single-phase and three-phase DGs, as well as Electronically Coupled Distributed Generators (ECDGs), have been developed and integrated into the load flow framework. These models incorporate advanced control strategies to represent the behavior of ECDGs more accurately within residential energy systems.
  • A comprehensive load flow methodology and simulator tailored for smart home networks has been developed using the proposed network models. To achieve more realistic test scenarios, measurements of various household electrical appliances have been incorporated into the load flow simulator. The developed simulator constitutes a versatile platform for the evaluation of additional models and scenarios in the context of future experimental studies.
The remainder of this paper is organized in alignment with its primary contributions. Section 2 presents the modeling of single-phase and multiphase residential wiring systems, along with typical household consumers. This section also details the measurement methodology used to determine the series and shunt parameters of home network line sections. Section 3 introduces the proposed load flow model and the associated computational procedure tailored for residential networks. Section 4 provides model validation results, includes comparative analyses between simulated and measured data, and demonstrates the load flow simulations for several representative home circuit configurations. Additionally, this section addresses the integration of prosumer-based generation units into the residential network. Finally, Section 5 concludes the paper with a summary of key findings and potential directions for future research.

2. Home Network Models

Home network models of wiring and consumers are important parts of the load flow calculation. This section presents single- and multiphase home network wiring models. Those models cover the most frequent types of home wiring, including the USA and Europe ones. This section also presents two types of consumer models: simple consumer that has a constant active and reactive power consumption, and a complex one which varies its active and reactive powers in real time.

2.1. Single-Phase Three-Wire System and Consumer Model

The simple home network shown in Figure 1a is considered in [7]. Home installation from this figure represents a single-phase three wire system (1φ3w). The application of the 1φ3w system is more convenient than the single-phase two-wire system (1φ2w). The reason is explained as follows. The two sources connected between grounded and ungrounded conductor have the same magnitude. However, they have the opposite phase angle. In this manner, the voltage between two ungrounded conductors is twice the magnitude over the voltage between grounded and ungrounded conductor. The other advantages are moderate voltage drops, reduced line loss, and savings in materials during home installation construction.
The electrical circuit of the home installation from Figure 1a is represented in Figure 1b. The current sources represent loads from Figure 1b. The consumers are modeled as active and reactive powers known as ZIP consumer model [40]:
P k U k = z P k U k U n 2 P k spec + i P k U k U n P k spec + p P k P k spec ,
Q k U k = z Q k U k U n 2 Q k spec + i Q k U k U n Q k spec + p Q k Q k spec ,
where U k and U n are actual and nominal voltage magnitudes at load terminal. P k spec and Q k spec are specified active and reactive powers at nominal voltage. The coefficients z P k , i P k , p P k and z Q k , i Q k , p Q k are constant impedance and current and power coefficients, and the following relations are applied:
z P k + i P k + p P k = 1 ,
z Q k + i Q k + p Q k = 1 .
If the load power factor is specified at the nominal voltage, then the specified reactive power is calculated in the following manner:
Q k spec = P k spec 1 c o s ϕ k spec 2 1 .
If the consumer does not change active power and power factor in real time, it is sufficient to model it with just those two parameters. However, if the consumer varies those two parameters in real time (as described in [36]), then the model is based on the measured consumption in real time using the smart meter connected to the cloud [41], as described in Section 4.3 and [36].
Since the backward–forward sweep is practical for the industrial application [5,12,26], the neutral (grounded) line of the home network 1φ3w line must be integrated into the grounded wires. In this manner, the model of home line sections will be presented as standardized distribution line models from [5,8]. The circuit from Figure 1b with inserted artificial nodes is presented in Figure 1c. With artificial node insertion, the number of nodes is the same in all three conductors of 1φ3w lines. In addition, during the insertion of artificial nodes, the sections are divided into as many parts as there are nodes in ungrounded conductors (e.g., Z ^ 3 from Figure 1b is divided into Z ^ 3 I , Z ^ 3 II , and Z ^ 3 III in Figure 1c). The IDs of new generated nodes are shown in Table 2 with the corresponding node pairs. From Figure 1c, the grounded conductor nodes which correspond to the voltage source are named as root nodes (A0’ and A0”). Since the layer-type numeration must be implemented in order to apply the backward–forward sweep load flow procedure, the new node IDs are also shown in Table 2 (layer-type numeration row) and presented in the electrical circuit shown in Figure 1d.
From Figure 1d, the branch impedances of each 1φ3w line section are numerated in the following manner: each line section has three conductors (one grounded and two ungrounded). Each section has two sets consisting of three nodes (one node set closer to the voltage source node set and one further from the source node set). The IDs of branches from branch sets are the same with further section node sets.
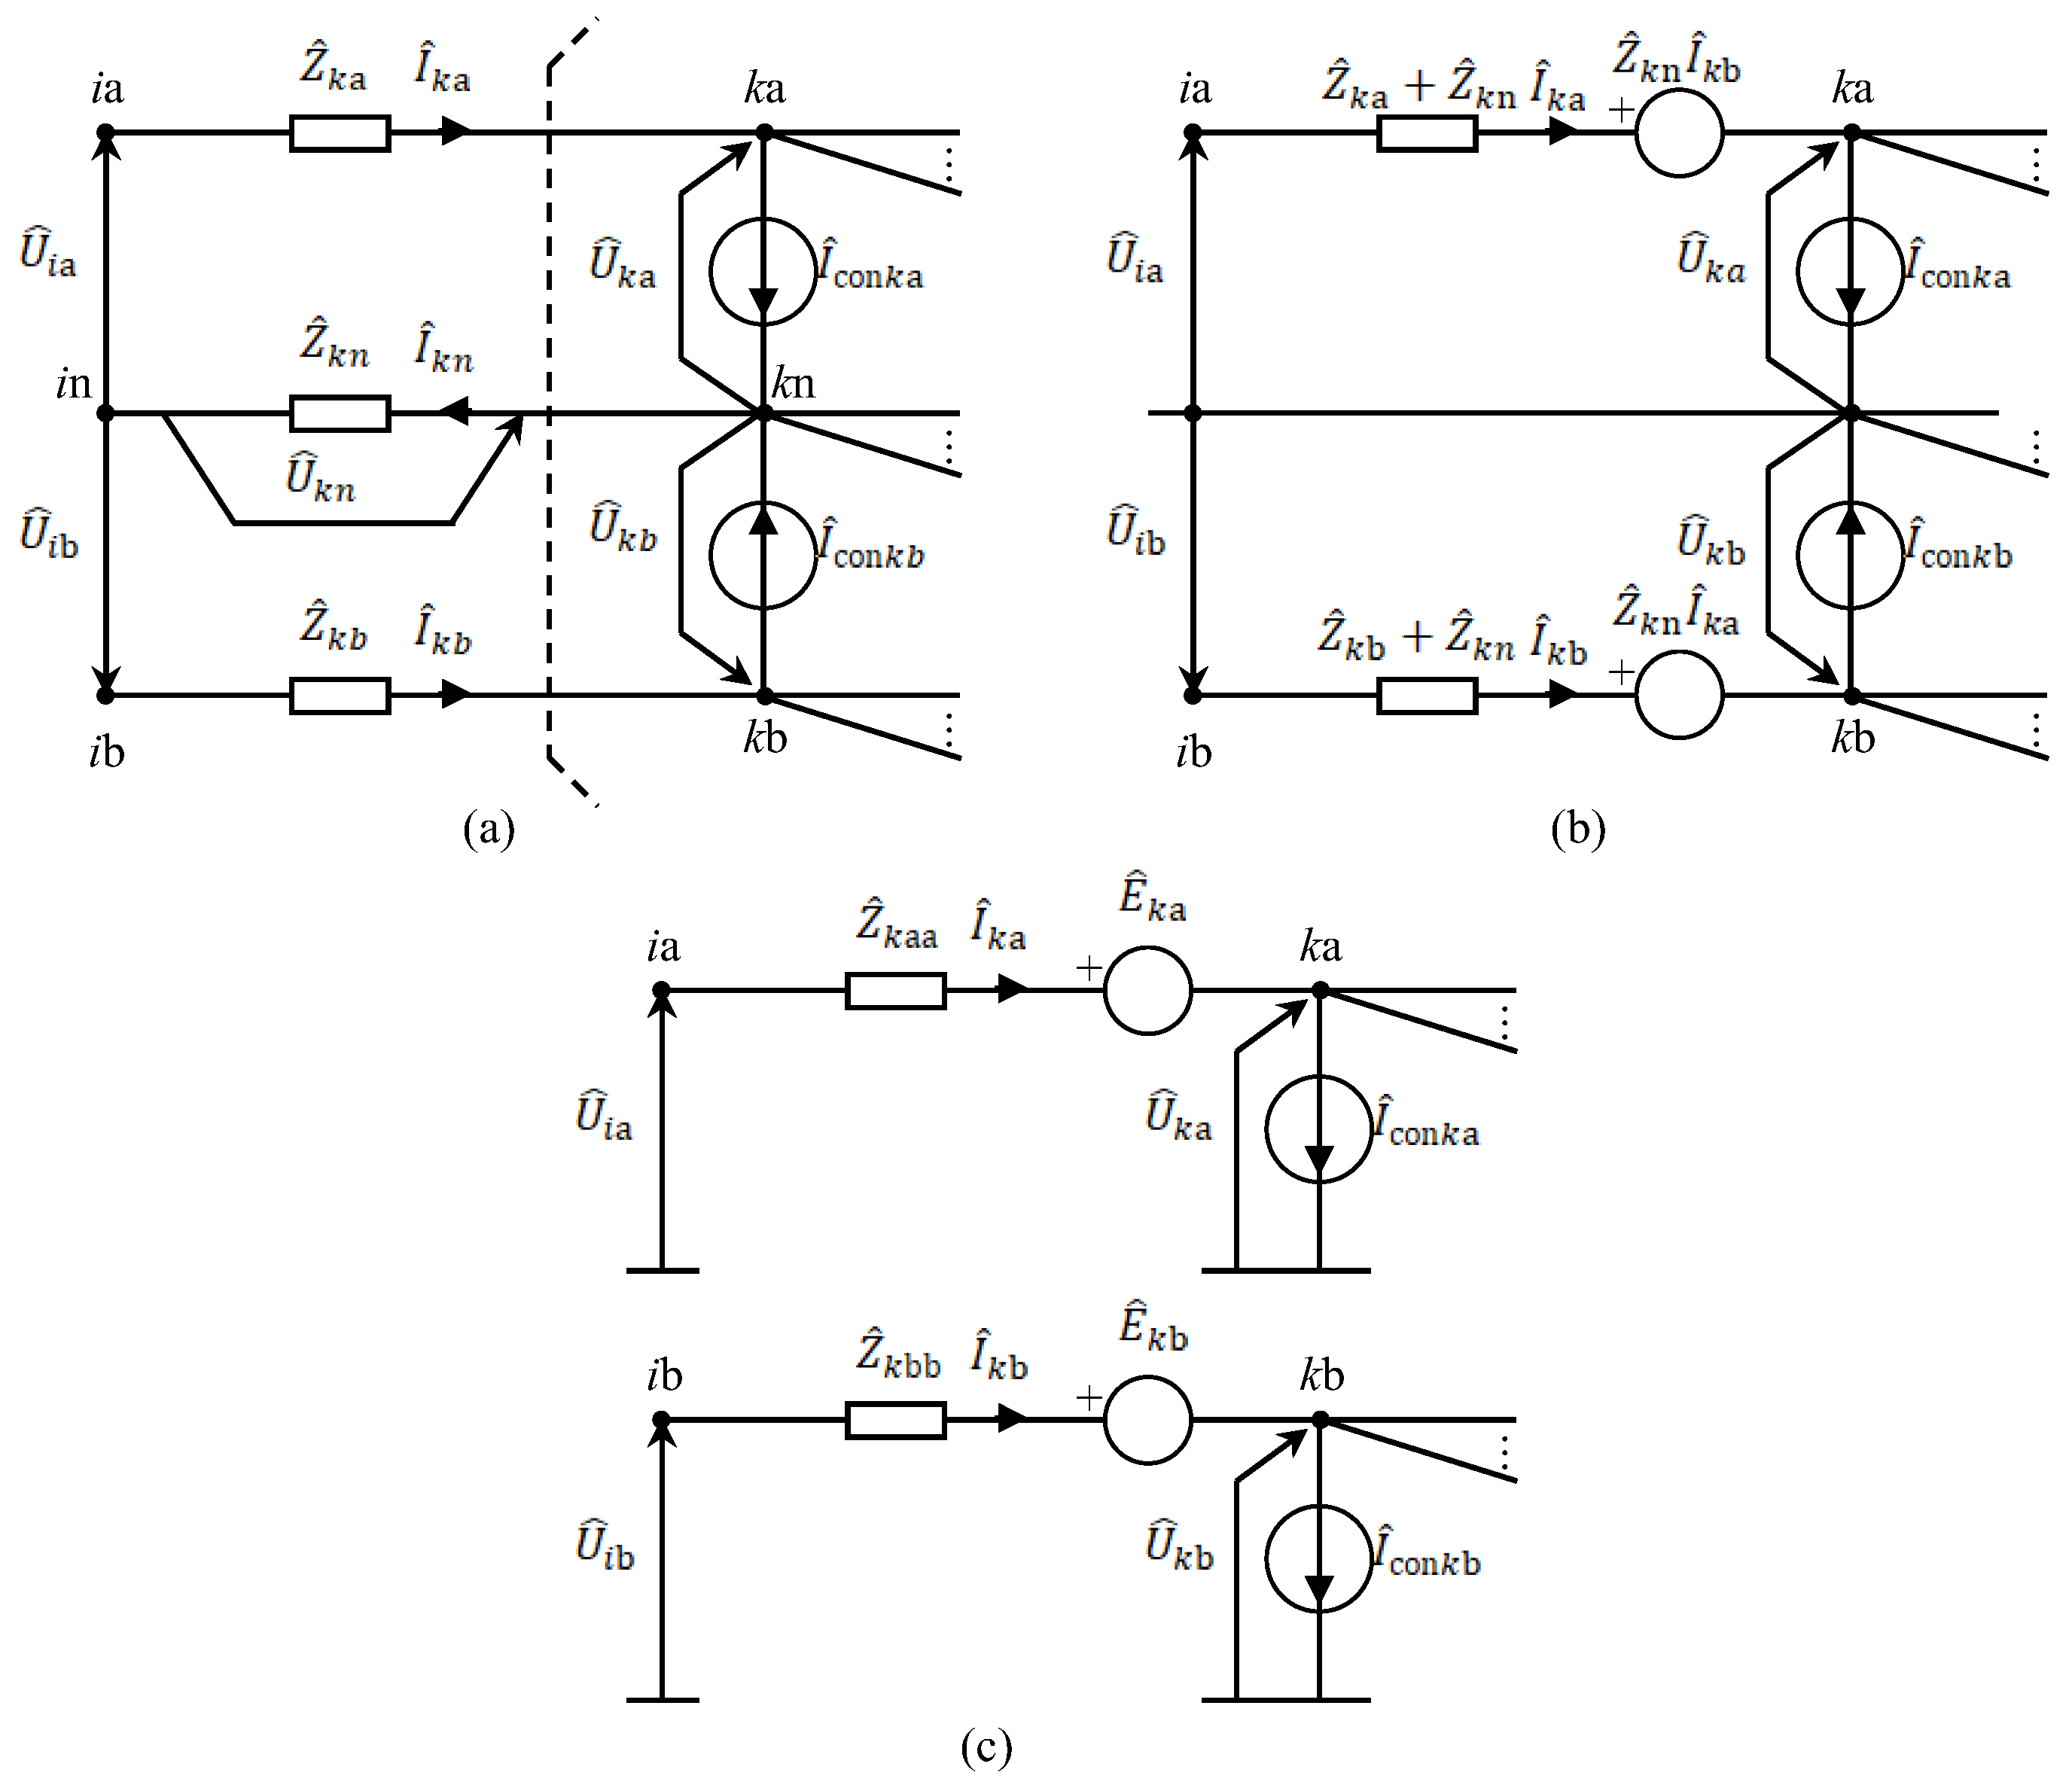
The model of each 1φ3w line section from Figure 1d is presented in Figure 2a. The 1φ3w line section k from this figure has two node sets: one node set closer to the root (in, ia, ib) and one further from the root (kn, ka, kb). Using Kirchhoff’s laws, the model of 1φ3w line section k is derived:
U ^ k a = U ^ i a Z ^ k a I ^ k a U ^ k n ,
U ^ k b = U ^ i b Z ^ k b I ^ k b U ^ k n ,
U ^ k n = Z ^ k n I ^ k n = Z ^ k n I ^ k a + I ^ k b .
This model is further optimized by dropping out the grounded conductor voltage drop U ^ k n from first two equations of the previous model (Figure 2b):
U ^ k a = U ^ i a Z ^ k a + Z ^ k n I ^ k a Z ^ k n I ^ k b ,
U ^ k b = U ^ i b Z ^ k b + Z ^ k n I ^ k b Z ^ k n I ^ k a .
The final model suited for the BFS load flow procedure application is as follows:
U ^ k a = U ^ i a Z ^ kaa I ^ k a E ^ k a ,
U ^ k b = U ^ i b Z ^ kbb I ^ k b E ^ k b .
The impedances Z ^ kaa and Z ^ kbb are self-impedances while the electromotive forces E ^ k a and E ^ k b represent inductive couplings between two single-phase ungrounded conductors. The model described above corresponds with the final decoupled section circuits (Γks, s = a , b ) shown on Figure 2c. The Γks circuits have one predecessor and, in general cases, more than one successor Γjs, j α k s , s = a , b .
The final home network circuit is presented in Figure 3. It can be observed from this figure that the ungrounded conductor wires are decoupled using the model described above. Furthermore, the required layer-type numeration has been used: the Γ segments directly supplied from the root with second nodes are put in the first layer. The successor Γ segments which are supplied from its predecessors from the first layer are put in the second layer. Finally, the last layer consists of Γ segments that have no successors (e.g., segments 8a and 7b from Figure 3). The network from Figure 3 has eight layers in phase a and seven layers in phase b. The BFS procedure adjusted for the smart home application is described as follows:
Backward sweep
I ^ k s h + 1 = I ^ conks h + 1 + i α k s I ^ i s h + 1 ,
I ^ conks h + 1 = S ^ k s U k s ( U ^ k s h ) * , s = a , b ;
Forward sweep
U ^ k s h + 1 = U ^ i s h + 1 Z ^ k s s I ^ k s h + 1 E ^ k s h + 1 , s = a , b ,
E ^ k s h + 1 = Z ^ k n I ^ k t h + 1 , s , t = a , b t s .
The load flow procedure starts with the backward sweep, where the branch currents are calculated starting from branches from the last layer. Afterwards, in the forward sweep the node voltages are calculated starting from the first layer. The procedure is finished when the convergence criteria U k s h + 1 U k s h < ε U , θ k s h + 1 θ k s h < θ U is achieved, where U k s and θ k s h are node k voltage magnitude and phase angle. The flow-chart of the procedure is presented in detail in Section 3.

2.2. Three-Phase and Multiphase Systems

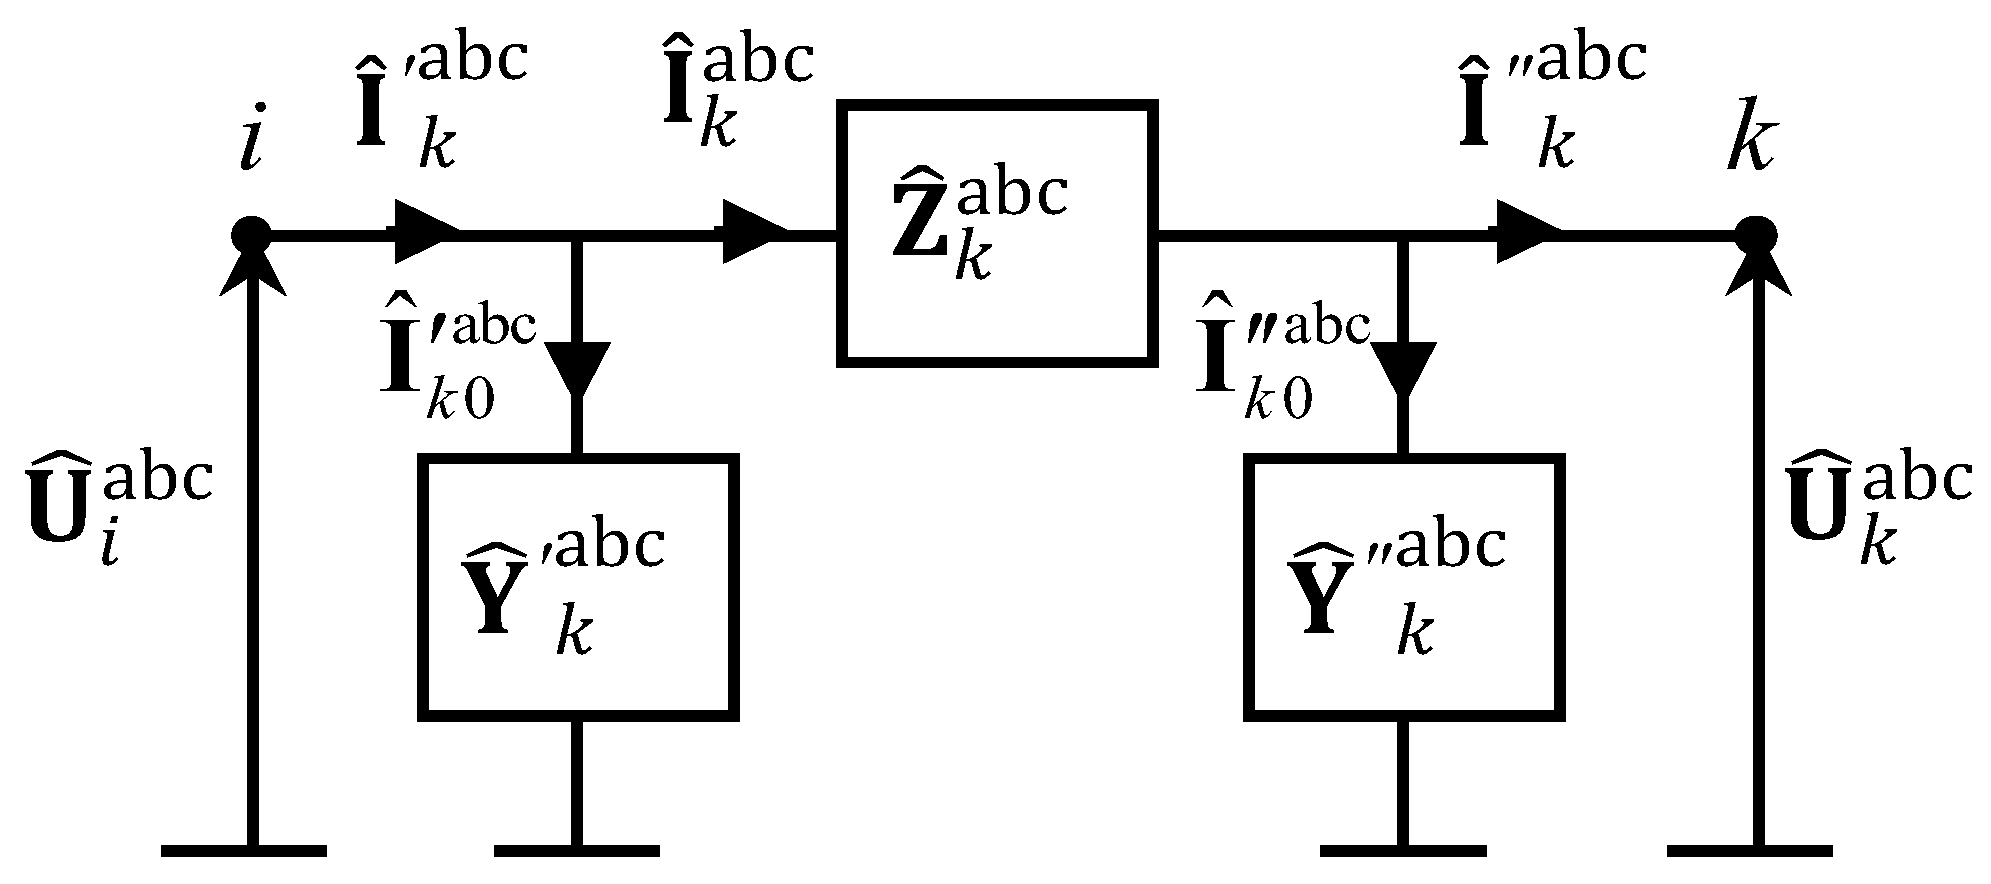
The European-style home installation mainly consists of four- and five-wire three-phase (3φ4w, 3φ5w) and single-phase three-wire line sections (1φ3w). In this system, an additional earth wire is added for safety reasons with zero potential and will not be considered since there is no regime in normal operating conditions for it. Additionally, using Carson’s equation with the Kron reduction the ground impedance is accounted into the model. The general multiphase Πk section is presented in Figure 4. The Z ^ k abc from this figure is a matrix of series impedances representing self and mutual inductive couplings of conductors. The Y ^ k abc and Y ^ k abc represent shunt matrices of self and mutual capacitive phase couplings and are usually considered as the same. The series and shunt matrices are of dimensions s × s , where s is the number of phase conductors. The model of the multiphase home installation line is as follows:
U ^ k abc = U ^ i abc Z ^ k abc I ^ k abc ,
I ^ k 0 abc = Y ^ k abc U ^ i abc ,   I ^ k 0 abc = Y ^ k abc U ^ k abc ,
I ^ k abc = I ^ k abc + I ^ k 0 abc ,   I ^ k abc = I ^ k 0 abc + I ^ k abc .
The meaning of voltage vectors U ^ k abc , U ^ i abc and current vectors I ^ k abc , I ^ k abc , and I ^ k 0 abc are obvious from Figure 4 and have the dimensions s × 1 . For the three-phase home line section, the series and shunt matrices are as follows:
Z ^ k abc = Z ^ kaa Z ^ kab Z ^ kac Z ^ kab Z ^ kbb Z ^ kbc Z ^ kca Z ^ kcb Z ^ kcc ,   Y ^ k abc = Y ^ k abc = Y ^ kaa Y ^ kab Y ^ kac Y ^ kab Y ^ kbb Y ^ kbc Y ^ kca Y ^ kcb Y ^ kcc .
The rows and columns which correspond to the missing phases of multiphase home line section are excluded from these matrices. Since the electric line parameters stored in these matrices are important for the load flow calculation and the specifications are rarely given in the factory specifications, the new method of series and shunt matrices measurement of the three-phase home line section has been presented in the next subsection.

Measurement of Series and Shunt Parameter Matrices of Home Line Sections

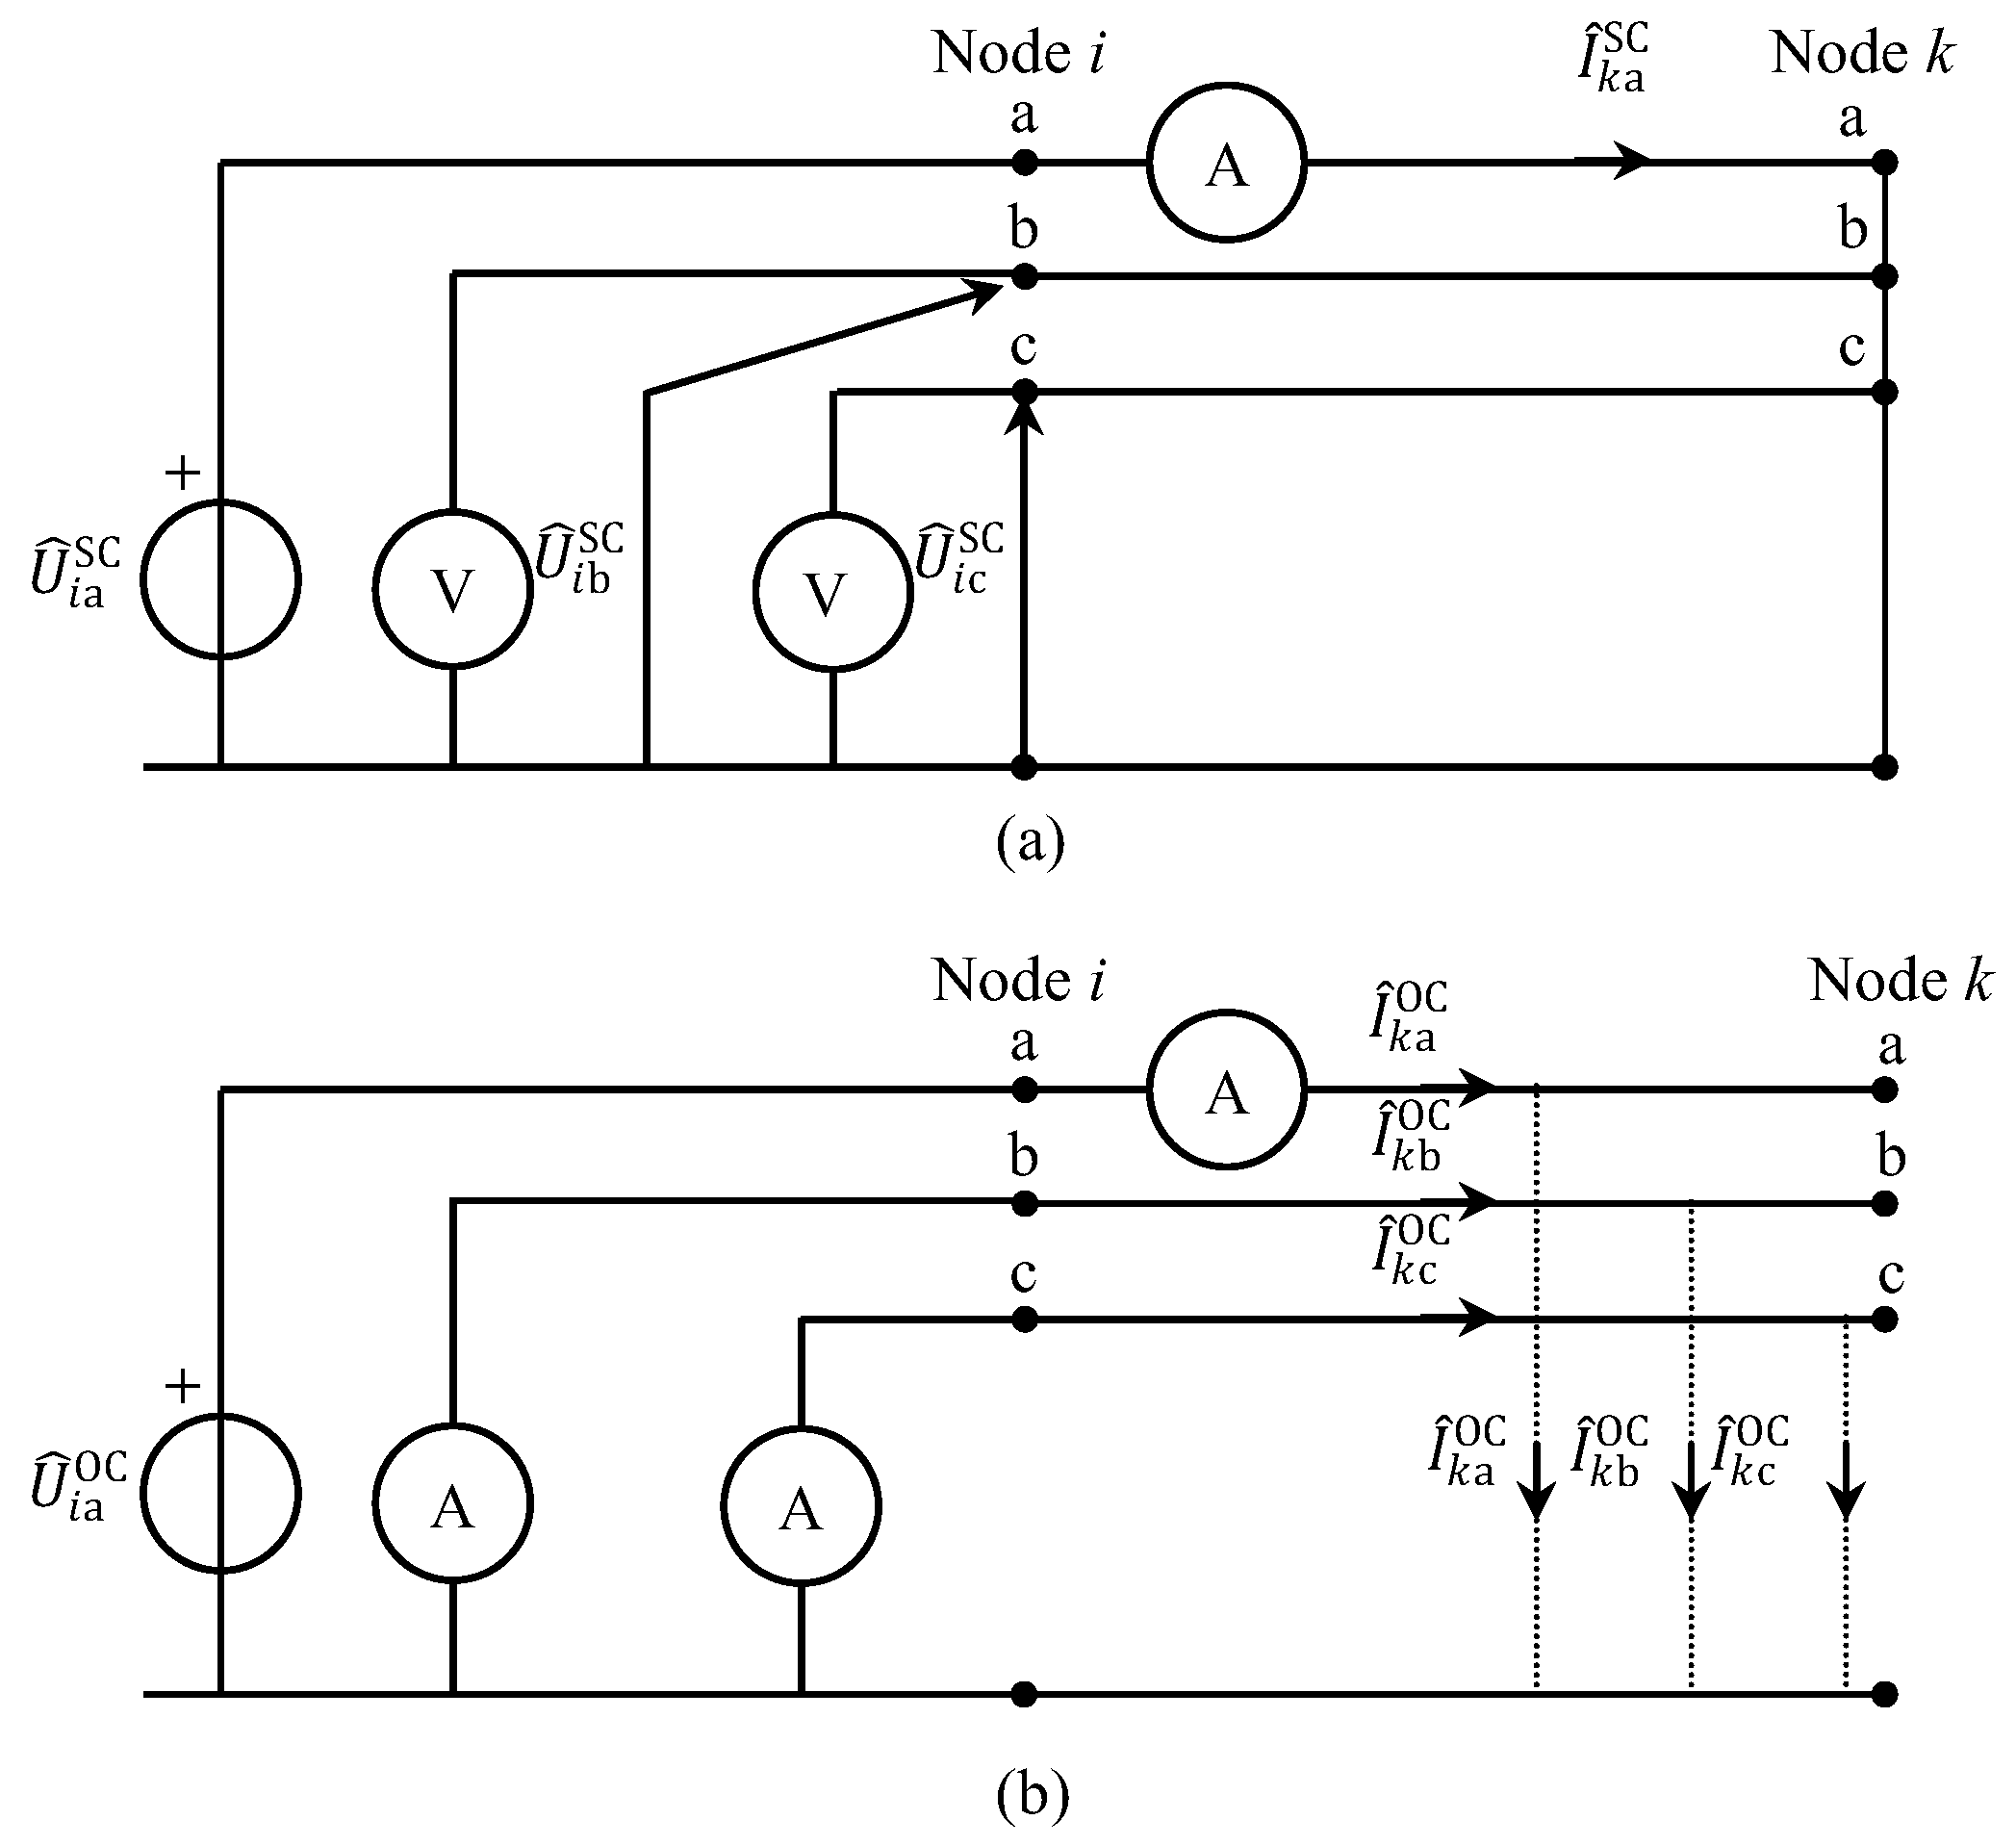
The series parameter matrix contains the series resistances and internal inductances, as well as the mutual inductances. The matrix of shunt parameters contains shunt conductances, self capacitances, and mutual capacitance between phases. In standard models, the resistance, inductance, and capacitance of the phases with the grounded neutral wire are integrated into the matrices Z ^ k abc , Y ^ k abc , and Y ^ k abc . For the stated reasons, the matrices of the three-phase home line sections are size 3 × 3. Although there are models whose matrices can be analytically calculated, it is very complex to apply such relations in practice, especially for the purpose of the low-voltage home network modeling. For that reason, matrices of series and shunt parameters need to be obtained empirically, i.e., by short- and open-circuit methods, respectively. Finally, it is important to emphasize that this measurement is used to verify the line models used in the BFS procedure presented in Section 4 (Results and Discussion).
A short-circuit method implies that the far end of the three-phase cable is short-circuited (Figure 5a). In this manner the capacitive effects are annulled. In the first stage of the method (Figure 5a), a voltage source is connected to phase a, which dictates the voltage U ^ i a SC of node ka, which causes the nominal branch current of the phase a. The voltage magnitudes and angles at the single-phase nodes of the other two phases (nodes kb and kc) can be measured. The following relations for the described method can be written:
U ^ i a SC U ^ i b SC U ^ i c SC = Z ^ kaa Z ^ kba Z ^ kca I nomka e j ψ k a .
The current I ^ k a SC from Figure 5a has nominal magnitude value ( I nomka ) which is specified by the installation manufacturers. The current phase angle is denoted as ψ k a . Since there are no branch currents of phases b and c, the corresponding columns of matrix Z ^ k abc from (9) are nullified in this stage of the method. The inductive self and mutual couplings with the other two phases are manifested through the current flow in phase a. The columns corresponding to phase a are calculated as follows:
Z ^ kaa Z ^ kba Z ^ kca = U ^ i a SC I nomka e j ψ k a U ^ i b SC I nomka e j ψ k a U ^ i c SC I nomka e j ψ k a .
In the same manner, the columns corresponding to phases b and c are obtained: first, the voltage source is connected to the phase b of the home line causing the nominal current magnitude value of the same phase. In this manner, the column corresponding to phase b is obtained. Second, the voltage source is connected to the phase c causing also the nominal current magnitude value of the same phase. Finally, the column corresponding to phase c is also obtained.
The open-circuit method implies that the line at the far end is left open (node k in Figure 5b). In this manner, the inductive couplings are annulled. In the first stage of this method, a voltage source of the nominal magnitude U ^ i a OC is connected to phase a (Figure 5b). The nominal magnitude U nomia is specified by the installation manufacturers. The currents that are measured are the capacitive-caused currents. Since the node voltages of phases b and c are nullified, the corresponding columns of matrices Y ^ k abc and Y ^ k abc from (9) are nullified as well. The columns corresponding to phase a are calculated as follows:
I ^ j a OC I ^ j b OC I ^ j c OC = 2 × Y ^ 0 kaa Y ^ 0 kba Y ^ 0 kca U nomia e j θ i a .
The phase voltage angle is denoted as θ i a . The current magnitudes and angles at the single-phase nodes of the other two phases (phase kb and kc from Figure 5b) can be measured. The capacitive self and mutual couplings with the other two phases are therefore measured using this method. The column corresponding to phase a is calculated:
Y ^ 0 kaa Y ^ 0 kba Y ^ 0 kca = I ^ k a OC 2 × U nomia e j θ i a I ^ k b OC 2 × U nomia e j θ i a I ^ k c OC 2 × U nomia e j θ i a .
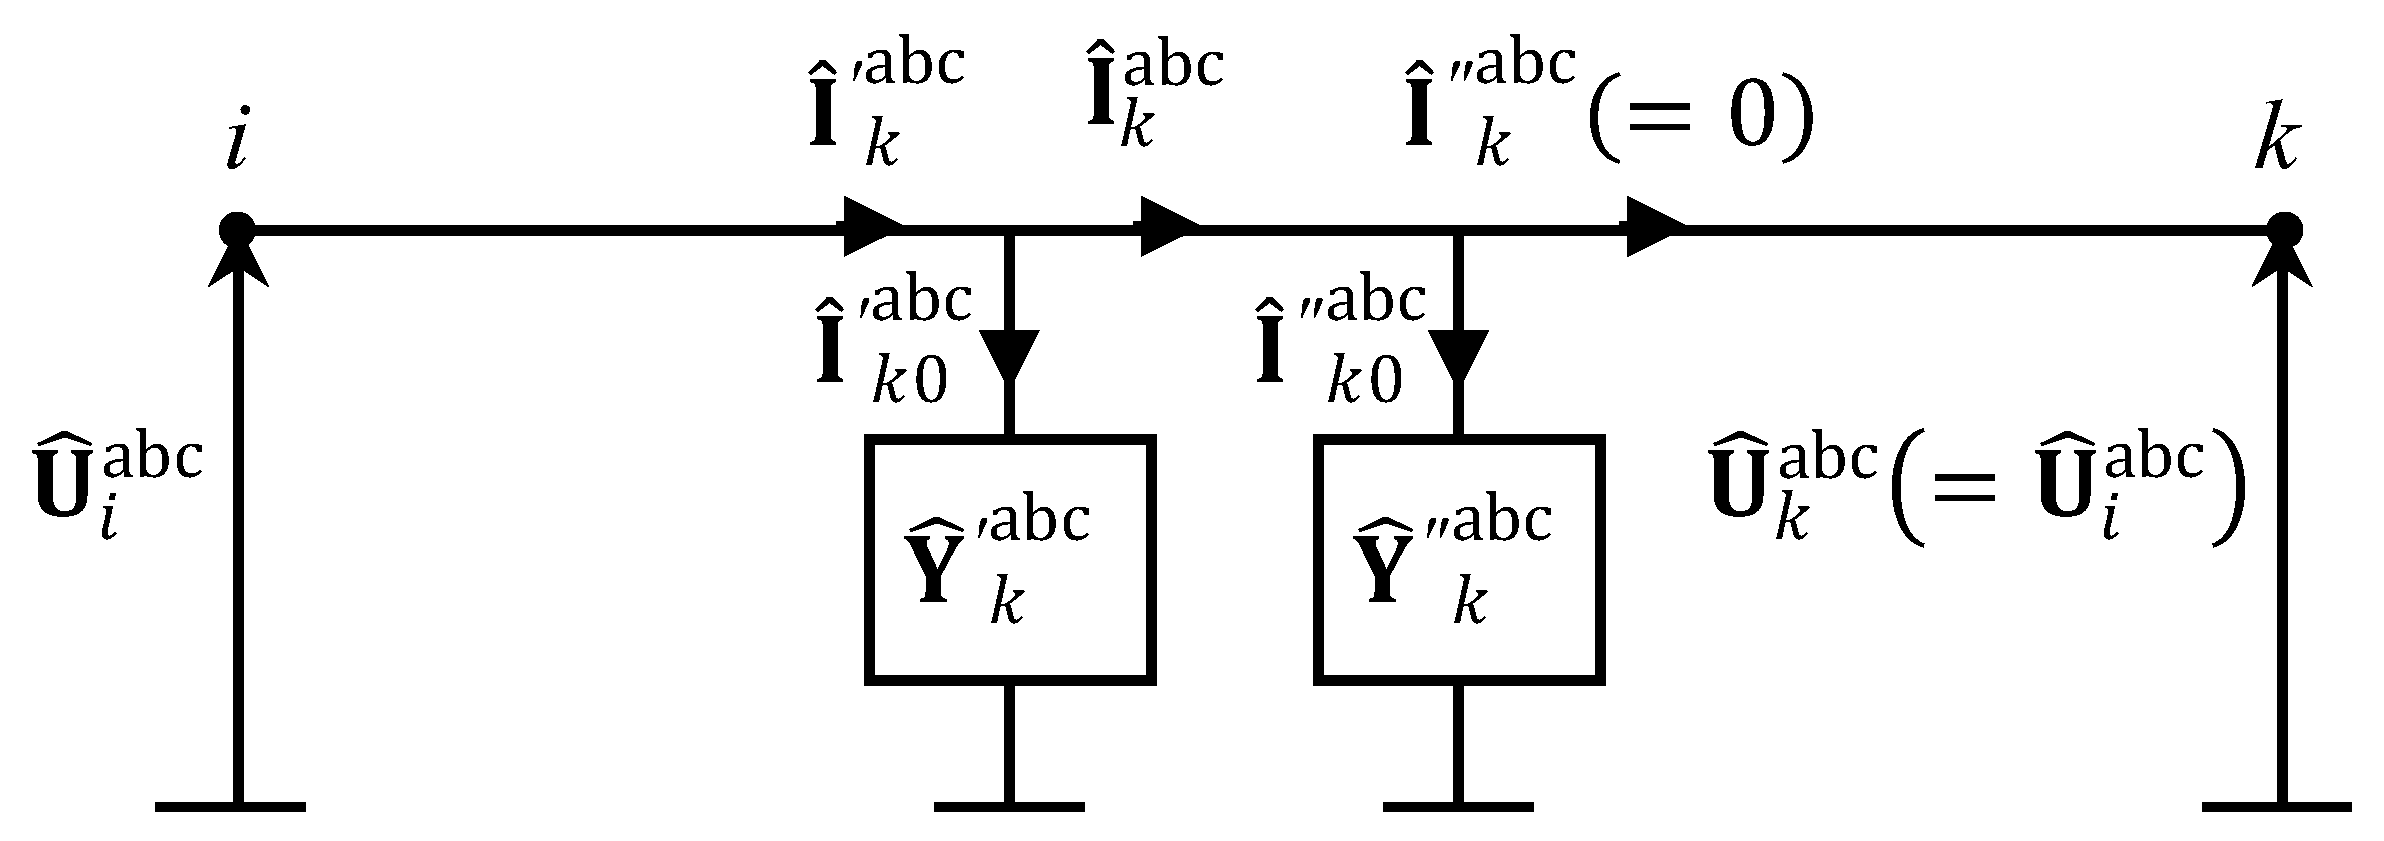
Relations (12) and (13) contain factor 2 as a consequence of the elimination of the series impedance matrix ( Z ^ k abc ) from Figure 4 (Section 2.2). During the open-circuit method, the inductive couplings are annulled. The assumption of equal voltages on both line ends was made (because of the reduced inductive effects) and this situation corresponds to Figure 6, where series impedance matrix ( Z ^ k abc ) is annulled. Since the equal shunt admittance matrices in Π circuits are assumed in most of the literature, the parallel shunt matrices are substituted with the double value of the admittance matrix elements.

3. Home Network Load Flow Model and Calculation

Considering the possibility of 1φ3w, 1φ2w, or 3φ4w systems, the decoupled Γks, s ϕ k section circuit is derived (Figure 7), where ϕ k is the set of phases of Πk section from Figure 4. The Γks, in general cases, could have multiple successor segments (Γjs from Figure 7). The successor indices are stored in the successor set α k s .
The impedance Z ^ k s s from Figure 7 corresponds to the self inductance of section k and they are the same as the diagonal element in the matrix Z ^ k abc from (9) which corresponds to the same phase. The admittance Y ^ Σ k s represents total capacitance of the Πk section and Πj successor segments. This admittance is obtained by summing the admittances of the predecessor Πk section and the successor Πj segments. The capacitive couplings with the other phases are represented with I ^ CCks . The inductive couplings with the other phases are represented with the E ^ k s . The load flow procedure for the home installations is as follows:
Backward sweep
I ^ conks h + 1 = S ^ k s U k s h U ^ k s h * ,
I ^ CCks h + 1 = t ϕ k t s Y ^ k s t U ^ k t h + 1 ,
I ^ k s h + 1 = Y ^ Σ k s U ^ k s h + 1 + I ^ CCks h + 1 + I ^ conks h + 1 + t α k s I ^ t s h + 1 ,   s = a , b , c ;
Forwardsweep
E ^ k s h + 1 = t ϕ k t s Z ^ k s t I ^ k t h + 1 ,
U ^ i s h + 1 = U ^ k s h + 1 Z ^ k s s I ^ k s h + 1 E ^ k s h + 1 ,   s = a , b , c .
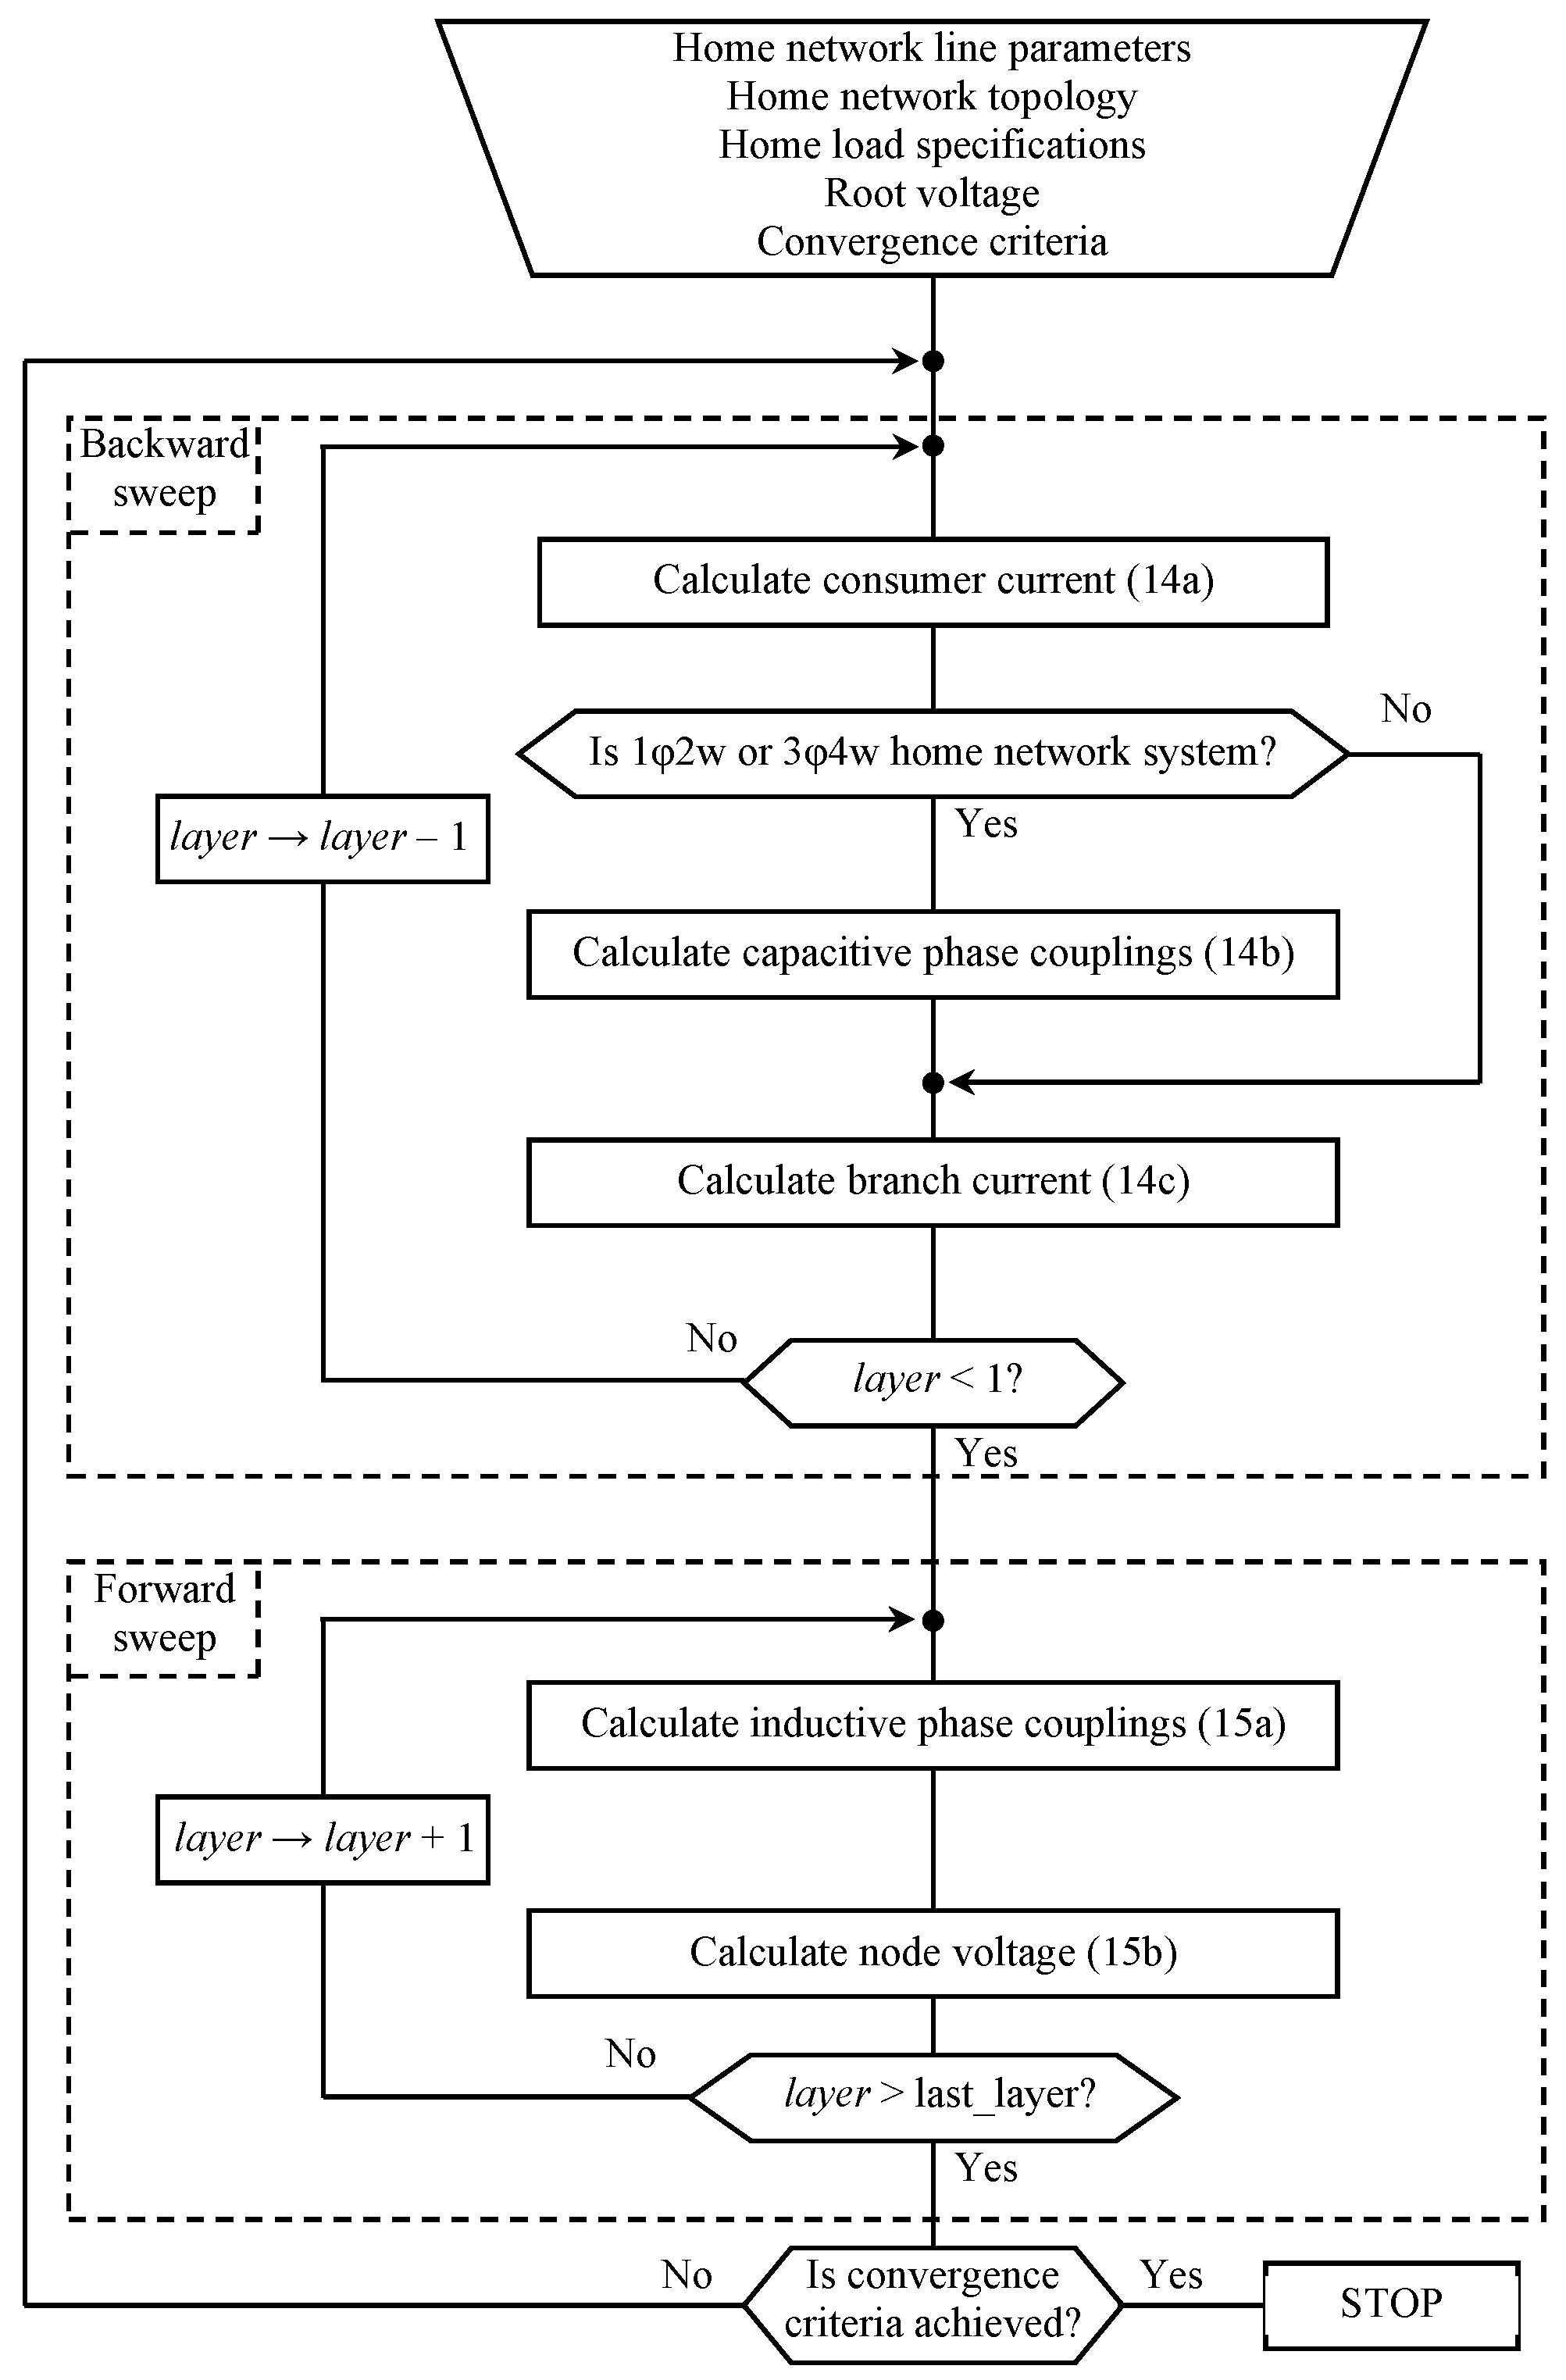
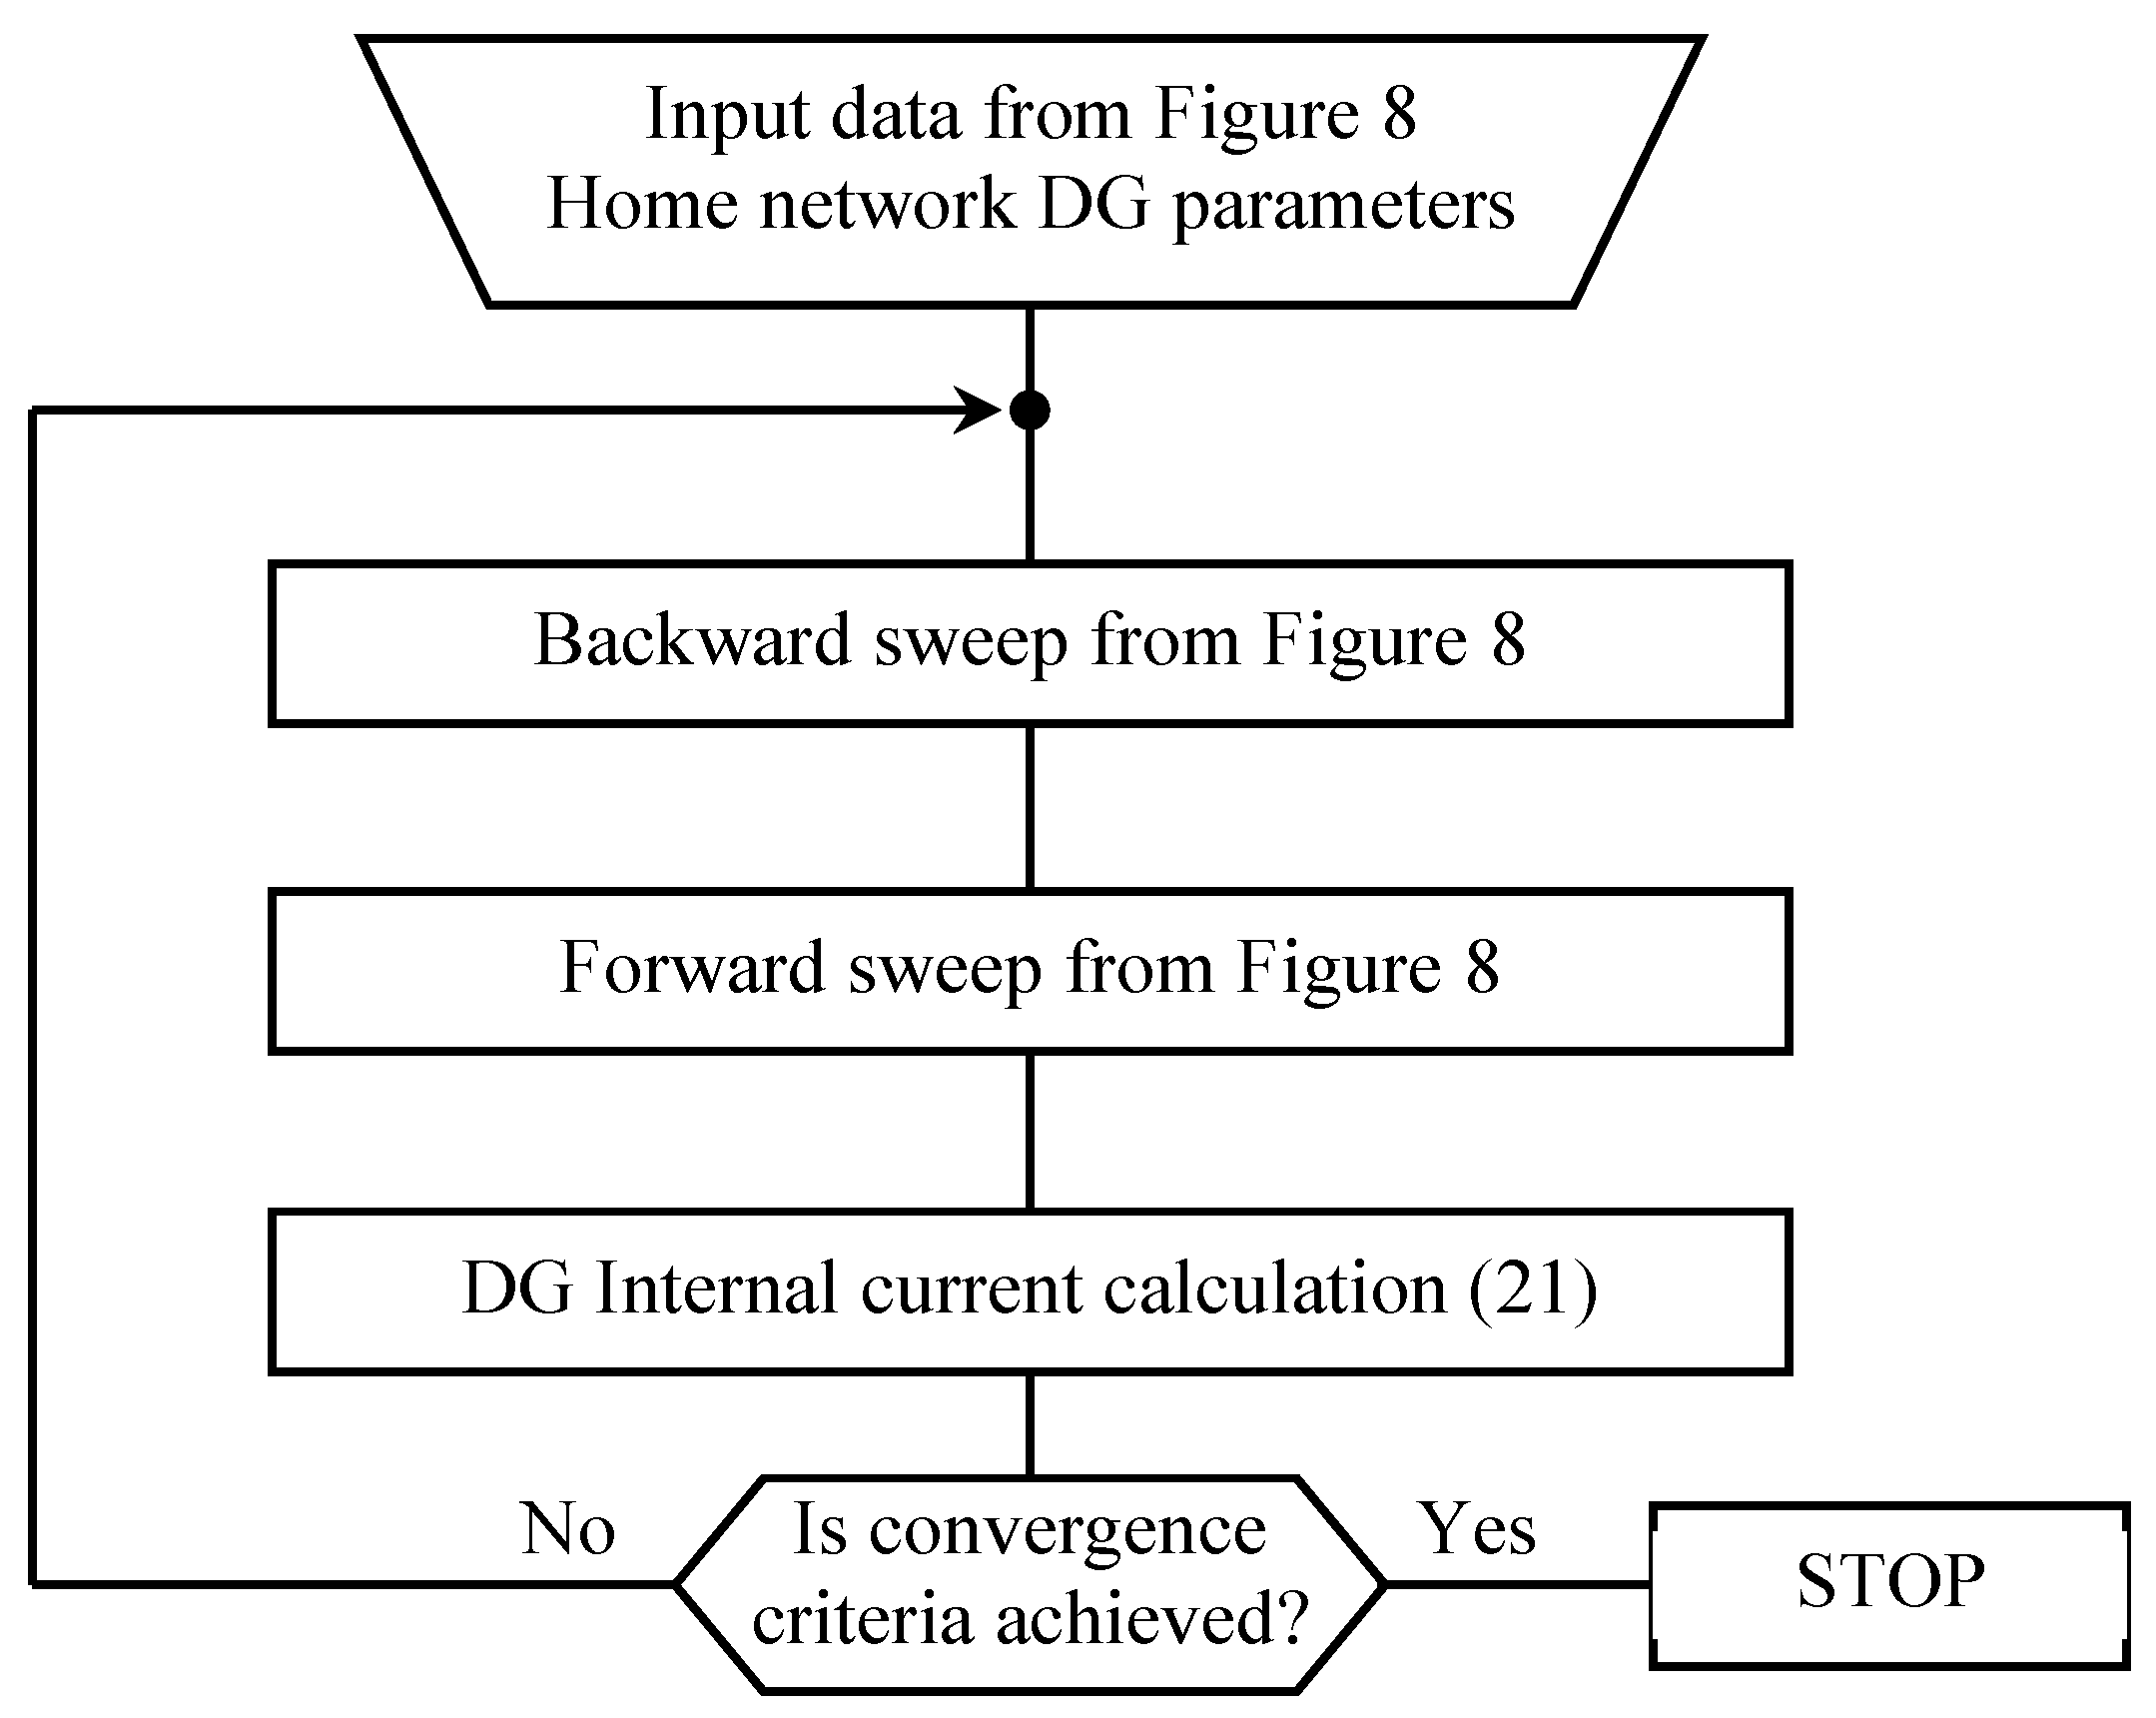
The BFS procedure is presented in Figure 8. The procedure is finished when the convergence criteria is achieved. If the 1φ3w system is observed, the number of phases is two and the capacitive coupling calculation (14b) is not executed. As stated earlier in this paper, before the BFS execution, the layer-type node numeration of the home grid must be performed first. In this case, the BFS load flow procedure does not handle loops since the home electric installations have a strictly radial structure. In the weakly meshed DNs, the loops are managed with the Thevenin theorem [5].

Three-Phase Distributed Generator Model Integration in Load Flow Procedure

The modern home premises are categorized as prosumers, meaning that the electric power can be generated through distributed generators (DGs) such as solar panels, wind turbines, and small-scale hydro turbines. The load flow model must integrate the various types of DG models in order to have robust and easy maintainable software [5,6,26].
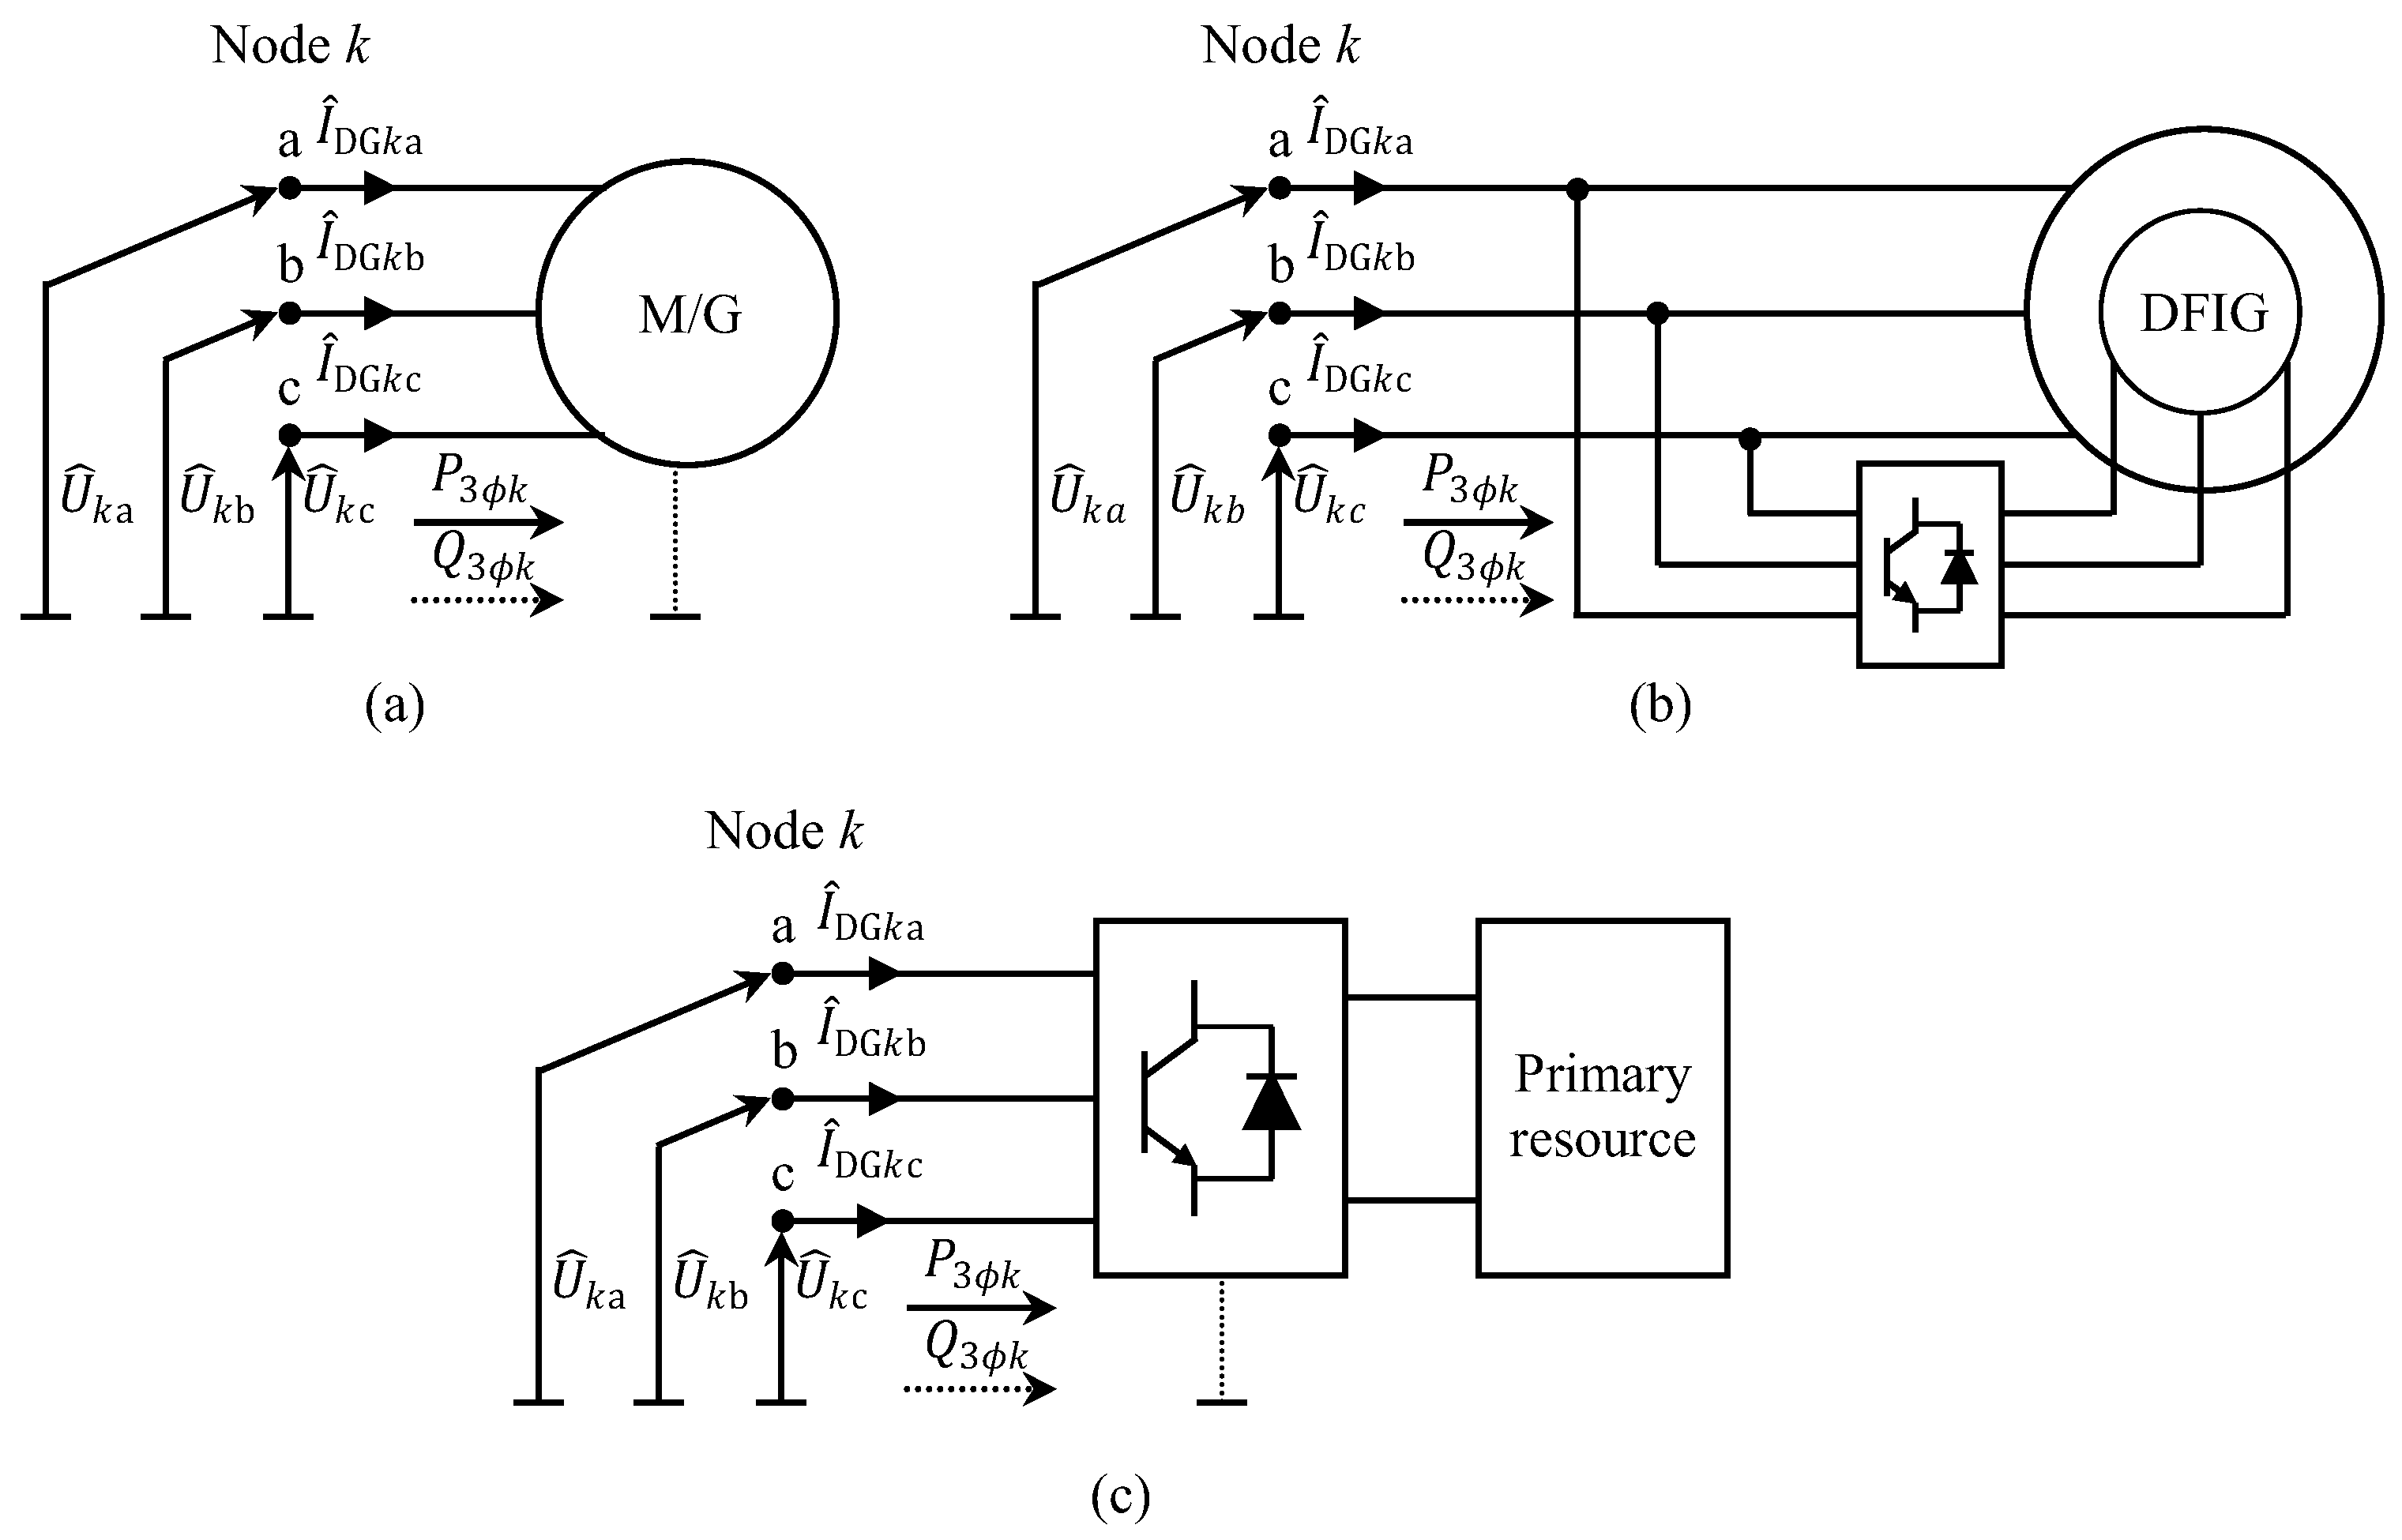
The DGs are presented in Figure 9. There are three main categories of the three-phase DGs: (i) The traditional type of DGs based on the diesel generators or the older type of the wind turbines with the traditional synchronous machines (Figure 9a). (ii) The new type of the wind turbines based on the Double-Fed Induction Generator (DFIG), where the stator is directly connected to the grid and the rotor is connected through the power electronic devices. These DGs are categorized as DGs partially connected via power electronics devices (Figure 9b). (iii) PV systems and some type of wind turbines where all the resources are connected to the grid through the power electronic devices (Figure 9c). The configuration of the power electronics could be three-wire or four-wire. The three-phase node k from Figure 9 is considered as the Point of Common Coupling (PCC). In this paper, the described control strategies are implemented at the PCC.
The control strategies of the traditional DGs (based on the synchronous machines) are implemented in the following manner: the three-phase active ( P 3 ϕ k ) and the three-phase reactive power ( Q 3 ϕ k ) are controlled at the PCC. Thus, the three-phase active power is P 3 ϕ k > 0 with the three-phase reactive power possible values being as follows: Q 3 ϕ k > 0 Q 3 ϕ k = 0 Q 3 ϕ k < 0 . The values of the reactive power depend on the status of the synchronous machine (over-excited, normal operating condition, under-excited).
If the induction machine is considered, then the active power is P 3 ϕ k < 0 , and the reactive power depends on the machine parameters and is strictly Q 3 ϕ k < 0 . In this paper they are denoted as DG type 1.
The control strategies of DFIG-based DGs and DGs that are connected to the grid through the power electronic devices are more complex since they can employ more strategies than the traditional ones. Additionally, they can dictate or block the inverse sequence current ( I DGk i ) and they can block the zero-sequence current ( I DGk 0 ). Thus, if both sequence currents are blocked, the symmetrical three-phase current is injected into the network. In this paper, they are denoted as DG type 2 and the injected three-phase balanced current strategy is considered.
Since the home network is unbalanced, the more detailed DG model must be considered. This is due to the phase voltage and current disbalances which are significantly higher in the modern active multiphase DNs compared to the traditional ones. Thus, the impact on the machine rotor or power electronics is more expressed.
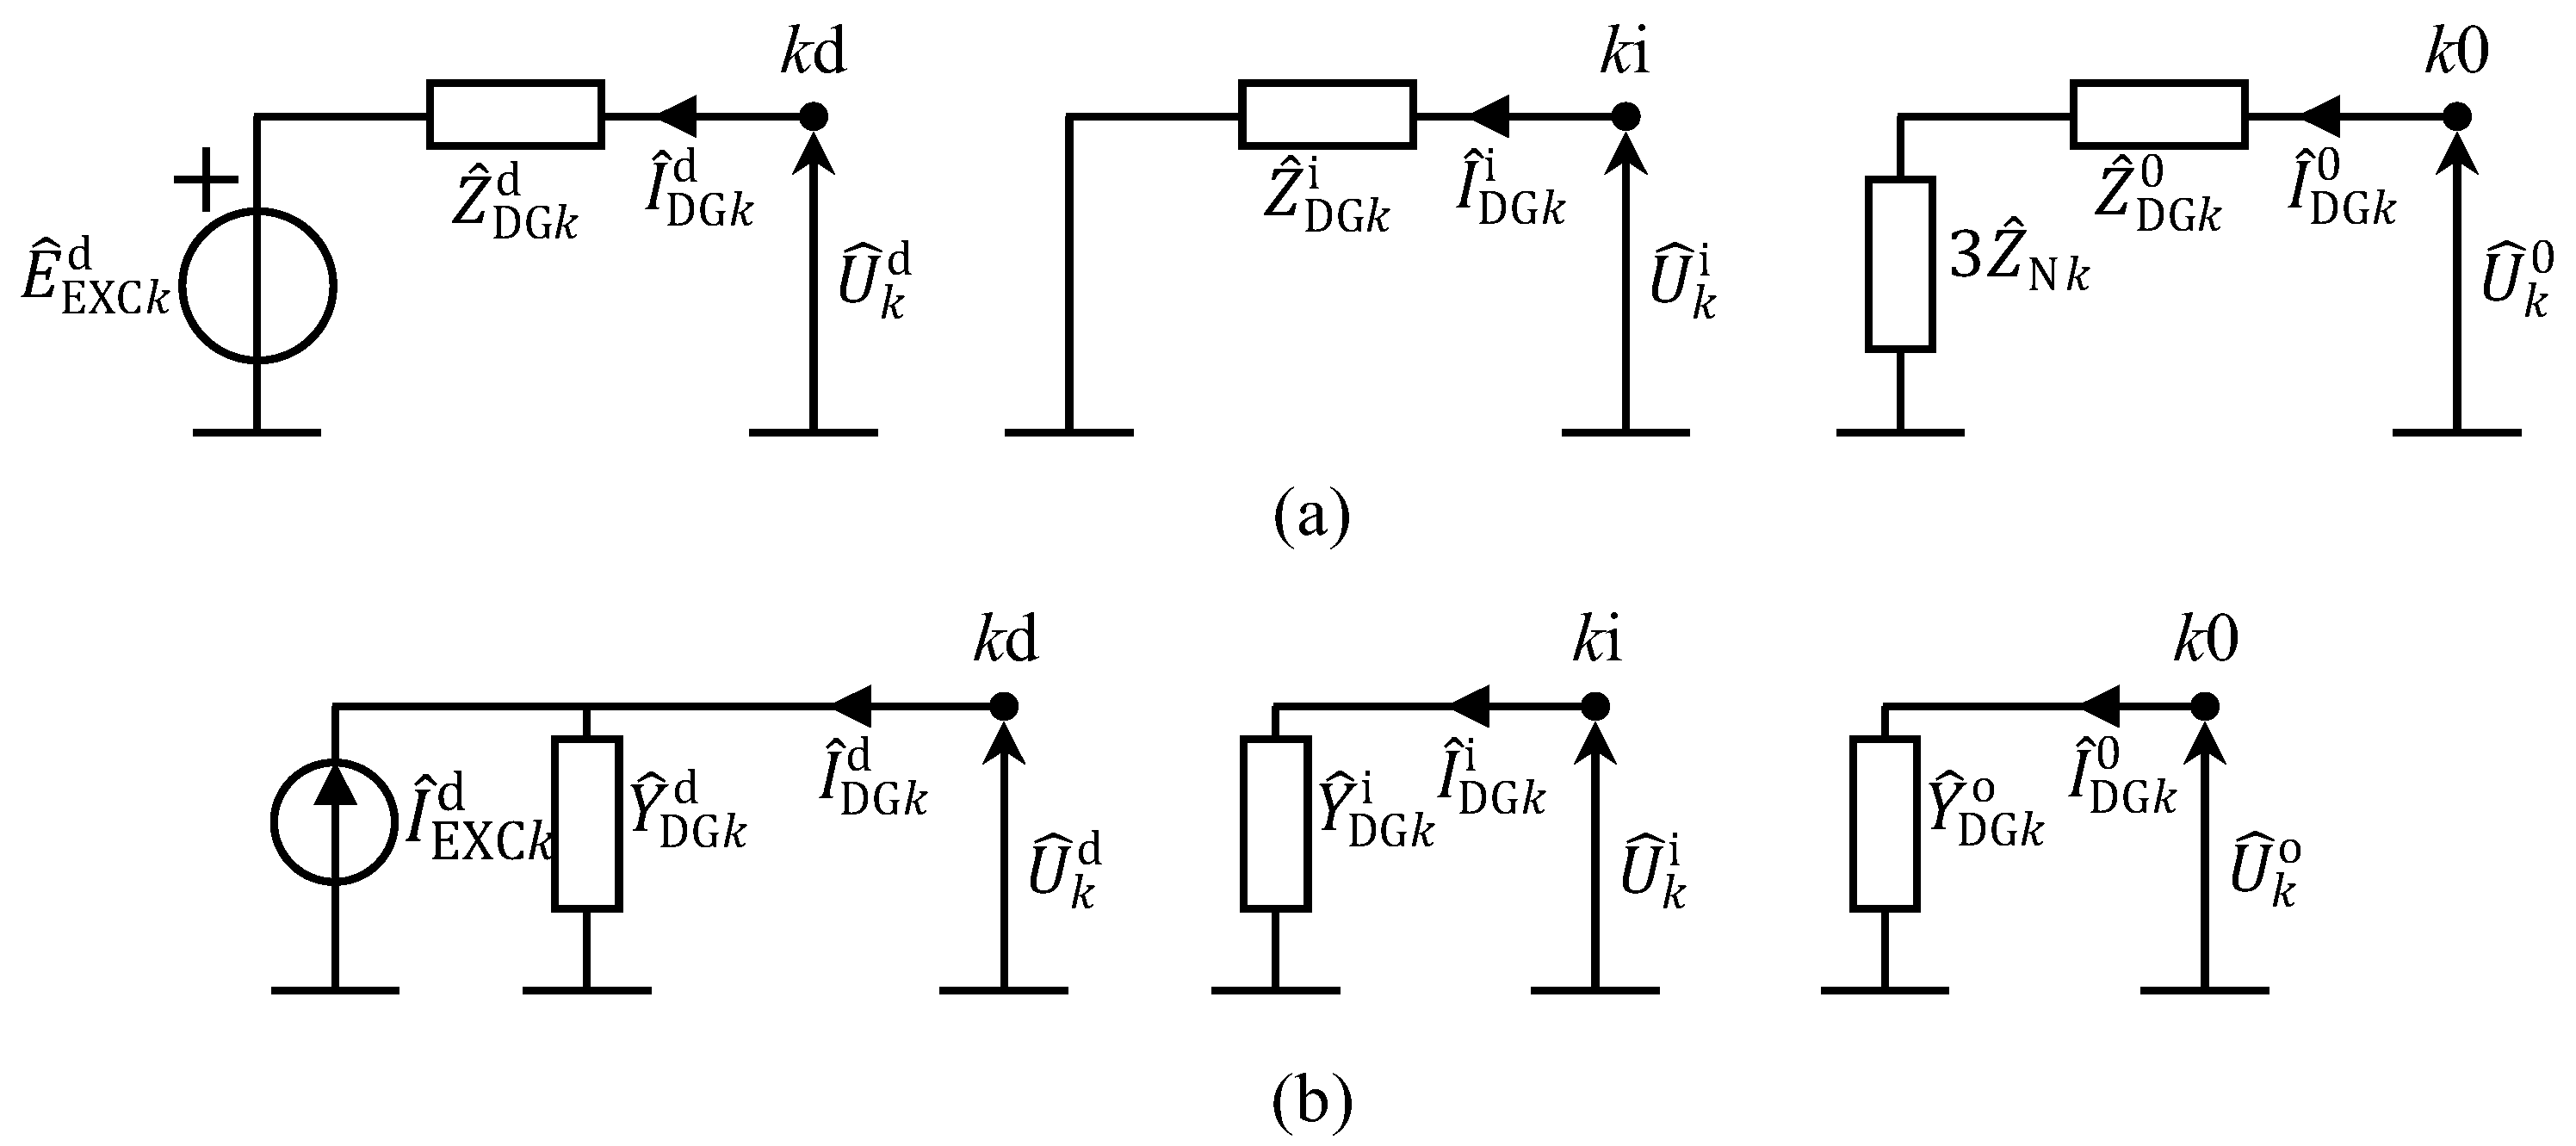
The DGk sequence circuits are presented on Figure 10a, and they are represented as the Thevenin equivalent circuits. In this figure, the positive sequence impedance is denoted as Z ^ DGk d . The reactive part of this impedance is the subtransient reactance X DGk d . The DGk internal voltage (electro motive force) is denoted with E ^ EXCk d . The negative and zero sequence impedances are denoted as Z ^ DGk i and Z ^ DGk 0 , respectively. The impedance between the neutral and the ground is denoted as Z ^ N k .
In this paper, the Thevenin equivalent is transformed into the Norton equivalent since it is more suited for the BFS procedure. The Norton equivalent sequence circuits are presented in Figure 10b. The model in matrix form is as follows:
I ^ DGk d I ^ DGk i I ^ DGk 0 = I ^ EXCk d 0 0 + Y ^ DGk d 0 0 0 Y ^ DGk i 0 0 0 Y ^ DGk 0 U ^ k d U ^ k i U ^ k 0 , I ^ EXCk d = E ^ EXCk d / Z ^ DGk d .
Considering the control strategies represented using DG types from Table 3, the following equations apply:
Y ^ DGk i 0 , if   DG k   is   type   1 , = 0 , if   DG k   is   type   2 ;  
Y ^ DG k 0 0 ,   if   DG k   is   grounded   or                     DG k   is   implemented   as   four                     wire   configuration ; = 0 ,     if   DG k   is   ungrounded   or                     DG k   is   implemented   as                       a   three   wire   configuration .  
Since the phase domain of the home network circuit model is considered, the DG model in this domain is considered as well. Using the transformation matrices
T ^ = 1 3 1 a ^ a ^ 2 1 a ^ 2 a ^ 1 1 1 , T ^ 1 = a ^ 2 a ^ 1 a ^ a ^ 2 1 1 1 1 , a ^ = e j 2 π 3 ,
the DGk model from (16) is transformed from the sequence to the phase domain:
I ^ DGka I ^ DGkb I ^ DGkc = I ^ EXCka I ^ EXCkb I ^ EXCkc + Y ^ DGkaa Y ^ DGkab Y ^ DGkac Y ^ DGkba Y ^ DGkbb Y ^ DGkbc Y ^ DGkca Y ^ DGkcb Y ^ DGkcc U ^ k a U ^ k b U ^ k c .
The DGk internal current sources I ^ EXCks , s = a , b , c from (19) are balanced; therefore, the following rule applies: I ^ EXCkb = a ^ 2 I ^ EXCka , I ^ EXCkb = a ^ I ^ EXCka . The presented phase domain model in matrix form (19) is further developed in the following decoupled form:
I ^ DGks = Y ^ DGkss U ^ k s I ^ PCks I ^ EXCks ,
I ^ PCks = t a , b , c t s Y ^ DGkst U ^ t ,   s = a , b , c .
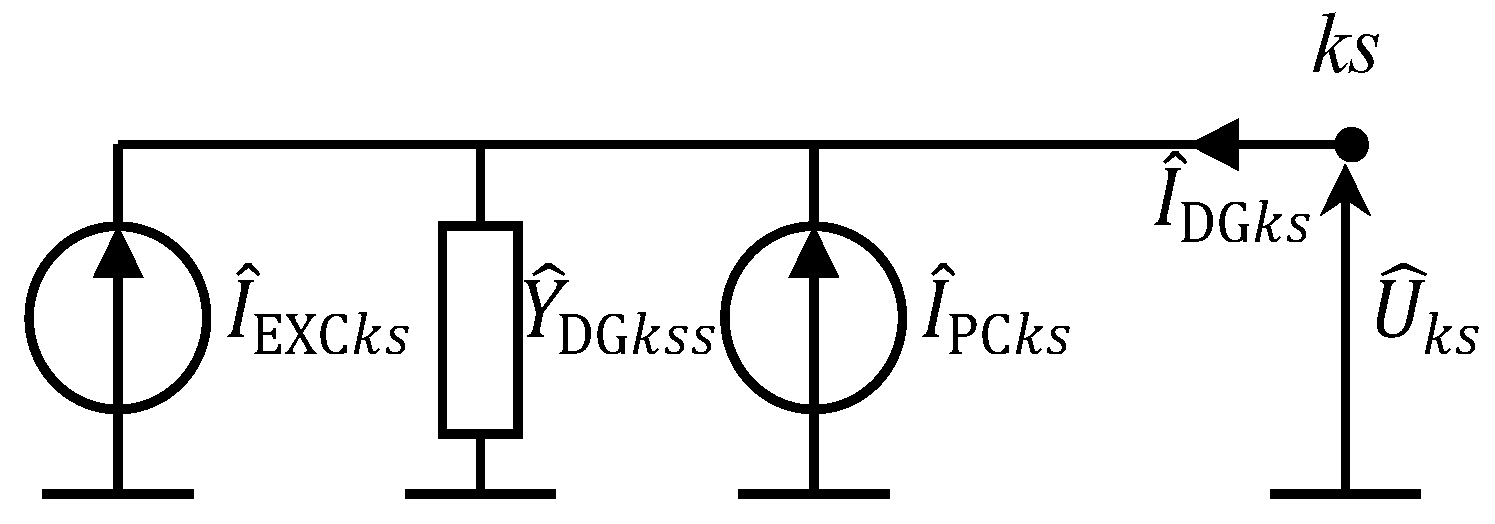
The phase couplings (PC) with the remaining phases t a , b , c t s of the phase s are modeled with the current source I ^ PCks . Considering the model (20), the phase domain decoupled Norton equivalent circuit of the DGk is presented in Figure 11.
The DGk internal current source is calculated using the following equations:
I ^ EXCka = S ^ 3 ϕ k s = a , b , c U ^ k s * Y ^ DGkss U ^ k s I ^ PCks U ^ k a * + a ^ 2 U ^ k b * + a ^ U ^ k c * ,
I ^ EXCkb = a ^ 2 I ^ EXCka ,
I ^ EXCkc = a ^ I ^ EXCka .
It should be noted that the single-phase DG is modeled as the consumer with the negative active and reactive powers from Section 2.1.
The DG model is integrated into the load flow procedure in the following manner: following the backward and forward procedure execution, the DG internal currents are calculated. The flow-chart of the DG model integration into the BFS procedure is presented in Figure 12.

4. Results and Discussion

This section presents the validation of the proposed load flow model, supported by empirical measurement results and simulation outcomes for several representative residential circuits. These include the following: (i) A home wiring installation network adopted from [7], used to verify the accuracy of the developed model and load flow procedure (Section 4.1). (ii) Single-phase and three-phase residential line segments, used to validate the proposed home network wiring model (Section 4.2). (iii) A comprehensive 24 h load flow simulation of a representative European dwelling, providing insight into temporal load dynamics (Section 4.3). The simulation was based on the load measurement performed by the Smart Meter which provides both active power and power factor. This feature provides model with the degree of lagging or leading of the current with respect to the voltage. Furthermore, this subsection discusses the integration of DG units within the home network, highlighting their relevance in the evolving role of residential prosumers. (iv) The performance of the proposed procedure on the large-scale DNs was compared to the state-of-the-art procedures presented in [7,29,30] (Section 4.4).
The load flow algorithm has been implemented in C# using Visual Studio 2019 and executed on a personal computer equipped with an Intel Core i7 processor (2.3 GHz, four cores, eight threads) and 16 GB of RAM. A flat-start initialization was employed for all simulations, and the convergence criterion for voltage magnitude and phase angle corrections was set to 10−6 per unit.

4.1. Model Verification on the Single-Phase Three-Wire Configuration

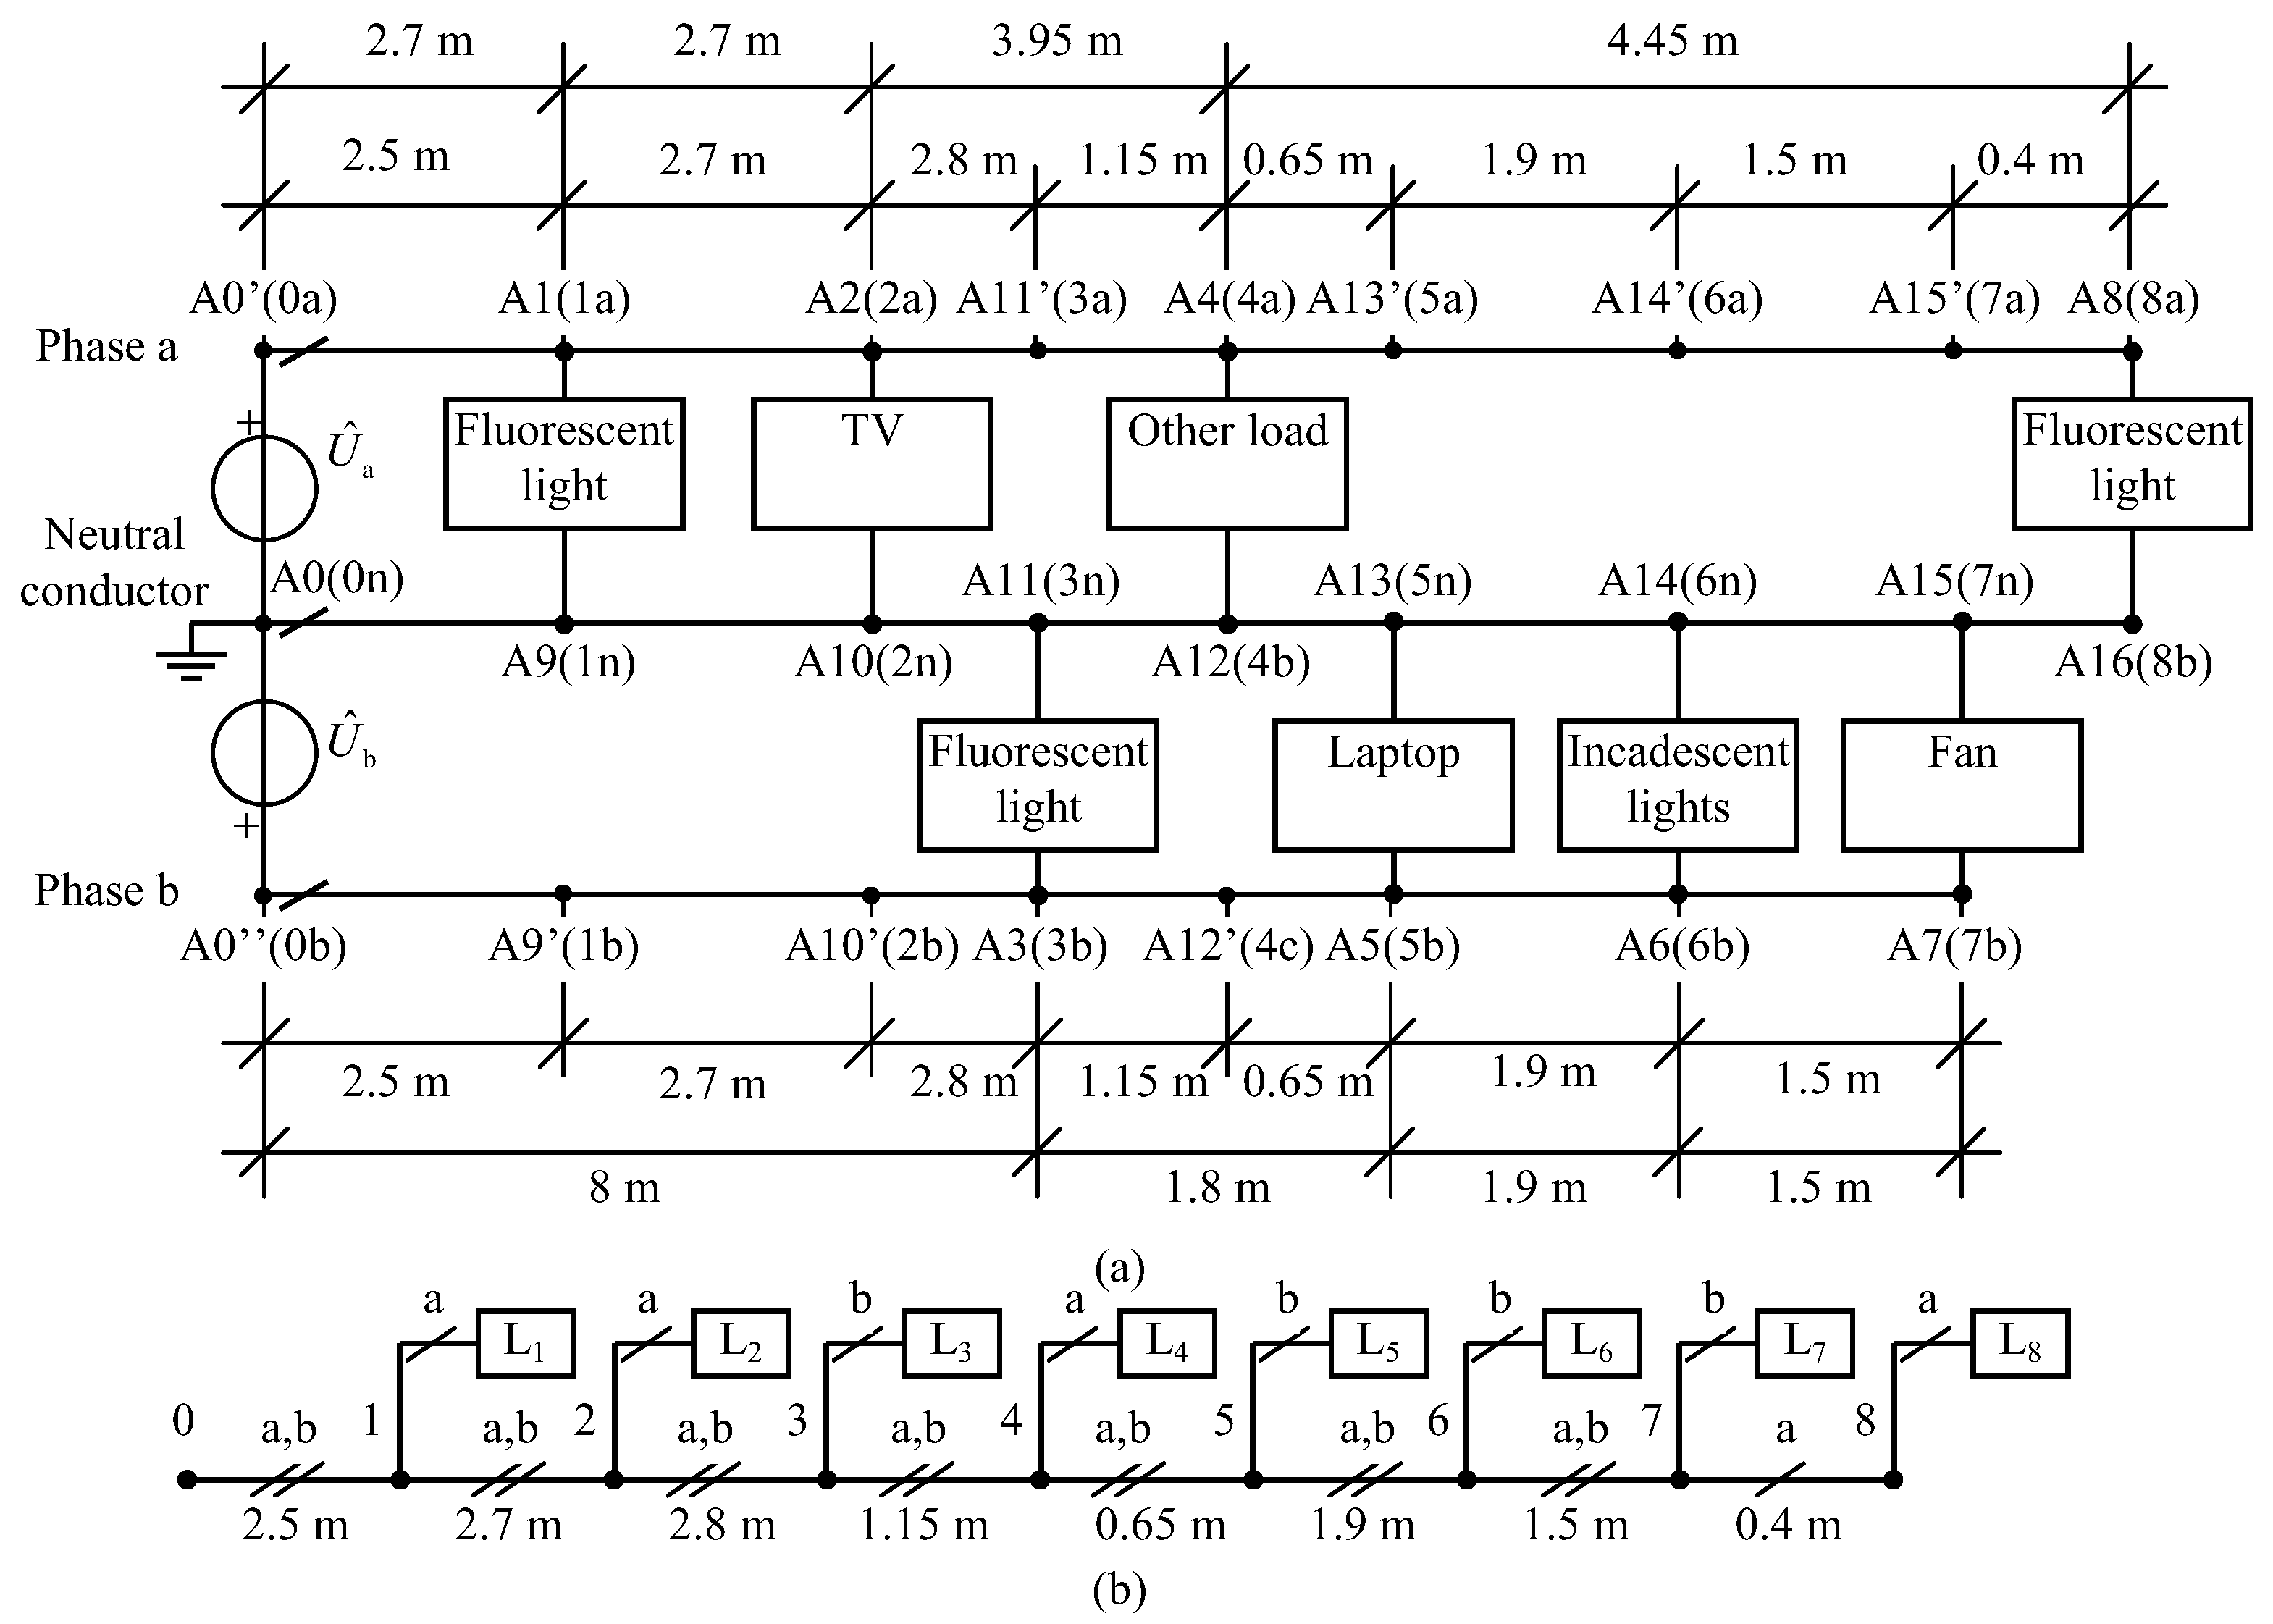
The model introduced in Section 3 is initially validated using the home line installation network described in [7]. This single-phase three-wire (1φ3w) configuration, depicted in Figure 1a (from Section 2.1), serves as a widely accepted benchmark for low-voltage residential premises wiring systems. The electrical parameters of the conductors employed in this network are listed in Table 4. To enable detailed load flow analysis, the original home network has been restructured by incorporating artificial nodes, as illustrated in Figure 13a. In this modified configuration, the conductor lengths have been subdivided to correspond with the positions of the artificial nodes. Node 0 is designated as the slack node, with phase voltage magnitudes of 109.1 V for phase a and 108.7 V for phase b. The corresponding phase angles are 0° and 180°, respectively. The simplified one-line diagram corresponding to Figure 13a is shown in Figure 13b. Load data for the network under study is provided in Table 5. Two distinct load scenarios have been analyzed to evaluate the performance and accuracy of the proposed load flow procedure.
Since all phase and neutral conductors of the home line installation network have the same parameters (Table 4), the line section parameter matrix is derived for all home network lines using the following relation:
Z ^ k ab = Z ^ k a + Z ^ k n Z ^ k n Z ^ k n Z ^ k b + Z ^ k n = 13.72 + j 0.229 10.1 + j 0.119 10.1 + j 0.119 13.72 + j 0.229 Ω km ,   k = 1 , 2 , , 7 ,
Z ^ 8 a = 13.72 + j 0.229 Ω km .
The finalized circuit representation of the home line installation is provided in Figure 3 (refer to Section 2.1). This configuration is derived using the section lengths from Figure 13b in combination with the corresponding line section parameter matrix Z ^ k ab . Based on this data, the complete equivalent model of the circuit in Figure 3 has been constructed.
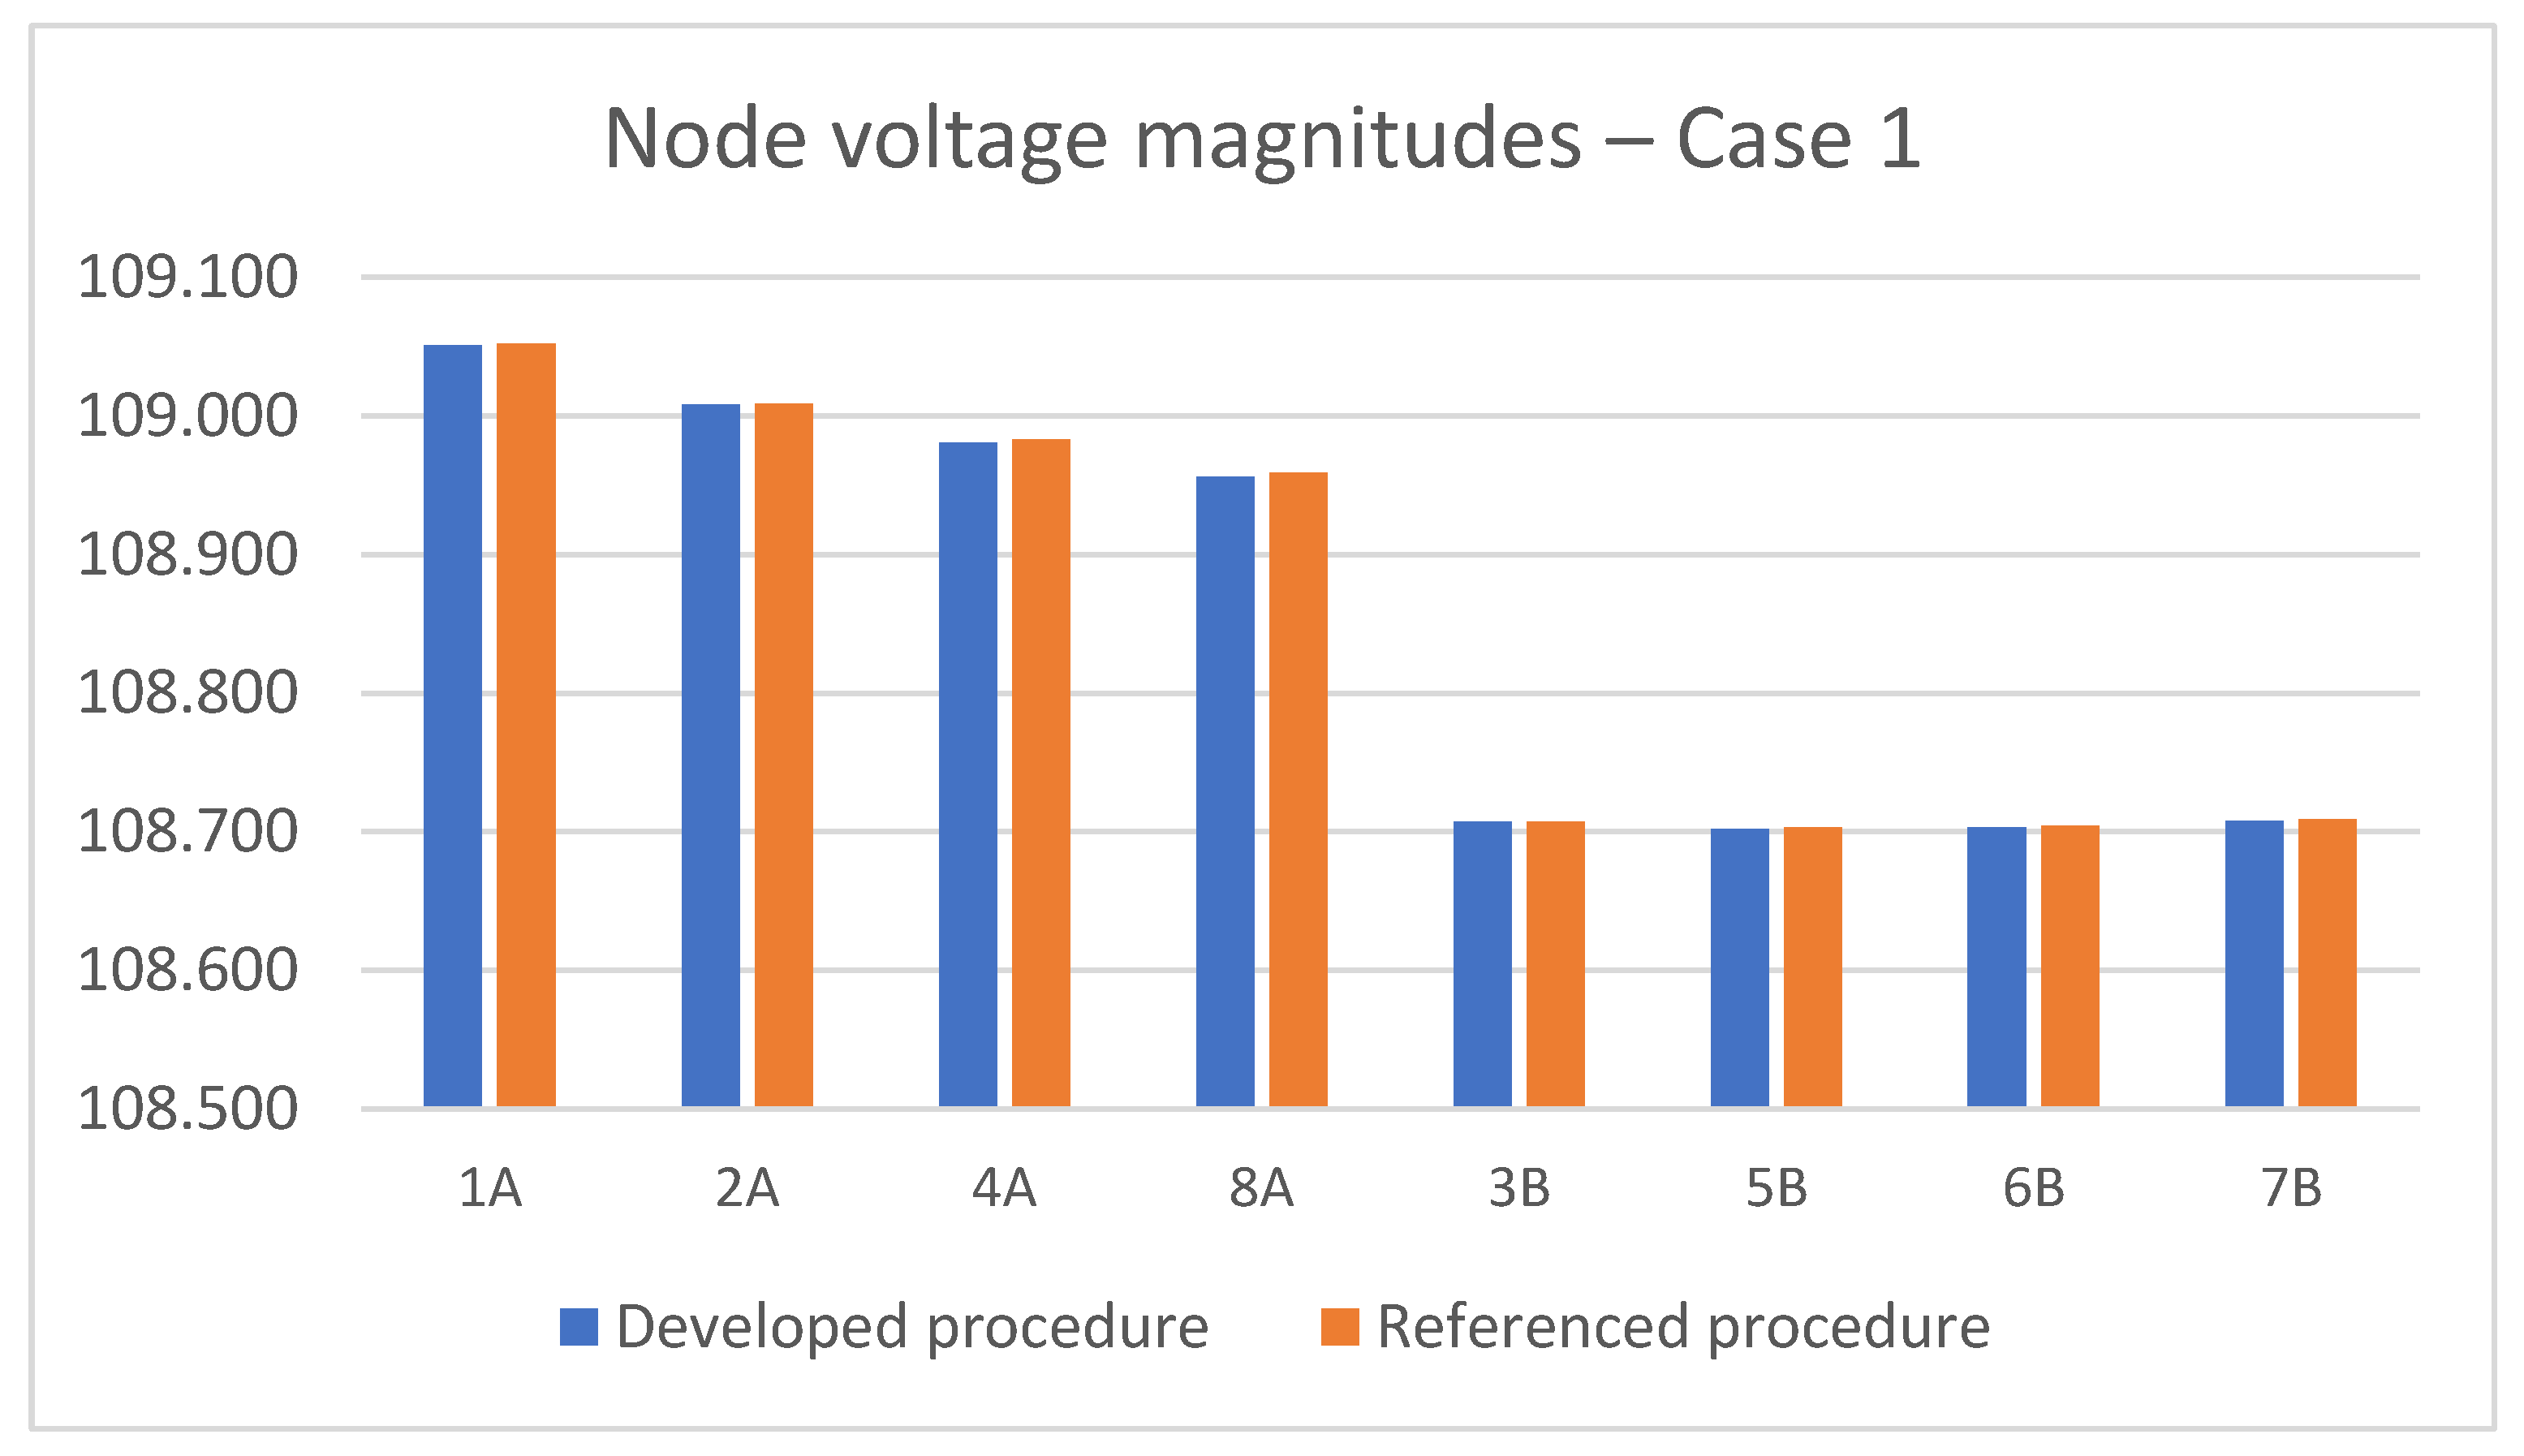
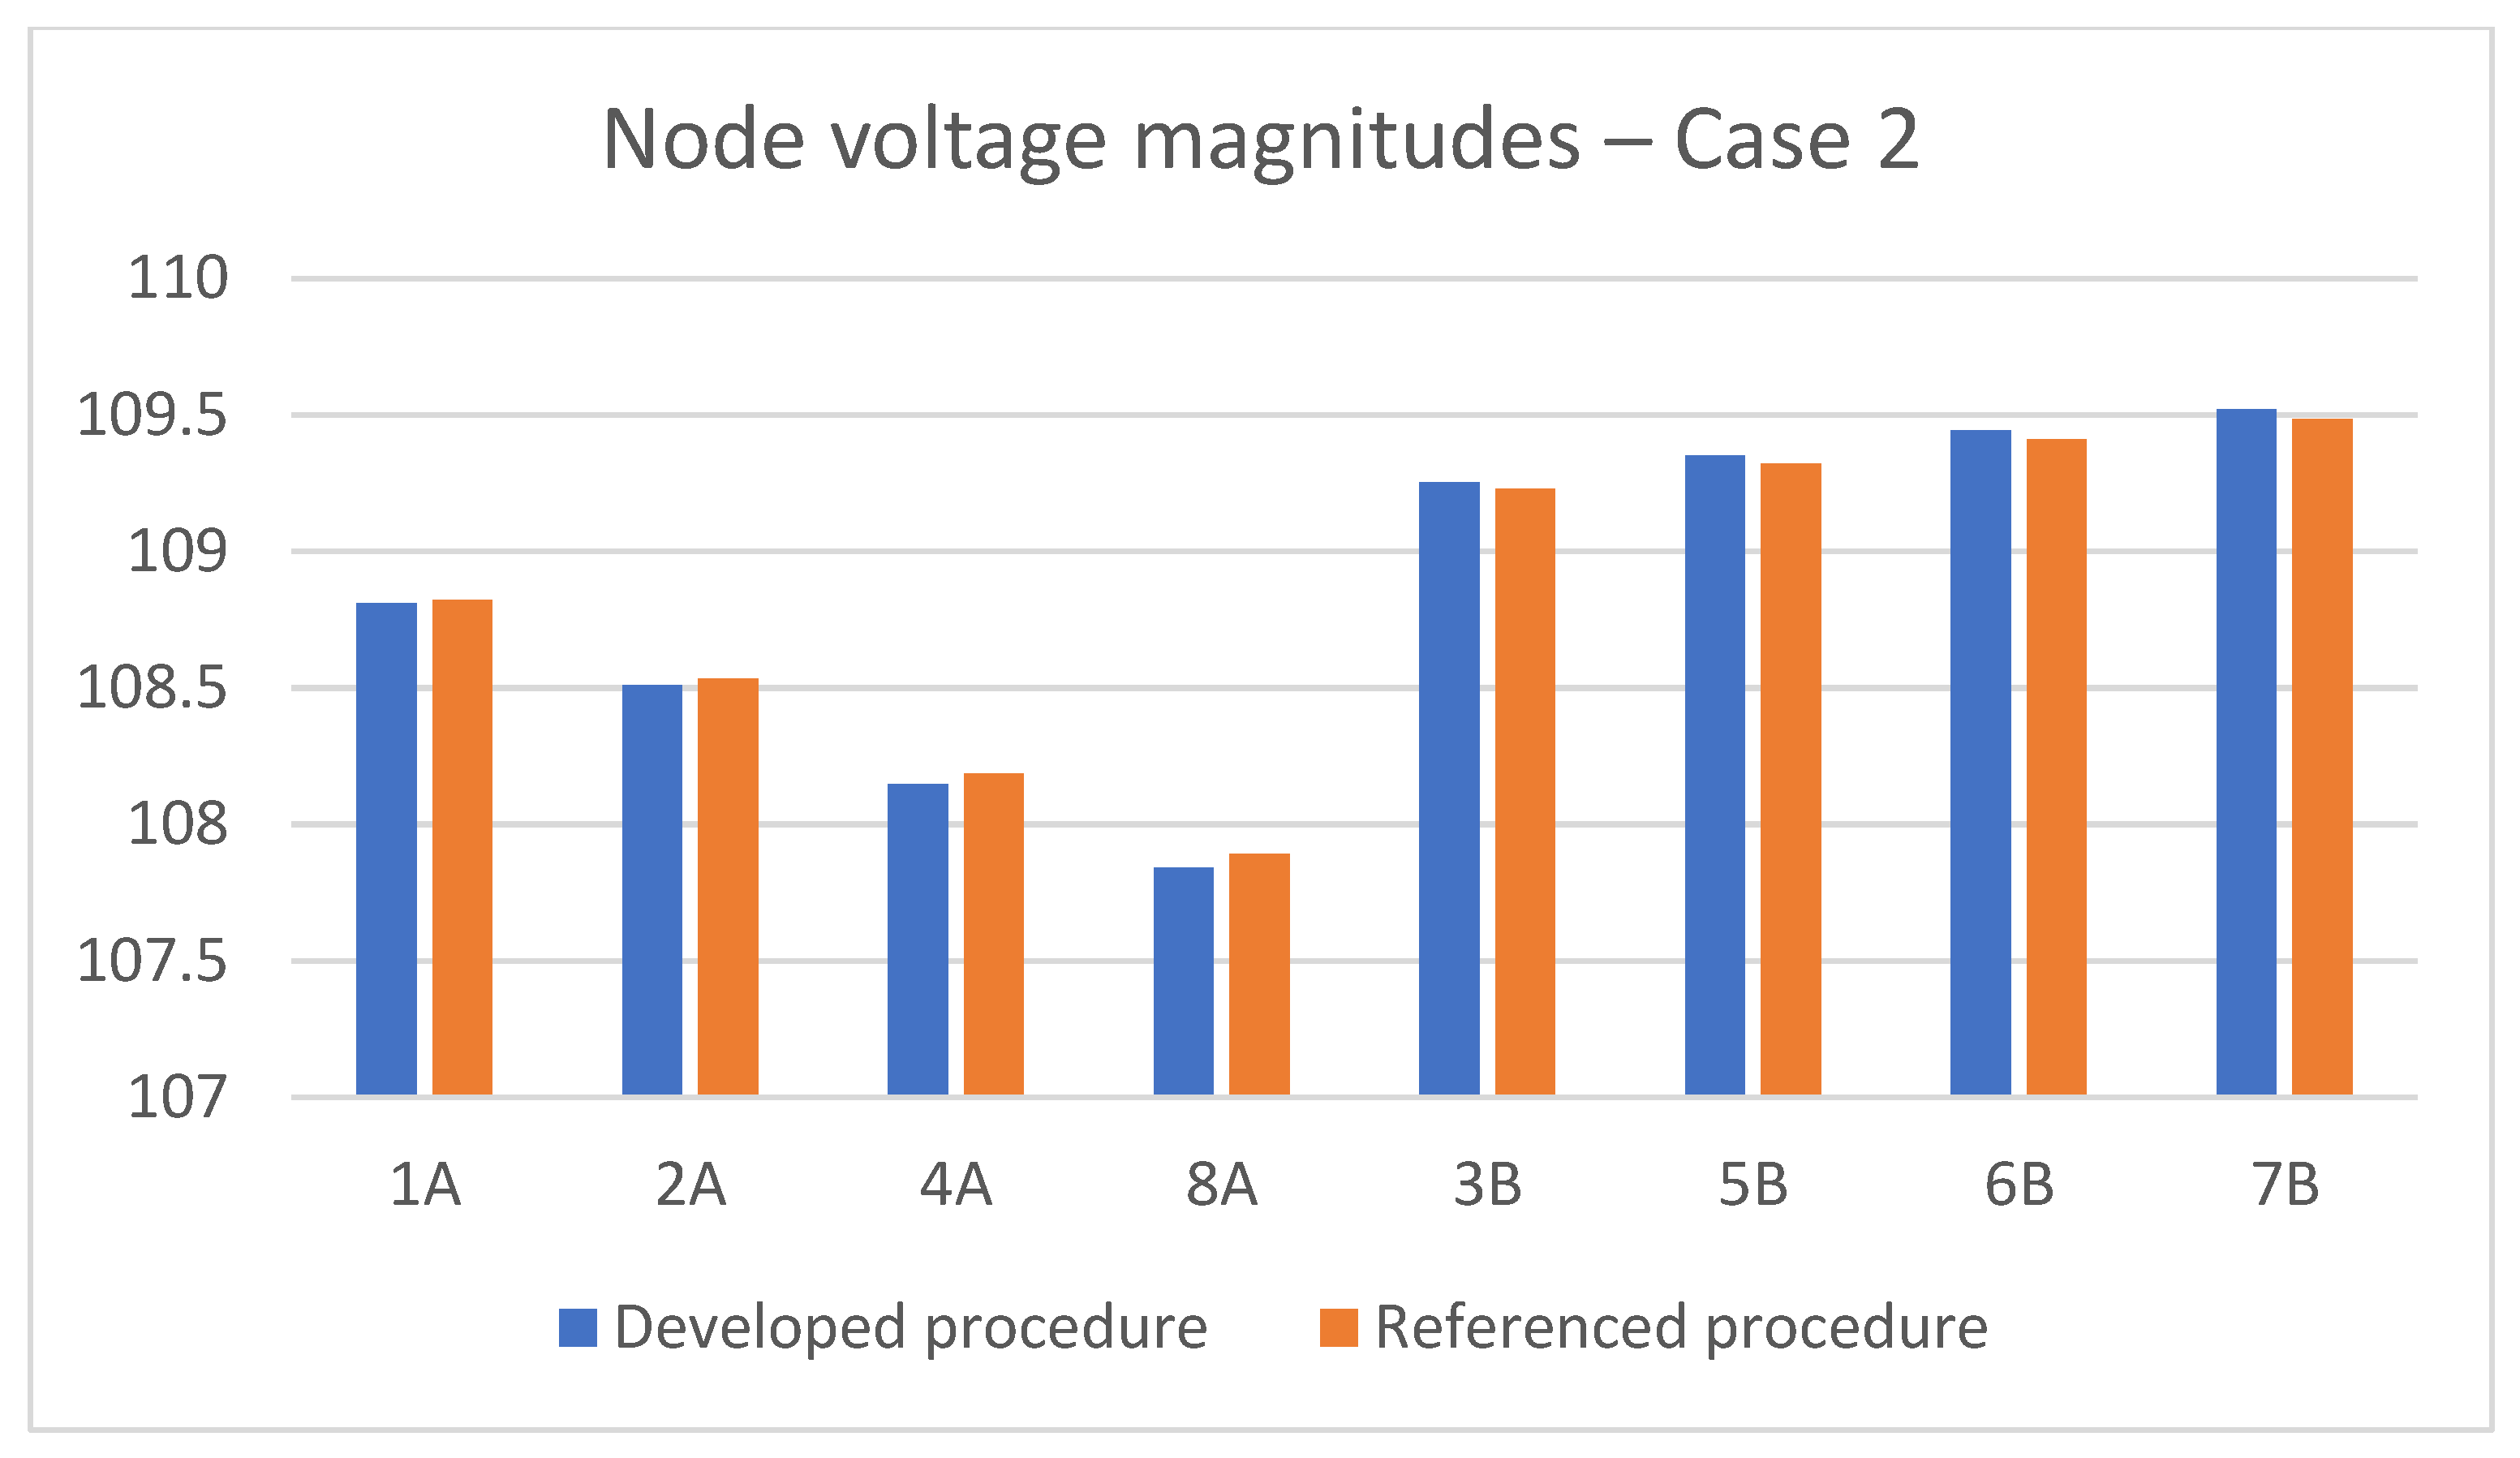
Voltage magnitudes at all network nodes, corresponding to home consumer connection points, are summarized in Figure 14 and Figure 15 for the two evaluated load scenarios. As the line network configuration is not supported by [29,30], the simulation results are benchmarked against only those reported in [7]. The observed discrepancies are minimal, with voltage magnitude mismatches remaining within approximately 0.3%, thereby confirming the accuracy and reliability of the proposed load flow model.

4.2. Three-Phase and Single-Phase Sections

This subsection presents the modeling approach for typical European residential wiring installations, specifically focusing on four-wire three-phase and two-wire single-phase cable configurations. The physical and electrical characteristics of the three-phase cables are provided in Table 6. By applying the measurement verification outlined in Section 2.2, the series impedance matrix Z and the shunt admittance matrix Y of the installation cables have been obtained:
Z ^ abc = 26.743 0.34 ° 11.686 0.31 ° 11.742 0.48 ° 11.686 0.31 ° 23.086 0.33 ° 11.714 0.2 ° 11.742 0.48 ° 11.714 0.2 ° 23.257 0.34 ° Ω km = 26.742 11.686 11.742 11.686 23.085 11.714 11.742 11.714 23.257 + j 0.159 0.063 0.098 0.063 4.654 0.041 0.041 1.431 4.830 Ω km , Y ^ abc = 48.544 86.7 ° 27.955 87.3 ° 5.618 86.9 ° 27.955 87.3 ° 48.209 86.6 ° 15.244 87.2 ° 5.618 86.9 ° 15.244 87.2 ° 47.684 86.7 ° nS km = 5.587 2.634 0.608 2.634 5.718 1.489 0.608 1.489 5.490 + j 96.926 55.848 11.220 55.848 96.249 30.451 11.220 30.451 95.210 nS km .
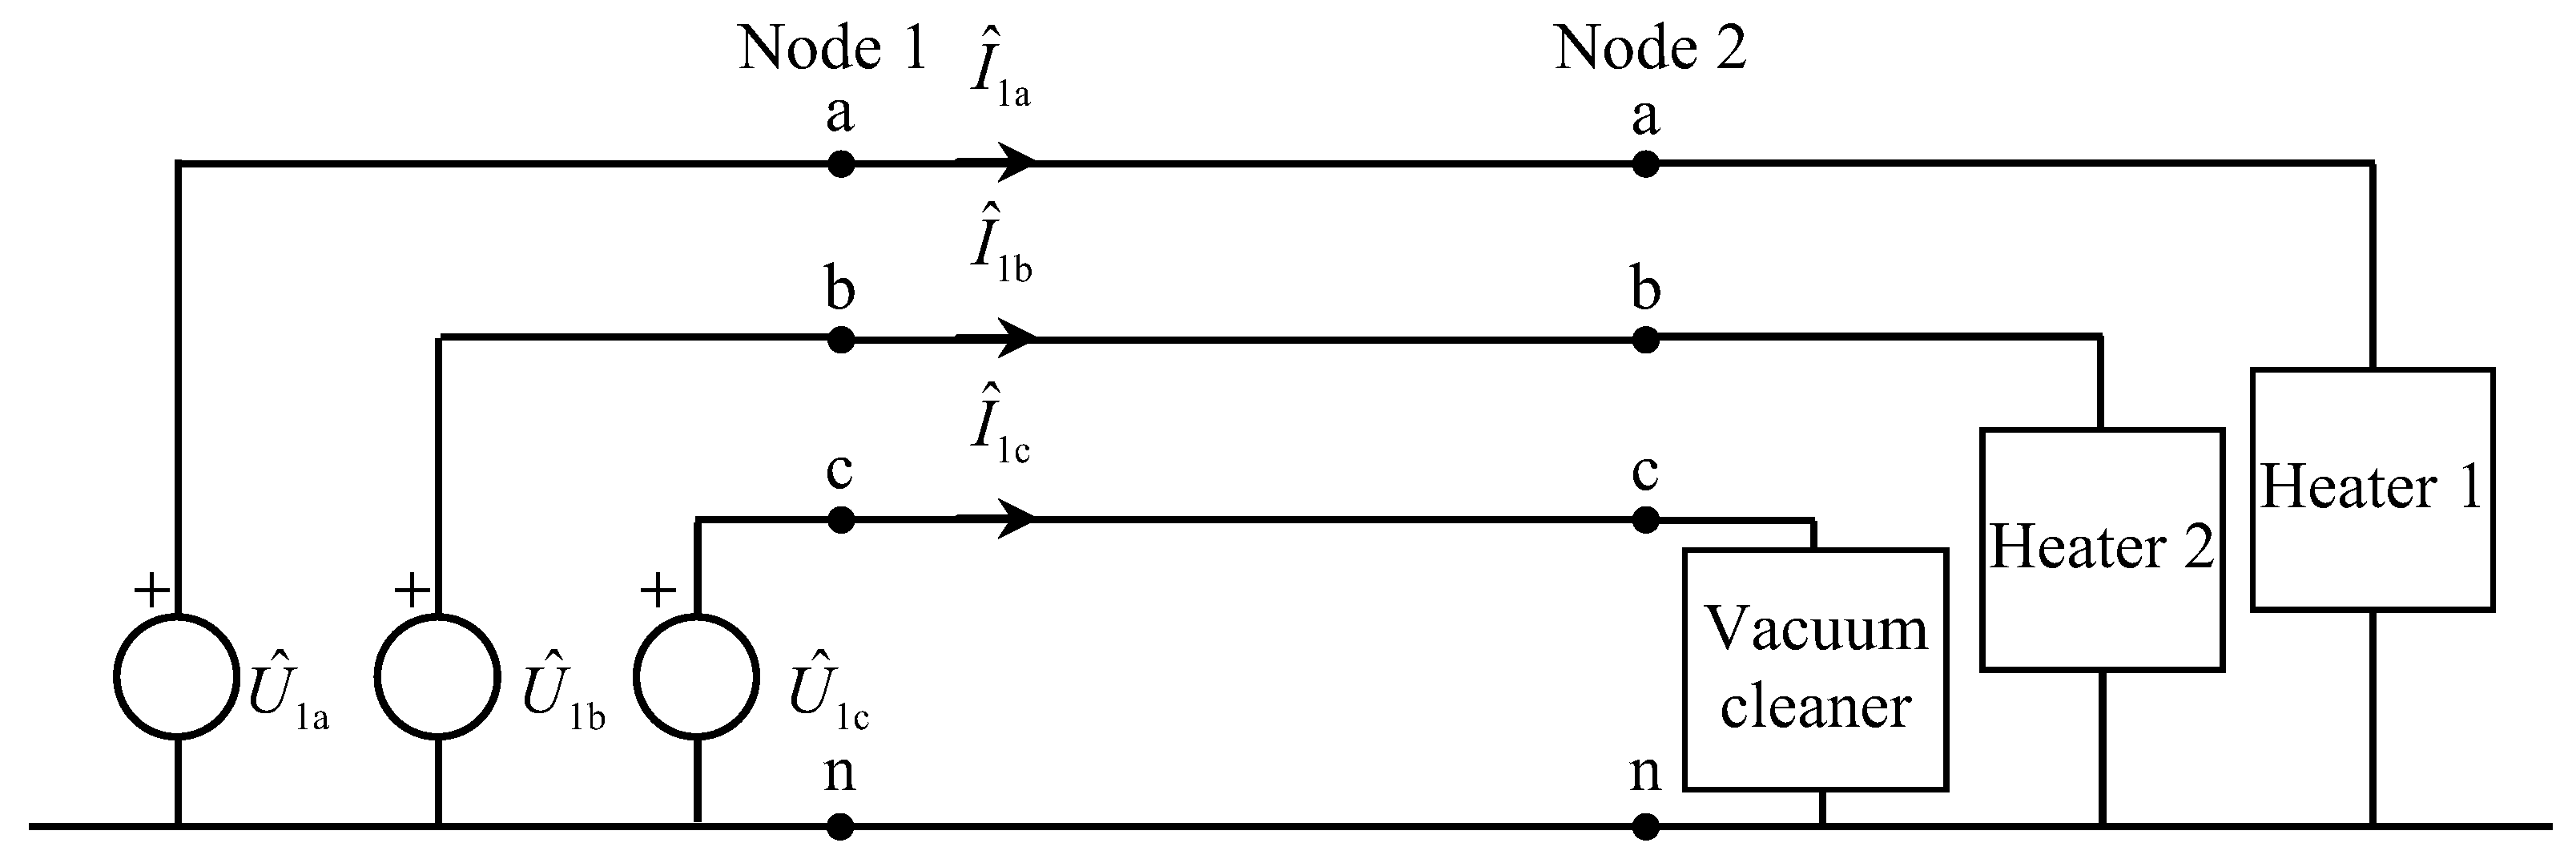
The accuracy of the series and shunt parameter matrices derived in Section Measurement of Series and Shunt Parameter Matrices of Home Line Sections has been experimentally validated using the setup shown in Figure 16. In this experiment, a three-phase voltage source is connected at node 1, with the following voltage magnitudes and phase angles: 393.759 V at 1.52° (phase a), 391.736 V at −118.73° (phase b), and 395.446 V at −238.311° (phase c). At node 2, two single-phase resistive loads heater 1 and heater 2 are connected to phases a and b, respectively. Heater 1 has an active power of 1.936 kW and reactive power of 0.019 kVAr, while heater 2 has an active power of 1.766 kW and reactive power of 0.014 kVAr. In addition, a vacuum cleaner is connected to phase c, with an active power of 1.770 kW and reactive power of 0.171 kVAr. Given the known three-phase voltages at node 1 and the active and reactive power consumption of the connected loads, the three-phase voltage magnitudes and angles at node 2 were computed using the proposed load flow procedure described in Section 3. The resulting voltage magnitudes and angles are presented in Table 7 and Table 8, respectively. Comparison with measured values at node 2 shows that the discrepancies in voltage magnitudes and angles do not exceed 0.5% and 2%, respectively. These results confirm the accuracy of the model introduced in Section Measurement of Series and Shunt Parameter Matrices of Home Line Sections and the load flow model and computational procedure proposed in Section 3.
For the single-phase cable sections, the series impedance and shunt admittance parameter matrices reduce to scalar values due to the single-conductor configuration, resulting in 1 × 1 matrices. By applying the same measurement verification described in Section Measurement of Series and Shunt Parameter Matrices of Home Line Sections, adapted for a single-phase conductor, the corresponding series impedance Z and shunt admittance Y parameters have been accurately determined as follows:
Z ^ s = 13.428 + j 0.162 Ω km ,   Y ^ s = 7.2 + j 49.335 nS km ,   s = a b c
The single-phase cable parameters were validated through the experimental setup illustrated in Figure 17. In this experiment, a single-phase voltage source was connected at node 1, supplying a voltage magnitude of 398.891 V with a phase angle of −3.92°. At node 2, a single-phase heater was connected, characterized by an active power consumption of 3.547 kW and a reactive power consumption of 0.031 kVAr. Using the proposed load flow procedure described in Section 3 and the previously obtained cable parameters, the voltage magnitude and angle at node 2 were calculated. The results are presented in Table 9. Comparison with the measured values at node 2 shows that the mismatch in voltage magnitude does not exceed 0.15%, while the phase angle deviation remains within 1.8%. These results further validate the precision of the installation parameter measurement presented in Section Measurement of Series and Shunt Parameter Matrices of Home Line Sections, as well as the reliability of the overall load flow model and computational approach presented in Section 3.

4.3. Three-Phase European Home Network

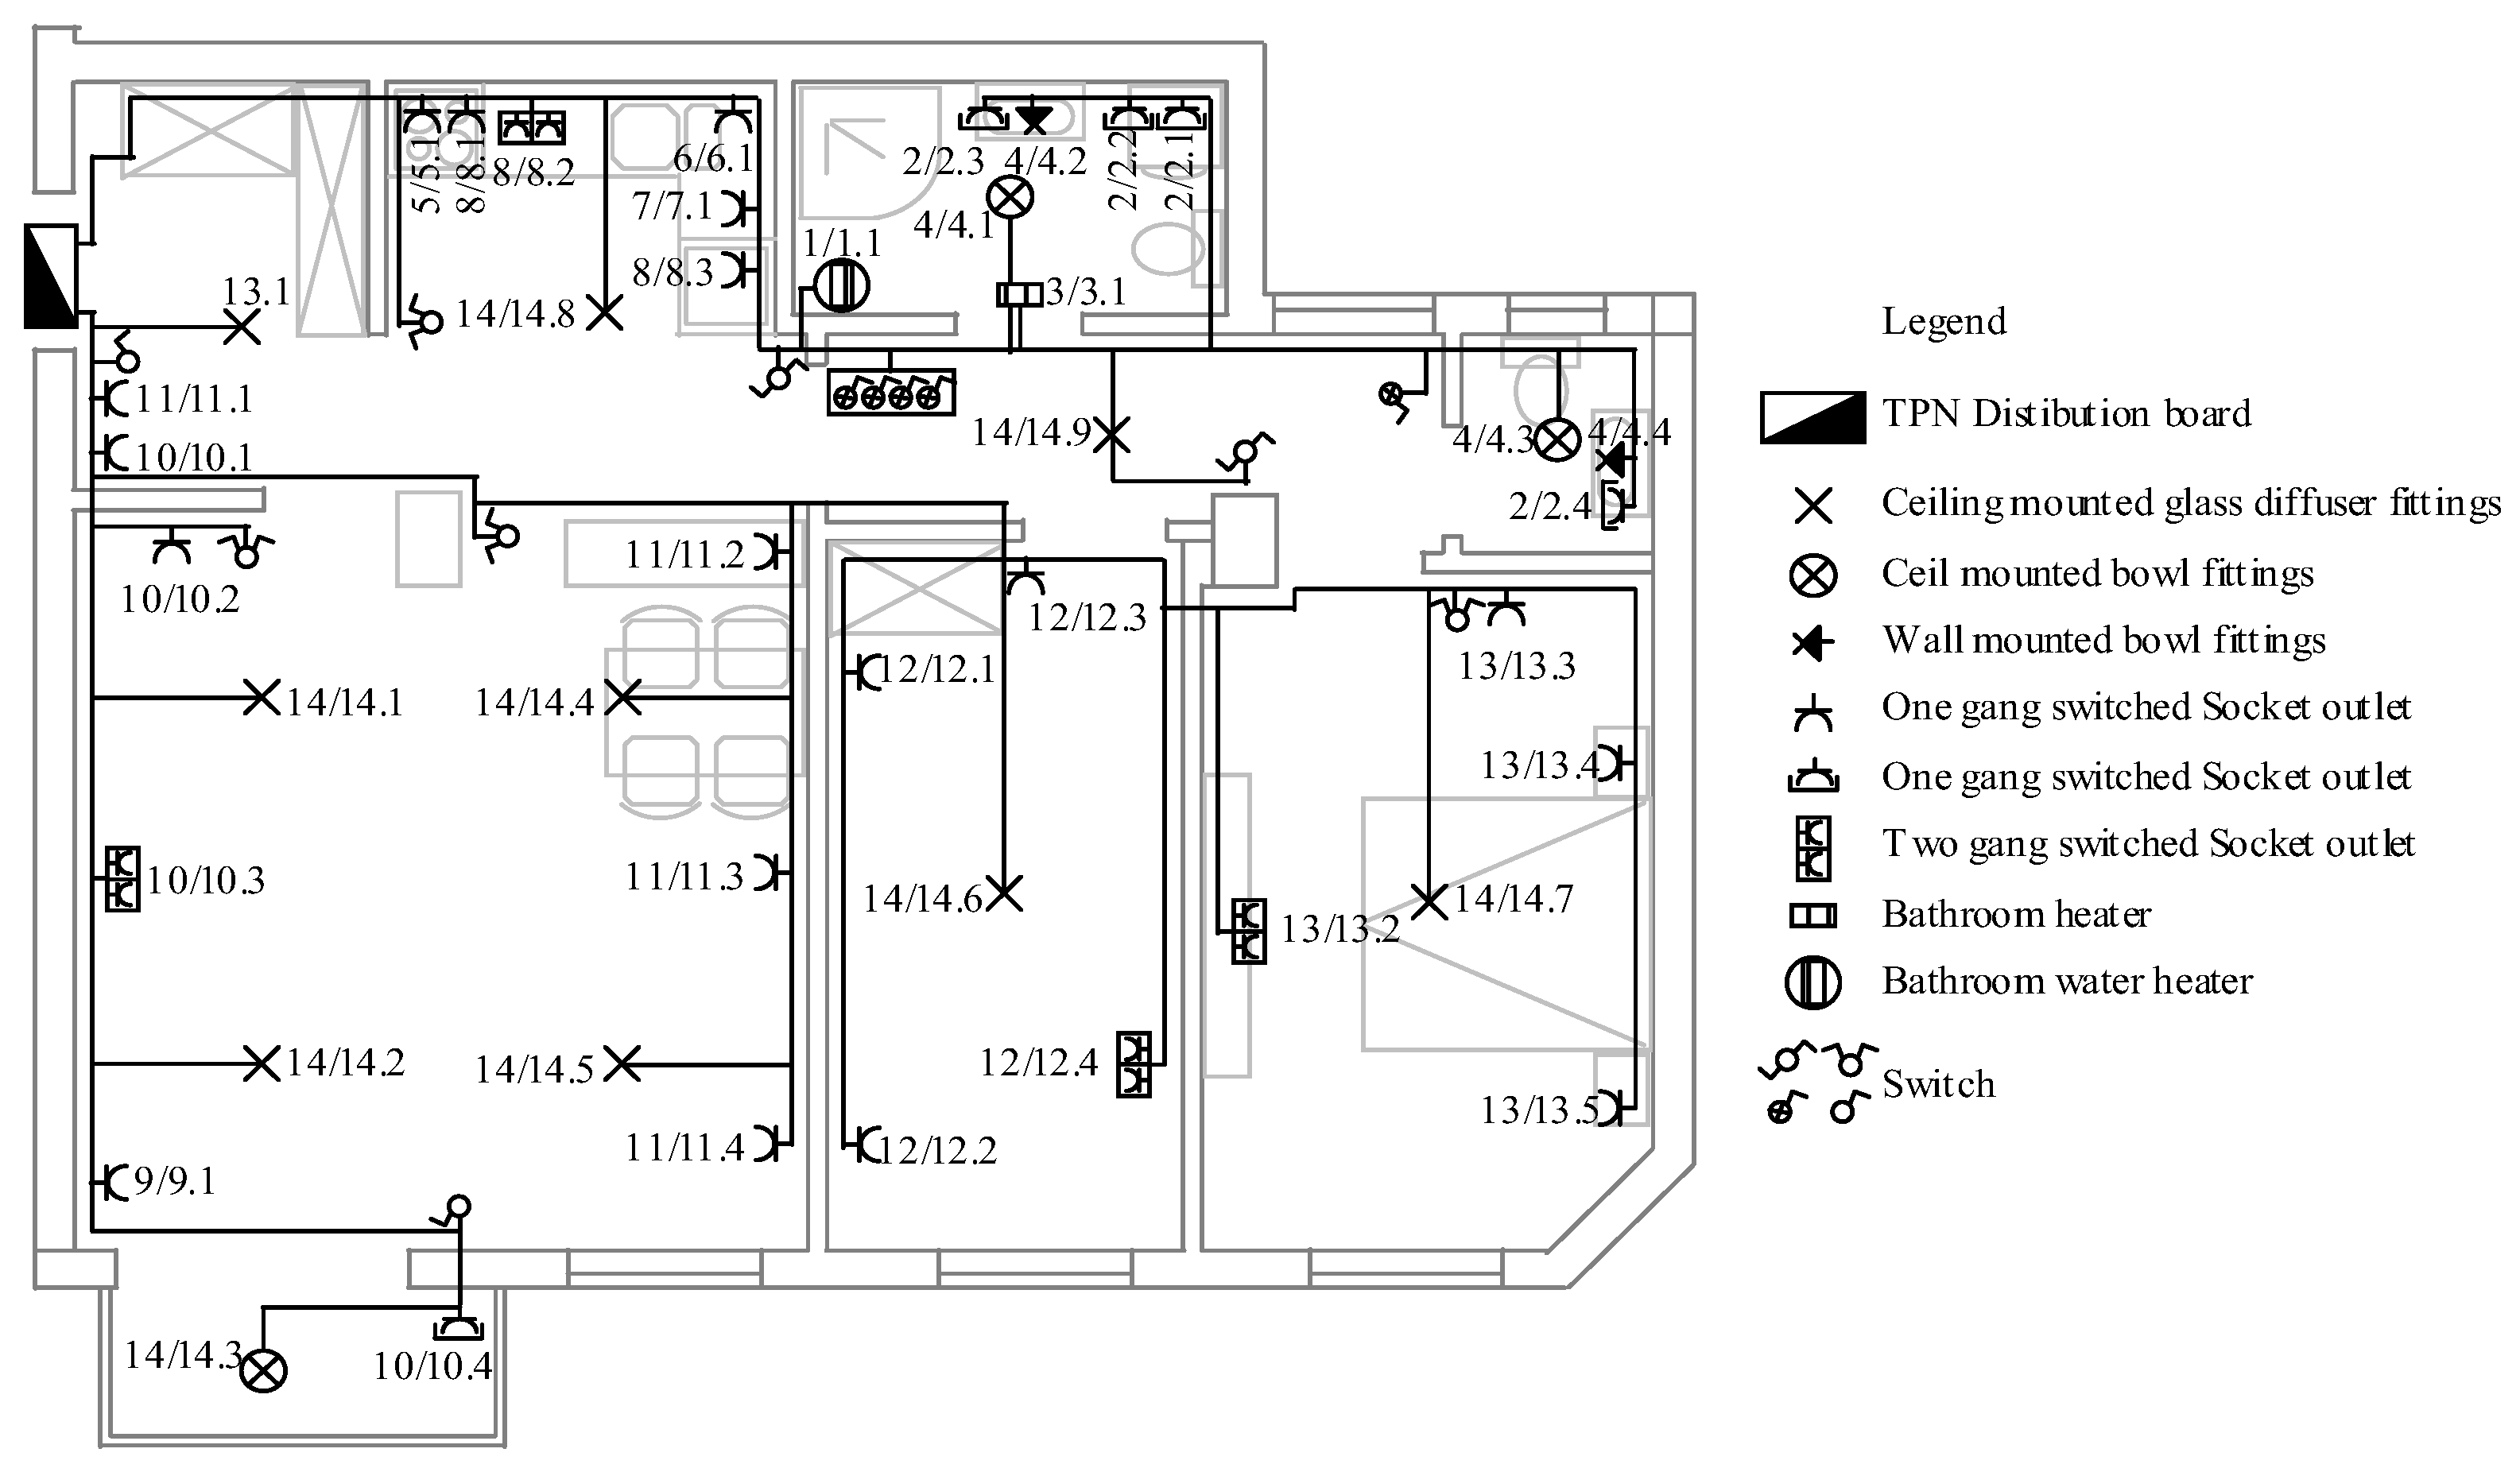
In this study, a real-life European residential dwelling unit is utilized to implement and validate the proposed load flow methodology, as depicted in Figure 18. While standard medium-voltage benchmark networks, such as the IEEE 13, 34, 37, and 123 bus test feeders are commonly used for evaluating load flow algorithms, they are not suitable for modeling detailed low-voltage home electrical networks due to their scale and abstraction. In contrast, the residential network modeled here captures the physical and operational characteristics of a typical household electrical installation. In Figure 18, the main installation cable corridors are illustrated using black lines, indicating the spatial layout of wiring across the dwelling. Consumer connection node points include the following: (i) single- and double-gang socket outlets; (ii) ceiling and wall-mounted lighting fixtures; (iii) fixed-position loads such as the bathroom water-heater and air-heater. The complete one-line diagram of the home installation network is provided in Figure 19. This network consists of 14 primary circuit feeders connected to a Three-Phase and Neutral Distribution Board (TPN). The physical lengths of all feeder branches are annotated alongside the corresponding line sections in Figure 19 and expressed in meters. Each branch is uniquely identified with a feeder ID, numbered from 1 to 14. Additionally, each consumer connection point (e.g., socket outlets, lighting fixtures) is associated with a unique node identification pair in the format (Feeder ID/Connection Node Point ID). All nodes within the residential electrical system, including wall junction boxes, are distinctly numbered and represented with circled numerals in Figure 19.
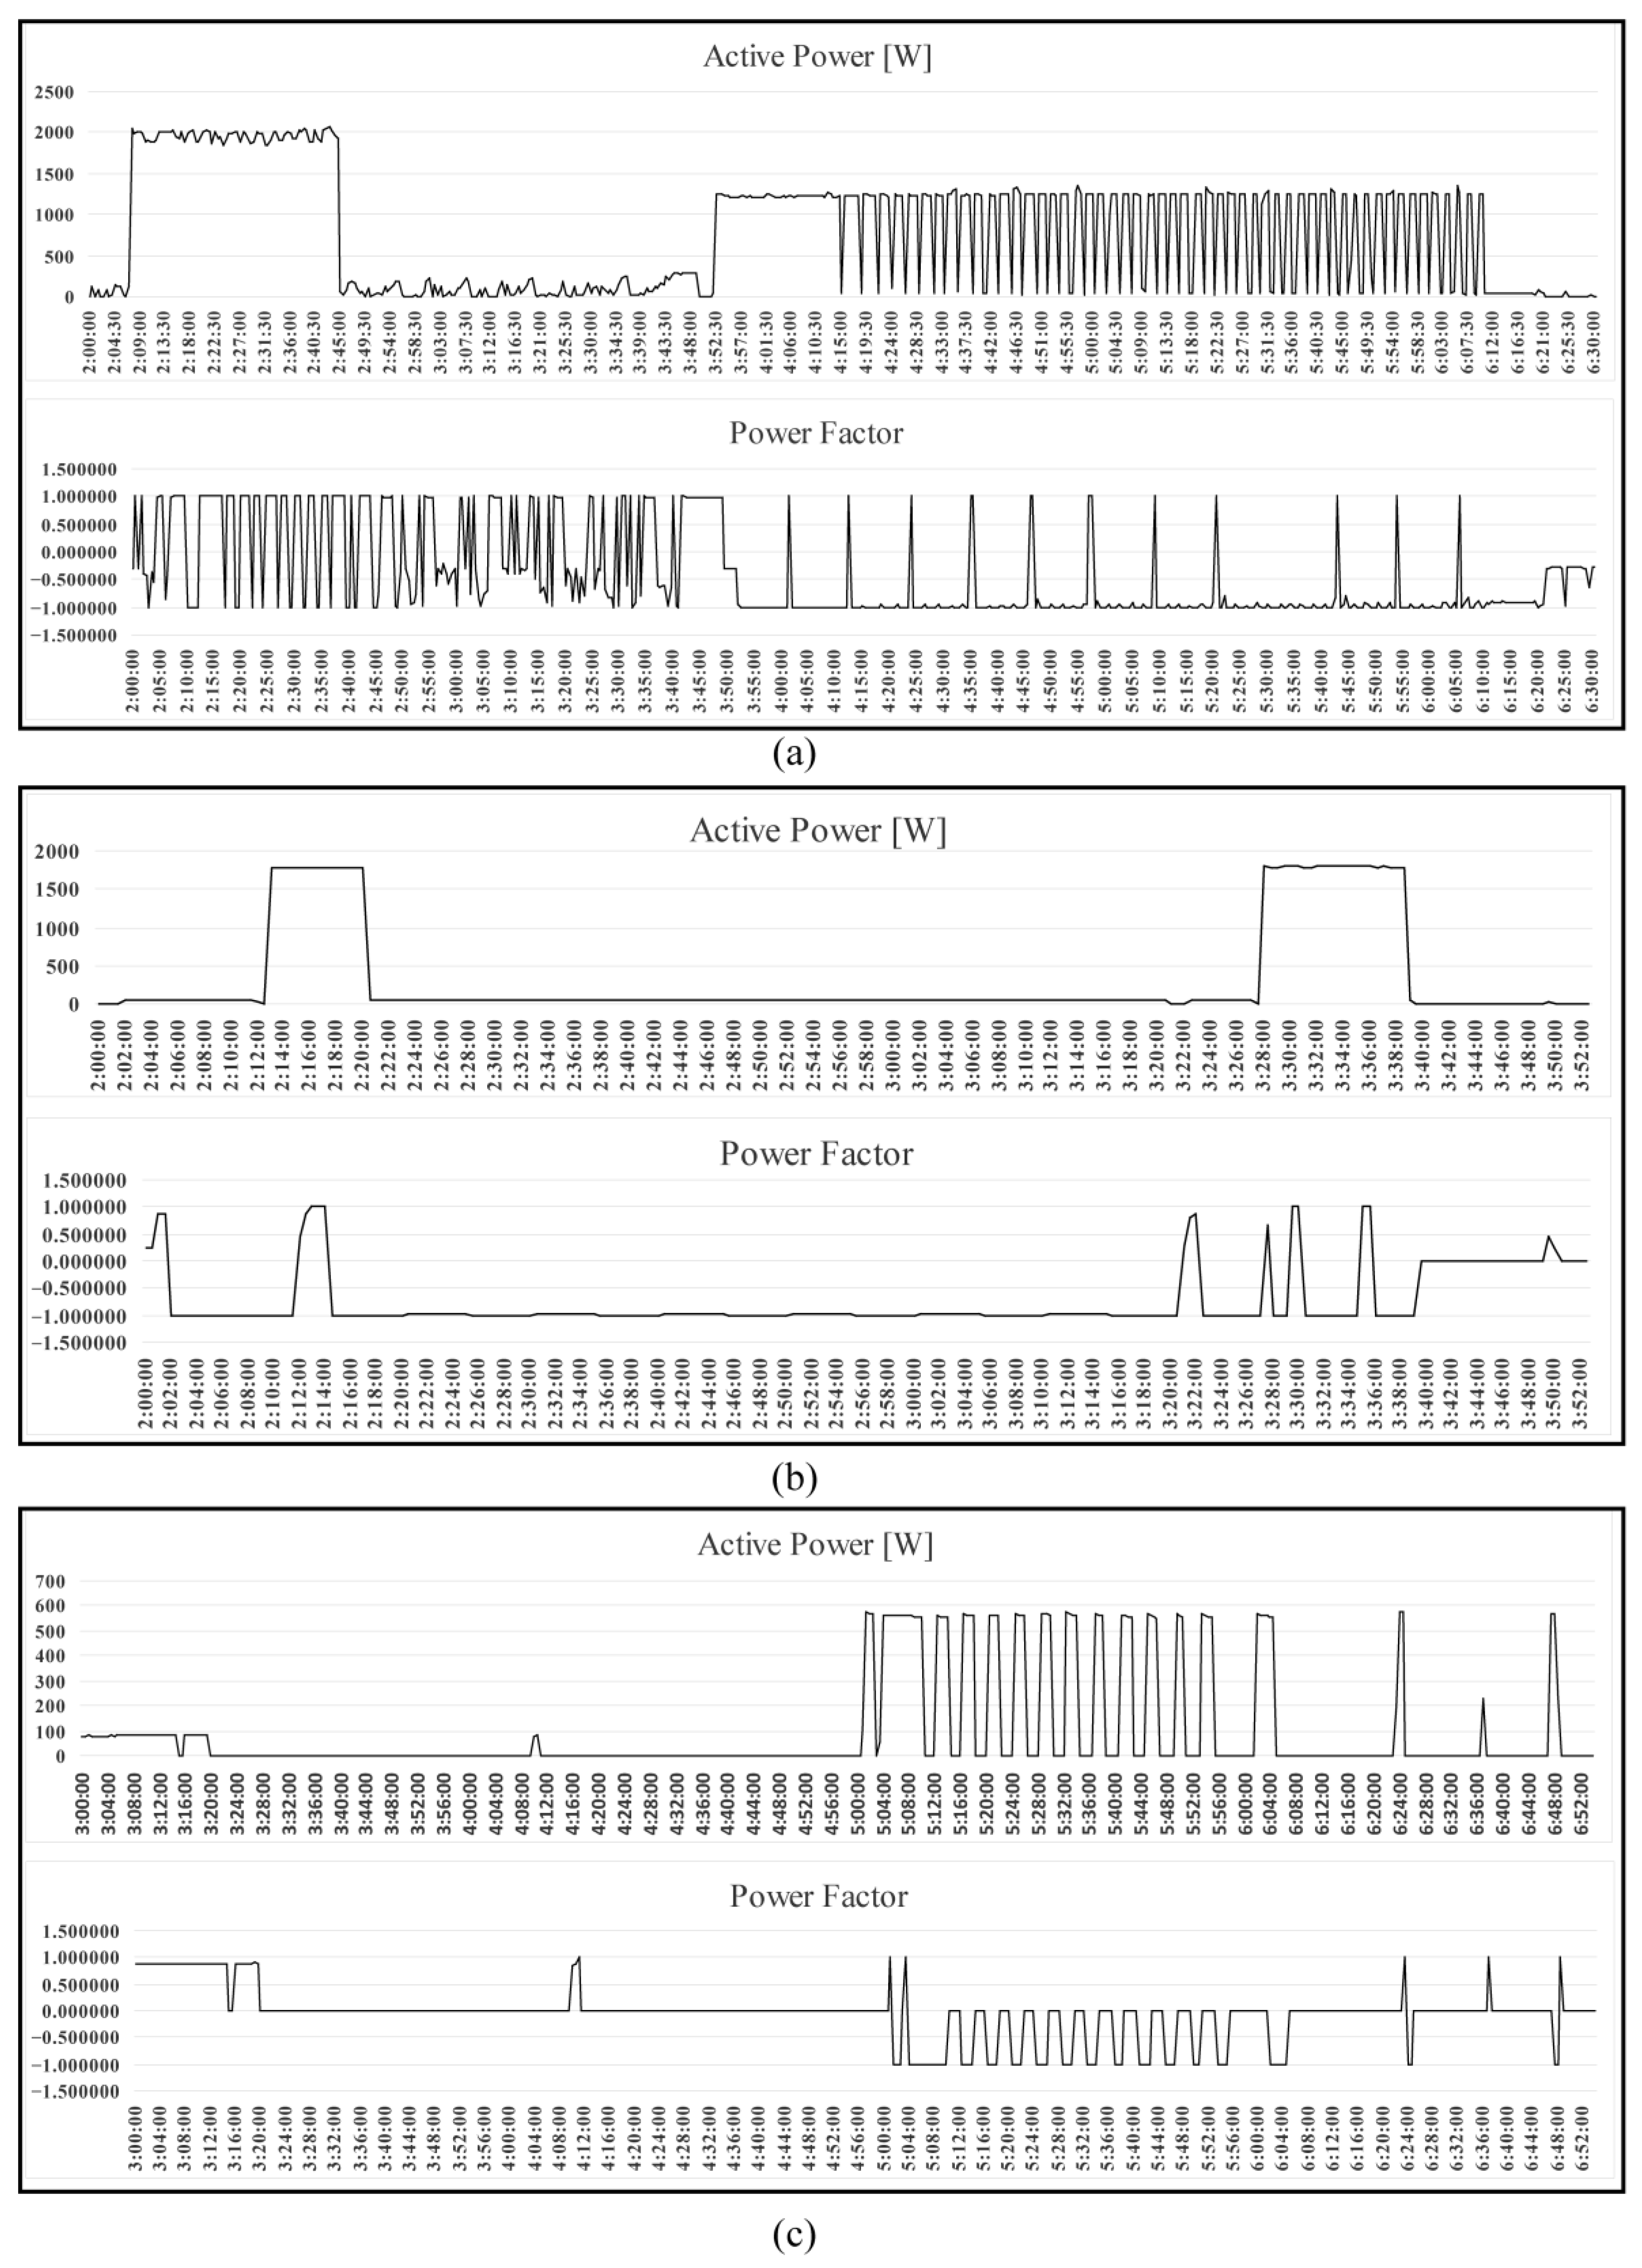
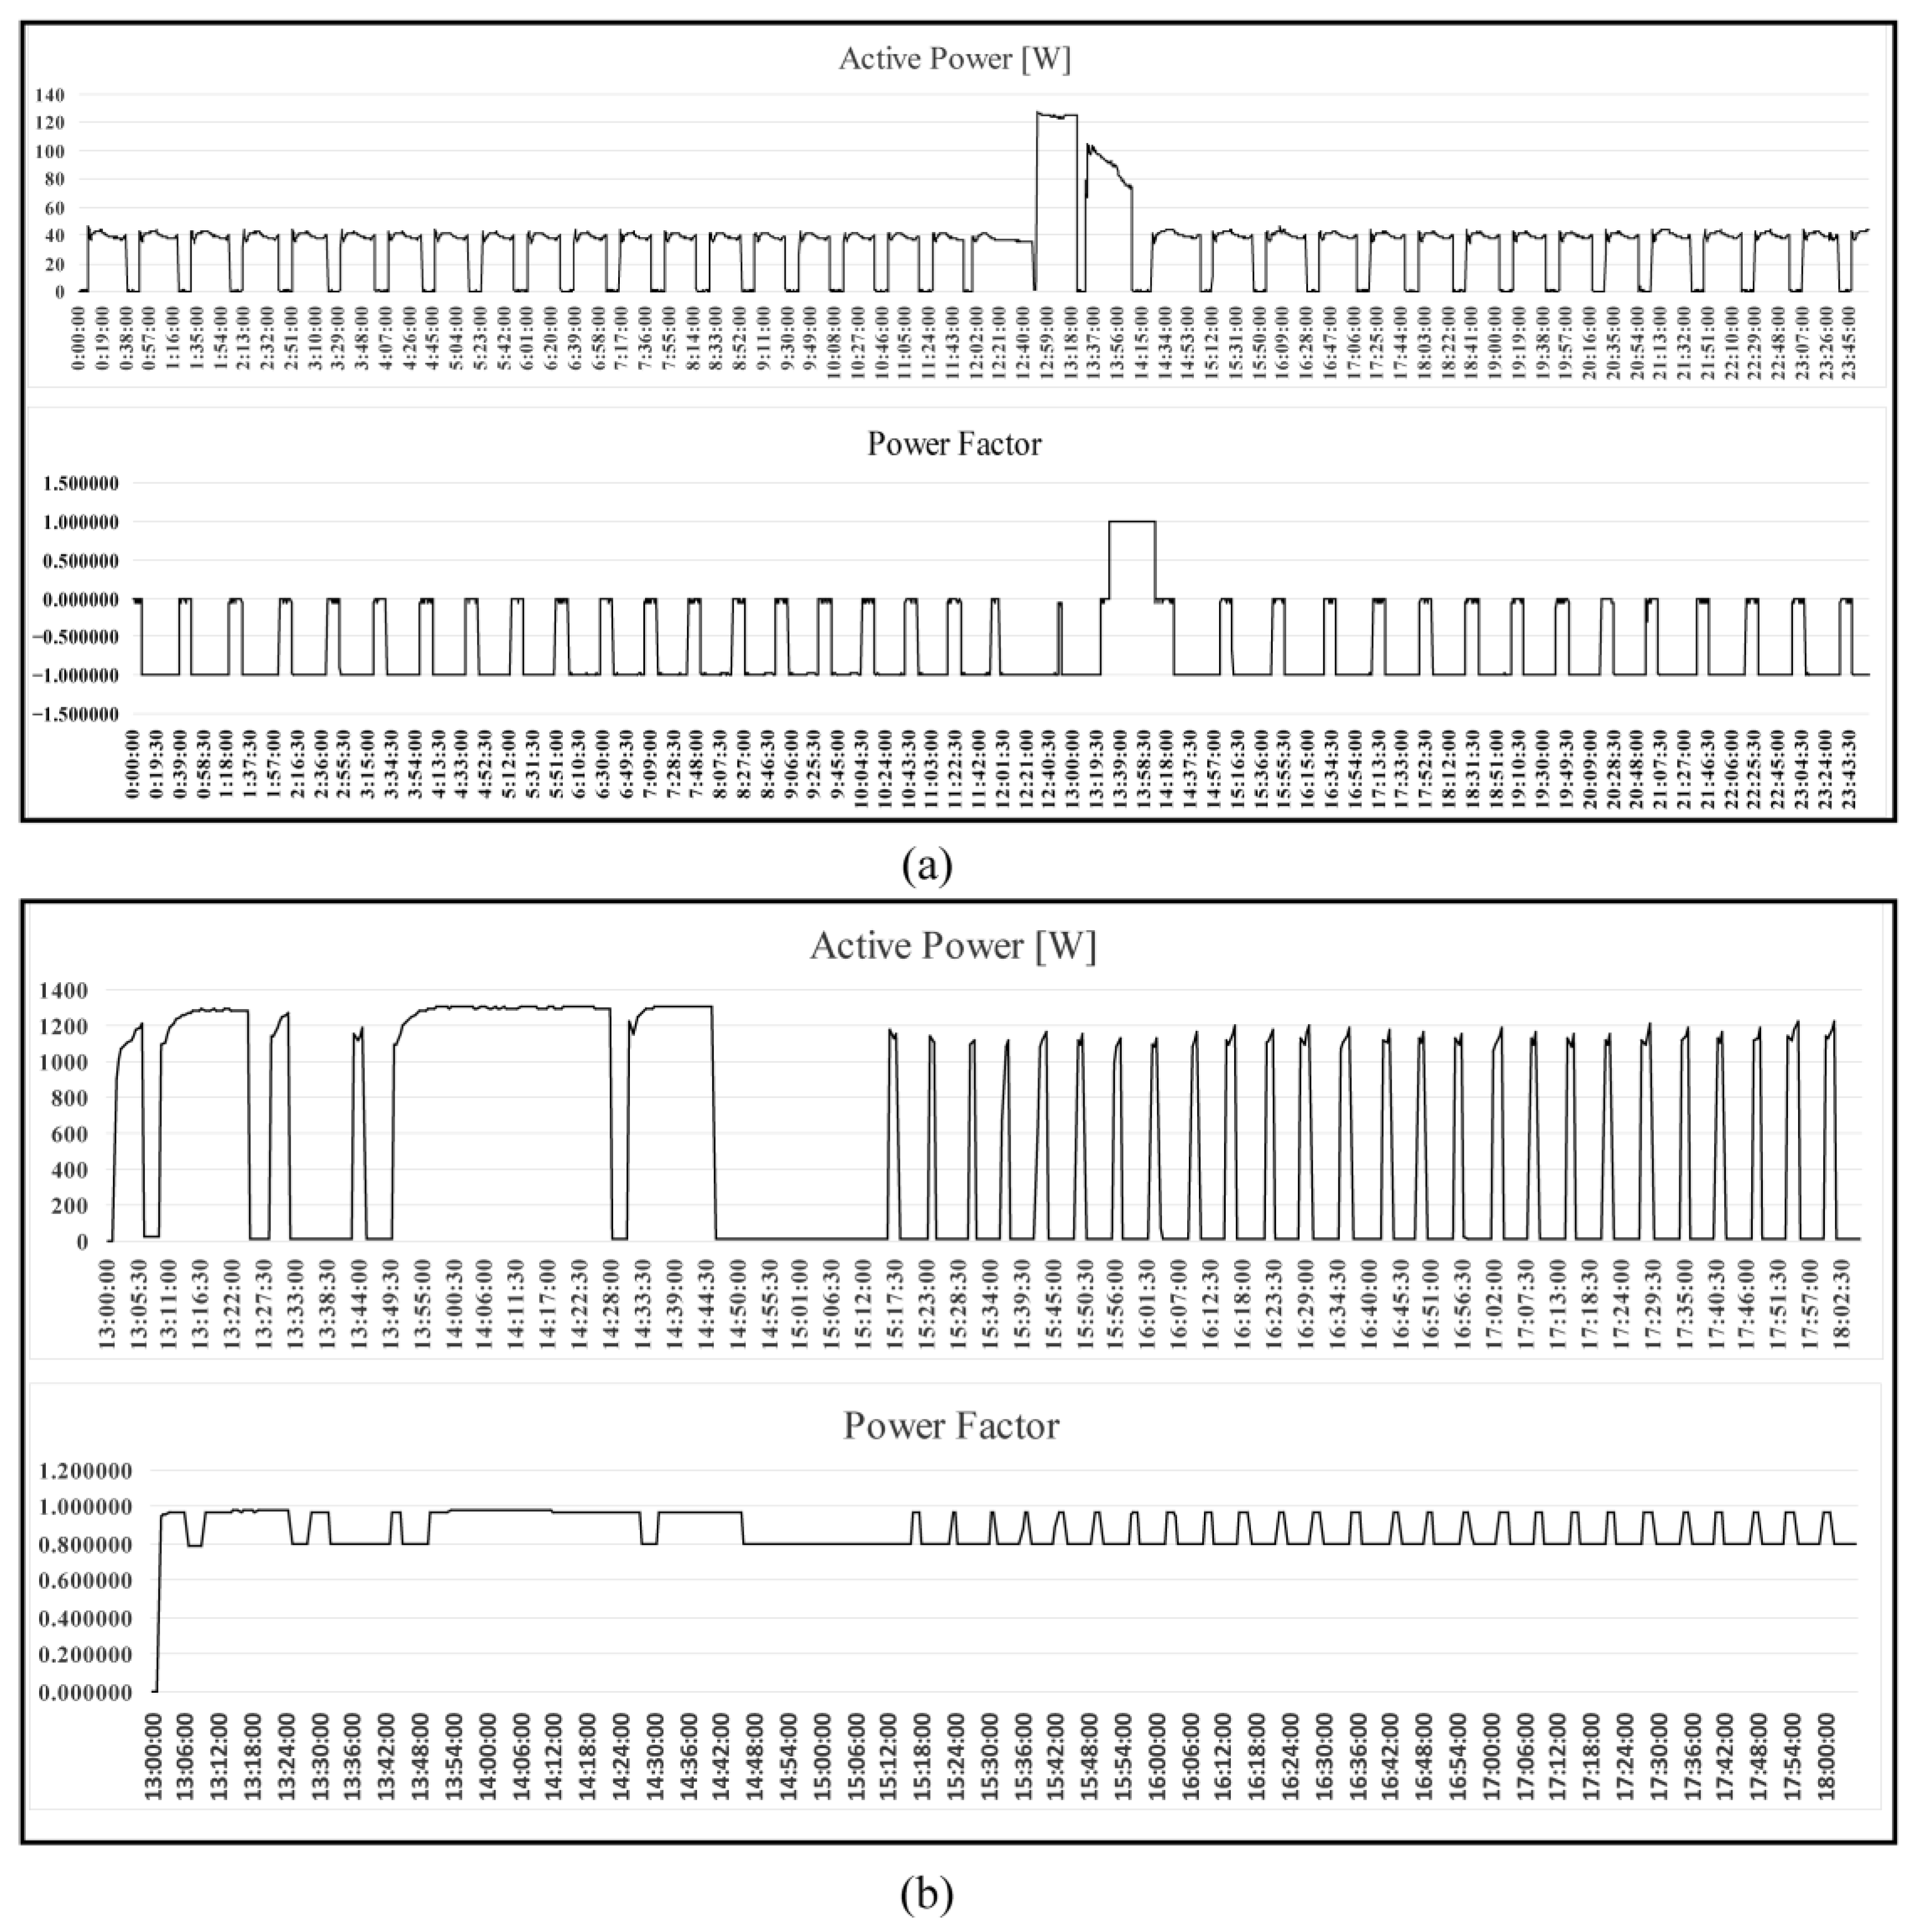
The list of loads distributed throughout the entire residential network is presented in Table 10 [35,36]. These loads are connected at physical node points corresponding to various branch feeders, as detailed in Table 10 and shown in Figure 19. For certain complex consumers, whose load profiles vary over time, individual load data (such as constant power and phase angle) was insufficient to accurately model their behavior. Instead, these loads have been modeled as time-varying data, reflecting their dynamic consumption patterns: (i) Consumer 2.1, a combined clothes washer and dryer (Figure 20a); (ii) Consumer 7.1, a dishwasher (Figure 20b); (iii) Consumer 8.1, a bread maker (Figure 20c); (iv) Consumer 8.3, a refrigerator (Figure 21a); (v) Consumers 9.1 and 12.1, air conditioners (Figure 21b). This approach ensures that the more complex consumption patterns of these appliances are accurately represented in the introduced load flow model (Section 3).
As part of the simulation procedure, load consumption data was gathered using a smart meter, as shown in Figure 22. The system includes a communication module (1), a smart kWh meter (2), and a socket (3) for connecting the device under test. The communication module utilizes the MODBUS protocol to retrieve data from the smart meter, which is then transmitted to the cloud via Wi-Fi. The smart meter is classified with an accuracy of 0.2% for current and voltage measurements, 0.5% for active power, and 2% for reactive power. The measurement data is available for download in CSV (Comma-Separated Values) or JSON (JavaScript Object Notation) formats.
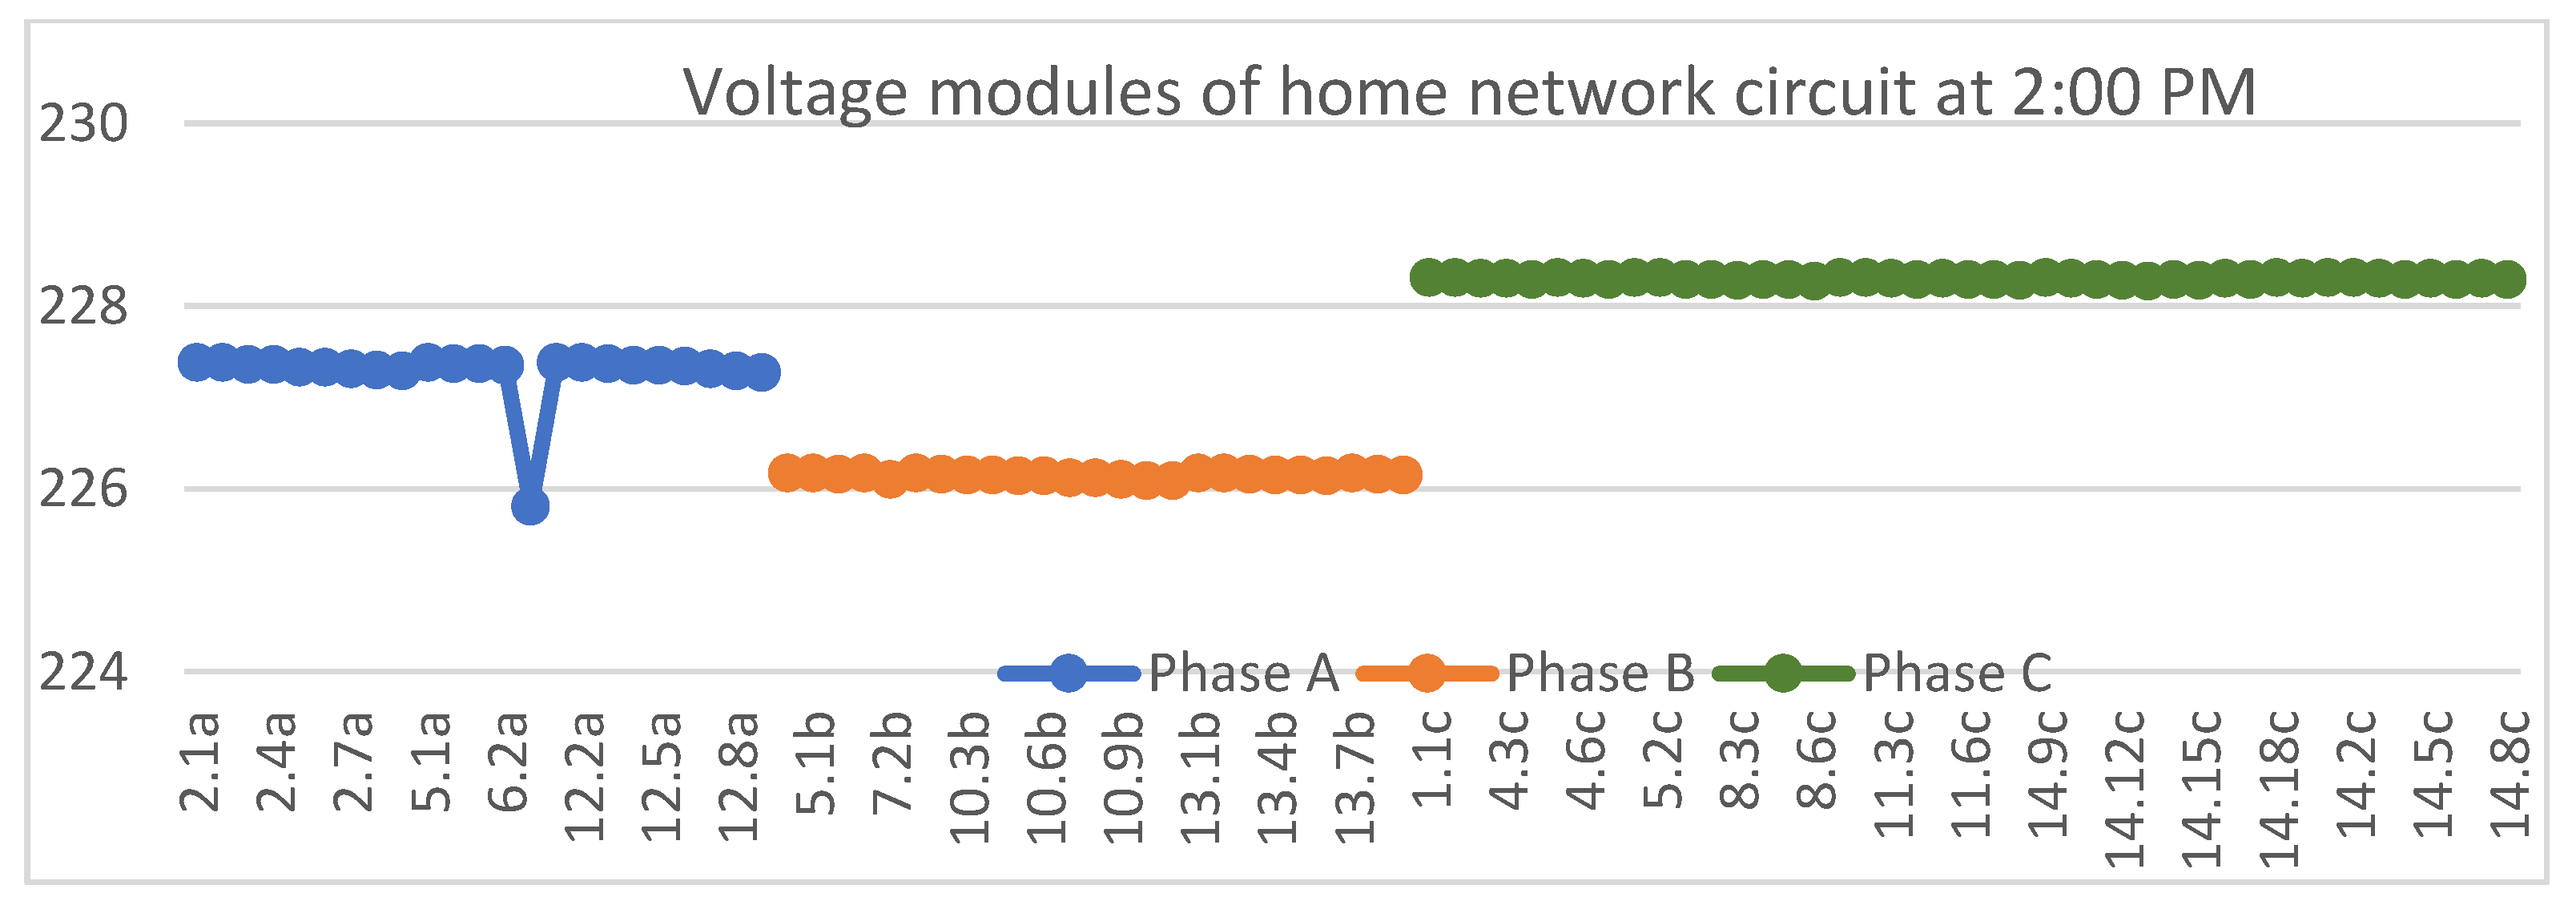
As the load flow procedures presented in [29,30] are not compatible with the methodology described above and employed in this study, the load flow for the entire home network was calculated at time t = 2:00 PM, with the results summarized in Figure 23. Given the extensive volume of results, only those derived from the procedures developed in this work are presented. The deviations from the procedures described in [29,30] do not exceed 0.7%.
In the subsequent phase of testing, a 24 h period was considered for the load flow simulation. The results, including voltage and current magnitudes, were obtained for the nodes corresponding to consumers with more complex load consumption patterns (as illustrated in Figure 20 and Figure 21). The calculated voltage at each node and the corresponding consumer current magnitudes over the 24 h period are presented in Figure 24 and Figure 25, respectively.
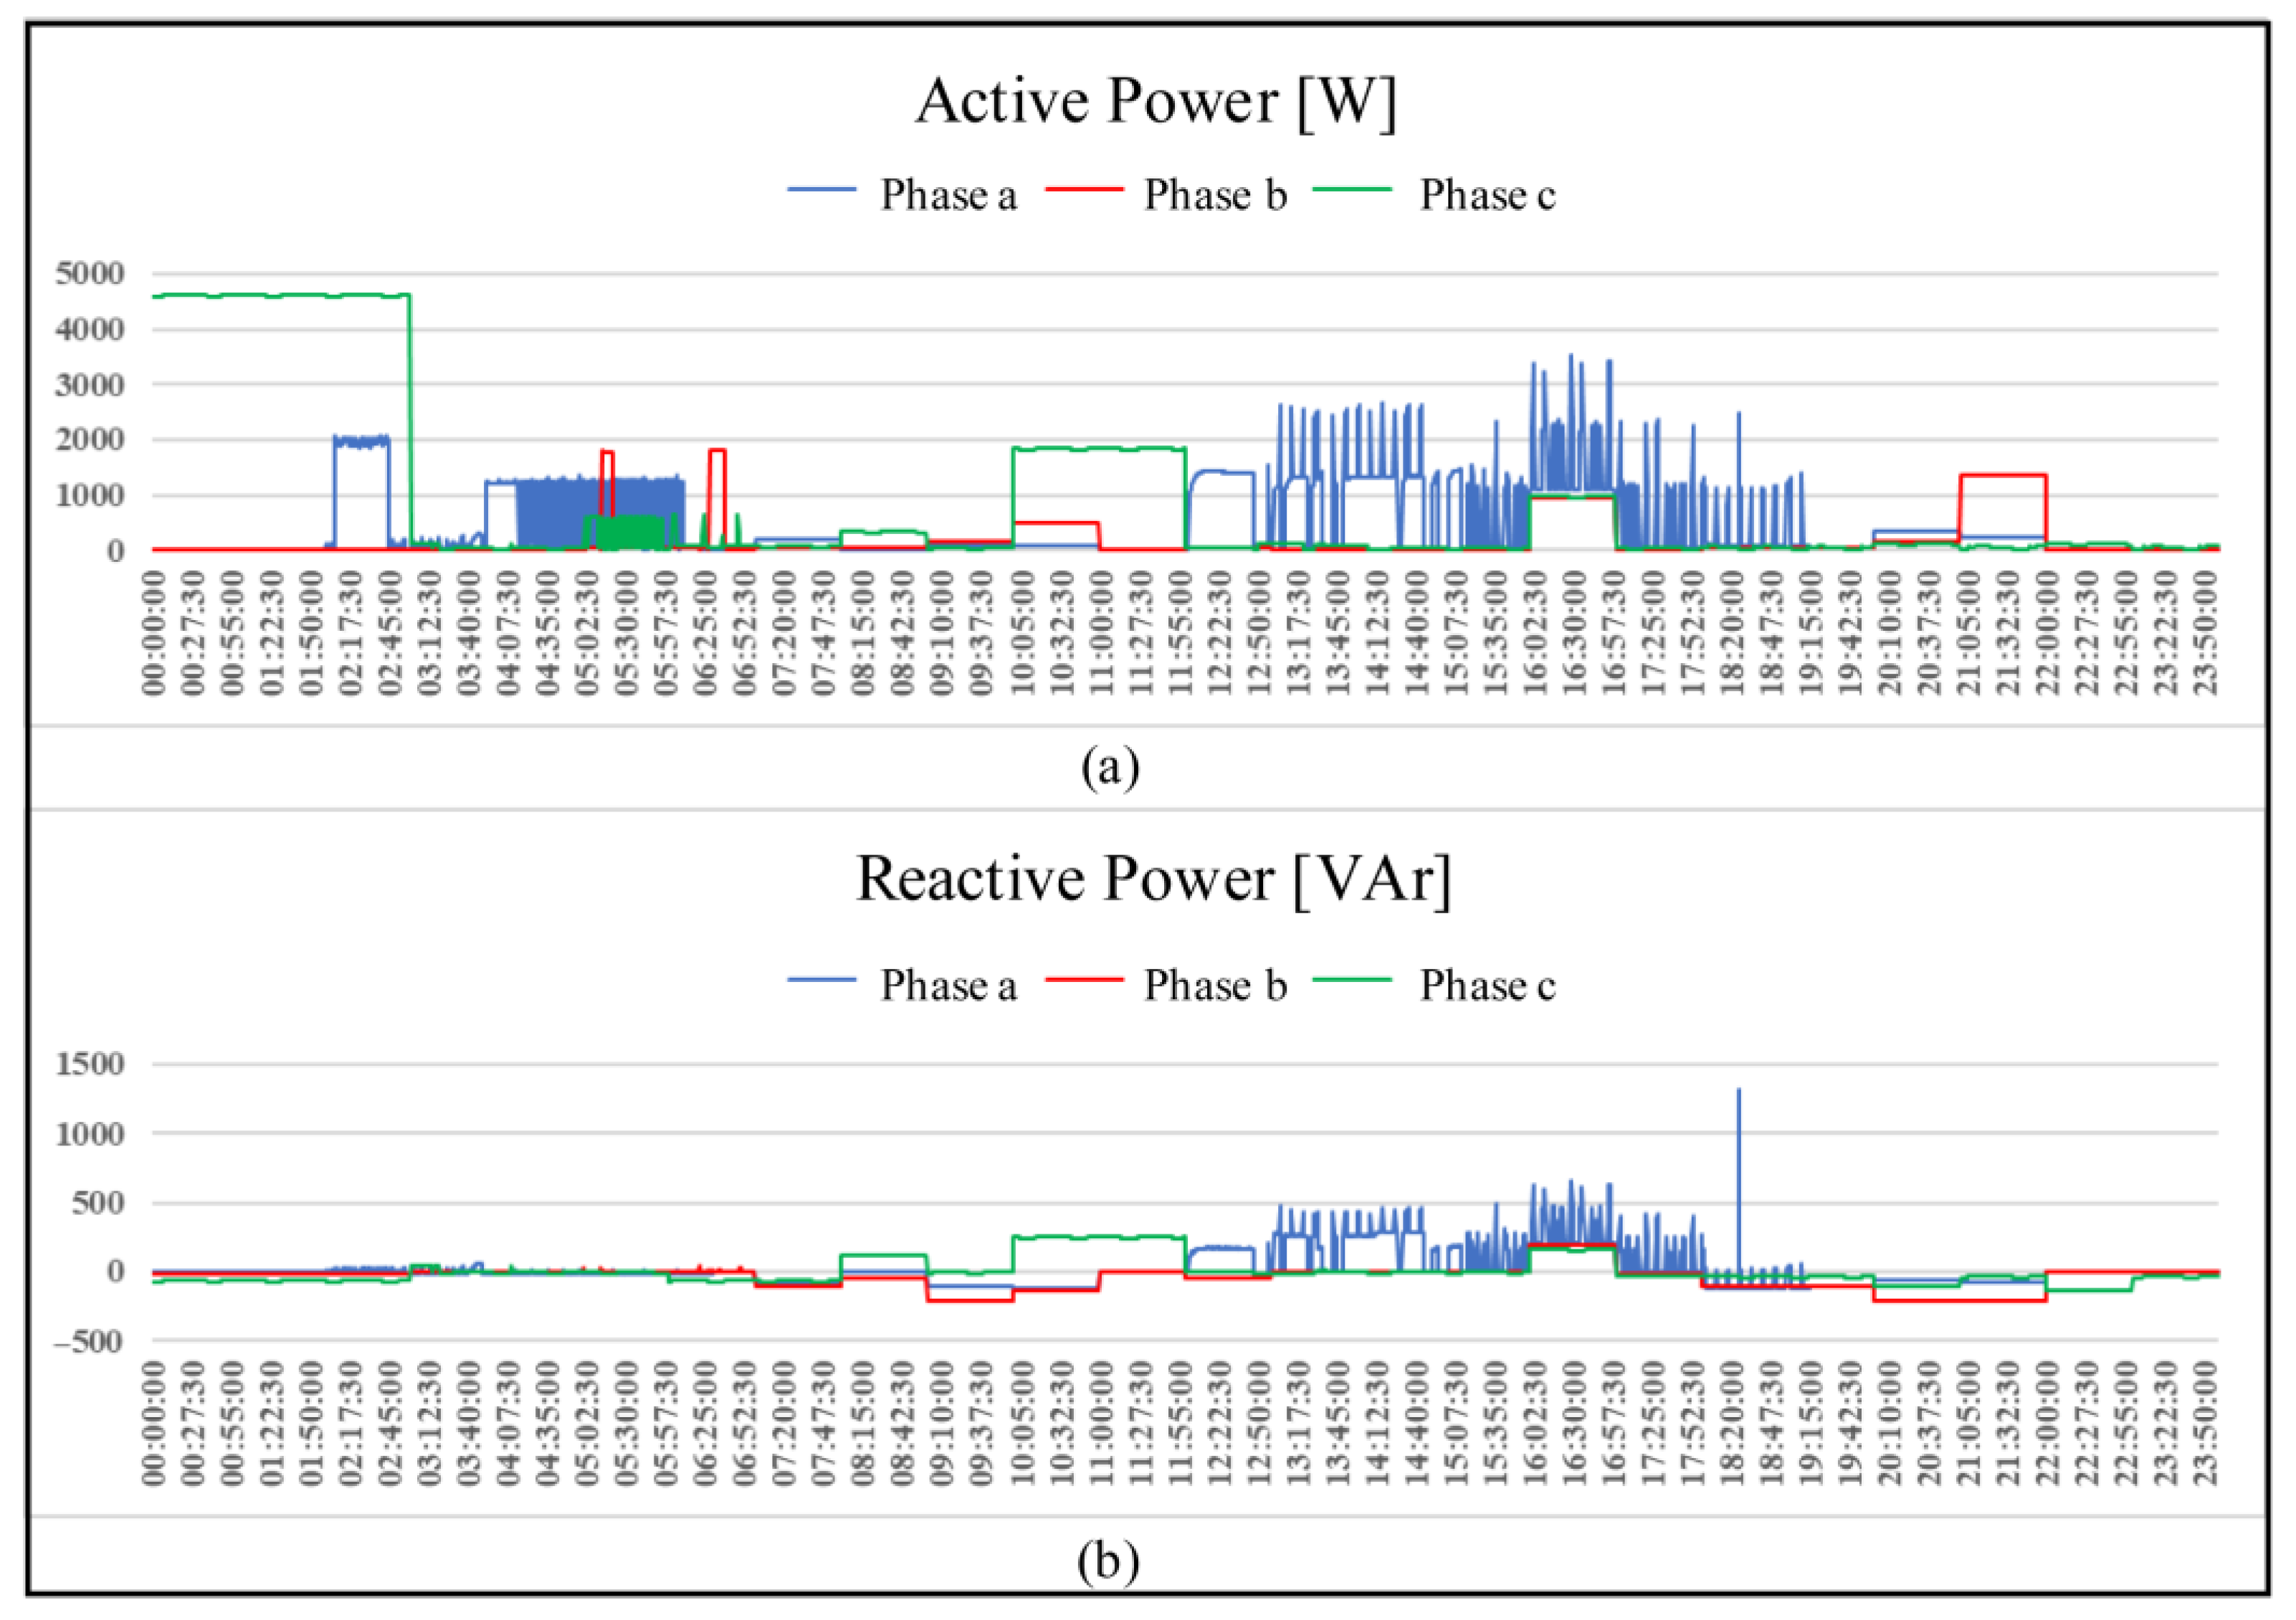
The final results are presented in Figure 26, which illustrates the total active and reactive power consumption over the 24 h period. From this figure, a significant power imbalance is evident throughout the day. Notably, during specific time intervals, such as from 9:10 to 10:05 AM, negative reactive power is observed in phase B, as shown in Figure 26b.

Integration of DG in Home Network

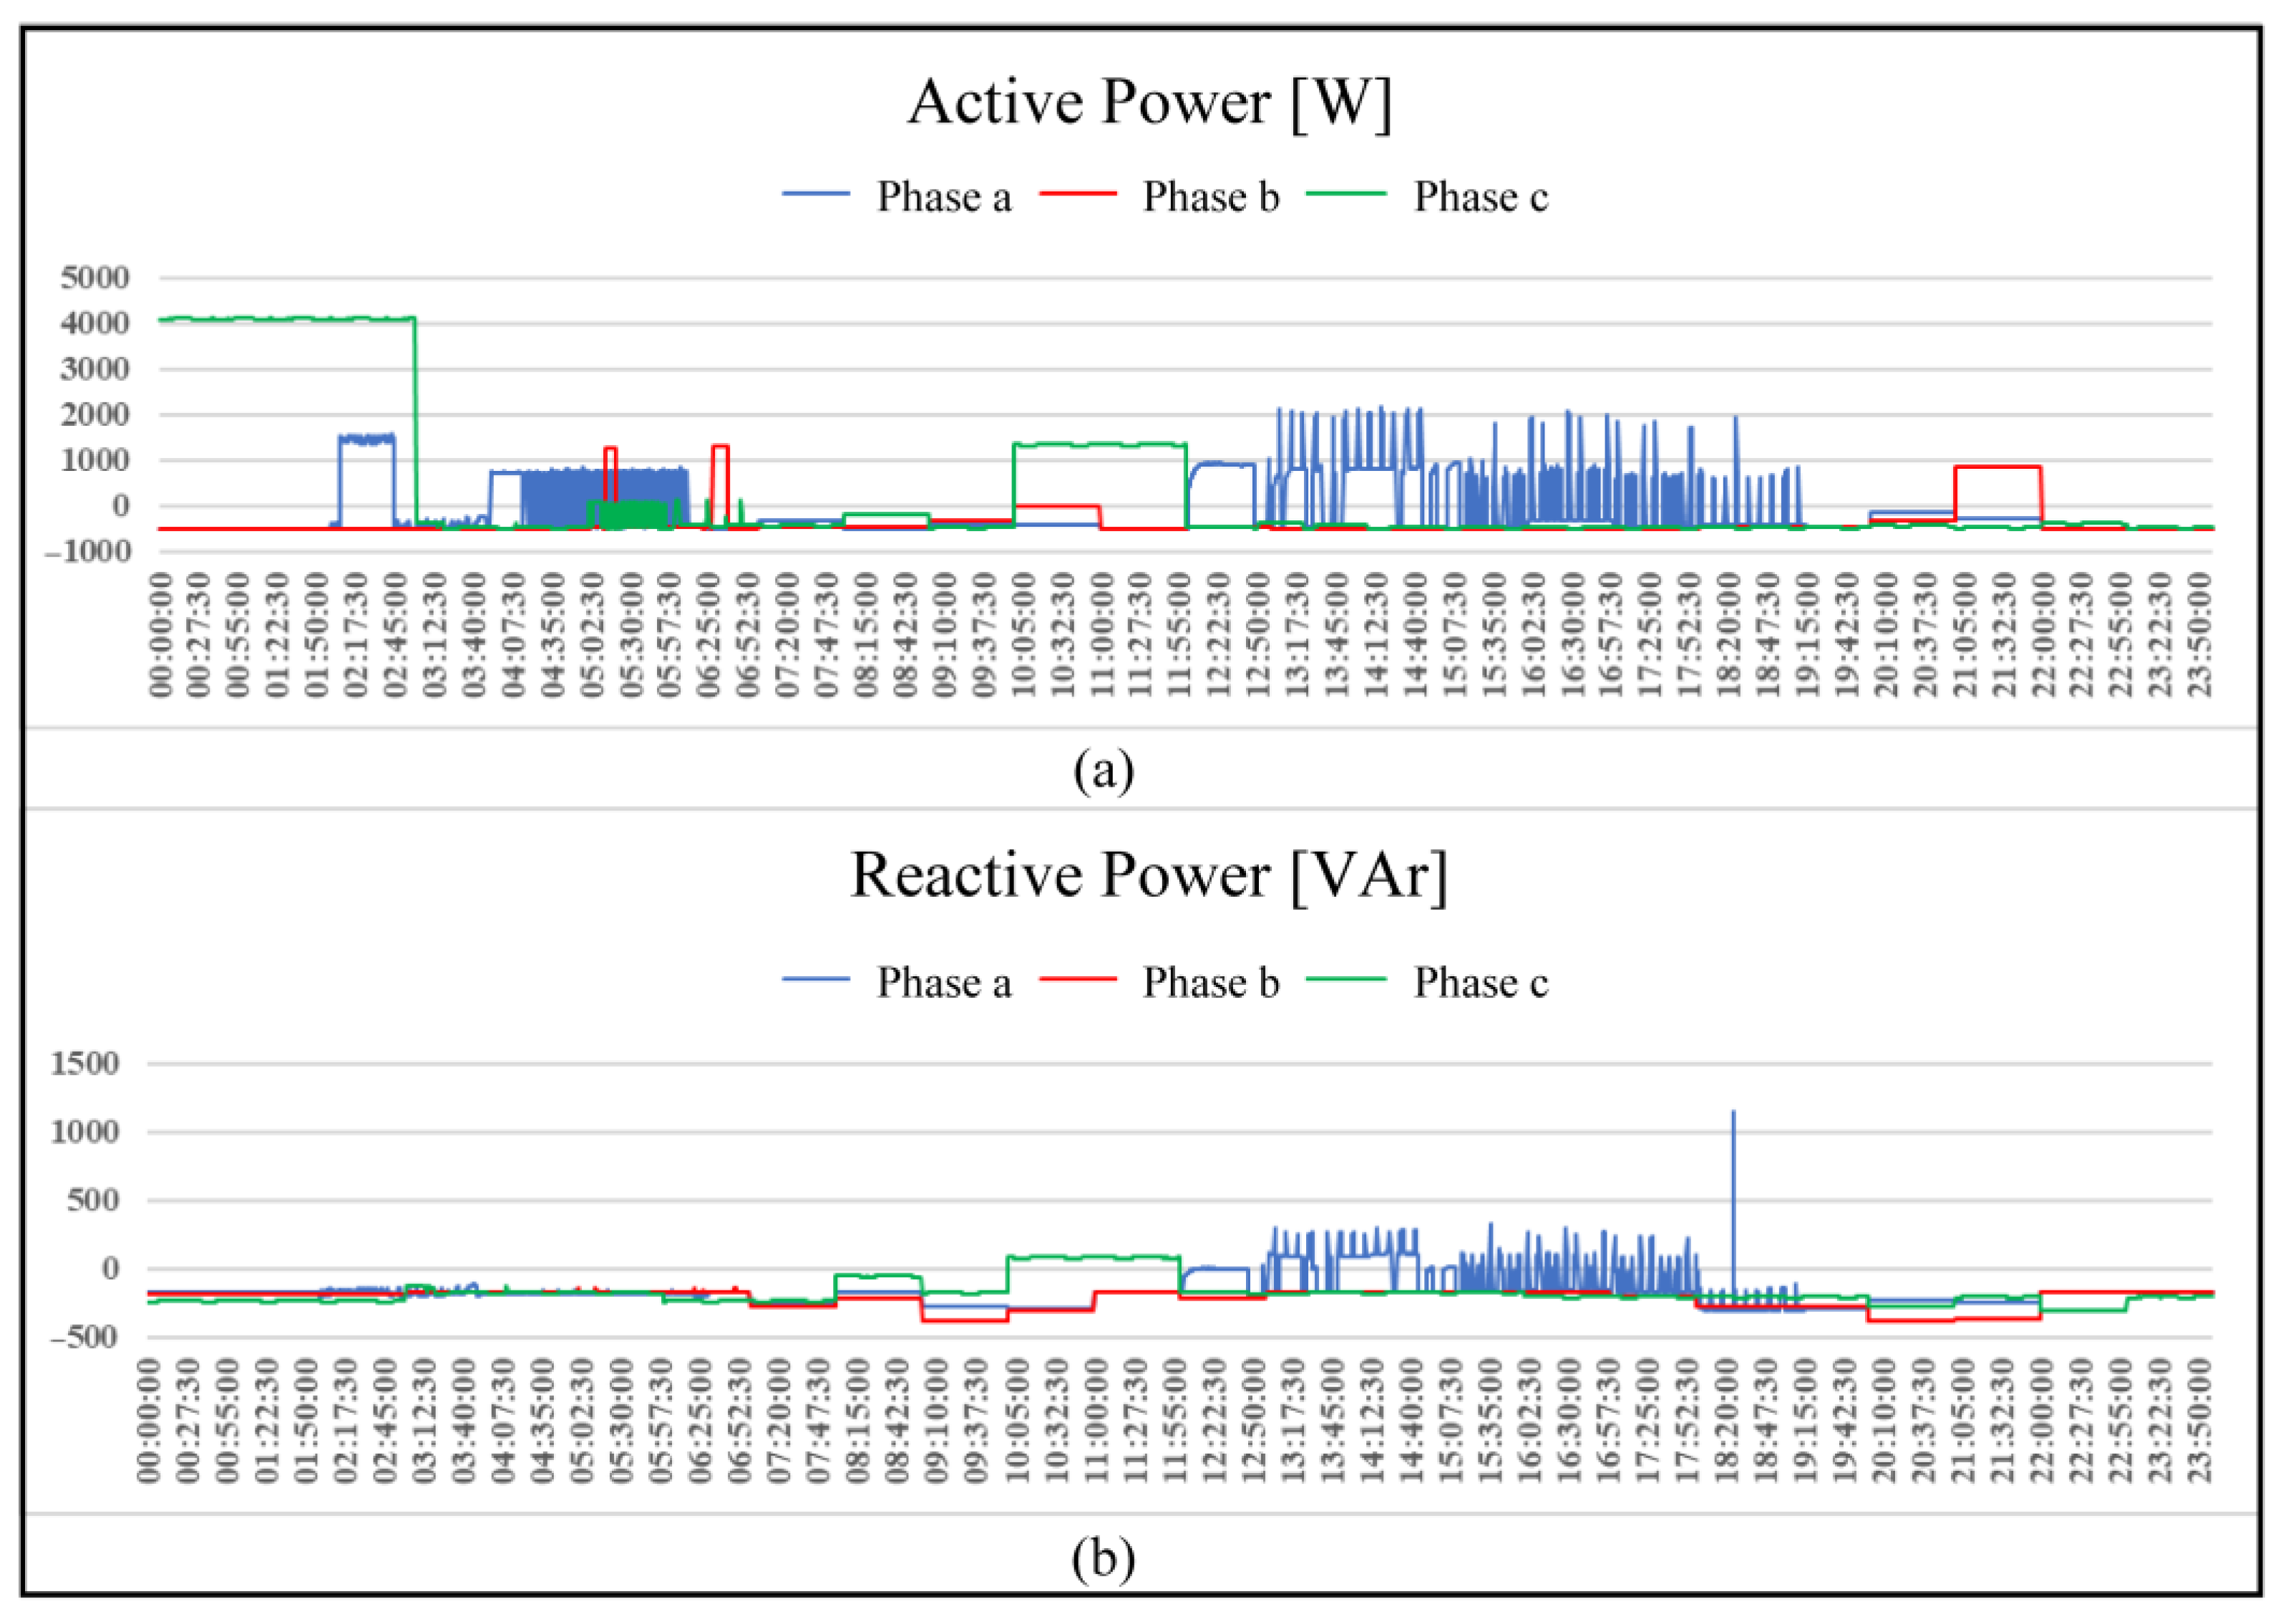
As smart homes evolve into prosumers, the home network depicted in Figure 18 is modified to incorporate distributed generation. Specifically, a three-phase DG is connected at connection point 5.2 in the main circuit feeder 5 (Figure 19). In Case 1, DG type 1, as detailed in Table 4 (Section Three-Phase Distributed Generator Model Integration in Load Flow Procedure), is employed. This generator is a traditional synchronous machine, with specified direct, inverse, and zero-sequence admittances: Yd = 110%, Yi = 20% and Y0 = 10%, respectively. The nominal apparent power is 3 kVA. The corresponding results for Case 1 are presented in Table 11. In Case 2, DG type 2 is connected, which is a Double-Fed Induction Generator (DFIG) with an additional control strategy that ensures balanced current injection into the system. The total active and reactive power consumption over the 24 h period for Case 2 is shown in Figure 27. Comparing the total consumption results from Figure 26 and Figure 27, it is evident that the integration of the generator significantly reduces the total home consumption, highlighting the role of DG in enhancing energy efficiency in prosumer-based smart homes. In both cases, the reverse reactive power flow is detected in phase B.

4.4. Performance of the Developed Procedure on the Large-Scale Distribution Network

The performance of the proposed procedure is evaluated using a large-scale IEEE European DN from [42] and compared with ones from [7,29,30]. Two test cases are considered: (i) Since the model in [7] assumes a single-phase three-wire (1φ3w) configuration, the European distribution network from [42] is adapted accordingly by converting it to the same configuration, using the line parameters specified in Section 4.1. The line lengths remain unchanged and the original loads (PQ nodes) are replaced with household electric networks described in Section 4.1. (ii) In this case, only the loads from [42] are replaced with the household electric networks defined in Section 4.2, while the original European DN configuration is retained. This configuration is used due to the incompatibility of the models in [29,30] with the single-phase three-wire (1φ3w). In both cases, the load flow for European DN is solved using the procedure from [5], whereas the proposed procedure, along with the procedures from [7,29,30], are applied to the household electrical networks. The results are summarized in Table 12 and Table 13. Based on the results, it is evident that the proposed load flow calculation method for residential networks demonstrates the highest efficiency.

4.5. Limitations of the Proposed Methodology

The limitations of the proposed solution are as follows:
(i)
The distribution energy resource voltage control in situation where part of the residential network forms the microgrid, operating in islanded mode.
(ii)
When the distribution energy resource is intermittent, the output power could be estimated using the weather, solar irradiation, ambient temperature, and wind speed model. Once these complex models are tailored for power flow model, they can be easily incorporated into the developed power flow calculation procedure since the efficiency is demonstrated in the previous subsection.
(iii)
Since EVs represent complex load, it is mandatory to measure their consumption at each stage of charging (grid to vehicle) or discharging (vehicle to grid) and then form the consumption diagram for this complex type of load. Based on this diagram it is possible to integrate the EV model into the load flow model and develop the load flow calculation procedure.
(iv)
The non-linearity loads results in a non-sinusoidal current which is periodic and needs Fourier expansion. It is possible to extend power flow models by increasing the number of relations by using the first Kirchhoff’s law for current and power balance.

5. Conclusions

Load flow analysis and simulations are crucial components of the smart grid concept. A wide range of advanced applications within HEMS are dependent on the results of the load flow calculation procedure. Within load flow models, traditionally, residential buildings have been modeled as aggregated loads with specified values of active and reactive powers. Although this approach has proven adequate for traditional distribution network analyses, the evolving complexity of residential building networks and smart grid concepts require more detailed modeling framework that explicitly incorporates the characteristics of residential buildings.
The proposed load flow procedure is based on the accurate models of all home network elements, which include appliances (with complex and traditional load profiles), measurement validation that is used to check the accuracy of the home wiring models, and on-site generator models for single-phase and three-phase distributed generators.
The wiring models have been validated by comparing the measured values to the simulated ones having the voltage magnitude mismatch of maximum 0.475% for the three-phase cables, and up to 0.133% for the single-phase cables. The single home model was also verified by comparing the simulation results of the introduced model to the model from the literature, and the voltage magnitude mismatch was less than 0.7%. Since some of the appliances have quite complex power profiles, which change both active and reactive power in real time, this paper introduced a realistic test case that includes such appliances by using their load patterns in real time. The load flow model includes not only the wiring and appliances models, but also the prosumer-based generator models such as photovoltaics or wind turbines.
The performance of the proposed load flow procedure is compared against those from the literature and shown to have the highest efficiency. The overall solution presented in this paper can be incorporated in both home energy management systems and more complex distribution energy management systems.
Future work will include the following: (i) microgrid operation in islanded mode; (ii) intermittent nature of DGs; (iii) EV model support including vehicle to grid and grid to vehicle modes; (iv) the support for the non-linear loads; (v) electromagnetic interference impact on the power flow.

Author Contributions

Conceptualization, N.V. and M.V.; Investigation, J.V.; Methodology, N.V., M.V., and D.P.; Software, N.V., M.V., J.V., and V.K.; Validation, Ž.P. and Đ.N.; Writing—original draft, N.V., M.V., and J.V.; Writing—review and editing, N.V., M.V., J.V., V.K., and Ž.P. All authors have read and agreed to the published version of the manuscript.

Funding

This paper has been supported by the Ministry of Science, Technological Development and Innovation (Grant No. 451-03-137/2025-03/200125, 451-03-136/2025-03/200125 and 451-03-137/2025-03/200156).

Data Availability Statement

The original contributions presented in this study are included in the article. Further inquiries can be directed to the corresponding author(s).

Conflicts of Interest

Author Vladan Krsman was employed by the company, Schneider Electric LLC. The remaining authors declare that the research was conducted in the absence of any commercial or financial relationships that could be construed as a potential conflict of interest.

Abbreviations and Nomenclature

Abbreviations
HEMSHome Energy Management Systems
PVPhotovoltaic
DGDistributed generation
EVElectric vehicle
EREnergy Resources
BFSBackward–Forward Sweep
BIBCBus-Injection to Branch-Current
BCBVBranch-Current to Bus-Voltage
LVLow voltage
ESSEnergy Storage Systems
ECDGElectronically Coupled Distributed Generators
1φ3wSingle-phase three wire system
1φ2wSingle-phase two-wire system
3φ4wThree-phase four-wire system
3φ5wThree-phase five-wire system
DFIGDouble-Fed Induction Generator
PCCPoint of Common Coupling
TPNThree-Phase and Neutral Distribution Board
DNDistribution network
Nomenclature
i, kNode indices
s ,   t Phase indices
U k , U n Actual and nominal voltage magnitudes at load terminal
P k spec ,   Q k spec Specified active and reactive powers at nominal voltage
z P k , i P k , p P k
z Q k , i Q k , p Q k
Constant impedance, current and power coefficients
c o s ϕ k spec Load power factor
{in, ia, ib}Node set indices closer to the root of American/Taiwan 1φ3w line section
{kn, ka, kb}Node set indices further to the root of American/Taiwan 1φ3w line section
Z ^ k a ,   Z ^ k b ,   Z ^ k n American/Taiwan 1φ3w line section impedances
Z ^ kaa ,   Z ^ kbb American/Taiwan 1φ3w section self-impedances
U ^ k a ,   U ^ k b ,   U ^ k n American/Taiwan 1φ3w node voltages closer to the root
U ^ i a ,   U ^ i b ,   U ^ i n American/Taiwan 1φ3w node voltages further to the root
E ^ k a , E ^ k b American/Taiwan 1φ3w inductive coupling voltages
I ^ k a ,   I ^ k b American/Taiwan 1φ3w line section currents
I ^ conks Load current
Z ^ k abc Series impedance matrix of European 3φ4w, 3φ5w, 1φ3w line sections
Y ^ k abc , Y ^ k abc Shunt admittance matrices of self and mutual capacitive phase couplings of European 3φ4w, 3φ5w, 1φ3w line sections
U ^ k abc , U ^ i abc Node voltage vectors
I ^ k abc , I ^ k abc Current vectors at the and at the end of European 3φ4w, 3φ5w, 1φ3w line section
I ^ k abc Branch current vector of European 3φ4w, 3φ5w, 1φ3w line section
I ^ k 0 abc , I ^ k 0 abc Shunt current vectors of European 3φ4w, 3φ5w, 1φ3w line section
Z ^ k s s Branch impedance of Γks section
Y ^ Σ k s Total self capacitance admittance of Γks section
Z ^ k s t Mutual inductance impedance of Γks section
Y ^ k s t Mutual capacitive coupling admittance of Γks section
U ^ k s , U ^ i s Node voltages of Γks section
I ^ k s Branch current of Γks section
I ^ CCks Capacitive coupling current of Γks section
E ^ k s Induced voltage of Γks section
T ^ , T ^ 1 Transformation matrices
X DGk d DG Subtransient reactance
Z ^ DGk d , Z ^ DGk i , Z ^ DGk 0 DG Positive, negative and zero sequence impedances
Y ^ DGk d , Y ^ DGk i , Y ^ DGk 0 DG Positive, negative and zero sequence impedances
Z ^ N k DG Impedance between the neutral and the ground
E ^ EXCk d DG internal voltage source (electro motive force)
I ^ EXCk d DG internal current source
P 3 ϕ k , Q 3 ϕ k Three-phase DG active and reactive powers
I ^ DGk d ,   I ^ DGk i , I ^ DGk 0 DG Positive, negative and zero sequence currents
Y ^ DGkss DG phase domain self capacitive admittance
Y ^ DGkst DG phase domain mutual capacitive admittance
I ^ PCks DG phase coupling current
I ^ DGks DG phase current at the PCC

References

  1. Leitao, J.; Gil, P.; Ribeiro, B.; Cardoso, A. A survey on home energy management. IEEE Access 2020, 8, 5699–5722. [Google Scholar] [CrossRef]
  2. Rathor, S.K.; Saxena, D. Energy management system for smart grid: An overview and key issues. Int. J. Energy Res. 2020, 44, 4067–4109. [Google Scholar] [CrossRef]
  3. Liu, Y.; Xiao, L.; Yao, G.; Bu, S. Pricing-based demand response for a smart home with various types of household appliances considering customer satisfaction. IEEE Access 2019, 7, 86463–86472. [Google Scholar] [CrossRef]
  4. Vojnović, N.; Vidaković, J.; Vidaković, M. Multi-threadaed unbalanced load flow of large-scale networks with advanced bus classification. Comput. Electr. Eng. 2022, 101, 108134. [Google Scholar] [CrossRef]
  5. Vojnović, N.; Vidaković, J.; Vidaković, M. Multi-threaded load flow of large-scale active multiphase distribution networks. Expert Syst. Appl. 2023, 1, 120313. [Google Scholar] [CrossRef]
  6. Strezoski, L.V.; Vojnovic, N.R.; Strezoski, V.C.; Vidovic, P.M.; Prica, M.D.; Loparo, K.A. Modeling challenges and potential solutions for integration of emerging DERs in DMS applications: Load flow and short-circuit analysis. J. Mod. Power Syst. Clean Energy 2019, 7, 1365–1384. [Google Scholar] [CrossRef]
  7. Liao, R.N.; Yang, N.C.; Chen, T.H. A novel and fast single-phase three-wire load flow solution for a modern home premises wiring systems. Int. J. Electr. Power Energy Syst. 2017, 1, 190–207. [Google Scholar] [CrossRef]
  8. Vojnović, N.; Vidaković, J.; Vidaković, M. Decoupled load flow for large-scale multiphase distribution networks. Sustain. Energy Grids Netw. 2023, 1, 101049. [Google Scholar] [CrossRef]
  9. Rahim, S.; Siano, P. A survey and comparison of leading-edge uncertainty handling methods for power grid modernization. Expert Syst. Appl. 2022, 204, 117590. [Google Scholar] [CrossRef]
  10. Tošić, S.; Vojnović, N.; Vidaković, M.; Vidaković, J.; Levi, V.; Ćetenović, D. Single and multi-threaded power flow algorithm for integrated transmission-distribution-residential networks. Comput. Electr. Eng. 2024, 120, 109735. [Google Scholar] [CrossRef]
  11. Shen, T.; Li, Y.; Xiang, J. A graph-based load flow method for balanced distribution systems. Energies 2018, 11, 511. [Google Scholar] [CrossRef]
  12. Strezoski, V.C.; Vidović, P.M. Power flow for general mixed distribution networks. Int. Trans. Electr. Energy Syst. 2015, 25, 2455–2471. [Google Scholar] [CrossRef]
  13. Ouali, S.; Cherkaoui, A. An improved backward/forward sweep load flow method based on a new network information organization for radial distribution systems. J. Electr. Comput. Eng 2020, 2020, 5643410. [Google Scholar] [CrossRef]
  14. Dkhili, N.; Eynard, J.; Thil, S.; Grieu, S. A survey of modelling and smart management tools for power grids with prolific distributed generation. Sustain. Energy Grids Netw. 2020, 21, 100284. [Google Scholar] [CrossRef]
  15. Koksoy, A.; Ozturk, O.; Balci, M.E.; Hocaoglu, M.H. A new wind turbine generating system model for balanced and unbalanced distribution systems load flow analysis. Appl. Sci. 2018, 8, 502. [Google Scholar] [CrossRef]
  16. Anirudh, C.V.S.; Seshadri, S.K.V. Enhanced modelling of doubly fed induction generator in load flow analysis of distribution systems. IET Renew. Power Gener. 2021, 15, 980–989. [Google Scholar] [CrossRef]
  17. Arboleya, P.; Koirala, A.; Suárez, L.; Mohamed, B.; González-Morán, C. Impact Evaluation of the New Self-Consumption Spanish Scenario on the Low-Voltage Terminal Distribution Network. IEEE Trans. Ind. Appl. 2019, 55, 7230–7239. [Google Scholar] [CrossRef]
  18. Qu, L.; Ouyang, B.; Yuan, Z.; Zeng, R. Steady-State Power Flow Analysis of Cold-Thermal-Electric Integrated Energy System Based on Unified Power Flow Model. Energies 2019, 12, 4455. [Google Scholar] [CrossRef]
  19. Sereeter, B.; Vuik, K.; Witteveen, C. Newton load flow methods for unbalanced three-phase distribution networks. Energies 2017, 10, 1658. [Google Scholar] [CrossRef]
  20. Murari, K.; Padhy, N.P. Graph-theoretic based approach for the load-flow solution of three-phase distribution network in the presence of distributed generations. IET Gener. Transm. Distrib. 2020, 14, 1627–1640. [Google Scholar] [CrossRef]
  21. Marini, A.; Mortazavi, S.S.; Piegari, L.; Ghazizadeh, M.S. An efficient graph-based load flow algorithm for electrical distribution systems with a comprehensive modeling of distributed generations. Electr. Power Syst. Res. 2019, 170, 229–243. [Google Scholar] [CrossRef]
  22. Hernández-Fuentes, H.E.; Soto, F.J.Z.; Martínez-Ramos, J.L. A fast non-decoupled algorithm to solve the load flow problem in meshed distribution networks. Sustain. Energy Grids Netw. 2022, 32, 100895. [Google Scholar] [CrossRef]
  23. Verma, R.; Sarkar, V. Application of modified Gauss-Zbus iterations for solving the load flow problem in active distribution networks. Electr. Power Syst. Res. 2019, 168, 8–19. [Google Scholar] [CrossRef]
  24. Feng, F.; Zhang, P. Implicit Zbus Gauss Algorithm Revisited. IEEE Trans. Power Syst. 2020, 35, 4108–4111. [Google Scholar] [CrossRef]
  25. Junior, H.M.; Melo, I.D.; Nepomuceno, E.G. An interval load flow for unbalanced distribution systems based on the Three-Phase Current Injection Method. Int. J. Electr. Power Energy Syst. 2022, 139, 107921. [Google Scholar] [CrossRef]
  26. Švenda, G.; Strezoski, V.; Kanjuh, S. Real-life distribution state estimation integrated in the distribution management system. Int. Trans. Electr. Energy Syst. 2017, 27, e2296. [Google Scholar] [CrossRef]
  27. Zhang, X.; Yu, X.; Ye, X.; Pirouzi, S. Economic energy management of networked flexi-renewable energy hubs according to uncertainty modeling by the unscented transformation method. Energy 2023, 278, 128054. [Google Scholar] [CrossRef]
  28. Pirouzi, S. Network-constrained unit commitment-based virtual power plant model in the day-ahead market according to energy management strategy. IET Gener. Transm. Distrib. 2023, 17, 4958–4974. [Google Scholar] [CrossRef]
  29. Yang, N.C.; Zeng, S.T. Three-phase power flow solution for multi-grounded four-wire residential networks considering neutral grounding. Energy Build. 2024, 323, 114784. [Google Scholar] [CrossRef]
  30. Clarke, J.A.; Kelly, N.J. Integrating power flow modelling with building simulation. Energy Build. 2001, 33, 333–340. [Google Scholar] [CrossRef]
  31. Wu, J.; Lian, Z.; Zheng, Z.; Zhang, H. A method to evaluate building energy consumption based on energy use index of different functional sectors. Sustain. Cities Soc. 2020, 1, 101893. [Google Scholar] [CrossRef]
  32. Teki, V.K.; Maharana, M.K.; Panigrahi, C.K. Study on home energy management system with battery storage for peak load shaving. Mater. Today Proc. 2021, 1, 1945–1949. [Google Scholar] [CrossRef]
  33. Liao, R.N.; Yang, N.C. Evaluation of voltage imbalance on low-voltage distribution networks considering delta-connected distribution transformers with a symmetrical NGS. IET Gener. Transm. Distrib. 2018, 12, 1644–1654. [Google Scholar] [CrossRef]
  34. Mbungu, N.T.; Bansal, R.C.; Naidoo, R.M. Smart energy coordination of autonomous residential home. IET Smart Grid 2019, 2, 336–346. [Google Scholar] [CrossRef]
  35. Hannagan, J.; Woszczeiko, R.; Langstaff, T.; Shen, W.; Rodwell, J. The Impact of Household Appliances and Devices: Consider Their Reactive Power and Power Factors. Sustainability 2022, 15, 158. [Google Scholar] [CrossRef]
  36. Pipattanasomporn, M.; Kuzlu, M.; Rahman, S.; Teklu, Y. Load profiles of selected major household appliances and their demand response opportunities. IEEE Trans. Smart Grid 2013, 5, 742–750. [Google Scholar] [CrossRef]
  37. Wang, X.; Mao, X.; Khodaei, H. A multi-objective home energy management system based on internet of things and optimization algorithms. J. Build. Eng. 2021, 33, 101603. [Google Scholar] [CrossRef]
  38. Sangswang, A.; Konghirun, M. Optimal strategies in home energy management system integrating solar power, energy storage, and vehicle-to-grid for grid support and energy efficiency. IEEE Trans. Ind. Appl. 2020, 56, 5716–5728. [Google Scholar] [CrossRef]
  39. Munankarmi, P.; Wu, H.; Pratt, A.; Lunacek, M.; Balamurugan, S.P.; Spitsen, P. Home Energy Management System for Price-Responsive Operation of Consumer Technologies Under an Export Rate. IEEE Access 2022, 10, 50087–50099. [Google Scholar] [CrossRef]
  40. Rizvi, S.M.H.; Sajan, K.S.; Srivastava, A.K. Synchrophasor based ZIP parameters tracking using ML with adaptive window and data anomalies. IEEE Trans. Power Syst. 2021, 37, 3–13. [Google Scholar] [CrossRef]
  41. Jabbar, W.A.; Annathurai, S.; Rahim, T.A.A.; Fauzi, M.F.M. Smart energy meter based on a long-range wide-area network for a stand-alone photovoltaic system. Expert Syst. Appl. 2022, 197, 116703. [Google Scholar] [CrossRef]
  42. IEEE.Org. IEEE PES Test Feeder. Available online: https://cmte.ieee.org/pes-testfeeders (accessed on 1 May 2025).
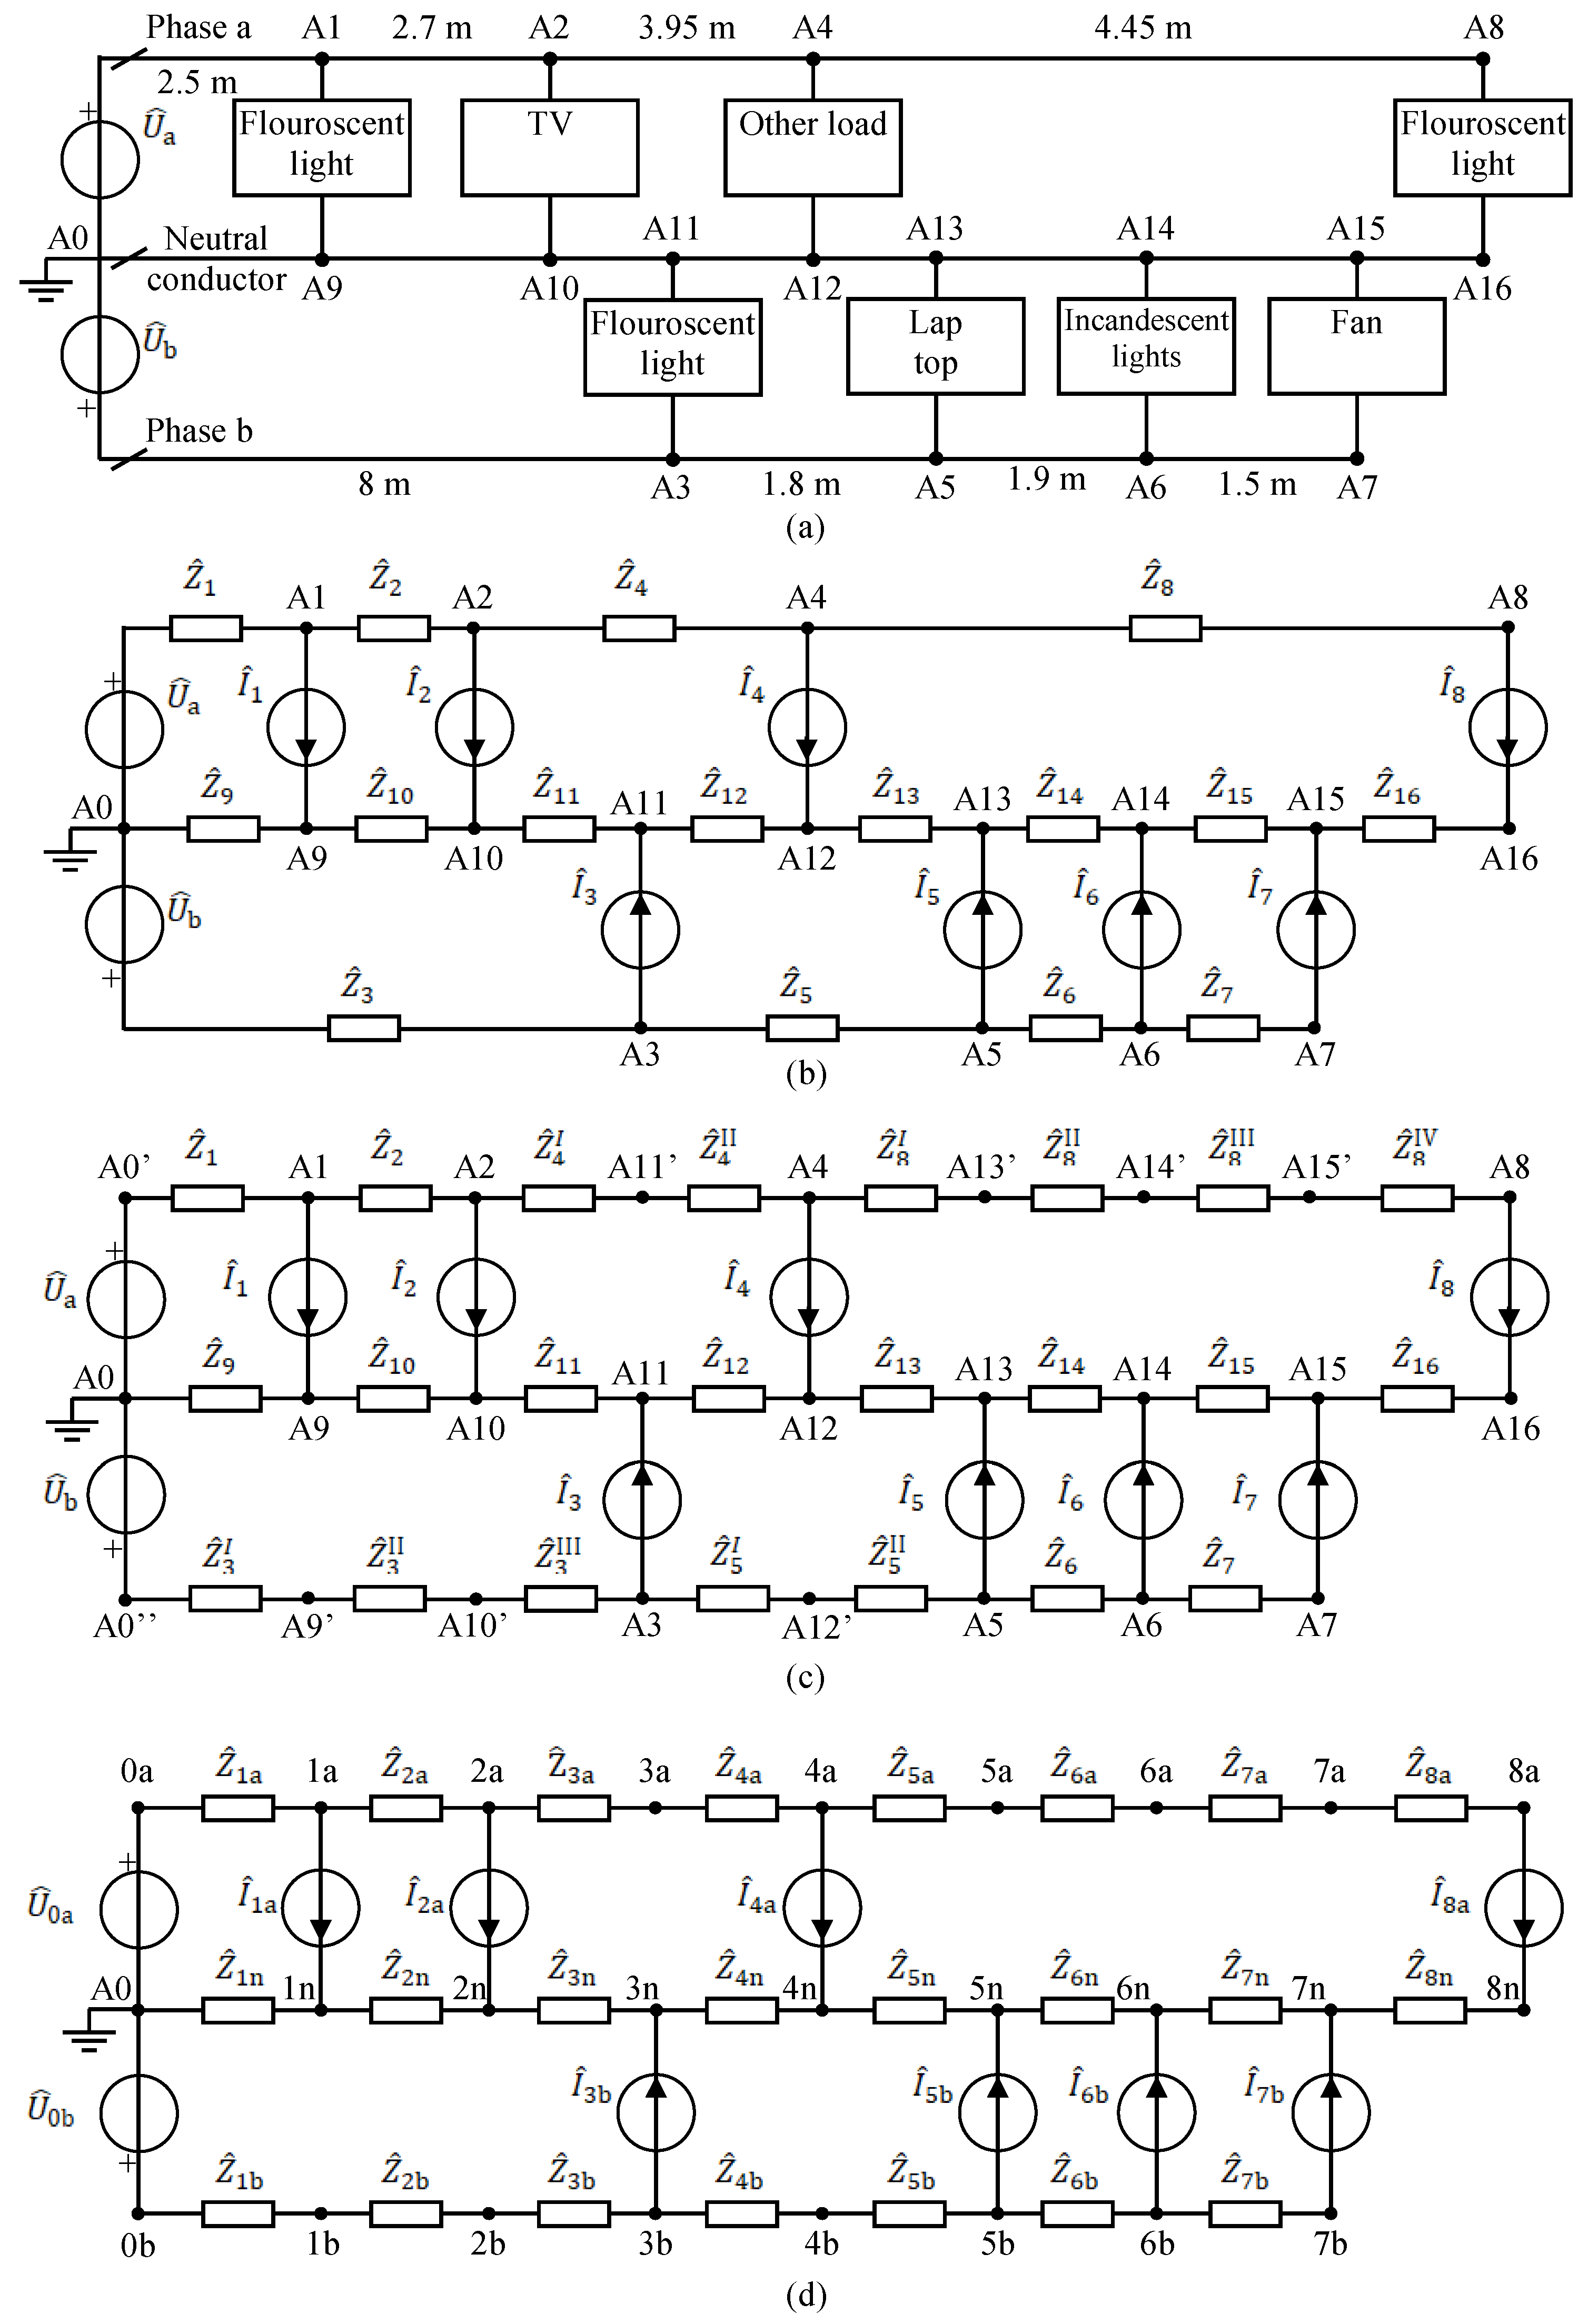
Figure 1. Home electric installation: (a) multi-line diagram [7]; (b) electrical circuit; (c) electrical circuit with artificial node insertion; (d) electrical circuit with implemented layer-type numeration.
Asi 08 00130 g001
Figure 2. (a) 1φ3w line section; (b) electrical circuit of 1φ3w line section after optimization; (c) decoupled Γks, section circuits.
Asi 08 00130 g002
Figure 3. Final decoupled home network circuit.
Asi 08 00130 g003
Figure 4. Multiphase Πk section.
Asi 08 00130 g004
Figure 5. (a) Short-circuit method for obtaining series parameter impedance; (b) open-circuit method for obtaining shunt parameter admittances.
Asi 08 00130 g005
Figure 6. The Πk section with impedance matrix ( Z ^ k abc ) annulled.
Asi 08 00130 g006
Figure 7. General decoupled Γks segment, s a b c .
Asi 08 00130 g007
Figure 8. Flow-chart of the BFS procedure.
Asi 08 00130 g008
Figure 9. (a) Traditional DGk; (b) DGk based on DFIG; (c) DG connected to the grid through power electronic devices only.
Asi 08 00130 g009
Figure 10. (a) Sequence circuits of DGk: positive, negative, and zero sequence circuit; (b) Norton equivalent sequence circuits of DGk.
Asi 08 00130 g010
Figure 11. Norton equivalent phase circuit of DGk, s = a , b , c
Asi 08 00130 g011
Figure 12. Summarized flow-chart of the BFS procedure with DG model integration.
Asi 08 00130 g012
Figure 13. (a) Home electric installation network with artificial nodes; (b) one-line diagram.
Asi 08 00130 g013
Figure 14. Node voltage magnitudes—Case 1.
Asi 08 00130 g014
Figure 15. Node voltage magnitudes—Case 2.
Asi 08 00130 g015
Figure 16. Four-wire three-phase cable parameter verification.
Asi 08 00130 g016
Figure 17. Two-wire single-phase cable parameter verification.
Asi 08 00130 g017
Figure 18. Practical sample dwelling unit.
Asi 08 00130 g018
Figure 19. One-line diagram of the entire home installation network from Figure 18.
Asi 08 00130 g019
Figure 20. Active power and power factor in certain time period: (a) Combined clothes washer and drier machine; (b) dish washer; (c) bread maker.
Asi 08 00130 g020
Figure 21. Active power and power factor in certain time period: (a) refrigerator; (b) air conditioner.
Asi 08 00130 g021
Figure 22. In-house made smart meter for active power and power factor measuring.
Asi 08 00130 g022
Figure 23. Load flow results of home network circuit at 2:00 PM.
Asi 08 00130 g023
Figure 24. Voltage and current magnitudes in 24 h period: (a) combined clothes washer and drier machine (node 2.6a); (b) dish washer (node 7.2b); (c) bread maker (node 84c).
Asi 08 00130 g024
Figure 25. Voltage and current magnitudes in 24 h period: (a) refrigerator (node 8.5c); (b) air conditioner (node 12.6a).
Asi 08 00130 g025
Figure 26. (a) Total active power consumption; (b) total reactive power consumption.
Asi 08 00130 g026
Figure 27. (a) Total active power consumption with DG; (b) total reactive power consumption with DG.
Asi 08 00130 g027
Table 1. Literature review comparison.
RefMethodResidential Network IncludedDG Incorporated into the Residential NetworkAll Types of Residential Electrical Wiring System Included
[4,18,19]Newton-based approachesNoNoNo
[10]Newton- and BFS-based approachYesNoNo
[22,23,24]Implicit Zbus methodNoNoNo
[25]Current Injection methodNoNoNo
[12,13,15,16]Backward–Forward SweepNoNoNo
[7]Loop Impedance Matrix-basedYesYesNo
[11,21]Distribution System Load Flow SolutionNoNoNo
[29]Implicit Zbus methodYesNoNo
[30]Newton-based approachYesYesNo
Table 2. Generated nodes.
IDs of new
generated nodes
A0’, A0”, A9’, A10’, A11’, A12’, A13’, A14’, A15’
Node pairsA0’, A0”A1, A9’A2, A10’A11’, A3A4, A12’A13’, A5A14’, A6A15’, A7A8
Layer-type numeration0a, 0b1a, 1b2a, 2b3a, 3b4a, 4b5a, 5b6a, 6b7a, 7b8a
Table 3. Specified and unknown state variables for particular generator type.
Generator TypeSpecified VariablesUnknown State Variables
DG type 1 P 3 ϕ k , Q 3 ϕ k U ^ k a , U ^ k b , U ^ k c
DG type 2 P 3 ϕ k , Q 3 ϕ k , I DGk i , I DGks 0 = 0 U ^ k a , U ^ k b , U ^ k c
Table 4. Conductor parameters.
BranchPhase/NeutralR [Ω/km]X [Ω/km]Length [m]
A0–A1a3.620.112.5
A1–A2a3.620.112.7
A2–A4a3.620.113.95
A4–A8a3.620.114.45
A0–A3b3.620.118
A3–A5b3.620.111.8
A5–A6b3.620.111.9
A6–A7b3.620.111.5
A0–A9n10.10.1192.5
A9–A10n10.10.1192.7
A10–A11n10.10.1192.8
A11–A12n10.10.1191.15
A12–A13n10.10.1190.65
A13–A14n10.10.1191.9
A14–A15n10.10.1191.5
A15–A16n10.10.1190.4
Table 5. Load data for sample 1φ3w home network.
ConsumerOriginal Numeration/(New Numeration)PhaseCase 1Case 2
Active Power [W]Power FactorActive Power [W]Power Factor
Fluorescent lightA1–A9/L1a300.95300.95
TVA2–A10/L2a800.951600.9
Other loadA4–A12/L4a800.952400.7
Fluorescent lightA8–A16/L8a800.955600.55
Fluorescent lightA3–A11/L3b400.95400.95
LaptopA5–A13/L5b600.75600.75
Incandescent lightsA6–A14/L6b250.8250.9
FanA7–A15/L7b300.95300.8
Table 10. One load variant scattered through entire home network with electrical data.
Connection Node PointLoadActive Power [W]Power FactorPhase
1.1Electric Water Heater E52–50R-045DV45001c
2.1LG clothes washer F2DV5S7N0EFigure 20aFigure 20aa
2.2LED bulb Osram—470 Lm5.5−0.57a
2.3Hair dryer5980.99a
2.4Hair dryer5980.99a
3.1Bathroom heater12001b
4.1LED bulb—Phillips 806 Lm16.7−0.55c
4.2LED bulb Osram—470 Lm5.5−0.57c
4.3LED bulb—Phillips 806 Lm16.7−0.55c
4.4LED bulb Osram—470 Lm5.5−0.57c
5.1Electric range/oven Kenmore 790.9131 201351000.98abc
6.1Water Kettle—Anko2129.30.99a
7.1Dish washerFigure 20bFigure 20bb
8.1Moulinex UNO Bread MakerFigure 20cFigure 20cc
8.2Microwave—Samsung1716.30.92c
8.3Refrigerator Maytag, 25.6-cuft side-by-sideFigure 21aFigure 21ac
9.1Air conditioner LG ES-H123LLA0Figure 21bFigure 21ba
10.1Vacuum—Dyson1335.00.98b
10.2Mobile phone charger10−0.47b
10.3LED—Dick Smith—40”64.5−0.62b
10.4Charger Power Tool—Ryobi38.2−0.62b
11.1Mobile phone charger10−0.47c
11.2Mobile phone charger10−0.47c
11.3Mobile phone charger10−0.47c
11.4Iron—Kambrook1863.70.99c
12.1Air conditioner LG ES-H123LLA0Figure 21bFigure 21ba
12.2Laptop Charger—Apple58.1−0.47a
12.3Charger Vacuum—Anko13.5−0.58a
12.4LED—Dick Smith—40”64.5−0.62a
13.1LED bulb—Phillips 806 Lm16.7−0.55b
13.2LED—Dick Smith—40”64.5−0.62b
13.3Mobile phone charger10−0.47b
13.4Laptop Charger—Apple58.1−0.47b
13.5USB Adapter Powerbank—Cosmos33.2−0.54b
14.1LED bulb Osram—470 Lm5.5−0.57c
14.2LED bulb Osram—470 Lm5.5−0.57c
14.3LED bulb—Phillips 806 Lm16.7−0.55c
14.4LED bulb Osram—470 Lm5.5−0.57c
14.5LED bulb Osram—470 Lm5.5−0.57c
14.6LED bulb—Phillips 806 Lm16.7−0.55c
14.7LED bulb—Phillips 806 Lm16.7−0.55c
14.8LED bulb—Phillips 806 Lm16.7−0.55c
14.9LED bulb—Phillips 806 Lm16.7−0.55c
Table 11. Node voltages and currents in node 5.2.
CaseVoltages [V]Injected Currents [A]
UaUbUcIaIbIc
1227.502226.337228.4802.1632.4412.362
2227.547226.315228.4602.3172.3172.317
Table 12. Procedure performance comparisons with [7].
Total CPU Time [ms]
Proposed load flowLoad flow procedure from [7]
159668
Table 13. Procedure performance comparisons with [29,30].
Total CPU Time [ms]
Proposed load flowLoad flow procedure from [29]Load flow procedure from [30]
43215052881
Table 6. Three-phase cable data.
Type of CableSize of Phase WiresSize of Neutral WireLength
PPY2.5 m22.5 m235 m
Table 7. Calculated voltage magnitudes comparison at node 2 with measured values.
UaUbUc
Calculated
[V]
Measured
[V]
Mismatch
[%]
Calculated
[V]
Measured
[V]
Mismatch
[%]
Calculated
[V]
Measured
[V]
Mismatch
[%]
222.828223.8910.475223.744223.1770.254225.519224.9940.233
Table 8. Calculated voltage angles comparison at node 2 with measured values.
θaθbθc
Calculated
[o]
Measured
[o]
Mismatch
[%]
Calculated
[o]
Measured
[o]
Mismatch
[%]
Calculated
[o]
Measured
[o]
Mismatch
[%]
1.4881.522.105−119.102−118.96−0.119121.106121.20.078
Table 9. Calculated voltage magnitude and angle comparison at node 2 with measured values.
θaUa
Calculated
[°]
Measured
[°]
Mismatch
[%]
Calculated
[V]
Measured
[V]
Mismatch
[%]
−3.926−3.9961.752222.818222.5210.133
Disclaimer/Publisher’s Note: The statements, opinions and data contained in all publications are solely those of the individual author(s) and contributor(s) and not of MDPI and/or the editor(s). MDPI and/or the editor(s) disclaim responsibility for any injury to people or property resulting from any ideas, methods, instructions or products referred to in the content.