1. Introduction
Modern supply chains operate in increasingly volatile environments where disruptions—particularly supplier delivery delays—can severely undermine operational performance and customer satisfaction. These challenges are amplified in EtO production systems, where manufacturing activities commence only after the receipt of customer-specific requirements [
1]. In such contexts, supplier lead times are both critical and highly uncertain, making reliable prediction and timely risk mitigation essential for ensuring production continuity [
2].
Conventional EWS for monitoring supplier lead times typically rely on static thresholds or historical averages. While simple to implement, these methods lack the capacity to adapt to real-time variability or dynamically changing supply chain conditions. As a result, they often generate inaccurate alerts, leading either to missed disruptions or excessive false alarms. Addressing these shortcomings requires system innovations that combine predictive analytics, real-time data integration, and adaptive alerting mechanisms.
The emergence of the Industrial IoT has created new opportunities for enhancing supply chain visibility and responsiveness [
3,
4]. IoT sensors and connected systems now enable the continuous capture of granular, time-sensitive data across operational processes. When integrated with probabilistic modeling and simulation, these data streams can support intelligent early warning solutions that dynamically adapt to evolving supply chain risks. Despite recent advances, there remains a research and practice gap in designing applied frameworks that fuse statistical modeling with IoT calibration and adaptive thresholding to support Smart Manufacturing systems.
To address this gap, the present study proposes an Intelligent IoT-Enhanced Probabilistic EWS tailored for Smart EtO supply chains. Three complementary alerting strategies are developed and evaluated: (i) the BPAS, which relies on historical supplier lead time distributions and fixed thresholds; (ii) the SIoT-CAS, which integrates real-time IoT deviation factors into forecasts while maintaining static thresholds; and (iii) the AID-RAS, which dynamically recalibrates both lead time predictions and critical thresholds using evolving IoT signals.
These systems are benchmarked using a Monte Carlo simulation framework under different levels of lead time uncertainty (σ), probability alert thresholds (), and maximum acceptable lead times (). Their performance is assessed through standard prediction and classification metrics, including Mean Absolute Error (MAE), Root Mean Square Error (RMSE), True Positive Rate (TPR), False Positive Rate (FPR), and Accuracy. This enables a comprehensive evaluation of predictive reliability, responsiveness, and robustness across varying operational scenarios.
The contribution of this study is twofold. From a theoretical perspective, it advances the literature on supply chain risk monitoring by introducing an integrated, IoT-enhanced probabilistic framework for EWS design. From a practical standpoint, it demonstrates an applied innovation that can be deployed within digital control towers, MES, or supplier management platforms to improve delivery reliability while minimizing operational inefficiencies. By combining IoT calibration, adaptive thresholding, and probabilistic forecasting, the proposed system enhances the resilience and intelligence of Smart EtO supply chains.
The remainder of this paper is structured as follows:
Section 2 reviews related work on lead time prediction and EWSs.
Section 3 outlines the proposed methodology, including probabilistic modeling, IoT integration, and simulation design.
Section 4 presents the experimental evaluation and results.
Section 5 discusses theoretical implications and managerial insights. Finally,
Section 6 concludes with the main findings and directions for future applied research.
2. Literature Review
EtO supply chains are marked by high customization, substantial variability, and extended lead times, all of which amplify their susceptibility to supplier-related disruptions. These delays are frequently exacerbated by engineering changes, non-standard components, and low repeatability in procurement cycles. Such complexity and uncertainty have prompted extensive research in predictive modeling, scheduling optimization, and disruption management [
1,
2]. For instance, the recent systematic literature review conducted by Fortes et al. [
1] presents a comprehensive overview of the operational challenges facing EtO environments, categorized into themes such as planning, scheduling, capacity, and lead time management. The review identifies diverse methodological contributions to address these issues—ranging from Bayesian uncertainty modeling to optimize cost estimation under batch size uncertainty [
5], to the integration of Lean Project Management for managing frequent design changes [
6]. Scheduling remains a focal point, with several approaches proposed, including regenerative scheduling models to handle machine breakdowns and urgent orders [
7], and genetic algorithm-based hyper-heuristics to improve practical applicability in large-scale scenarios [
8]. Other solutions address poor workflow visibility through real-time Radio Frequency Identification (RFID)-based data collection [
9], and complexity in configuration processes via product similarity frameworks [
10]. However, the review also highlights persistent limitations—such as the lack of case-based validation [
11,
12], scalability issues in large project contexts [
13], and fragmented software ecosystems [
14]. These findings underscore the need for integrated, adaptive systems that can dynamically respond to the variability and uncertainty intrinsic to EtO production systems. However, many of these early approaches rely on case-specific implementations or simplified assumptions, limiting their generalizability in real-time, high-variability contexts.
Lead time prediction has emerged as a central issue in supply chain analytics. Traditional approaches often assume normally distributed lead times, which do not adequately represent the skewed, non-negative distribution observed in real-world delivery delays. To address this, researchers increasingly use log-normal distributions, which provide greater realism, especially in environments where late deliveries are more common than early ones. Studies by Tadikamalla [
15] and Strijbosch and Moors [
16] have demonstrated that log-normal models outperform symmetric alternatives under high demand uncertainty. Nonetheless, these models are often static and disconnected from real-time decision frameworks, thereby limiting their operational utility. Addressing this gap, Alaoua and Karim [
17] proposed a novel approach that integrates IoT data with log-normal lead time modeling to dynamically optimize supplier performance in Smart EtO supply chains. Their framework leverages real-time monitoring to recalibrate lead time predictions continuously, thus transforming static probabilistic models into adaptive, decision-support tools capable of issuing early warnings under uncertainty.
Recent advancements in digital supply chains have highlighted the potential of the IoT to bridge critical visibility and forecasting gaps. IoT-enabled systems offer continuous monitoring of upstream operations, allowing organizations to track supplier conditions in real time and respond to disruptions proactively. Alzahrani and Asghar [
18] introduced an IoT-based logistics risk model that enhances disruption prediction in volatile contexts. Similarly, Sallam et al. [
19] and Zrelli and Rejeb [
20] emphasized that interoperability, real-time analytics, and feedback loops are essential for unlocking the full predictive power of IoT in supply chain forecasting. Chigilipalli et al. [
3] demonstrated the role of IoT in additive manufacturing environments, where smart integration of beacons and mobile data exchange facilitates real-time monitoring, waste reduction, and improved responsiveness. Their findings reinforce the relevance of IoT for efficient, customized, and adaptive production processes. Expanding on this paradigm, recent studies have proposed integrating digital twins—virtual replicas of physical assets—with advanced learning algorithms to further improve supply chain resilience. For example, Abideen et al. [
21] developed a digital twin architecture enhanced by reinforcement learning to support adaptive decision-making in logistics. Kritzinger et al. [
22] also categorized digital twin applications in manufacturing, highlighting their potential to simulate complex behaviors and predict disruptions before they escalate. Alzahrani and Asghar [
18] proposed an intelligent risk prediction system for the logistics sector using a hybrid deep learning model (CNN + BiGRU) to assess the impact of natural disasters on shipping operations based on IoT data. Their work highlights the potential of real-time data and deep learning for enhancing decision support in supply chain risk management, particularly under disruptive external events. Collectively, these studies reflect a growing consensus on the importance of embedding IoT-calibrated intelligence into predictive monitoring architectures to enhance agility and resilience in supply chain management.
In parallel, the concept of supply chain resilience has gained prominence. Nikookar et al. [
23] emphasized that resilience extends beyond buffering capacity or redundancy to include strategic configuration and the timely activation of response capabilities. Sreedevi and Saranga [
24] noted that flexibility in sourcing and production is crucial for mitigating both supply and demand risks, although such capabilities may be constrained in settings with limited infrastructure. These insights reinforce the need for data-driven EWSs that exceed traditional buffer-based approaches.
The deployment of EWS has thus emerged as a proactive risk management strategy. Empirical studies have demonstrated their ability to anticipate quality and quantity issues—particularly in the food industry [
25,
26,
27]—and to identify a broad spectrum of risks in sectors like fashion and maritime logistics [
28]. In the financial services sector, EWS are used to prevent customer churn [
29], while in manufacturing, they have proven effective in identifying operational threats [
30] and anticipating supply disruptions [
31]. Despite these sector-specific successes, the systematic implementation of EWS at the supply chain level remains underdeveloped.
Addressing this gap, Nagy and Foltin [
32] proposed a framework that integrates publicly available big data to generate early warning signals for maritime logistics. Their findings show that embedding big data analytics (BDA) into EWS design significantly improves resilience by enabling early detection and proactive responses to emerging threats.
The broader literature confirms the critical role of BDA in strengthening supply chain analytics. As data volume and complexity increase, decision-makers require robust systems capable of filtering, structuring, and interpreting diverse information sources [
33,
34]. Successful adoption of these systems demands not only advanced technological infrastructure but also organizational readiness and skilled personnel.
Real-world implementations by companies like Ford and IBM illustrate the practical effectiveness of predictive modeling in mitigating supply-side risks [
35,
36], though the accurate forecasting of high-impact, low-probability events remains inherently difficult [
37]. Nevertheless, the integration of BDA facilitates the development of more adaptive, intelligent, and resilient supply networks [
38,
39].
While various studies have explored predictive analytics and lead time modeling in supply chains, a significant gap remains in integrating real-time data calibration, statistical forecasting, and actionable early warnings into a unified framework. Most traditional models remain static, aggregated, and detached from operational decision-making, limiting their responsiveness in dynamic environments. Addressing this shortfall, recent efforts—such as Hinrichsen et al. [
40]—have emphasized the importance of anticipatory risk management systems. Their proposed EWS enhances supply chain resilience by monitoring procurement market disruptions—such as commodity price volatility and geopolitical risks—through the application of Principal Component Analysis (PCA) on publicly available indices. By moving beyond reactive “firefighting” strategies, their work reinforces the value of real-time monitoring and index-based analytics in enabling proactive intervention. Building on these insights, the present research contributes by introducing an intelligent, IoT-calibrated EWS designed for complex and uncertainty-prone supply chain environments—such as those found in EtO systems—where supplier variability and operational complexity necessitate real-time responsiveness.
3. Methodology
This section presents the details of the proposed intelligent EWS for predicting supplier delivery delays in a smart manufacturing environment. The methodology integrates log-normal statistical modeling of supplier lead times, real-time adjustments using Internet of Things (IoT) data, dynamic thresholding, and probabilistic alert generation. The objective is to provide a robust and adaptive mechanism for anticipating delivery risks in volatile supply chain conditions.
The baseline supplier lead time
is modeled as a log-normal random variable, capturing the empirically observed right-skewed distribution of real-world delivery durations. Formally, we assume:
Here,
μ and
σ are the mean and standard deviation of the natural logarithm of the lead time. These parameters are estimated from historical supplier performance data using:
where
is the observed lead time of the
i-th delivery, and
n: the number of simulated (or observed) supplier lead times (i.e., the sample size).
The probability density function (PDF) of
is thus defined as:
To account for real-time disturbances, operational data are continuously collected via an IoT infrastructure. This includes data streams related to machine health, inventory levels, transport status, supplier reliability, and contextual disruptions. A deviation factor
δ(
t) is dynamically computed to represent the relative shift in expected delivery performance at time
t, based on these operational indicators. The baseline lead time is then adjusted as:
This expression reflects the real-time updated estimation of lead time, incorporating sensor-driven insights. The system then evaluates whether the adjusted lead time exceeds a critical time threshold
. While in traditional systems
is often fixed, the proposed method dynamically recalculates this threshold based on current conditions. Specifically:
where
is the customer’s required delivery date,
is the estimated remaining internal production time, and
is the allowable scheduling slack. This ensures that the system adapts its tolerance to disruption in real time.
To assess the likelihood of a late delivery, the system computes the probability that
exceeds the dynamic threshold
using the cumulative distribution function (CDF) of the log-normal distribution. The final probabilistic risk measure is expressed as:
where
is the standard normal cumulative distribution function. An alert is triggered when this risk exceeds a predefined threshold probability
, reflecting the decision-maker’s risk tolerance:
This condition enables the system to generate alerts in a manner that is neither overly conservative nor overly tolerant, but instead optimally balanced to current operational realities. It allows the organization to proactively identify potential delays and take preventive action before they materialize into disruptions.
To evaluate the performance and robustness of the EWS mechanisms proposed and developed in this study, a comprehensive Monte Carlo simulation framework was implemented. This simulation environment generates synthetic supplier lead time scenarios under varying levels of uncertainty, governed by the standard deviation parameter σ, as well as across different alert probability thresholds () and delivery constraints (). The evaluation focuses on three novel alerting strategies designed to address different dimensions of supplier delay prediction:
The Baseline Probabilistic Alerting System (BPAS): A foundational model that issues alerts based on the probability that modeled supplier lead times exceed a fixed critical threshold. This system relies solely on historical data and does not incorporate real-time updates.
The Smart IoT-Calibrated Alert System (SIoT-CAS): An enhanced version that adjusts supplier lead time predictions in real time using IoT-derived operational deviation factors δ(t). However, it still operates with a static threshold (), making it partially adaptive.
The Adaptive IoT-Driven Risk Alert System (AID-RAS): A fully dynamic and intelligent alerting model that integrates real-time IoT-based calibration of lead times and continuously updates the critical threshold () based on production progress, buffer availability, and customer due dates.
Each system was subjected to 1000 simulation iterations per configuration to ensure statistical validity and robustness. System performance was quantified using the following key evaluation metrics:
where
TP,
FP,
FN, and
TN refer to the counts of true positives, false positives, false negatives, and true negatives, respectively, from the confusion matrix of simulated alert outcomes.
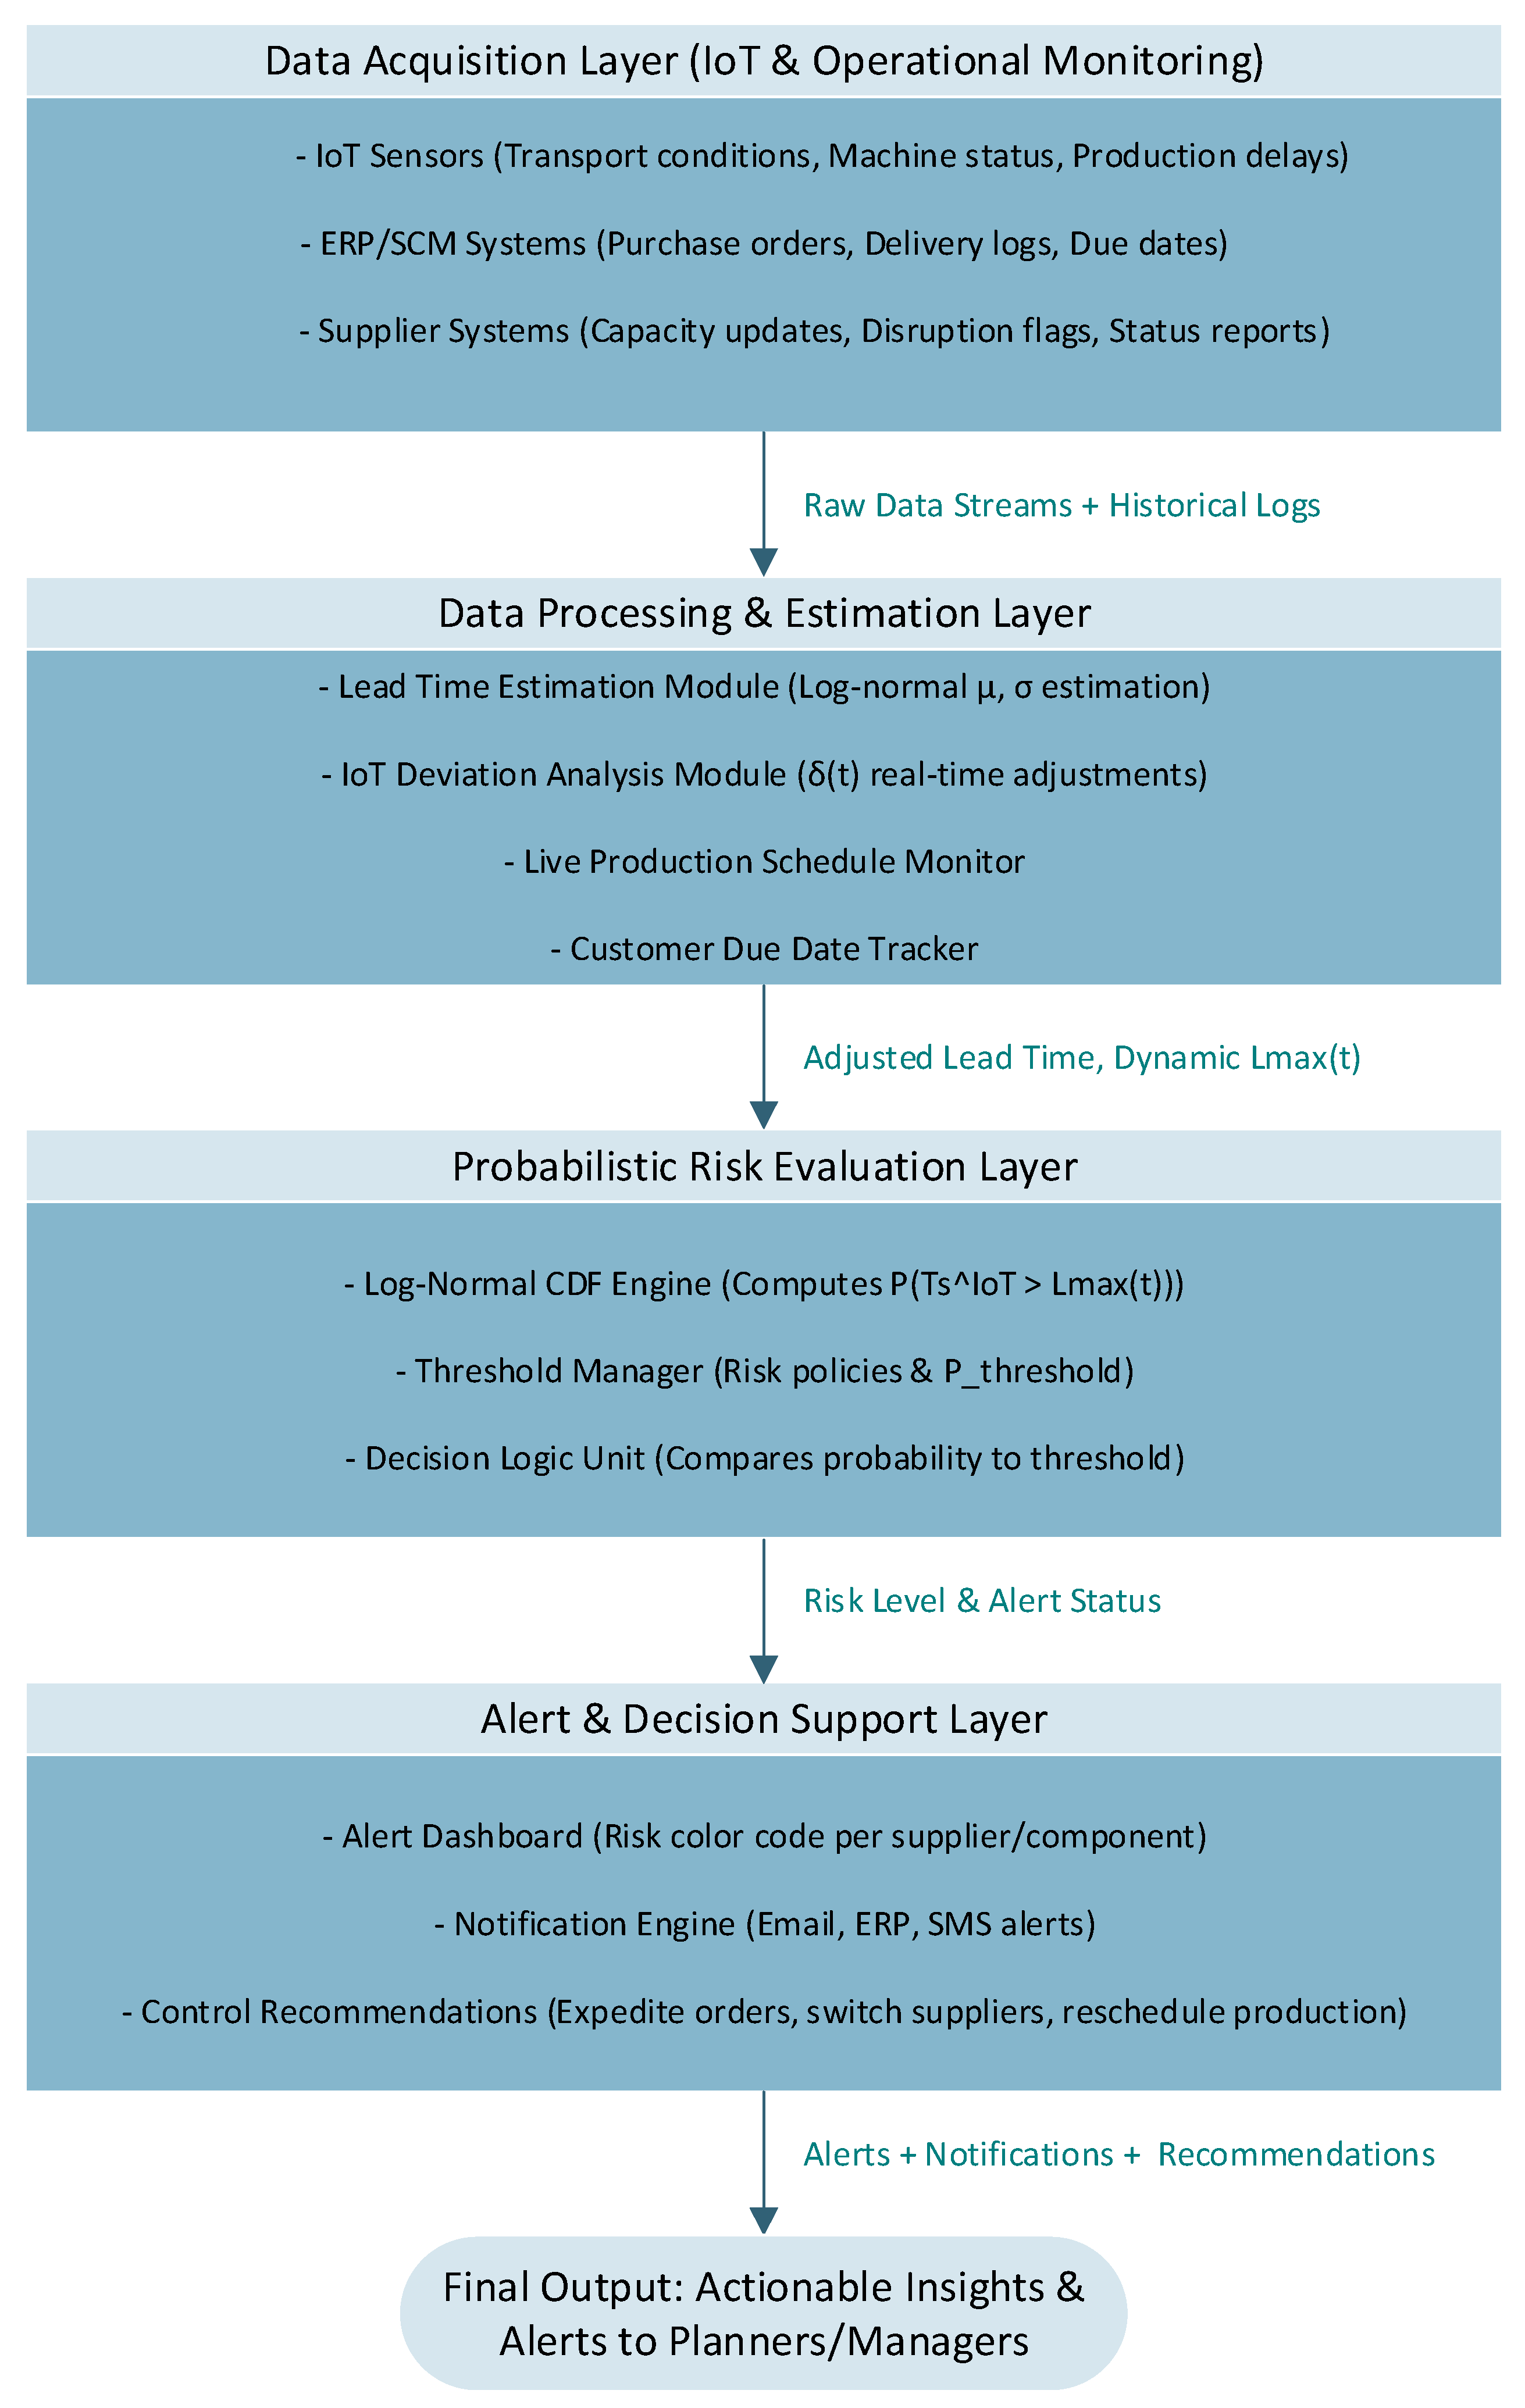
To visualize the structure and logic of the proposed EWS,
Figure 1 provides a flowchart of its architecture. This diagram illustrates the integration of IoT data acquisition, real-time calibration, probabilistic modeling, dynamic thresholding, and alert issuance—offering a comprehensive representation of how the EWS operates in smart EtO environments.
4. Results and Evaluation
This section presents the experimental results and performance assessment of the proposed intelligent EWS. The objective is to empirically evaluate their predictive accuracy, responsiveness, and robustness in handling supplier lead time variability within Smart EtO environments. To this end, a series of Monte Carlo simulations was conducted, each consisting of 1000 replications with 1000 samples per run, in order to capture the stochastic behavior of supplier performance under diverse operational conditions. To ensure reproducibility, a fixed random seed (seed = 42) was used across all experiments.
Supplier lead times were modeled using a log-normal distribution, defined as , where the location parameter was set to μ = 2.5 (in log-days) and the variability was explored across a grid of . For the IoT-calibrated systems (SIoT-CAS and AID-RAS), a sensor-driven multiplicative deviation factor was incorporated to dynamically adjust predicted lead times in response to real-time disruptions. In the case of AID-RAS, delivery feasibility was additionally benchmarked against dynamic thresholds determined by three key components: customer due dates days, remaining internal production time days, and a fixed scheduling buffer (t) = 10 days.
For comparative sensitivity analysis, baseline fixed-threshold systems (BPAS and SIoT-CAS) were evaluated using maximum acceptable lead times days. Furthermore, probability thresholds were systematically varied across all alerting systems, with }, in order to assess their influence on detection performance.
The evaluation relies on multiple performance metrics—including MAE, RMSE, TP, FR, TPR, FPR, and overall accuracy—providing a multidimensional view of each system’s effectiveness. This analysis investigates how well each model balances early detection capabilities with precision, and how the adaptive integration of IoT signals and dynamic thresholds contributes to improved forecasting and decision support in complex Engineer-to-Order supply chains.
4.1. Evaluation of the BPAS
To assess the performance of the BPAS, we conducted Monte Carlo simulations by varying three key parameters: the standard deviation (σ) of the log-normal lead time distribution, the maximum acceptable lead time threshold , and the alert probability threshold (). The goal is to analyze how prediction performance metrics respond to different system sensitivities and uncertainties.
4.1.1. Impact of Lead Time Variability (σ)
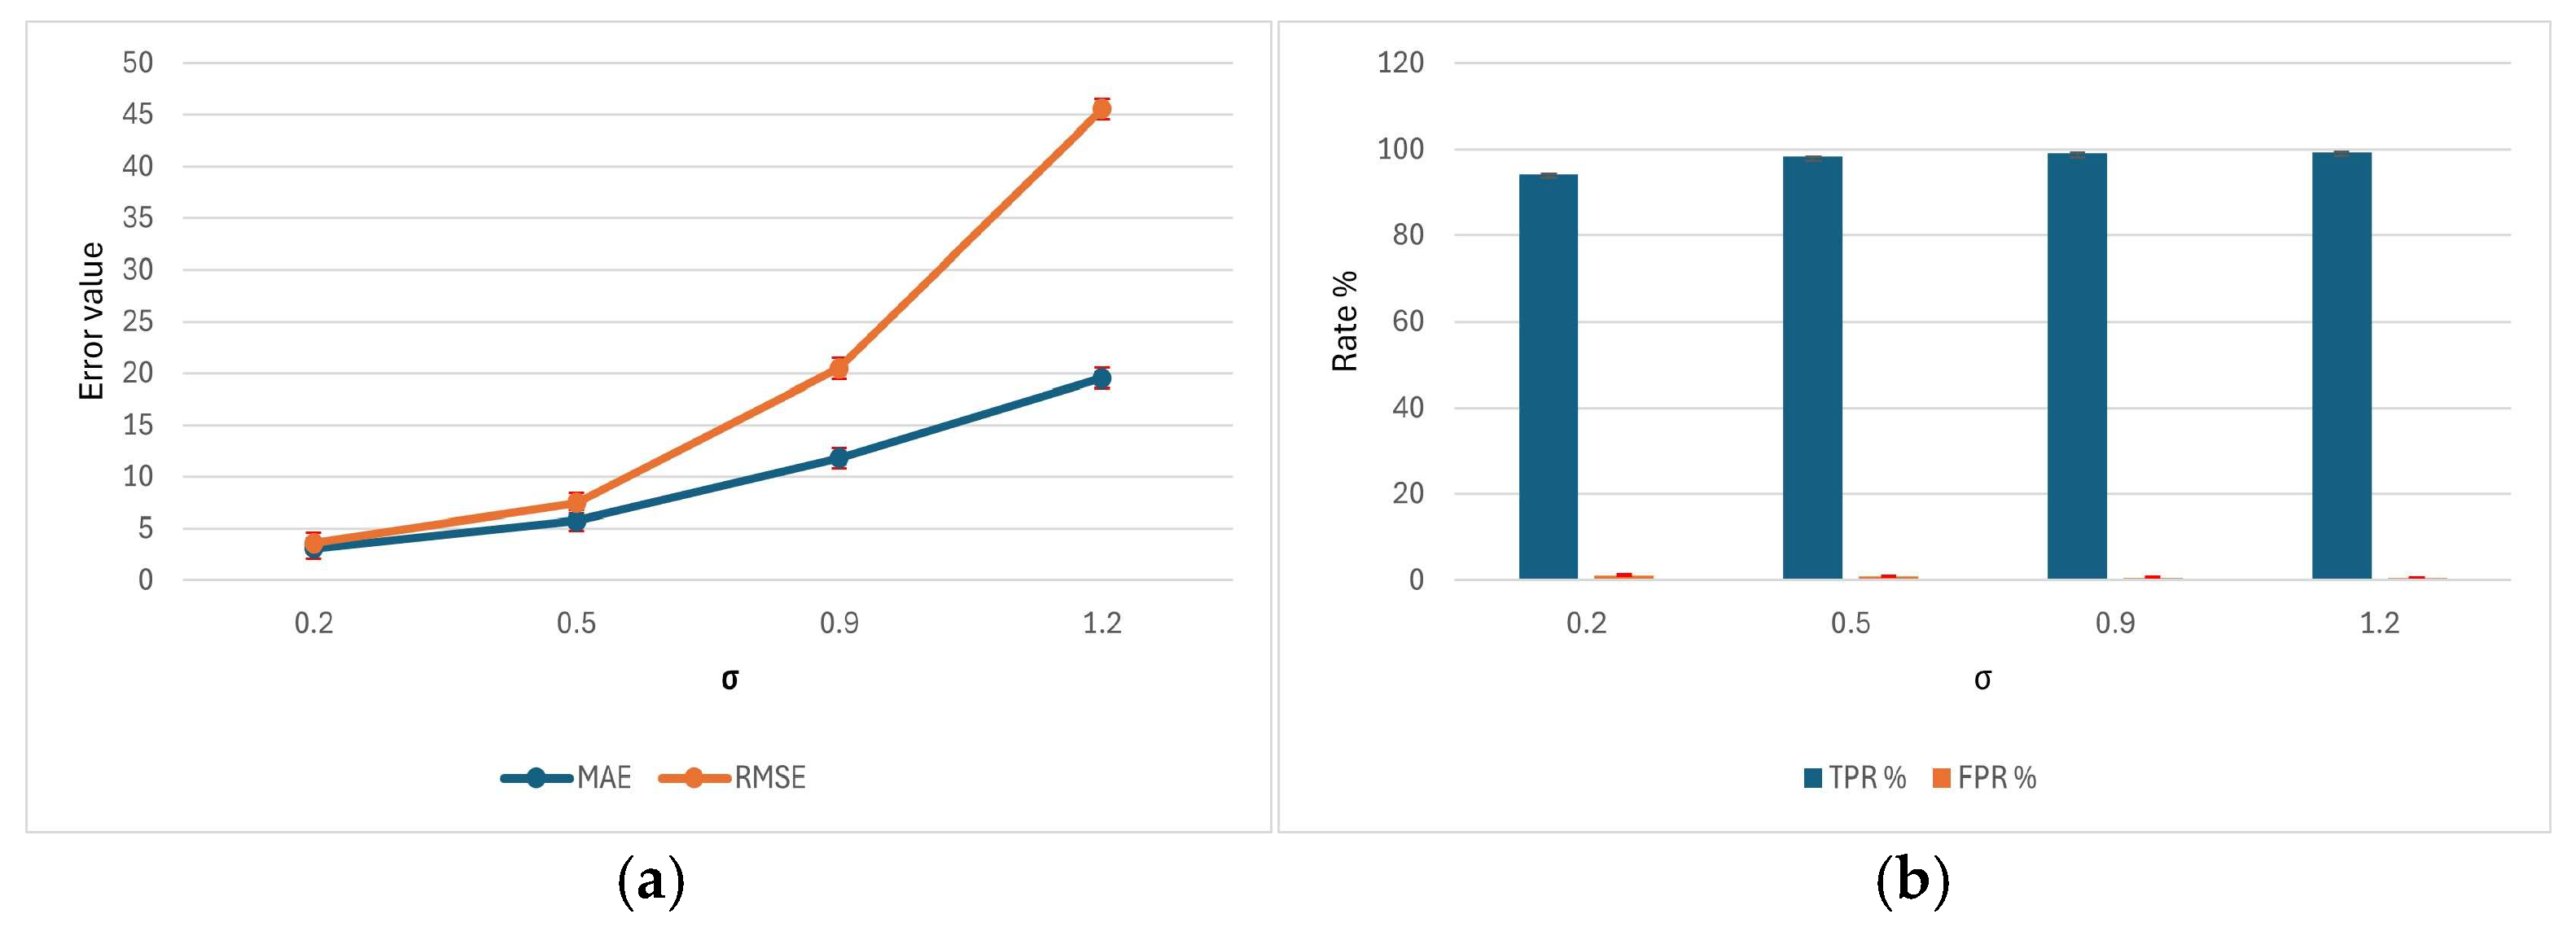
Table 1 presents the results of the Monte Carlo simulation evaluating the BPAS under increasing levels of lead time variability, represented by the standard deviation parameter σ of the log-normal distribution. The system demonstrates excellent ability to detect supplier delays across all variability levels. At low variability (
σ = 0.2), nearly all delayed deliveries are correctly identified (TPR = 94.28% ± 0.12) with very few false alarms (FPR = 1.18% ± 0.02), yielding high overall accuracy (98.14% ± 0.03) and low prediction errors (MAE = 3.08 ± 0.00, RMSE = 3.60 ± 0.00). As variability increases to
σ = 0.5, the system maintains strong performance (TPR = 98.30% ± 0.04, FPR = 0.92% ± 0.02), though the average prediction errors grow (MAE = 5.76 ± 0.01, RMSE = 7.43 ± 0.02), reflecting slightly reduced precision in estimating exact lead times. At higher variability levels (
σ = 0.9 and
σ = 1.2), the system continues to correctly flag almost all delays (TPR = 99.18% ± 0.03 and 99.42% ± 0.02) with minimal false positives (FPR = 0.59% ± 0.02 and 0.47% ± 0.02), but MAE and RMSE rise substantially (MAE = 11.79 ± 0.03, RMSE = 20.45 ± 0.13 at
σ = 0.9; MAE = 19.53 ± 0.08, RMSE = 45.52 ± 0.69 at
σ = 1.2), indicating limits in predicting the exact timing of delays. Overall, the results confirm that the static probabilistic system is highly effective at detecting supplier delays, while acknowledging that its precision decreases under highly volatile supply conditions, highlighting the potential benefit of adaptive or real-time calibrated systems.
4.1.2. Impact of Alert Trigger Threshold
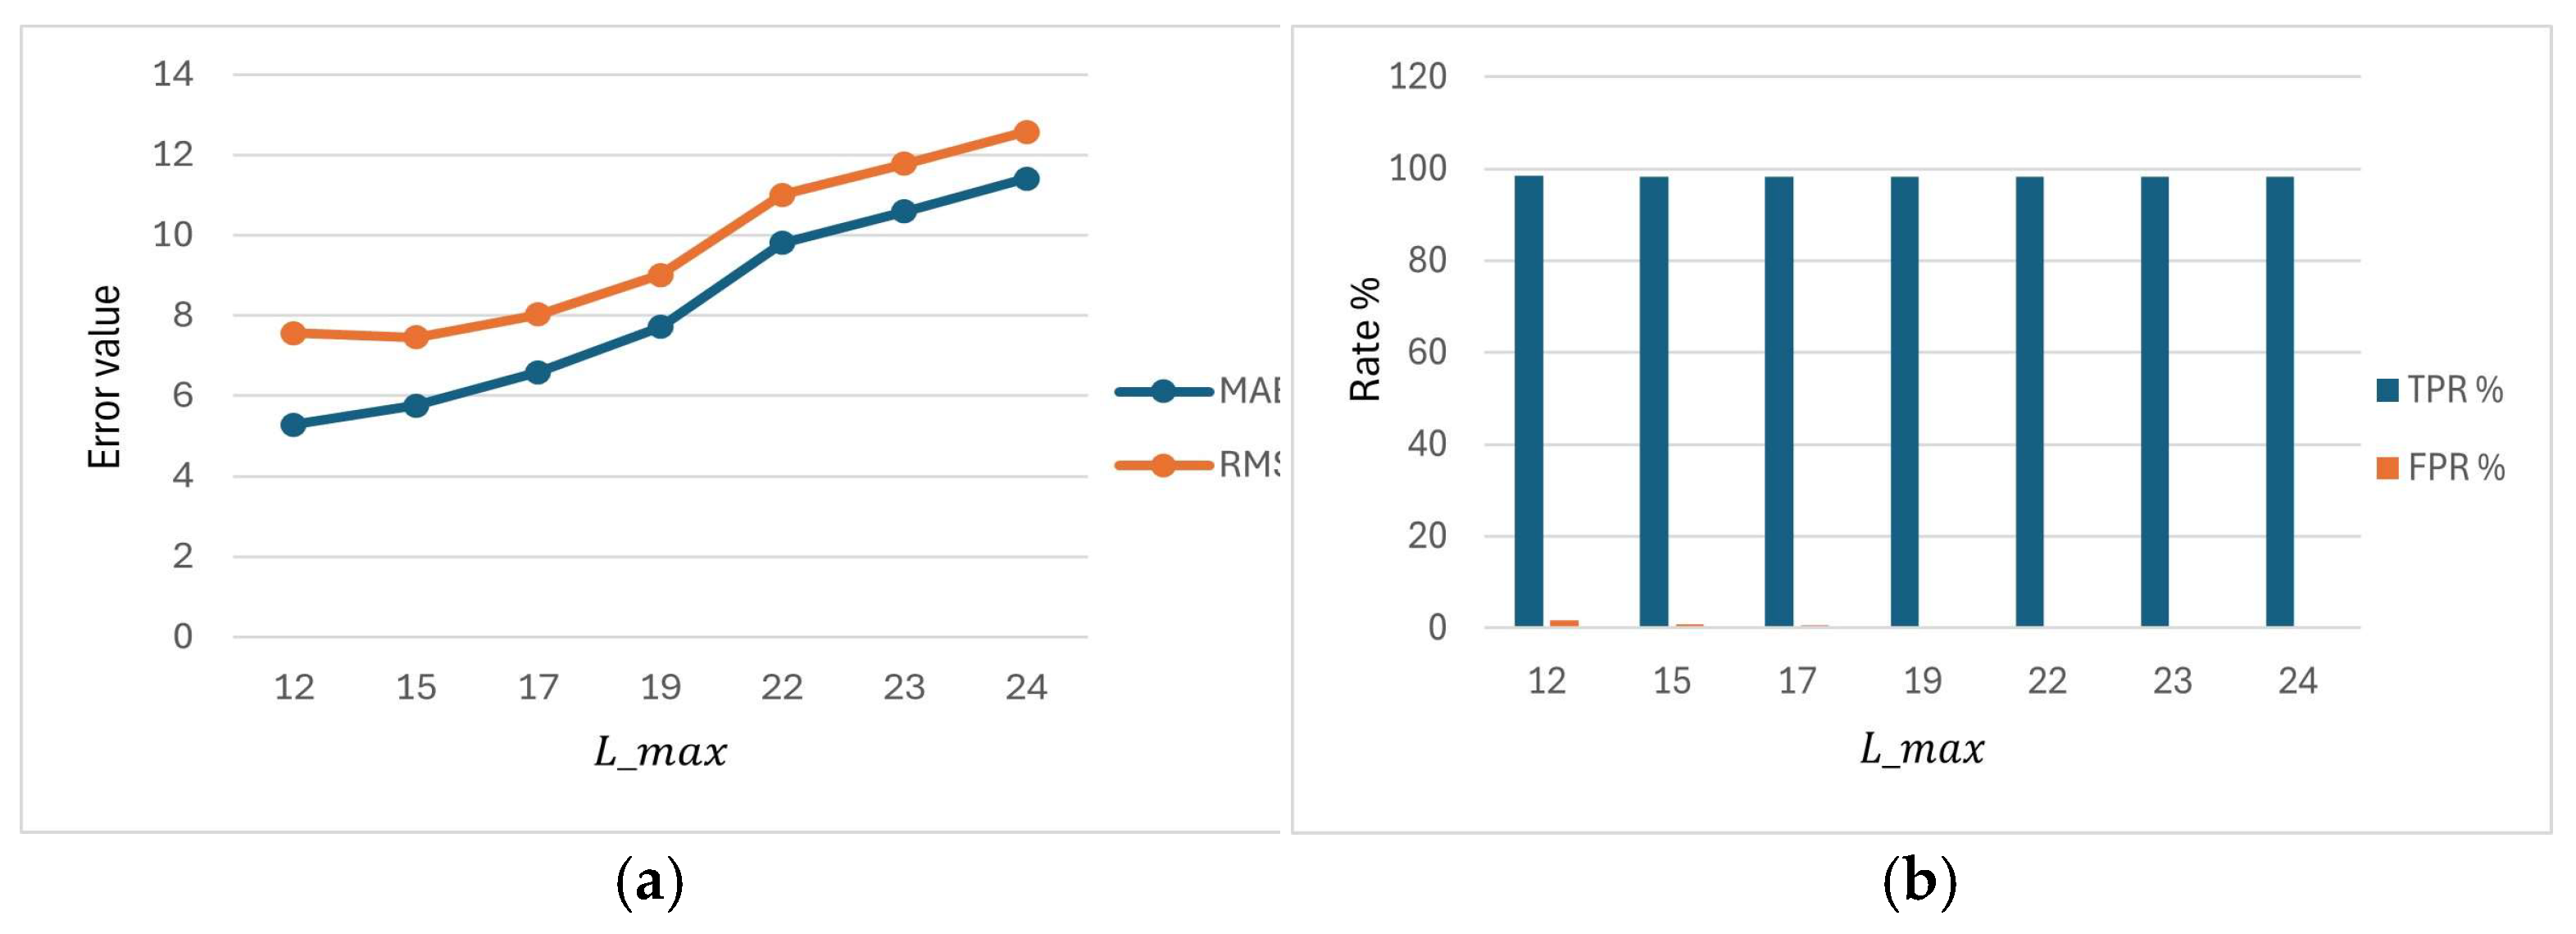
Table 2 investigates the impact of varying the alert trigger threshold
, which defines the cutoff for signaling potential supplier delays, on the performance of the BPAS. At the lowest threshold (
= 12), the system achieves high detection of delays (TPR = 98.47% ± 0.03%) while maintaining a moderate level of false alarms (FPR = 1.66% ± 0.04%). The mean absolute error (MAE = 5.28 ± 0.01) and root mean square error (RMSE = 7.56 ± 0.02) are low, and overall accuracy reaches 98.41% ± 0.02%, reflecting the system’s effectiveness at predicting delays even at a tight threshold.
As the threshold increases to = 15, the system maintains similar high performance: TPR remains at 98.28% ± 0.05% with a slightly lower FPR of 0.89% ± 0.02%, MAE = 5.76 ± 0.01, RMSE = 7.45 ± 0.02, and accuracy improves to 98.83% ± 0.02%. This threshold represents a balanced point where the system continues to detect most supplier delays while minimizing false alarms.
With further increases in up to 24, TP gradually decreases (from 504.66 ± 1.00 to 86.00 ± 0.53), but TPR remains consistently high around 98%, and FP declines further (FPR = 0.18% ± 0.01%), indicating a conservative alerting behavior. However, MAE and RMSE increase steadily (MAE = 11.41 ± 0.01, RMSE = 12.57 ± 0.01 at = 24), reflecting that while the system continues to reliably flag delays, the precision of delay magnitude prediction decreases slightly as the threshold rises. Overall accuracy improves with increasing threshold, reaching 99.67% ± 0.01% at the highest .
These results demonstrate that the BPAS is highly effective at predicting supplier delays across a wide range of thresholds. Lower thresholds provide more precise error estimation but slightly more false alarms, whereas higher thresholds reduce FP at the cost of slightly larger prediction errors. The system shows robust delay detection with minimal false alerts, highlighting its reliability for proactive supply chain management.
4.1.3. Impact of Probability Threshold ()
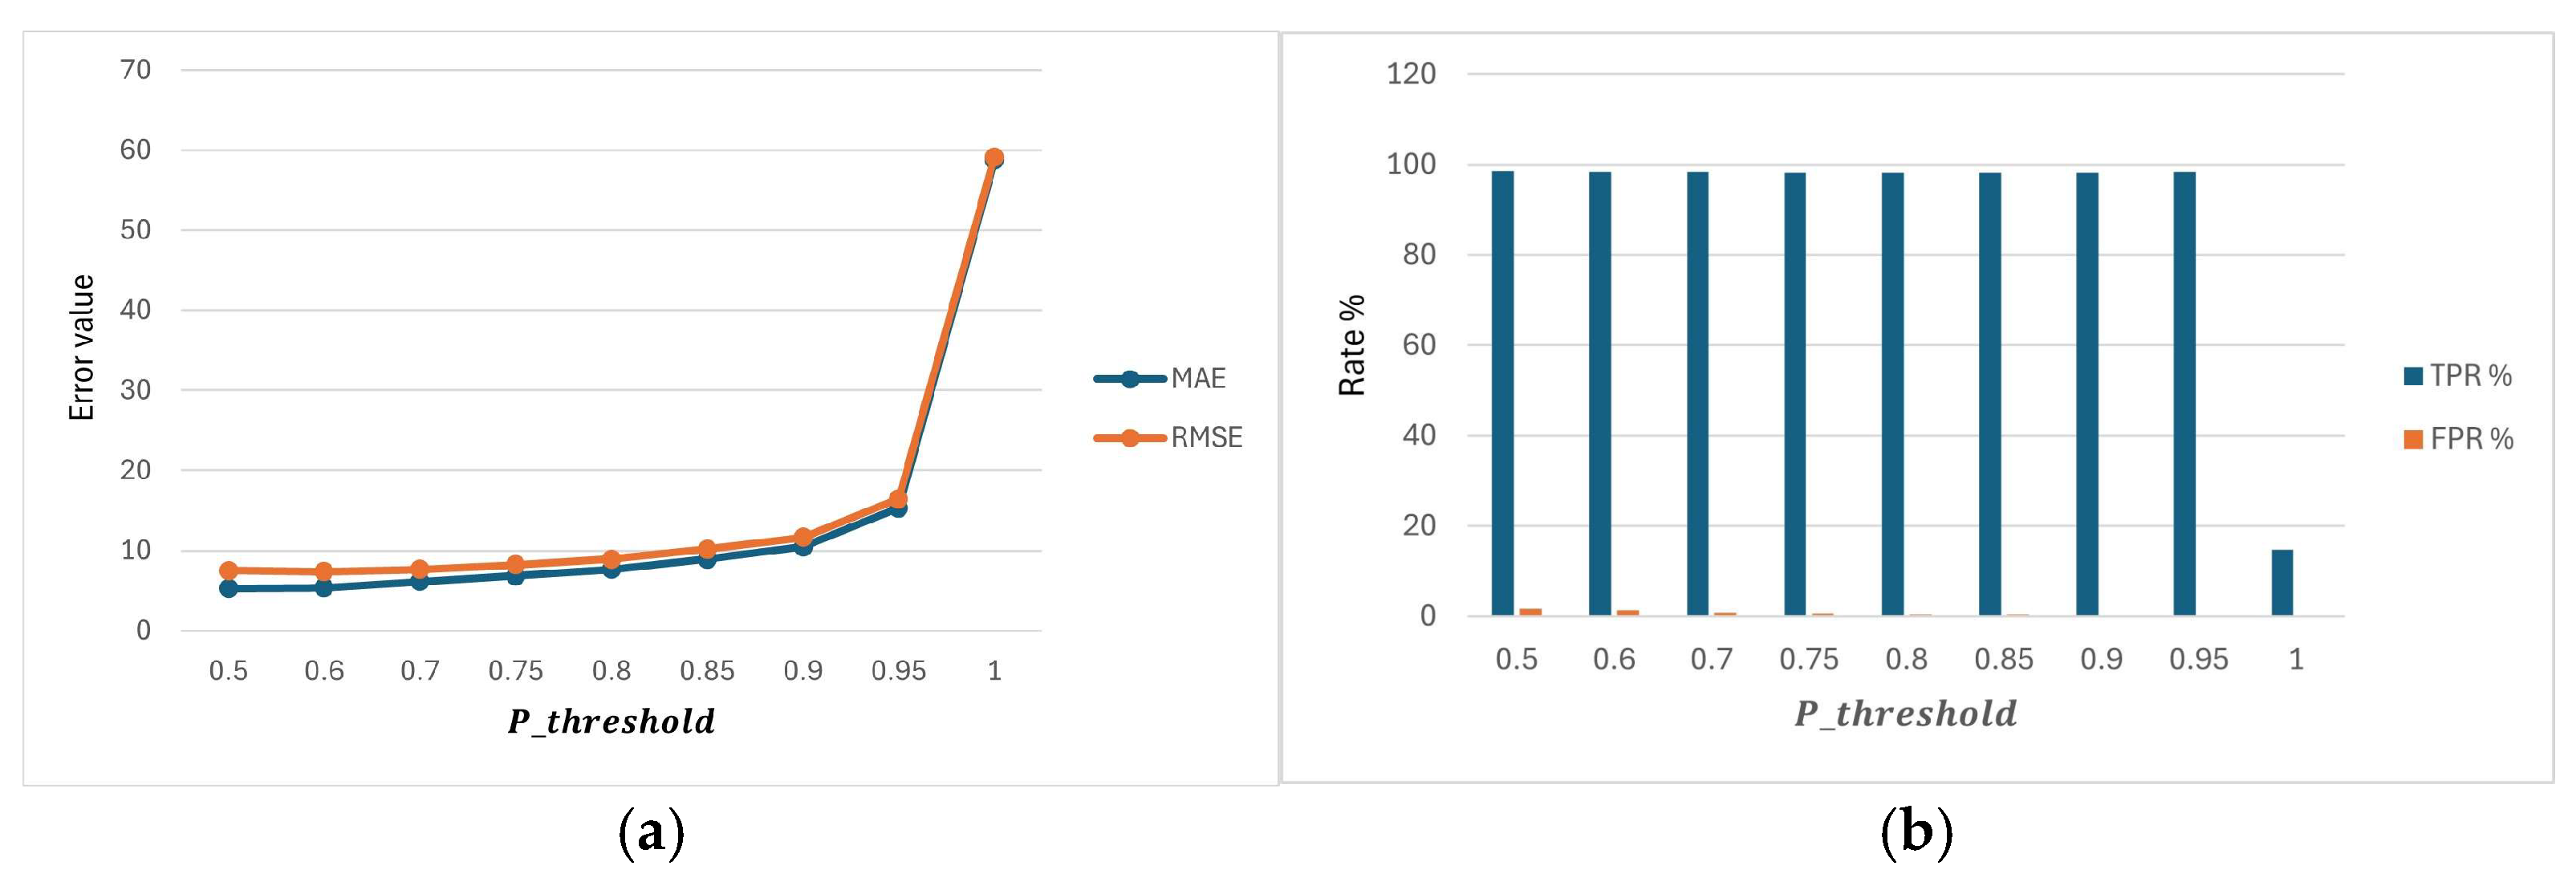
Table 3 evaluates how varying the probability threshold (
)—which determines the likelihood required to trigger an alert—affects the performance of the BPAS in predicting supplier delays. At the lowest threshold (
= 0.50), the system achieves high detection of delays with a TPR of 98.47% ± 0.04% and a moderate FPR of 1.59% ± 0.04%. The MAE and RMSE remain low (5.29 ± 0.01 and 7.52 ± 0.02, respectively), and overall accuracy reaches 98.44% ± 0.03%, indicating effective and timely alerting for potential delays.
As the threshold increases to 0.60 and 0.70, the system maintains high TPR above 98%, while FP gradually decreases from 7.27 ± 0.17 to 5.18 ± 0.14, reflecting a more conservative alerting behavior. MAE and RMSE increase slightly (up to 6.14 ± 0.01 and 7.67 ± 0.02 at = 0.70), but the system continues to detect the majority of actual delays with minimal false alarms, leading to high accuracy values (98.58% ± 0.02% to 98.98% ± 0.02%).
At intermediate thresholds (0.75–0.90), MAE and RMSE further increase, ranging from 6.85 ± 0.01 to 10.47 ± 0.01 and from 8.23 ± 0.01 to 11.65 ± 0.01, respectively, and FPR continues to decline (0.58% to 0.21%), yet TPR remains high above 98%. This indicates that the system is still reliably predicting most delays but with fewer false alerts, at the cost of slightly larger prediction errors.
For very high thresholds (0.95–1.00), the system becomes extremely conservative. At = 0.95, TPR remains high at 98.34%, but MAE and RMSE increase substantially (15.34 ± 0.01 and 16.44 ± 0.01), and the number of TO drops considerably, reflecting that only the most extreme delays are being flagged. At the maximum threshold of 1.00, the system fails to detect almost all delays (TP = 0.16 ± 0.02, TPR = 14.70% ± 2.20%) and MAE/RMSE spike dramatically (58.73 ± 0.01 and 59.18 ± 0.01), although FPR reaches 0.00% and accuracy nominally reaches 100% due to the near absence of alerts.
Overall, these results illustrate that the choice of critically balances the system’s ability to detect supplier delays against false alarms. Lower thresholds provide more proactive detection, while higher thresholds reduce false alerts but risk missing most delays. The BPAS shows robust performance for intermediate thresholds (0.50–0.90), making it highly effective for anticipating supplier delays under typical operating conditions.
4.1.4. Visual Analysis of BPAS Performance
For more analysis,
Figure 2,
Figure 3 and
Figure 4 provide a visual representation of how the performance metrics of the BPAS respond under varying experimental conditions. They enhance the interpretability of the results by highlighting the system’s sensitivity to parameter changes and its stability across scenarios. The visualizations facilitate a more intuitive understanding of trade-offs between detection accuracy and false alert rates, thereby supporting a deeper evaluation of the model’s robustness in dynamic supply chain environments.
4.2. Evaluation of the SIoT-CAS
This section presents the performance evaluation of the proposed SIoT-CAS. The objective is to assess the system’s ability to detect potential supplier delays under varying conditions by integrating real-time data adjustments. The evaluation is conducted through a series of Monte Carlo simulations, where the system’s response is tested across different values of the parameters: σ, and . The analysis focuses on key performance metrics such as the MAE, RMSE, TP, FP, and the corresponding TPR and FPR.
4.2.1. Impact of Lead Time Variability (σ)
The results in
Table 4 demonstrate how the performance of the SIoT-CAS system evolves with different values of
σ. When
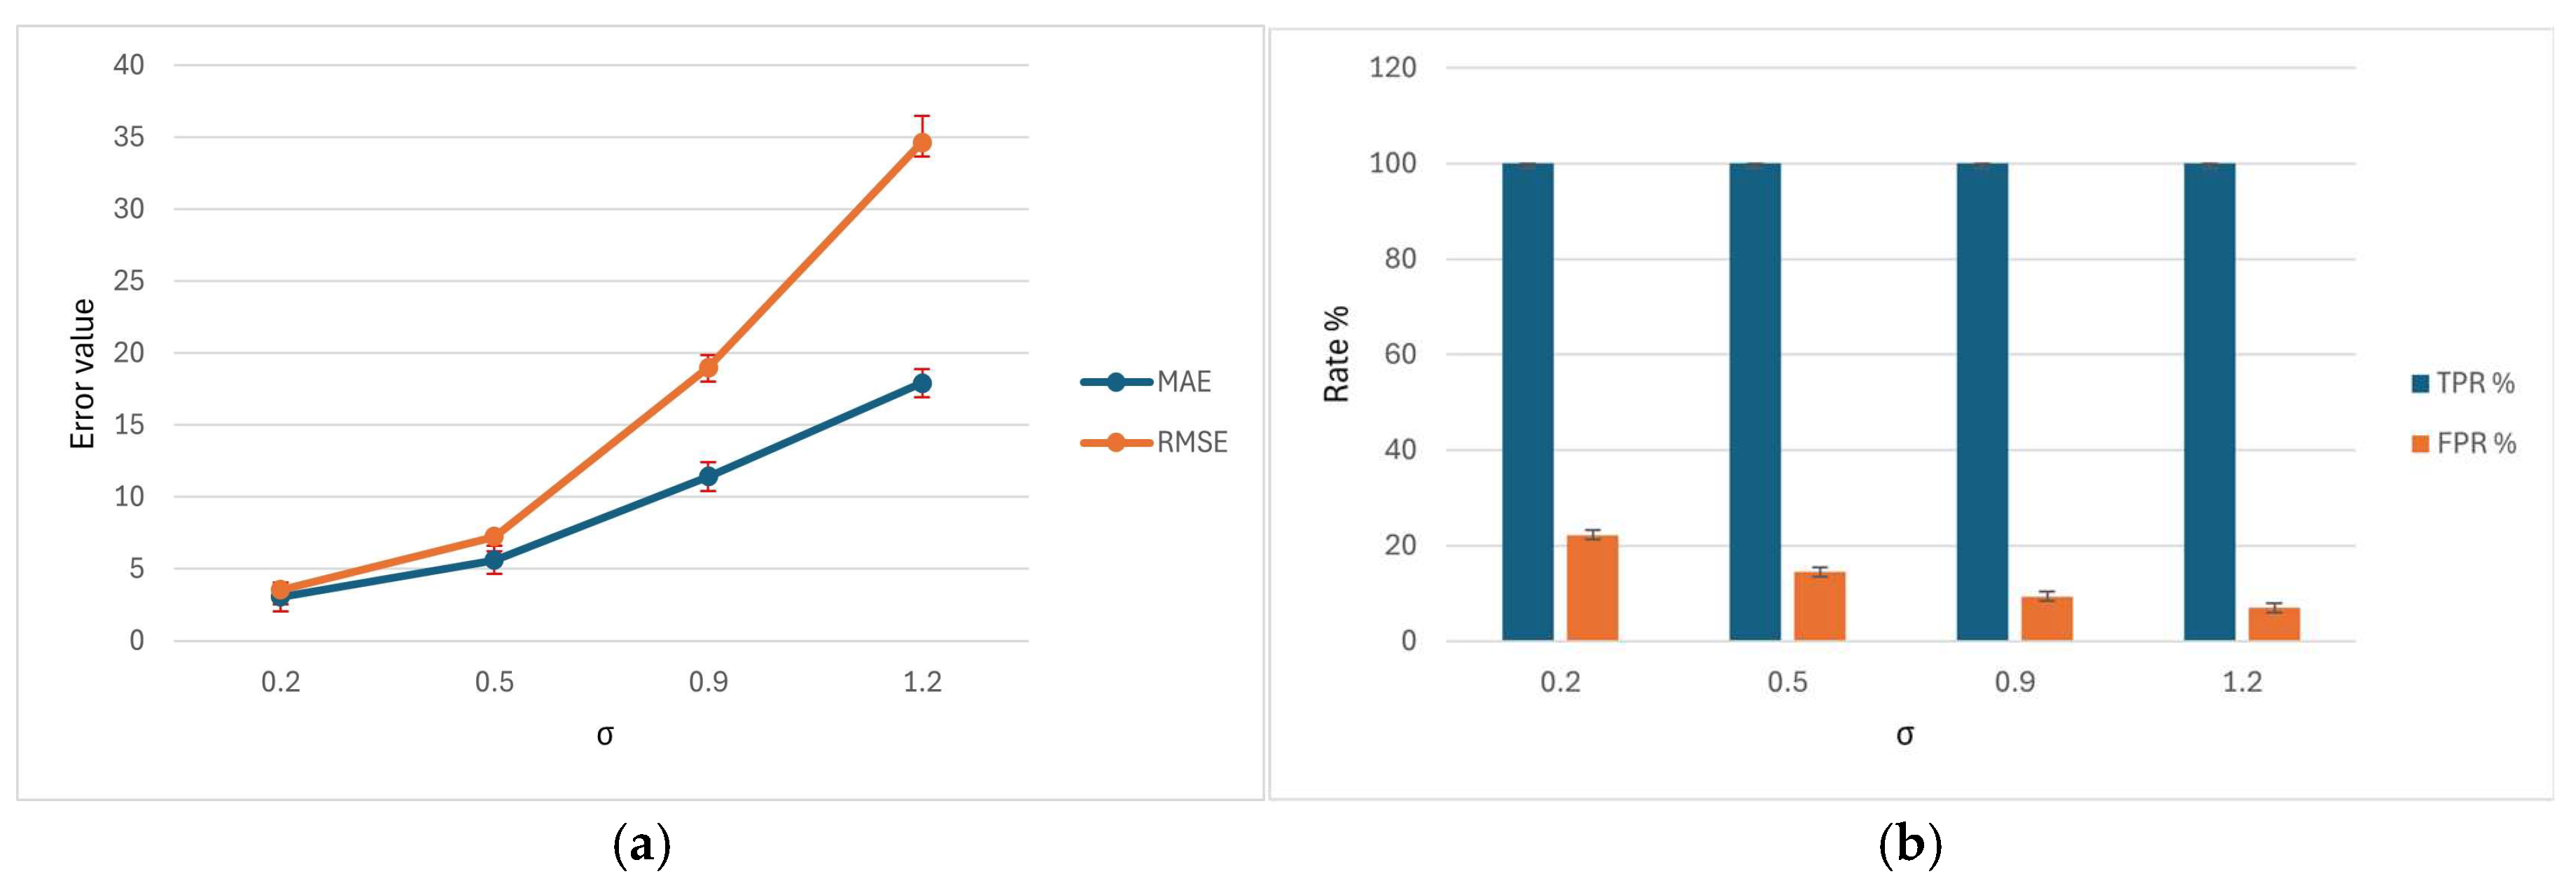
σ = 0.2, the system achieves a very low MAE of 3.06 ± 0.10, indicating highly precise predictions, while maintaining a perfect TPR of 100%. However, this precision comes at the cost of a high number of FP (189.76 ± 24.01), leading to an FPR of 22.25 ± 2.70 and a relatively lower overall accuracy of 81.02 ± 2.40. As
σ increases to 0.5, the MAE rises moderately to 5.62 ± 0.28, but the number of FP decreases significantly to 97.49 ± 17.52, which reduces the FPR to 14.48 ± 2.53 and improves the accuracy to 90.25 ± 1.75, while still maintaining a TPR of 100%. With
σ = 0.9, the MAE increases further to 11.42 ± 0.86, and the FP continues to decline (53.46 ± 15.00), lowering the FPR to 9.36 ± 2.24 and raising the accuracy to 94.65 ± 1.50. At the highest tested level,
σ = 1.2, the MAE reaches 17.90 ± 1.81, yet FP falls further to 40.47 ± 12.00, producing the lowest FPR of 7.00 ± 2.06 and the highest accuracy of 95.95 ± 1.20, with the TPR consistently at 100% across all cases. These results highlight a trade-off: increasing σ reduces FP and improves accuracy but leads to higher MAE and RMSE values, reflecting less precise predictions. Nevertheless, the system demonstrates strong robustness by preserving a perfect detection rate (TPR = 100%) throughout all scenarios.
4.2.2. Impact of Maximum Acceptable Lead Time () of the SIoT-CAS
The results presented in
Table 5 illustrate how variations in
influence the predictive performance of the model across several evaluation metrics. The TPR remains consistently at 100% for all values of
, confirming the model’s ability to correctly identify all relevant cases without omission. However, the FPR shows a clear downward trend as
increases, moving from 18.84% at
= 12 to only 4.48% at
= 24. This indicates that higher tolerance levels substantially reduce the likelihood of false alarms.
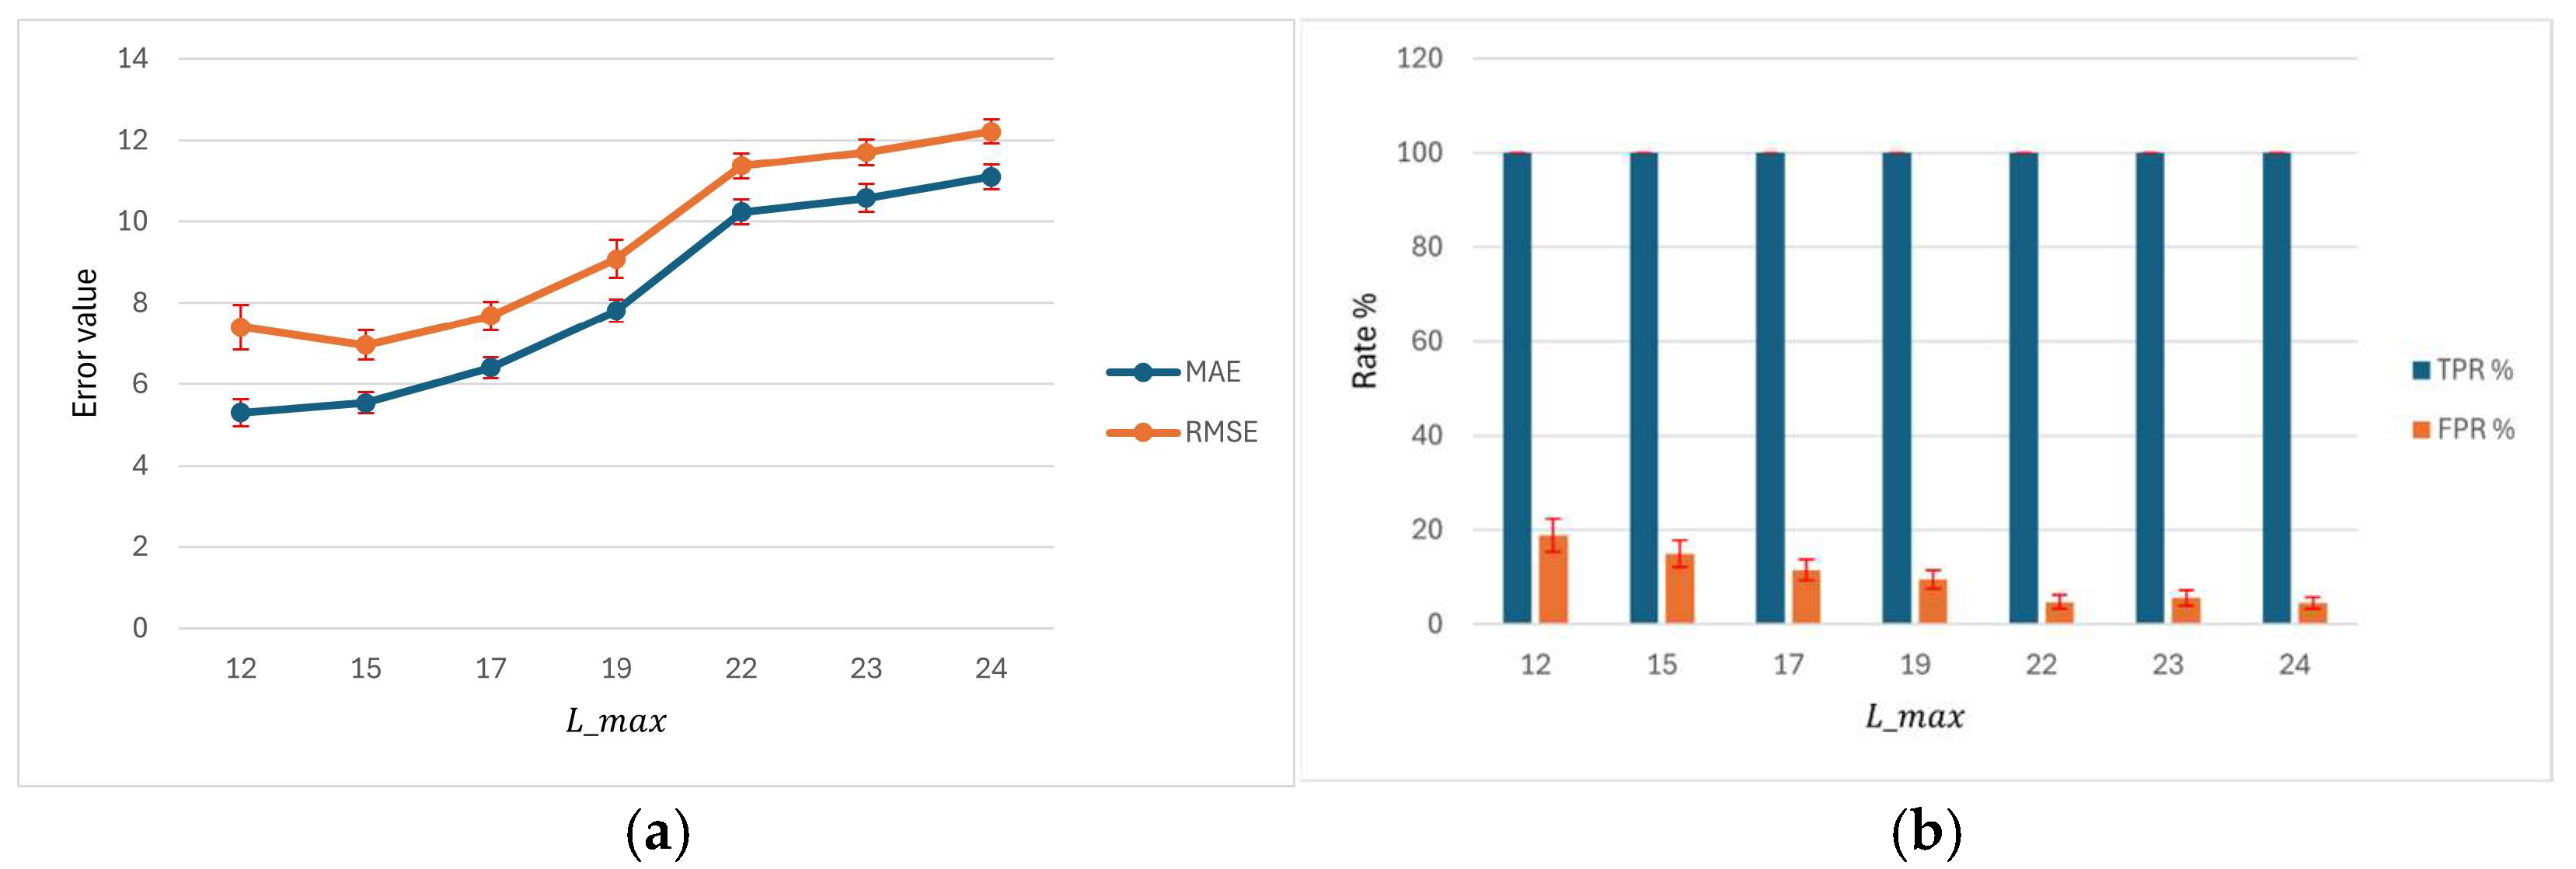
A similar trend is observed in the number of TP and FP. As increases, both TP and FP decrease, reflecting a natural trade-off: while the system remains highly sensitive (TPR = 100%), the stricter filtering reduces the volume of predictions made. The MAE gradually increases with higher values of , from 5.30 at = 12 to 11.09 at = 24, showing that predictions become less precise in terms of absolute deviation. This pattern is further confirmed by the RMSE values, which increase from 7.40 to 12.22, highlighting the higher dispersion of errors when tolerance is extended.
Interestingly, the accuracy percentage improves steadily with higher , moving from 90.42% to 95.90%. This suggests that despite larger absolute errors, the reduction in false alarms enhances the overall classification reliability of the system. Taken together, these results emphasize a critical balance: while smaller values of yield tighter error bounds, they also produce higher FPR, whereas larger values improve accuracy and reduce false alarms, but at the expense of higher prediction errors.
4.2.3. Impact of Alert Probability Threshold ()
The results presented in
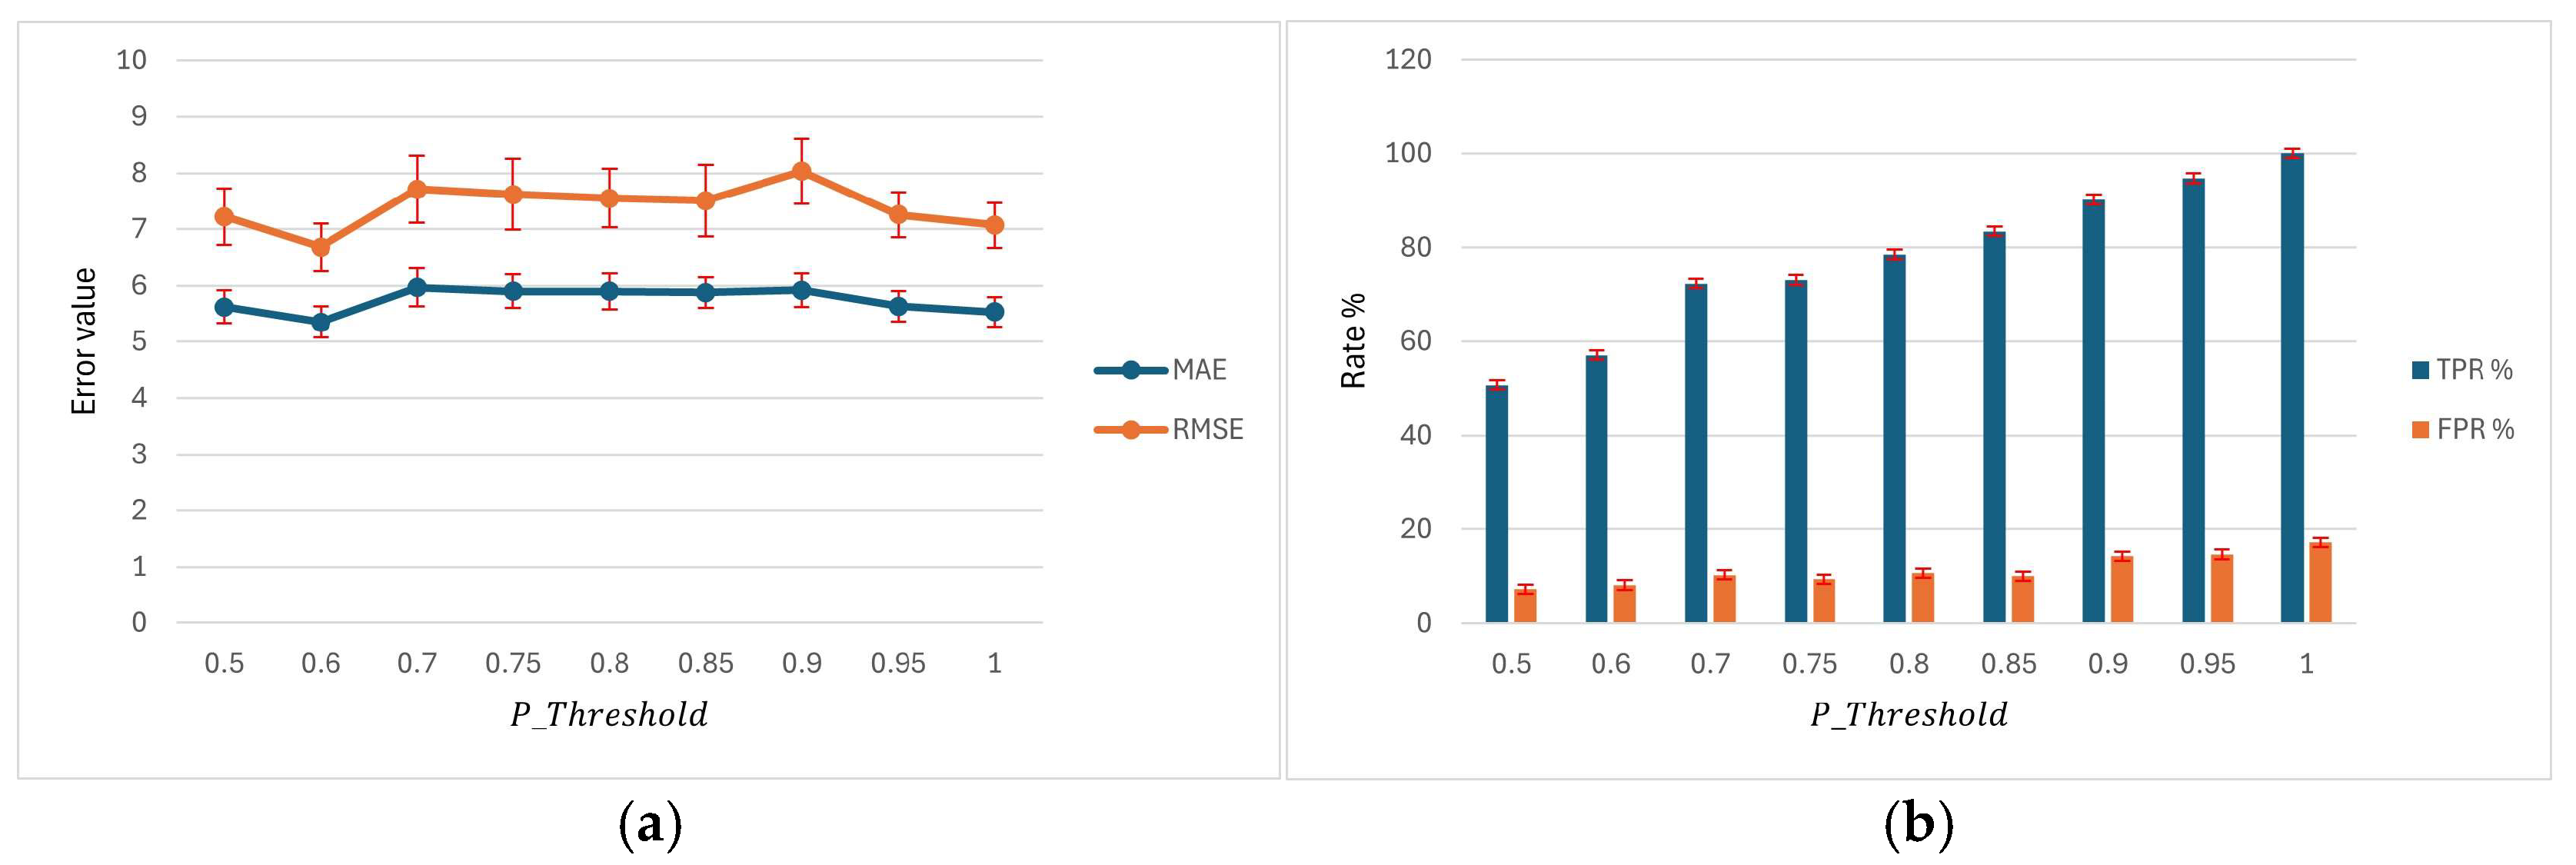
Table 6 demonstrate the effect of varying the decision threshold on the predictive performance of the SIoT-CAS. As the threshold increases from 0.5 to 1, the TPR improves substantially, rising from 50.68% at a threshold of 0.5 to 100% at a threshold of 1, indicating a consistent enhancement in the system’s sensitivity. This gain, however, is accompanied by a gradual increase in the FPR, which grows from 7.19% to 17.15%, reflecting the classic trade-off between sensitivity and specificity. Accuracy shows an overall upward trend, reaching its peak at 88.69% for thresholds 0.95 and 1, suggesting that higher thresholds strike a favorable balance between correctly identifying true cases and tolerating a limited number of false alarms. Regarding error metrics, MAE remains relatively stable across thresholds, fluctuating within the narrow range of 5.3–6.0, while the RMSE exhibits a similar consistency, with values between 6.7 and 8.0. This stability in MAE and RMSE highlights the robustness of the predictive estimates, even as classification sensitivity is adjusted. Collectively, these results emphasize the system’s adaptability: lower thresholds favor more conservative detection, whereas higher thresholds maximize detection capability at the expense of slightly higher false alarms, with the optimal trade-off observed around thresholds of 0.85–0.95, where both sensitivity and overall accuracy remain high.
4.2.4. Visual Analysis of SIoT-CAS Performance
To complement the quantitative findings presented in the previous tables, this subsection provides a visual analysis of the performance of the SIoT-CAS under varying experimental conditions.
Figure 5,
Figure 6 and
Figure 7 depict key performance metrics—including MAE, RMSE, TPR, and FPR—across different values of lead time variability (
σ), maximum acceptable lead time (
), and probability threshold (
). These graphical representations facilitate a more intuitive understanding of the system’s sensitivity, trade-offs, and stability under changing operational scenarios.
4.3. Evaluation of the AID-RAS
This subsection presents the performance evaluation of the proposed AID-RAS when enhanced with a dynamically adjusted maximum acceptable lead time, denoted as . Unlike static threshold approaches, this dynamic configuration continuously recalculates based on real-time production constraints, customer due dates, and buffer allowances, thereby aligning alerts with evolving operational conditions. To assess the robustness and responsiveness of this system, a Monte Carlo simulation was conducted using 1000 synthetic observations of supplier lead times. The evaluation examines the system’s behavior under varying alert probability thresholds and different levels of lead time variability σ. The key performance metrics include MAE, RMSE, TPR, FPR, TP, FP, and overall accuracy. This comprehensive analysis aims to validate the effectiveness of dynamically adapting in improving early detection of potential delays while minimizing false alarms.
4.3.1. Impact of Lead Time Variability (σ)
Table 7 illustrates the impact of lead time variability, represented by the standard deviation
σ, on the performance of the AID-RAS system. At low variability (
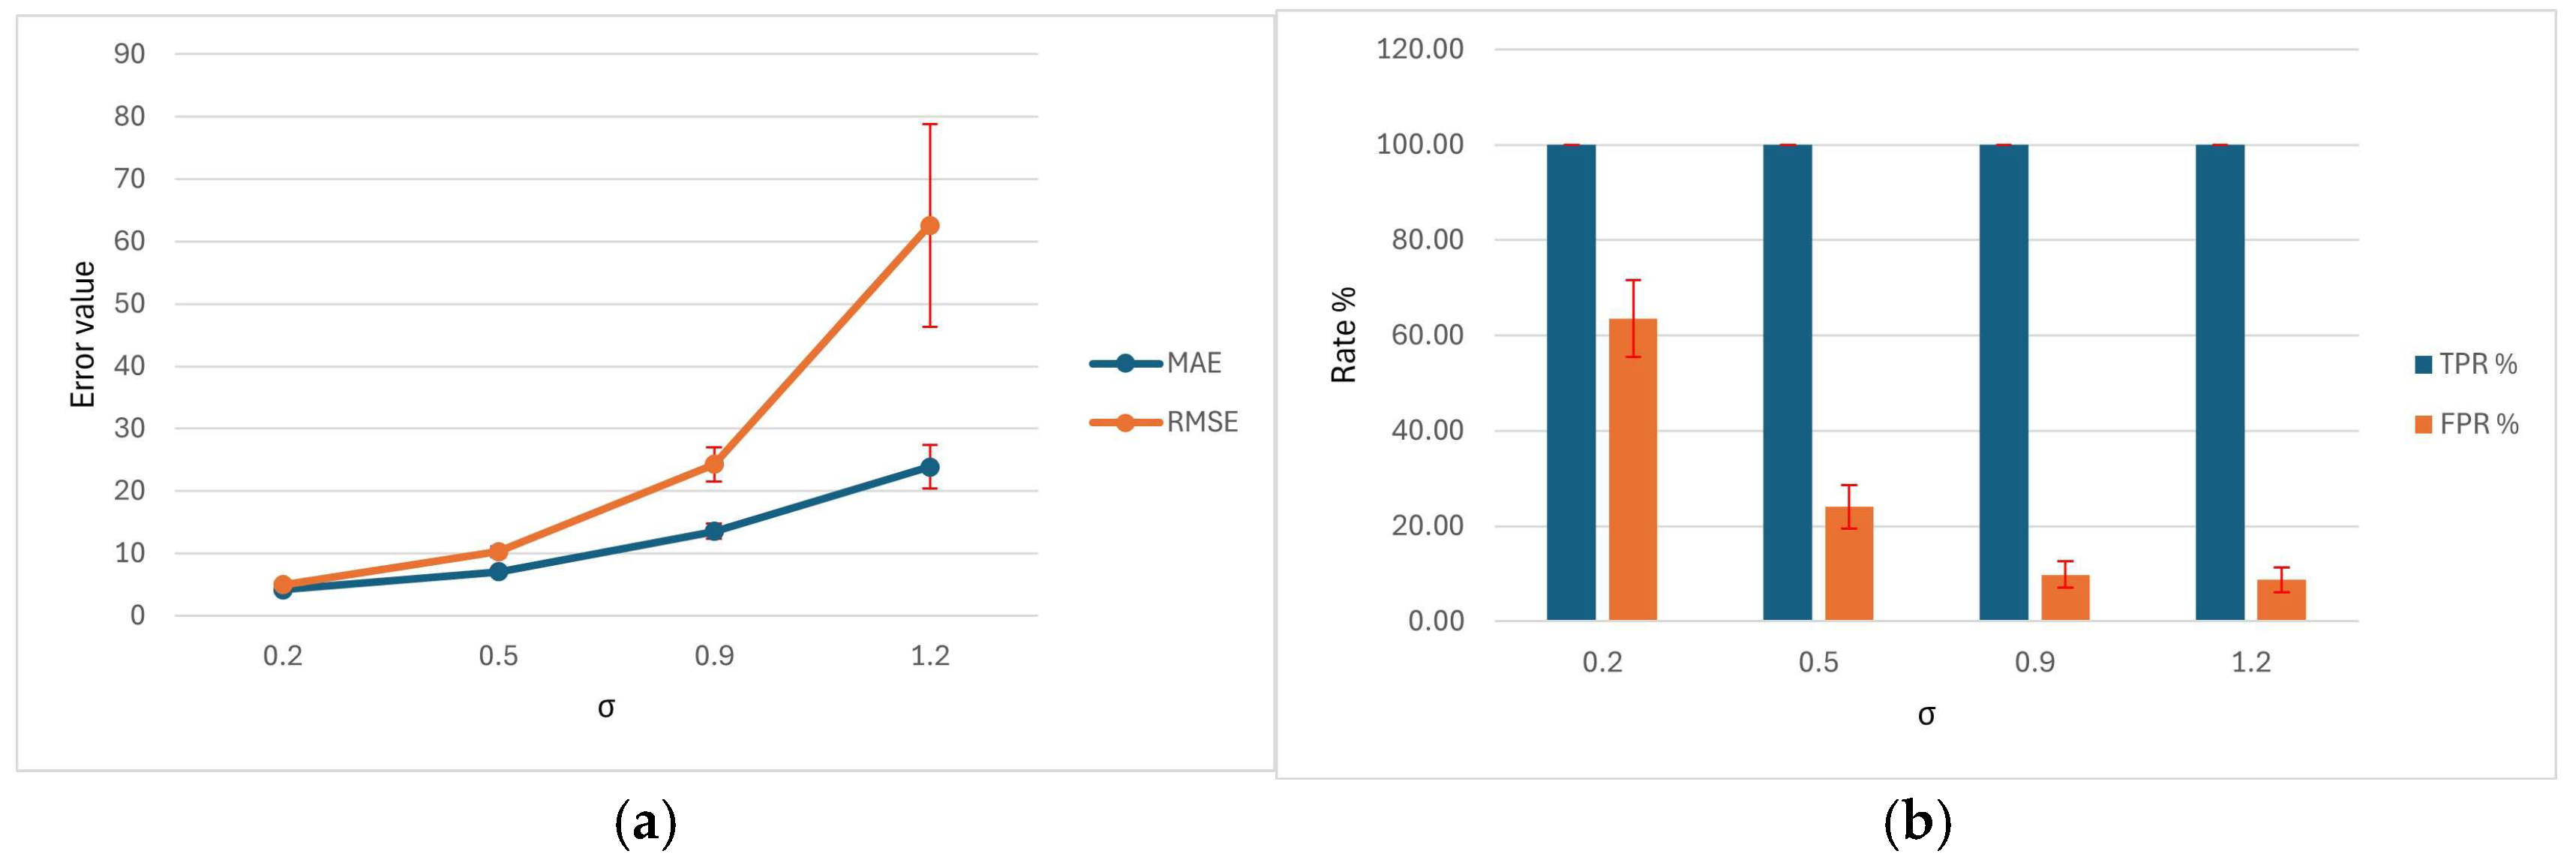
σ = 0.2), the system achieves very low prediction errors, with MAE of 4.14 and RMSE of 4.98, and reliably identifies all supplier delays (TPR = 100.00%). However, this high sensitivity comes at the cost of numerous false alarms, as indicated by 93.52 ± 17 FP and an FPR of 63.54% resulting in a moderate overall accuracy of 90.65%. As σ increases to 0.5, prediction errors rise (MAE = 7.01, RMSE = 10.25), while the number of FP decreases to 85.36 and the FPR falls to 24.05%, slightly improving accuracy to 91.46%. At higher variability levels (
σ = 0.9 and 1.2), MAE and RMSE increase substantially, reaching 13.54 and 24.29 for
σ = 0.9, and 23.85 and 62.58 for
σ = 1.2, respectively. Despite the growing prediction errors, the system maintains full detection capability (TPR = 100%) while reducing FP to 40.95 and 36.79, with corresponding FPRs of 9.82% and 8.69%. Consequently, overall accuracy improves to 95.91% at
σ = 0.9 and 96.32% at
σ = 1.2. These results demonstrate that AID-RAS consistently detects supplier delays with full reliability while higher
σ values help reduce false alarms, indicating an optimal operational trade-off between predictive precision and alert manageability in Smart EtO environments.
4.3.2. Impact of Alert Probability Threshold ()
Table 8 presents the effect of varying the alert probability threshold (
) on the performance of the AID-RAS system. Across all threshold values from 0.50 to 1.00, the system maintains perfect sensitivity, with a TPR of 100.00%, indicating that all delayed supplier deliveries are consistently detected. As
varies, the number of FP fluctuates, ranging from a low of 67.69 at
= 0.95 to a high of 88.01 at
= 0.50, with corresponding FPR values spanning 19.14% to 25.01%. Prediction errors, measured by MAE and RMSE, remain relatively stable across thresholds, with MAE values between 6.98 and 7.00, and RMSE values ranging from 10.30, indicating that the alert probability threshold primarily affects classification rather than predictive accuracy. Overall system accuracy varies modestly, from 91.20% at
= 0.50 to a maximum of 93.23% at
= 0.95, reflecting the balance between minimizing FP and maintaining high sensitivity. These results suggest that the AID-RAS system can reliably detect supplier delays across a wide range of alert probability thresholds, with thresholds around 0.80–0.95 providing an optimal trade-off between detection reliability and false alarm reduction.
4.3.3. Visual Analysis of AID-RAS Performance:
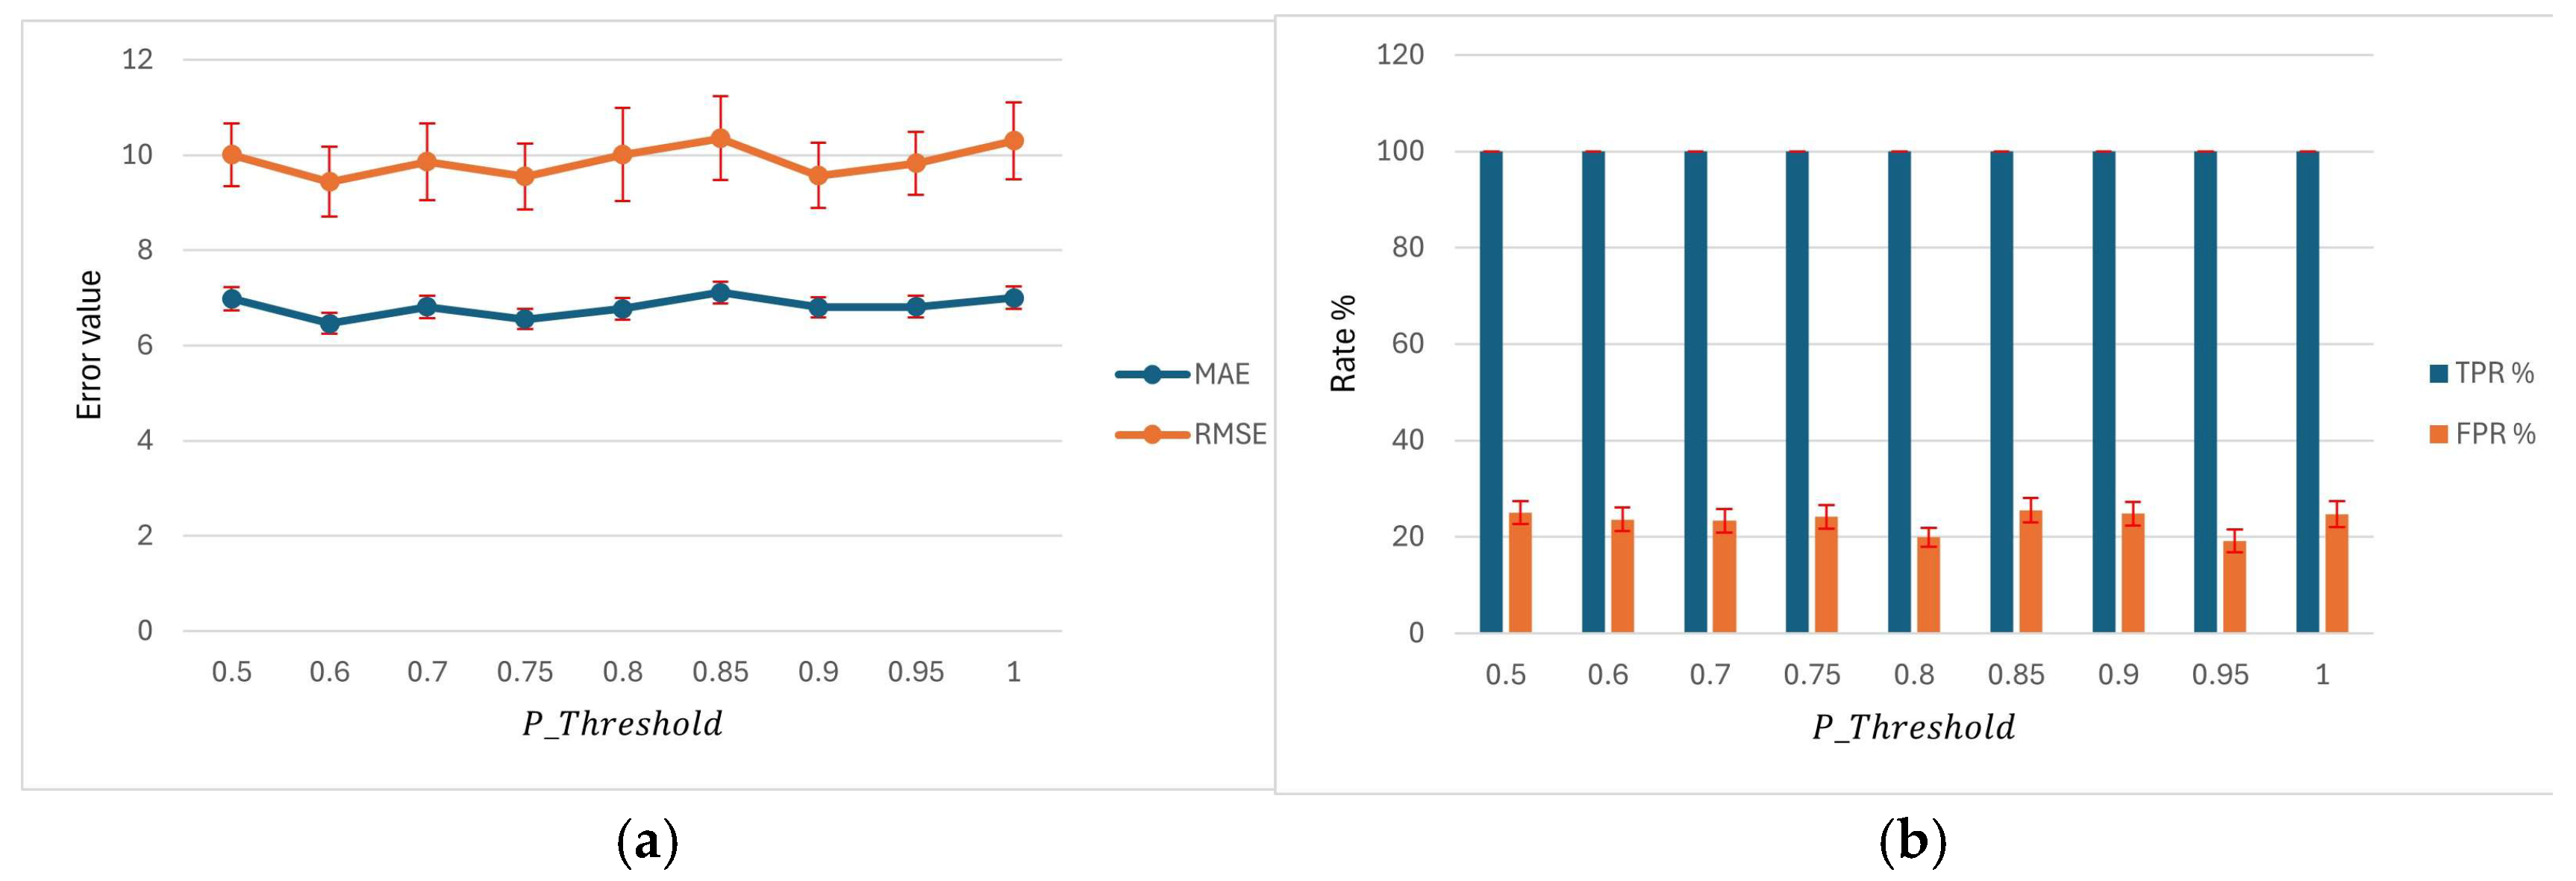
To enhance the interpretability of the simulation outcomes, this subsection presents a visual analysis of the performance of the AID-RAS.
Figure 8 and
Figure 9 illustrate how key performance indicators—such as MAE, RMSE, TPR, and FPR—respond to changes in probability threshold, lead time variability (
σ). These visualizations provide a clearer understanding of the system’s predictive behavior, sensitivity to input variability, and ability to maintain robustness under dynamic operational conditions. This graphical insight is critical for assessing the practical applicability of the proposed EWS in smart and adaptive supply chain environments.
4.4. Comparative Evaluation of the Three EWSs
Table 9 presents a comparative evaluation of the three EWSs—BPAS, SIoT-CAS, and AID-RAS—across key performance metrics with 95% CI. BPAS demonstrates the lowest false positive rate (FPR = 0.21 ± 0.01%) and the highest overall detection reliability (TPR = 98.22 ± 0.08%), achieving an accuracy of 99.62 ± 0.01%, although its prediction errors are the largest among the three systems (MAE = 10.47 ± 0.01, RMSE = 11.65 ± 0.01). This indicates that BPAS is highly reliable for identifying true supplier delays while minimizing false alarms, making it most suitable for stable supply chain environments.
SIoT-CAS shows a balanced trade-off between predictive accuracy and sensitivity, with lower prediction errors (MAE = 5.92 ± 0.30, RMSE = 8.03 ± 0.58) and a high true positive rate (TPR = 90.20 ± 3.12%), but with a higher false positive rate (FPR = 14.23 ± 2.72%) and slightly lower overall accuracy (87.28 ± 2.05%). These results suggest that SIoT-CAS is effective in environments where IoT-enabled data streams are available, enhancing predictive precision while tolerating moderate false alerts.
AID-RAS achieves perfect sensitivity (TPR = 100.00 ± 0.00%), indicating no delayed deliveries are missed, with moderate prediction errors (MAE = 6.80 ± 0.21, RMSE = 9.57 ± 0.68) and an accuracy of 91.83 ± 1.68%. Its higher false positive rate (FPR = 24.77 ± 2.41%) reflects aggressive alerting, which ensures full detection under uncertain or high-risk conditions, making it particularly suitable for volatile supply chain scenarios requiring uncompromising delay detection.
In summary, BPAS minimizes false alarms in stable conditions, SIoT-CAS balances precision and sensitivity in data-rich environments, and AID-RAS ensures complete detection under high uncertainty, highlighting the contextual strengths of each EWS.
4.5. Computational Efficiency Analysis
All computations were performed on a standard personal computer (Intel
® Core™ i7 CPU, 1.8 GHz, 16 GB RAM). To assess the computational efficiency of the proposed EWSs, we measured both execution time and peak memory usage during the Monte Carlo simulations (
Table 10). The results show that BPAS achieves the fastest runtime (1.56 s) with minimal memory usage (0.26 MB), followed by SIoT-CAS (1.75 s, 0.29 MB), while AID-RAS requires slightly higher resources (2.60 s, 0.55 MB) due to its more advanced probabilistic calibration. Overall, the computational requirements across all three methods remain modest, with execution times in the order of seconds and memory consumption well below 1 MB.
In the production phase (i.e., when the system is deployed), each strategy typically runs in constant time, O(1), since the runtime primarily depends on the probability distribution function used by each EWS (i.e., it does not depend on the input size). Therefore, the proposed approaches are highly practical for real-time deployment in industrial EtO environments, as they can deliver reliable predictions without imposing significant computational overhead.
5. Discussion
Building on the experimental results of the three EWSs—BPAS, SIoT-CAS, and AID-RAS—this section explores the broader significance of the findings from theoretical, managerial, and practical perspectives. The results demonstrate the fundamental trade-offs between predictive accuracy, sensitivity, and robustness in managing supplier delivery delays within smart EtO supply chains.
5.1. Implications for Theory
From a theoretical standpoint, this study advances the literature on predictive analytics in supply chain management by integrating real-time IoT data streams into a probabilistic early warning framework. The introduction of a dynamic threshold parameter, , represents a novel contribution, as it adapts probabilistic lead time predictions to evolving operational conditions. This bridges the gap between static statistical models and responsive, context-aware prediction mechanisms in Smart Manufacturing and EtO systems.
The comparative evaluation of the three EWSs further enriches the theoretical understanding of calibration strategies in predictive modeling. The BPAS approach illustrates the trade-off of a highly conservative design: it minimizes false alarms effectively but at the cost of higher prediction errors and reduced detection of true supplier delays. SIoT-CAS contributes by demonstrating how IoT-calibrated variability enhances forecast precision and responsiveness, though this improvement comes with limitations in sensitivity and reliability. AID-RAS, in turn, highlights the theoretical potential of adaptive intelligence for balancing prediction accuracy and resilience, as it maximizes true detections while tolerating a higher incidence of false alerts.
By empirically showing how these systems navigate the inherent trade-offs between accuracy, sensitivity, and reliability, this study deepens theoretical insight into the design of IoT-enabled, probabilistic early warning models. It underscores that adaptive calibration mechanisms are not merely technical enhancements but conceptual innovations, offering more nuanced representations of uncertainty in complex and highly customized EtO supply chains. This provides a theoretical foundation for future development of real-time, data-driven risk management frameworks.
5.2. Implications for Managers and Policymakers
From a practical standpoint, the proposed system offers a robust and scalable decision-support tool for supply chain and operations managers. Its probabilistic architecture strengthens reliability by explicitly quantifying uncertainty, while real-time IoT calibration minimizes false alarms and enhances trust in the alerts generated. When embedded into existing digital infrastructures—such as MES or IoT-enabled control towers—the system can significantly improve operational resilience, reduce costly disruptions, and enhance supplier performance monitoring. These benefits are particularly valuable in high-mix, low-volume industries, where agility, customization, and reliability are central to competitive advantage.
Managerially, the results highlight the importance of aligning the choice of EWS with organizational priorities and operational risk profiles. BPAS is most suitable for stable environments where avoiding false alarms is critical, even if detection capability is limited. SIoT-CAS enables more accurate lead time forecasting through IoT-driven calibration, making it ideal when predictive precision outweighs sensitivity. AID-RAS, with its adaptive intelligence, offers the strongest detection capability and resilience, making it especially effective in high-risk or mission-critical projects where undetected supplier delays would carry substantial costs, even at the expense of tolerating more false alerts.
For policymakers and supply chain strategists, the study provides insights into the broader ecosystem required for the successful adoption of adaptive EWSs. Establishing secure and standardized data-sharing protocols, investing in digital infrastructure, and fostering trust-based collaboration with suppliers are essential to realizing the full potential of IoT-driven predictive systems. At the same time, practical considerations—such as data privacy, sensor reliability, and implementation costs—must be carefully managed to ensure sustainable and large-scale adoption in industrial contexts.
5.3. Limitations of the Study and Future Research Directions
Despite the contributions, certain limitations should be acknowledged. First, it assumes full availability and reliability of real-time IoT data across the supply chain, which may not hold in practice. Incomplete sensor coverage, data latency, or connectivity issues can impair the system’s ability to adjust thresholds accurately or in time.
Second, the model relies on a log-normal assumption for supplier lead times, calibrated from synthetic data. While this distribution captures the skewed nature of many real-world processes, actual lead time behavior may deviate significantly—requiring more flexible or hybrid modeling approaches, such as Bayesian updating techniques, for example, would allow for continuous refinement of lead time estimates based on incoming real-time data, enhancing adaptability in uncertain environments. Similarly, machine learning-based density estimation methods—such as kernel density estimation, Gaussian mixture models, or neural network-based generative models—can offer non-parametric alternatives that better capture the intricacies of supplier performance distributions. Integrating these advanced modeling strategies could improve the accuracy and generalizability of early warning predictions, particularly in highly dynamic or volatile manufacturing contexts.
Third, the current threshold adaptation logic is deterministic and rule-based. Future studies should explore self-learning algorithms, such as reinforcement learning or online anomaly detection, to continuously recalibrate and in response to evolving patterns in supply chain data.
Further empirical validation is also needed. Testing the system in industrial settings—especially in aerospace, automotive, or industrial equipment sectors—would provide deeper insight into deployment challenges, user interaction, and business impact. Broader testing would also help assess the generalizability of the approach across different supply chain architectures and levels of digital maturity.
6. Conclusions
This study introduced and validated an IoT-calibrated probabilistic EWS for predicting supplier delivery delays in smart EtO supply chains. By developing and evaluating three alerting mechanisms—BPAS, SIoT-CAS, and AID-RAS—the research demonstrates how the integration of probabilistic modeling with real-time IoT calibration significantly enhances the accuracy, sensitivity, and resilience of delay predictions.
The experimental results highlight clear trade-offs among the approaches. BPAS minimizes false alarms, making it suitable for stable and low-risk environments. SIoT-CAS improves prediction precision, proving valuable when accurate lead time estimation is the managerial priority. AID-RAS, by dynamically adjusting thresholds through real-time IoT streams, achieves the highest detection rates and robustness against uncertainty, making it particularly well-suited for high-risk or mission-critical projects. These findings underscore the importance of selecting an EWS aligned with specific operational contexts and strategic objectives.
Beyond empirical validation, the study contributes to theory by positioning EWSs within the broader discourse on predictive supply chain analytics and resilience. It further provides actionable guidance for managers and policymakers, demonstrating that IoT-enhanced predictive systems can strengthen operational reliability, support supplier monitoring, and mitigate costly disruptions.
Nevertheless, the study has limitations. It focused on three proposed strategies and did not benchmark them against existing buffer-based or purely statistical models. Future research should address this gap through comparative evaluation and real-world case studies. Additional work could also explore hybrid systems that combine probabilistic forecasting with machine learning, or examine how trust, data security, and supplier collaboration shape the long-term adoption of such systems.
In conclusion, this research advances both academic and practical understanding of how adaptive, IoT-calibrated EWSs can transform risk management in EtO supply chains. By reducing uncertainty, improving responsiveness, and enhancing resilience, the proposed systems pave the way toward smarter, more reliable, and more agile industrial ecosystems.
