1. Introduction
Recently, with the swift progress of energy generation from new energy sources as well as HVDC transmission, the power system is gradually becoming highly power electronic [
1,
2,
3,
4]. The high degree of power electrification of the system brings a series of frequency and voltage stability problems, which greatly threaten the secure functioning of the system [
5,
6]. The focus of many recent research projects has been on analyzing and improving the strength of high-percentage new energy access and DC sending/receiving systems. Nevertheless, there is no unified and effective strength measurement index for sending/receiving systems with a considerable percentage of new energy and DC entry because of the large number of components. Therefore, the development of a strength measurement index for such feeder/receiver systems has turned into a pressing issue that needs to be addressed.
System strength is a vital foundation for ensuring that high-ratio power electronic power systems operate safely and reliably. Scholars both domestically and internationally have undertaken a considerable number of studies on the basic concept and analysis of system strength [
7,
8,
9,
10,
11]. The authors of [
12] regard system strength and inertia as two-fold characteristics, and system strength is only used to characterize the voltage features of the system. The authors of [
13] state that power systems have the ability to maintain and control voltage waveforms at arbitrary locations in the power system during steady-state operation as well as after being subjected to disturbances. The short-circuit ratio (SCR) is a frequently deployed metric for initial assessments of system strength, as recommended by researchers [
14,
15] and organizations [
16] such as the International Council on Large Electric Systems (CIGRE), the Australian Energy Market Operator (AEMO), and China Electric Power Research Institute (CEPRI). The SCR can balance the need for a deep understanding of the system strength with the time and cost burdens of rigorous electromagnetic model analysis. However, the system’s stability can change rapidly with varying operations. As a result, the SCR has garnered considerable attention for its proactive and valuable role in assessing practical engineering scenarios. The authors of [
17] came up with a new SCR standard that could take into account the reactive power provision ability of a VSC HVDC system, thereby enhancing the stability of the AC system on the different buses connected to the LCC HVDC system. The concepts of the multi-infeed SCR [
18] and the equivalent effective SCR [
19] were put forward to assess the robustness of a multi-infeed HVDC system. The weighted SCR [
20], the composite SCR [
21], and the equivalent circuit-based SCR [
22] were presented for the analysis of a weak power system’s voltage stability problem, which considers renewable energy generation (REG). The authors of [
23] introduced the site-dependent short circuit ratio (SDSCR), whose critical value was determined to be 1 based on the eigenvalue criterion. The authors of [
24] proposed a support strength factor of the receiving system to evaluate the voltage support strength, and another study [
25] offered a real-time assessment method used for the real-time monitoring of the stability status of renewable energy systems using the concept of a generalized SCR. A comparison of the application scenarios for different methods is shown in
Table 1.
As can be seen from the above literature review, most studies measured the voltage support capacity of the system based on the concepts of the SCR or extended SCR. The focus was mostly on new energy grid-connected systems or DC feeder/receiver systems. However, there is a lack of a complete set of system strength assessment indexes and methodologies for complex systems that contain a significant percentage of new energy and DC entry. In this paper, therefore, we propose an evaluation metric for system strength based on equivalent impedance, which can effectively measure the system strength. The following are the primary innovations of this paper:
The equivalent impedance method is applied to analyze the system strength in transmission/reception/termination grids containing a significant percentage of new energy and DC entry.
A measure of the strength of the sending/receiving end of the grid under a significant percentage of new energy and DC entry is defined, which can efficaciously analyze the system’s voltage support strength and provide security constraints on new energy and DC power.
A methodology for the quantification of the transient overvoltage of the power grid at the sending and receiving ends, predicated on the impedance ratio, is proposed. The influence mechanism of the transient overvoltage amplitude of the impedance ratio is analyzed, and based on the impedance ratio, the equivalent impedance safety domain of the new energy and DC systems in the sending/receiving end system is calculated using the constraint of transient overvoltage.
The remainder of this paper is structured as follows: in the first section, the suggested equivalent impedance theory is systematically presented; in the second section, the proposed metrics for assessing the strength of support the sender/receiver system is explained in detail; in the third section, the correctness of the proposed metrics is verified by means of several different arithmetic systems; and in the last section, a conclusion is given.
2. Equivalent Impedance Principle
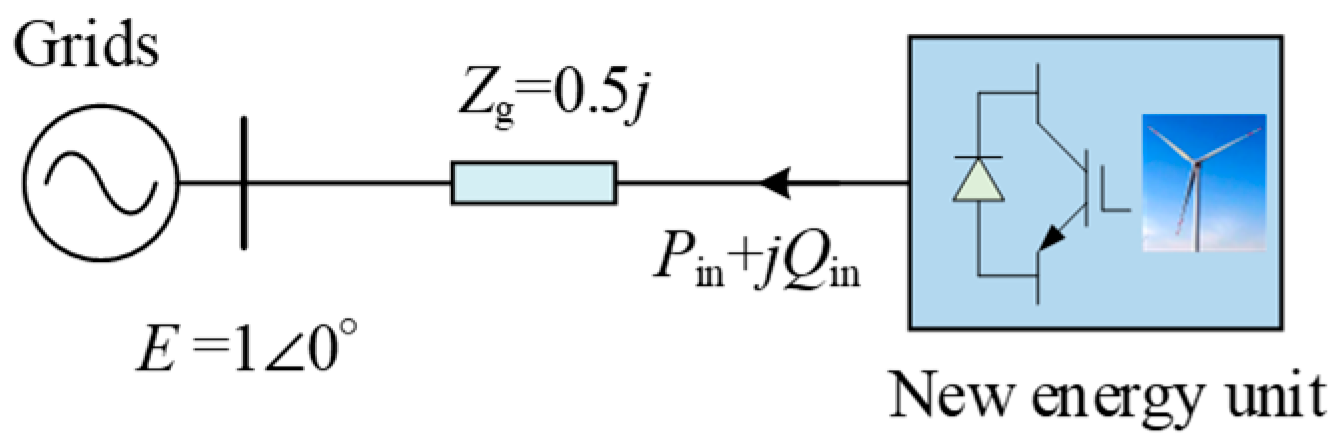
In this paper, we illustrate the fundamentals of equivalent impedance by means of a simple stand-alone, single-feeder system shown in
Figure 1, and then introduce it to a complex sender/receiver system.
In Equation (1), the new energy unit’s active power and reactive power are described as
where
P and
Q are the active and reactive power of the new energy unit,
E and
V denote the voltage of the AC system and grid-connected bus, and
δ is the difference in their phase angles.
XS is the impedance of the AC system.
From the above equation, the variable
δ can be eliminated, and the square of the voltage mode of the new energy grid-connected bus is obtained as
In addition, in this paper, the equivalent impedance is derived from the perspective of equivalent impedance of the new energy unit to verify the correctness of the equivalent impedance for voltage calculation.
In
Figure 2, the equivalent circuit is displayed in accordance with the new energy system of
Figure 1. According to the electrical circuit principle,
where
ZN denotes the equivalent impedance of the new energy unit.
The new energy equivalent impedance is calculated as follows
where
S* denotes the apparent power of the new energy unit.
When combined, Equations (3) and (4) give the complex equation for the voltage
By solving Equation (5), we can obtain the same voltage solution as Equation (2), so the new energy is regarded as active equivalent impedance, which also satisfies the basic principle of the circuit.
Accordingly, in this paper, we will use the principle of equivalent impedance to analyze the stability of the new energy system via HVDC.
Here, the size of the equivalent impedance of the external grid-connected equipment will be introduced from the impedance perspective when the system is critically stabilized at the static voltage. In the critical case, according to Equation (2),
When combined with Equation (4), these yield
where
denotes the critical impedance of the new energy unit when the system is in a critical stable state.
That is, when the system is in the static voltage critical stabilization condition, the external equipment equivalent impedance modulus is equivalent to the magnitude of the grid-connected impedance XS. Since the power increase in the external equipment will cause its impedance to decrease, when the system operation point is located far from the critical point, the equivalent impedance of the external equipment should be greater than the grid-connected impedance, and the system is in the static voltage destabilization condition when the equivalent impedance of the external equipment is greater than the grid impedance.
3. Definition of the Support Strength of the Grid at the Sending/Receiving End
Currently, the strength of voltage support is measured by the system SCR; for example, the strength of a stand-alone, single-feed-in/feed-out system is measured by the system’s SCR capacity in relation to its rated capacity for new energy sources. For systems with multiple new energy field access, multiple fields short-circuit ratios and generalized short-circuit ratios are also introduced to extend the adaptability of short-circuit ratios in different scenarios. However, for the new energy system via DC in
Figure 3, there has not been a reasonable index for measuring the whole system strength, and it is challenging to propose a unified index because the strength of the system may be affected by the new energy stations connected to it and the DC capacity.
Based on the concept of voltage stiffness, in this paper, we propose a strength index for the sending/receiving system under new energy and DC access.
When the new energy field station and the DC outgoing system are both used as access objects, the defined indicators are
where
λND denotes the ratio between the equivalent impedance of the parallel system and the AC system.
ZD and
ZN denote the equivalent impedance of the HVDC system and the new energy unit.
When the system meets static voltage stabilization, the new energy field station and DC outgoing system should meet the overall equivalent impedance that is in excess of or equivalent to the grid-connected impedance when the working condition changes, and the grid-connected impedance here should be the size of XS.
3.1. Influence of New Energy Output Change on Indicators
For the new energy system shown in
Figure 3, in the ordinary course of events, the reactive power required for DC system transmission is provided by the reactive power compensator in the converter station. The exchange of reactive power between the AC system and the DC system is very small.
Provided that reactive power is not emitted by new energy, the equivalent impedance of the DC system as well as the new energy should be
Using associative Equation (2), the new energy and DC system parallel equivalent impedance is
where
P signifies the sum of active power from the DC system and new energy, and
Xs is the impedance of the system. In
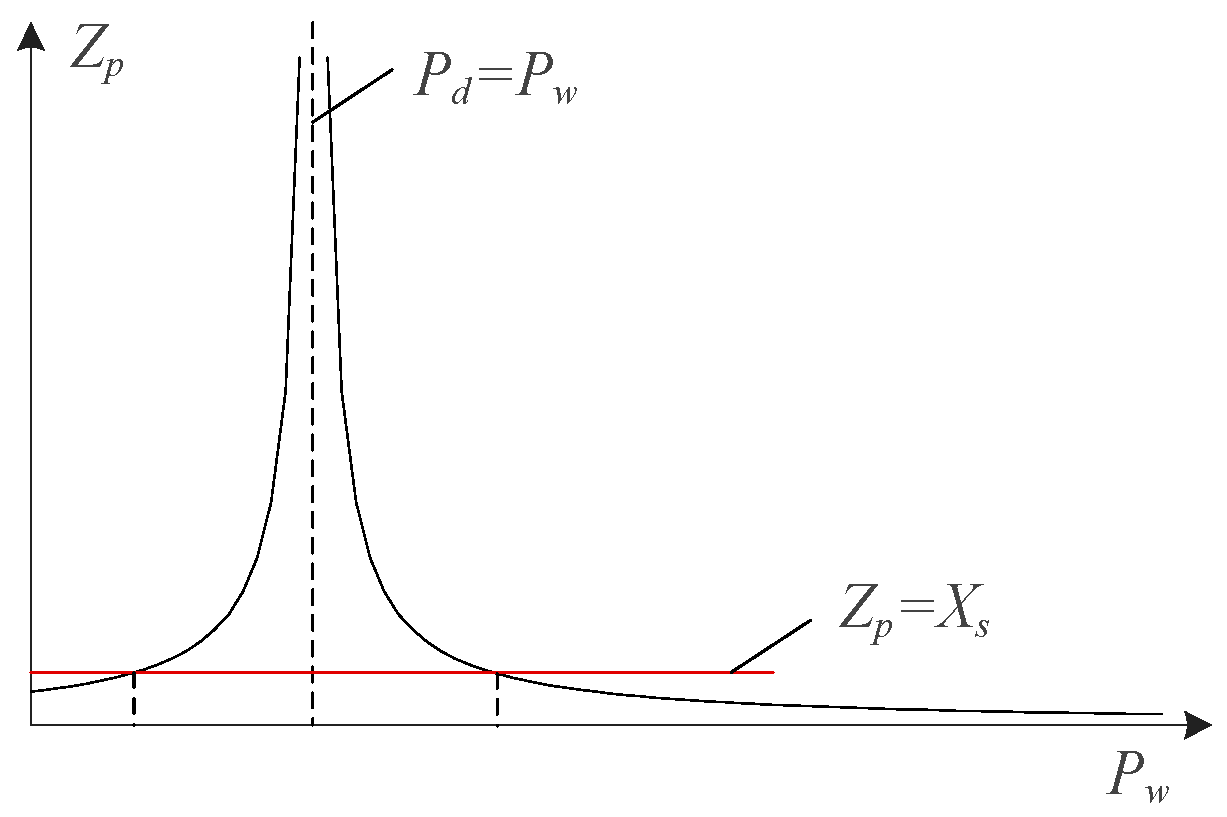
Figure 4, the equivalent impedance of the new energy and DC systems first increases and then decreases as the power of the new energy increases.
Therefore, the new energy through the DC system strength indicators
λND can be expressed as follows
From Equation (10), the shunt equivalent impedance is not only related to the power
P, but also to the system parameters
E and
Xs, which seems to be inconsistent with common sense. But in fact, since the equivalent impedance is commensurate with the power and voltage at the parallel network point, and the voltage is related to the system parameters, the equivalent impedance is also affected by the system parameters. To find its partial derivative with respect to the active power, it is easy to know that
. In other words, an increase in active power is accompanied by a decrease in equivalent impedance. At the same time, through the formula it can be seen that when the DC system and the total amount of the new energy power reaches a critical value, its equivalent critical impedance can be worked out using the following equation:
where
and
are the active power and equivalent impedance, respectively, when the system is in a critical steady state.
It can be analyzed that when the new energy unit has less power than the DC power, this AC system delivers power to the outside world, and the equivalent impedance increases in proportion to the new energy power. When the power of the new energy unit is greater than that of the DC power, the external power is fed into the AC system and then the equivalent impedance decreases with the increase in the new energy power.
3.2. Static Voltage Stability Domain of New Energy DC Feeder System
The impedance of the new energy feeder and the DC system will be affected by the power change, resulting in the equivalent impedance of the parallel connection of these two changing, which in turn affects the static voltage stabilization margin of the sending system.
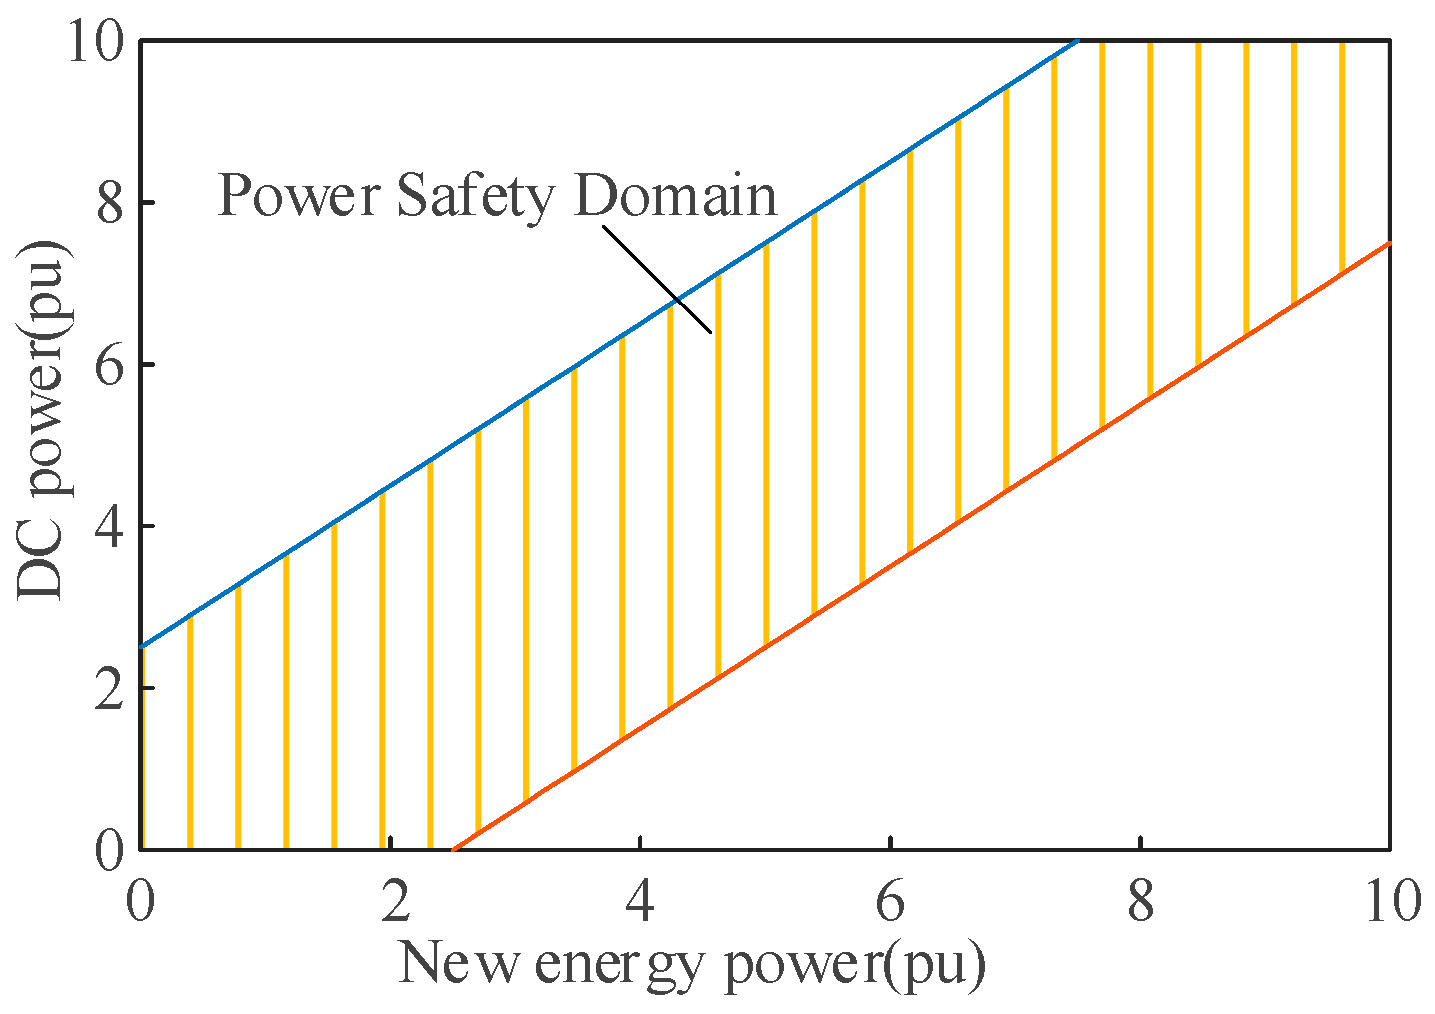
To guarantee that the feeder system has a certain stability margin, the static voltage stability domain of the new energy feeder and the DC feeder power is derived.
Figure 5 presents the safety domain composed of new energy and DC power.
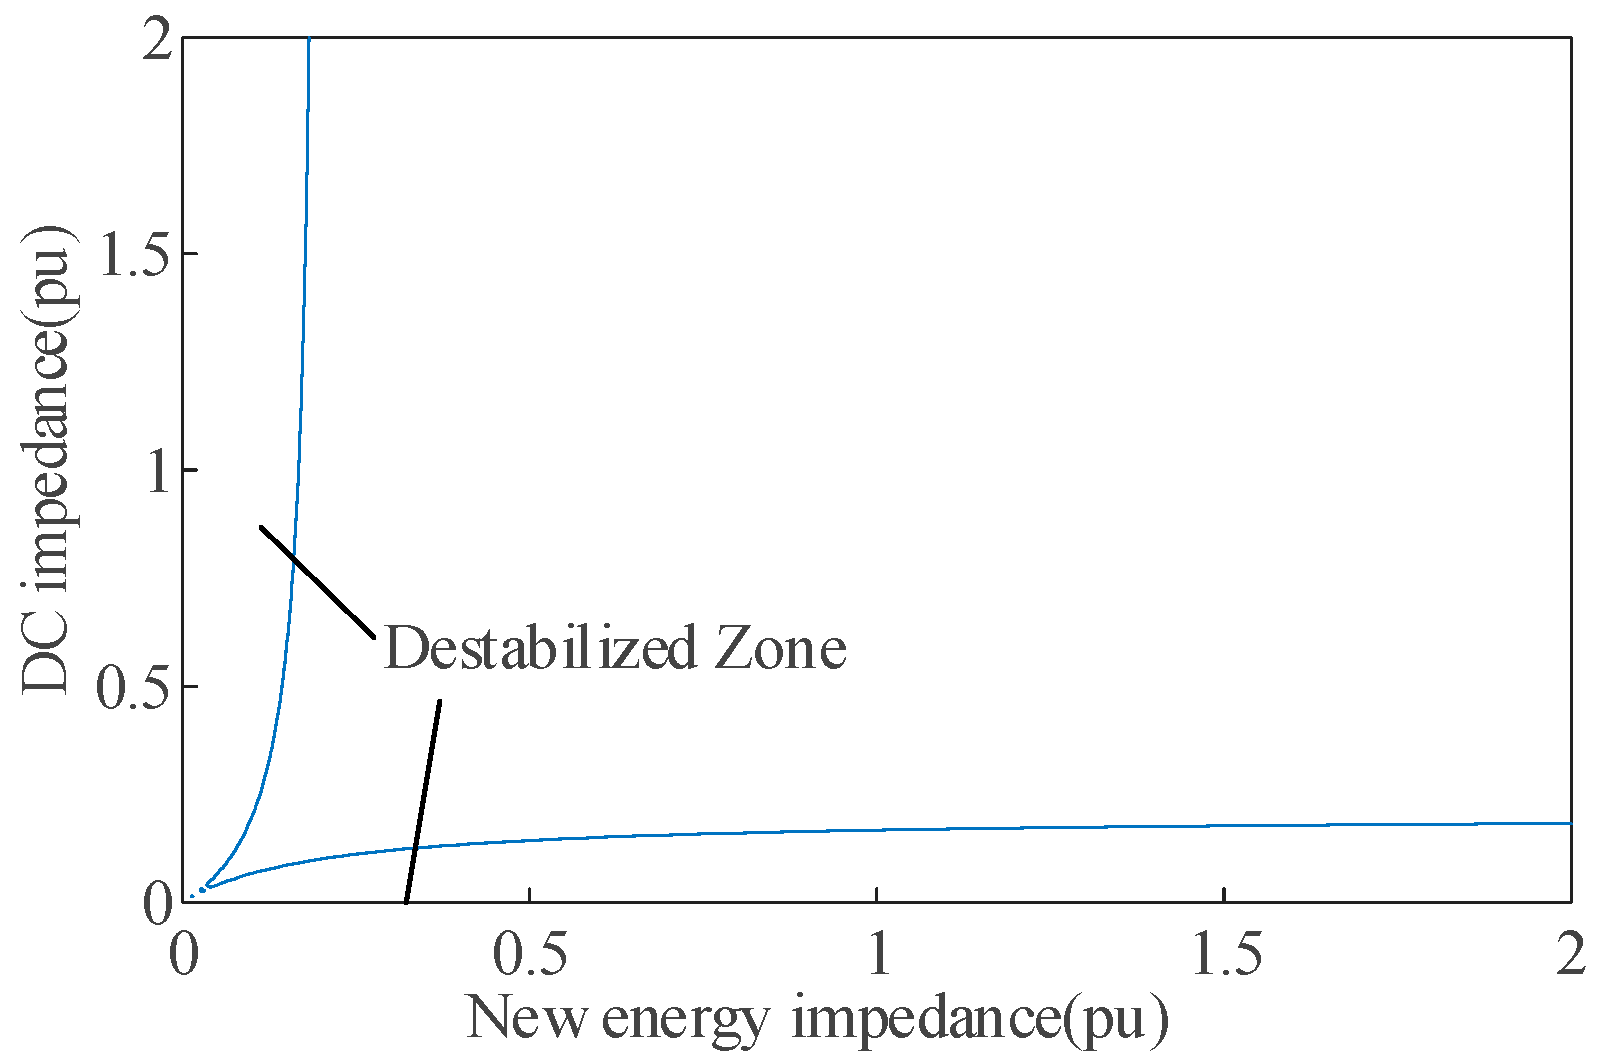
From the standpoint of impedance, the DC outgoing system and the new energy unit should both satisfy the equivalent impedance.
Figure 6 presents the stable range enclosed by the equivalent impedance of new energy and DC systems.
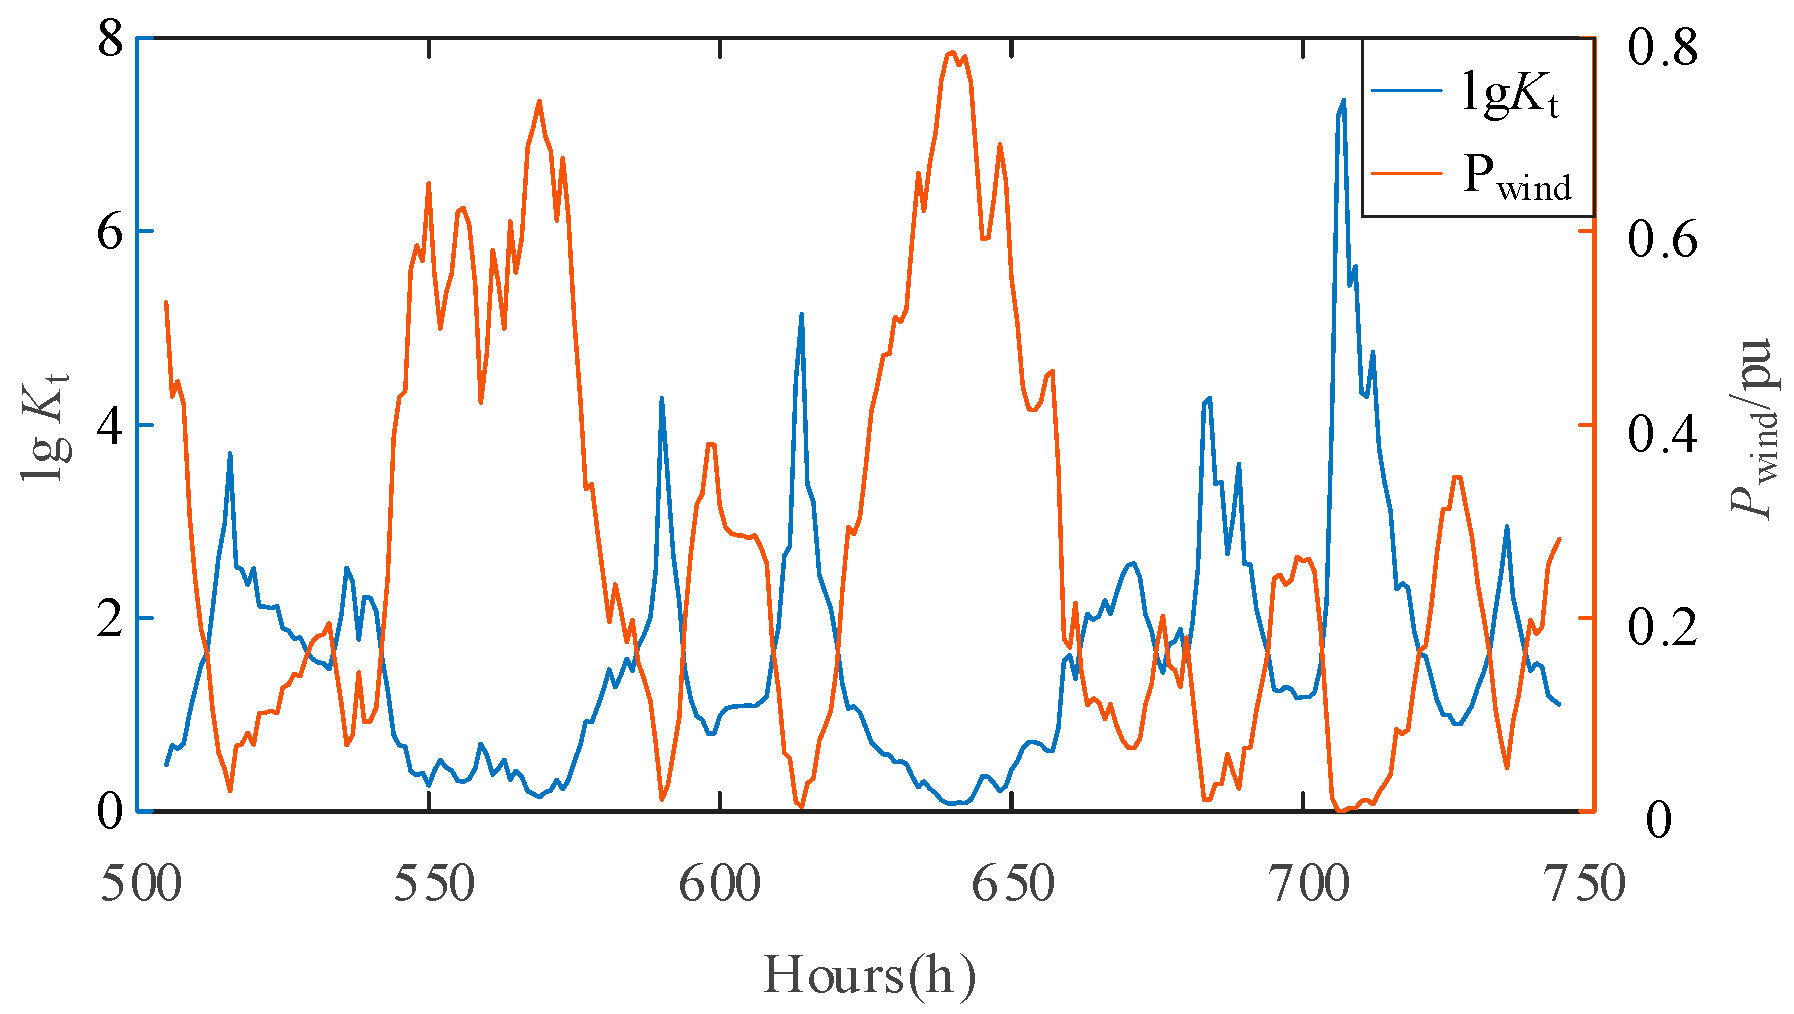
Due to the uncertainty and volatility of the wind and light, the new energy unit has time-varying power, which leads to time-varying equivalent impedance, which is larger when the new energy is small and the safety margin is larger, and smaller when the new energy is larger and the safety margin is smaller.
The curve in
Figure 7 shows the output of a wind farm for 10 days in January; the equivalent time-varying impedance
ZN(t) for the whole day is calculated based on Equation (10), and the time-sequence impedance ratio
λ(t) is plotted. It was generated with a constant power factor of magnitude 0.95.
The display is to be facilitated by taking the value of λt to be logarithmic and by taking the active output to be the most recent value, which prevents the amplitude of some data from being too large and facilitates comparison. According to the curve in the figure, part of the time node wind power is larger, the corresponding impedance ratio is close to 1 (lgλt tends to zero), the static voltage safety margin is insufficient, and the static voltage instability is a greater risk. Therefore, the use of the equivalent impedance ratio can be more intuitive for understanding the safety status of the system and issuing a real-time warning.
Therefore, due to the random fluctuations in the output of new energy, the stability margin of the system will constantly change. In severe cases, it may exceed the critical point of system stability, leading to system collapse. Through the impedance ratio index, the operating point status and stability margin of the system can be clearly understood, and effective early warning and remedial measures can be taken.
3.3. Quantification of Transient Overvoltage
3.3.1. Single-Feeder System
Based on the single-machine, single-feed-in system depicted in
Figure 8, the scale of the equivalent impedance of the external equipment at the transient overvoltage threshold is analyzed from the viewpoint of impedance. The transient overvoltage described in this paper is the overvoltage engendered by the reactive power surplus that is produced by the new energy unit after the AC fault clearing of the new energy pooling system.
After fault recovery, the transient overvoltage is most serious while the new energy active power is 0, and currently, the transient overvoltage amplitude of the parallel network point is
The equivalent impedance modulus of the new energy unit is:
where
SN denotes the apparent power of the new energy unit and
UN denotes the rated voltage at the grid-connected bus.
For the rated operating conditions,
UN = 1, Equation (16) can be combined with Equation (15) to obtain the parallel network point transient overvoltage and the equivalent impedance of the external equipment through the following formula:
According to the above equation, the TOV is negatively correlated with
ZN; taking
E = 1 and
XS = 0.1, the corresponding relationship curve is shown in
Figure 8.
In general, the overvoltage amplitude is not allowed to exceed 1.3 pu. At this point, the ratio of the corresponding external equipment impedance to this system’s impedance can be derived and should satisfy the following conditions:
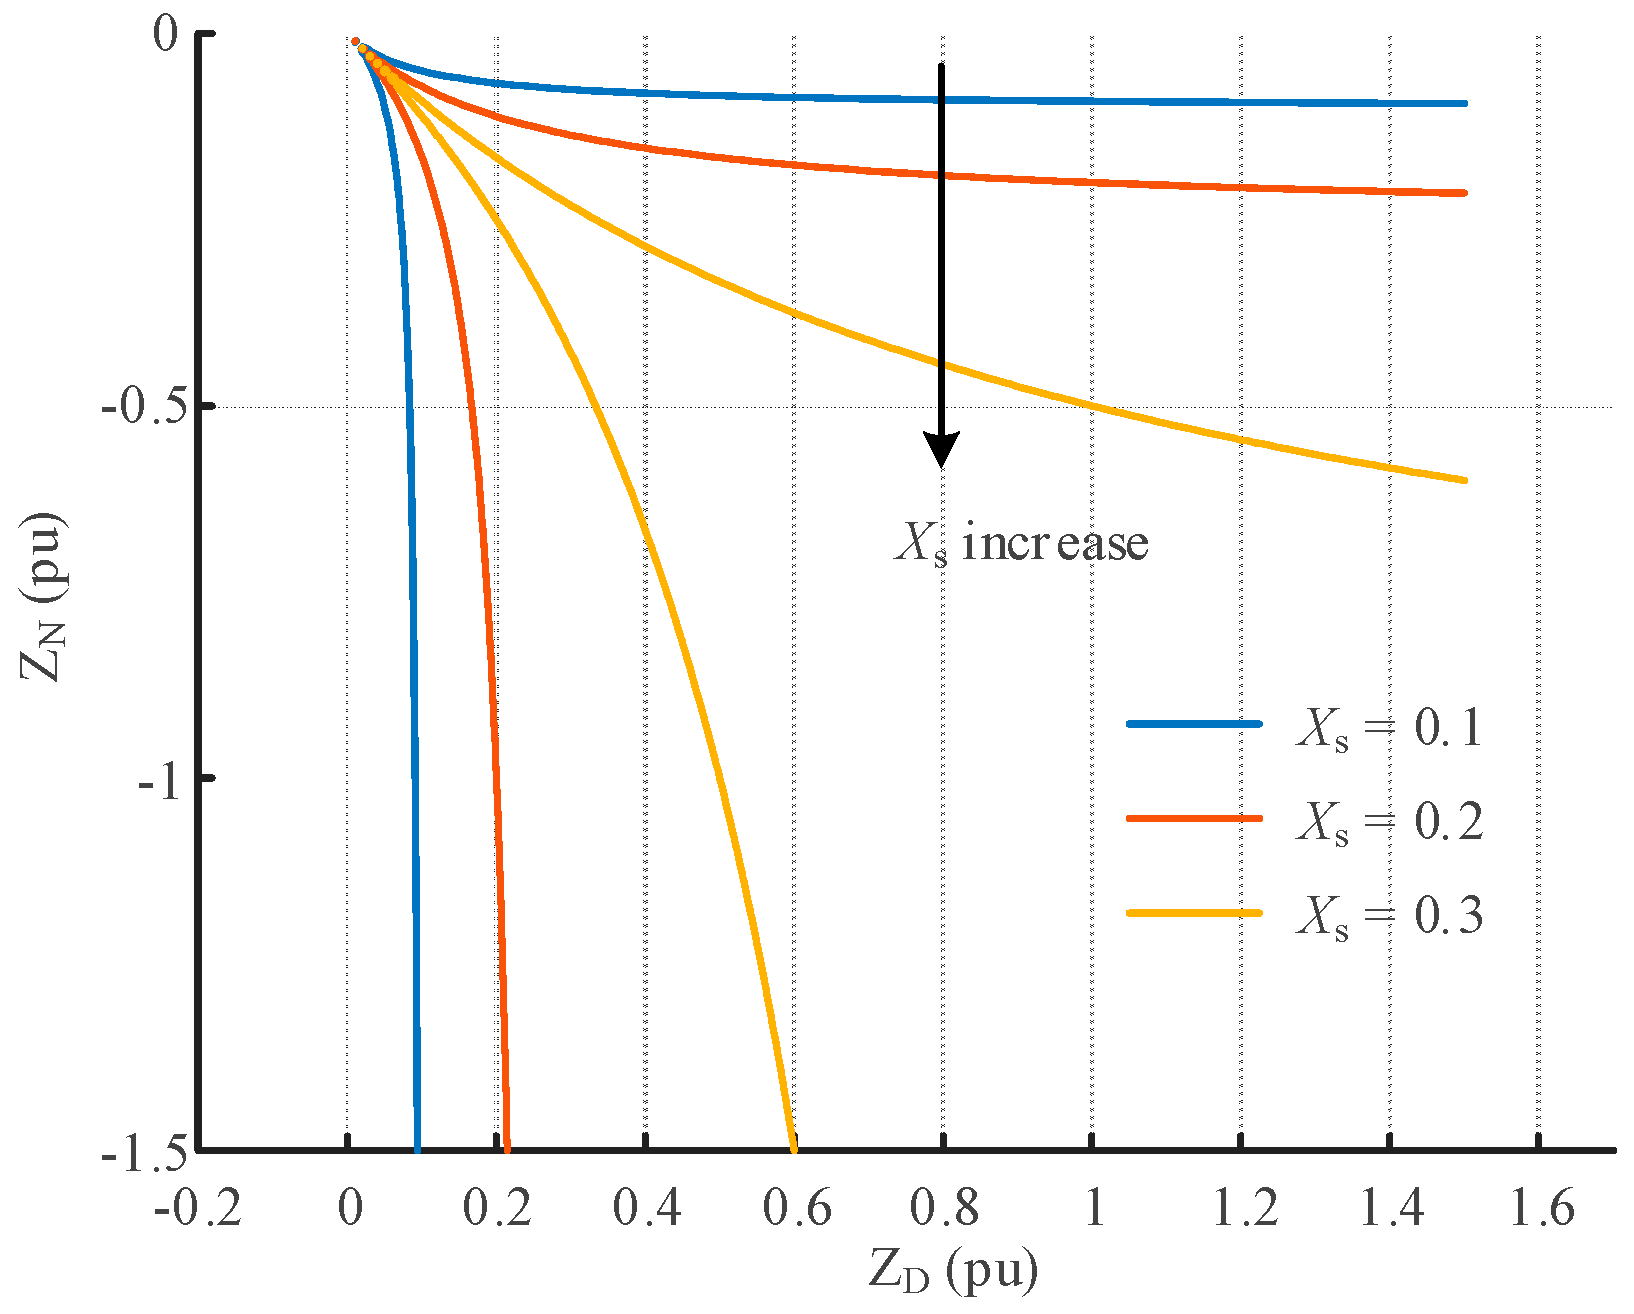
Since the impedance ratio index proposed in this paper directly compares the external device to the system impedance magnitude, the size of the system impedance directly affects the stability domain of the system as shown in
Figure 9. When the system impedance is very small, the stability domain is highly sensitive to its changes. When the system impedance is large, i.e., in a weak system, the stability domain is less sensitive to its changes.
3.3.2. New Energy via Access to HVDC Transmission System
The transient overvoltage of a single device plugged into the AC system was analyzed in the previous section, and the transient overvoltage at the receiving-end grid under new energy as well as DC connection will be further studied here.
According to the proposed equivalent impedance theory, the parallel impedance of new energy and DC should satisfy Equation (18), and the security constraint inequality about the new energy and DC equivalent impedance can be obtained:
where
and
. The following figure plots the safety domains of the new energy and DC equivalent impedances for different system impedances. It can be seen that the impedance safety domain is shrinking as the system impedance increases.
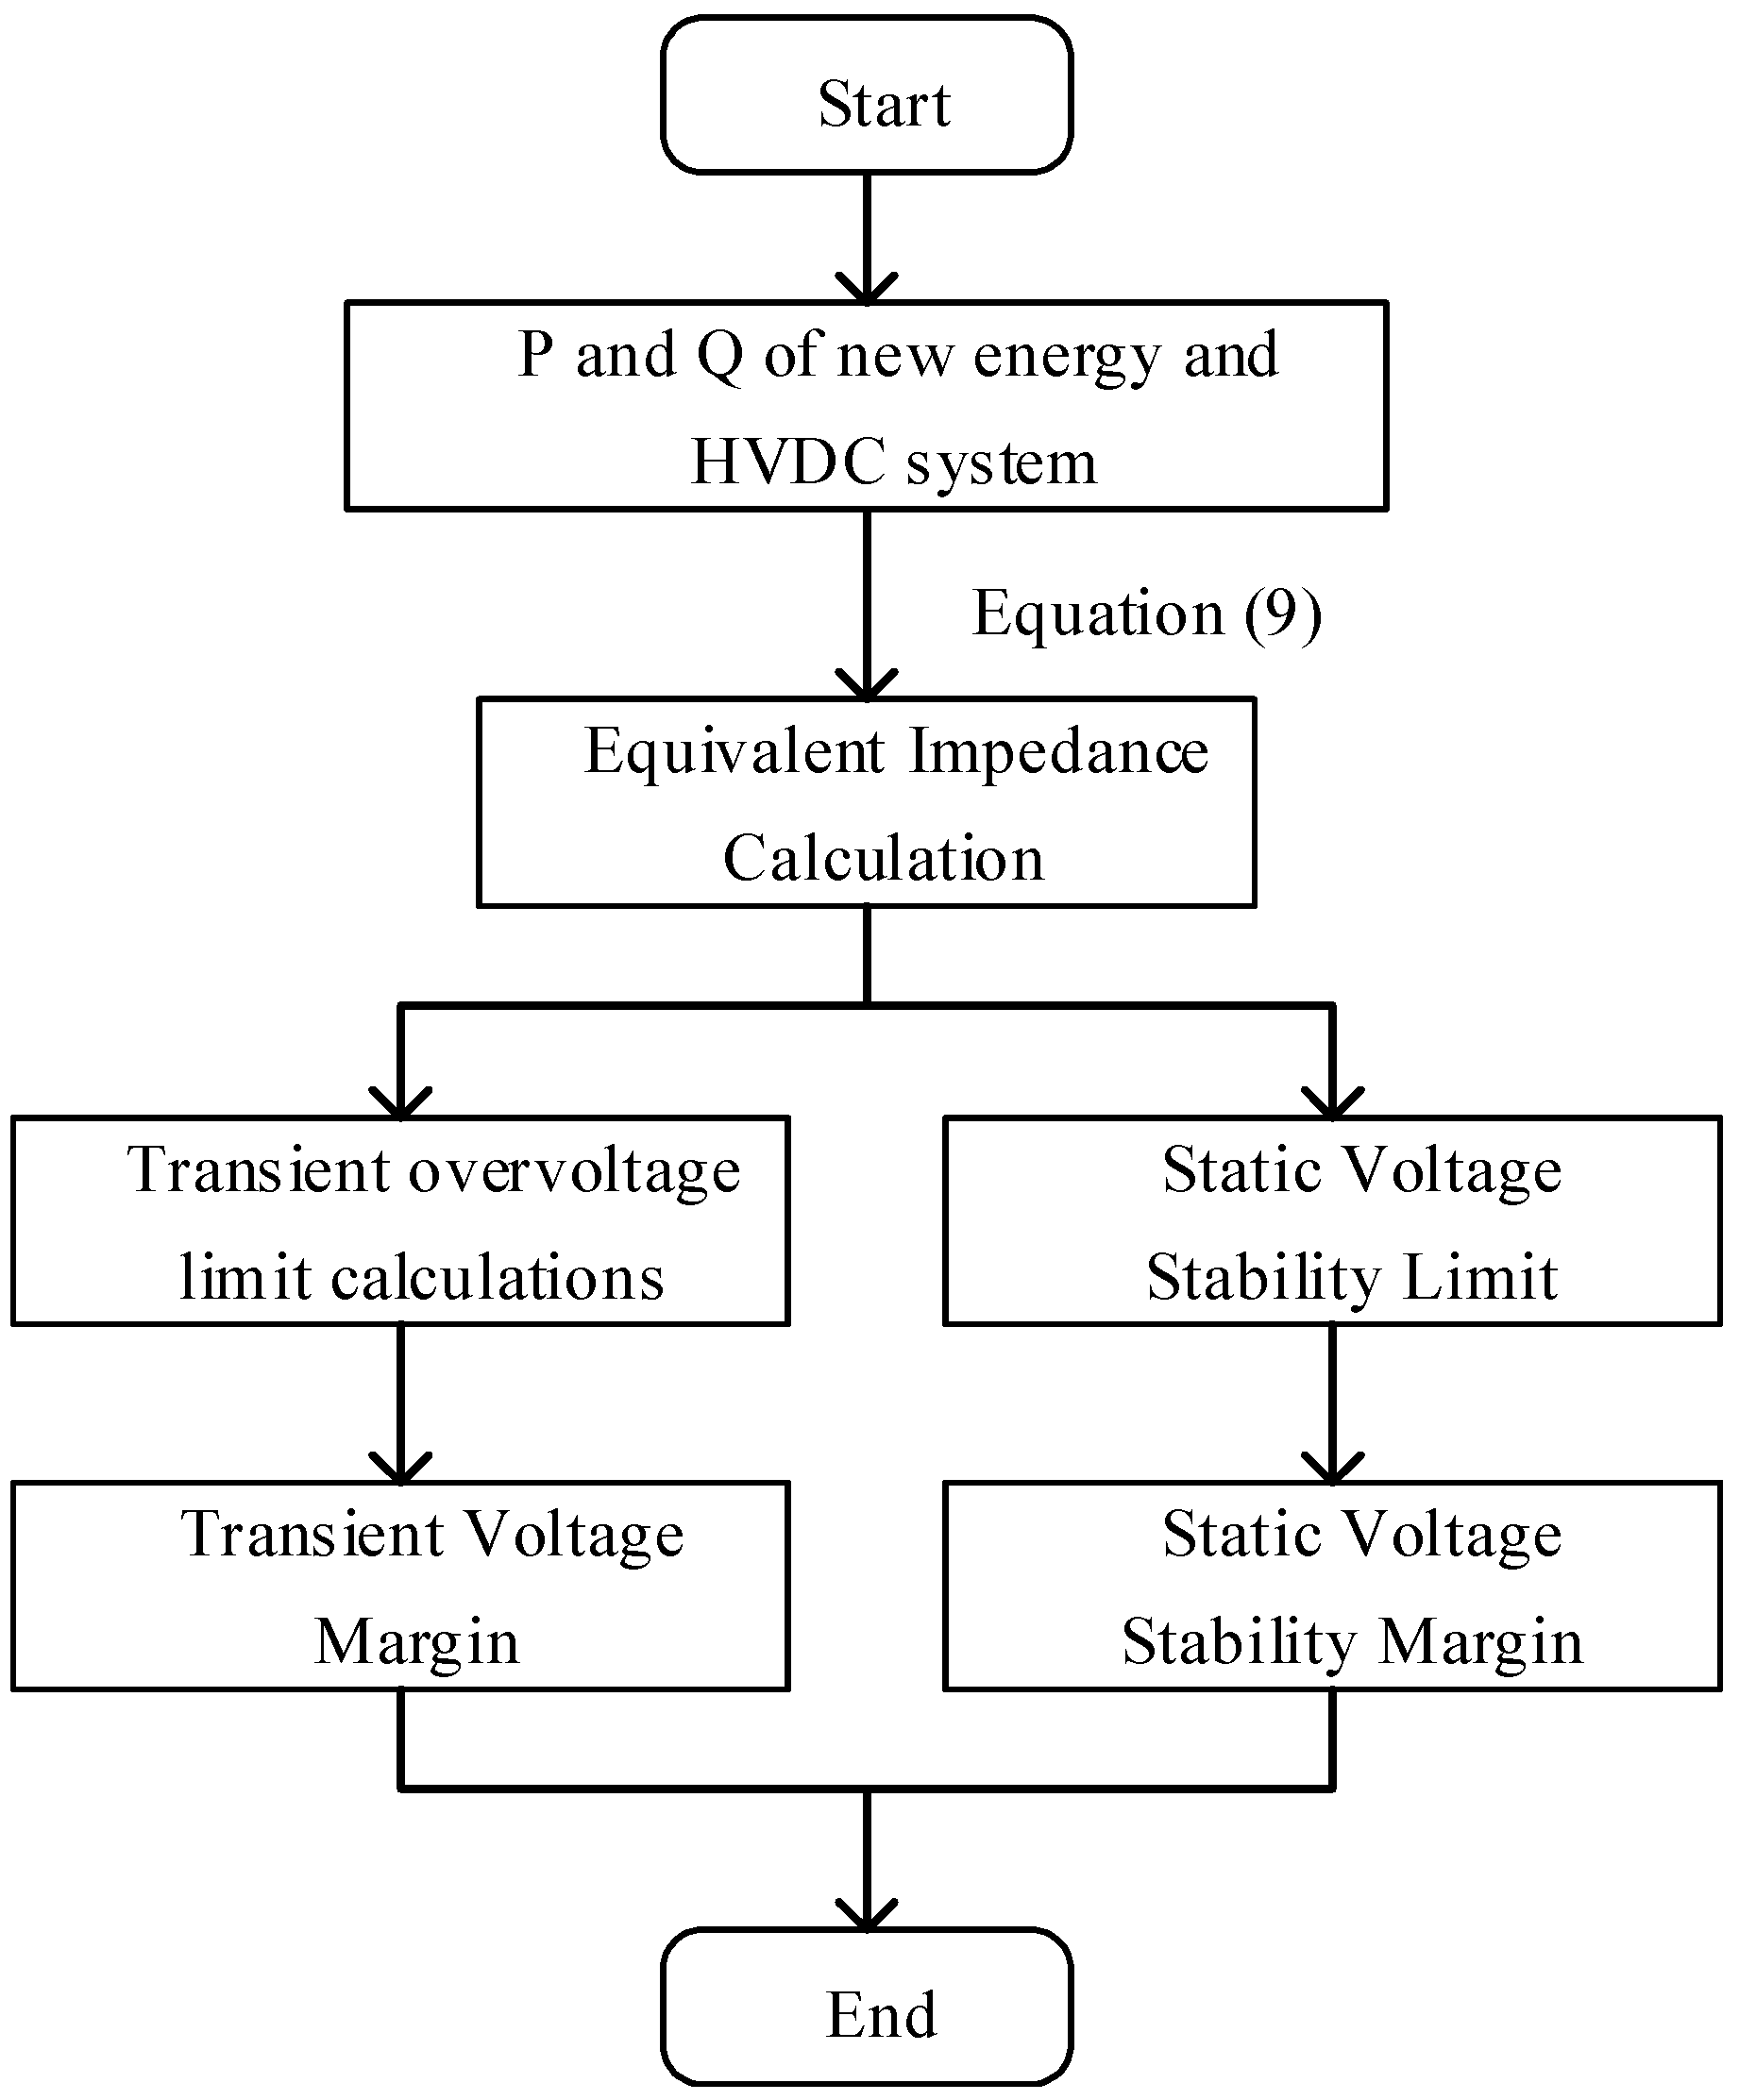
In summary, in this section, we analyze the static voltage stability and transient overvoltage analysis methods for new energy and DC systems based on impedance. An impedance ratio-based static voltage stability limit and transient overvoltage margin calculation method is proposed, and
Figure 10 shows the calculation method of the stability margin.
4. Simulation Verification
4.1. Equivalent Impedance Analysis and Verification
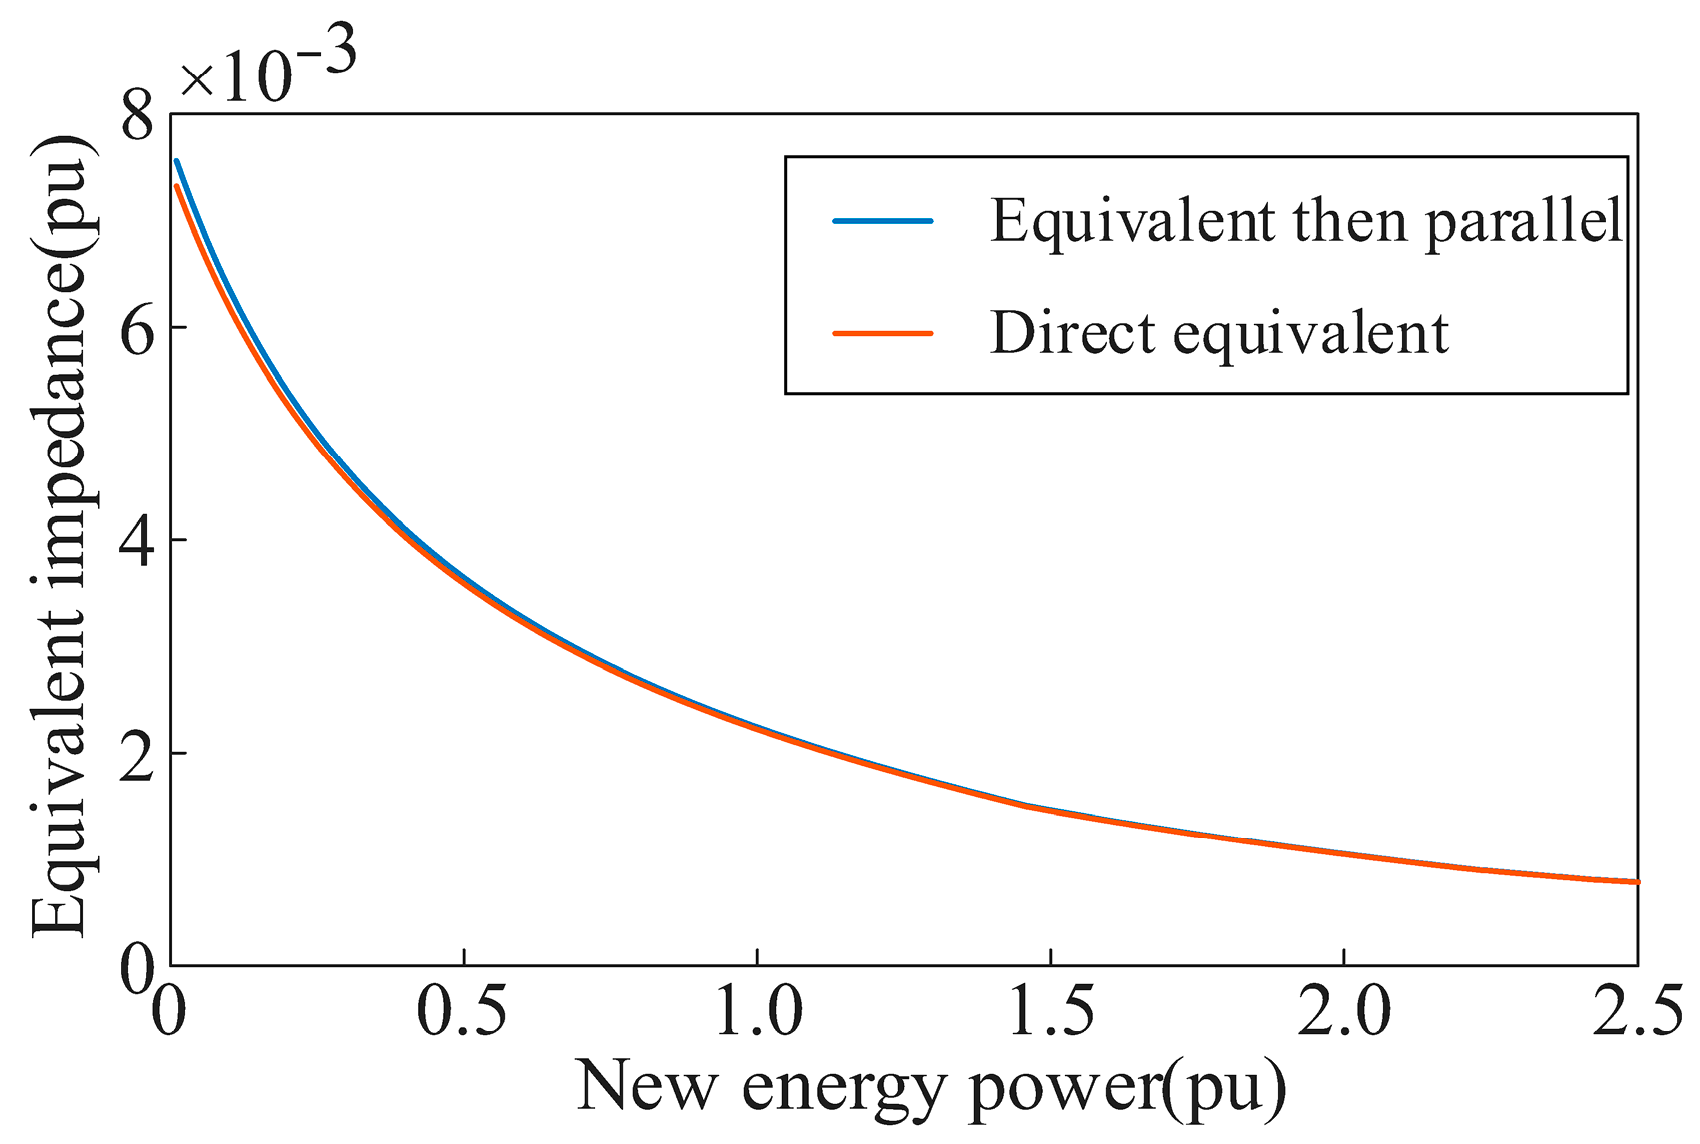
The equivalent delivery system model is built according to the new energy HVDC delivery system as follows. To assess the accuracy of the model of equivalent impedance of the HVDC sending system and the new energy unit proposed in this paper, we will compare the impedance calculated from the parallel connection of new energy and HVDC with the impedance calculated directly through the relevant data of the grid-connected bus by increasing the new energy output power. This comparison will also provide theoretical support for the static voltage stabilization and the transient voltage support strength predicated by the impedance ratio in this paper’s discussion.
Figure 11 gives the impedance curves of HVDC and new energy impedance first parallel and then equivalent, and first equivalent and then parallel. Both of them have the same trend with the new energy power, and the difference is very small. This proves that the equivalent impedance posited in this paper meets the accuracy requirements of the rudimentary circuit principle.
Figure 12 presents the effect of new energy power on equivalent impedance. When the HVDC power is large, with the increase in the new energy unit power, the new energy and DC parallel impedance will first increase and then decrease, and the turning point is when the new energy and DC power are equal. This conclusion is also consistent with the previous theoretical analysis.
4.2. Static Stability Analysis Verification
4.2.1. Single Feeder
The AC grid voltage level is 10 kV, and the reference voltage and capacity are set to 10 kV and 100 MVA, respectively. The new energy unit is set to generate power with fixed reactive power, and the reactive power
. According to Equation (2), the variation curve of the grid-connected bus voltage with the active power fed from the new energy unit is shown in
Figure 13. The curve of voltage calculated using the equivalent impedance is shown in
Figure 14. The two are essentially the same, proving the correctness of using the equivalent impedance for grid-connected voltage calculation.
4.2.2. New Energy Single Feeder
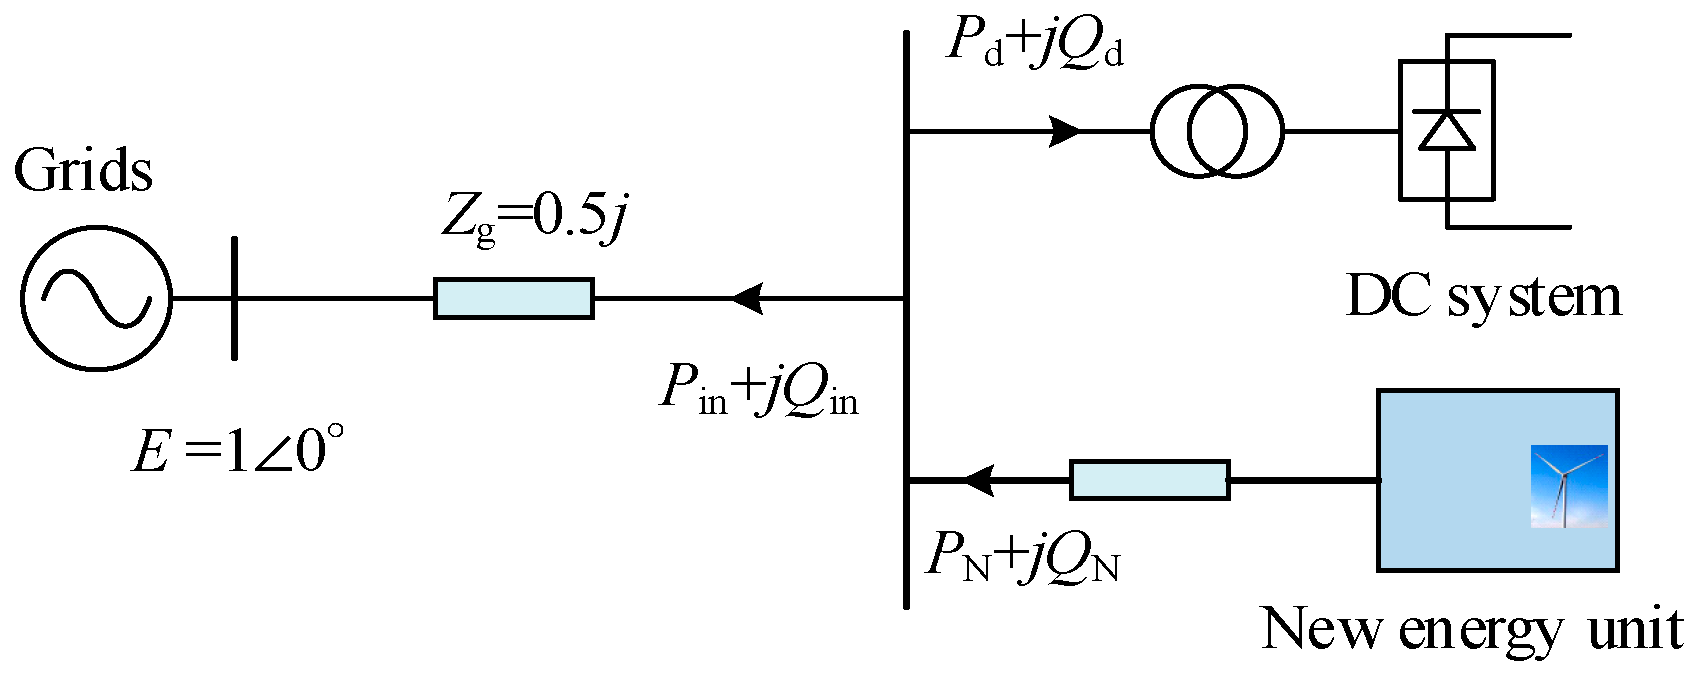
As demonstrated in
Figure 15 for this new energy DC delivery system, the AC system voltage
E is 1.0 p.u. and the impedance
j is 0.1 pu. Here, the magnitude of different impedance ratios will be changed by increasing the new energy power or DC power to ensure that the critical impedance ratio is correct. Those results in
Figure 13 and
Figure 16 show that the system reaches the static voltage critical steady state while the new energy unit output power is changed so that the DC and new energy parallel equivalent impedance and the system impedance are the same, i.e., while the impedance ratio index is 1. When the power of the new energy unit increases, the system is not stable, while the voltage and power of the grid-connected bus are constantly oscillating.
4.2.3. Cluster
The majority of the new energy system will be connected to the outside transmission of power through a cluster grid, to prove the correctness of the impedance index that is put forward in this paper.
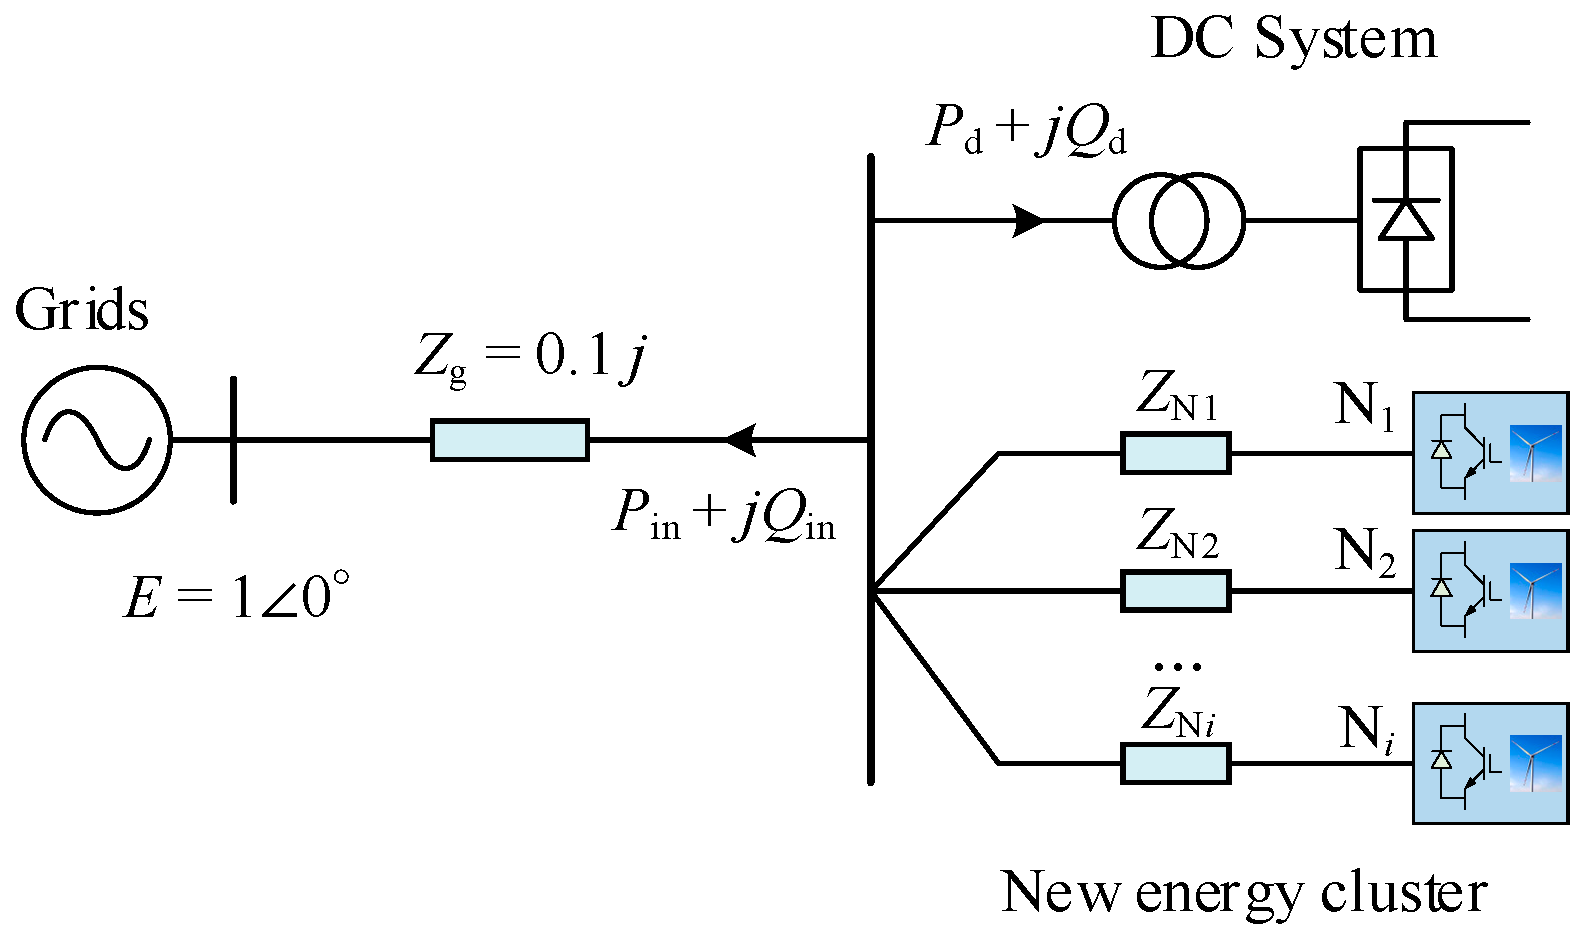
As shown in
Figure 17, the new energy cluster grid-connected system is linked to the DC outgoing system. The DC voltage level is 800 kV, while the rated power is 500 MW. Twenty new energy stations are included in the new energy cluster, as the grid voltage level of each station is 35 kV, the grid impedance is 0.3
j, and the rated power is 40 MW.
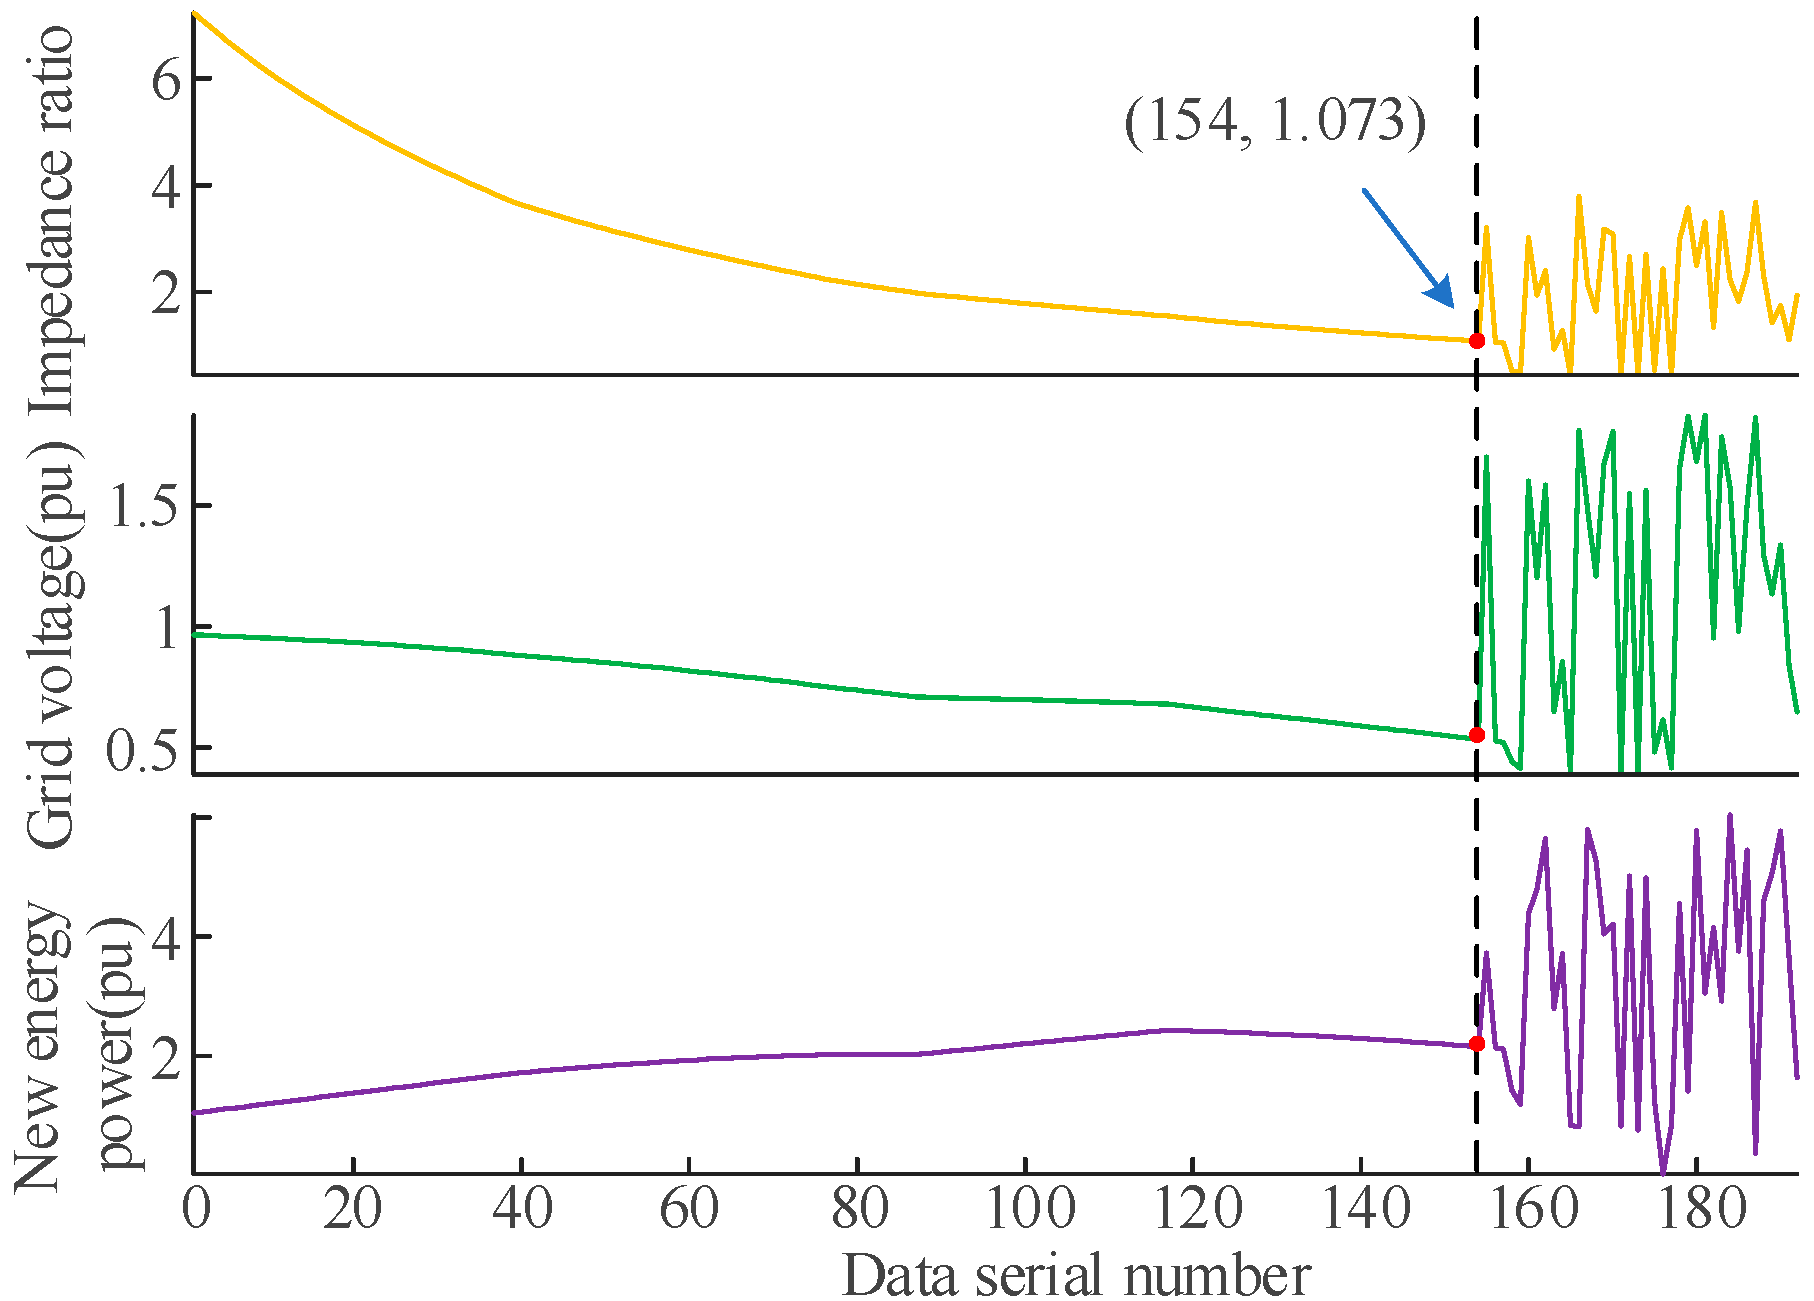
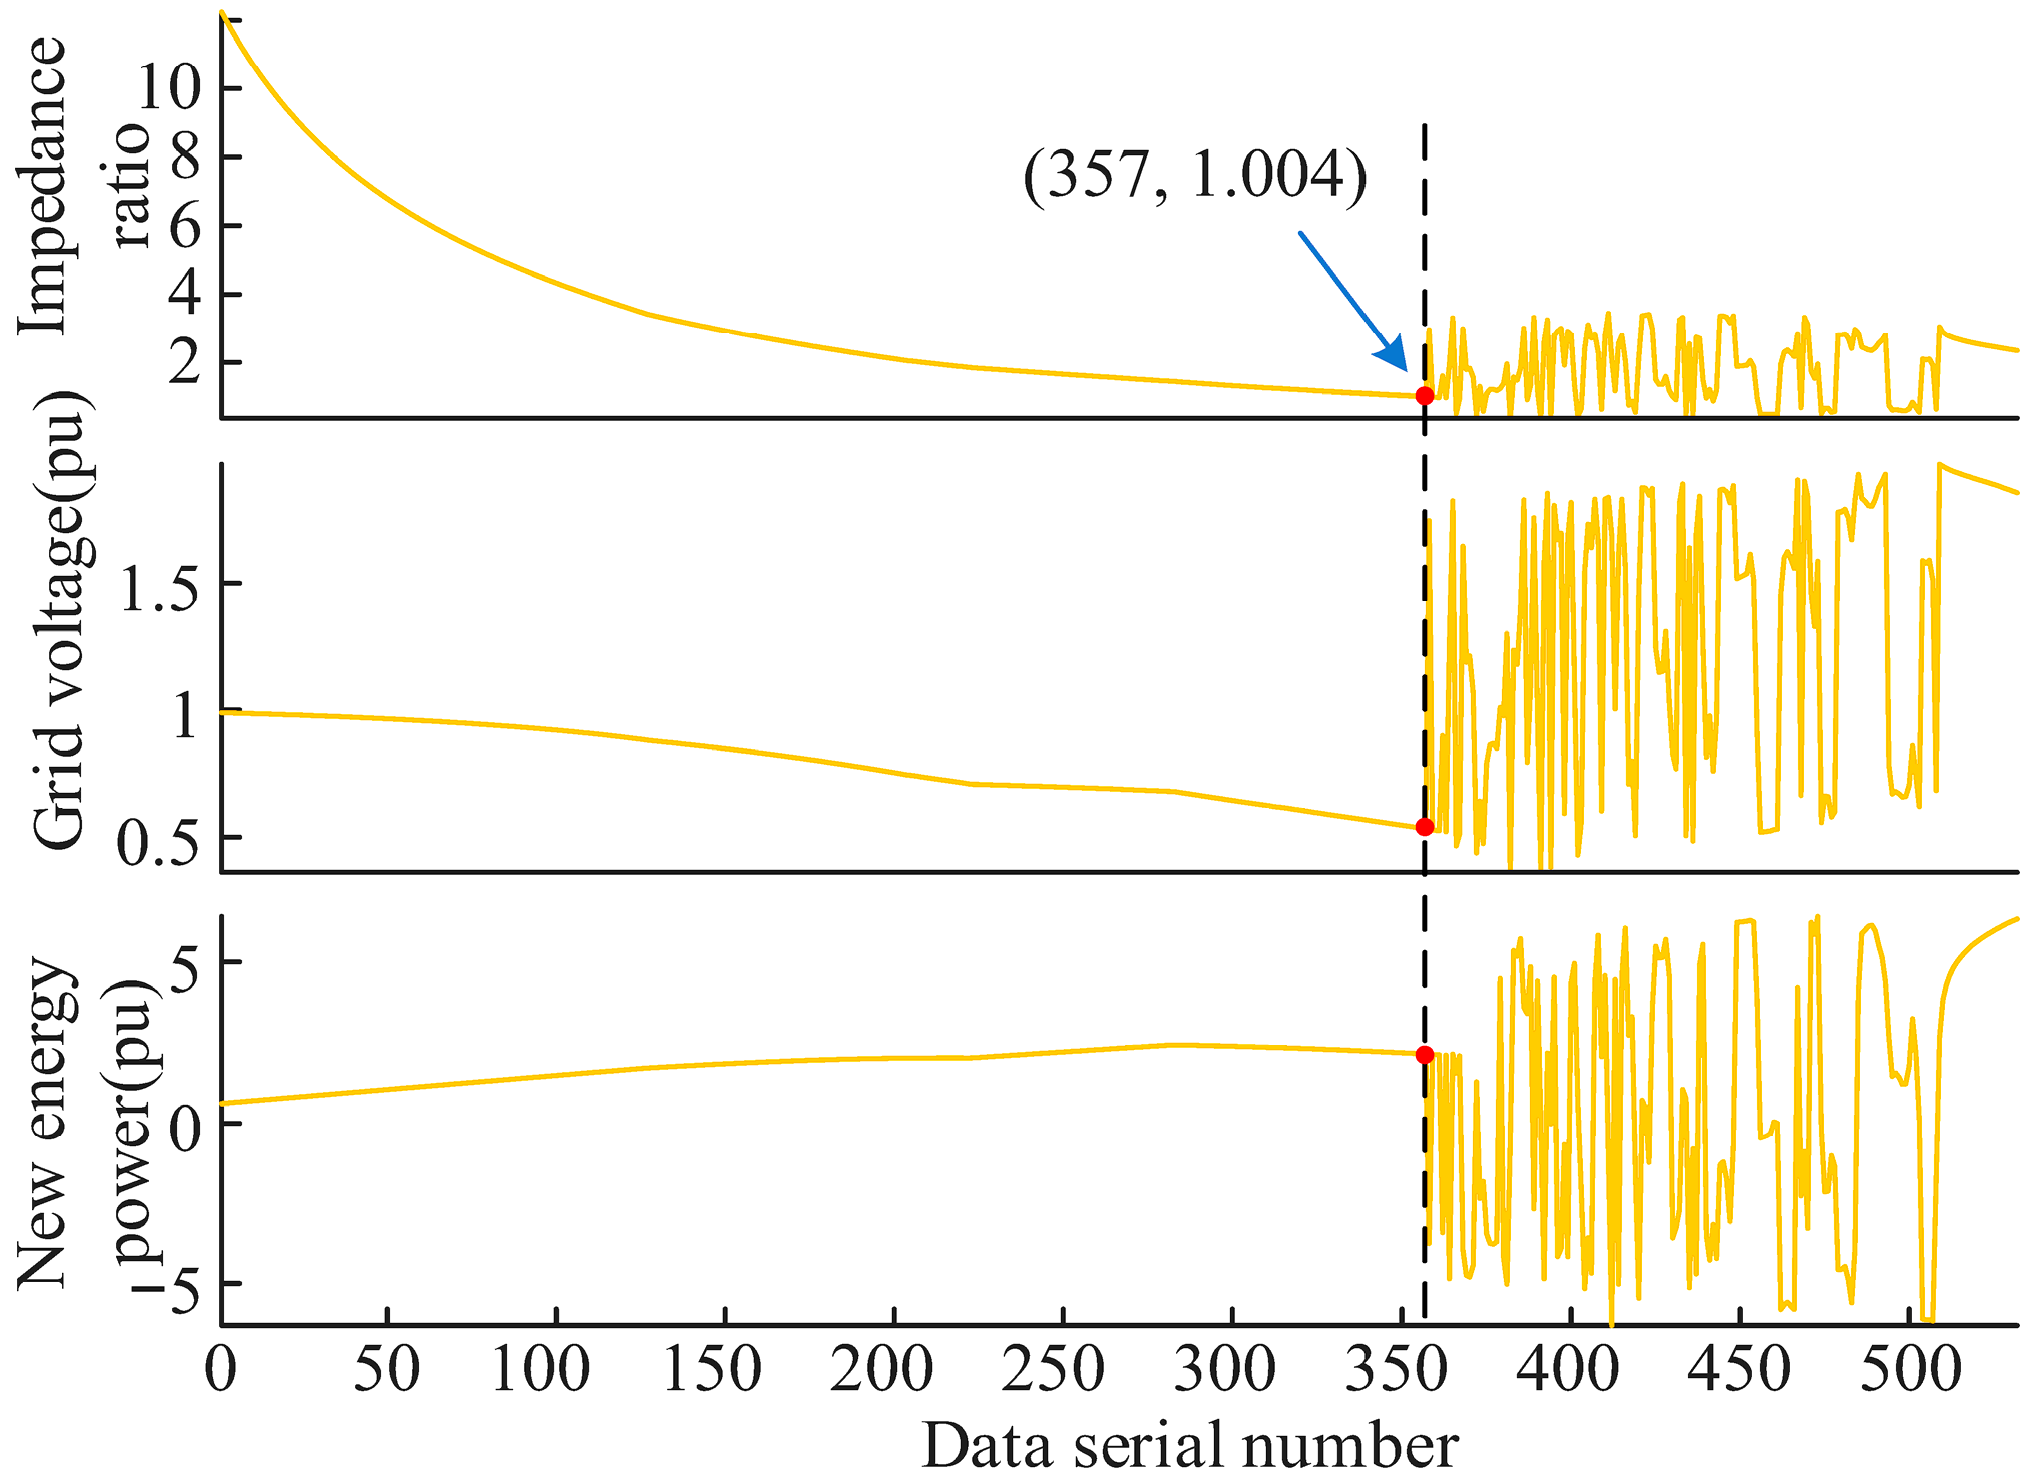
By increasing the power output of the first new energy field station, the real-time grid-connected impedance and grid-connected voltage of this DC system and the new energy cluster are recorded, and the relevant results are shown in
Figure 18.
From
Figure 18, as the new energy cluster power increases, the equivalent impedance ratio and the grid-connected voltage both decrease gradually. At 137 data points, the impedance ratio is about 1. After this point, both the grid voltage and the new energy cluster power are in a destabilized oscillation state. This shows that the proposed impedance index is in a static voltage stabilization state when it is greater than 1, and in a destabilization state otherwise. Therefore, the equivalent impedance from the new energy or HVDC system should be increased as much as possible to keep the impedance ratio at a high level under normal working conditions.
Through the above results, it is proved that the equivalent impedance meets the basic circuit principle and can be used for traditional current calculation, and the suggested scale is able to precisely reflect the robustness of the system support. It should be noted that the proposed index is applicable to both sending and receiving systems. For reasons of space, the case of the receiving-end grid is not illustrated in this paper’s calculations. For the receiving-end grid, it is sufficient to take a negative sign for the DC power Pd in all cases.
4.3. Transient Overvoltage Analysis
The strength index proposed in this paper is applicable not only to the static voltage support strength but also to the transient overvoltage analysis. Here, the output of the new energy source will be changed to alter its own impedance, and the influence of its impedance change on the transient overvoltage of AC faults will be further analyzed. The sending end system’s simulation model, as depicted in
Figure 15, is set up, and the output power of the new energy unit is continuously changed, which results in a corresponding alteration to the equivalent impedance of the new energy and HVDC.
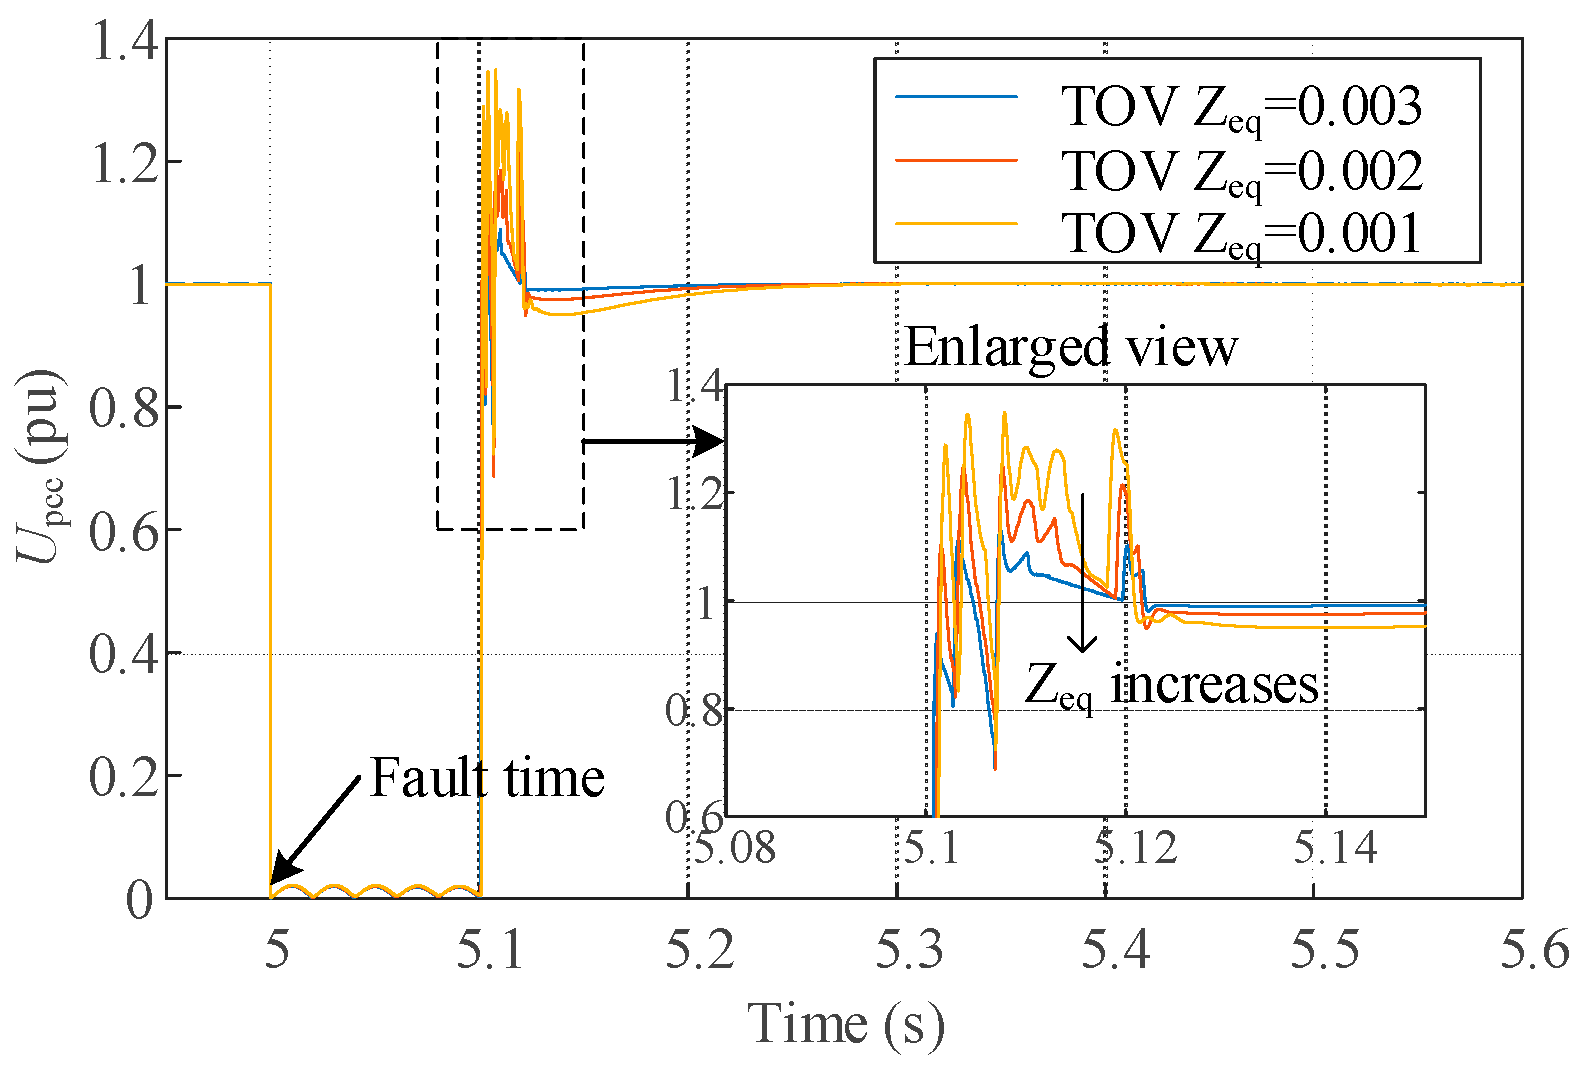
Figure 19 gives the transient voltage time-series curve after an AC fault occurs in the system under different equivalent impedances. According to the enlarged subplot, it can be seen that the peak transient overvoltage increases gradually with the decrease in the equivalent impedance. This proves the correctness of the aforementioned theory that the transient overvoltage is negatively correlated with the equivalent impedance.
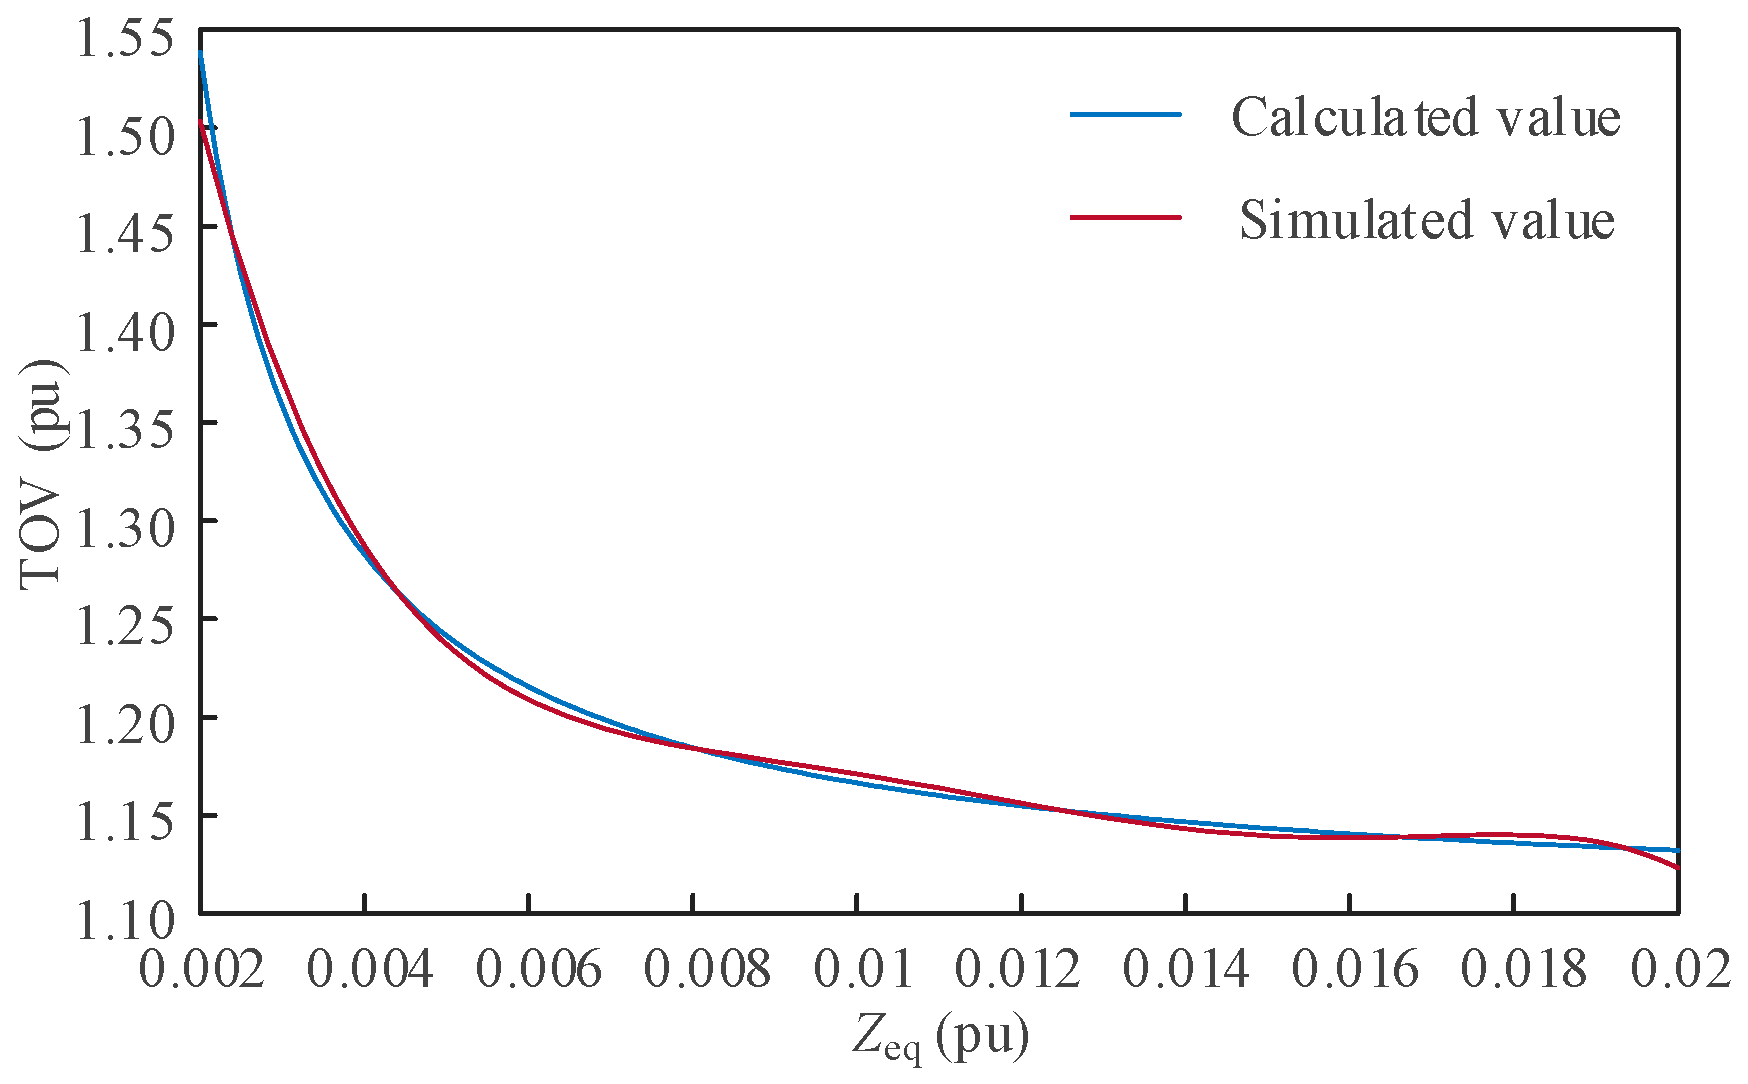
In order to better investigate the variation in the peak transient overvoltage with the equivalent impedance,
Figure 20 shows the variation curve of the transient overvoltage of the system along with the equivalent impedance. The two curves represent the results of theoretical calculation and simulation, respectively, and there is a negligible discrepancy between them, which means that the theoretical analysis and the actual simulation results are proven to coincide.
5. Conclusions
In order to address the lack of a definition of system strength and an assessment method for sending/receiving systems containing a significant percentage of new energy and DC access, this paper proposes a strength measurement index founded upon the principle of the impedance amplitude ratio. The DC system and the new energy unit are equivalent in terms of impedance, the connection between the equivalent impedance and the system impedance after the parallel connection of the two is analyzed, and the mapping connection between the support strength and the ratio that is dependent on the equivalent impedance and the system impedance is established. Since the impedance ratio index proposed in this paper is obtained by real-time power calculation, the index also changes in real time. It can dynamically reflect the exact operating point of the system in real time and issue a timely warning when there is an insufficient stability margin. After studying the above issues in theory and checking the results in simulation, the following conclusions can be obtained:
The equivalent impedance of the DC system and the new energy source is the same as impedance in the traditional sense, which satisfies the basic principle of the circuit and can be used for current calculation. When the DC system is fed, the equivalent impedance is negative, and vice versa.
The proposed equivalent impedance ratio can reflect the system’s voltage support strength, which is applicable to both the feeder system and the receiver system.
This index can accurately reflect the system’s static voltage stability margin; the closer its value is to 1, the more unstable the system is.
To guarantee that the transient overvoltage of the sending/receiving system does not exceed 1.3 pu after the occurrence of an AC fault, it is necessary that the rated parallel impedance of the new energy and DC systems is no less than 2.56 times the system impedance.
Analysis shows that the power of the new energy and DC system should be within a certain safety domain, and the difference between the two should not exceed a certain threshold; otherwise, the system will face the risk of destabilization.
Author Contributions
Conceptualization, B.W. and D.Z.; methodology, Y.K.; software, Q.Z.; validation, H.L. and Z.L.; formal analysis, Y.Q.; investigation, Y.K.; resources, B.W. and Z.L.; data curation, Q.Z.; writing—original draft preparation, B.W. and D.Z.; writing—review and editing, H.L.; visualization, Y.Q.; supervision, Q.Z.; project administration, Z.L. All authors have read and agreed to the published version of the manuscript.
Funding
This research was funded by the State Grid Shaanxi Electric Power Co., Ltd. (grant number SGSN0000DKJS2404793).
Data Availability Statement
The data presented in this study will be available when required.
Conflicts of Interest
Authors Biyang Wang, Yu Kou, and Qinglei Zhang were employed by the Dispatch and Control Center of the State Grid Shaanxi Electric Power Company. Authors Dehai Zhang, Haibo Li, Zongxiang Lu, and Ying Qiao were employed by the Sichuan Energy Internet Research Institute, Tsinghua University. The funders had no role in the study design, data collection and analysis, decision to publish, or preparation of the manuscript.
References
- Xiao, H.; Duan, X.; Zhang, Y.; Li, Y. Analytically Assessing the Effect of Strength on Temporary Overvoltage in Hybrid Multi-Infeed HVdc Systems. IEEE Trans. Power Electron. 2022, 37, 2480–2484. [Google Scholar] [CrossRef]
- Ni, X.; Gole, A.M.; Zhao, C.; Guo, C. An Improved Measure of AC System Strength for Performance Analysis of Multi-Infeed HVdc Systems Including VSC and LCC Converters. IEEE Trans. Power Deliv. 2018, 33, 169–178. [Google Scholar] [CrossRef]
- Yamada, Y.; Tsusaka, A.; Nanahara, T.; Yukita, K. A Study on Short-Circuit-Ratio for an Inverter-Based Resource with Power-Voltage Curves. IEEE Trans. Power Syst. 2024, 39, 6076–6086. [Google Scholar] [CrossRef]
- Kim, J.-K.; Kang, J.; Shim, J.W.; Kim, H.; Shin, J.; Kang, C. Dynamic Performance Modeling and Analysis of Power Grids with High Levels of Stochastic and Power Electronic Interfaced Resources. Proc. IEEE 2023, 111, 854–872. [Google Scholar] [CrossRef]
- Shi, Q.; Dong, W.; Wang, G.; Ma, J.; Wang, C.; Guo, X. Grid Strength Assessment Method for Evaluating Small-Signal Synchronization Stability of Grid-Following and Grid-Forming Converters Integrated Systems. J. Mod. Power Syst. Clean Energy 2025, 13, 55–65. [Google Scholar] [CrossRef]
- Luo, C.; Liao, S.; Chen, Y.; Huang, M. Quantitative Transient Stability Analysis for Parallel Grid-Tied Grid-Forming Inverters Considering Reactive Power Control. IEEE Trans. Power Electron. 2025, 40, 4780–4786. [Google Scholar] [CrossRef]
- Liu, Y.; Chen, Y.; Xin, H.; Tu, J.; Zhang, L.; Song, M. System Strength Constrained Grid-Forming Energy Storage Planning in Renewable Power Systems. IEEE Trans. Sustain. Energy 2025, 16, 981–994. [Google Scholar] [CrossRef]
- Yu, L.; Sun, H.; Xu, S.; Zhao, B.; Zhang, J. A Critical System Strength Evaluation of a Power System with High Penetration of Renewable Energy Generations. CSEE J. Power Energy Syst. 2022, 8, 710–720. [Google Scholar] [CrossRef]
- Yu, L.; Xu, S.; Sun, H.; Zhao, B.; Wu, G.; Zhou, X. Multiple Renewable Short-Circuit Ratio for Assessing Weak System Strength with Inverter-Based Resources. CSEE J. Power Energy Syst. 2024, 10, 2271–2282. [Google Scholar] [CrossRef]
- Wang, G.; Huang, Y.; Xu, Z. Voltage Stiffness for Strength Evaluation of VSC-Penetrated Power Systems. IEEE Trans. Power Syst. 2024, 39, 6119–6122. [Google Scholar] [CrossRef]
- Henderson, C.; Egea-Alvarez, A.; Kneuppel, T.; Yang, G.; Xu, L. Grid Strength Impedance Metric: An Alternative to SCR for Evaluating System Strength in Converter Dominated Systems. IEEE Trans. Power Deliv. 2024, 39, 386–396. [Google Scholar] [CrossRef]
- Australian Energy Market Operator. System Strength Requirements Methodology System Strength Requirements & Fault Level Shortfalls; Australian Energy Market Operator: Melbourne, Australia, 2018. [Google Scholar]
- Australian Energy Market Operator. System Strength in the NEM Explained; Australian Energy Market Operator: Melbourne, Australia, 2020. [Google Scholar]
- Gu, H.J.; Yan, R.F.; Saha, T.P. Review of system strength and inertia requirements for the national electricity market of Australia. CSEE J. Power Energy Syst. 2019, 5, 295–305. [Google Scholar] [CrossRef]
- Gu, Y.J.; Green, T.C. Power system stability with a high penetration of inverter-based resources. Proc. IEEE 2023, 111, 832–853. [Google Scholar] [CrossRef]
- AEMO. System Strength Impact Assessment Guidelines; AEMO: Melbourne, Australia, 2023. [Google Scholar]
- Kim, Y.-K.; Lee, G.-S.; Kim, C.-K.; Moon, S.-I. An Improved AC System Strength Measure for Evaluation of Power Stability and Temporary Overvoltage in Hybrid Multi-Infeed HVDC Systems. IEEE Trans. Power Deliv. 2022, 37, 638–649. [Google Scholar] [CrossRef]
- de Toledo, P.F.; Bergdahl, B.; Asplund, G. Multiple infeed short circuit ratio-aspects related to multiple HVDC into one AC network. In Proceedings of the 2005 IEEE/PES Transmission & Distribution Conference & Exposition: Asia and Pacific, Dalian, China, 18 August 2005; pp. 1–6. [Google Scholar] [CrossRef]
- Lee, D.H.A.; Andersson, G. An equivalent single-infeed model of multi-infeed HVDC systems for voltage and power stability analysis. IEEE Trans. Power Deliv. 2016, 31, 303–312. [Google Scholar] [CrossRef]
- Schmall, J.; Huang, S.H.; Li, Y.; Billo, J.; Conto, J.; Zhang, Y. Voltage stability of large-scale wind plants integrated in weak networks: An ERCOT case study. In Proceedings of the 2015 IEEE Power & Energy Society General Meeting, Denver, CO, USA, 26–30 July 2015; pp. 1–5. [Google Scholar] [CrossRef]
- GE Energy Consulting. Minnesota Renewable Energy Integration and Transmission Study: Final Report; GE Energy Consulting: Schenectady, NY, USA, 2014. Available online: https://mn.gov/commerce-stat/pdfs/mrits-report-2014.pdf (accessed on 31 October 2014).
- Bech, J. Connection of Wind Farms to Weak AC Networks; CIGRE: Paris, France, 2016. [Google Scholar]
- Wu, D.; Li, G.G.; Javadi, M.; Malyscheff, A.M.; Hong, M.G.; Jiang, J.N. Assessing impact of renewable energy integration on system strength using site-dependent short circuit ratio. IEEE Trans. Sustain. Energy 2018, 9, 1072–1080. [Google Scholar] [CrossRef]
- Xia, C.; Li, X.; Li, S.; Zhou, B. Definition and Analysis of Receiving System Voltage Support Strength Factor. IEEE Access 2019, 7, 134206–134214. [Google Scholar] [CrossRef]
- Liu, Y.; Lai, X.; Xin, H.; Zhu, J.; Huang, L.; Xia, S. Generalized Short-Circuit Ratio Based Distributed Real-Time Stability Assessment of Renewable Power Systems. IEEE Trans. Power Syst. 2023, 38, 5953–5956. [Google Scholar] [CrossRef]
Figure 1.
New energy single-unit grid-connected system.
Figure 1.
New energy single-unit grid-connected system.
Figure 2.
Equivalent circuit of single-fed system.
Figure 2.
Equivalent circuit of single-fed system.
Figure 3.
Schematic diagram of equivalent impedance.
Figure 3.
Schematic diagram of equivalent impedance.
Figure 4.
Effect of new energy unit power on equivalent impedance.
Figure 4.
Effect of new energy unit power on equivalent impedance.
Figure 5.
Power domain view.
Figure 5.
Power domain view.
Figure 6.
Impedance domain view.
Figure 6.
Impedance domain view.
Figure 7.
Change in impedance ratio due to fluctuations in new energy.
Figure 7.
Change in impedance ratio due to fluctuations in new energy.
Figure 8.
Relationship between TOV and impedance of external equipment.
Figure 8.
Relationship between TOV and impedance of external equipment.
Figure 9.
Impedance safety domains with different system impedances.
Figure 9.
Impedance safety domains with different system impedances.
Figure 10.
Stability margin calculation process.
Figure 10.
Stability margin calculation process.
Figure 11.
Comparison of equivalent impedance.
Figure 11.
Comparison of equivalent impedance.
Figure 12.
Effect of new energy power on equivalent impedance.
Figure 12.
Effect of new energy power on equivalent impedance.
Figure 13.
Power–voltage–impedance variation curve (system 1).
Figure 13.
Power–voltage–impedance variation curve (system 1).
Figure 14.
Arithmetic system 1.
Figure 14.
Arithmetic system 1.
Figure 15.
Arithmetic system 2.
Figure 15.
Arithmetic system 2.
Figure 16.
Power–voltage–impedance variation curve (system 2).
Figure 16.
Power–voltage–impedance variation curve (system 2).
Figure 17.
New energy cluster transmission system.
Figure 17.
New energy cluster transmission system.
Figure 18.
Power–voltage–impedance variation curve (system 3).
Figure 18.
Power–voltage–impedance variation curve (system 3).
Figure 19.
Transient voltage curves with different equivalent impedances.
Figure 19.
Transient voltage curves with different equivalent impedances.
Figure 20.
Variation curve of TOV with equivalent impedance.
Figure 20.
Variation curve of TOV with equivalent impedance.
Table 1.
Application of short-circuit ratios in different studies.
Table 1.
Application of short-circuit ratios in different studies.
| Reference | [17] | [18] | [19] | [20] | [21] | [22] |
|---|
| Application Scenario | HVDC | HVDC | HVDC | REG | REG | REG |
| Disclaimer/Publisher’s Note: The statements, opinions and data contained in all publications are solely those of the individual author(s) and contributor(s) and not of MDPI and/or the editor(s). MDPI and/or the editor(s) disclaim responsibility for any injury to people or property resulting from any ideas, methods, instructions or products referred to in the content. |
© 2025 by the authors. Published by MDPI on behalf of the International Institute of Knowledge Innovation and Invention. Licensee MDPI, Basel, Switzerland. This article is an open access article distributed under the terms and conditions of the Creative Commons Attribution (CC BY) license (https://creativecommons.org/licenses/by/4.0/).


