1. Introduction
Quality control is an important aspect of the manufacturing sector, which guarantees that products are as stated and fulfill the needs of consumers. The practice entails a combination of processes and methods employed to track, sustain, and enhance product quality along the whole course of manufacturing. The role of quality control cannot be overstated, as it has a direct influence on efficiency in operations, product dependability, and customer satisfaction [
1]. Traditional defect detection methods have often depended on manual inspections, which are labor-intensive and prone to human error. In response to these limitations, manufacturing systems are increasingly implementing computerized quality control solutions that utilize artificial intelligence (AI) and machine learning (ML) to improve the accuracy and speed of inspections. Notably, the use of computer vision, especially through deep learning, has become central to automated quality assurance. This transition has significantly enhanced inspection accuracy and efficiency, which are essential for maintaining high manufacturing standards. The integration of these advanced technologies not only streamlines defect detection processes but also reduces operational costs, ultimately leading to improved product quality and customer satisfaction [
2]. While surface defect detection has been extensively studied in industrial settings, the automatic identification of geometric anomalies particularly in circular mechanical parts remains a relatively underexplored domain. Existing approaches often rely on perfect circular assumptions or are confined to lens and PCB inspection, without considering manufacturing-induced variations such as roundness deviation, circularity error, diameter deviation, and positional (concentricity) error. Early detection of anomalies, often caused by equipment malfunctions or material defects, is crucial for mitigating financial losses and operational disruptions [
3]. Our study addresses this gap by introducing a real-time defect detection framework that captures irregularities and evaluates geometric deviations in circular parts. This system, optimized for lightweight deployment on edge devices, offers a novel and practical solution for defect detection in circular features of manufactured parts by exploring the practical applications of deploying machine learning algorithms on Raspberry Pi 5 for efficient defect detection in various industrial settings. The integration of lightweight models is crucial for effective deployment on resource-constrained devices like the Raspberry Pi 5. Our approach evaluates models like EfficientNetB3, ResNet50, and MobileNetV3 with a focus on establishing a robust baseline for real-time deployment.
The objective is to enhance the inline quality control process in manufacturing by predicting future product quality, specifically targeting geometric defects like diameter inconsistency and positional errors. This approach aims to enable early adjustments, minimize scrap production, and reduce downtime in the production system. The goal is to develop a real-time detection system for irregularities in geometric features of metal components using deep learning models to improve production capabilities.
The main goals are as follows: (1) develop and evaluate a real-time visual defect detection model can be adapted for industrial applications, with a specific focus on identifying defects in geometrical features such as holes in metal components, (2) improve applicability and scalability of automated quality control in manufacturing environments, (3) address challenges in defect detection, such as dataset imbalance, overfitting, and the ability to generalize to unseen defect types, while ensuring the system is practical for real-time use.
Despite the significant progress achieved in visual defect detection using deep learning, most of the existing research focuses predominantly on surface anomalies such as cracks, discolorations, and pits. While these approaches have demonstrated remarkable accuracy and efficiency, especially when paired with lightweight architecture for real-time applications, they often overlook geometric deviations, particularly in circular or mechanically critical components. Geometric defects such as diameter inconsistency and positional errors are equally vital in quality control, especially in precision manufacturing contexts like automotive or aerospace industries. However, studies that explicitly address these types of geometric anomalies remain limited in scope and rarely extend beyond controlled experimental setups. Moreover, the deployment of models capable of detecting such geometric faults in real-time on resource-constrained platforms, such as the Raspberry Pi, is still in its infancy. This gap underscores the need for geometric analysis in a unified framework, optimized for edge deployment.
In parallel with traditional and CNN-based defect detection systems, recent advancements have introduced novel methodologies such as open-set recognition, compound fault diagnosis using domain adaptation and reinforcement learning, and biologically inspired models like Spiking Neural Networks (SNNs). These approaches have shown significant potential in handling complex or previously unseen defects by leveraging temporal encoding, domain alignment, and adaptive learning strategies [
4,
5,
6,
7,
8,
9]. While our current study emphasizes lightweight CNN deployment on edge devices for detecting geometric irregularities in circular components, these recent developments represent promising directions for enhancing the robustness and adaptability of future defect recognition systems in industrial applications.
The present study aims to bridge this gap by proposing a lightweight, real-time visual inspection system that quantifies critical geometric deviations in circular geometries of components, offering a robust solution for manufacturing.
2. Related Work
In manufacturing environments, features can be derived from various sources, including sensor data, images, and historical defect records. However, identifying the most relevant features that contribute to effective classification remains a complex task. The quality of a product may be influenced by different external factors during manufacturing processes, e.g., temperature, humidity, and wear of machines [
10]. Understanding how these variables impact defect detection models and incorporating them into the classification process can lead to more stable and trustworthy systems. Real-time visual defect detection has garnered significant attention in recent years, driven by the need for improved quality assurance in Industry 4.0 manufacturing systems. Traditional inspection methods, largely dependent on human labor, are increasingly being replaced by automated systems that leverage computer vision and deep learning to detect defects with high accuracy and consistency.
Convolutional Neural Networks (CNNs) have emerged as a cornerstone technology for defect detection in various industrial applications, relying on their capacity to learn intricate features from image data automatically. The effectiveness of CNNs is significantly evidenced in the domain of tire defect detection, where they outperform traditional methods by adapting to the diverse characteristics of images. Wang et al. [
11] demonstrated that a CNN could self-learn key features critical for identifying different defect types in tire imagery, achieving notable accuracy through the ensemble of multiple parallel networks. In broader industrial contexts, CNNs have been successfully deployed for detecting metallic surface defects, as illustrated by Tao et al. [
12]. Their study highlighted the versatility of CNNs, including adaptations such as multi-scale pyramidal pooling networks, which can handle varying input image sizes, enhancing their utility in real-world applications [
12]. Moreover, recent advancements indicate the progress of CNNs in tackling both uniform and non-uniform defects, such as those found in sheet metal stamping. Singh et al. [
13] specifically demonstrated the effectiveness of deep learning architectures in detecting split defects, showcasing how tailored CNN approaches can yield superior results over conventional techniques. This adaptability highlights the potential for CNNs to transform defect detection processes across diverse manufacturing environments.
ResNet50, a deep residual learning framework, has significantly advanced the field of visual defect detection in manufacturing by enabling the extraction of intricate features from images through its innovative architecture. Introduced by Kaiming He et al. [
14], ResNet50 utilizes skip connections or residual connections to facilitate the training of very deep networks, addressing the vanishing gradient problem that often hampers the performance of traditional deep learning models [
15]. This architecture has been widely adopted due to its ability to achieve high accuracy with relatively fewer parameters compared to other models, making it suitable for various applications, including industrial defect detection. For instance, in the study by Konovalenko et al. [
16], ResNet50 was employed to classify images of steel surfaces with defects, achieving an impressive accuracy of 96.91%. As noted by Borade [
15] while ResNet50 can achieve high accuracy, its performance is heavily reliant on the quality and quantity of training data. He et al. [
17] highlighted the adaptability of ResNet to various datasets, instructing ResNet to generate feature maps and combining them into a multi-level feature fusion network for more accurate defect localization on steel plates. This fusion of features enhances the model’s ability to discern distinct defects within complex images, a critical requirement in industrial defect detection. Zhang et al. [
18] proposed a novel approach for detecting surface defects in hot-rolled steel, using attention mechanisms and dilated convolution to improve precision and generalization. Their two-stage framework, with ResNet50 as the backbone, significantly enhanced feature extraction and detection accuracy. On the NEU-DET dataset, their model achieved a mean Average Precision (mAP) of 81.79%, surpassing several mainstream object detection networks. However, certain defect types remained difficult to detect, raising ongoing concerns in steel manufacturing quality control.
EfficientNet, combined with the Lion optimizer, has been effective in the classification of spandex defects with an accuracy of 94.38% and hence has potential for practical applications [
19]. The use of EfficientNet in conjunction with novel techniques such as augmentation and transfer learning also shows promise, as authors have observed that these integrations lead to better generalization capabilities in detecting defects on various surfaces [
20]. Chen et al. utilized a modified version of EfficientNet as the backbone of their detection model to capture multi-scale features necessary for identifying defects in insulator components [
21]. Tang et al. [
22] proposed an improved defect detection model, EfficientNet-PSO, for identifying cracks in automobile steel forgings. The model combines EfficientNet with a Feature Pyramid Network (FPN), attention mechanisms, and an enhanced IoU calculation to improve accuracy and convergence. It achieved an mAP of 95.69% and an F1-score of 0.94 with 1.86B FLOPs, outperforming five other deep learning models. A custom image acquisition platform was also developed to validate the model in real-world conditions.
Hang et al. [
23] proposed a lightweight real-time defect detection network for sanitary ceramics using MobileNetV3 with a multi-layer feature pyramid and a hybrid anchor-free/RPN approach. The model achieved a 22.9% boost in speed, a 35.0% increase in average precision, and reduced memory usage by 8.4%, making it suitable for deployment on low-resource industrial devices. Xia et al. [
24] proposed an improved MobileNetV3 with a hybrid attention mechanism for electronic component recognition. It achieved 95.07% accuracy while reducing parameters by 20%, enabling efficient real-time deployment and addressing manual inspection inefficiencies in electronics manufacturing. The lightweight nature of MobileNet enables deployment on platforms with limited processing power, such as Raspberry Pi, without compromising real-time operational capabilities. Moreover, adaptations of MobileNet like the MobileNet-SSD algorithm have shown promise in automotive applications, specifically in detecting paint defects. Ma et al. [
25] reported the effectiveness of a lightweight MobileNet-v3 architecture in detecting small target defects within bearing datasets, demonstrating notable improvements in accuracy while reducing the model’s computational load. This efficiency is critical for applications in high-speed environments, such as assembly lines, where timely defect detection can significantly reduce waste and enhance quality control [
26]. Additionally, Q. Yu [
27] showcased a new lightweight model, MobileDDD-Net, which integrates MobileNet for chip defect detection, highlighting MobileNet’s adaptability and efficiency in diverse scenarios. Architecture’s pruning and quantization techniques further optimize real-time performance, providing a robust solution that remains responsive in demanding industrial settings.
Recent advancements in defect recognition have introduced biologically inspired models and adaptive learning frameworks that extend beyond traditional CNN-based approaches. For instance, Spiking Neural Networks (SNNs), considered third-generation neural models, offer temporal encoding and sparse event-based processing, making them well-suited for capturing compound mechanical faults. Wang et al. [
4] demonstrated that integrating continuous time–frequency gradients with SNNs significantly enhances their ability to distinguish subtle and overlapping fault patterns in noisy environments. Similarly, Xuan et al. [
7] developed a Wavelet Gradient Integrated SNN for bearing fault detection, achieving higher accuracy than conventional CNNs.
In the context of compound fault diagnosis, domain adaptation and reinforcement learning techniques are gaining traction. Wang et al. [
6] proposed a Domain Reinforcement Feature Adaptation framework that aligns latent representations of single and compound faults, while Wang et al. [
5] introduced the RAOS framework, which leverages adversarial reinforcement learning to recognize complex fault combinations using only single-fault training data.
Another emerging challenge in real-world deployment is open-set recognition, where unseen defect types may appear during inference. Li et al. [
9] addressed this with a dual-adversarial structure and Selective Momentum Contrast, improving generalization across known and unknown classes.
The advancements in lightweight architectures like EfficientNet and MobileNet are pivotal for enhancing defect detection capabilities on resource-constrained devices such as the Raspberry Pi, ensuring efficient performance in real-time applications. Ameen et al. [
28] optimized deep learning models for deployment on Raspberry Pi by applying pruning, quantization, and TensorFlow Lite conversion techniques. Their evaluation of custom CNNs and pre-trained models like MobileNetV2 and ResNet50 showed that MobileNet-based models offered the best trade-off between accuracy and speed, while Arm NN Delegate achieved the lowest inference latency, making the approach suitable for real-time edge applications.
Edge deployment of convolutional neural networks (CNNs) remains a challenging frontier in real-time AI applications. Paul [
29] extensively discusses the difficulties encountered when implementing deep learning models such as MobileNet-V2 and ResNet-50 on memory-constrained and low-power devices, particularly in the context of real-time facemask detection. This issue is directly relevant to industrial defect detection systems, where achieving real-time performance on devices like the Raspberry Pi necessitates a delicate balance between accuracy, model size, and inference speed. A major gap identified in Paul’s work is the lack of optimized deployment methodologies tailored for edge environments. While lightweight models show promise, the study reveals ongoing challenges in minimizing disk footprint and computational load without sacrificing classification metrics such as precision, recall, and F1-score. The challenge of deploying deep learning models on constrained edge devices is not unique to industrial settings; it spans critical domains such as healthcare, where the need for real-time, low-latency AI is equally vital.
In this context, Tesfai et al. [
30] present a compelling study focused on continuous health monitoring via wearable sensors, where deep CNNs are used to classify Electrocardiogram (ECG) signals in real time. Their work exposes significant barriers posed by the memory and computational demands of traditional Deep Neural Networks (DNNs), which often inhibit practical deployment in time-sensitive applications. To overcome these limitations, Tesfai et al. [
30] propose a lightweight ShuffleNet-based CNN, optimized through innovative techniques such as focal loss, sliding window preprocessing, and variable stride augmentation to address class imbalance. These strategies not only improve classification accuracy but also drastically reduce the model’s resource footprint, offering critical lessons for similar challenges in industrial defect detection systems, where imbalanced datasets and noisy inputs are common.
While the current study focuses on the deployment of lightweight CNNs for edge-based defect detection, we recognize these innovations as important future directions for extending the adaptability and resilience of defect recognition systems in industrial applications.
3. Materials and Methods
The study was carried out with an image dataset captured from industrial metal plate components under varied environmental conditions presented in
Table 1. The dataset comprises images with various defects that were created. The dataset collection process was set based on a machine vision system consisting of a 0.35 megapixel (MP) industrial camera. The images were captured using the Wenglor B50M012 industrial smart camera (Tettnang, Germany), which possesses a monochrome image sensor. Images were captured with the aid of an external white light with a color temperature of 5000 K, which is a simulation of daylight and offers stable light for image taking. The camera lens settings are manually varied to ensure that the dataset images have different conditions used for training. The exposure times exhibited considerable variance, spanning from 120 µs to 20,000 µs, thereby influencing image brightness and potentially affecting the model’s defect detection efficacy. Additional parameters, such as gain ranging from 16 to 30 and field of view (FOV), also played a role in generating subtle disparities among the varied conditions. These variations were deliberately implemented to replicate diverse environmental and lighting scenarios representative of the manufacturing context.
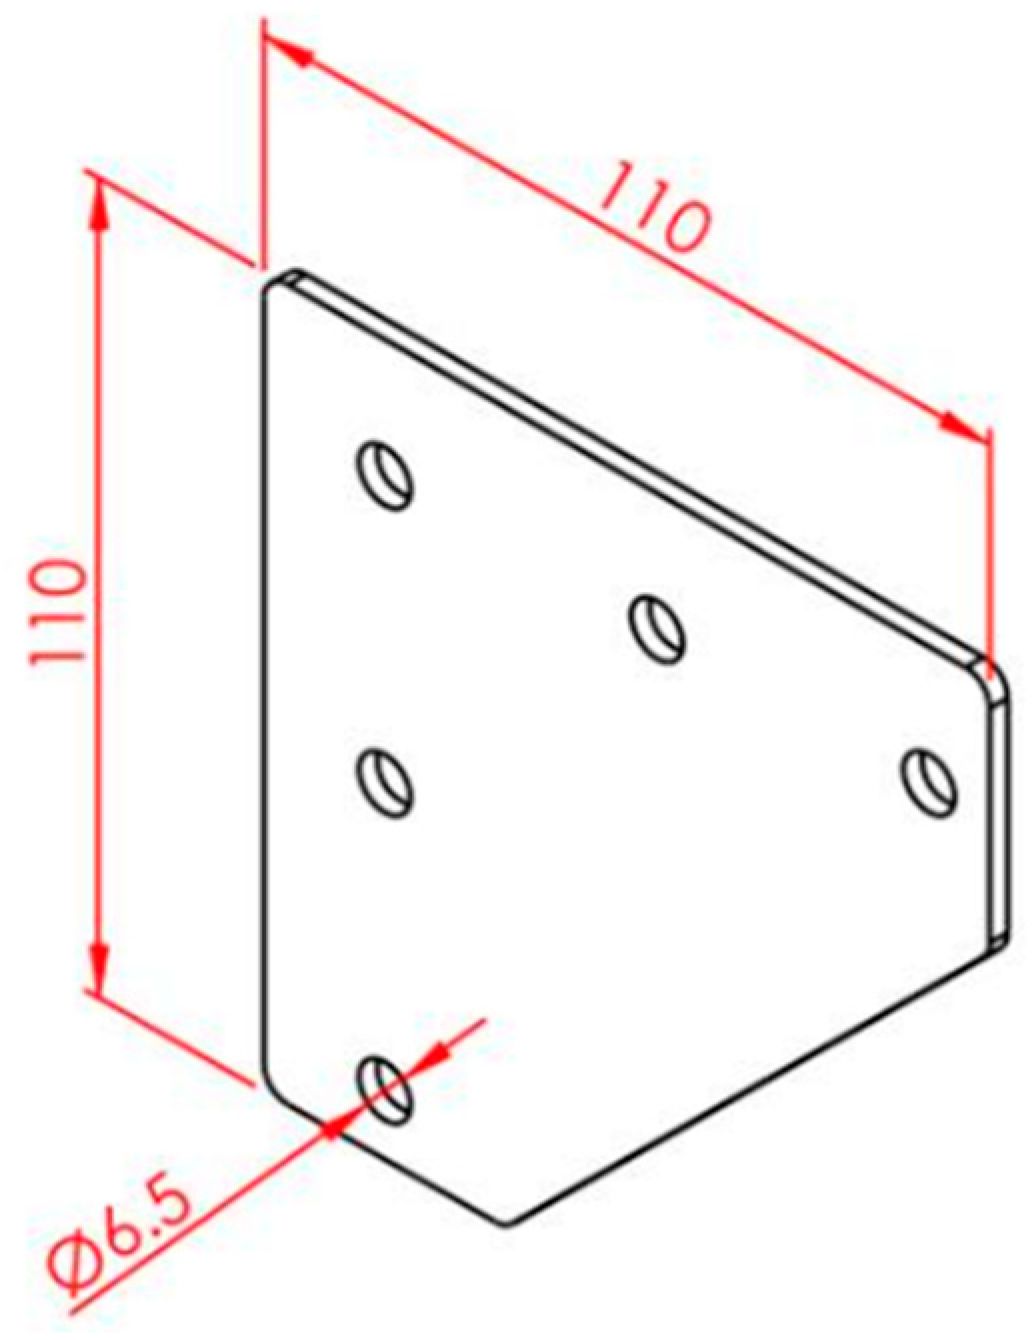
Figure 1 illustrates a metal component that resembles a triangular metal plate featuring drilled holes, which is frequently utilized in industrial settings, such as in the manufacture of hinges. The triangular plate boasts equal sides of 110 mm, indicating it is both compact and robust, suitable for supporting the weight and movement. Its symmetrical dimensions are crucial for even distributing the mechanical forces encountered.
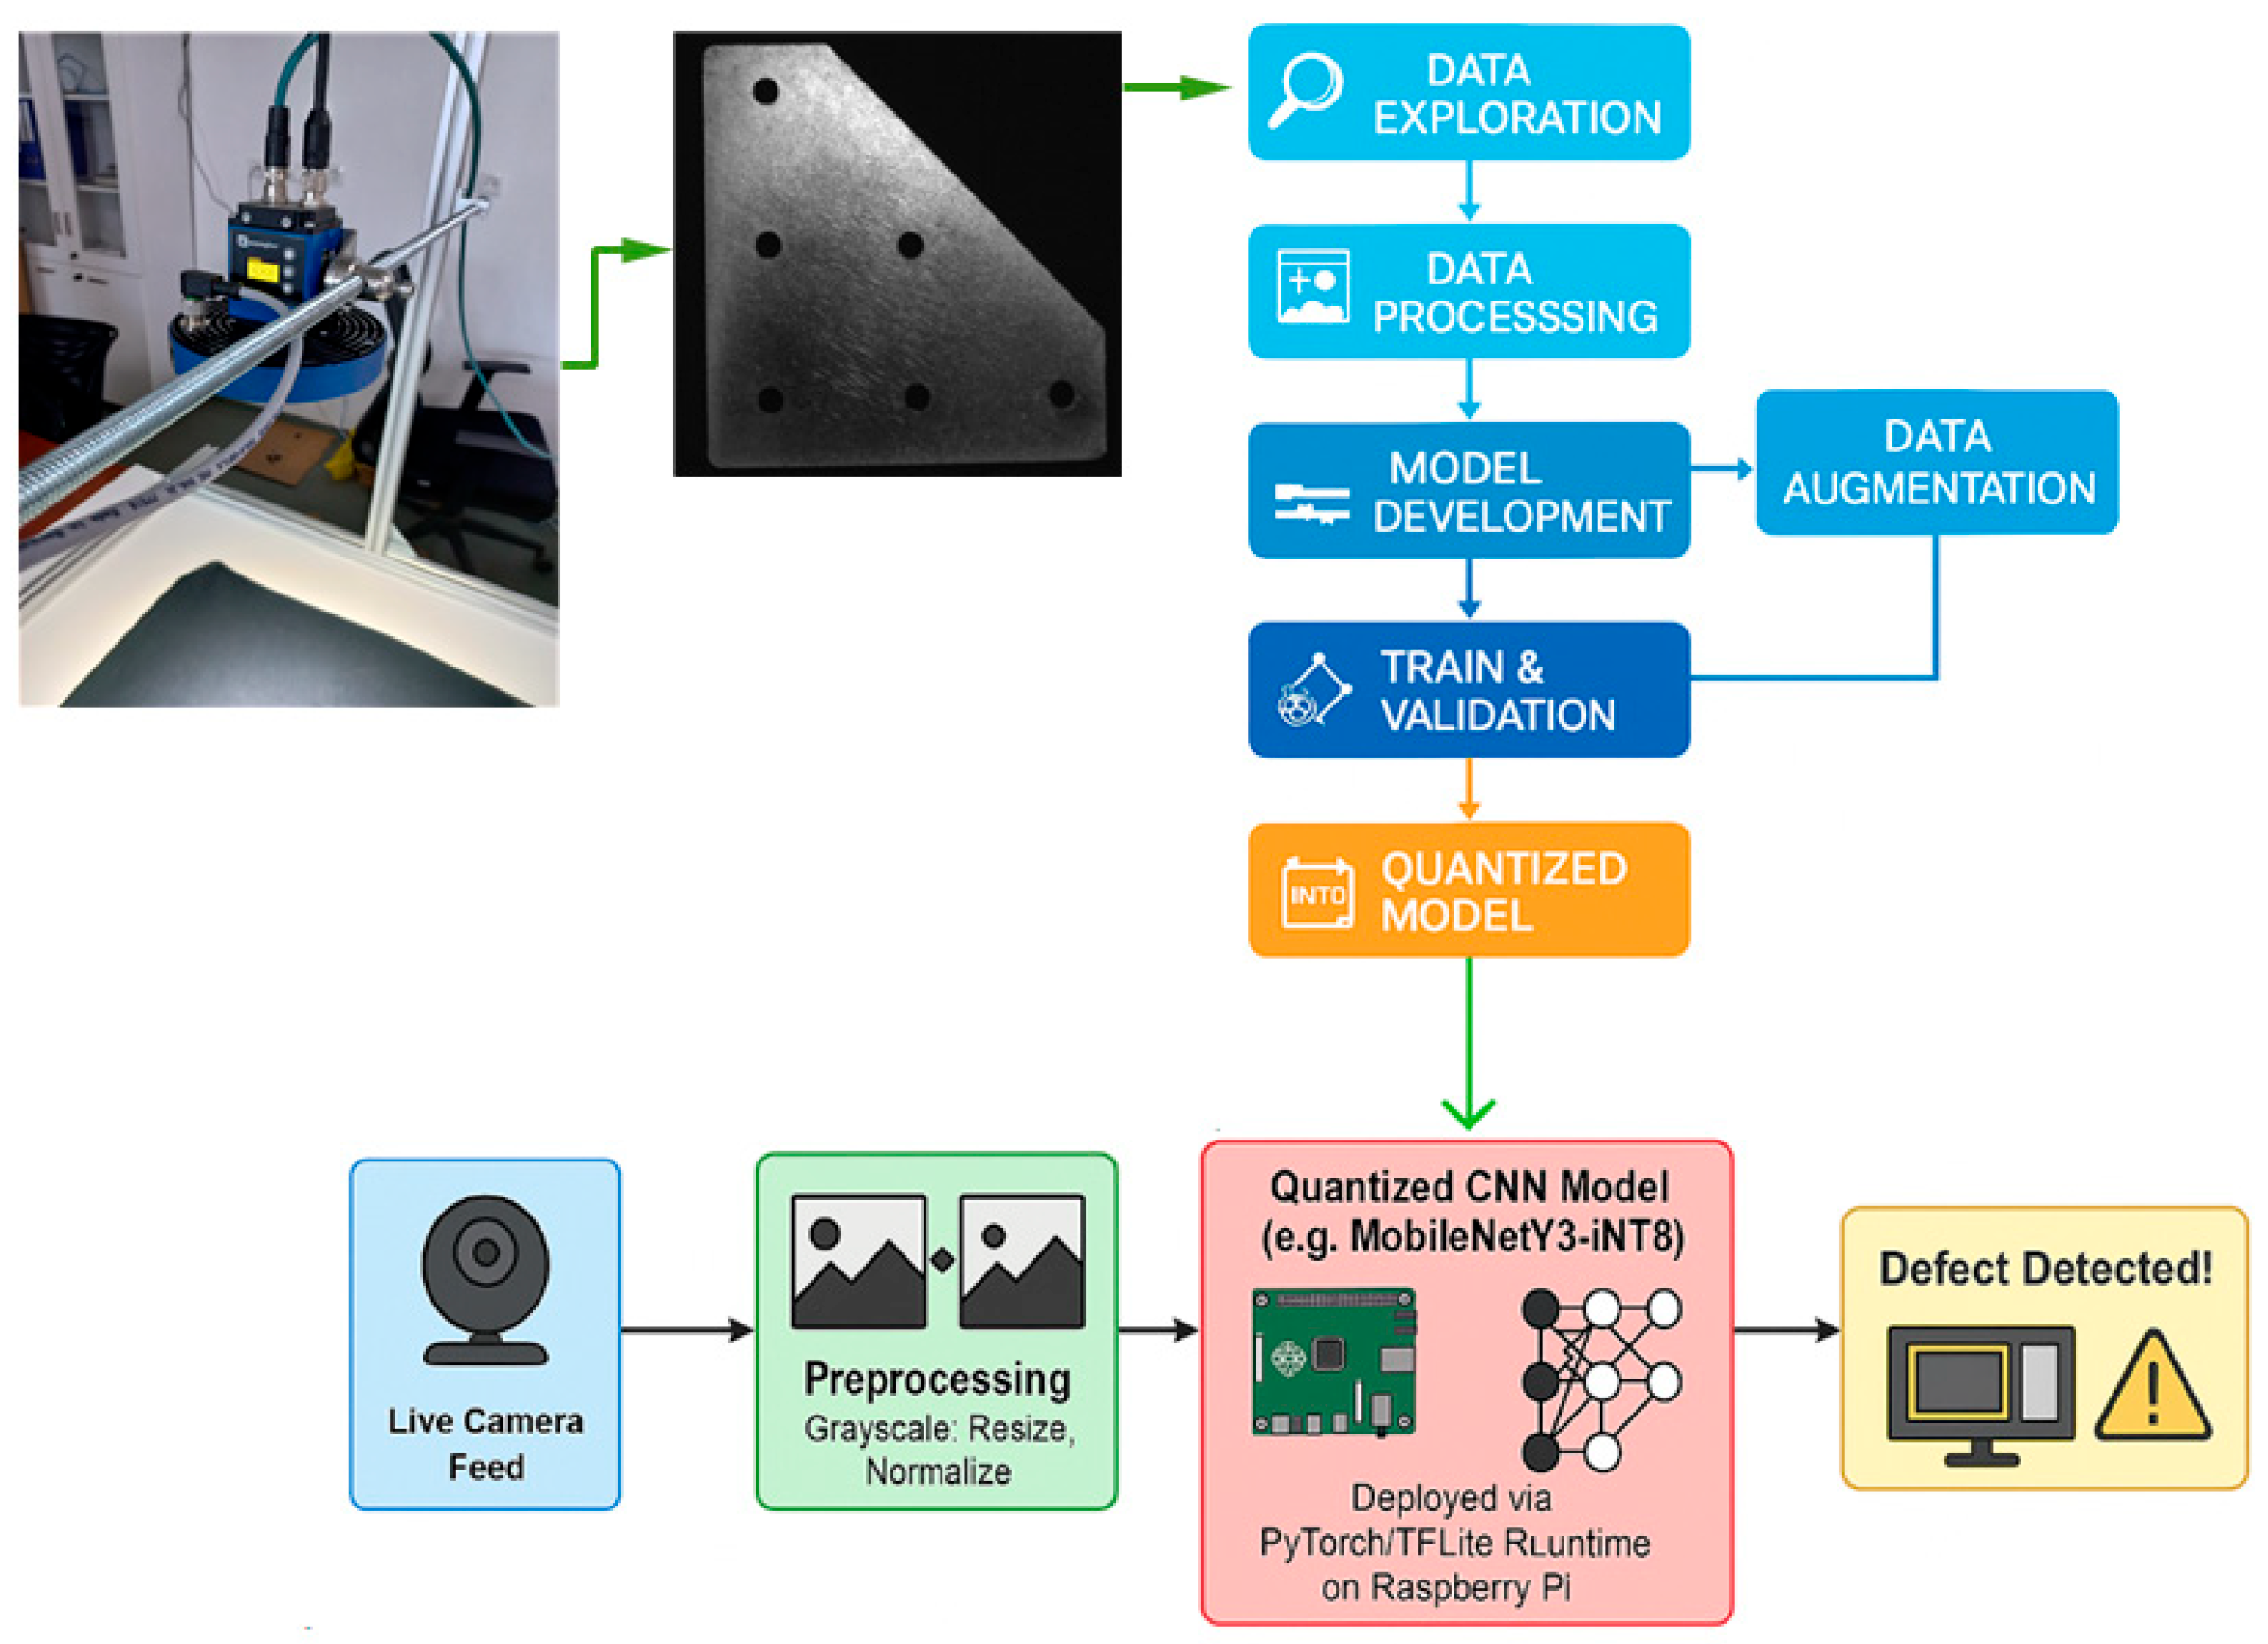
The diagram in
Figure 2 illustrates the workflow of a real-time defect detection system using deep learning methods, specifically applied to metal component inspection. Here is a clear textual description of the diagram:
Initially, images of metal components are captured using a dedicated imaging setup (Wenglor B50M012 camera, Tettnang, Germany).
Captured images proceed to a structured preprocessing stage, where initial data exploration occurs, identifying key characteristics and potential anomalies.
Subsequently, the dataset undergoes systematic data processing, which includes cleaning, normalization, and potentially extracting relevant features to improve learning efficacy.
Data augmentation is implemented concurrently to enrich the training dataset, thereby addressing dataset imbalance and enhancing model generalization.
A robust deep learning model is developed and trained on the processed and augmented dataset.
Model validation steps ensure the trained model performs reliably by assessing its predictive capabilities on unseen data.
Once the trained model achieves satisfactory performance criteria, it is deployed for real-time detection and classification.
The output stage provides prompt, automated defect detection and classification results, facilitating timely quality control decisions in manufacturing environments.
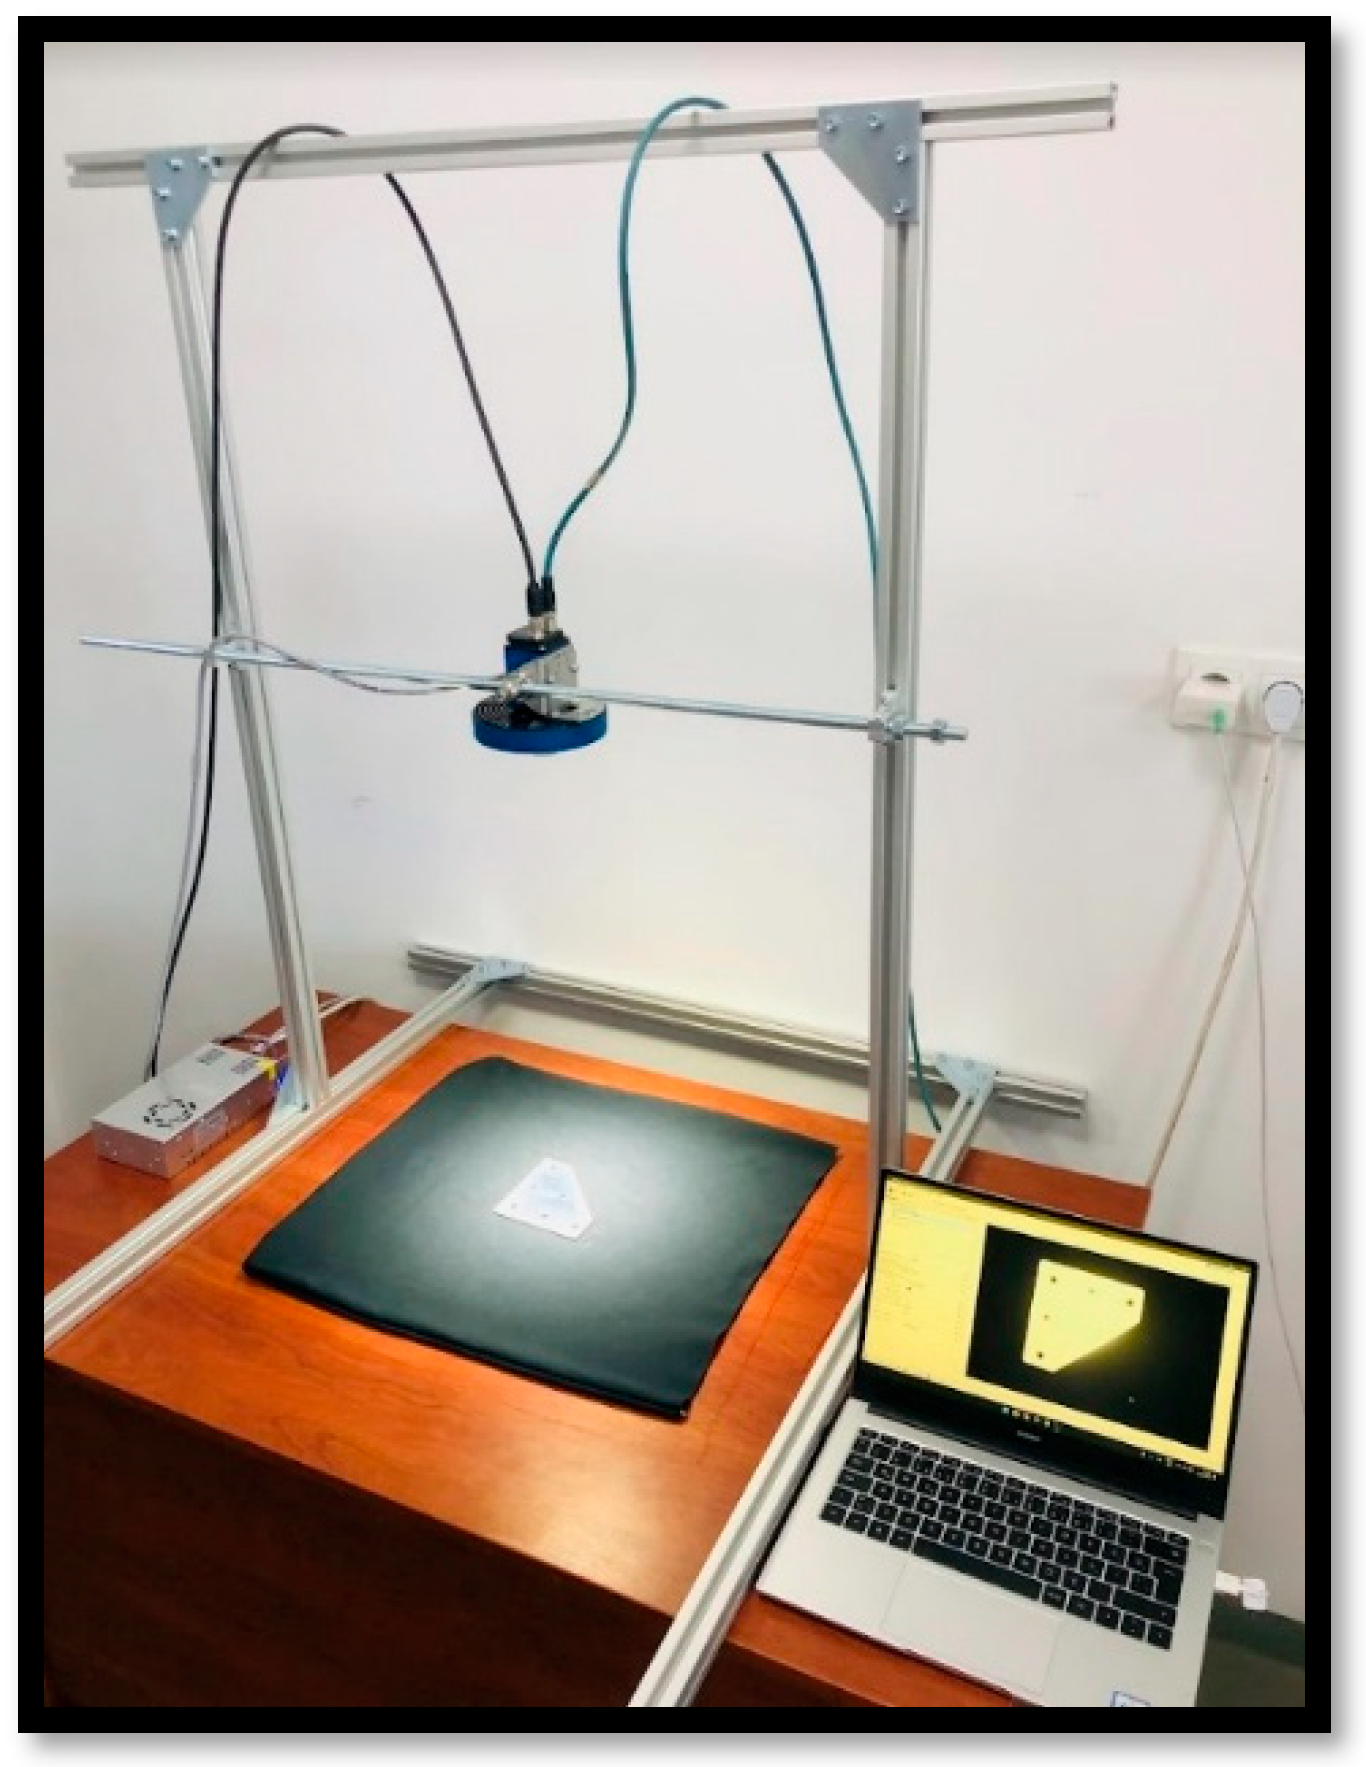
The experimental setup
Figure 3 for the real-time visual defect detection system comprises an integrated arrangement optimized for industrial inspection of metal components. It includes a high-resolution camera strategically positioned above an inspection area to capture clear, consistent images. The dedicated lighting system ensures uniform illumination, reducing shadows and reflections, thereby enhancing defect visibility. Captured images are directly transferred to a Raspberry Pi-based edge computing unit, where they undergo immediate processing and classification using pre-trained deep learning models. The real-time results, indicating the presence or absence of defects, are promptly displayed through a monitoring interface, enabling rapid decision-making and timely intervention, ultimately supporting efficient and reliable quality assurance in manufacturing environments.
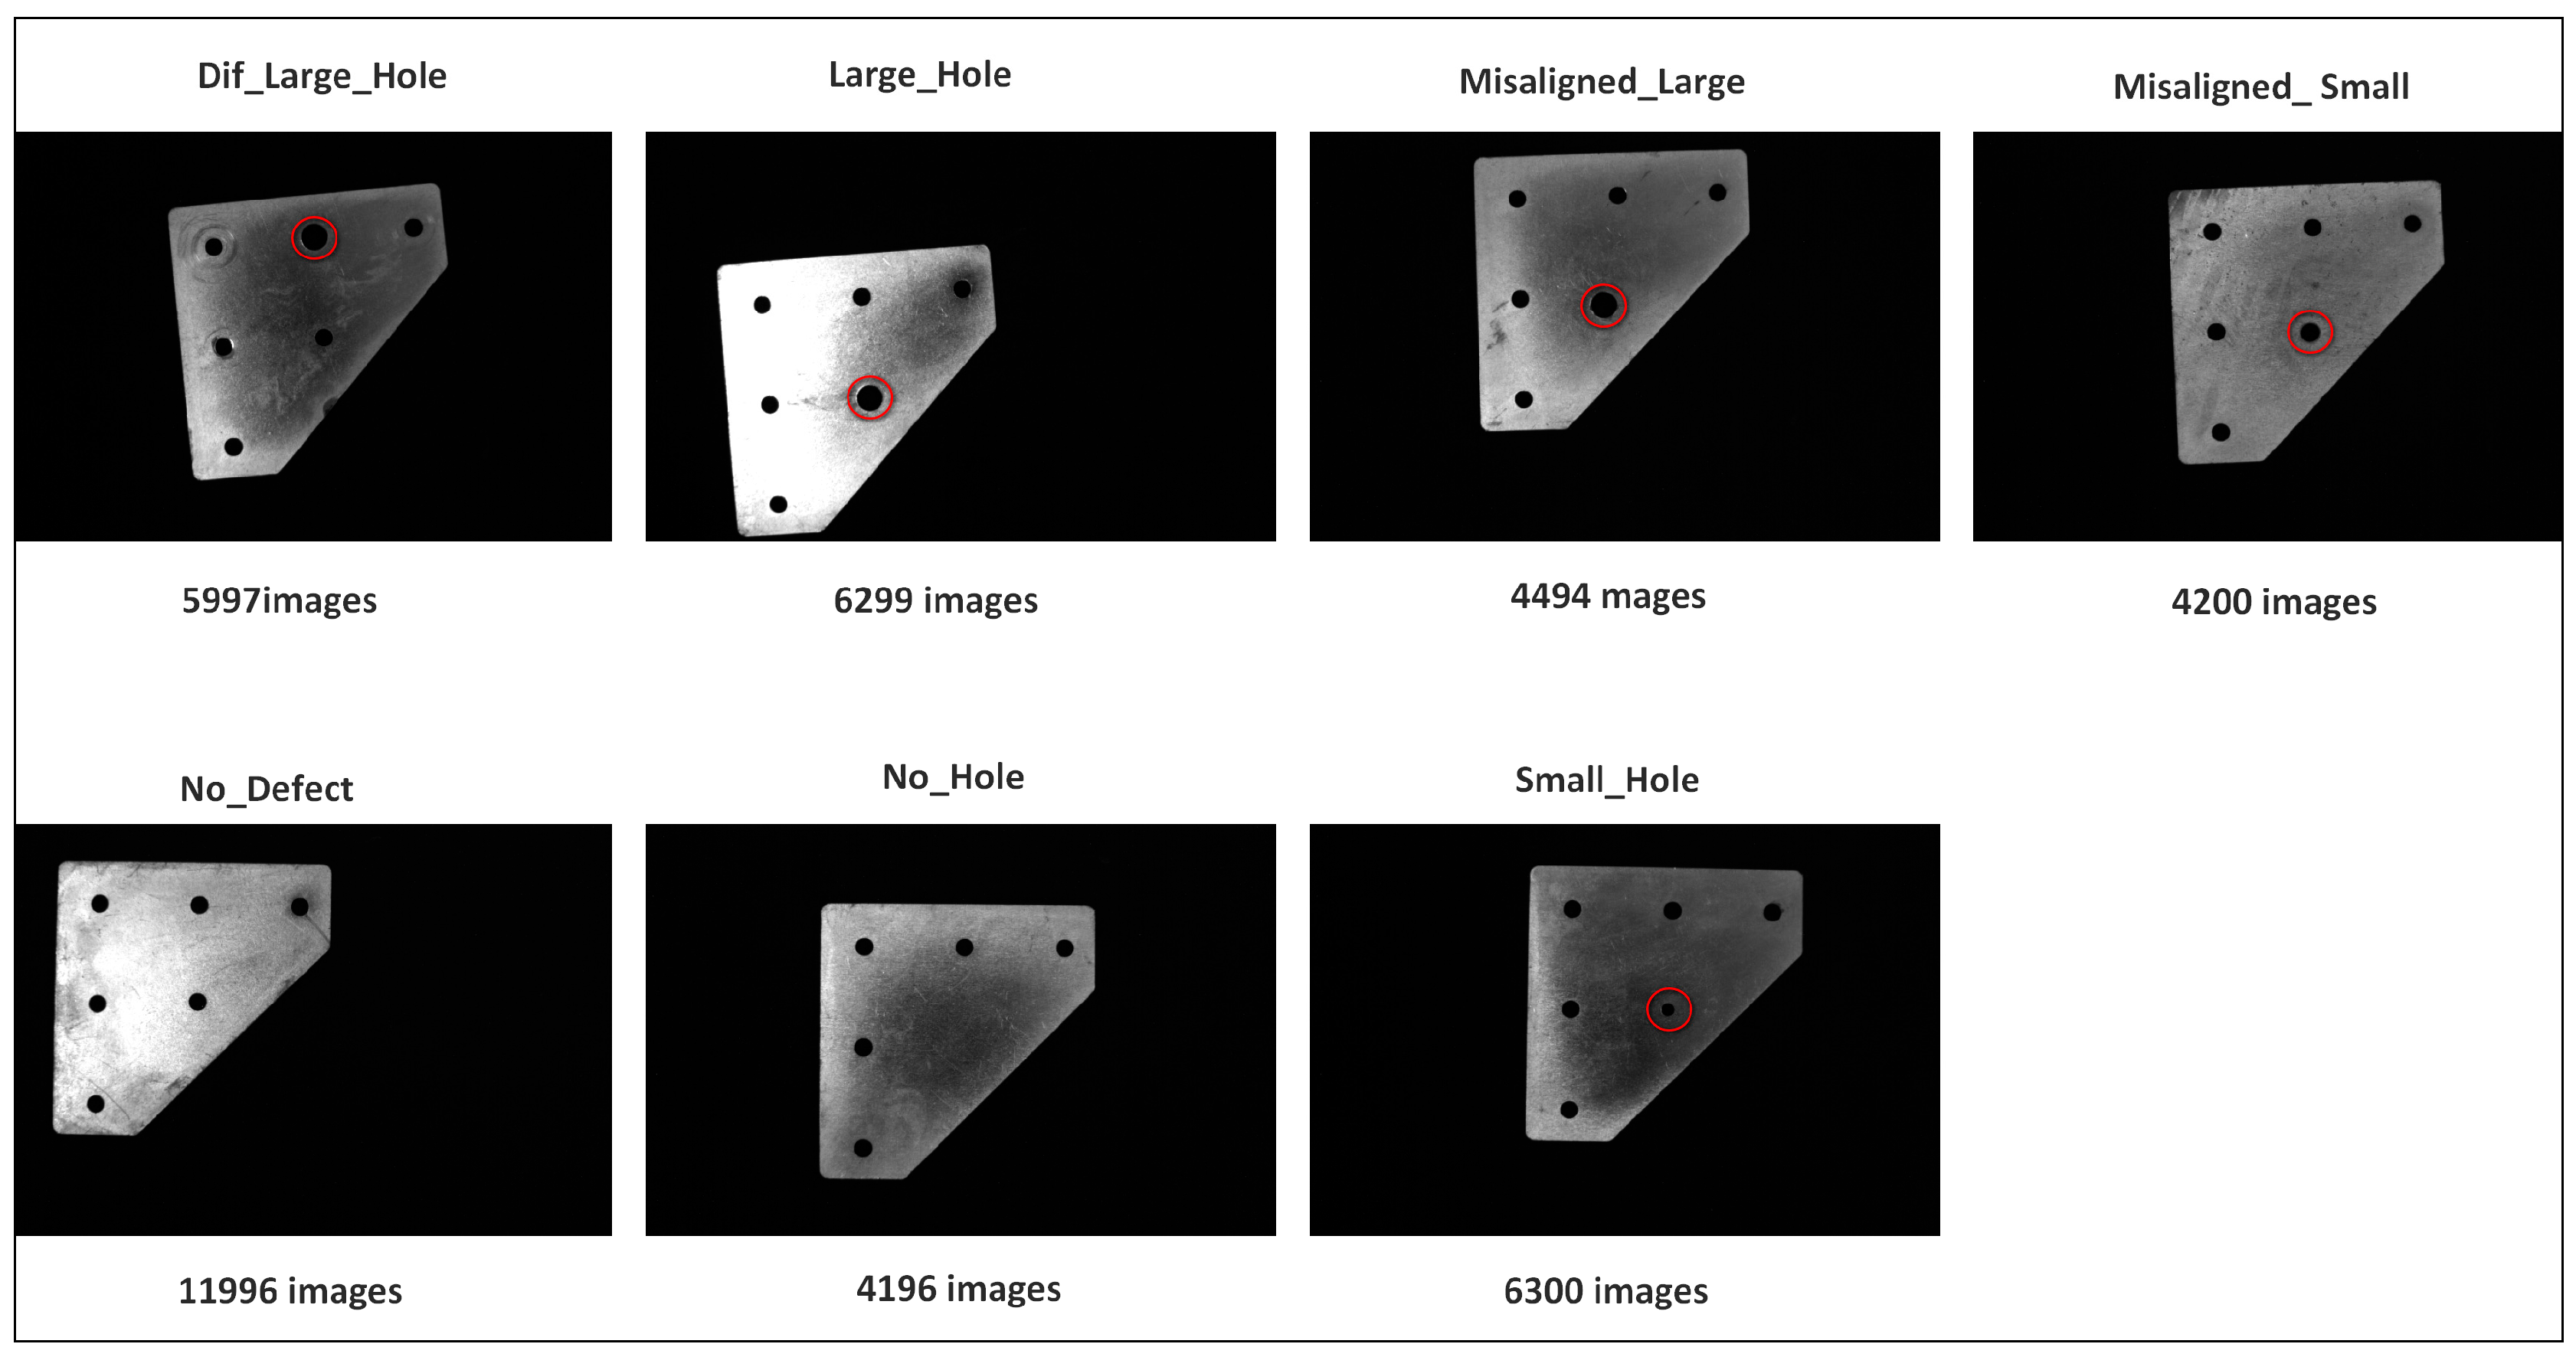
3.1. Defect Types
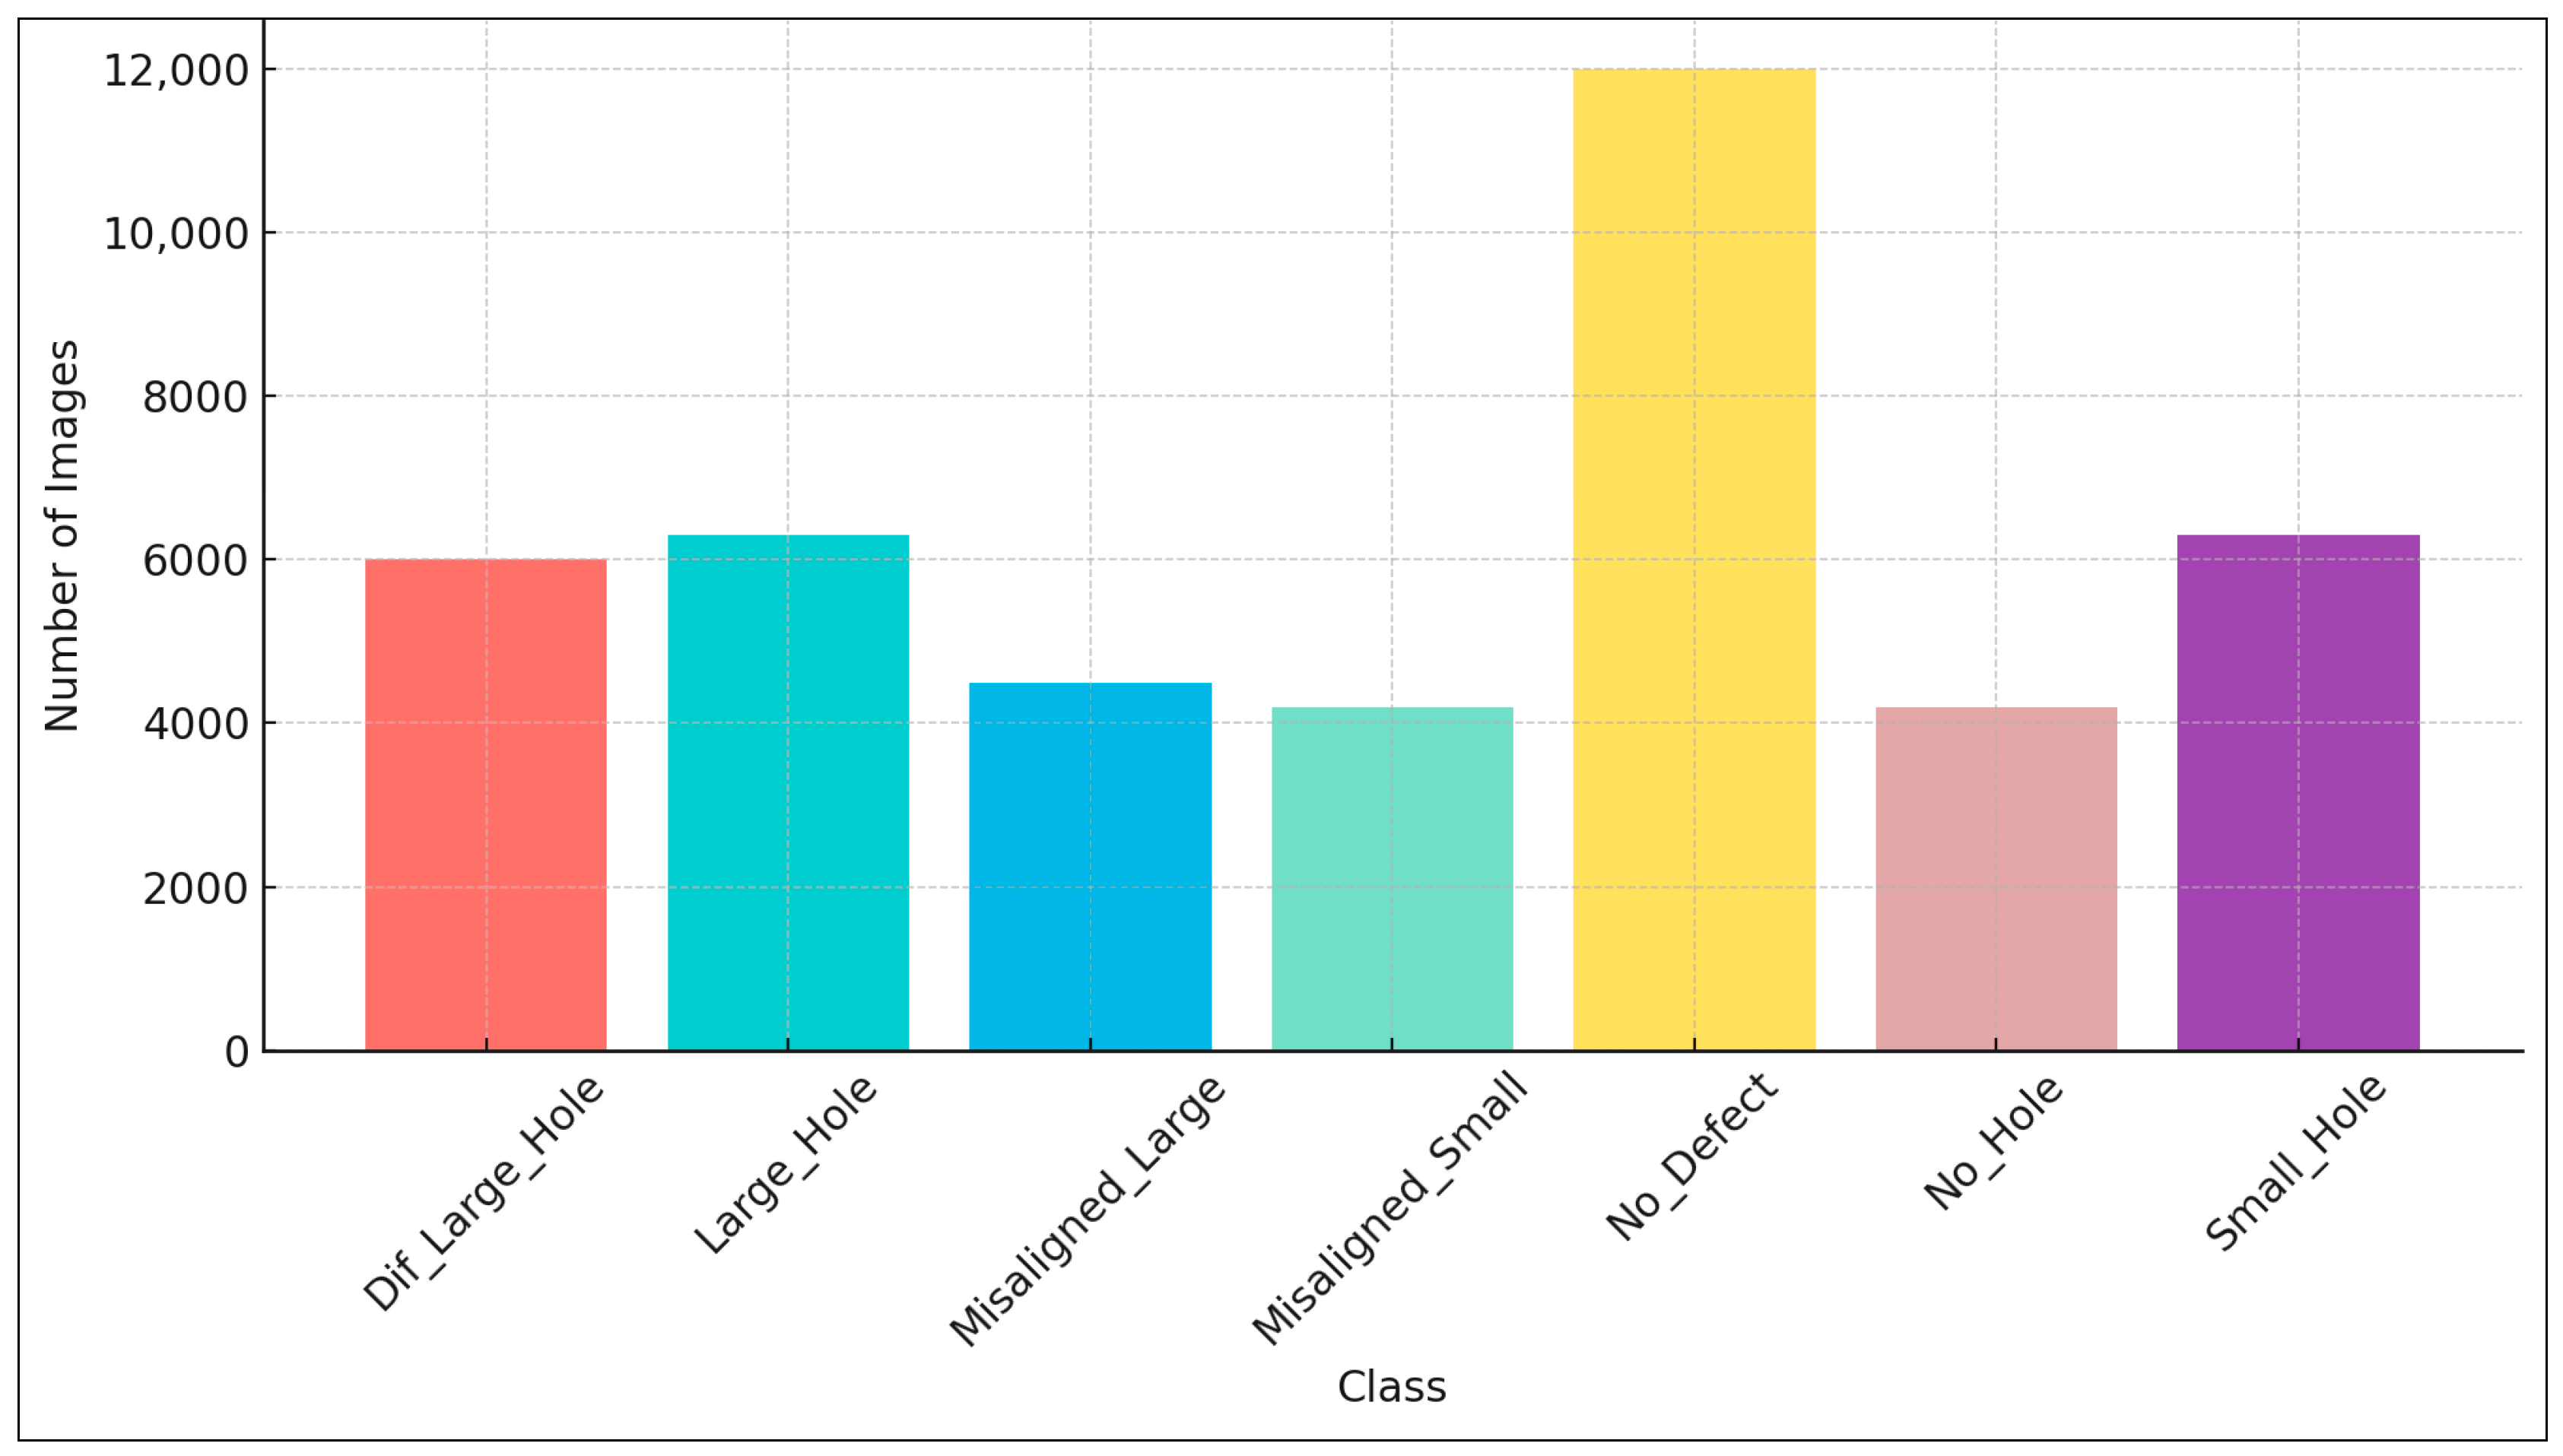
The dataset consists of seven distinct classes: Dif_Large_Hole (5997 samples), Large_Hole (6299 samples), Misaligned_Large (4494 samples), Misaligned_Small (4200 samples), No_Defect (11,996 samples), No_Hole (4196 samples), and Small_Hole (6300 samples). These classes are categorized based on their defect characteristics, aligning with the objective of clearly identifying defect presence or absence rather than specific defect nuances alone. Specifically, the Large_Hole and Small_Hole classes represent properly positioned holes with diameters of 10 mm and 5 mm, respectively. The Large_Hole category captures samples with large holes exhibiting irregular shapes or dimensions. Classes Misaligned_Large and Misaligned_Small comprise components where holes of 10 mm and 5 mm diameter, respectively, are incorrectly positioned. No_Defect samples are characterized by standard reference holes of 7 mm diameter, ensuring consistency in baseline quality, while No_Hole contains components entirely lacking holes.
The dataset distribution and each defect class are presented in
Figure 4 and
Figure 5 across seven distinct classes used for defect detection. The classes and their respective sample counts are visually represented in a bar graph, clearly highlighting dataset imbalances. Specifically, the No_Defect category has the highest number of samples (11,996), ensuring a robust baseline for quality assessment, while classes such as No_Hole (4196 samples) and Misaligned_Small (4200 samples) represent minority classes. This graphical representation underscores the need for balanced training approaches, such as data augmentation or synthetic data generation, to enhance model performance across all categories and ensure effective generalization in real-world scenarios.
3.2. Training and Validation Approach
The methodology employs convolutional neural networks (CNNs) and specialized image preprocessing techniques. The computational system was configured with an i9-11900 processor (Intel, Santa Clara, CA, USA), operating at a base frequency of 2.50 GHz, supported by 16 logical cores. The device was equipped with 64 GB of DDR4 RAM, ensuring optimal performance for memory-intensive operations. Graphical computations and rendering were facilitated by an NVIDIA GeForce RTX 3080 Ti GPU (Santa Clara, CA, USA), with 12 GB of dedicated memory and 32 GB of shared memory, delivering accelerated processing capabilities for graphical and machine learning applications. For GPU-intensive simulations, NVIDIA CUDA libraries and the NVENC API were utilized. Analytical workflows were developed using Python 3.10, ensuring compatibility with the DirectX-12 and OpenCL 3.0 frameworks pre-installed on the system.
To standardize input dimensions and ensure compatibility across deep learning architectures, all grayscale BMP images were resized to 224 × 224 pixels. Pixel normalization was performed using mean and standard deviation values to align with common preprocessing standards in computer vision. The dataset comprised 43,482 images of metal components, exhibiting a notable class imbalance, with the No_Defect category alone accounting for approximately 27.6% of the data.
To improve the model’s resilience to real-world variations, an extensive data augmentation strategy was implemented using the Albumentations library. This pipeline incorporated a variety of transformations to simulate environmental and operational inconsistencies, including random rotations, horizontal flips, brightness and contrast adjustments, Gaussian noise, motion blur, and optical distortions. Additional augmentations such as random shadows, coarse dropout, and JPEG compression artifacts were applied to mimic occlusions and sensor degradation. Post augmentation, images were converted to three-channel tensors to conform with standard input formats.
For binary classification, the dataset was restructured into two categories:
The OK class included only the No_Defect samples, representing components free of visual anomalies.
The Defective class encompassed all remaining defect types, including shape irregularities, misalignments, missing holes, and dimensional deviations.
To address class imbalance, class weighting was applied during training, calculated based on the inverse frequency of class occurrences. The learning process employed dynamic learning rate scheduling to facilitate stable convergence and prevent overfitting. Regularization techniques such as early stopping, weight decay, and stochastic dropout were utilized to enhance generalization on unseen data. The training workflow also supported mixed-precision computation to optimize performance on resource-constrained environments, and quantization strategies were optionally explored to enable efficient deployment on edge devices.
For binary classification purposes, all defect classes including Irregular_Large_Hole, Aligned_Large_Hole, Misaligned_Large, Misaligned_Small, and Aligned_Small_Hole are consolidated into a single Defective category. The No_Defect samples are labeled as being in the OK (non-defective) category. This binary grouping aligns directly with practical quality control goals in automated industrial inspection, where the priority is reliably identifying the presence or absence of defects rather than distinguishing specific defect types. Adopting this approach ensures that the trained model can effectively differentiate defective components from non-defective ones, thus enhancing its applicability, robustness, and efficiency for real-time quality assurance scenarios.
Throughout the training process, both loss and accuracy metrics were continuously monitored for the training and validation sets across all epochs. Model performance was assessed using a comprehensive suite of evaluation metrics. These included overall classification accuracy, along with precision, recall, and F1-score, reported both globally and on a per-class basis. A confusion matrix was employed to visualize misclassification patterns and to illustrate performance distribution across different classes.
Beyond classification performance, metrics critical for deployment were also evaluated. These included model size (in megabytes) and inference speed, measured in both frames per second (FPS) and average milliseconds per image. Such deployment-aware metrics are particularly important for assessing real-time feasibility on resource-constrained edge devices. Collectively, these evaluation criteria offer a detailed view of the model’s predictive accuracy, generalization capability, and practical viability in industrial settings.
4. Results and Real-Time Deployment
This section evaluates the real-time deployment performance of deep learning models for industrial defect detection, with a focus on updated experimental results. The deployment scenario mimics real manufacturing environments using a webcam-based input stream to test the robustness of models under practical conditions such as varied lighting, defect visibility, and orientation shifts.
The deployment involved integrating optimized architecture into a practical setup, simulating conditions typically encountered in industrial workflows. Further refinements were made by enhancing logging for better interpretability, improving augmentation strategies, and explicitly addressing class imbalance using weighted loss functions.
4.1. ResNet50
The ResNet50 architecture was trained and optimized for binary classification of industrial defects using a robust and deployment-aware pipeline. The training strategy incorporated two-stage fine-tuning, initially updating only the classifier head, followed by full-model unfreezing at a lower learning rate combined with advanced augmentations such as random flips, rotations, brightness/contrast adjustments, and Gaussian noise. To mitigate the effects of class imbalance (72% defect, 28% no defect), a dynamically weighted cross-entropy loss function was employed. The model was trained on a grayscale image dataset comprising 43,482 samples and evaluated on a stratified test set of 6523 images. ResNet50 achieved near-perfect test performance, with 99.98% accuracy, a precision of 0.9994, recall of 1.0000, F1-score of 0.9997, and mean average precision (mAP) of 1.0000.
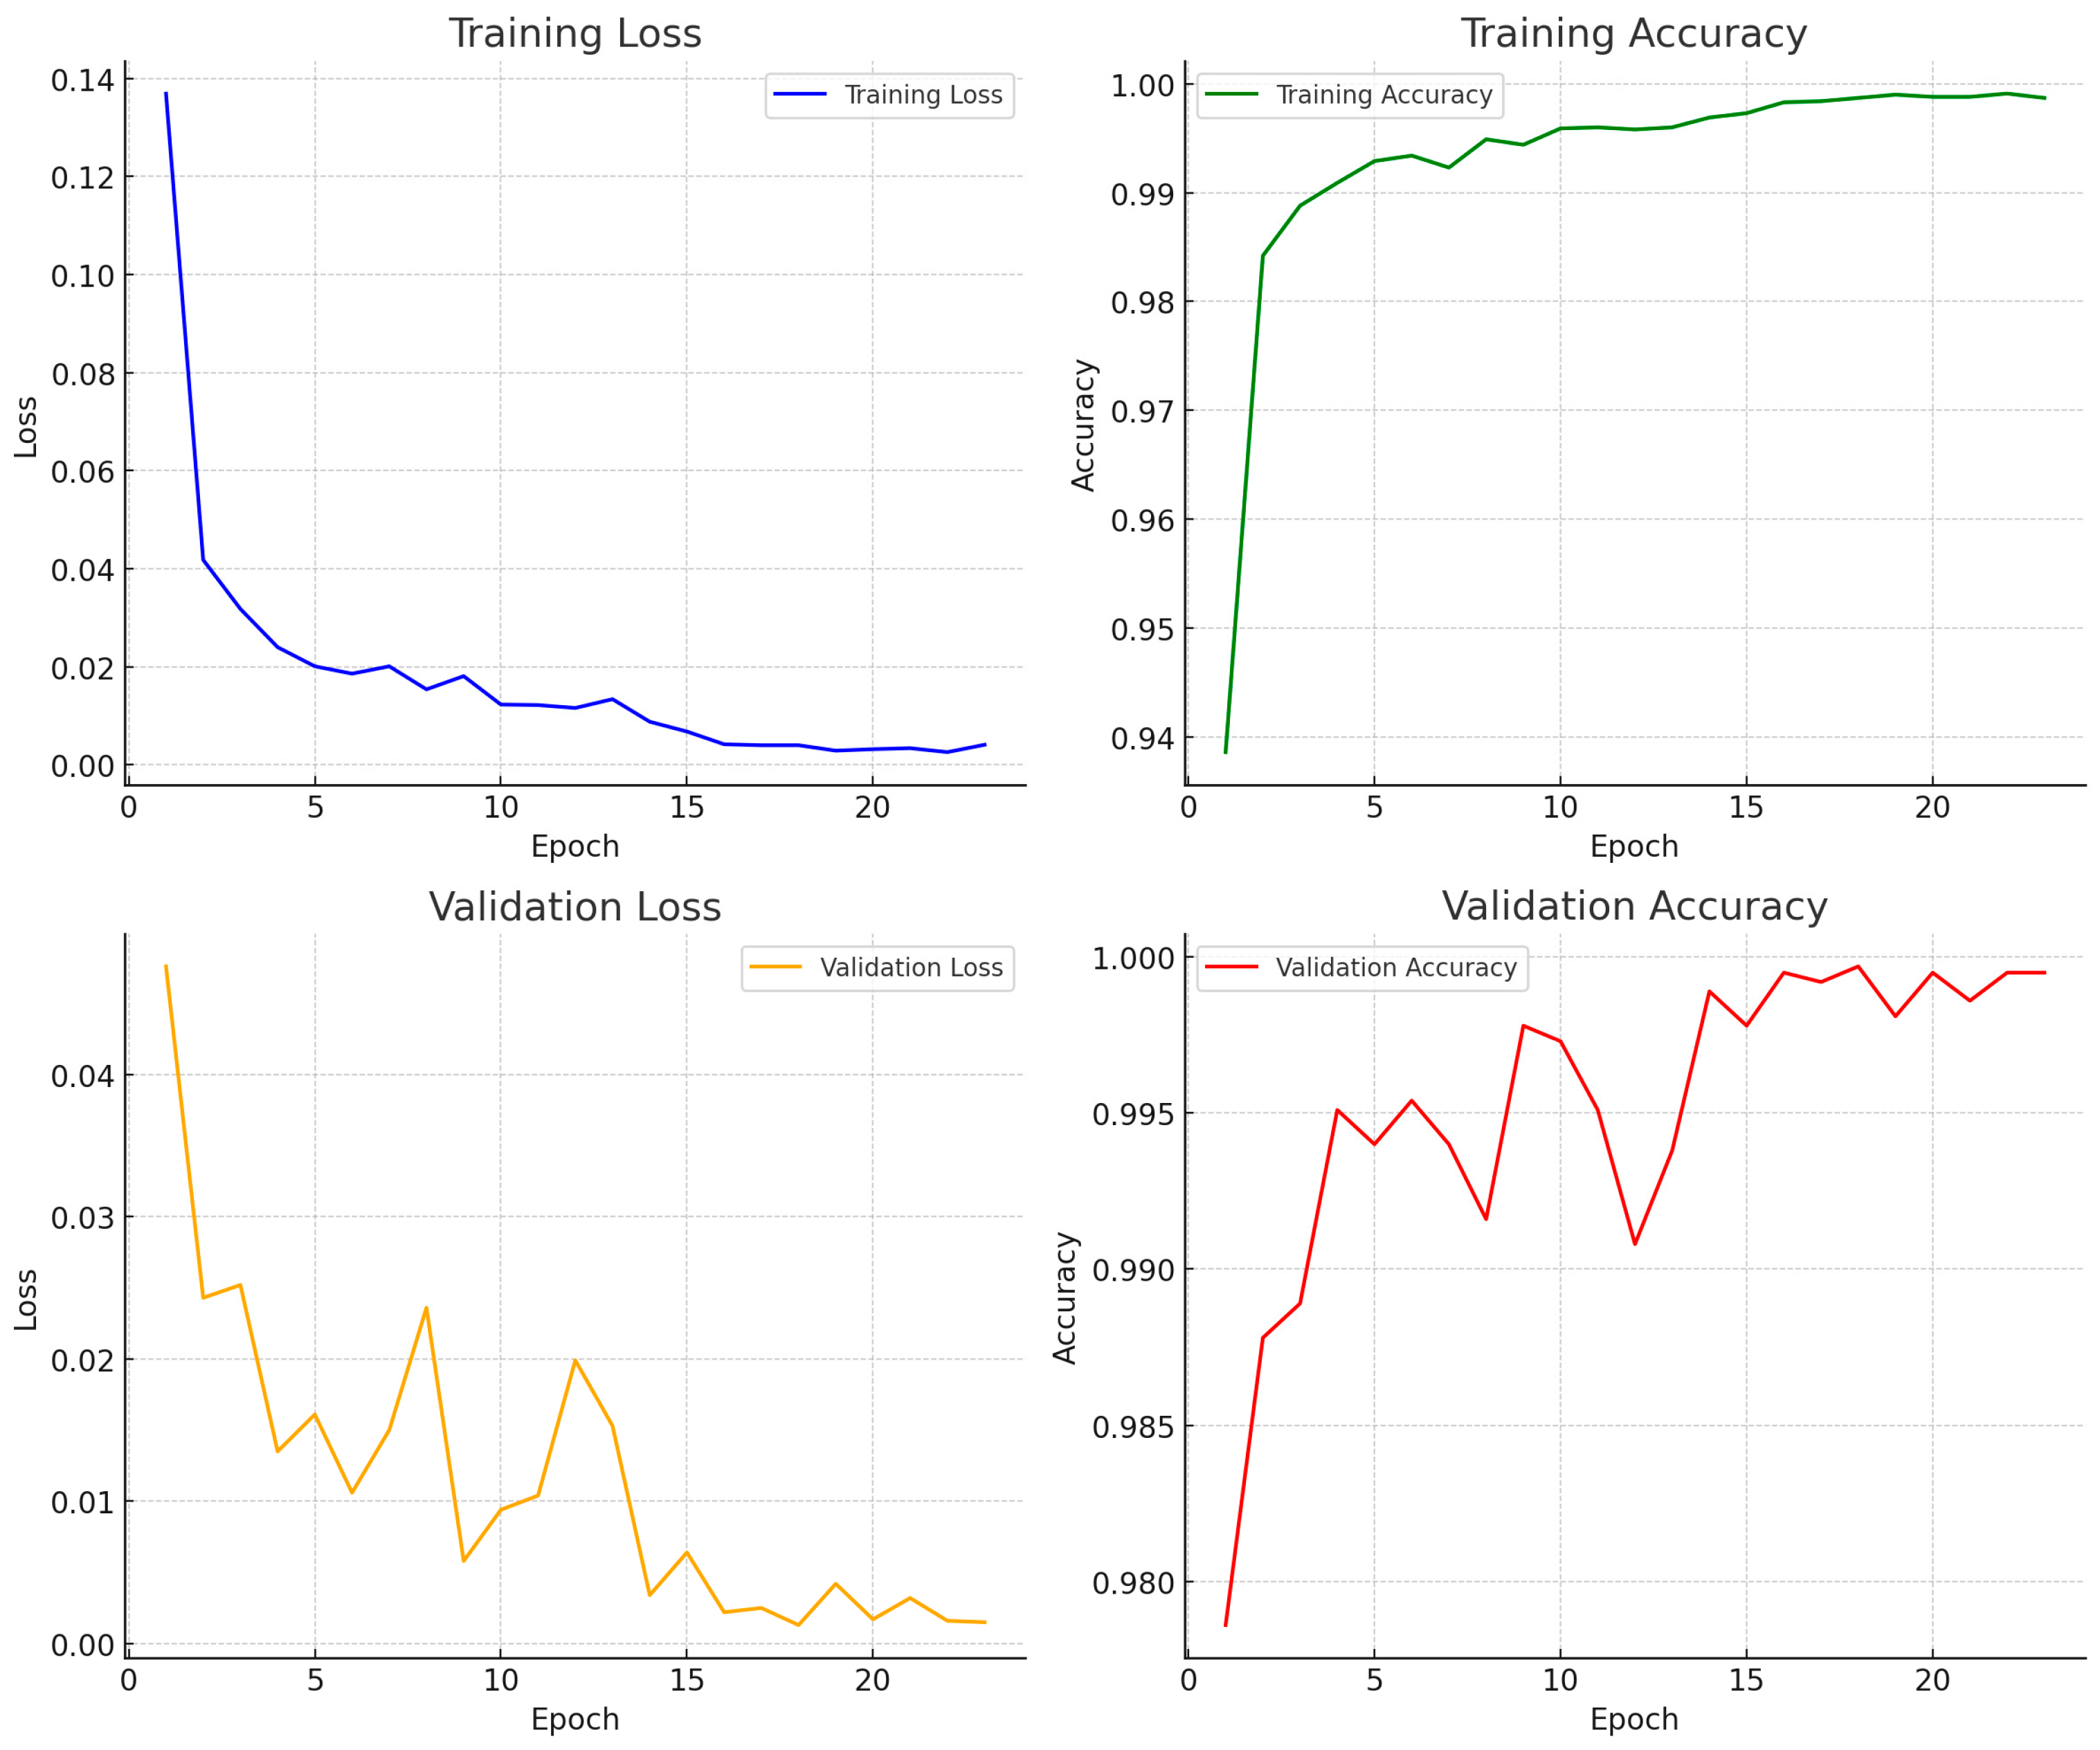
The training and validation curves for ResNet50 (
Figure 6) demonstrate a consistent decline in both training and validation loss, with minimal divergence between the two, indicating effective mitigation of overfitting. Validation accuracy steadily increased and plateaued above 99.9%, closely mirroring training accuracy, which suggests that the model generalized well across unseen data. The low and stable validation loss throughout training further confirms that the optimization strategy, including early stopping and class-weighted loss, contributed to robust convergence.
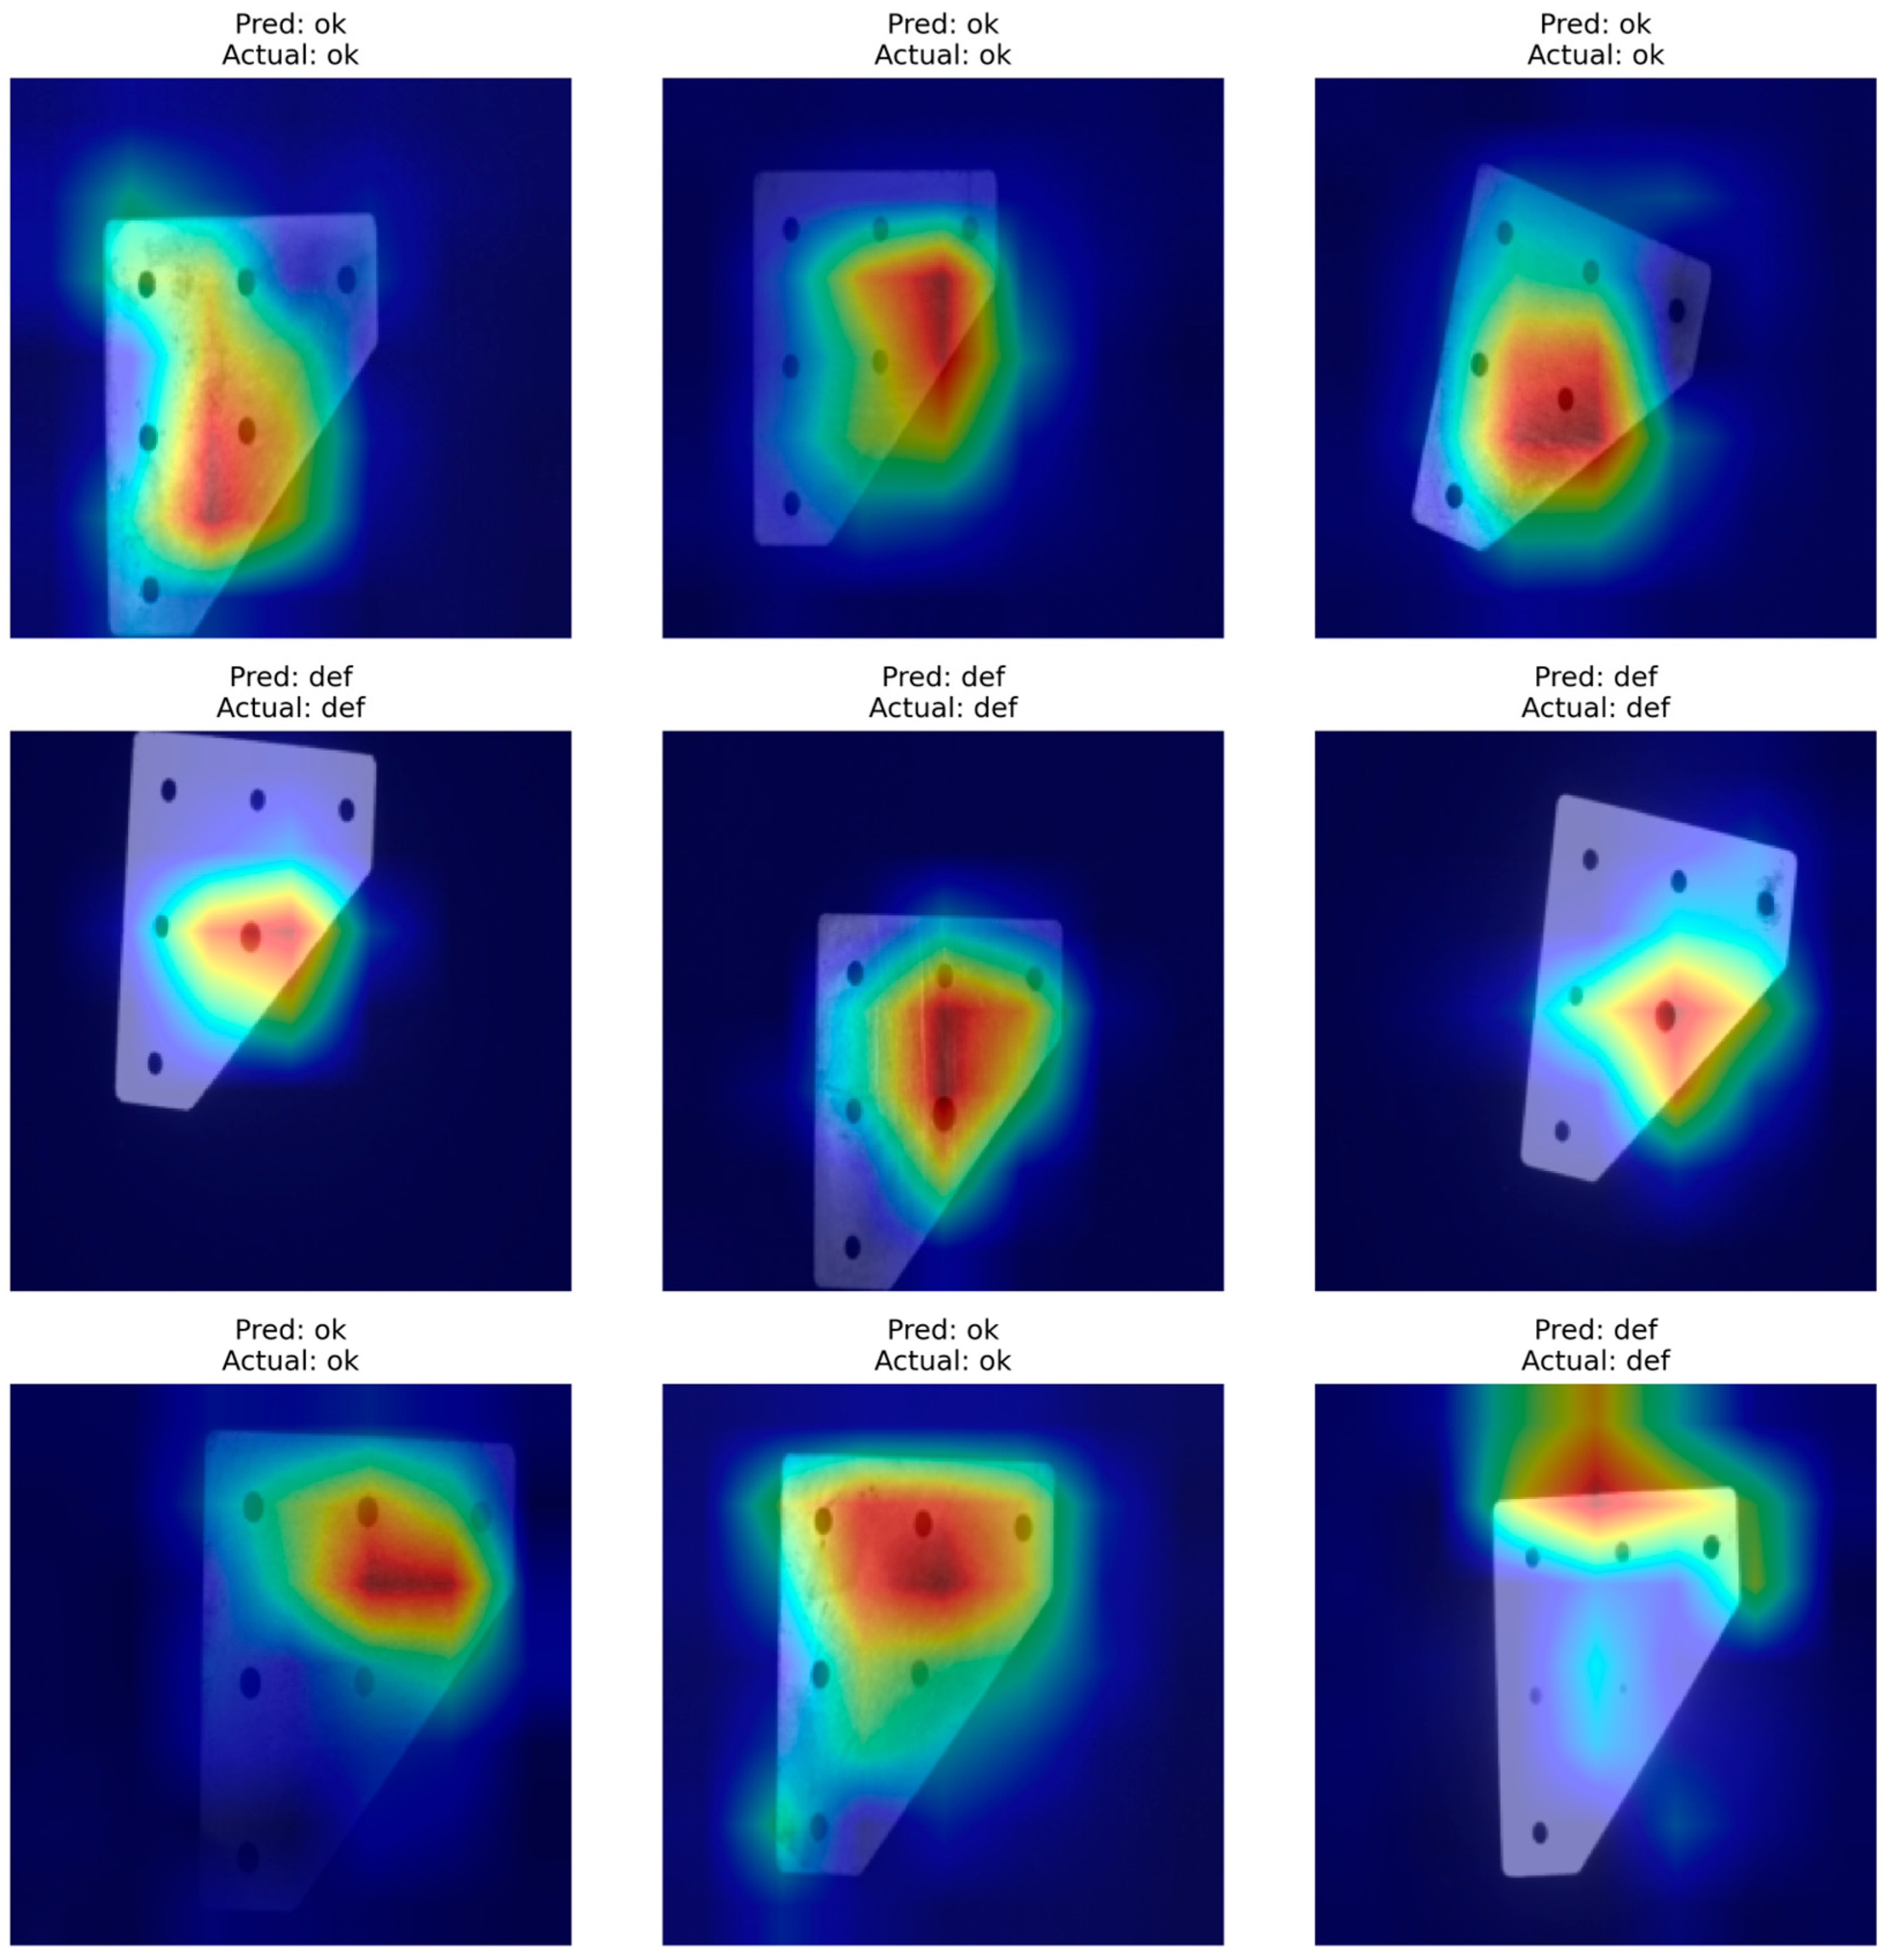
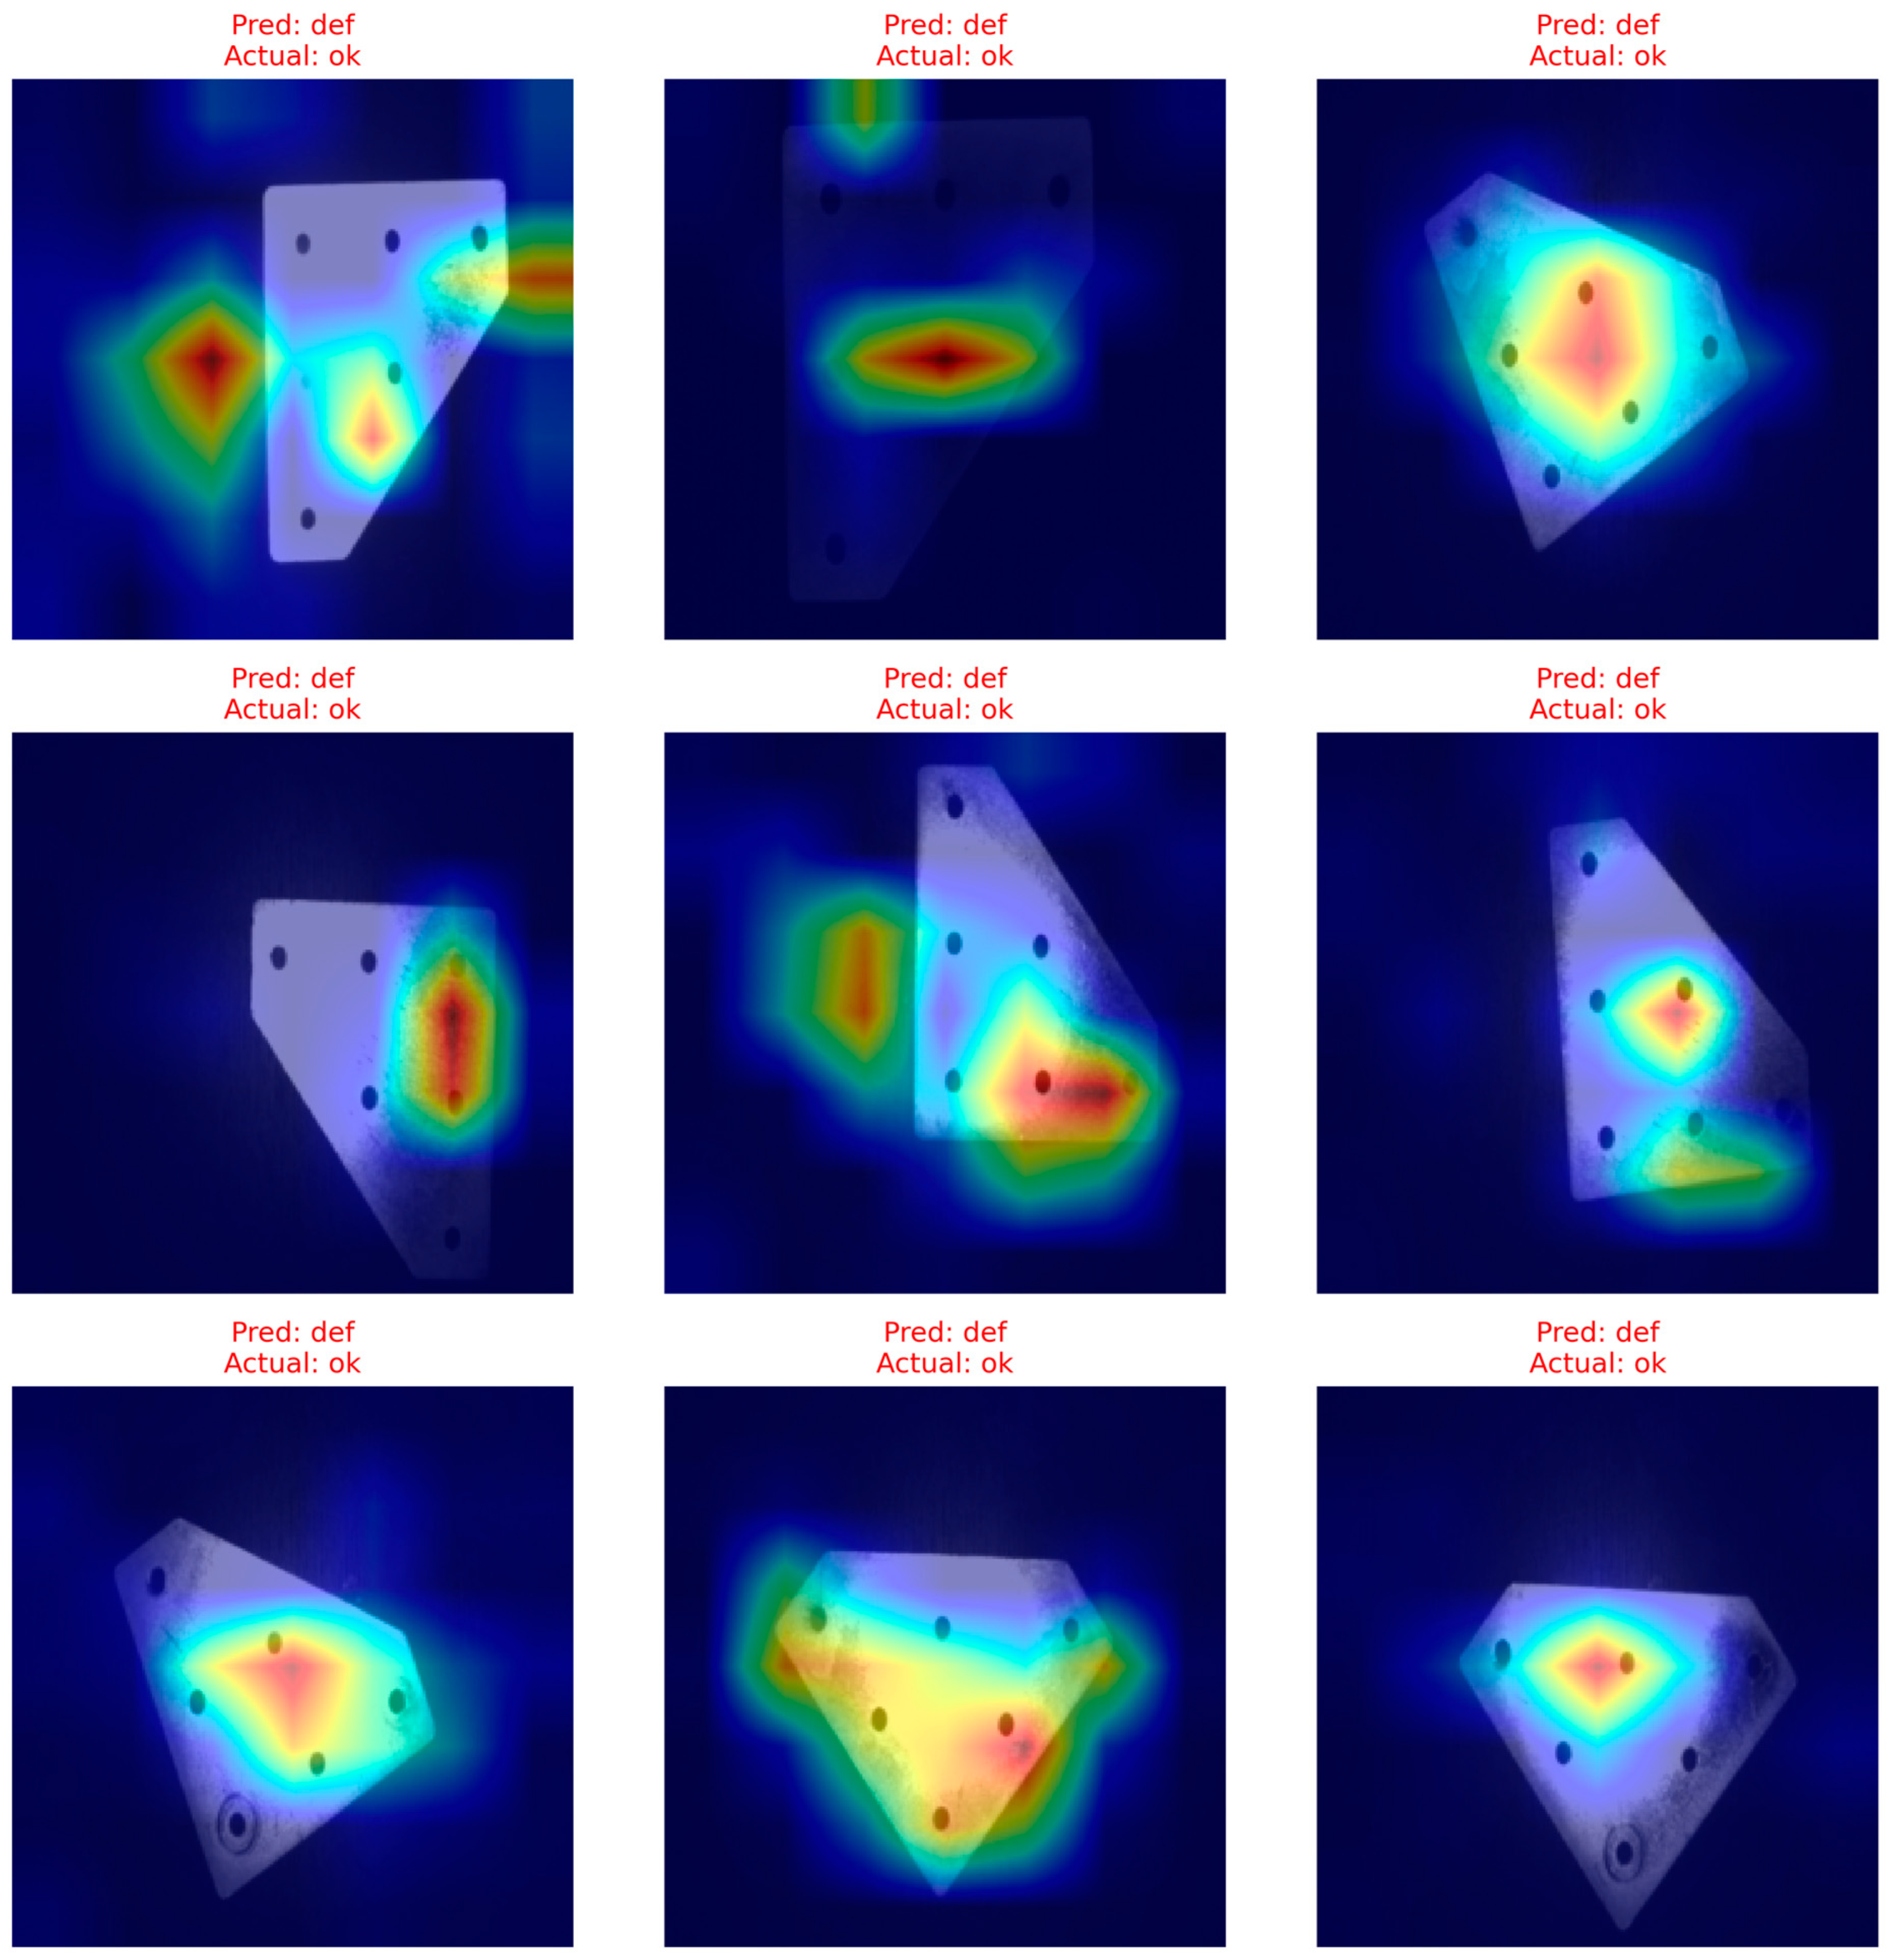
To enhance interpretability, Grad-CAM visualizations were generated to analyze the spatial attention of the ResNet50 model during inference (
Figure 7 and
Figure 8). In true positive cases, where both the predicted and actual labels are correct, the model’s attention maps consistently highlight relevant structural regions such as holes, edges, and misaligned areas confirming that the model makes decisions based on meaningful visual cues. These heatmaps exhibit tight localization on defect regions for defective samples and diffused, non-anomalous focus for non-defective ones. Additionally, Grad-CAM results for misclassified cases (false positives) reveal that while the samples were defect-free, the model concentrated on regions with minor visual irregularities or artifacts that resembled defects (e.g., dark shadows, non-uniform reflections). This indicates a conservative bias in the model toward erring on the side of caution, an acceptable trade-off in high-stakes industrial contexts where false negatives are more critical than false positives. Together, these visual insights validate the model’s attention mechanisms and support its use in real-time quality inspection tasks where explainability is essential for operator trust and certification compliance.
4.2. MobileNetV3
MobileNetV3-Large architecture was fine-tuned for binary defect classification with a strong emphasis on lightweight deployment and inference efficiency. The training process utilized a two-stage fine-tuning strategy, beginning with classifier head training followed by unfreezing all layers for full backpropagation. Weighted cross-entropy loss was employed to counteract dataset imbalance, and the model was trained using mixed precision for improved throughput. Data augmentation techniques, including random rotation, horizontal flip, brightness/contrast jittering, and Gaussian noise, were applied to improve generalization. The model was evaluated on a 6523-image test set extracted from a larger corpus of 43,482 grayscale industrial images.
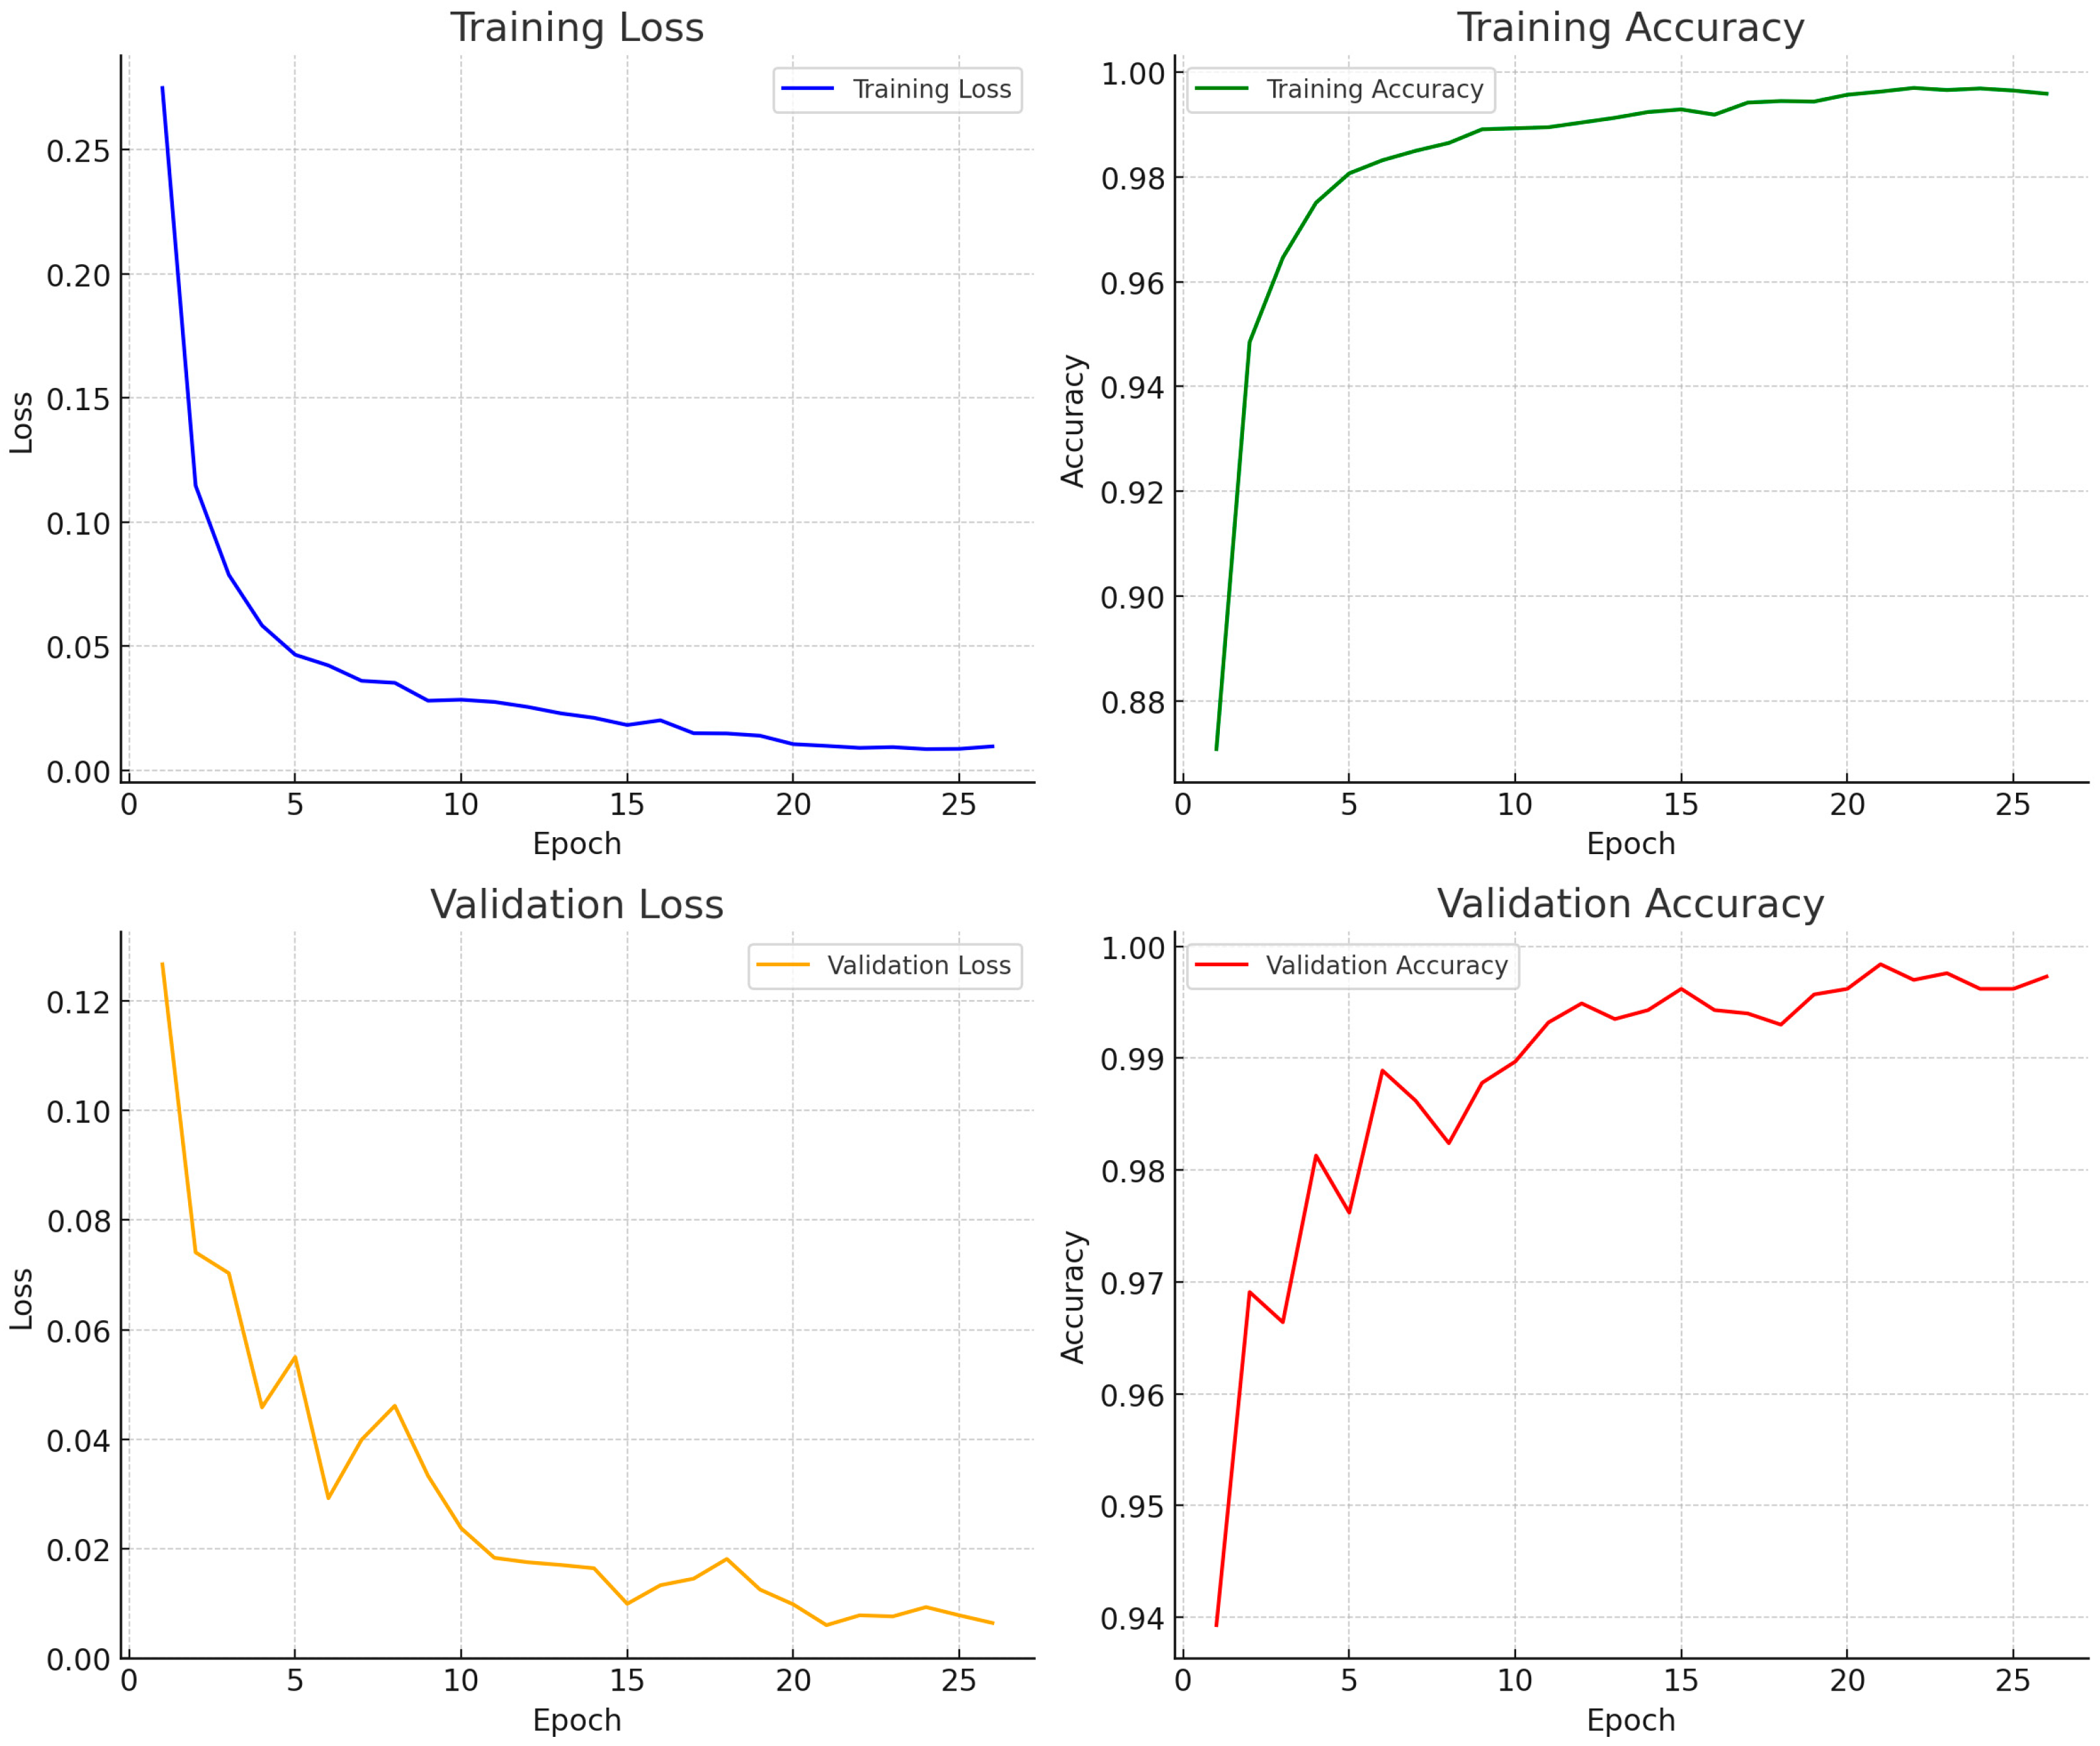
The training and validation curves of MobileNetV3-Large (
Figure 9) demonstrate rapid convergence and strong generalization. Training loss exhibited a consistent exponential decline over epochs, while training accuracy steadily approached 100%. Validation accuracy increased rapidly in early epochs and stabilized near-perfect levels (>99.9%), with validation loss concurrently decreasing and plateauing below 0.02. The close alignment between training and validation metrics without divergence indicates an absence of overfitting. These trends confirm the effectiveness of the two-stage fine-tuning strategy and regularization through augmentation and class balancing.
To support interpretability and explain the decision-making behavior of MobileNetV3-Large, Grad-CAM visualizations were generated for both correctly and incorrectly classified samples (
Figure 10 and
Figure 11). For true positive predictions, the model’s attention was concentrated on semantically meaningful features such as hole alignment, plate boundaries, and surface inconsistencies, indicating that its decisions are grounded in visually relevant defect indicators. In non-defective samples, attention maps exhibited diffuse and uniform activation across structurally consistent regions, reflecting model confidence in the absence of anomalies.
Grad-CAM maps for false positives (i.e., defect predicted for non-defective parts) revealed that the model focused on ambiguous regions such as lighting gradients, smudges, or subtle textures, suggesting a conservative detection behavior that prioritizes defect sensitivity over specificity. While this results in a small number of overcautious classifications, such behavior may be desirable in industrial inspection systems where false negatives carry higher operational risk than false positives. Grad-CAM visualizations further validated the model’s decision-making process, revealing precise attention to regions of interest such as corner irregularities, misplaced holes, or homogeneous surfaces in no-defect parts. Unlike larger models, MobileNetV3-Large demonstrated both excellent interpretability and minimal overfitting while maintaining ultra-low latency. These results establish it as a compelling choice for real-time, resource-constrained industrial defect detection systems.
4.3. EfficientNetB3
EfficientNet-B3 was fine-tuned for binary classification of defective and non-defective industrial components, with an emphasis on balancing model complexity and inference accuracy. The training utilized the full model architecture initialized with pretrained weights and applied weighted cross-entropy loss to mitigate class imbalance. Training was conducted using mixed-precision computation to accelerate convergence and reduce GPU memory usage. EfficientNet-B3 achieved near-perfect classification performance, attaining 99.97% test accuracy with a test loss of only 0.0009.
Training and validation curves (
Figure 12) exhibit a smooth convergence pattern, with training loss declining progressively and training accuracy consistently improving across epochs. Validation accuracy rapidly exceeded 99.9% early in the training process and plateaued at near-perfect levels, while validation loss remained minimal and stable. The tight alignment between training and validation metrics indicates excellent generalization and confirms the absence of overfitting.
To enhance interpretability and explain the model’s decision-making process, Grad-CAM visualizations were generated for both accurate and misclassified test samples (
Figure 13). For correctly predicted defect samples, the model’s attention was sharply localized to discriminative regions such as edge discontinuities, corner irregularities, and surface anomalies. For non-defective parts, the attention maps revealed widespread, diffuse activations across smooth surface areas, suggesting strong confidence in the absence of defects. In the only false positive case, the model’s attention focused on ambiguous features resembling defect patterns, such as surface reflections or shadow gradients, indicating a conservative bias favoring defect sensitivity. Feature maps extracted from different convolutional stages revealed a hierarchical learning process, where early layers captured general contours while deeper layers localized fine-grained defect features. Compared to lightweight architecture, EfficientNet-B3 offered superior accuracy and interpretability while maintaining a practical inference speed for real-time deployment in industrial quality assurance pipelines.
The heatmaps highlight the discriminative regions that influenced the model’s decision. Red zones indicate high attention. Correctly classified defects show strong localization on holes or irregular edges, while non-defective parts exhibit dispersed activation. The bottom-right image illustrates a false positive case where the model attended to ambiguous surface artifacts. These results demonstrate the model’s interpretability and its capacity to focus on semantically relevant features for classification.
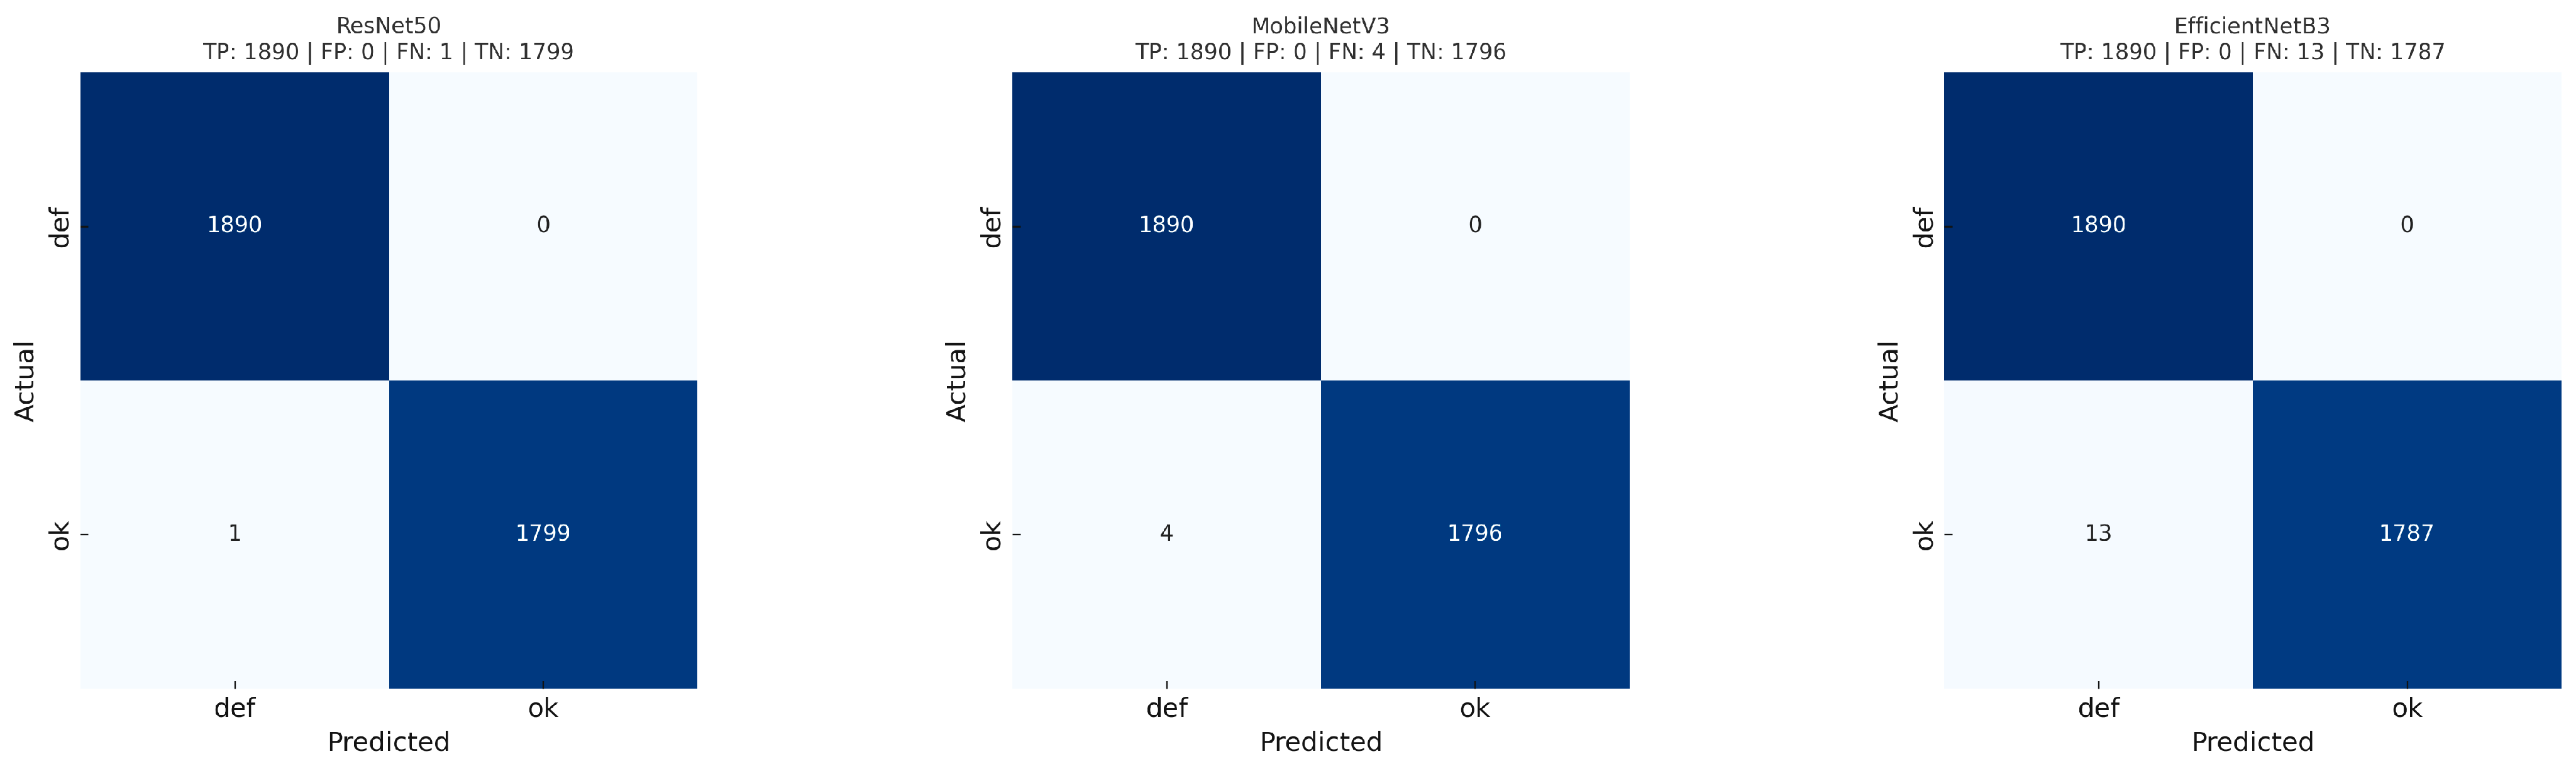
To evaluate and compare the binary classification performance of the proposed models, confusion matrices for ResNet50, MobileNetV3, and EfficientNetB3 were generated and are illustrated in
Figure 14. All three models demonstrated strong performance in accurately identifying defective and non-defective samples from the test dataset. The ResNet50 model achieved near-perfect results, correctly classifying all defective samples and misclassifying only a single OK sample as defective, yielding the best performance in terms of both false positives and false negatives. MobileNetV3 followed closely, also achieving flawless detection of defective items but with four OK instances incorrectly labeled as defective. EfficientNetB3 also achieved perfect true positive classification for defects but exhibited the highest number of false positives among the three, misclassifying thirteen OK samples as defective. ResNet50 had one false alarm (non-defective part flagged as defective), MobileNetV3 had four, and EfficientNetB3 had thirteen, while none of the models missed any actual defects (no false negatives). This visual comparison highlights the trade-off between model complexity and misclassification cost, suggesting that ResNet50 offers the most balanced and robust performance among the tested architectures, while MobileNetV3 remains a lightweight yet competitive alternative for real-time deployment scenarios.
4.4. Real-Time Testing
To evaluate the model’s performance in a deployment scenario, the trained model was exported to TorchScript and quantized for real-time inference. This phase assessed real-time performance using lightweight models deployed on a Raspberry Pi 5. A total of 100 test samples were evaluated under live streaming conditions via webcam input. Models were converted to TorchScript for optimized inference. OpenCV pipelines handled real-time image capture, preprocessing, and display.
Real-Time Testing Procedure:
A live video stream was initialized via the camera module.
Each frame was resized, normalized, and passed through the quantized model.
The prediction result (Defect/No Defect) and inference time were displayed on the live feed.
A total of 100 samples were evaluated during testing, simulating real inspection use cases.
The real-time evaluation involved testing several state-of-the-art models, including ResNet50, EfficientNetB3, and MobileNetV3. Despite challenges like low-contrast images and dataset imbalance, EfficientNetB3 and MobileNetV3 Models trained and validated through offline procedures were deployed to classify live image captures from a webcam (
Table 2). This approach allowed for the assessment of each model’s reliability, accuracy, and robustness when presented with practical variability, such as changing lighting conditions, different orientations, and subtle defect characteristics.
We measured the model’s inference speed and computational load under real-time conditions. Inference speed is reported in Frames Per Second (FPS) the number of video frames (images) processed per second. This throughput metric (FPS) directly reflects the system’s real-time processing capability. Additionally, we compute the complexity model in terms of GFLOPs, which denotes the number of Giga (billion) Floating-point Operations required per inference. Reporting GFLOPs provides a hardware-agnostic measure of computational cost, allowing us to compare model efficiency independently of the test platform.
By utilizing a webcam-based real-time application, this study provides an early-stage evaluation of model feasibility in practical environments. These insights can guide future efforts to fine-tune model architectures, develop ensemble techniques, and integrate these systems into production workflows. Ultimately, the goal is to enhance both accuracy and efficiency in defect detection systems for industrial applications.
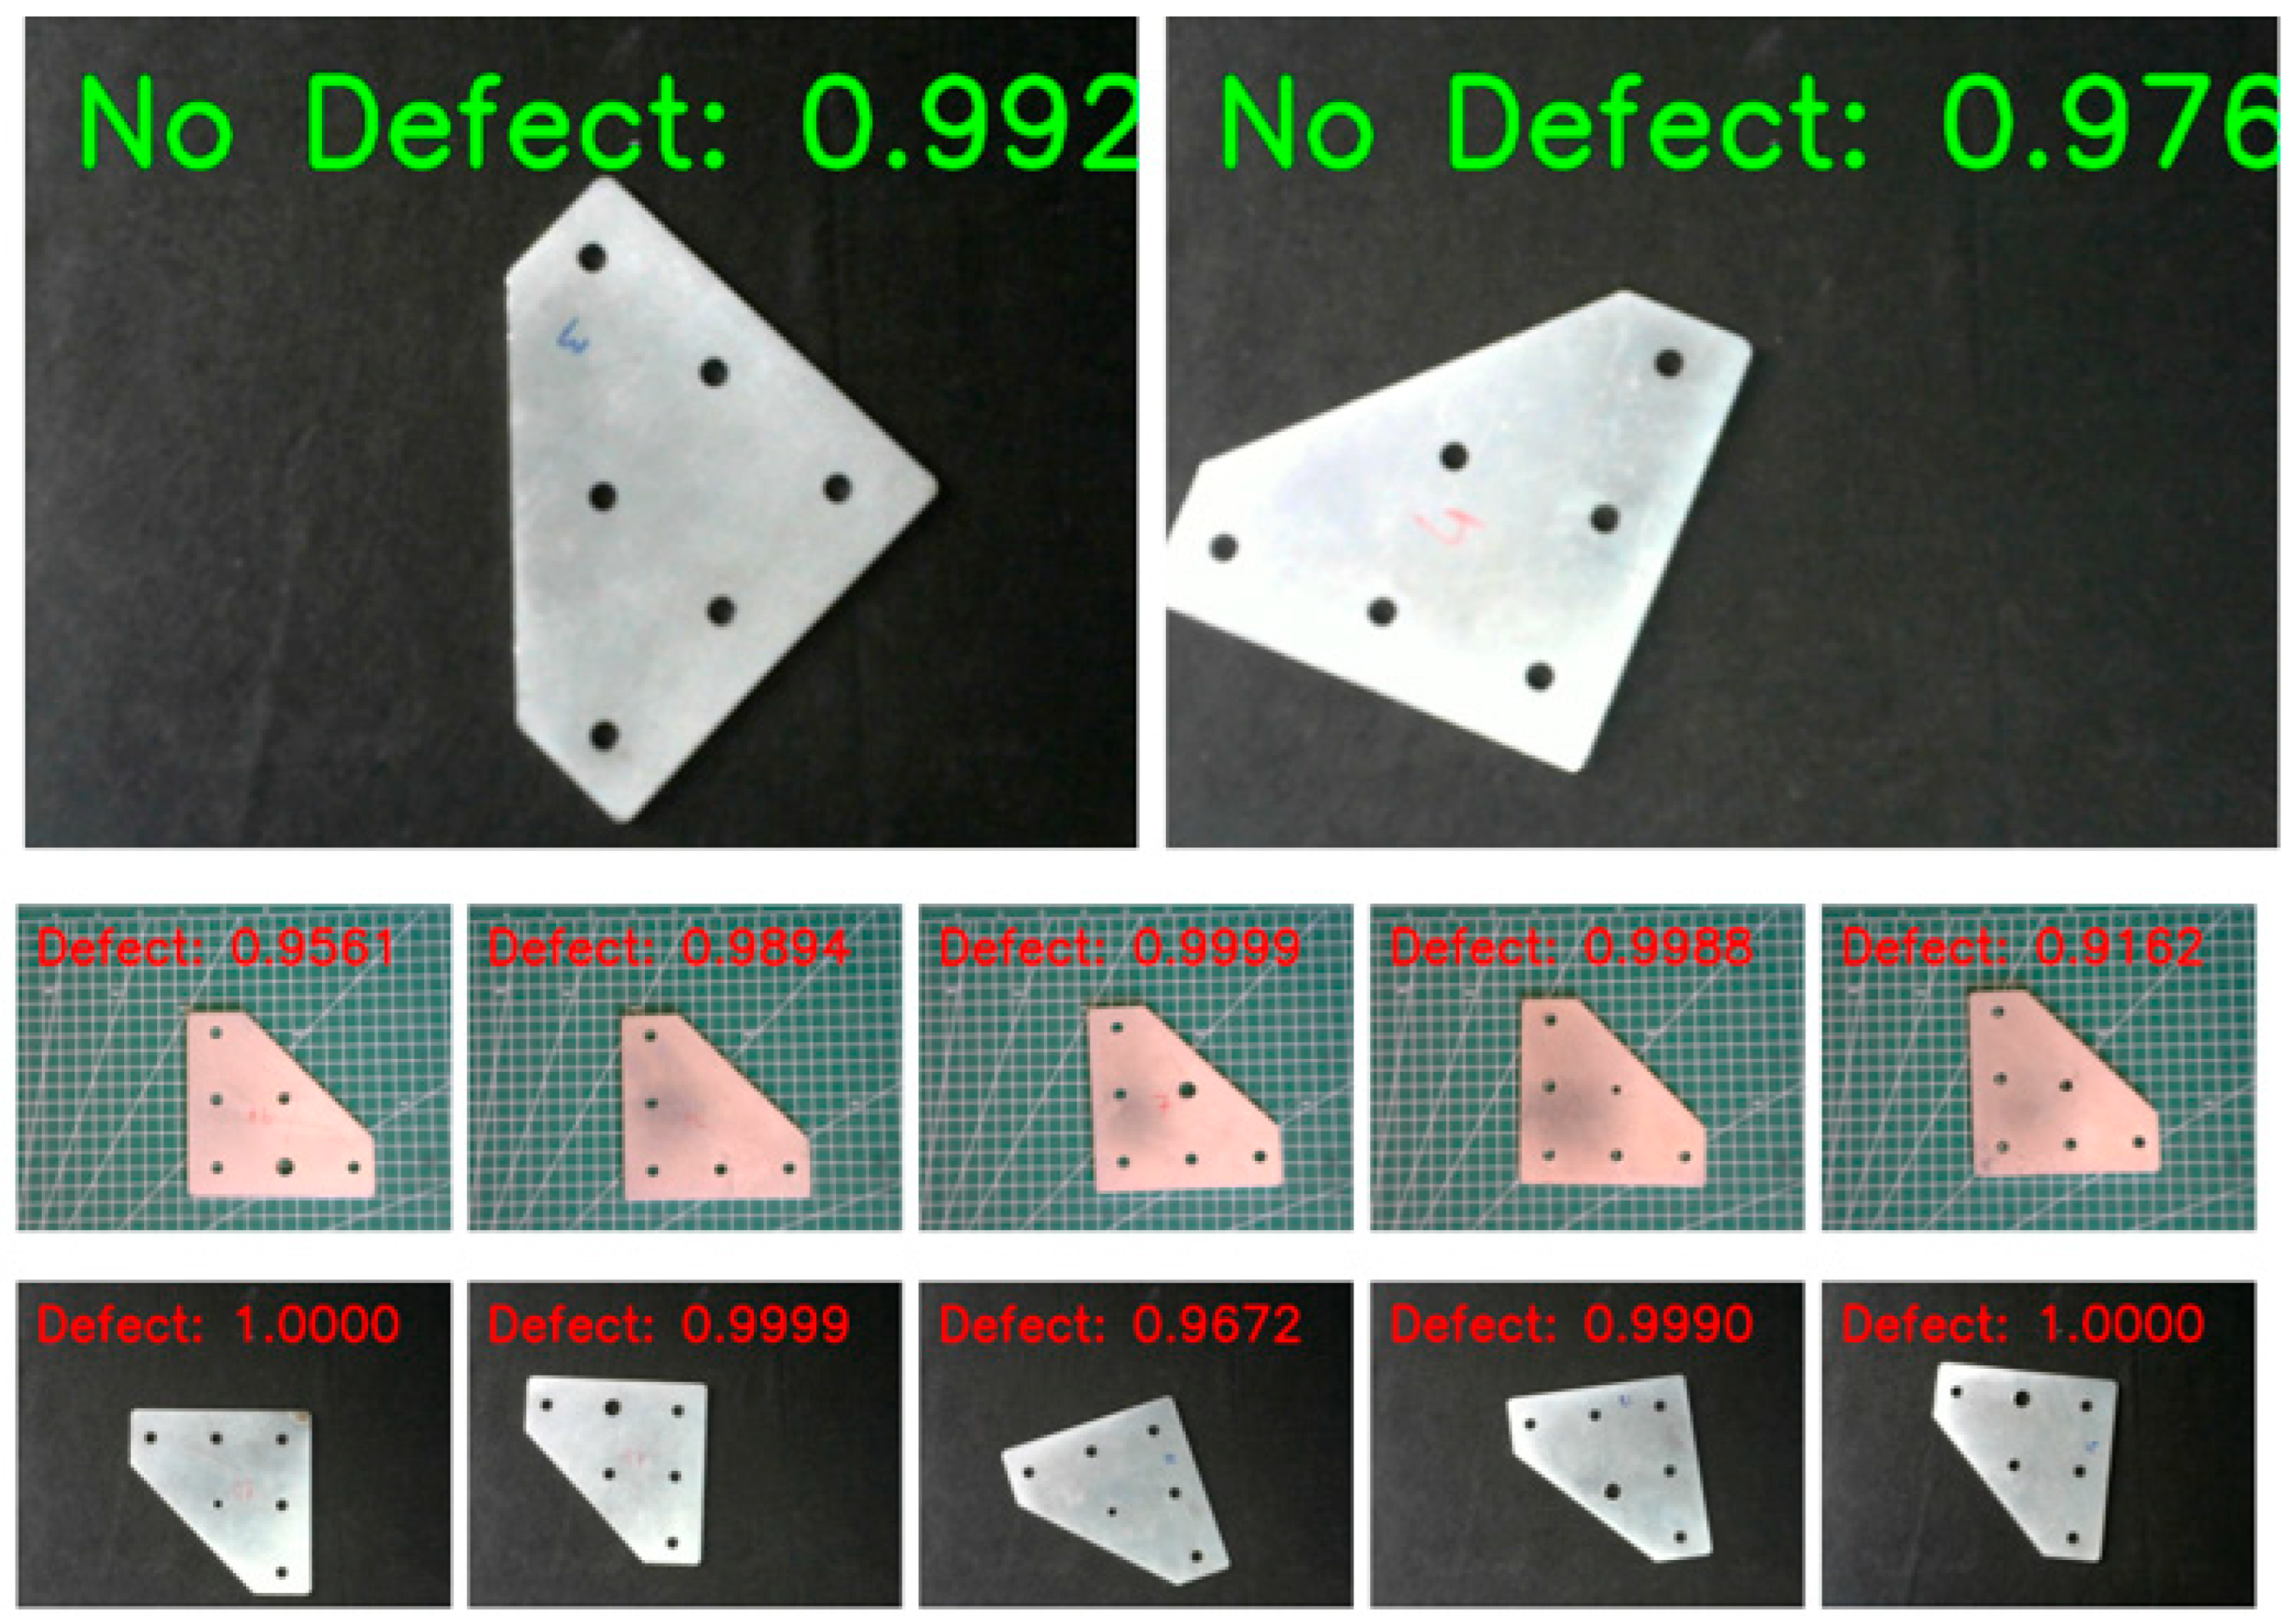
Figure 15 and
Figure 16 illustrate real-time inference outcomes using MobileNetV3-Large and EfficientNet-B3 models, respectively. MobileNetV3-Large consistently achieved high-confidence predictions (probabilities often exceeding 0.99) across different backgrounds and lighting conditions, highlighting its suitability for robust edge deployment in zero-defect manufacturing systems. EfficientNet-B3 similarly demonstrated reliability by accurately identifying defective plates with high confidence (0.98–1.00), even under varied lighting and positional challenge.
During our real-time inference evaluations, we attempted to apply Post-Training Quantization (PTQ) to the trained model to reduce computational load and latency. However, the quantized (INT8) version of the model exhibited a substantial drop in prediction accuracy compared to the original full-precision model. In practice, we observed that Post-Training Quantization (PTQ) introduced significant degradation in the model’s performance and was consistent with reports that quantizing both weights and activations can markedly impact accuracy. This accuracy loss was severe enough to render the PTQ model unsuitable for deployment, so we ultimately did not adopt the quantized model in the final real-time system.
Further analysis suggests that the accuracy degradation was exacerbated by platform mismatches and deployment environment differences affecting inference reliability. In other words, the conditions under which the model was quantized (e.g., the calibration data and development hardware/software) did not perfectly align with the conditions of the target deployment platform. Such discrepancies can introduce additional quantization errors and inconsistency in model outputs. For example, when a model trained in floating-point is run on hardware with 8-bit fixed-point arithmetic, the conversion to low-precision operations can inject quantization noise that degrades accuracy. In our case, these platform-specific numerical differences led to unreliable inference results with the PTQ model, undermining the benefits of quantization. This finding aligns with recent studies showing reliability issues in current PTQ methods, where average accuracy may be high, but significant drops can occur in specific cases [
31].
Given the unacceptably large accuracy drop and potential unpredictability, we opted to retain a higher-precision model for real-time testing to ensure consistent performance.
It is worth noting that the efficiency gains from quantization remain highly attractive, and we consider our PTQ outcome as a motivation for future improvements rather than a definitive failure. Going forward, we plan to explore more advanced quantization and optimization techniques to achieve faster, resource-efficient inference without sacrificing accuracy. We will investigate enhanced PTQ strategies (for example, using improved calibration methods or mild fine-tuning after quantization) and Quantization-Aware Training (QAT), which integrates quantization into the training process and is known to better preserve accuracy at low bit widths. Additionally, other model optimization methods such as network pruning, weight clustering, or knowledge distillation will be considered alongside quantization in our future work. By addressing the identified platform and environment mismatches and leveraging these techniques, we aim to deploy an optimized model that maintains high prediction reliability in real-time conditions while reaping the benefits of reduced model complexity and latency.
5. Discussion
The evaluation of lightweight deep learning models—MobileNetV3-Large, EfficientNet-B3, and ResNet50—on the Raspberry Pi 5 revealed critical trade-offs between model complexity, inference speed, and deployment feasibility under industrial conditions. Deployed within a webcam-based inspection setup processing 100 real-time samples, each model exhibited distinct performance characteristics. MobileNetV3-Large achieved the highest throughput (~8 FPS, ~125 ms inference time) and a 96% accuracy, making it highly suitable for real-time defect detection on resource-constrained edge devices. This combination of speed, size, and accuracy highlights its robustness, particularly under diverse lighting and surface conditions.
EfficientNet-B3 offered a balanced performance profile with ~4.7 FPS and an inference time of ~213 ms. It achieved 95% classification accuracy and consistently high confidence levels (0.98–1.00), suggesting it is well-suited for scenarios where interpretability and robustness to defect variations are prioritized over speed.
ResNet50, while yielding near-perfect offline accuracy (99.98%) and superior feature extraction capabilities, encountered practical deployment limitations. Although executable on Raspberry Pi 5, its inference speed was considerably lower (~3.87 FPS, ~248 ms), and attempts to apply 8-bit post-training quantization (PTQ) failed due to unsupported operations or severe accuracy degradation. These issues stem from architectural complexity (~25 million parameters) and lack of compatibility with edge hardware, underscoring the need for model-specific optimization techniques. Without quantization-aware training or targeted pruning, ResNet50 remains impractical for real-time use on embedded systems.
Beyond performance metrics, interpretability was assessed using Grad-CAM heatmaps to visualize the regions that influenced model decisions. All models generally focused on semantically relevant areas—typically around visible hole defects—validating that CNNs were learning meaningful features. In instances of incorrect predictions, Grad-CAM helped reveal confounding factors such as glare or surface texture irregularities that misled the model. This diagnostic capability enhances trust in AI predictions, a critical requirement for industrial deployment where decisions must be explainable.
An interesting behavioral trend observed during real-time testing was a tendency among MobileNetV3-Large and EfficientNet-B3 to frequently predict the “Defect” class, even in borderline or clean samples. This bias likely reflects residual class imbalance in the training data or environmental factors in the test setup. Such conservative prediction behavior, while reducing false negatives, may increase false positives, highlighting the importance of dataset balancing and adaptive thresholding strategies in future work.
While class weighting and data augmentation were used to mitigate dataset imbalance during training, these approaches may not fully eliminate bias, particularly in edge deployment scenarios where environmental noise exacerbates uncertainty. To further address this issue, future work will explore more advanced imbalance handling strategies such as Focal Loss, which dynamically down-weights easy examples to focus training on harder, minority-class samples. Additionally, synthetic oversampling techniques, including SMOTE and GAN-based augmentation, will be investigated to enrich minority-class diversity without duplicating existing patterns. These methods may help reduce false positives, balance class decision boundaries, and improve generalization, especially in real-time applications with noisy or underrepresented input conditions.
6. Conclusions
This study presents a comprehensive and practical framework for deploying real-time visual defect detection systems on Raspberry Pi 5 using deep learning. By evaluating three popular CNN architectures—ResNet50, MobileNetV3-Large, and EfficientNet-B3—we demonstrate that lightweight models can achieve high accuracy in detecting geometric and structural defects under real manufacturing conditions using low-cost hardware.
Among the models tested, MobileNetV3-Large provided the best deployment trade-off, achieving approximately 8 FPS and 96% classification accuracy. EfficientNet-B3 followed closely with 95% accuracy and ~4.7 FPS, making it a viable option where slightly higher interpretability is desired at the expense of processing speed. ResNet50, despite its excellent offline performance, was not suitable for real-time use without further optimization due to its large size, slower inference, and quantization incompatibility.
Key findings include the following:
MobileNetV3 is best suited for real-time industrial deployment due to its small size, low latency, and excellent accuracy.
EfficientNetB3 offers improved robustness and interpretability at the cost of lower inference speed, ideal for applications with moderate computational headroom.
Deployment feasibility depends not only on model accuracy but also on architectural compatibility with edge hardware and quantization support.
Conservative prediction behavior, which minimizes false negatives, is preferable in safety-critical environments, even if it increases false positives.
Real-time inference on Raspberry Pi 5 at ~8 FPS confirms that affordable, portable AI-based inspection systems are viable for Zero Defect Manufacturing (ZDM). These findings lower the entry barrier for automated quality control and provide a pathway for replacing manual inspections with consistent, explainable machine vision solutions.
To address the limitations encountered with ResNet50 and improve model efficiency, future work will explore Quantization-Aware Training (QAT), which integrates quantization into the training process and is known to better preserve accuracy at low bit widths. By retraining heavier models (e.g., ResNet50 or EfficientNetB3) with QAT, it may become possible to retain high accuracy in 8-bit form and enable real-time deployment. Additional techniques such as network pruning, weight clustering, and knowledge distillation will also be investigated.
Furthermore, improvements in dataset diversity and balance are essential to mitigate class bias and improve generalization. Expanding the dataset to include more varied defect-free and defective samples across lighting and orientation scenarios will reduce the model’s over-reliance on specific visual cues. More adaptable architectures such as edge-optimized transformer models or the use of small hardware accelerators (e.g., TPUs) can also enhance inference throughput.
In summary, this research confirms the potential of lightweight deep learning models for reliable real-time defect detection on low-power embedded platforms. With targeted optimization, these models can be further refined to meet the demands of high-throughput and interpretable industrial inspection.
Despite the encouraging results, a key limitation of the current study lies in the use of a controlled dataset with predefined defect types, which may not fully capture the variability present in actual production environments. As such, the generalizability of the proposed framework to more complex, real-world industrial scenarios remains to be validated. Future work will prioritize the integration of datasets collected from diverse manufacturing lines including automotive and aerospace sectors to evaluate robustness under varying lighting conditions, material textures, and background complexities. This effort will be essential for advancing the system from a prototype to a field-ready solution for defect detection.


