Abstract
This research evaluates the performance of six metaheuristic algorithms in the active and reactive power management of wind turbines (WTs) integrated into an AC microgrid (MG). The population-based genetic algorithm (PGA) is proposed as the primary optimization strategy and is rigorously compared against five benchmark techniques: Monte Carlo (MC), particle swarm optimization (PSO), the JAYA algorithm, the generalized normal distribution optimizer (GNDO), and the multiverse optimizer (MVO). This study aims to minimize, through independent optimization scenarios, the operating costs, power losses, or CO2 emissions of the microgrid during both grid-connected and islanded modes. To achieve this, a coordinated control strategy for distributed generators is proposed, offering flexible adaptation to economic, technical, or environmental priorities while accounting for the variability of power generation and demand. The proposed optimization model includes active and reactive power constraints for both conventional generators and WTs, along with technical and regulatory limits imposed on the MG, such as current thresholds and nodal voltage boundaries. To validate the proposed strategy, two scenarios are considered: one involving 33 nodes and another one featuring 69. These configurations allow evaluation of the aforementioned optimization strategies under different energy conditions while incorporating the power generation and demand variability corresponding to a specific region of Colombia. The analysis covers two-time horizons (a representative day of operation and a full week) in order to capture both short-term and weekly fluctuations. The variability is modeled via an artificial neural network to forecast renewable generation and demand. Each optimization method undergoes a statistical evaluation based on multiple independent executions, allowing for a comprehensive assessment of its effectiveness in terms of solution quality, average performance, repeatability, and computation time. The proposed methodology exhibits the best performance for the three objectives, with excellent repeatability and computational efficiency across varying microgrid sizes and energy behavior scenarios.
1. Introduction
1.1. Problem Description
In recent years, the global shift towards renewable energy sources and distributed generation technologies has significantly accelerated the transformation of electrical systems, driving improvements in sustainability, efficiency, and resilience [1]. In this evolving landscape, microgrids (MGs) have emerged as a key solution, given their ability to integrate a wide variety of distributed energy resources and operate flexibly in both grid-connected and islanded modes. This flexibility entails more efficient energy management, balances local generation and demand, improves system reliability, and contributes to reducing environmental impacts [2,3]. Moreover, the growing global energy demand, in addition to the technical, economic, and environmental constraints of conventional power systems, further highlights the need for innovative and decentralized paradigms (e.g., MGs) to address the challenges of operating modern power systems [4,5].
MGs are small- to medium-scale systems that coordinate multiple distributed generators (DGs) to optimize the use of locally available energy resources [5]. Depending on system configuration and operational criteria, MGs can seamlessly transition between grid-connected [6] and islanded [7] operations. Among the renewable technologies integrated into MGs, wind turbines (WTs) play a prominent role due to their widespread availability, their ability to generate power around the clock, their low maintenance costs, and their lack of greenhouse gas emissions [8,9]. These attributes align closely with global sustainability goals, particularly with those aimed at reducing dependence on fossil fuels and mitigating environmental degradation.
The intelligent operation of renewable energy sources has been widely studied in recent years, with a particular emphasis on photovoltaic systems (PVs). Numerous optimization strategies have been proposed in this regard, often yielding high-quality solutions with low computational effort [10,11,12]. However, most of these studies lack a rigorous statistical evaluation of performance and repeatability, which is essential for ensuring operational reliability in real-world applications. Optimization strategies applied to MGs must guarantee the best possible performance in every execution while maintaining short processing times in order to effectively respond to the inherent variability of both generation and demand. Ultimately, these strategies should aim to enhance the economic, technical, and environmental performance of power systems.
In contrast, wind generation has received less attention in the development of intelligent operation strategies despite its high potential to address emerging challenges, particularly the curtailment of renewable energy in countries with high levels of penetration [13]. Unlike PVs, WTs can operate continuously throughout the day, and when active power injection is not possible, their power converters can be leveraged to supply reactive power, thereby enhancing voltage support and improving system stability [14]. Nowadays, this characteristic is especially valuable in the global energy context, where the need to maximize the utilization of renewable resources is more urgent than ever. In this vein, the efficient operation of WTs within electrical networks, particularly in MGs, has become a critical research focus necessary for progressing toward more flexible, resilient, and sustainable power systems.
1.2. Literature Review
To enable the effective integration and intelligent dispatch of WTs in MGs, it is essential to develop advanced power management strategies [15]. These strategies must ensure the optimal utilization of generation resources while observing the fundamental technical constraints, such as the active and reactive power balance, voltage and current limits, and the operational boundaries of generation units [16].
Below is a review of the most relevant studies that address the optimal operation of WTs, with a specific focus on strategies involving the coordinated control of active and reactive power.
In [17], the authors aim to reduce energy loss in 84- and 32-node test systems by implementing a PSO-based energy management strategy for the intelligent integration and operation of WTs. Different case scenarios are analyzed by varying the number of installed turbines—each with a heuristically assigned nominal power. This study reports energy loss reductions of up to 50.72% in the 84-node system and approximately 73% in the 32-node system. However, the WTs are operated at their maximum power point while considering a fixed power factor without adjusting the active and reactive power according to system demand, which limits the adaptability and practical applicability of the approach.
In [18], the focus shifts to minimizing operating costs, emissions, and losses in a 30-node system by replacing diesel generators with wind farms at specific nodes. The proposed strategy includes fixed-step active and reactive power control, considering the network’s technical constraints. Despite achieving substantial improvements, the fixed-step nature of the control limits the responsiveness of generation units. A continuous control framework could enhance adaptability to load variations and better support the technical, economic, and environmental performance of the system.
The authors of [19] address the optimal power dispatch problem through a day-ahead WT power injection strategy based on the NSGA-II algorithm [20]. Their multi-objective formulation accounts for a detailed hourly power flow analysis and multiple operational constraints, including voltage profiles, transformer tap positions, and harmonic distortion. Implemented on 33-, 69-, and 29-node test systems, the methodology consistently improves technical performance but leaves room for future work on economic and environmental optimization, as well as on the exploration of alternative metaheuristic algorithms.
In [21], a multi-objective approach is proposed to enhance the technical performance of networks integrating PV, WT, and electric vehicle resources. Using the cooperative dual population evolutionary algorithm (c-DPEA), collective cell migration optimization (CCMO), and the weighted optimization framework (WOF), the authors optimize the reactive power dispatch of systems with 14, 33, 39, and 118 nodes. The results demonstrate that intelligent reactive power control significantly reduces losses and voltage deviations, with the CDPEA outperforming other methods in dynamic environments.
In the work by [22], the objective is to reduce the operating costs and energy losses of an MG. To this effect, a Monte Carlo algorithm is used in conjunction with an interval-based optimal power flow model that accounts for wind variability. The test system considered is the IEEE 118-node benchmark feeder, which includes eight WTs. The power injection of each turbine is managed through the intelligent adjustment of their corresponding power output intervals. The results demonstrate that the proposed strategy effectively addresses the problem, although performance could be further improved by directly optimizing the WTs’ power injections rather than merely managing their allowable power intervals through the Monte Carlo approach. This could lead to higher efficiency and increased benefits.
The study presented in [23] focuses on minimizing the operating costs of a 30-node MG. To this effect, several scenarios are analyzed that involve different combinations of PVs and WTs while accounting for the inherent uncertainty of these renewable technologies. A genetic algorithm (GA) is employed to manage the active power injected by renewable generators. While this approach delivers a satisfactory performance, it could be enhanced by incorporating the PGA variation of this methodology. Additionally, the framework could be expanded by introducing objective functions aimed at improving the system’s technical conditions.
In [24], a GNDO algorithm is implemented to improve the economic performance of a power system that includes thermal units, PVs, and/or WTs within the framework of four case studies. The proposed strategy outperforms other benchmark techniques presented in the paper, but it does not consider technical constraints such as line current limits or nodal voltage variations.
To reduce power losses in a 28-node test system, the work by [25] employs the JAYA algorithm, which achieves this goal through the strategic placement and intelligent management of PVs and WTs. Although the approach exhibits improvements in terms of technical performance compared with other benchmark techniques and the base case, it does not account for line current constraints or reactive power injection from the WTs.
In [26], the authors aim to minimize the operating costs and energy losses of a 30-node power network. To this effect, an MVO for managing its PVs and WTs is applied. The proposed strategy outperforms all other benchmark methods under study. However, this paper does not specify the technical constraints considered in the analysis.
To provide a comprehensive and critical overview of prior research focused on improving MG performance through intelligent wind generation management, Table 1 compiles some key studies, outlining the methodologies adopted, the test systems utilized, the indicators considered for optimization, and the type of power managed—be it active, reactive, or a combination of both.

Table 1.
Summary of recent research on optimization problems involving intelligent WTs management.
1.3. Identified Research Needs and Opportunities
Our review of the most relevant works on the optimal operation of WTs in MGs (Table 1) reveals several common patterns in the existing methodologies. Most proposals employ well-established metaheuristic algorithms such as PSO, GAs, and variants of evolutionary techniques that are primarily focused on active power control. The widespread use of these strategies is due to their ease of implementation, their ability to handle multiple decision variables, and their strong performance when solving complex problems in contexts where exact methods or commercial tools often fail or show limited effectiveness [31].
Additionally, the test systems commonly used in these studies feature small-scale topologies, e.g., 14-, 33-, 34-, or 69-node networks, mostly under grid-connected conditions. Regarding the objective functions considered, there is a strong emphasis on minimizing operating costs and technical losses, with a limited integration of environmental indicators. Moreover, the validation methods employed are generally deterministic, with little or no consideration of statistical repeatability and, in many cases, with no assessment of computation times. This limits the understanding of the robustness and applicability of these methodologies in real-world scenarios.
The key gaps observed in this comparative analysis have motivated this study. Firstly, only a few works address the coordinated control of both active and reactive power in WTs within MG environments, despite these devices’ great potential for providing voltage support through power electronic converters, especially in scenarios where active power injection is limited or curtailed (i.e., renewable energy curtailment events). Secondly, most of the existing methodologies fail to simultaneously consider the three fundamental pillars of energy system performance: technical indicators (e.g., voltage quality and power losses), economic indicators (e.g., operating costs), and environmental indicators (e.g., CO2 emissions). This limits their applicability in addressing the multifaceted challenges currently faced by modern power systems.
Furthermore, it is evident that operational strategies must be adaptive and capable of effectively responding to the shifting priorities of grid operators and asset owners, which can vary depending on system conditions and external factors. At times, economic efficiency may be the main concern. In other situations, technical reliability becomes critical, and during environmental crises, minimizing the environmental impact associated with energy consumption takes precedence. Therefore, it is essential to develop a strategy that delivers optimal performance regarding economic, technical, and environmental aspects, allowing for intelligent and efficient energy management that is aligned with the real-world operational requirements of MGs in both grid-connected and islanded modes.
1.4. Proposed Optimization Methodology and Performance Validation
In light of the research opportunities identified in the literature, this study addresses current challenges by proposing a novel optimization framework for WT-based MGs that is capable of managing the active and reactive power outputs from WTs while considering their operation in both grid-connected and islanded modes. The optimization objectives include the minimization of operating costs, energy losses, and CO2 emissions (critical performance indices in AC MG operation) while considering key technical constraints such as power balance, generator capacity limits, current thresholds, and voltage bounds, all of which reflect the real operational behavior of AC MGs. Due to the nonlinear and high-dimensional nature of the problem, metaheuristic algorithms are employed, given their proven ability to efficiently solve large-scale and complex tasks involving power systems optimization.
To solve the proposed mathematical model, a two-stage optimization methodology is implemented. In the first stage, the PGA is used to determine the optimal dispatch of active and reactive power from WTs over a 24-hour horizon. In the second stage, the successive approximations (SA) method is applied to perform hourly power flow analyses, assessing the feasibility and quality of candidate solutions through a fitness function that aims to fulfill the established objectives while observing the problem’s constraints. The choice of the PGA as the core optimization strategy is driven by its robust global search capability, resilience to premature convergence, and adaptability to highly constrained, nonlinear problems [32]. Its population-based approach enables a broad exploration of the solution space, which is particularly advantageous for high-dimensional tasks such as the joint control of active and reactive power in WTs. Moreover, although the PGA has been successfully applied in related contexts involving PVs and battery storage, its use in wind-based MG scenarios remains largely unexplored [31,33,34], which makes it a promising and technically justified candidate for addressing the multi-criteria energy management problem under study.
In grid-connected mode, the MG assumes the presence of a main grid at the slack node, which is capable of supplying or absorbing power as required. In islanded mode, the slack node is replaced by a diesel generator, introducing generation constraints that must be observed to ensure long-term system reliability. The reverse power flow at the slack node is also restricted in this mode.
To ensure a fair and thorough evaluation, several well-established metaheuristic algorithms were selected, adapted, and tuned as comparison methodologies, including PSO, MC simulation, the GA, the JAYA, the GNDO, and MVO. As summarized in Table 1, most of these algorithms have primarily focused on active power control, and only a few (notably PSO and MC) have been used to address active and reactive power regulation. Moreover, current studies tend to optimize economic and technical objectives, such as operating costs and energy losses, while often neglecting environmental impact as a key optimization criterion.
For our comparison, the parameter types reported by the original authors (e.g., population size, number of iterations, learning rates) were preserved to ensure methodological consistency. These parameters were then tuned within literature-supported ranges to maximize the performance of each algorithm for the studied problem. Furthermore, all optimization methods employed the same SA load flow model to evaluate the feasibility and system-level impact of the proposed solutions. This ensured that the comparison was carried out under homogeneous technical conditions, making the benchmarking process both fair and technically sound.
To validate the proposed approach, a literature-reported 33-node MG model was adapted and tested in both operating modes. The system incorporated variable generation and demand profiles based on the typical conditions of Colombia. A statistical analysis was performed in order to evaluate the solution quality, repeatability, and processing times of each algorithm. Additionally, the adapted version of a 69-node system was used to model a more dynamic seven-day operation scenario. Daily demand and renewable generation profiles were generated using artificial neural networks (ANNs), allowing for a realistic representation of temporal fluctuations.
1.5. Main Contributions
This research makes significant contributions to both the academic field and the electrical power sector. From an academic perspective, it introduces the PGA to the coordinated active and reactive power control of WTs within MGs while optimizing economic, technical, and environmental performance indicators. This novel application addresses clear gaps in the existing literature, as most studies have primarily focused on active power management or on isolated objectives, often neglecting a comprehensive assessment of system performance. The proposed optimization methodology is designed to be flexible and adaptive to changing operational priorities. As previously mentioned, its effectiveness is validated through testing on 33- and 69-node MGs, performing statistical analyses regarding solution quality, repeatability, and computational performance. A comparative study against six well-established metaheuristic algorithms is also conducted under standardized evaluation conditions, ensuring fairness and reliability in the benchmarking process.
From the perspective of the electrical power sector, this study provides a practical and intelligent tool for improving MG operation under real-world conditions while integrating wind energy. The proposed strategy enhances decision-making in dynamic environments by addressing key challenges such as renewable energy curtailment and the need for reactive power support. By simultaneously minimizing operating costs, technical losses, and CO2 emissions, our methodology supports sustainability goals and the global transition to cleaner energy systems. In addition, the optimization framework accounts for realistic technical constraints (e.g., voltage, current, and generation limits), as well as for specific considerations regarding islanded operation. These characteristics ensure its applicability within regulatory and operational settings, contributing to the advancement of next-generation energy management solutions for distributed renewable systems.
1.6. Document Structure
This document is structured as follows. Section 2 presents the three objective functions, which aim to minimize operating costs, energy losses, and CO2 emissions, along with their corresponding constraints, which ensure that the implemented strategies remain within the technical limitations of the MG. Then, Section 3 outlines the solution methodology, which consists of two stages: one that applies metaheuristic techniques and another that utilizes SA to perform hourly load flow analysis and thus form the fitness function. Section 4 introduces the test systems considered, i.e., the aforementioned 33- and 69-node MGs, which can operate in both grid-connected and islanded modes. Section 5 presents the results obtained for each of the techniques used in relation to all objective functions and modes of operation. Finally, Section 6 provides an analysis of the results and outlines the conclusions of this study, along with potential directions for future research.
2. Mathematical Formulation
This section presents the mathematical formulation employed to define the optimization problem addressed in this study. First, a graphical representation of the MG components is provided. Then, the mathematical models of the objective functions (the minimization of operating costs, power losses, or CO2 emissions, as applicable) are introduced. Additionally, the technical constraints associated with the system components are detailed, with the purpose of providing realistic and feasible solutions.
Figure 1 presents a simplified schematic of the MG architecture, illustrating the intelligent operation of the WTs considered in this study. The diagram depicts a representative AC MG with five nodes. This grid incorporates WTs equipped with their corresponding power electronic converters, which enable the injection and control of both active and reactive power, as well as loads, distribution lines, and conventional generators, allowing for grid-connected and islanded operation. This configuration facilitates the visualization of the main components involved in our intelligent energy management strategy and its corresponding mathematical model, as it considers the steady-state operation of the MG. This includes the main grid or the diesel generator at the reference node (i.e., the slack node), the loads, and the WTs, as well as the most relevant operational constraints (i.e., voltage and current limits, generation capacities, and converter ratings). The figure identifies the system’s key variables and their interactions within an optimized operation framework aimed at minimizing three fundamental objective functions: operating costs, energy losses, and CO2 emissions. These functions are modeled independently to allow for flexible selection by the system operator, and they are analyzed in the context of an intelligent generator management strategy that ensures efficient operation within the permitted technical limits.
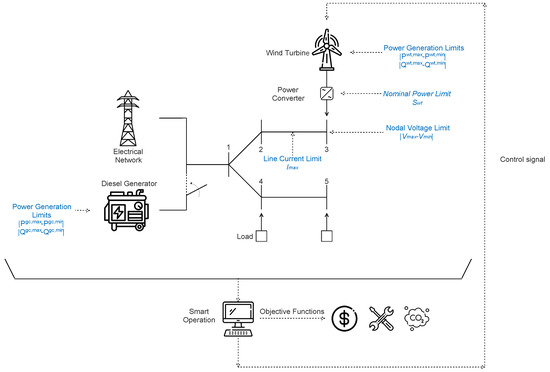
Figure 1.
Architecture of a WT-based MG.
The three objective functions adopted in this study represent essential performance criteria from economic, technical, and environmental perspectives. Rather than applying a multi-objective optimization scheme with weighted aggregation, the proposed methodology follows a flexible single-objective formulation in which each objective is independently defined and optimized. This design allows microgrid operators to prioritize specific goals—such as cost minimization, energy efficiency improvement, or CO2 emissions reduction—based on real-time operational needs or strategic requirements. Such flexibility reflects practical microgrid operation, where priorities may shift over time due to varying constraints, regulations, or energy policies [35].
This formulation enhances the practical applicability of the proposed approach, enabling tailored decision-making in both grid-connected and islanded modes. Additionally, it guarantees a technically sound and efficient dispatch of both active and reactive power from wind-based distributed generation in alignment with the selected operational criterion. The objective functions and constraints used to formulate the optimization problem are described in the following sections.
2.1. Operating Costs Minimization ()
The objective function seeks to minimize the daily operating costs of the MG. This function incorporates the cost of both energy purchasing and maintenance associated with the WT, as detailed in Equation (1).
In this equation, denotes the unit cost of the energy produced by conventional generators, while corresponds to the operation and maintenance cost of the WTs. The variable indicates the active power supplied by conventional generators at node i and hour h, whereas represents the active power generated by the WTs at node i during hour h. The summation is performed for all hours within the 24 h operation horizon and across all nodes within the MG. The parameter represents the duration of each time interval—1 h in this case. In this objective function, the power supplied by conventional generators may correspond to energy purchased from the main grid during grid-connected operation or to energy produced by diesel generators within the MG in islanded mode.
2.2. Energy Losses Minimization ()
The objective function aims to minimize the total energy losses associated with power transmission within the MG. This is expressed in Equation (2).
In this equation, denotes the set of lines in the system, while and represent the resistance of line l and the squared current flowing through it, respectively, as a result of power management within the MG.
2.3. Minimizing CO2 Emissions ()
The third objective function () aims to reduce the MG’s CO2 emissions associated with energy production by conventional generators. This is illustrated in Equation (3). Unlike the economic objectives, emissions are not monetized in the objective function. Instead, they are used as an environmental performance indicator to support decision-making, especially in environmentally sensitive areas like the city of Medellín, Colombia. This approach allows operators to evaluate trade-offs between economic, technical, and environmental goals based on changing priorities without assigning a fixed monetary value to emissions.
Most of the terms in this function have been explained in Equation (1), with the exception of , which represents the emissions associated with the conventional generator installed at node i. It is important to note that this function does not account for emissions from the WTs, as this technology, similar to PVs, does not produce emissions related to energy production [36,37].
2.4. Constraints
The operation of WTs within MGs is governed by a series of constraints associated with the technical limitations of the grid’s equipment, as well as with its operational requirements. These include the line loading limits, the allowable nodal voltage variations, the overall power balance, and the minimum and maximum active power generation limits of both the conventional generators and the WTs.
The active power balance in an MG for each hour of operation is represented by the following equation:
In Equation (4), represents the active power supplied by the conventional generator at node i during hour h, while denotes the active power demanded by the loads at the same node and hour. and represent the voltage magnitudes at nodes i and j at the same hour, respectively, and is the magnitude of the admittance between nodes i and j. In addition, and correspond to the voltage phase angles at these nodes for hour h. Finally, the term refers to the phase angle of the admittance between nodes i and j.
Equation (5) defines the reactive power balance, ensuring that, at each node and every hour, the reactive power of the system remains within equilibrium.
Here, represents the reactive power injected by the conventional generators, and denotes the reactive power demanded by the loads connected to the MG, both at node i during hour h. Meanwhile, corresponds to the reactive power supplied by the WTs at the same node and hour. This equation ensures proper management and reactive power balance at each node in the system.
In order to limit the active power output of the conventional generators and thereby prevent overloading, Equation (6) is employed.
Here, and represent the minimum and maximum active power generation limits of the conventional generators at node i. It should be emphasized that, in grid-connected mode, these power limits are determined by the energy export capabilities of the grid at the connection point, which is the typical scenario. In contrast, during islanded operation, these limits are defined by the power constraints of the diesel generators, which generally range from 40% to 80% of the fossil fuel-based generation plant’s nominal capacity.
In addition, as shown in Equation (7), it is crucial to establish a constraint on the reactive power of conventional generators in order to ensure that their operation stays within the nominal capacity limits.
where and represent the minimum and maximum reactive power limits for each conventional generator at node i.
Furthermore, for the islanded operation mode, two additional constraints are incorporated to ensure that the diesel generator installed at the slack node only injects active and reactive power into the system. In this study, the mathematical model considers both the main grid and the diesel generator as conventional generation sources. These constraints, presented in Equations (8) and (9), explicitly prevent power absorption at the slack node. This is crucial because, unlike the grid-connected mode, where the main grid can absorb surplus energy, the diesel generator lacks energy storage or absorption capabilities. As a result, these restrictions are necessary to reflect the physical limitations of the MG and ensure a feasible operational strategy under isolated conditions.
The active power injection of the WTs can be represented using Equation (10).
where and denote the minimum and maximum power limits of the WTs, respectively, while denotes the wind generation factor at hour h. This factor is determined by the wind speed and the technical characteristics of the wind turbine, i.e., the power generated by the WTs is constrained by both wind availability and the installed capacity of the turbines.
Additionally, the reactive power injection capabilities of wind turbines (WTs) within the microgrid must be explicitly considered to ensure realistic operational constraints. The electrical configuration for the connection of the WT in the microgrid is presented in Figure 2. As shown, the wind turbine is connected to the grid through a full-scale power converter system consisting of a back-to-back converter with a DC–link capacitor. This architecture enables both voltage and frequency regulation, as well as decoupled control of active and reactive power. In particular, the grid-side converter independently regulates the injection of active power () and reactive power () at each time interval, ensuring that both remain within the converter’s apparent power limit (). This capability allows the WT to flexibly manage active power delivery and provide voltage support to the grid, which is crucial for improving the flexibility and operational reliability of the microgrid, especially under variable generation and demand conditions. Equation (11) ensures that the total power injected by the converter remains within its rated apparent power capacity.
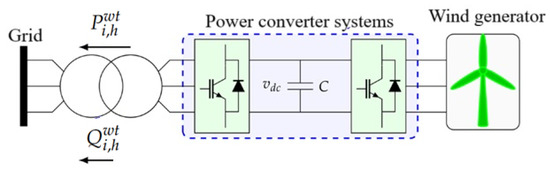
Figure 2.
Active and reactive power control of WTs [38].
In this context, Equation (12) defines the maximum allowable reactive power that a WT can inject at node i during hour h as a function of its active power output. This limitation arises from the control strategy implemented through the turbine’s power converter, whose capacity restricts the range of reactive power support. The converter enables reactive power compensation, particularly in scenarios of low wind generation or when active power injection is curtailed due to the operational constraints of the grid, allowing for better utilization of the converter’s capacity to support voltage regulation and overall system stability [39].
This expression is derived from the apparent power triangle, where the square of the apparent power S is the sum of the squares of the active power P and the reactive power Q, i.e., , which is described in Equation (11).
Physically, this equation reflects a fundamental inverter limitation: the converter can only handle a certain maximum current, which translates into a maximum apparent power. As more active power is dispatched, a lower capacity remains for reactive power. This creates a circular constraint in the P–Q plane, where the feasible operating region lies within a circle of radius .
By enforcing this relationship, the model ensures that the WTs operate within the safe and feasible region of the power converter’s capability curve, which is essential for maintaining voltage stability and preventing overloading, especially in scenarios of high renewable penetration.
This relationship allows defining the reactive power injection limits of the WTs, as expressed in Equation (13).
In this equation, represents the minimum reactive power injection allowed for the WTs at node i. In this study, this value is assumed to be zero, as reactive power consumption by the WTs is not considered. The upper bound is time-dependent and varies according to the active power output at each hour h, as defined by Equation (12).
This dynamic bounding ensures that the reactive power injection remains within the feasible limits imposed by the converter’s apparent power capability. This bounding is adapted on an hourly basis according to the active power dispatch. Such constraints are critical for accurately modeling the operational flexibility of WTs in supporting voltage regulation and overall MG stability.
Equation (14) introduces a constraint to ensure that the voltage magnitude at each node remains within predefined operational limits, a necessary condition for maintaining the stability and reliable operation of the system. These voltage limits are established in accordance with the national regulations applicable to the distribution system operator, ensuring compliance with local technical standards and regulatory frameworks. In this equation, and denote the minimum and maximum permissible voltage levels at node i, respectively.
As the final constraint, Equation (15) ensures that the current flowing through each line of the MG does not exceed its nominal capacity, thus preventing overloading and contributing to the secure operation of the system. This current limit is determined by the constructive characteristics of the MG, as defined during its design and construction phases, and reflects the thermal and operational capacity of the distribution infrastructure.
Here, refers to the current in the line between nodes i and j at hour h, while denotes the maximum current capacity of the line, beyond which its integrity may be compromised.
These constraints, together with the objective functions designed to minimize operating costs, energy losses, and CO2 emissions, constitute the core of the proposed optimization framework. This mathematical model allows for a realistic and technically sound representation of the operation of wind-based MGs under both grid-connected and islanded conditions. The formulation captures the essential dynamics and operational decisions associated with active and reactive power dispatch. Moreover, the inclusion of detailed technical constraints, such as power balance, voltage and current limits, and generation capabilities, ensures that all optimization results remain within the real physical and regulatory boundaries that govern the operation of practical AC MGs. As such, this framework constitutes a robust tool for analyzing and improving the performance of MGs while respecting their actual operational limitations.
3. Solution Methodology
This section of the paper presents the methodology employed to address the optimization problem under study, including the solution’s encoding, the algorithms used, and the parameter tuning approach adopted to maximize their performance.
3.1. Encoding for Solving the Proposed Optimization Problem
To address the studied optimization problem, six metaheuristic techniques were implemented, with the PGA as the primary strategy. As previously mentioned, the remaining methods used for comparison included the MC algorithm, PSO, JAYA, GNDO, and MVO. These techniques were selected due to their proven effectiveness in previous research, particularly when it comes to solving nonlinear and multi-nodal problems.
Figure 3 and Figure 4 illustrate the encoding scheme adopted for the active and reactive power injection of the WTs, respectively. These are per-unit values (p.u.) and are bound by the technical operating limits of both the turbines and their power electronic converters, as defined in Equations (10), (12) and (13). The active power range is determined by the wind profile at each hour and the rated capacity of the turbines, with the minimum value typically set to zero, representing shutdown conditions. The reactive power is constrained by the converter’s remaining capacity after satisfying active power requirements. This ensures that the total apparent power does not exceed the converter’s nominal rating.

Figure 3.
Active power component of the WTs.

Figure 4.
Reactive power component of the WTs.
Figure 5 presents the complete encoding structure used in the optimization process. This structure integrates both active and reactive power decision variables into a single vector of size , where denotes the number of hours in the optimization horizon (24 in this case) and the number of WTs. In the case under study, this results in a total of 144 continuous variables. Each individual (candidate solution) generated by the metaheuristic algorithm is initialized and constrained within the feasible power limits defined for the WTs and their converters, ensuring that the operational boundaries are respected from the outset of the optimization process.

Figure 5.
Complete encoding of the optimization problem.
This codification is essential for maintaining solution feasibility throughout the process and guiding the search toward realistic and implementable results. Moreover, the nonlinear and high-dimensional nature of the problem arising from the interdependence between power injections and grid constraints makes it particularly challenging to solve using conventional optimization techniques. In light of this, advanced metaheuristic algorithms are employed to efficiently explore the solution space and identify high-quality operational strategies for the MG.
To assess the performance of the metaheuristic methods used, a comparative analysis was conducted. This analysis evaluates how well each method minimized the operating costs, energy losses, and CO2 emissions of the MG, which helped to identify the most suitable optimization approach for systems of this type and for specific operational scenarios.
3.2. Population-Based Genetic Algorithm (PGA)
The PGA is based on the evolutionary process observed in humans, animals, and other living organisms, which involves selection, recombination, and random mutation processes [40]. Unlike the traditional GA, the PGA employs evolution rules based on descendant populations, allowing the entire parent population to be replaced by fitter descendants that contain the best genetic information within their encoding, which accelerates the convergence of the algorithm and improves the quality of its solutions.
The solution process for the proposed optimization problem is primarily divided into two stages. First, the PGA must search for the operation scheme that achieves the best impact on the defined objective function. Each individual in the population represents a candidate schedule in terms of active and reactive power injection by the WTs.
In the second stage, the impact of each candidate solution is evaluated through an hourly power flow analysis, which calculates the corresponding values of the objective function and the system constraints based on the dispatched active and reactive power of the WTs. These results are then processed by a fitness function, which penalizes the objective function whenever any constraint is violated. This penalization strategy enhances the exploration capability of the optimization method and contributes to reducing the overall processing times [41].
The hourly power flow analysis conducted in this work was based on the SA method, a numerical technique that allows for the efficient load flow analysis of electrical systems with low processing times and excellent convergence performance [42]. Specifically, the method performs 24 load flow calculations, adjusting the generation and demand profiles according to the data for each time period, and it evaluates the corresponding impact on the objective function and system constraints for each hour.
With the nodal voltage values obtained from the load flow analysis and the system parameters, it is possible to compute the effect on the objective function for each hour in the analyzed day of operation while considering, through the adaptation function, the penalty value applied when any constraint is violated. After analyzing all 24 h, the effects on the objective function for each hour are summed, which yields the result for one day of MG operation for each individual provided by the PGA.
The iterative process used to implement the PGA for efficiently solving the studied optimization problem is as follows:
- Step 1. The initial population is randomly generated, with active power values ranging from zero (i.e., the minimum power output of the WTs) to the maximum power levels produced by the turbines operating at their maximum power point during an average day of operation. Similarly, the reactive power values to be supplied by the WTs are randomly generated while considering the available capacity of the power converters. Each individual in the population is encoded, as illustrated in Figure 5.
- Step 2. The fitness function values of each individual in the population are evaluated via an hourly power flow analysis based on the SA method, which will be described later in this section. This evaluation depends on the selected objective function, which, in this case, may involve minimizing operating costs, energy losses, or CO2 emissions, as applicable.
- Step 3. After evaluating all individuals in the population, the best solution is stored as the incumbent for the optimization problem.
- Step 4. Through selection, recombination, and mutation processes, a new offspring population is generated in each iteration. During the selection process, four parents are randomly chosen from the population. These parents compete against each other to identify the two fittest candidates for recombination. Recombination generates offspring by averaging the information contained within the parents, which is possible thanks to the continuous nature of the optimization problem. Then, mutation introduces changes in the offspring by randomly generating values between the minimum and maximum power limits assigned to the time periods selected for this effect. The time periods for mutation and the number of periods dedicated to this process are defined as PGA parameters, and they generally affect the proposed encoding.
- Step 5. The fitness function of the offspring population is evaluated using the aforementioned hourly power flow method.
- Step 6. Based on the fitness values of the offspring and parents, a comparison is made, and the parents with lower fitness than the best offspring are replaced. It is possible that, in a given iteration, the entire parent population is replaced without affecting convergence since the offspring’s encodings contain the information from the best parents.
- Step 7. The incumbent solution is updated.
- Step 8. If the maximum number of iterations is reached, the incumbent solution is selected as the optimal solution to the problem, and the iterative process is terminated. If the maximum number of iterations is not reached, the process returns to Step 4, and the iterations continue from there.
The pseudocode presented in Algorithm 1 is associated with the above-presented process is as follows:
| Algorithm 1: Iterative process of the PGA |
 |
In this methodology, the fitness function is responsible for evaluating the impact of each individual on the operating costs, energy losses, or CO2 emissions of the MG, as well as on its set of constraints. This function processes the data provided by the PGA and ensures that each solution complies with the technical and operational constraints of the MG. The evaluation allows the PGA to operate efficiently, ultimately guiding the search toward the optimal solution for the MG.
The process implemented for evaluating each of the individuals generated by the PGA for each hour of the day is as follows:
- Step 1. The power demand of the users connected to the MG during hour h is entered.
- Step 2. The active and reactive power supplied by the WTs in the system is entered for hour h.
- Step 3. The system’s load flow for hour h is executed using the SA method. This method calculates the magnitude of the nodal voltages in the network, which are necessary for calculating the objective function and system constraints [42].Equation (16) is used to calculate the nodal voltages, where represents the voltages at all demand nodes during the h-th period of iteration . In addition, is the admittance matrix relating the demand nodes, and corresponds to the power demand and the WTs’ generation. and represent the connection to the reference node and its voltage, respectively. The recursive process converges when the stopping criterion reaches a convergence tolerance of .
- Step 4. Using the previously obtained information, the objective function is calculated. Depending on the case, this may refer to operating costs, energy losses, or CO2 emissions. Subsequently, the violations of the previously established constraints are calculated. All of this is done for the hour h under analysis.
- Step 5. Using the outcomes of the preceding evaluations, the fitness function integrates the original objective function with penalty terms that are activated when key constraints are violated. In this case, this has to do with the nodal voltage limits, line current capacities, and diesel generator output bounds. As the problem is formulated as a minimization task, constraint violations increase the objective function value, discouraging the selection of infeasible solutions.This penalization strategy not only enforces constraint compliance but also enhances the optimizer’s ability to explore near-infeasible regions. This improves population diversity, accelerates convergence, and often yields higher-quality solutions with reduced computational effort [31]. The corresponding formulation of the fitness function is presented below:Equation (17) represents the fitness function (FF), which is composed of the objective function (FO) to be minimized and a penalty () that is applied if the established loading and voltage constraints are violated. In this particular case, the best solution of the FF corresponds to the smallest value found.As penalty in the grid-connected case, the following is considered:In Equation (18), and correspond to loading and voltage violations, respectively, and and are penalty factors implemented when the aforementioned violations occur. These penalty factors were heuristically set as 1000, thereby increasing the value of the associated objective function. This implies that the solution quality will be reduced as a consequence of the penalties incurred due to violations.On the other hand, for the islanded operation, two additional constraints must be added, as shown in the following equation:Here, and are the same as those mentioned in Equation (18), while and correspond to the violations associated with energy sales at the slack node and with generation outside the established limits of diesel generators.It is worth emphasizing that, in this study, certain constraints are not included in the fitness function since they are inherently satisfied through structural aspects of the model that guarantee feasibility by design.Specifically, the active and reactive power limits of the WTs are inherently satisfied through the adopted encoding strategy (see Figure 3, Figure 4 and Figure 5). Each candidate solution is constructed within admissible power ranges determined by wind resource availability and by the rated capacity of power converters. This approach ensures that the generation limits of the WTs are respected at all times without the need for penalization in the adaptation function, which reduces the computational burden while improving search efficiency.Moreover, the active and reactive power balance within the MG is addressed through a power flow analysis executed on an hourly basis. This analysis, based on the SA method (Equation (16)), solves the Nonlinear Balance Equations (4) and (5), ensuring that each candidate solution satisfies the physical laws governing power injection, demand, and network behavior. As such, the power balance constraint is not handled through penalty terms but rather through explicit calculation, which makes it an intrinsic part of the model evaluation.By managing these constraints in a structural fashion via encoding and power flow analysis, the model avoids unnecessary penalization and enhances computational efficiency, allowing the fitness function to focus solely on dynamic and system-dependent constraints.
- Step 6. The fitness functions for each hour h are then summed to obtain a single value.
- Step 7. Finally, the fitness function is sent to the PGA. This entire process is repeated for each iteration performed by the algorithm, providing new parameters every time.
3.3. Algorithms Used for Comparison
To evaluate the effectiveness of the proposed approach, five widely used metaheuristic algorithms (MC, PSO, JAYA, GNDO, and MVO) were employed to solve the same optimization problem. These methods were selected for their previous use in the optimal operation of WTs within MGs. However, none had been applied to the specific challenge addressed in this study: the coordinated control of active and reactive power in WTs to improve economic, technical, and environmental performance indicators. All algorithms were implemented in their standard form—as commonly reported in the literature—and carefully tuned through a dedicated parameter optimization process to ensure optimal performance under identical conditions. This ensured a fair and consistent comparison framework. The main characteristics of each of the methods used for comparison are summarized below and detailed in the cited references.
- The MC algorithm operates by generating a list of elite solutions obtained by evaluating random populations that are independently generated in each iteration. In the context of this research, each individual proposed by MC corresponds to a solution for the operation of WTs within the analyzed MG. In each iteration, MC generates a population, evaluates the fitness function of each solution, and stores the best one in an elite list. Finally, the best solution from the elite list is selected as the solution to the analyzed problem [43].
- The PSO is a bio-inspired optimization method based on the behavior of swarms or herds [44]. This algorithm considers both the individual behavior of each particle and that of the leader, i.e., the particle currently holding the best position in the solution space. By employing random values in each step of the particle swarm’s evolution, the algorithm avoids local optima. Once the convergence criterion (typically defined by a maximum number of iterations) is met, all particles converge to the same location, which corresponds to the best solution. This behavior mirrors natural swarming, where the group converges to the most abundant food source in the environment.
- JAYA, named after the Sanskrit translation for victory [45], is a metaheuristic algorithm that combines features of evolutionary algorithms and swarm intelligence. This algorithm seeks the global best solutions within the populations it generates and discards the worst individuals. Its main difference from other population-based algorithms is that it does not rely on manually set parameters, which could potentially affect its efficiency.
- The GNDO, belonging to the family of mathematics-inspired techniques, operates based on a Gaussian distribution, and it features both local and global exploration phases [46]. In the former, the search for a new solution involves analyzing the mean and standard deviation of the population, while in the latter, a variety of random variables is used to explore a wider search space in pursuit of the optimal solution.
- The MVO is based on multiverse theory and emulates the presence of black and white holes for the exchange of information between multiple universes. Additionally, wormholes are employed to move the solution space from one universe to a location closer to the best universe [47].
Each of these methods is applied following the same approach as the PGA; specifically, they are used to determine the active and reactive power dispatch scheme for the WTs installed within the MG. The same hourly power flow analysis based on successive approximations is employed to evaluate the objective functions related to operating costs, energy losses, and CO2 emissions, as well as the problem constraints. These elements are integrated through the proposed fitness function, which returns the impact of each individual generated during the iterative process of the optimization methodologies.
3.4. Tuning the Optimization Algorithms
To ensure optimal performance and fair comparison between the analyzed optimization methodologies, a parameter tuning process was carried out. This was done via PSO, following the meta-optimization approach described in [48]. Note that the PSO was not used to solve the MG optimization problem itself but rather to identify the best-performing internal parameters (e.g., population size, number of iterations, inertia weight, and learning coefficients) for each algorithm.
The PSO algorithm used for tuning was configured with eight particles, a maximum of 300 iterations, cognitive and social acceleration coefficients of 1.494, and an inertia weight that linearly decreased from 0.7 to 0.001. Each candidate parameter set was evaluated over 100 independent runs on a representative test case in order to minimize the average value of the objective function and the variability of the results, thereby ensuring statistical robustness.
It is important to note that the tuning process was performed independently for each operating mode (grid-connected and islanded) to account for the specific technical constraints and characteristics of each scenario. The final set of tuned parameters for each algorithm, objective function, and system configuration is summarized in Table 2. While the specific parameters of each algorithm were tuned within the ranges reported in the specialized literature, all methods shared a common search space for the general parameters. Specifically, the number of individuals was allowed to vary between 4 and 1000, and the maximum number of iterations ranged from 2 to 15,000. This consistent configuration created a fair benchmarking scenario, where each methodology was given the opportunity to adjust its internal settings to achieve the best possible performance under the same general constraints.
Table 2.
Tuned parameters for the optimization methodologies implemented in the 33- and 69-node MGs (grid-connected and islanded modes).
This systematic tuning procedure improved the overall performance and consistency of each method, ensuring that all algorithms operated under optimized and reproducible conditions throughout the study.
It is important to clarify that the results presented in Table 2 correspond to a preliminary parameter tuning process applied to each metaheuristic algorithm rather than to the final solutions obtained from solving the main optimization problem. This auxiliary procedure, based on established methodologies in the specialized literature, was carried out to ensure fair comparison conditions and optimal performance in the subsequent application of each algorithm.
4. Test Systems
This section provides the technical parameters of the two MGs used in this study, which comprised 33 and 69 nodes. Each MG was evaluated in both grid-connected and islanded modes. Additionally, the generation and demand scenarios defined for each case are described, outlining the conditions under which the proposed methodology was assessed.
4.1. Test System: 33-Node AC MG
This test system is a 33-node AC MG capable of grid-connected and islanded operation. This system was selected since it has been previously used in the literature to validate intelligent optimization strategies [49]. It is composed of 33 nodes and 32 distribution lines, operating with a base voltage of 12.66 kV and a base power of 1000 kVA.
Figure 6 presents the electrical diagram of the 33-node MG. This system includes electrical loads at each node, all of which have both active and reactive power demands, as detailed in Table 3. Node 1 serves as the slack bus and can be energized either by the main electrical grid (during grid-connected operation) or by a 4000 kW diesel generator (when operating in islanded mode or during grid failures or planned disconnections). This generator operates within a power limit range of 40-80% of its rated capacity. Moreover, the red markers in the figure indicate the WTs connected at nodes 12, 15, and 31, each with an installed capacity of 1300 kW. In this test system, the power converters used for each WT featured a power capacity of 1300 kW.
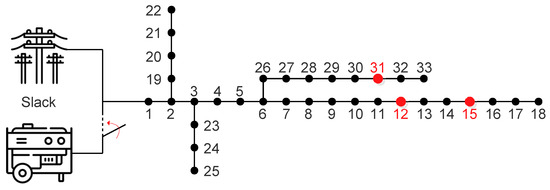
Figure 6.
Electrical diagram of the 33-nodes MG [49].
Table 3.
Technical parameters of the 33-node MG.
Table 3 [49] presents, from left to right, the line number l, the sending node i, the receiving node j, the line resistance between nodes i and j, the line reactance between nodes i and j, the active power demand at node j, the reactive power demand at node j, and the maximum current capacity of the line connecting nodes i and j. Additionally, it is important to note that the maximum allowable voltage variation for the MG is ±8 of the nominal voltage.
Table 4 presents the cost and CO2 emission values associated with the operation of the MG in its two operating modes. In this table, represents the energy purchase or generation cost stemming from the conventional generators, denotes the CO2 emissions factor resulting from the MG’s operation, and refers to the operation and maintenance costs of the WTs [50].
Table 4.
Cost, maintenance, and emissions level parameters for the grid-connected and islanded operating modes.
Figure 7 illustrates the generation curves of the WTs and the demand profile of the MG for a typical day of operation. These curves were obtained based on the wind generation patterns and electricity demand behavior of a specific region in Colombia [31].
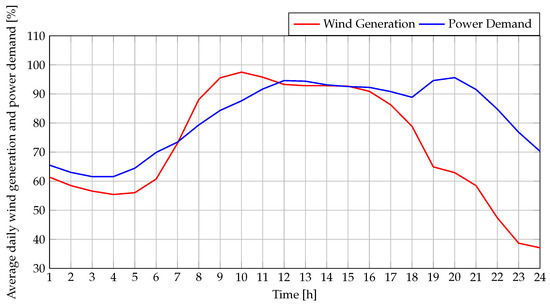
Figure 7.
Average daily generation of WTs located in a region of Colombia.
4.2. Test System: 69-Node AC MG
Figure 8 shows the electrical diagram of 69-node MG, while Table 5 presents the technical parameters of the 69-node MG used in this study. The explanation of these parameters is the same as that provided in Table 3. The maximum allowable voltage variation for this MG is ±8% of the nominal voltage.
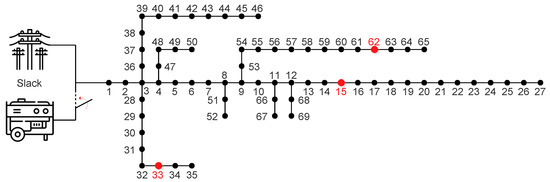
Figure 8.
Electrical diagram of the 69-node MG [51].
Table 5.
Technical parameters of the 69-node MG.
The load profile used in this study was sourced from a Colombian distribution utility, whereas the wind generation profile was synthesized using an ANN trained on climatic data from a specific region in Colombia [31]. This ANN was trained using real meteorological variables (time, temperature, humidity, and pressure) and was used to generate hourly wind generation and power demand profiles over a representative seven-day period. Figure 9 depicts the load variation over a typical week. The “regular” curve reflects the demand behavior that is commonly observed on Monday, Tuesday, Thursday, and Friday, while the other curves capture the characteristic patterns of the remaining days. Figure 10, on the other hand, illustrates the wind generation profiles corresponding to each day of the week.
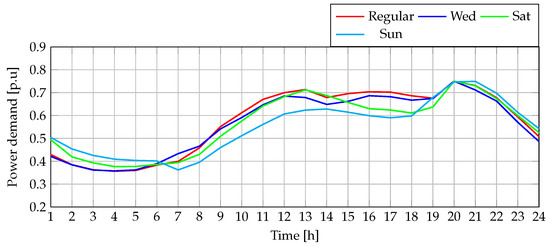
Figure 9.
Hourly power demand for a week of operation.
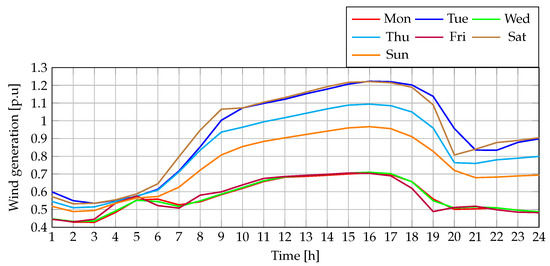
Figure 10.
Hourly power generated by the WTs for a week of operation.
5. Results and Discussion
This section presents the results obtained when solving the proposed optimization problem, which aims to reduce operating costs, energy losses, and CO2 emissions through the coordinated management of active and reactive power from WTs. The simulations were conducted using MATLAB R2024a software on a computer equipped with an Intel(R) Core(TM) i9-14900HX processor at 2.20 GHz, 32 GB of RAM, and a 64-bit version of Windows 11. Each metaheuristic technique was executed 100 times for every objective function in both operating modes. The effectiveness of each method was evaluated by analyzing the best solution, the average solution, the standard deviation, and the average processing time. Subsequently, the best-performing strategy was implemented in the 69-node MG with seven different combinations of generation and demand profiles. Each combination was evaluated under both grid-connected and islanded conditions while considering all the objective functions.
5.1. Results for the 33-Node AC MG Operating in Grid-Connected Mode
In Table 6, the results obtained for the 33-node MG in grid-connected mode are presented.
Table 6.
Solutions obtained for the 33-node AC MG in grid-connected mode.
5.1.1. Statistical Analysis for the Objective Function (Operating Costs)
An analysis of the best solutions obtained for (operating costs minimization) reveals that all methods achieved reductions with respect to the base case (USD 9931.6423), with an average reduction of 56.3904%. To assess the effectiveness of each methodology, the average solutions obtained after 100 executions were also evaluated. This is illustrated in Figure 11, where PGA stands out for its effectiveness, achieving an average reduction of 63.1132%. This corresponds to average reductions of 34.1342%, 1.7604%, 0.7352%, 13.7275%, and 0.3396% compared with MC, PSO, JAYA, GNDO, and MVO, respectively.

Figure 11.
Average cost reduction in the 33-node AC MG operating in grid-connected mode.
The standard deviation of each methodology had to be examined in order to evaluate the dispersion observed in the results. Figure 12 illustrates this analysis, where PGA achieves a standard deviation of 0.0187%, reflecting reductions of 0.6705%, 1.5359%, 1.6904%, 6.5476%, and 0.1023% when compared with MC, PSO, JAYA, GNDO, and MVO. An analysis of both the average solution and the standard deviation clearly indicated that PGA provides the best performance in terms of cost reduction.
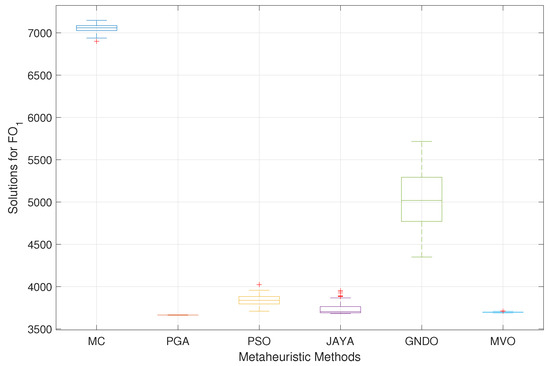
Figure 12.
Boxplot of the solutions for in the 33-node AC MG in grid-connected mode.
According to the processing times reported in Table 6 for , JAYA exhibits the fastest performance, completing the optimization process in 225.4094 s, while GNDO is the slowest method (393.0044 s). The proposed PGA reports a processing time of 256.7073 s, ranking second among the six strategies evaluated.
The average processing time of all methods is approximately 293.7181 s, which is relatively short considering that the optimization covers a full 24-h period of operation. Although PGA is not the most time-efficient method, it offers a favorable balance between speed and consistency, making it computationally efficient and well-suited for practical MG operation scenarios.
5.1.2. Statistical Analysis of the Objective Function (Energy Losses)
Regarding the reduction in energy losses, the implemented methodologies achieved outstanding results, with the best solution reporting a maximum average reduction of 79.7345% when compared with the base case (3378.9199 kWh). Figure 13 illustrates the average values obtained by each methodology, highlighting PGA’s 85.1408% reduction. This reduction corresponds to improvements of 23.5485%, 1.4032%, 1.7154%, 7.5312%, and 2.0005% relative to MC, PSO, JAYA, GNDO, and MVO, respectively.
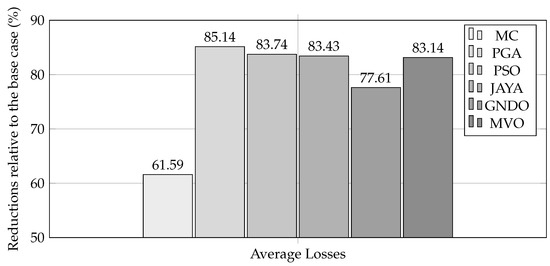
Figure 13.
Average loss reduction in the 33-node AC MG operating in grid-connected mode.
Figure 14 corresponds to a boxplot showing the 100 solutions obtained by each methodology, with the aim of analyzing the dispersion of the results in the context of the loss reduction problem for the 33-node MG operating in grid-connected mode. This analysis indicates that the methodology exhibiting the best performance is PGA, with a standard deviation of 0.0197%. This improvement corresponds to reductions of 1.1886%, 2.0995%, 2.8594%, 2.2012%, and 1.3092% relative to the standard deviations obtained by MC, PSO, JAYA, GNDO, and MVO.
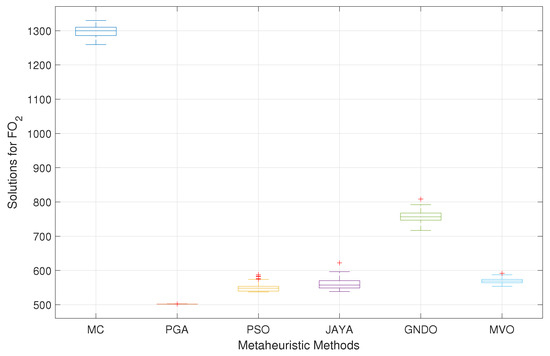
Figure 14.
Boxplot of the solutions for in the 33-node AC MG operating in grid-connected mode.
In terms of computational performance regarding , MC reported the shortest average processing time for the 100 runs, completing the optimization in 162.5012 s. However, it is important to highlight that the proposed PGA demonstrated a highly efficient performance, ranking as the second fastest (231.4558 s) among all evaluated strategies.
Although not the absolute fastest, PGA significantly outperformed several other advanced metaheuristics, such as PSO, JAYA, and GNDO, which required notably longer times to complete the same task. In particular, GNDO exhibited the highest processing time (360.0060 s). The average value for all methods was approximately 264.3522 s, meaning that PGA performed well below the average, which confirms its computational efficiency and practical suitability for the optimization of technical performance in MGs.
5.1.3. Statistical Analysis of the Objective Function (CO2 Emissions)
When comparing the analyzed metaheuristic techniques regarding CO2 emissions in the 33-node MG during grid-connected operation, an average decrease of 57.9576% is observed among the best solutions provided by each algorithm in relation to the base case (12541.1958 ). Figure 15 presents the average reductions achieved by each technique after 100 executions. In this analysis, PGA stands out with a reduction of 65.8319%, representing improvements of 35.2939%, 2.0183%, 0.8879%, 14.4529%, and 4.9379% compared with MC, PSO, JAYA, GNDO, and MVO.
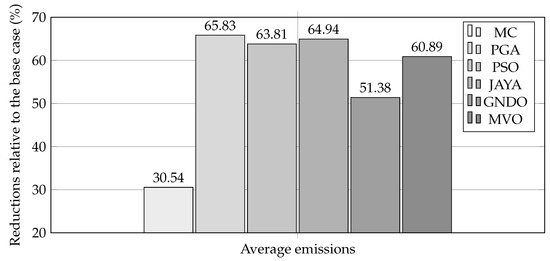
Figure 15.
Average emissions reduction in the 33-node MG operating in grid-connected mode.
Figure 16 presents the 100 solutions obtained by each methodology, with the purpose of analyzing their dispersion. PGA achieves a standard deviation of 0.0673%, which translates into improvements of 0.6723%, 2.2018%, 1.7188%, 6.0265%, and 1.8921% compared with MC, PSO, JAYA, GNDO, and MVO, respectively. These results, along with the average solutions obtained, position the PGA as the most effective technique for CO2 emissions reduction in this case, standing out not only for the quality of its solutions but also for its repeatability and consistency.
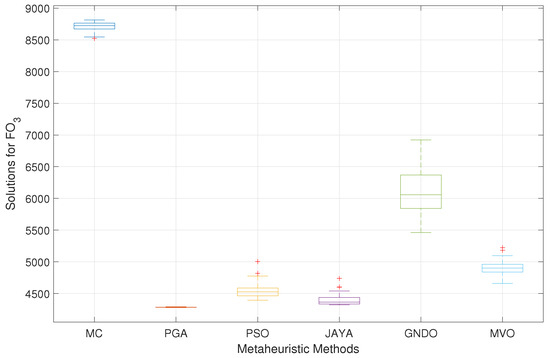
Figure 16.
Boxplot of the solutions for in the 33-node AC MG operating in grid-connected mode.
For , JAYA reported the best computation time, completing the optimization in 227.4124 s. Close behind, the proposed PGA achieved a processing time of 235.4538 s, positioning it among the fastest and confirming its consistently efficient performance across all objective functions. Once again, GNDO registered the highest processing time (369.1405 s), reinforcing the advantages of more lightweight and stable algorithms such as PGA for this type of optimization problem.
In general terms, the average processing time of all strategies with regard to was approximately 278.7691 s, making PGA’s performance not only competitive but clearly below the average, which reinforces its potential as a reliable and time-efficient tool for tasks involving the environmental optimization of MGs.
Furthermore, it was essential to ensure that the results obtained with each methodology adhered to the technical constraints of the MG, particularly regarding voltage levels and line loading capacity. This compliance is demonstrated in Figure 17 and Figure 18, which illustrate the evolution of the worst voltage variation and the maximum current level throughout the 24-hour operation period. In both figures, it is graphically verified that all methodologies respect the established technical limits for the analyzed MG.
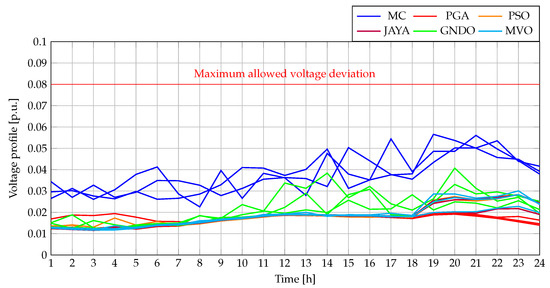
Figure 17.
Maximum voltage variations for the 33-node AC distribution network operating in grid-connected mode.
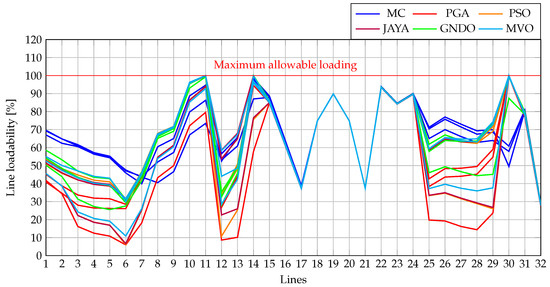
Figure 18.
Line loadability for the 33-node AC MG operating in grid-connected mode.
Incorporating the reactive power injected by the WTs into this MG requires ensuring that their apparent power does not exceed the nominal capacity. To this effect, Figure 19 presents the active power dispatch of the three WTs for each of the objective functions considered. In parallel, Figure 20 shows the reactive power of the WTs under the same scenarios. Finally, Figure 21 illustrates the apparent power of the WTs, as calculated from the previously presented active and reactive powers. This final analysis was only conducted for PGA since our proposal achieved the best performance. In this figure, it can be observed that at no point during the 24 h period does the apparent power exceed the nominal capacity of the power converters (1300 kW for each of the WTs).
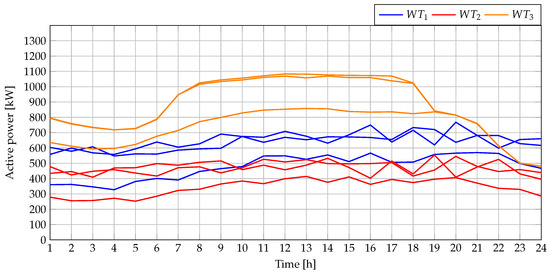
Figure 19.
Active power dispatched by the WTs within the 33-node AC MG operating in grid-connected mode.
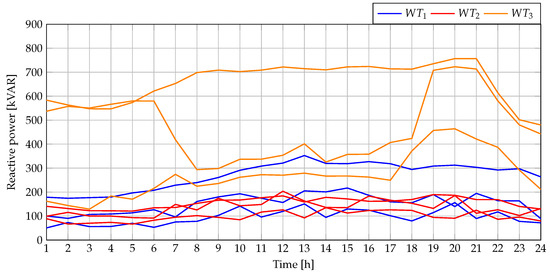
Figure 20.
Reactive power dispatched by the WTs within the AC MG with 33 nodes during grid-connected operation.
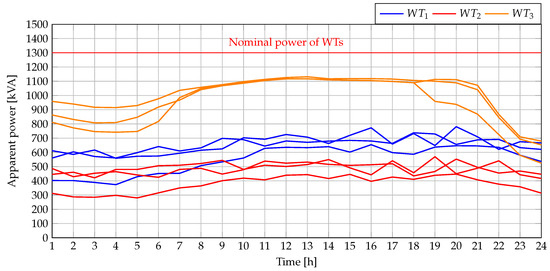
Figure 21.
Apparent power dispatched by WTs for the 33-node AC MG during grid-connected operation.
5.2. Results for the 33-Node AC MG Operating in Islanded Mode
Table 7 presents the results obtained after optimizing the three objective functions in the 33-node MG during islanded operation through the coordinated dispatch of active and reactive WT power. The table includes the best solutions achieved by each methodology, along with their average values, standard deviations, and average processing times.
Table 7.
Solutions obtained for the 33-node MG operating in islanded mode.
5.2.1. Statistical Analysis of the Objective Function (Operating Costs)
When analyzing the islanded mode, it is not possible to evaluate a base case, as the system cannot operate under the generation and demand curves representing a typical day without violating the power limits imposed on the diesel generator. This highlights that, in this mode of operation, the smart management of the WTs installed in the MG is essential to prevent load disconnections. Upon evaluating the best solutions obtained by the analyzed methodologies with regard to , it was observed that all of them achieved outstanding performance, reaching an average minimum cost of USD 12,352.5471 while fully complying with the operational constraints imposed on the MG in islanded mode.
As with the analysis conducted for the MG in grid-connected mode, the best-performing metaheuristic technique was primarily identified based on its average solution and standard deviation since these indicators reflect both the effectiveness and consistency of each strategy. In this context, PGA achieved an average solution of USD 11454.6395, representing improvements of 27.5469%, 0.8549%, 1.6540%, 15.4469%, and 0.0933% over MC, PSO, JAYA, GNDO, and MVO. This behavior is clearly illustrated in Figure 22. It is important to note that, for the islanded operation mode, the performance of the PGA was directly compared against the other methodologies rather than the base case. This is because considering a base case for the islanded mode without implementing intelligent WT management would result in violations of the injection limits at the slack node during certain hours of the day.
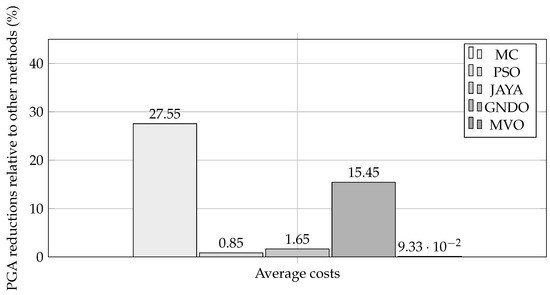
Figure 22.
PGA’s operating cost reductions relative to other methodologies in the 33-node MG operating in islanded mode.
In Figure 23, a boxplot illustrates the 100 solutions obtained by each technique with regard to the operating costs of the MG in islanded mode. The plot clearly shows that the algorithm with the lowest standard deviation is PGA, with a value of 0.0189%. This result translates into improvements of 0.6044%, 0.9452%, 1.9374%, 1.4490%, and 0.3722% when compared with MC, PSO, JAYA, GNDO, and MVO.
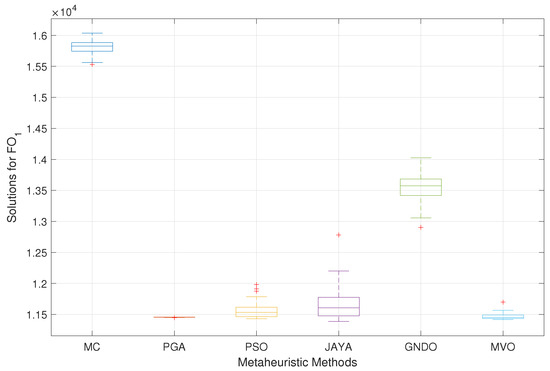
Figure 23.
Boxplot of the solutions for in the 33-node AC MG operating in islanded mode.
When minimizing operating costs during islanded operation, JAYA reported the lowest processing time, completing the optimization in 196.3772 s. The proposed PGA followed close behind with 217.3473 s, which makes it the second-fastest strategy. In contrast, PSO required 525.5258 s, i.e., it was the slowest among all the evaluated methods. The average processing time for all approaches was 326.4040 s, placing PGA significantly below the threshold. These results confirm PGA’s strong computational efficiency, which is particularly relevant in isolated scenarios where timely decision-making is critical for MG stability and cost-effectiveness.
5.2.2. Statistical Analysis of the Objective Function (Energy Losses)
Regarding loss minimization in islanded mode, all the analyzed techniques demonstrated outstanding performance, achieving an average minimum solution of 733.0458 kWh.
An assessment of the average solutions for each technique revealed that the PGA provides the best performance (547.3763 kWh) when it comes to minimizing losses in islanded mode. The reported value is 58.3932%, 9.2595%, 19.7571%, 36.9182%, and 16.5941% higher than the results obtained with MC, PSO, JAYA, GNDO, and MVO. This improvement is clearly depicted in Figure 24.

Figure 24.
Loss reduction reported by PGA compared with other methodologies in the 33-node MG during islanded operation.
Figure 25 corresponds to a boxplot showing the 100 executions of each technique used for minimizing losses in the 33-node MG. In this case, PGA stands out once again for its effectiveness, showing a standard deviation of 0.1702%. Our proposal outperforms MC, PSO, JAYA, GNDO, and MVO by 1.1375%, 3.4178%, 6.6455%, 2.5100%, and 2.0800%, respectively.

Figure 25.
Boxplot of the solutions for in the 33-node AC MG during islanded operation.
In this evaluation, JAYA once again demonstrated remarkable speed, finalizing its execution in 195.5680 s, the shortest time among all tested strategies. Close behind, the proposed PGA required 216.7334 s, outperforming most competitors and reinforcing its efficiency across diverse operational criteria. On the opposite end, MVO recorded the highest computation time (536.7649 s), more than doubling that of PGA. The overall average processing time for the objective function associated with energy losses was 331.6653 s, positioning PGA well below the benchmark.
These results confirm that PGA is not only competitive in terms of solution quality; it also boasts a high computational efficiency, which is essential for scenarios that require a continuous, real-time re-evaluation of operation plans.
5.2.3. Statistical Analysis of the Objective Function (CO2 Emissions)
As for during islanded operation, all techniques yielded promising results; each of them reached optimal solutions, leading to an average minimum value of 11,117.5033 . This demonstrates the overall effectiveness of the studied methods. Figure 26 illustrates the average solutions obtained by each metaheuristic technique, with PGA once again showing superior performance, exhibiting an average of 10,267.4865 . Compared with MC, PSO, JAYA, GNDO, and MVO, this represents improvements of 28.5284%, 1.1314%, 2.3201%, 15.8819%, and 0.1453%, respectively.
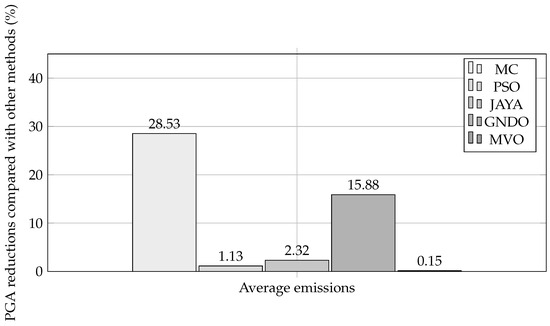
Figure 26.
Reduction in emissions by PGA compared with other methodologies in the 33-node MG during islanded operation.
A detailed analysis of the standard deviations reveals PGA’s exceptional repeatability, as shown in Figure 27, with a remarkably low standard deviation (0.0079%). This value is lower by 0.6376%, 1.2086%, 1.9206%, 1.7986%, and 0.2322% than the deviations recorded by MC, PSO, JAYA, GNDO, and MVO for this specific optimization case.
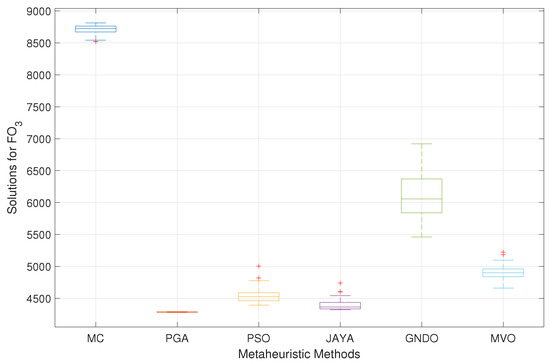
Figure 27.
Boxplot of the solutions for in the 33-node AC MG operating in islanded mode.
JAYA exhibited the shortest execution time (200.7937 s), closely followed by the proposed PGA, which completed the optimization in 218.1240 s. At the other end of the spectrum, MVO was the slowest approach, requiring 547.4273 s. The average processing time of all six methods was approximately 336.7343 s, i.e., less than six minutes. This confirms that all techniques, including PGA, can be executed efficiently within practical time constraints. Note that PGA once again demonstrates a consistently low computation time, reinforcing its suitability for real-time or near-real-time energy management in islanded MGs.
To demonstrate compliance with technical constraints regarding voltage and load capacity in the islanded 33-node MG, Figure 28 and Figure 29 are presented. These figures depict the optimal solutions obtained by each technique for , , and . It is evident that the voltage limit (0.08 p.u.) and the maximum load capacity of the lines are not exceeded.
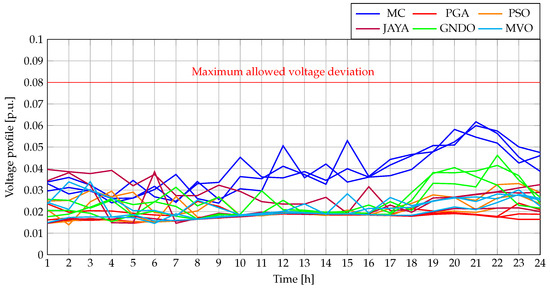
Figure 28.
Maximum voltage deviation for the 33-node AC MG operating in islanded mode.
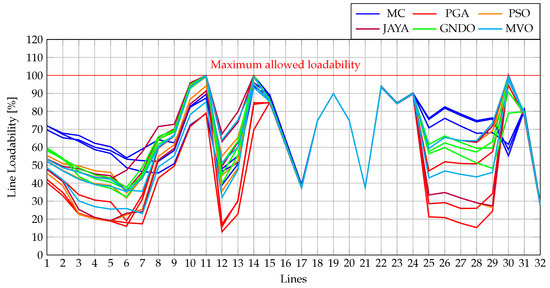
Figure 29.
Line loadability for the 33-node AC MG operating in islanded mode.
Figure 30 presents the power injection of the diesel generators for each of the applied techniques, with the aim of demonstrating compliance with these units’ dispatch limits in the islanded MG. Note that these limits range between 1600 kW and 3200 kW and that all strategies successfully maintained the generator outputs within the specified bounds at all times.
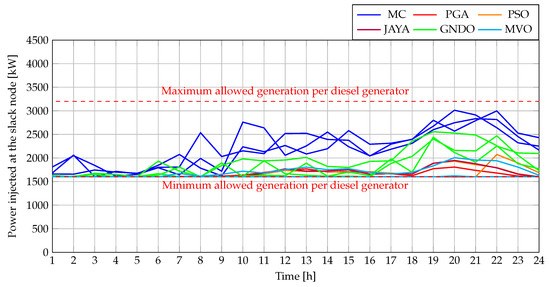
Figure 30.
Power supplied by the diesel generator within the framework of each analyzed metaheuristic technique.
Finally, it was essential to verify that the power injection limits of the WTs, as defined by their rated power capacity, were not violated when implementing the proposed PGA. To this effect, Figure 31 presents the active power injected by each WT within the framework of the best solutions obtained. In addition, the reactive power outputs are shown in Figure 32. Subsequently, using the information from both curves, the apparent power profile of the WTs is depicted in Figure 33 for each objective function as optimized by the best technique. The results clearly confirm that the nominal power limit of 1300 kW is not exceeded at any point.
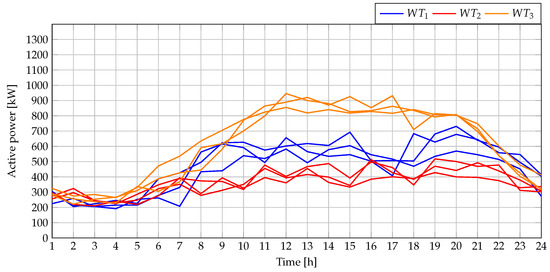
Figure 31.
Active power dispatched by the WTs in the 33-node AC MG during islanded operation.
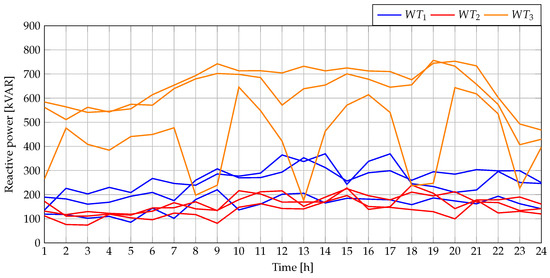
Figure 32.
Reactive power dispatched by the WTs in the 33-node AC MG during islanded operation.
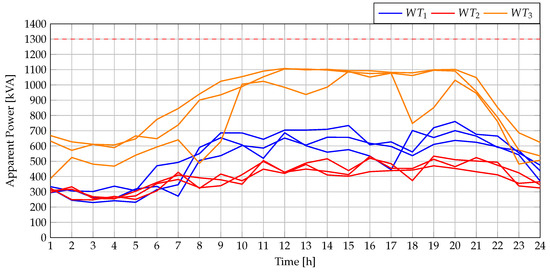
Figure 33.
Apparent power delivered by the WTs in the 33-node AC MG during islanded operation.
5.3. Validating the Proposed Methodology on a 69-Node MG
Although the PGA demonstrated a strong performance in the 33-node MG, it is essential to assess its robustness and adaptability to larger systems and more complex generation and demand scenarios. To this effect, the algorithm was applied to a 69-node MG, considering a full week of operation under both grid-connected and islanded conditions.
5.3.1. PGA Performance in the Grid-Connected 69-Node MG
Table 8 presents the results obtained by applying the PGA to the 69-node MG operating in grid-connected mode. This table includes the different objective functions used in this work, along with the base cases for each of the seven days of the week and the corresponding results achieved by PGA on each day.
Table 8.
Objective function values for the 69-node MG in grid-connected mode over a one-week operation period.
Regarding , PGA achieved a weekly average cost reduction of USD 8180.6846. When compared with the base case, this corresponds to an average economic improvement of 114.8964%, with daily absolute reductions ranging from USD 8122.9397 to USD 8315.0187. The standard deviation throughout the week is approximately 1.9558%, indicating PGA’s stable and consistent performance under varying operating conditions.
It is worth noting that reduction values exceeding 100% indicate that the MG not only satisfies its own energy demand but also generates surplus energy that can be exported to the main grid. This surplus leads to additional economic benefits, thereby enhancing the overall profitability of wind-based MG operations. Such outcomes are directly related to the interaction between power demand patterns and the availability of wind generation within the MG, which, under favorable conditions, allows for both self-sufficiency and energy sales.
In addition, the average execution time required by the proposed methodology to solve the cost minimization problem () is 437.3418 s per day, i.e., approximately 7.2890 min, which demonstrates its practicality for day-ahead or short-term operation planning.
As for , PGA achieved a weekly average reduction of 1592.3923 kWh compared with the base scenario. This corresponds to an average improvement of 92.5971%, with daily absolute reductions ranging from 1455.7406 kWh to 1643.6205 kWh. The standard deviation is approximately 0.2696%, indicating a highly stable and consistent performance under varying load and wind generation conditions.
This high level of loss reduction significantly improves the overall efficiency of the MG, minimizing unnecessary energy dissipation along the distribution lines. The consistency observed throughout the week reinforces PGA’s robustness in managing technical constraints and optimizing power flows, even when the system operates in different modes or under fluctuating generation profiles. Moreover, the average computation time required to solve the energy losses minimization problem was 432.1599 s per day, equivalent to approximately 7.2027 min.
Finally, regarding , PGA reported a weekly average reduction of 10782.4538 compared with the base scenario. This corresponds to an average improvement of 119.9285%, with daily absolute reductions ranging from 10720.0819 to 10877.8816 . The standard deviation was approximately 1.9008%, and the coefficient of variation was 1.5849%, once again reflecting a stable and consistent reduction performance under varying conditions.
The fact that these reductions surpass 100% reflects the MG’s ability to generate more renewable energy than it consumes, allowing it not only to achieve self-sufficiency but also to inject surplus clean energy into the main grid. This surplus displaces higher-emission generation sources in the broader electrical system, effectively supporting the reduction in the total grid emissions. As a result, the proposed strategy contributes to both improving operational efficiency and advancing environmental sustainability, aligning MG operations with broader carbon reduction targets and decarbonization goals.
Moreover, the average computation time required by the proposed methodology to solve the CO2 emissions minimization problem was approximately 434.4161 s per day, equivalent to 7.2403 min. This is consistent with the execution times observed for and , all averaging close to 7.2 min per day, which confirms the practicality and scalability of the proposed optimization framework across multiple objectives in real-time or day-ahead operation planning.
Additionally, a comparative analysis of the processing times required by the PGA for the 33-node and 69-node MGs was performed. This evaluation highlights how increasing system complexity affects the computational effort needed by the metaheuristic technique to solve the optimization problem.
In the grid-connected 33-node, PGA required an average computation time of 241.2056 s across the three objective functions, whereas, in the 69-node MG, this time increased to 434.6393 s. This represents an 80.1974% increase for grid-connected operation, highlighting that greater system complexity results in significantly longer processing times. Nevertheless, these durations, on the order of minutes, are relatively short compared with the 24-hour analysis performed by the implemented technique. This suggests that the proposed strategy can be executed multiple times in response to system contingencies, which reinforces its overall reliability and flexibility.
5.3.2. PGA’s Performance in the 69-Node MG During Islanded Operation
Table 9 presents the results obtained for the islanded 69-node MG with regard to the objective functions , , and . It is important to note that, as in the analysis performed for the 33-node MG during islanded operation, no base case is provided. This is due to the fact that such a scenario would lead to a violation of the power generation limits set for the diesel generator located at the slack node.
Table 9.
Objective function values for the 69-node MG in islanded mode over a one-week operation period.
Regarding , , and in islanded mode, PGA yields weekly average values of USD 7212.0110, 171.7586 kWh, and 6416.4515 , respectively. For , the absolute daily reductions relative to the base case range from USD 7203.0919 to USD 7217.1257, with a standard deviation of 1.7022%. In the case of , the absolute daily reductions range from 163.1527 kW to 178.0434 kW, with a standard deviation of 3.20%. Finally, for , the absolute daily reductions range between 6415.3316 and 6417.2474 , with a standard deviation of 0.0140%.
While these values are not as favorable as those obtained in grid-connected mode, this outcome is consistent with our expectations, given the additional technical constraints imposed to ensure a safe and reliable operation in an islanded configuration. These constraints inherently limit the operational flexibility of the MG, thereby reducing the potential for cost savings, loss minimization, and emissions reduction. Nevertheless, the results demonstrate the strategy’s effectiveness in maintaining acceptable performance even under more restrictive operating conditions.
The average processing times required by PGA are 413.5717, 411.2182, and 411.3664 s for the objective functions , , and , respectively, which represents a consistent overall average of 412.0521 s across all objective functions.
When comparing processing times required during islanded operation, the 33-node MG reports an average value of 217.4016 s, whereas the 69-node system reaches 412.0521. This corresponds to an increase of approximately 89.53%, reflecting the higher computational effort required for larger systems under similar operating conditions.
6. Conclusions
This study proposed an intelligent active and reactive power management strategy based on a population-based genetic algorithm for wind turbines installed in AC microgrids, considering both grid-connected and islanded operation modes. The methodology was validated through extensive simulations, including 100 independent executions for each evaluated scenario, using realistic daily generation and demand profiles. The primary contribution of this proposal lies in its ability to minimize operating costs, energy losses, and CO2 emissions while ensuring compliance with the MG’s technical and operational constraints and ensuring high solution consistency and robustness.
A detailed analysis of the results obtained confirms that the PGA-based strategy significantly outperforms other metaheuristic techniques (MC, PSO, JAYA, GNDO, and MVO) in both operating modes. In grid-connected mode, PGA achieved an average operating cost reduction of 63.1132% compared with the base case, with a very low standard deviation of 0.0187%, demonstrating remarkable consistency over 100 independent runs. Additionally, the energy losses were reduced by 85.1408% and the CO2 emissions by 65.8319%, both with minimal standard deviations (0.0197% and 0.0673%, respectively), which confirms the high reliability and robustness of the solutions found. Improvements were also observed with respect to all the methodologies used for comparison.
In islanded mode, the performance of the PGA demonstrated clear superiority compared with the other evaluated metaheuristics (MC, PSO, JAYA, GNDO, and MVO) across all key performance indicators. Specifically, PGA achieved an average reduction of 9.1192% in operating costs relative to the mean performance of the other methods, reflecting its greater ability to economically optimize the MG’s energy management. As for energy losses, the PGA showed average reductions of 9.2595% compared with the second-best technique, while, for CO2 emissions, a reduction of 0.1453% was obtained.
Beyond the observed improvements in the average values, PGA also exhibited exceptional solution consistency. The standard deviation associated with the operating costs was reduced by 1.0616% compared with the average variability of the other algorithms. In the case of energy losses, the standard deviation was reduced by 3.1582%, as well as by 1.1595% for the CO2 emissions. These reductions in variability confirm PGA’s robustness and reliability even under the more challenging conditions imposed by the islanded MG operation.
Overall, PGA consistently delivered superior average performance and the lowest solution variability in both operating modes and across all optimization objectives. These findings confirm that our methodology not only guarantees significant economic, technical, and environmental improvements but also ensures highly reliable and secure energy management of modern AC MGs.
Moreover, the low standard deviations observed, on the order of only a few cents (USD), milliwatts, or milligrams of CO2 across 100 independent executions, demonstrate PGA’s outstanding repeatability. This high level of consistency significantly reduces operational risk and builds trust regarding its deployment under real-world conditions, reinforcing its robustness, precision, and practical applicability.
An evaluation of the processing times required by all optimization strategies revealed highly satisfactory results in terms of computational efficiency. Overall, all methods achieved relatively short execution times, especially when considering the 24-hour horizon of the analysis.
In grid-connected mode, the average processing time across all algorithms was approximately 293.72 s (about 4.89 min), confirming that the optimization of a full day of MG operation can be completed in just a few minutes. For the islanded mode, the average increased slightly to 322.75 s (approximately 5.38 min). This increase is expected as the solution space becomes more constrained due to the limited power capacity of the diesel generator, which imposes stricter feasibility requirements and increases the computational effort required to find viable solutions.
Notably, the proposed PGA demonstrated a consistently competitive performance, ranking among the fastest methods in nearly all objective functions. Its ability to maintain low computation times, even under the tighter constraints of islanded operation, underscores its practical suitability for real-time or near-real-time energy management in MGs operating under both grid-connected and isolated conditions.
An evaluation of the PGA on a 69-node MG over a one-week period, using demand and generation forecasts generated by ANNs, confirms the robustness of the proposed methodology. In the grid-connected mode, this methodology achieved reductions of 112.6609%, 92.5971%, and 119.9285% in the three objective functions under study (, , and , respectively), with corresponding standard deviations of 1.9558%, 0.2696%, and 1.9008%. In the islanded mode, forecasting enabled adaptive, optimized planning, achieving average daily values of USD 7212.0110 (cost), 171.7586 kWh (losses), and 6416.4515 (emissions), with standard deviations of 1.7022%, 3.20%, and 0.0140%, respectively.
The low standard deviations observed across all objectives indicate that the proposed strategy maintains a highly stable and predictable performance, even under varying daily conditions. This consistency is critical for MG operation, as it reduces the risk of unexpected outcomes, facilitates short-term planning, and ensures a reliable operation regardless of fluctuations in demand or renewable generation. In this test scenario, the use of ANN forecasts improved the responsiveness and proactivity of the strategy, reinforcing the role of intelligent, predictive control in enhancing MG autonomy, efficiency, and scalability under variable conditions.
In the 69-node MG, the execution times remained consistent across the three objectives analyzed, averaging 412.0521 s per day (≈7 min). This validates the strategy’s feasibility for day-ahead scheduling. Compared with the 33-node MG, where the average times were 217.4016 s (islanded) and 241.2056 s (grid-connected), this case saw increases of 89.53% and 80.20%, respectively, reflecting greater complexity, albeit within the practical limits.
Although the results presented in this study are based on simulation data, the proposed method exhibits characteristics that support its potential application in real-world MGs. The relatively low computational burden and convergence times observed make it suitable for integration into scheduling schemes with hourly or day-ahead horizons. Additionally, the codification strategy and the use of the SA power flow method ensure numerical stability and compatibility with embedded control platforms or supervisory systems. As future work, an evaluation of the algorithm’s real-time performance is proposed, considering practical constraints such as processor capacity, memory availability, and data acquisition rates, which are typical of MG controllers. Experimental validation using real measurement data or hardware-in-the-loop (HIL) platforms is also considered essential to confirm our proposal’s feasibility and operational robustness under real operating conditions.
Based on the findings presented in this work, a potential avenue for future research is the integration of complementary technologies alongside WTs, such as energy storage systems. This combination could enhance the efficiency of WTs by expanding their operational range and potentially lead to greater reductions in operating costs, energy losses, and CO2 emissions.
The proposed framework could be extended to a multi-objective optimization setting by simultaneously incorporating two or more of the objective functions considered herein. This would allow the construction of Pareto-optimal fronts and enable a trade-off analysis of economic, technical, and environmental indicators. In this context, performance metrics such as the hypervolume, the generational distance, the inverted generational distance, and the proportion of independent solutions could be employed to evaluate solution quality. Furthermore, future work could include formal statistical tests to complement the current analysis based on standard deviation values. These tests could help to confirm the significance of performance differences across optimization methods and further strengthen the reliability of the proposed strategies under varying operating conditions.
In addition, the authors propose evaluating enhanced and hybrid versions of the implemented algorithms to improve performance regarding the active and reactive power management of wind-based distributed generation. This includes incorporating adaptive strategies and combining complementary techniques to improve convergence, robustness, and solution quality. Future research could focus on quantifying the benefits of these improvements under different MG configurations and operating conditions, using the current results as a performance baseline.
Building upon this foundation, subsequent efforts will aim to enhance the current steady-state optimization framework by integrating dynamic constraints such as frequency stability, voltage transients, and harmonic distortion, thereby increasing the model’s realism and robustness under highly variable operating conditions. Additionally, the framework will be expanded to incorporate more detailed representations of system components and economic factors. This includes part-load efficiency curves for diesel generators, start-up and shutdown costs, minimum up-time constraints, converter dynamics, fuel price volatility, and opportunity costs, as well as economic instruments like carbon pricing and penalties for renewable curtailment. These enhancements will significantly improve the applicability of the proposed methodology to a wider range of real-world scenarios, supporting the development of more adaptive, reliable, and environmentally responsible energy management strategies in modern MGs.
Author Contributions
Conceptualization, H.P.V. and L.F.G.-N.; methodology, L.F.G.-N. and R.I.B.; software, L.F.G.-N., H.P.V. and R.I.B.; validation, H.P.V. and O.D.M.; formal analysis, H.P.V. and J.C.H.; investigation, L.F.G.-N. and H.P.V.; resources, L.F.G.-N.; data curation, H.P.V.; writing (original draft), H.P.V.; writing (review and editing), O.D.M. and J.C.H.; visualization, R.I.B. and H.P.V.; supervision, L.F.G.-N.; project administration, L.F.G.-N. and J.C.H.; funding acquisition, L.F.G.-N. and R.I.B. All authors have read and agreed to the published version of the manuscript.
Funding
This research was funded by the ANID FONDECYT Iniciación 2024 Folio (11240006) under the project titled“Smart energy management methods for improving the economic, technical, and environmental indices of alternating current microgrids including variable generation”. Our work was also funded by the Colombian Ministry of Science, Technology and Innovation (MINCIENCIAS) and the National Fund for Science, Technology, and Innovation (Fondo Francisco José de Caldas) through the support received for a research internship under Contingent Value-Based Funding Contract No. 112721-358-2023, Call. 934 of 2023. The authors acknowledge the support provided by Thematic Network 723RT0150 “Red para la integración a gran escala de energías renovables en sistemas eléctricos (RIBIERSE-CYTED)” funded by the 2022 Call for Thematic Networks of the Ibero-American Program of Science and Technology for Development (CYTED). This work was supported by the Council of Andalucía (Junta de Andalucía, Consejería de Transformación Económica, Industria, Conocimiento y Universidades, Secretaría General de Universidades, Investigación y ecnología) under Project ProyExcel_00381.
Institutional Review Board Statement
Not applicable.
Data Availability Statement
The original contributions presented in the study are included in the article; further inquiries can be directed to the corresponding author.
Acknowledgments
During the preparation of this work, the authors used Grammarly and ChatGPT 4.0 to improve their writing and style. After using this tool, the authors reviewed and edited the content as needed and took full responsibility for the publication’s content.
Conflicts of Interest
The authors declare no conflicts of interest.
References
- Pal, D.B.; Rathoure, A.K. Environmental Aspects in Electrical Energy Generation: A Comprehensive Review. In Renewable Energy Development: Technology, Material and Sustainability; Springer: Berlin/Heidelberg, Germany, 2025; pp. 351–375. [Google Scholar]
- Boche, A.; Foucher, C.; Villa, L.F.L. Understanding microgrid sustainability: A systemic and comprehensive review. Energies 2022, 15, 2906. [Google Scholar] [CrossRef]
- CNE. Norma técnica de Calidad de Servicio Para Sistemas de Distribución. 2019. Available online: https://www.cne.cl/wp-content/uploads/2019/12/Norma-TÃľcnica-de-Calidad-de-Servicio-para-Sistemas-de-DistribuciÃşn.pdf (accessed on 4 March 2025).
- Allwyn, R.G.; Al-Hinai, A.; Margaret, V. A comprehensive review on energy management strategy of microgrids. Energy Rep. 2023, 9, 5565–5591. [Google Scholar] [CrossRef]
- Wei, P.; Chen, W. Microgrid in China: A review in the perspective of application. Energy Procedia 2019, 158, 6601–6606. [Google Scholar] [CrossRef]
- Mehrasa, M.; Pouresmaeil, E.; Jørgensen, B.N.; Catalão, J.P. A control plan for the stable operation of microgrids during grid-connected and islanded modes. Electr. Power Syst. Res. 2015, 129, 10–22. [Google Scholar] [CrossRef]
- Cetinkaya, U.; Bayindir, R. On&Off-Grid Hybrid Microgrid Design and Dynamic Analysis. In Proceedings of the 2019 7th International Conference on Smart Grid (icSmartGrid), Newcastle, NSW, Australia, 9–11 December 2019; pp. 132–136. [Google Scholar] [CrossRef]
- Beig, A.; Muyeen, S. Wind energy. In Electric Renewable Energy Systems; Elsevier Inc.: Philadelphia, PA, USA, 2016; pp. 60–77. [Google Scholar] [CrossRef]
- Mohtasham, J. Review Article-Renewable Energies. Energy Procedia 2015, 74, 1289–1297. [Google Scholar] [CrossRef]
- Shaheen, M.A.M.; Hasanien, H.M.; Al-Durra, A. Solving of Optimal Power Flow Problem Including Renewable Energy Resources Using HEAP Optimization Algorithm. IEEE Access 2021, 9, 35846–35863. [Google Scholar] [CrossRef]
- Farhat, M.; Kamel, S.; Atallah, A.M.; Khan, B. Optimal Power Flow Solution Based on Jellyfish Search Optimization Considering Uncertainty of Renewable Energy Sources. IEEE Access 2021, 9, 100911–100933. [Google Scholar] [CrossRef]
- Yugeswar Reddy, O.; Jithendranath, J.; Chakraborty, A.K.; Guerrero, J.M. Stochastic optimal power flow in islanded DC microgrids with correlated load and solar PV uncertainties. Appl. Energy 2022, 307, 118090. [Google Scholar] [CrossRef]
- Kumar, A. Control Strategies of Grid Integrated Wind/PV Based Hybrid Power System. In Hybrid Electric Vehicles and Distributed Renewable Energy Conversion: Control and Vibration Analysis; IGI Global: Hershey, PA, USA, 2025; pp. 99–118. [Google Scholar]
- Mauludin, M.S.; Khairudin, M.; Asnawi, R.; Mustafa, W.A.; Fauziah, T.S. The advancement of artificial intelligence’s application in hybrid solar and wind power plant optimization: A study of the literature. J. Adv. Res. Appl. Sci. Eng. Technol. 2025, 50, 279–293. [Google Scholar] [CrossRef]
- Cheng, Q.; Zhang, Z.; Wang, Y.; Zhang, L. A Review of Distributed Energy Systems: Technologies, Classification, and Applications. Sustainability 2025, 17, 1346. [Google Scholar] [CrossRef]
- MansourLakouraj, M.; Shahabi, M.; Shafie-khah, M.; Catalão, J.P. Optimal market-based operation of microgrid with the integration of wind turbines, energy storage system and demand response resources. Energy 2022, 239, 122156. [Google Scholar] [CrossRef]
- Safaei, A.; Vahidi, B.; Askarian-Abyaneh, H.; Azad-Farsani, E.; Ahadi, S. A two step optimization algorithm for wind turbine generator placement considering maximum allowable capacity. Renew. Energy 2016, 92, 75–82. [Google Scholar] [CrossRef]
- Tripathy, M.; Samal, R.K. A new perspective on wind integrated optimal power flow considering turbine characteristics, wind correlation and generator reactive limits. Electr. Power Syst. Res. 2019, 170, 101–115. [Google Scholar] [CrossRef]
- Liu, Y.; Ćetenović, D.; Li, H.; Gryazina, E.; Terzija, V. An optimized multi-objective reactive power dispatch strategy based on improved genetic algorithm for wind power integrated systems. Int. J. Electr. Power Energy Syst. 2022, 136, 107764. [Google Scholar] [CrossRef]
- Wang, X.; Zhu, H.; Luo, X.; Chang, S.; Guan, X. A novel optimal dispatch strategy for hybrid energy ship power system based on the improved NSGA-II algorithm. Electr. Power Syst. Res. 2024, 232, 110385. [Google Scholar] [CrossRef]
- Xu, B.; Zhang, G.; Li, K.; Li, B.; Chi, H.; Yao, Y.; Fan, Z. Reactive power optimization of a distribution network with high-penetration of wind and solar renewable energy and electric vehicles. Prot. Control. Mod. Power Syst. 2022, 7, 51. [Google Scholar] [CrossRef]
- Guo, X.; Bao, H.; Li, J. Interval optimal power flow model and its Monte Carlo method for AC/DC hybrid power system with wind power. In Proceedings of the 2019 14th IEEE Conference on Industrial Electronics and Applications (ICIEA), Xi’an, China, 19–21 June 2019; pp. 873–876. [Google Scholar]
- Reddy, S.S. Optimal power flow with renewable energy resources including storage. Electr. Eng. 2017, 99, 685–695. [Google Scholar] [CrossRef]
- Hoque, S.; Islam, R.; Shafiullah, M.; Adnan, S.; Azam, S. Generalized Normal Distribution Optimization Algorithm for Economic Dispatch with Renewable Resources Integration. J. Energy Power Technol. 2023, 5, 1–19. [Google Scholar] [CrossRef]
- Venkatareddy, P.; Sambaiah, K.S.; N, S. Optimal Mix and allocation of Solar and Wind Energy Sources in Active Distribution System Using Jaya Optimization Algorithm. In Proceedings of the 2022 Trends in Electrical, Electronics, Computer Engineering Conference (TEECCON), Bengaluru, India, 26–27 May 2022; pp. 45–49. [Google Scholar] [CrossRef]
- Sood, Y.R.; Maheshwari, A.; Jaiswal, S. Optimal Power Flow Solution Based on Multi-verse Optimizer Algorithm Incorporating Renewable Energy Sources. In Proceedings of the 2024 IEEE 4th International Conference in Power Engineering Applications (ICPEA), Pulau Pinang, Malaysia, 4–5 March 2024; pp. 299–304. [Google Scholar]
- Nadimi-Shahraki, M.H.; Taghian, S.; Mirjalili, S.; Abualigah, L.; Abd Elaziz, M.; Oliva, D. EWOA-OPF: Effective whale optimization algorithm to solve optimal power flow problem. Electronics 2021, 10, 2975. [Google Scholar] [CrossRef]
- Rajesh, P.; Naveen, C.; Venkatesan, A.K.; Shajin, F.H. An optimization technique for battery energy storage with wind turbine generator integration in unbalanced radial distribution network. J. Energy Storage 2021, 43, 103160. [Google Scholar] [CrossRef]
- Khaled, U.; Eltamaly, A.M.; Beroual, A. Optimal power flow using particle swarm optimization of renewable hybrid distributed generation. Energies 2017, 10, 1013. [Google Scholar] [CrossRef]
- Al-butti, O.S.; Burunkaya, M.; Rahebi, J.; Lopez-Guede, J.M. Optimal Power Flow using PSO algorithms based on Artificial Neural Networks. IEEE Access 2024, 12, 154778–154795. [Google Scholar] [CrossRef]
- Grisales-Noreña, L.F.; Montoya, O.D.; Ramos-Paja, C.A. An energy management system for optimal operation of BSS in DC distributed generation environments based on a parallel PSO algorithm. J. Energy Storage 2020, 29, 101488. [Google Scholar] [CrossRef]
- Alhijawi, B.; Awajan, A. Genetic algorithms: Theory, genetic operators, solutions, and applications. Evol. Intell. 2024, 17, 1245–1256. [Google Scholar] [CrossRef]
- Restrepo-Cuestas, B.J.; Montano, J. Bishop model parameter estimation in photovoltaic cells using metaheuristic optimization techniques. Sol. Energy 2024, 270, 112410. [Google Scholar] [CrossRef]
- Restrepo-Cuestas, B.J.; Montano, J.; Ramos-Paja, C.A.; Trejos-Grisales, L.A.; Orozco-Gutierrez, M.L. Parameter estimation of the bishop photovoltaic model using a genetic algorithm. Appl. Sci. 2022, 12, 2927. [Google Scholar] [CrossRef]
- Wang, Y.; Rousis, A.O.; Strbac, G. On microgrids and resilience: A comprehensive review on modeling and operational strategies. Renew. Sustain. Energy Rev. 2020, 134, 110313. [Google Scholar] [CrossRef]
- Güney, T. Solar energy, governance and CO2 emissions. Renew. Energy 2022, 184, 791–798. [Google Scholar] [CrossRef]
- Carlini, F.; Christensen, B.J.; Datta Gupta, N.; Santucci de Magistris, P. Climate, wind energy, and CO2 emissions from energy production in Denmark. Energy Econ. 2023, 125, 106821. [Google Scholar] [CrossRef]
- Gil-González, W.; Montoya, O.D.; Grisales-Noreña, L.F.; Perea-Moreno, A.J.; Hernandez-Escobedo, Q. Optimal placement and sizing of wind generators in AC grids considering reactive power capability and wind speed curves. Sustainability 2020, 12, 2983. [Google Scholar] [CrossRef]
- Garrido-Arévalo, V.M.; Gil-González, W.; Montoya, O.D.; Grisales-Noreña, L.F.; Hernández, J.C. Optimal dispatch of DERs and battery-based ESS in distribution grids while considering reactive power capabilities and uncertainties: A second-order cone programming formulation. IEEE Access 2024, 12, 48497–48510. [Google Scholar] [CrossRef]
- Emami, A.; Noghreh, P. New approach on optimization in placement of wind turbines within wind farm by genetic algorithms. Renew. Energy 2010, 35, 1559–1564. [Google Scholar] [CrossRef]
- Grisales-Noreña, L.F.; Gonzalez Montoya, D.; Ramos-Paja, C.A. Optimal sizing and location of distributed generators based on PBIL and PSO techniques. Energies 2018, 11, 1018. [Google Scholar] [CrossRef]
- Rosales Muñoz, A.A.; Grisales-Noreña, L.F.; Montano, J.; Montoya, O.D.; Giral-Ramírez, D.A. Optimal power dispatch of distributed generators in direct current networks using a Master–Slave methodology that combines the Salp swarm algorithm and the successive approximation method. Electronics 2021, 10, 2837. [Google Scholar] [CrossRef]
- Zou, B.; Xiao, Q. Solving Probabilistic Optimal Power Flow Problem Using Quasi Monte Carlo Method and Ninth-Order Polynomial Normal Transformation. IEEE Trans. Power Syst. 2014, 29, 300–306. [Google Scholar] [CrossRef]
- Jain, N.; Singh, S.; Srivastava, S. PSO based placement of multiple wind DGs and capacitors utilizing probabilistic load flow model. Swarm Evol. Comput. 2014, 19, 15–24. [Google Scholar] [CrossRef]
- Yu, K.; Liang, J.; Qu, B.; Chen, X.; Wang, H. Parameters identification of photovoltaic models using an improved JAYA optimization algorithm. Energy Convers. Manag. 2017, 150, 742–753. [Google Scholar] [CrossRef]
- Barnawi, A.B. Development and Analysis of Optimization Algorithm for Demand-Side Management Considering Optimal Generation Scheduling and Power Flow in Grid-Connected AC/DC Microgrid. Sustainability 2023, 15, 15671. [Google Scholar] [CrossRef]
- Karthikeyan, K.; Dhal, P. Multi verse optimization (MVO) technique based voltage stability analysis through continuation power flow in IEEE 57 bus. Energy Procedia 2017, 117, 583–591. [Google Scholar] [CrossRef]
- Kusuma, V.A.; Firdaus, A.A.; Suprapto, S.S.; Putra, D.F.U.; Prasetyo, Y.; Filliana, F. Leveraging PSO algorithms to achieve optimal stand-alone microgrid performance with a focus on battery lifetime. Int. J. Appl. Power Eng. 2023, 12, 293–299. [Google Scholar] [CrossRef]
- Grisales-Noreña, L.F.; Vega, H.P.; Montoya, O.D.; Botero-Gómez, V.; Sanin-Villa, D. Cost Optimization of AC Microgrids in Grid-Connected and Isolated Modes Using a Population-Based Genetic Algorithm for Energy Management of Distributed Wind Turbines. Mathematics 2025, 13, 704. [Google Scholar] [CrossRef]
- Wang, P.; Wang, W.; Xu, D. Optimal Sizing of Distributed Generations in DC Microgrids With Comprehensive Consideration of System Operation Modes and Operation Targets. IEEE Access 2018, 6, 31129–31140. [Google Scholar] [CrossRef]
- Cubillo-Leyton, P.I.; Montoya, O.D.; Grisales-Noreña, L.F. Optimized integration of photovoltaic systems and distribution static compensators in distribution networks using a novel discrete-continuous version of the adaptive JAYA algorithm (AJAYA). Results Eng. 2025, 26, 104726. [Google Scholar] [CrossRef]
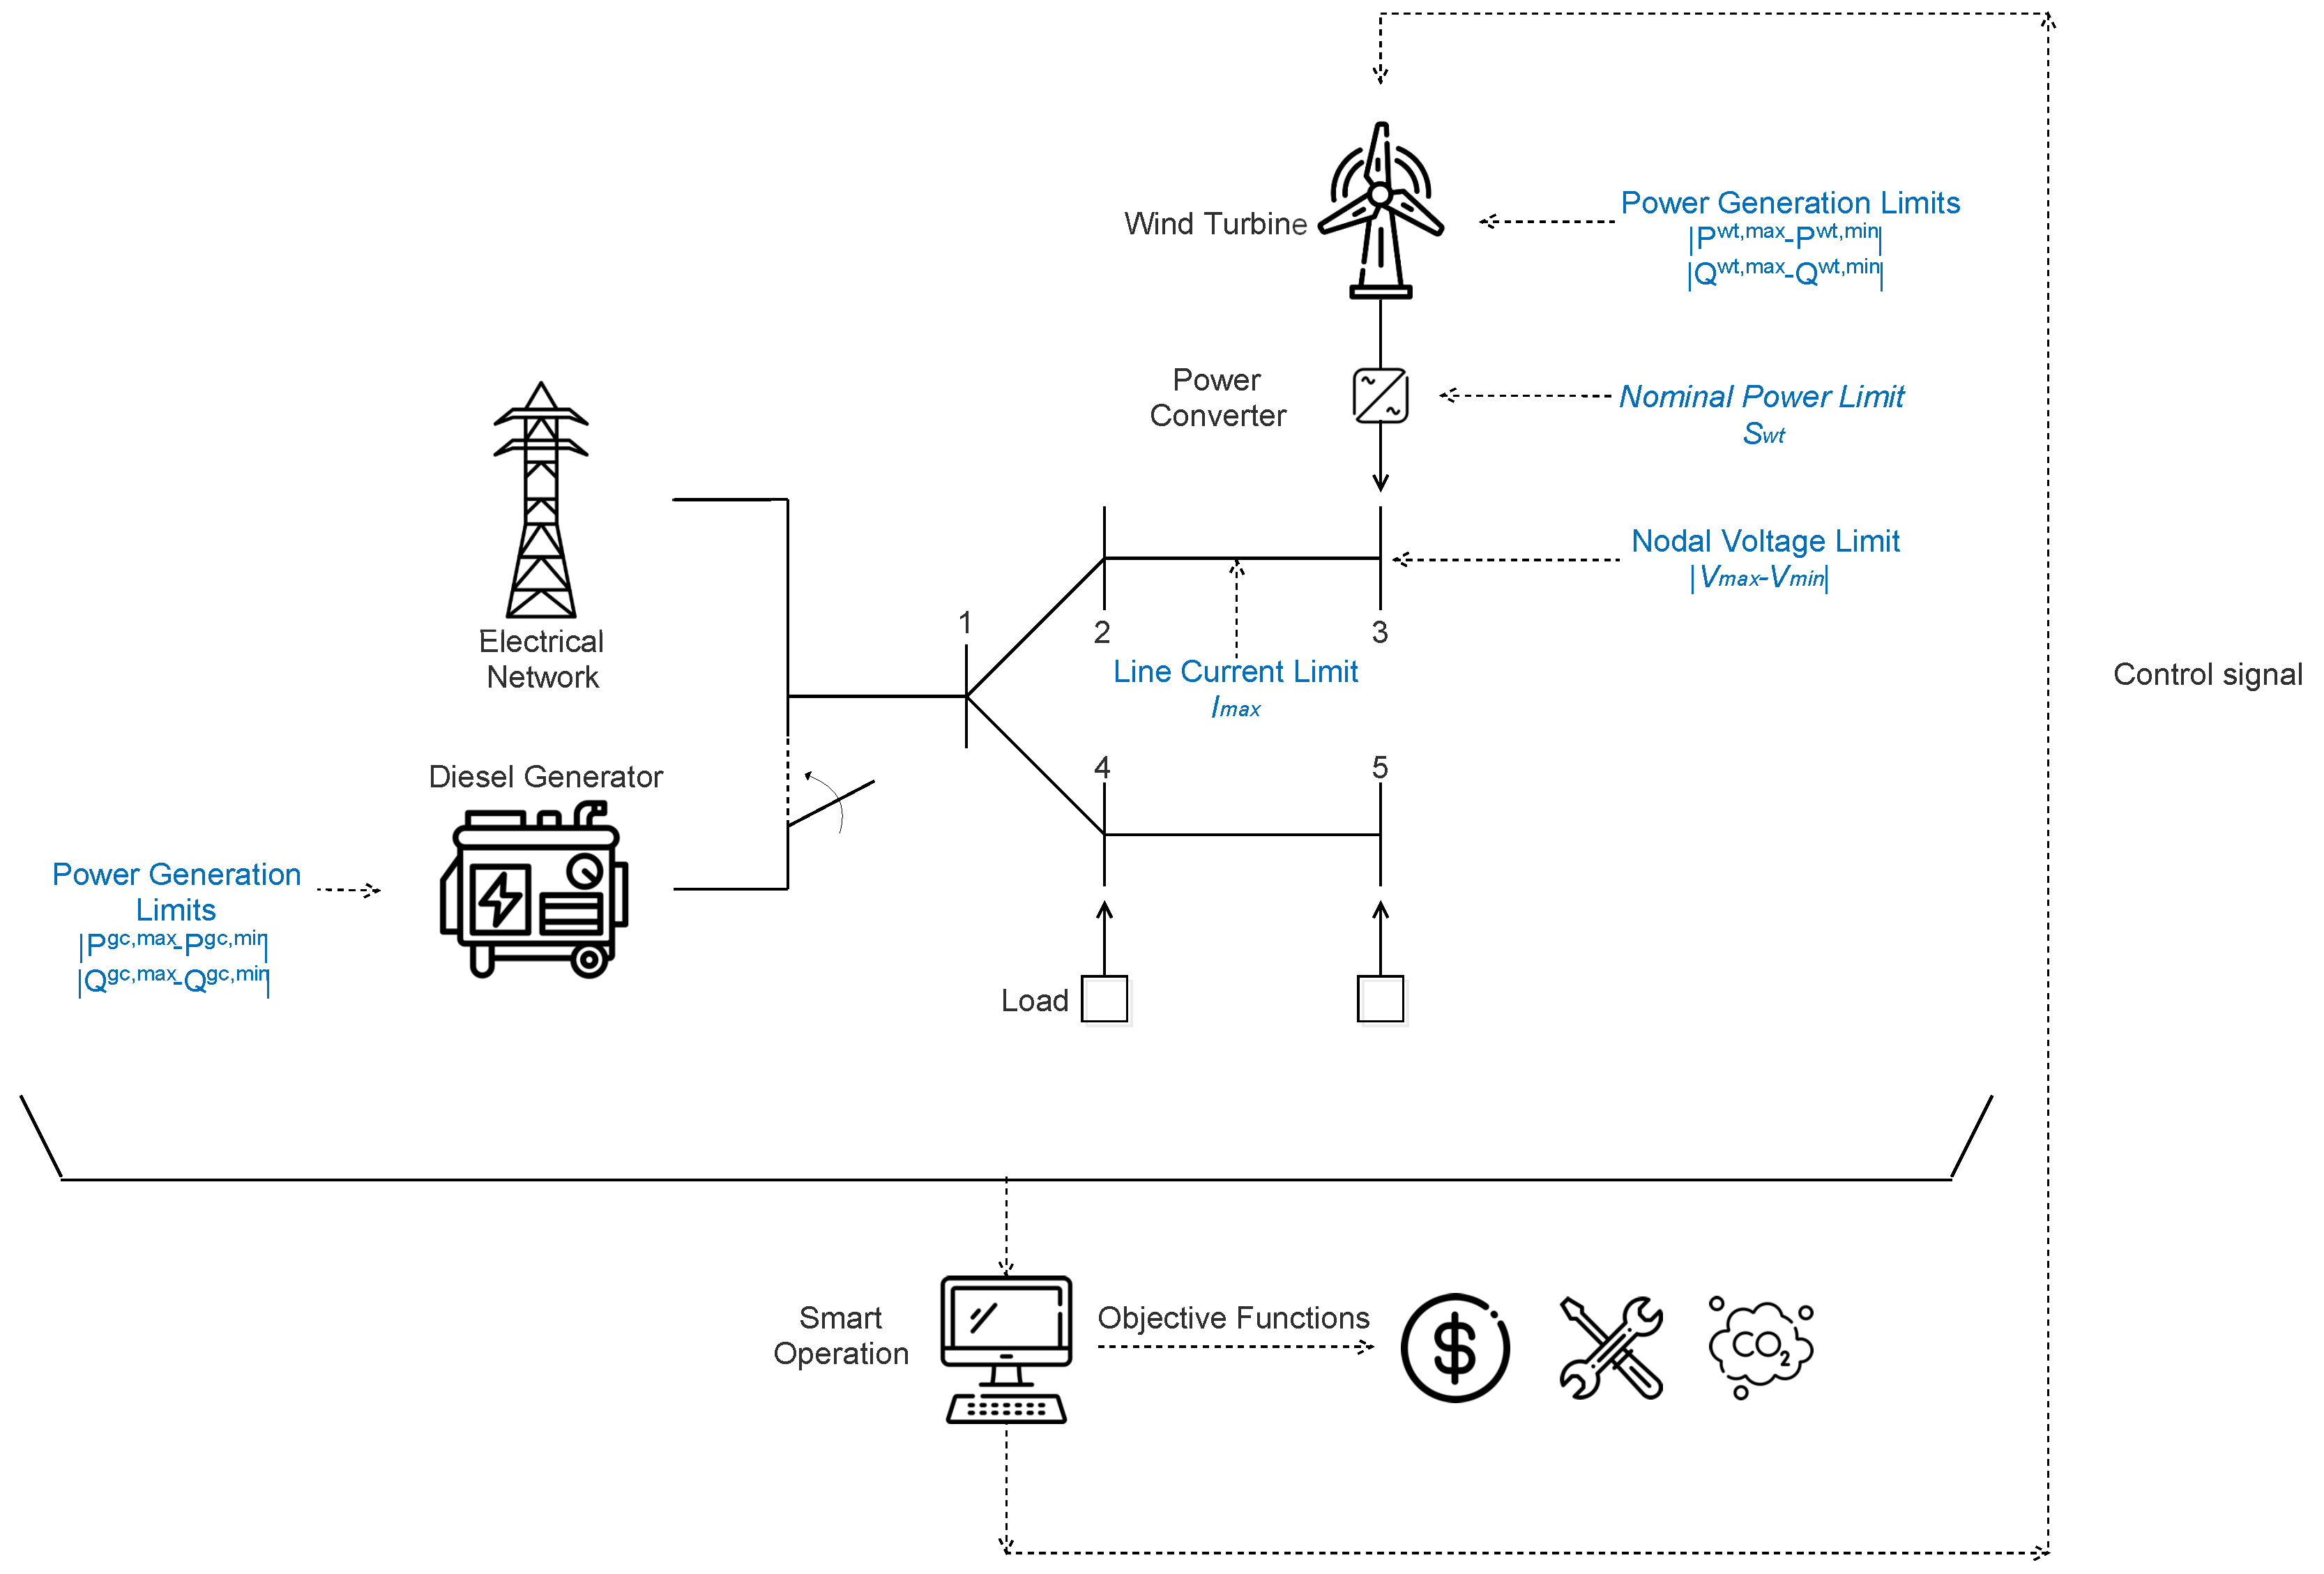

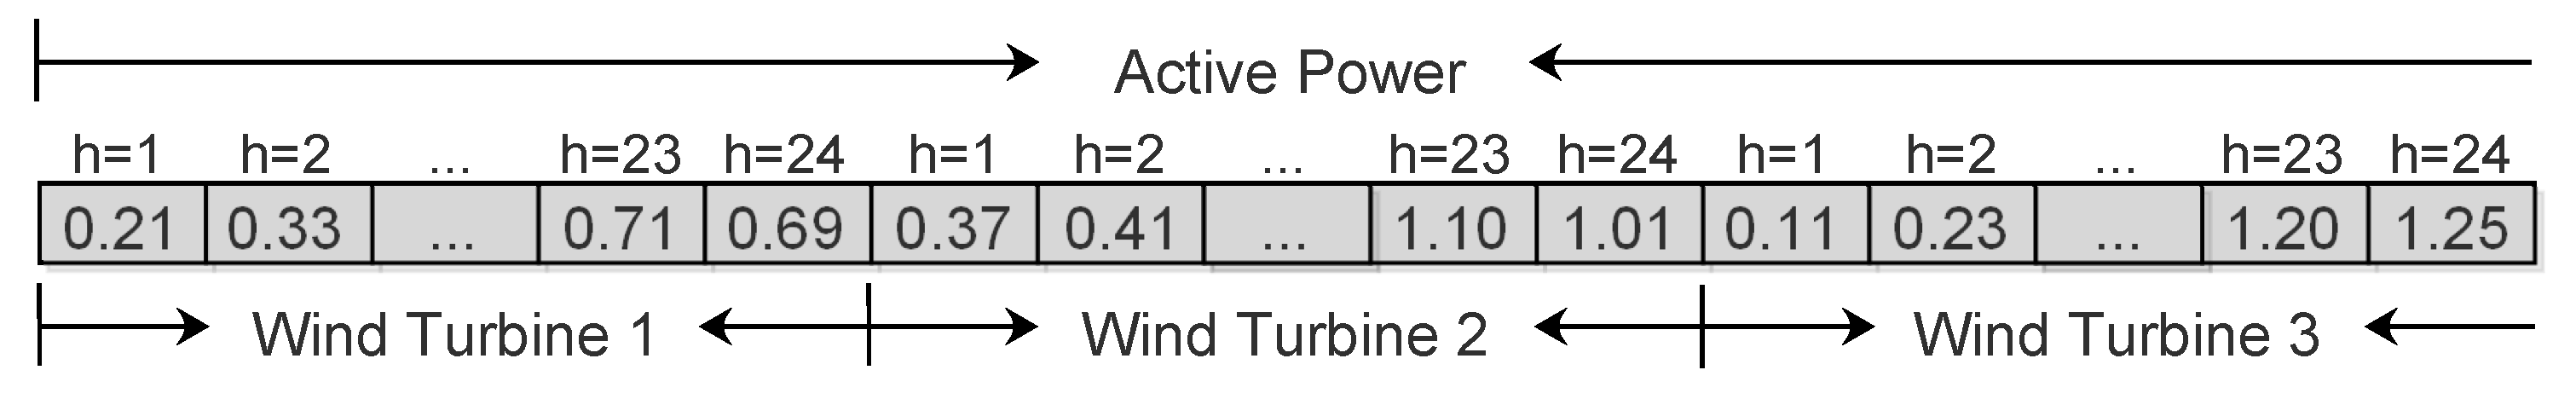
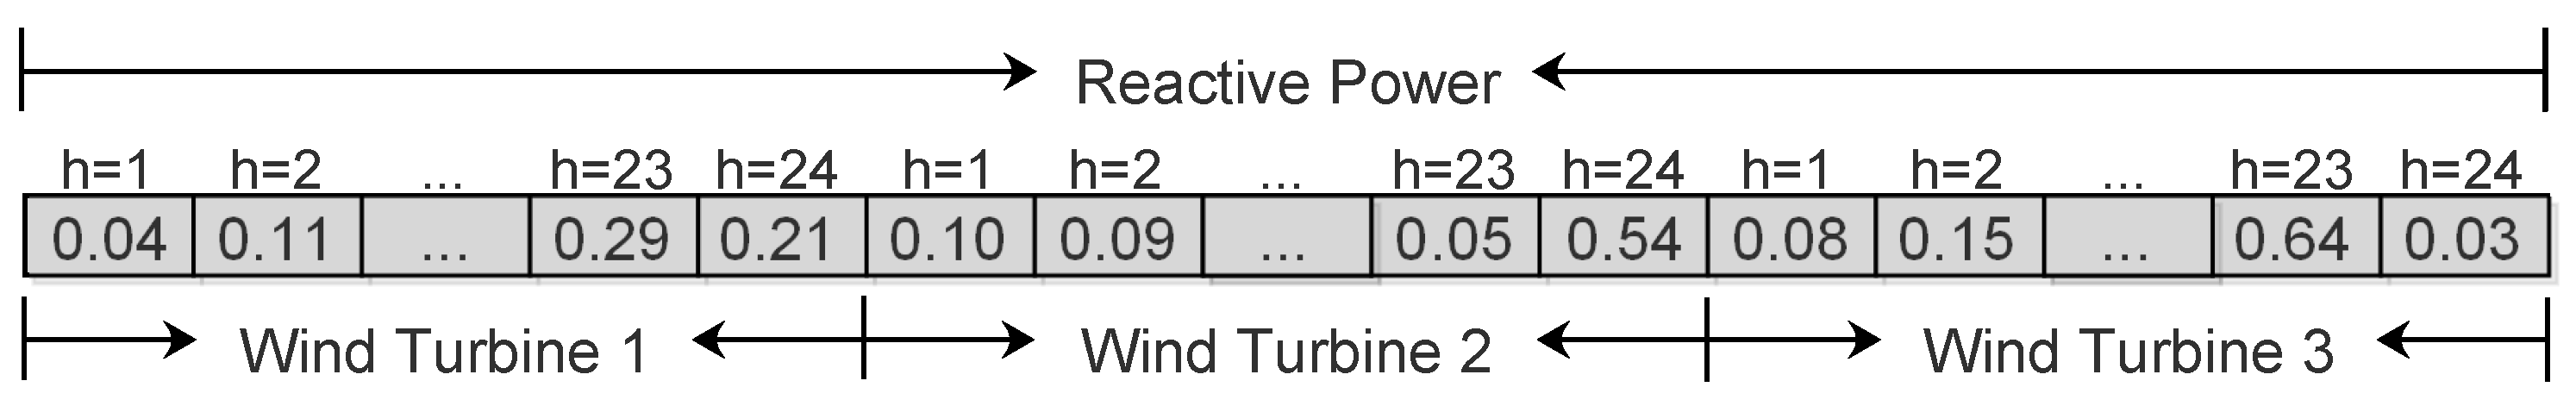
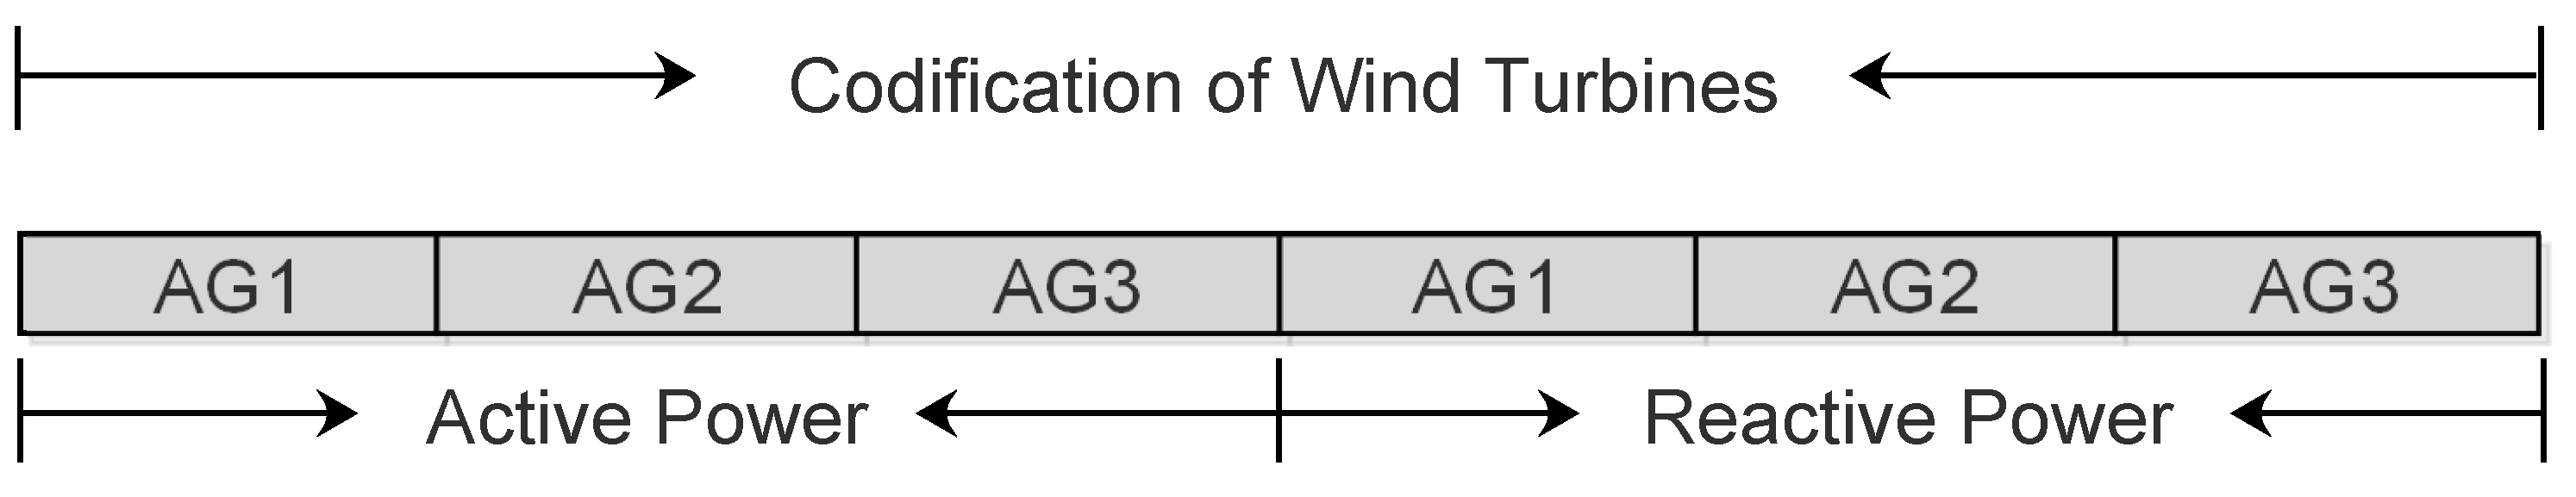

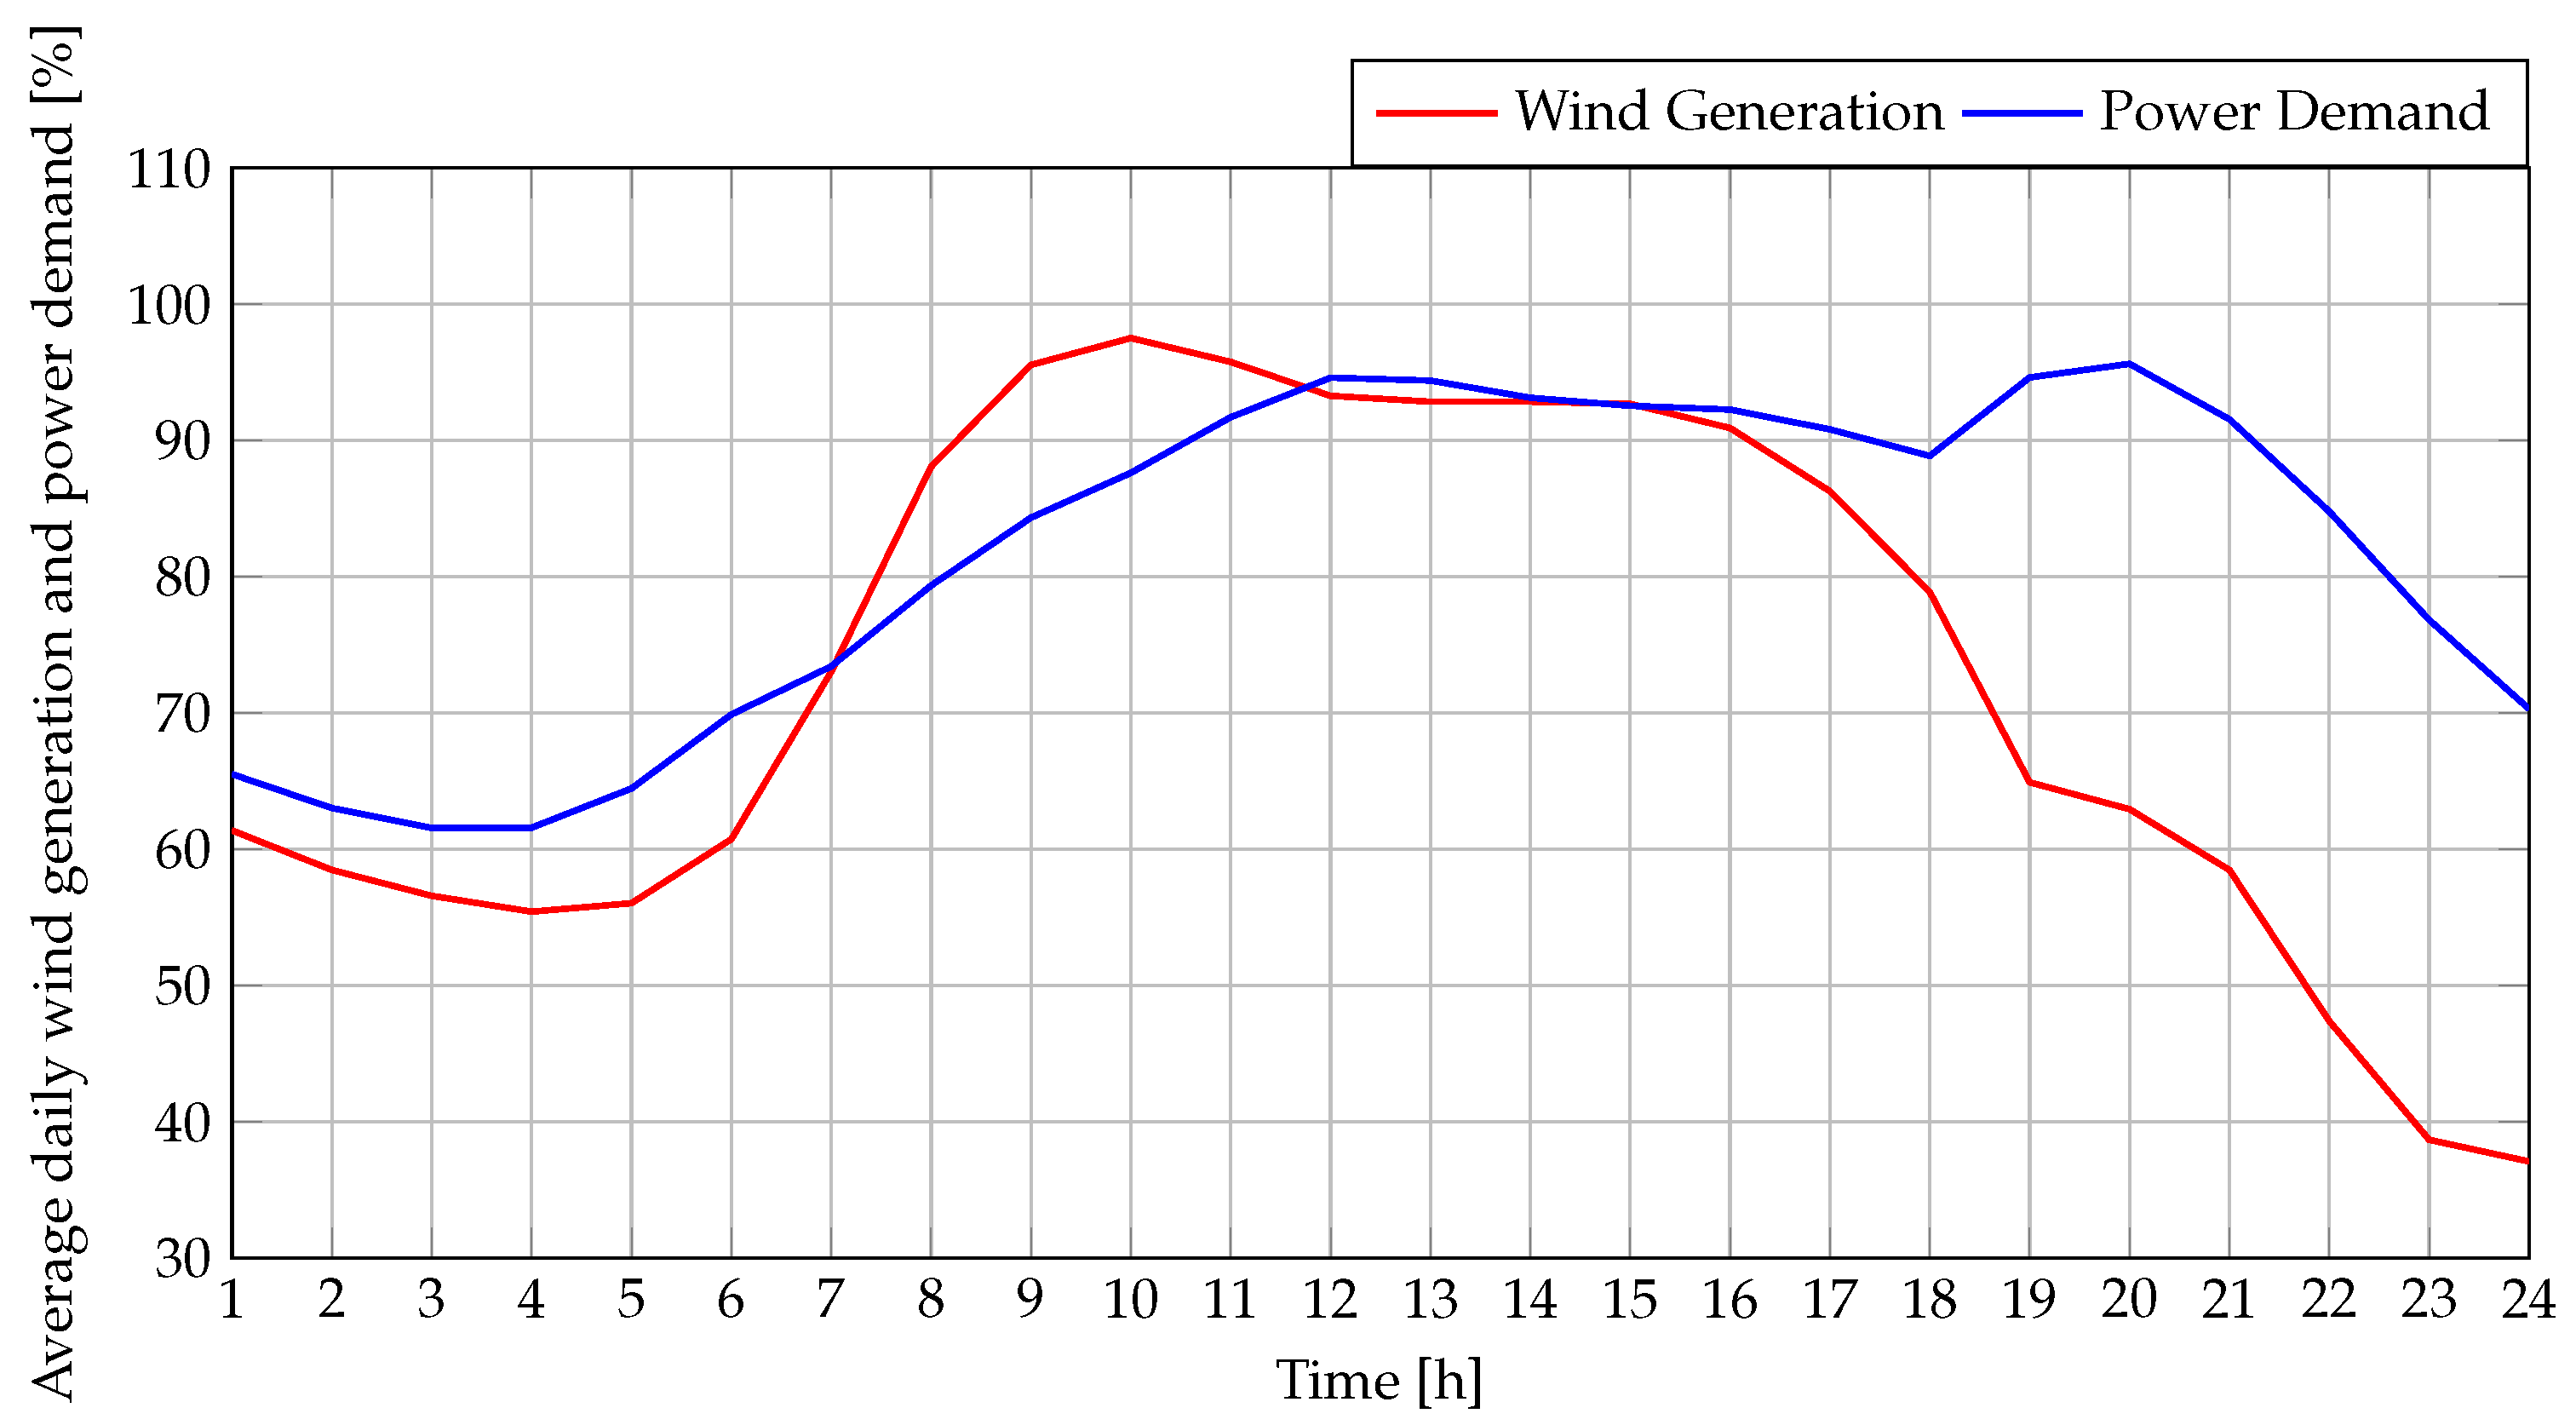
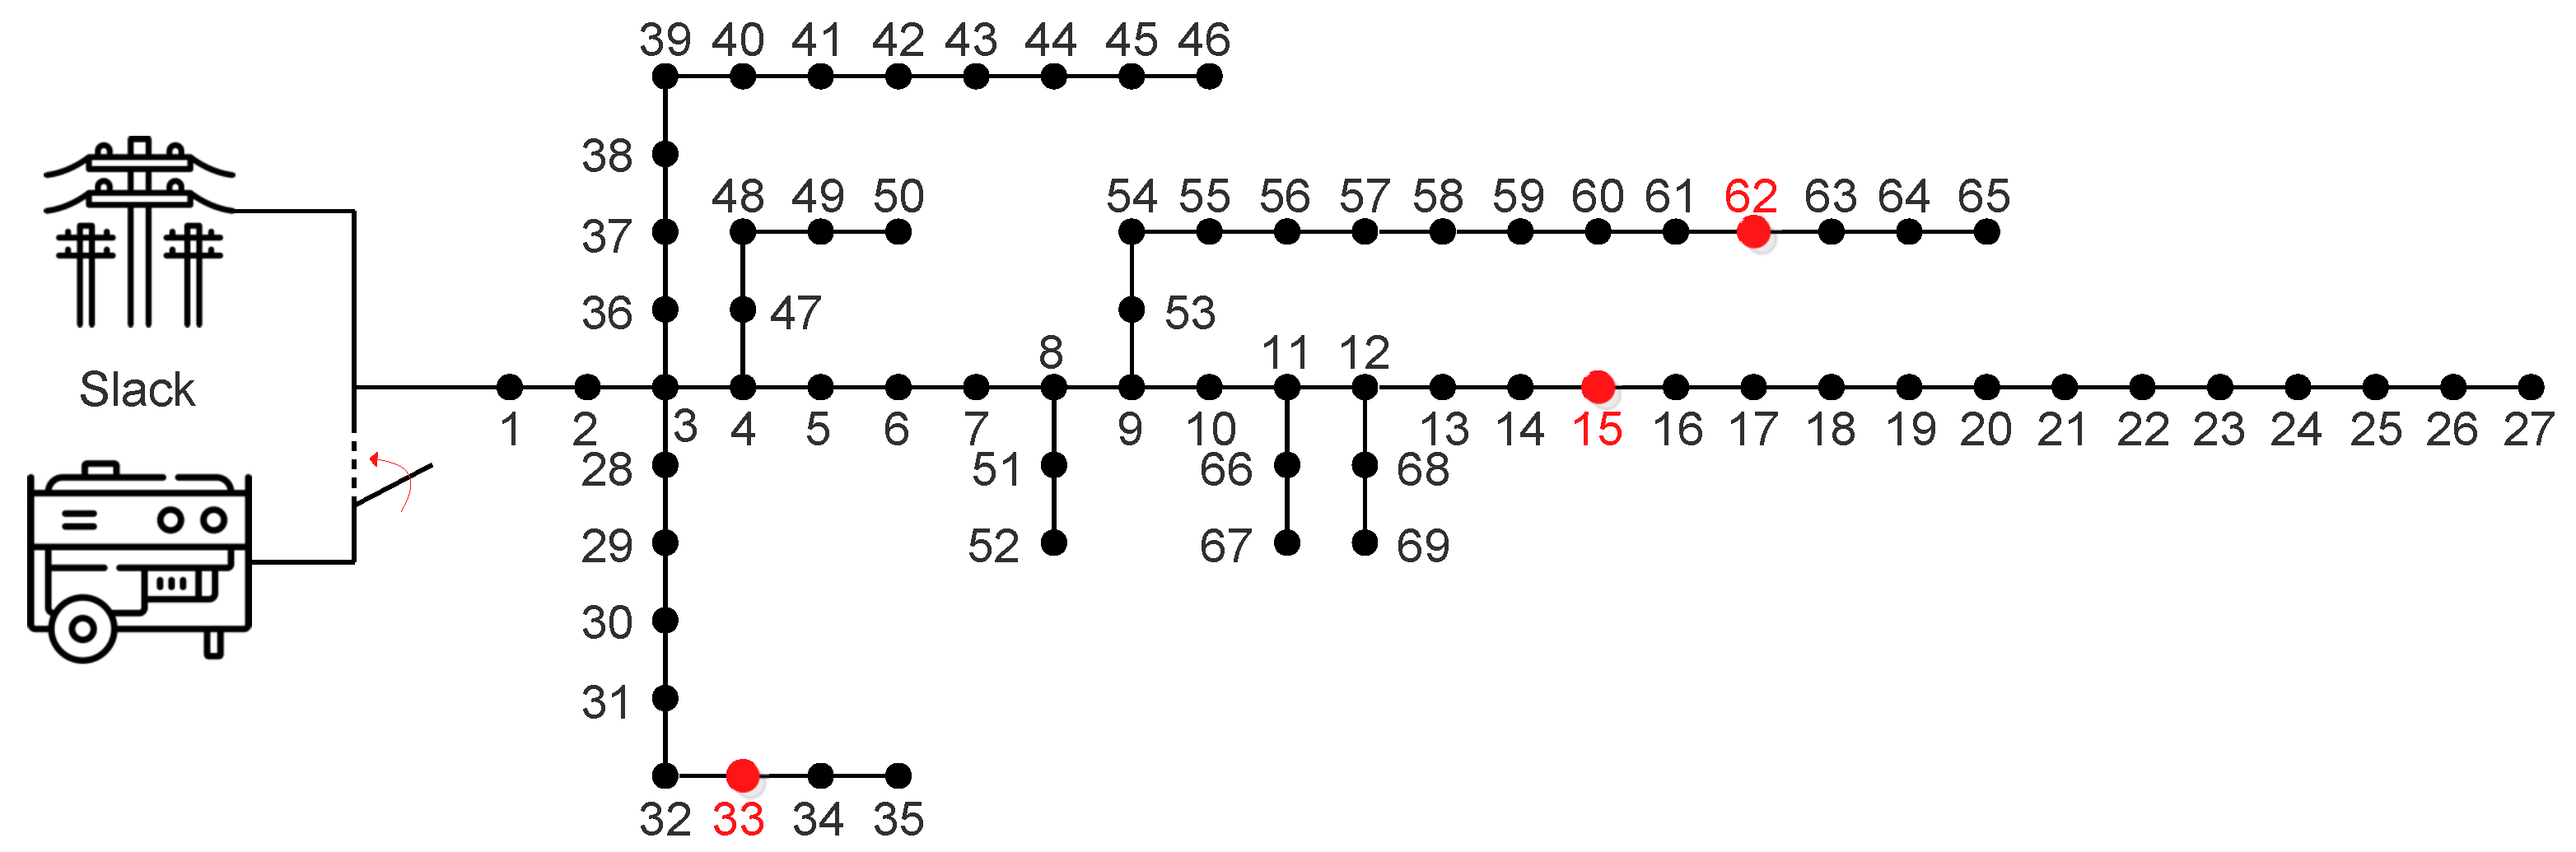
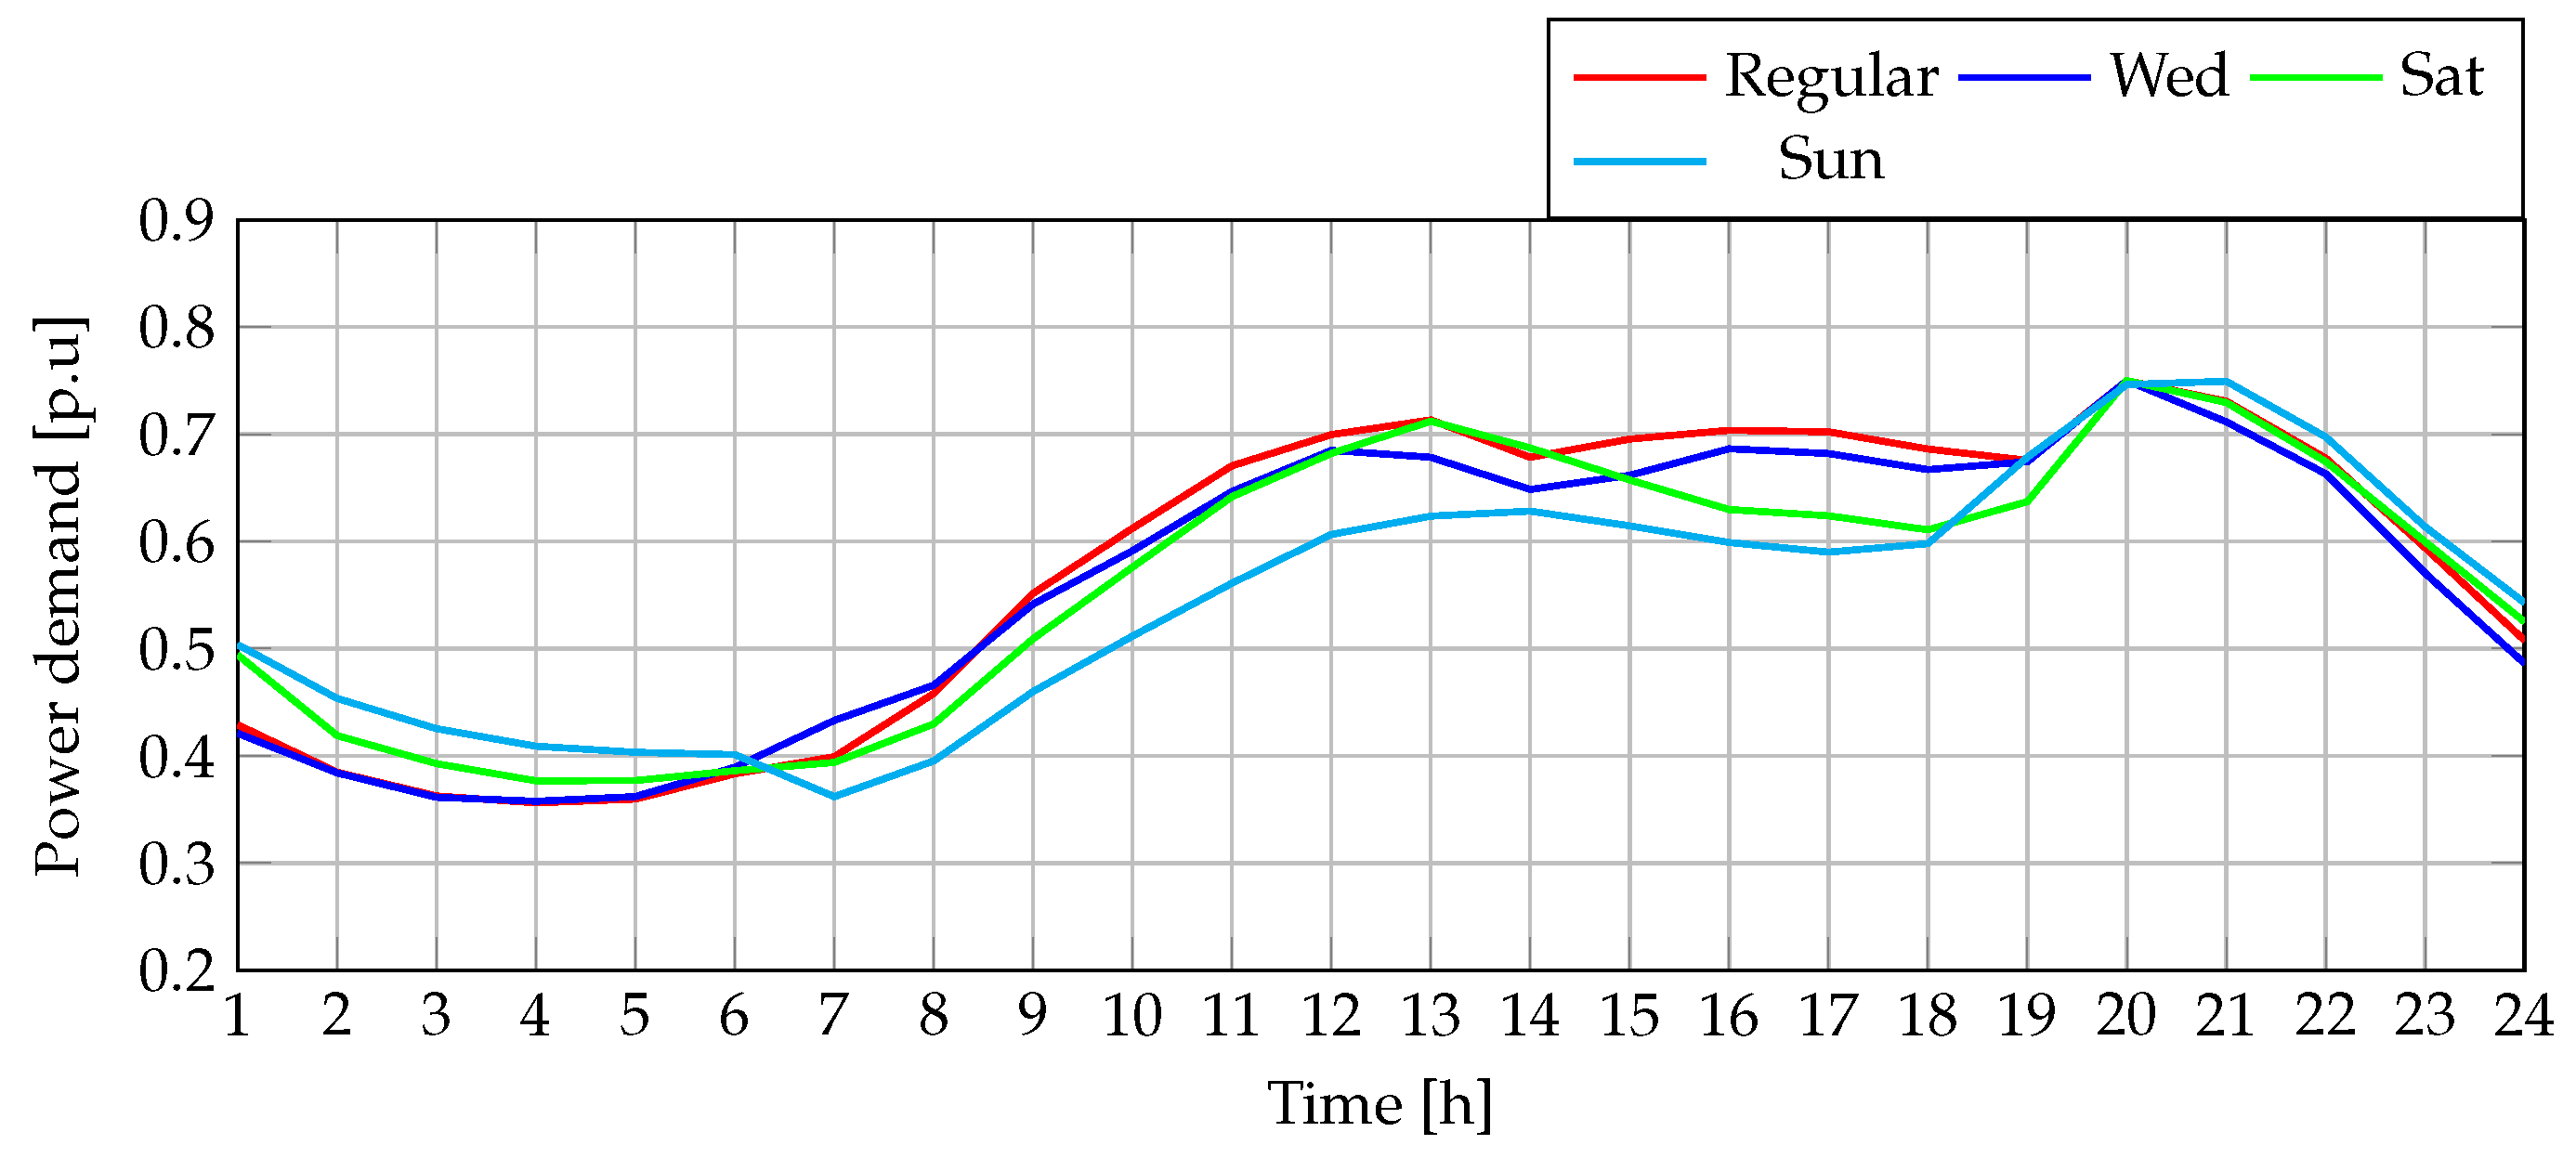
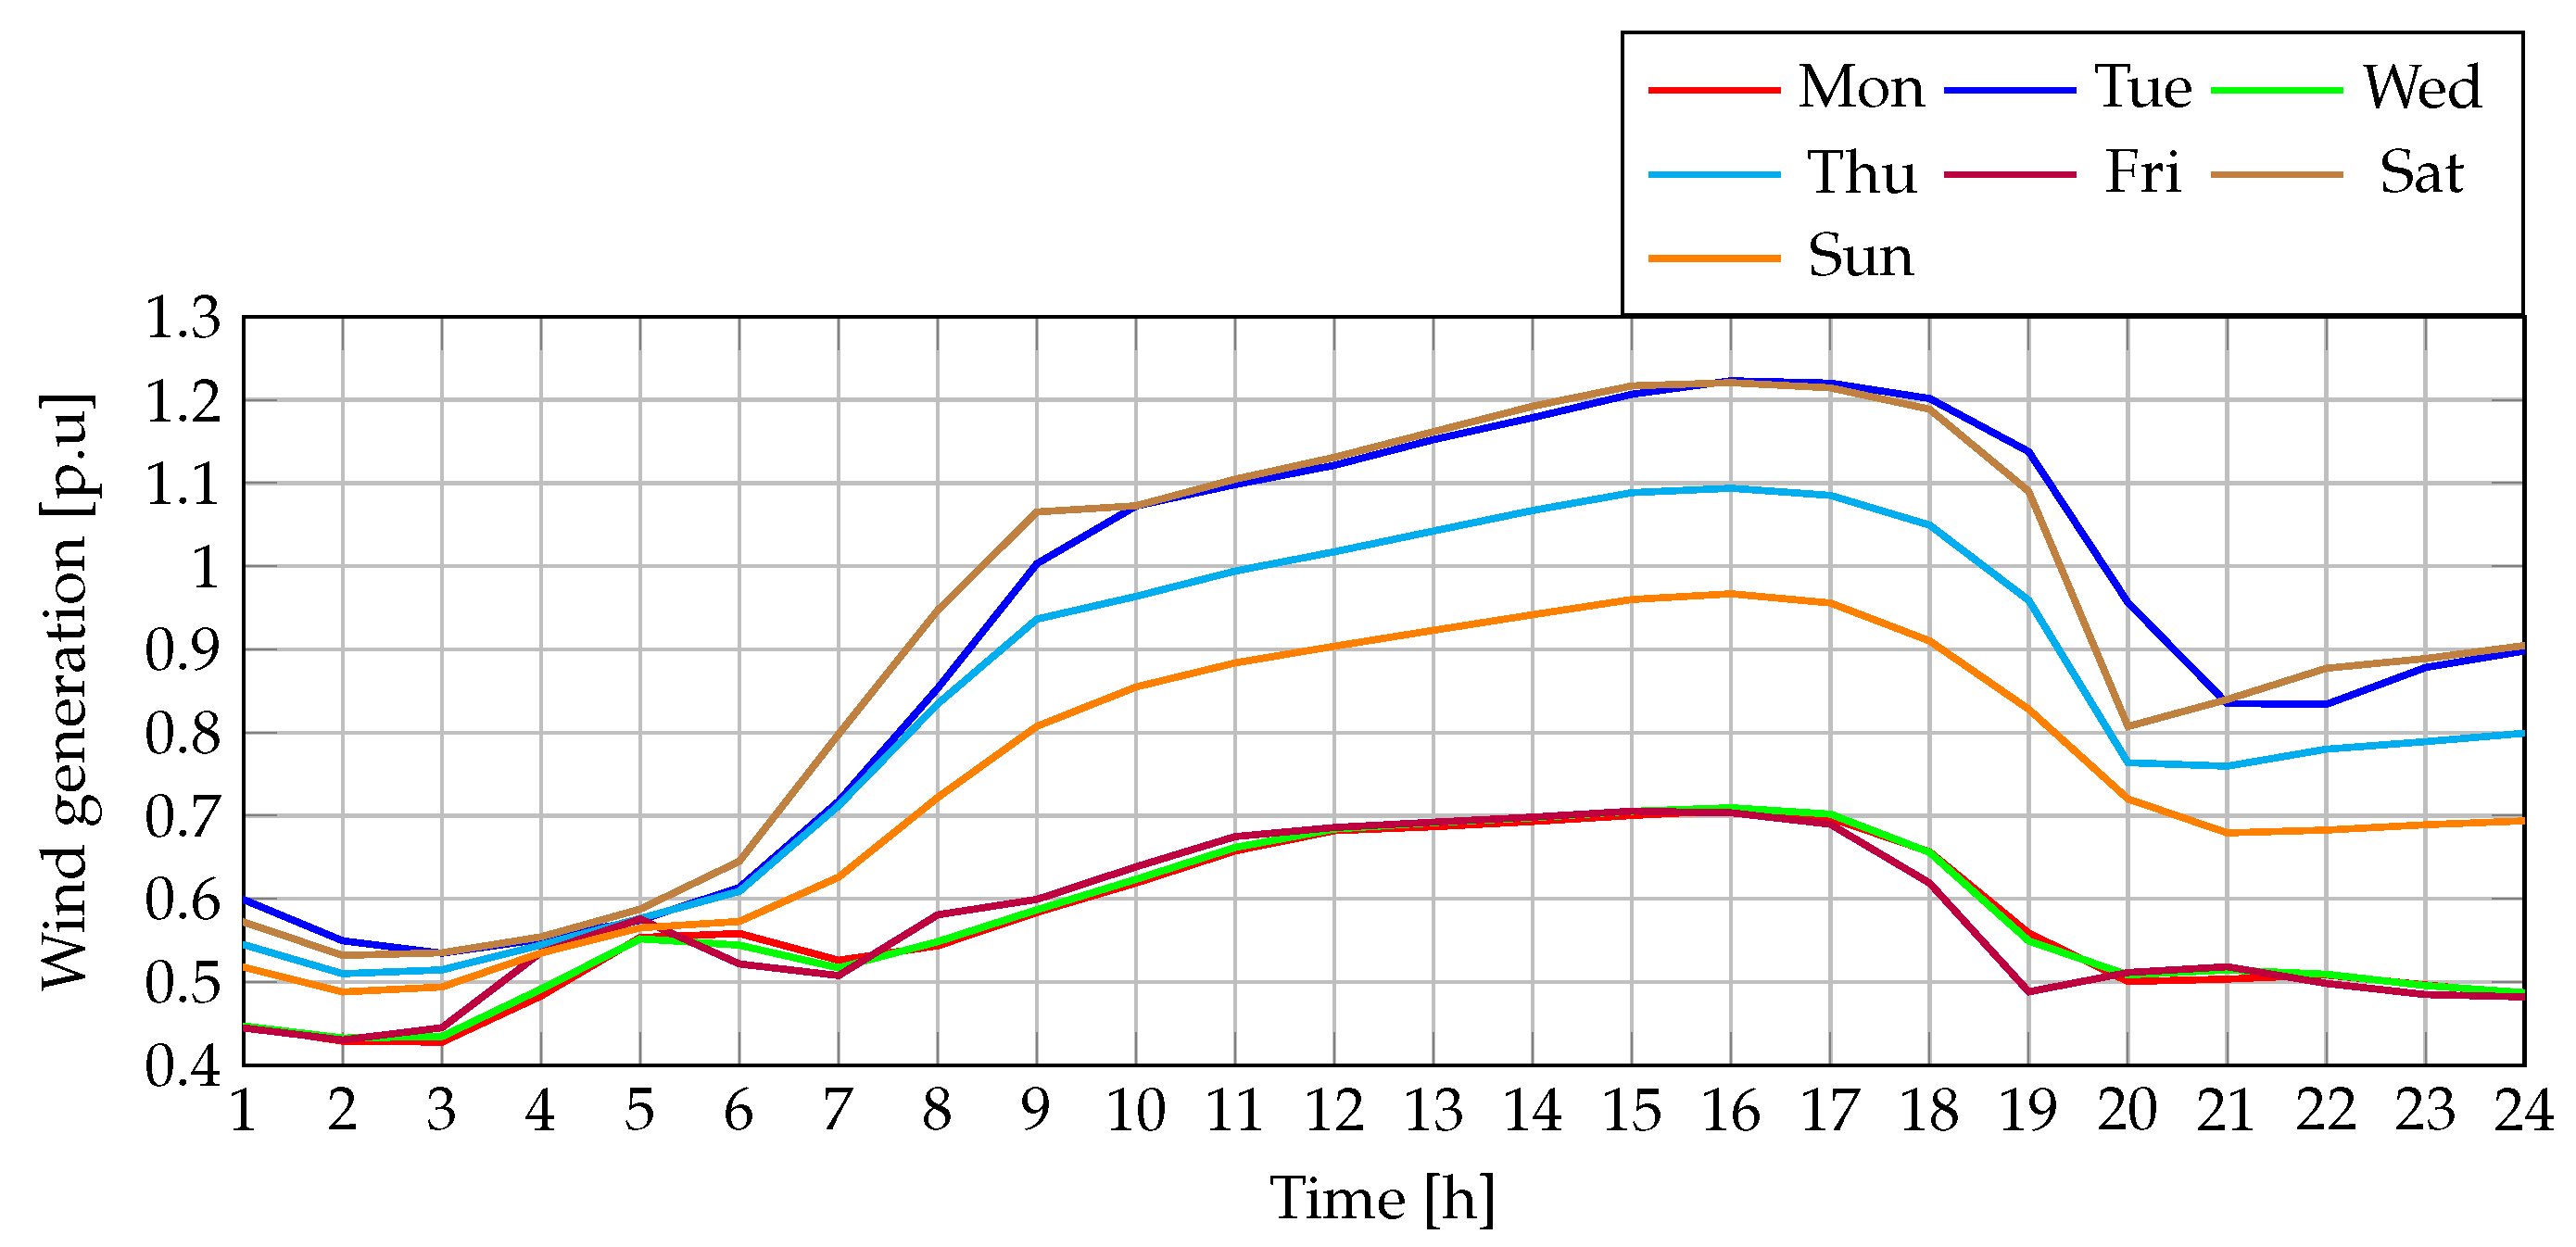
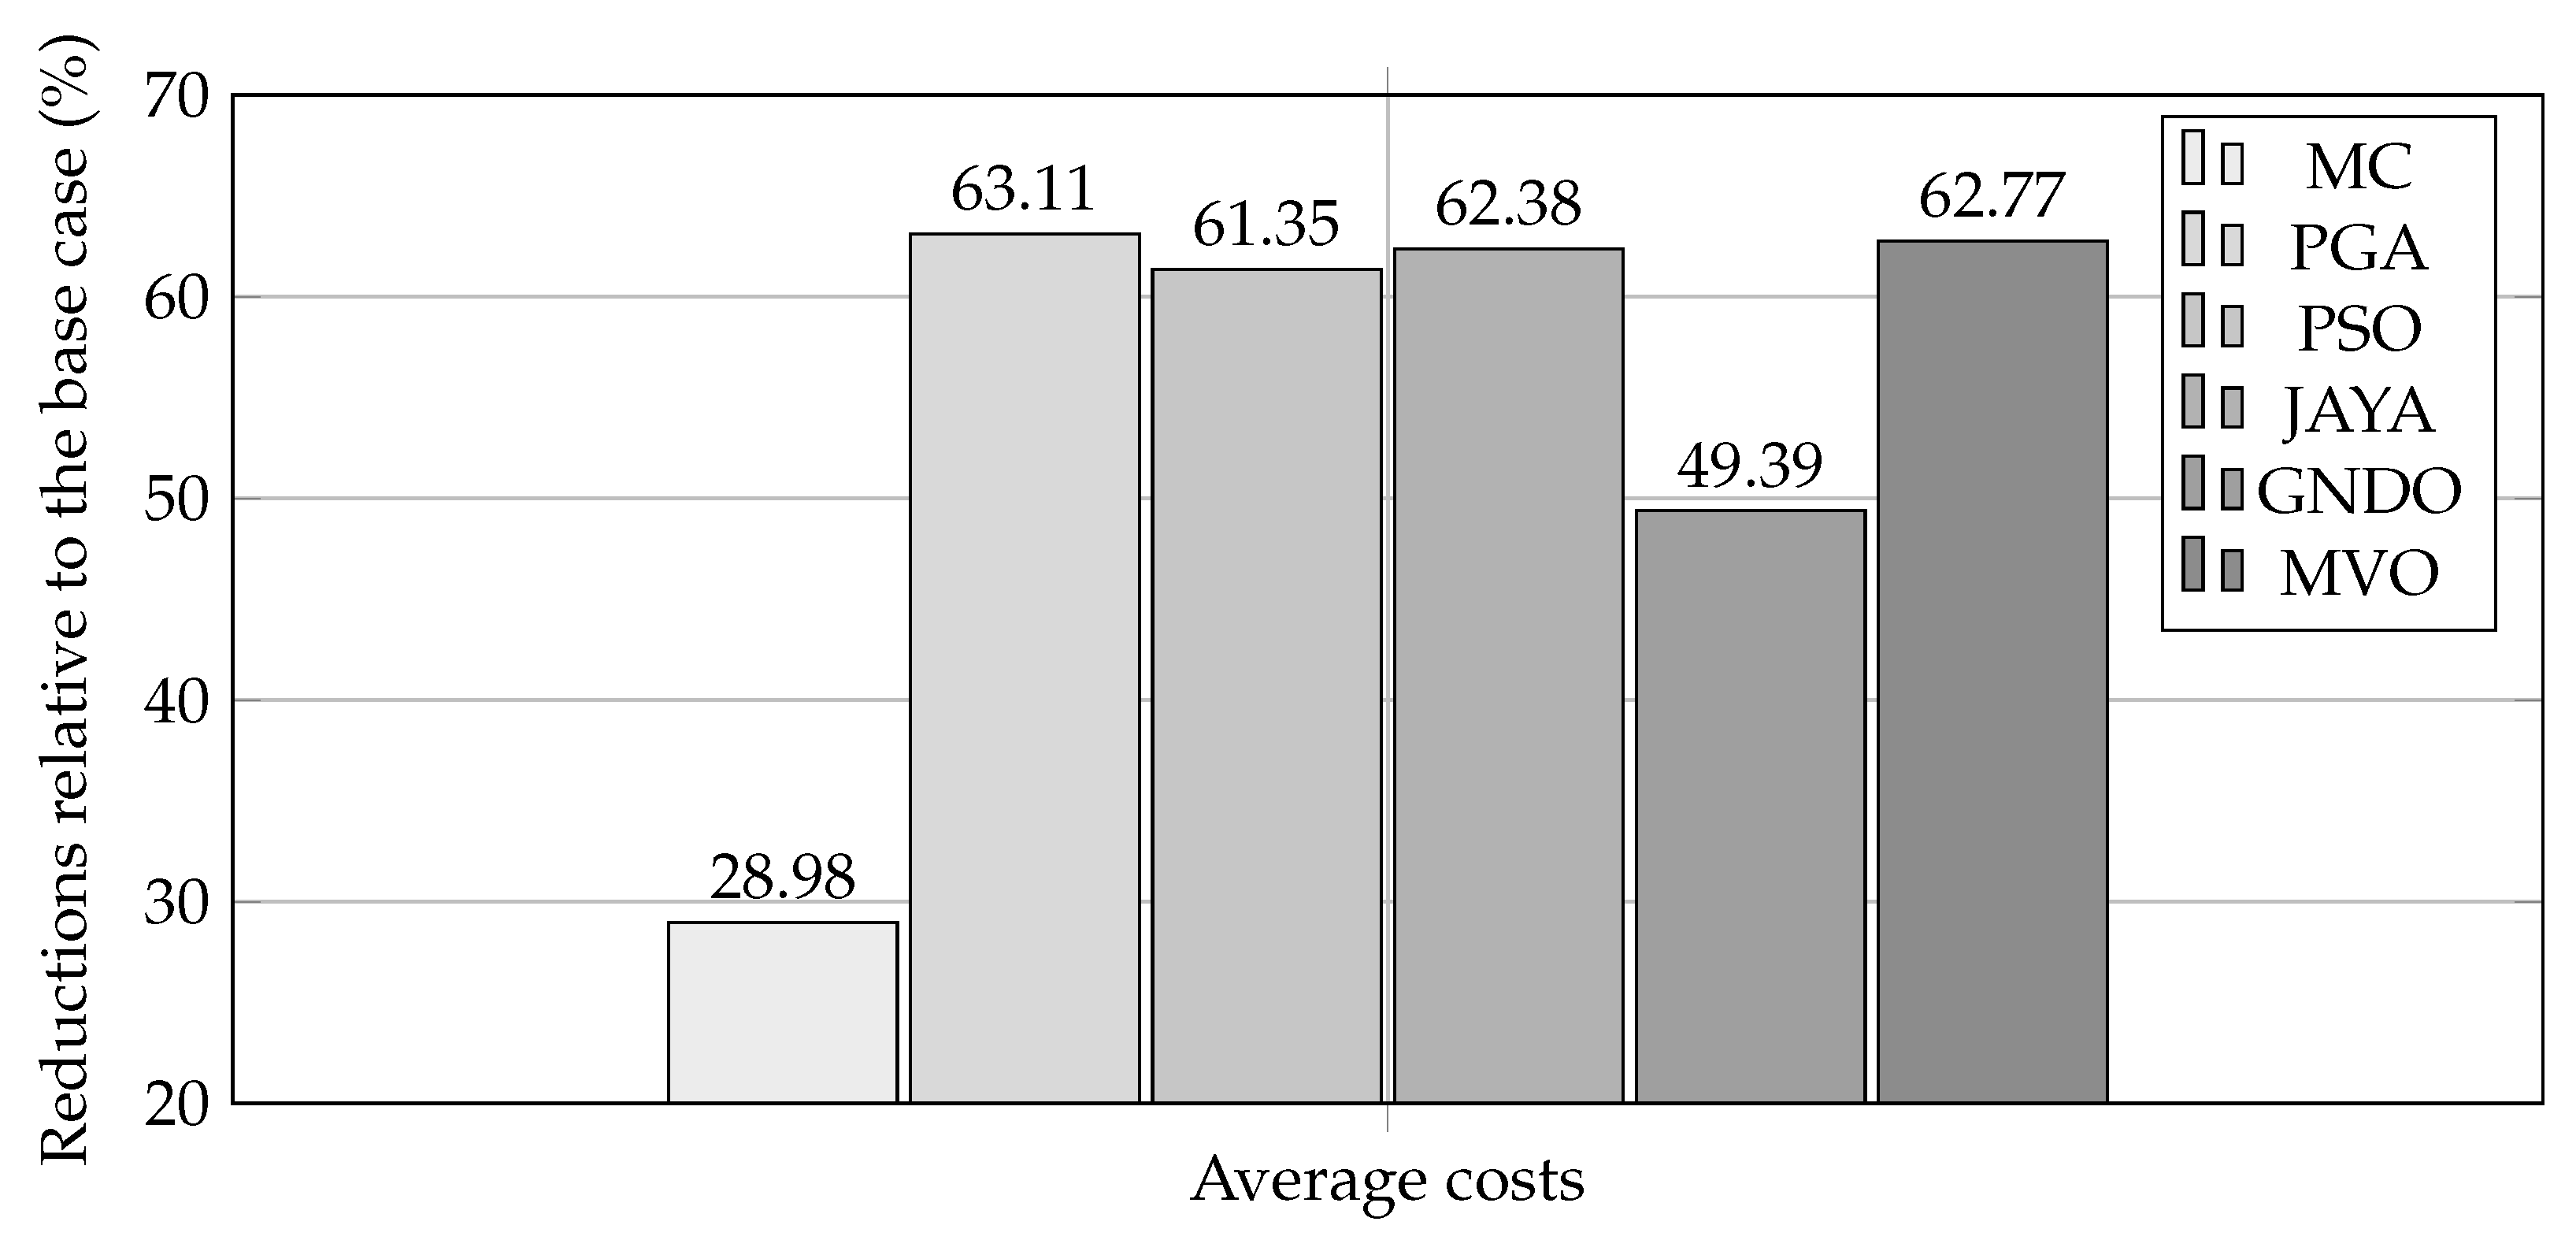
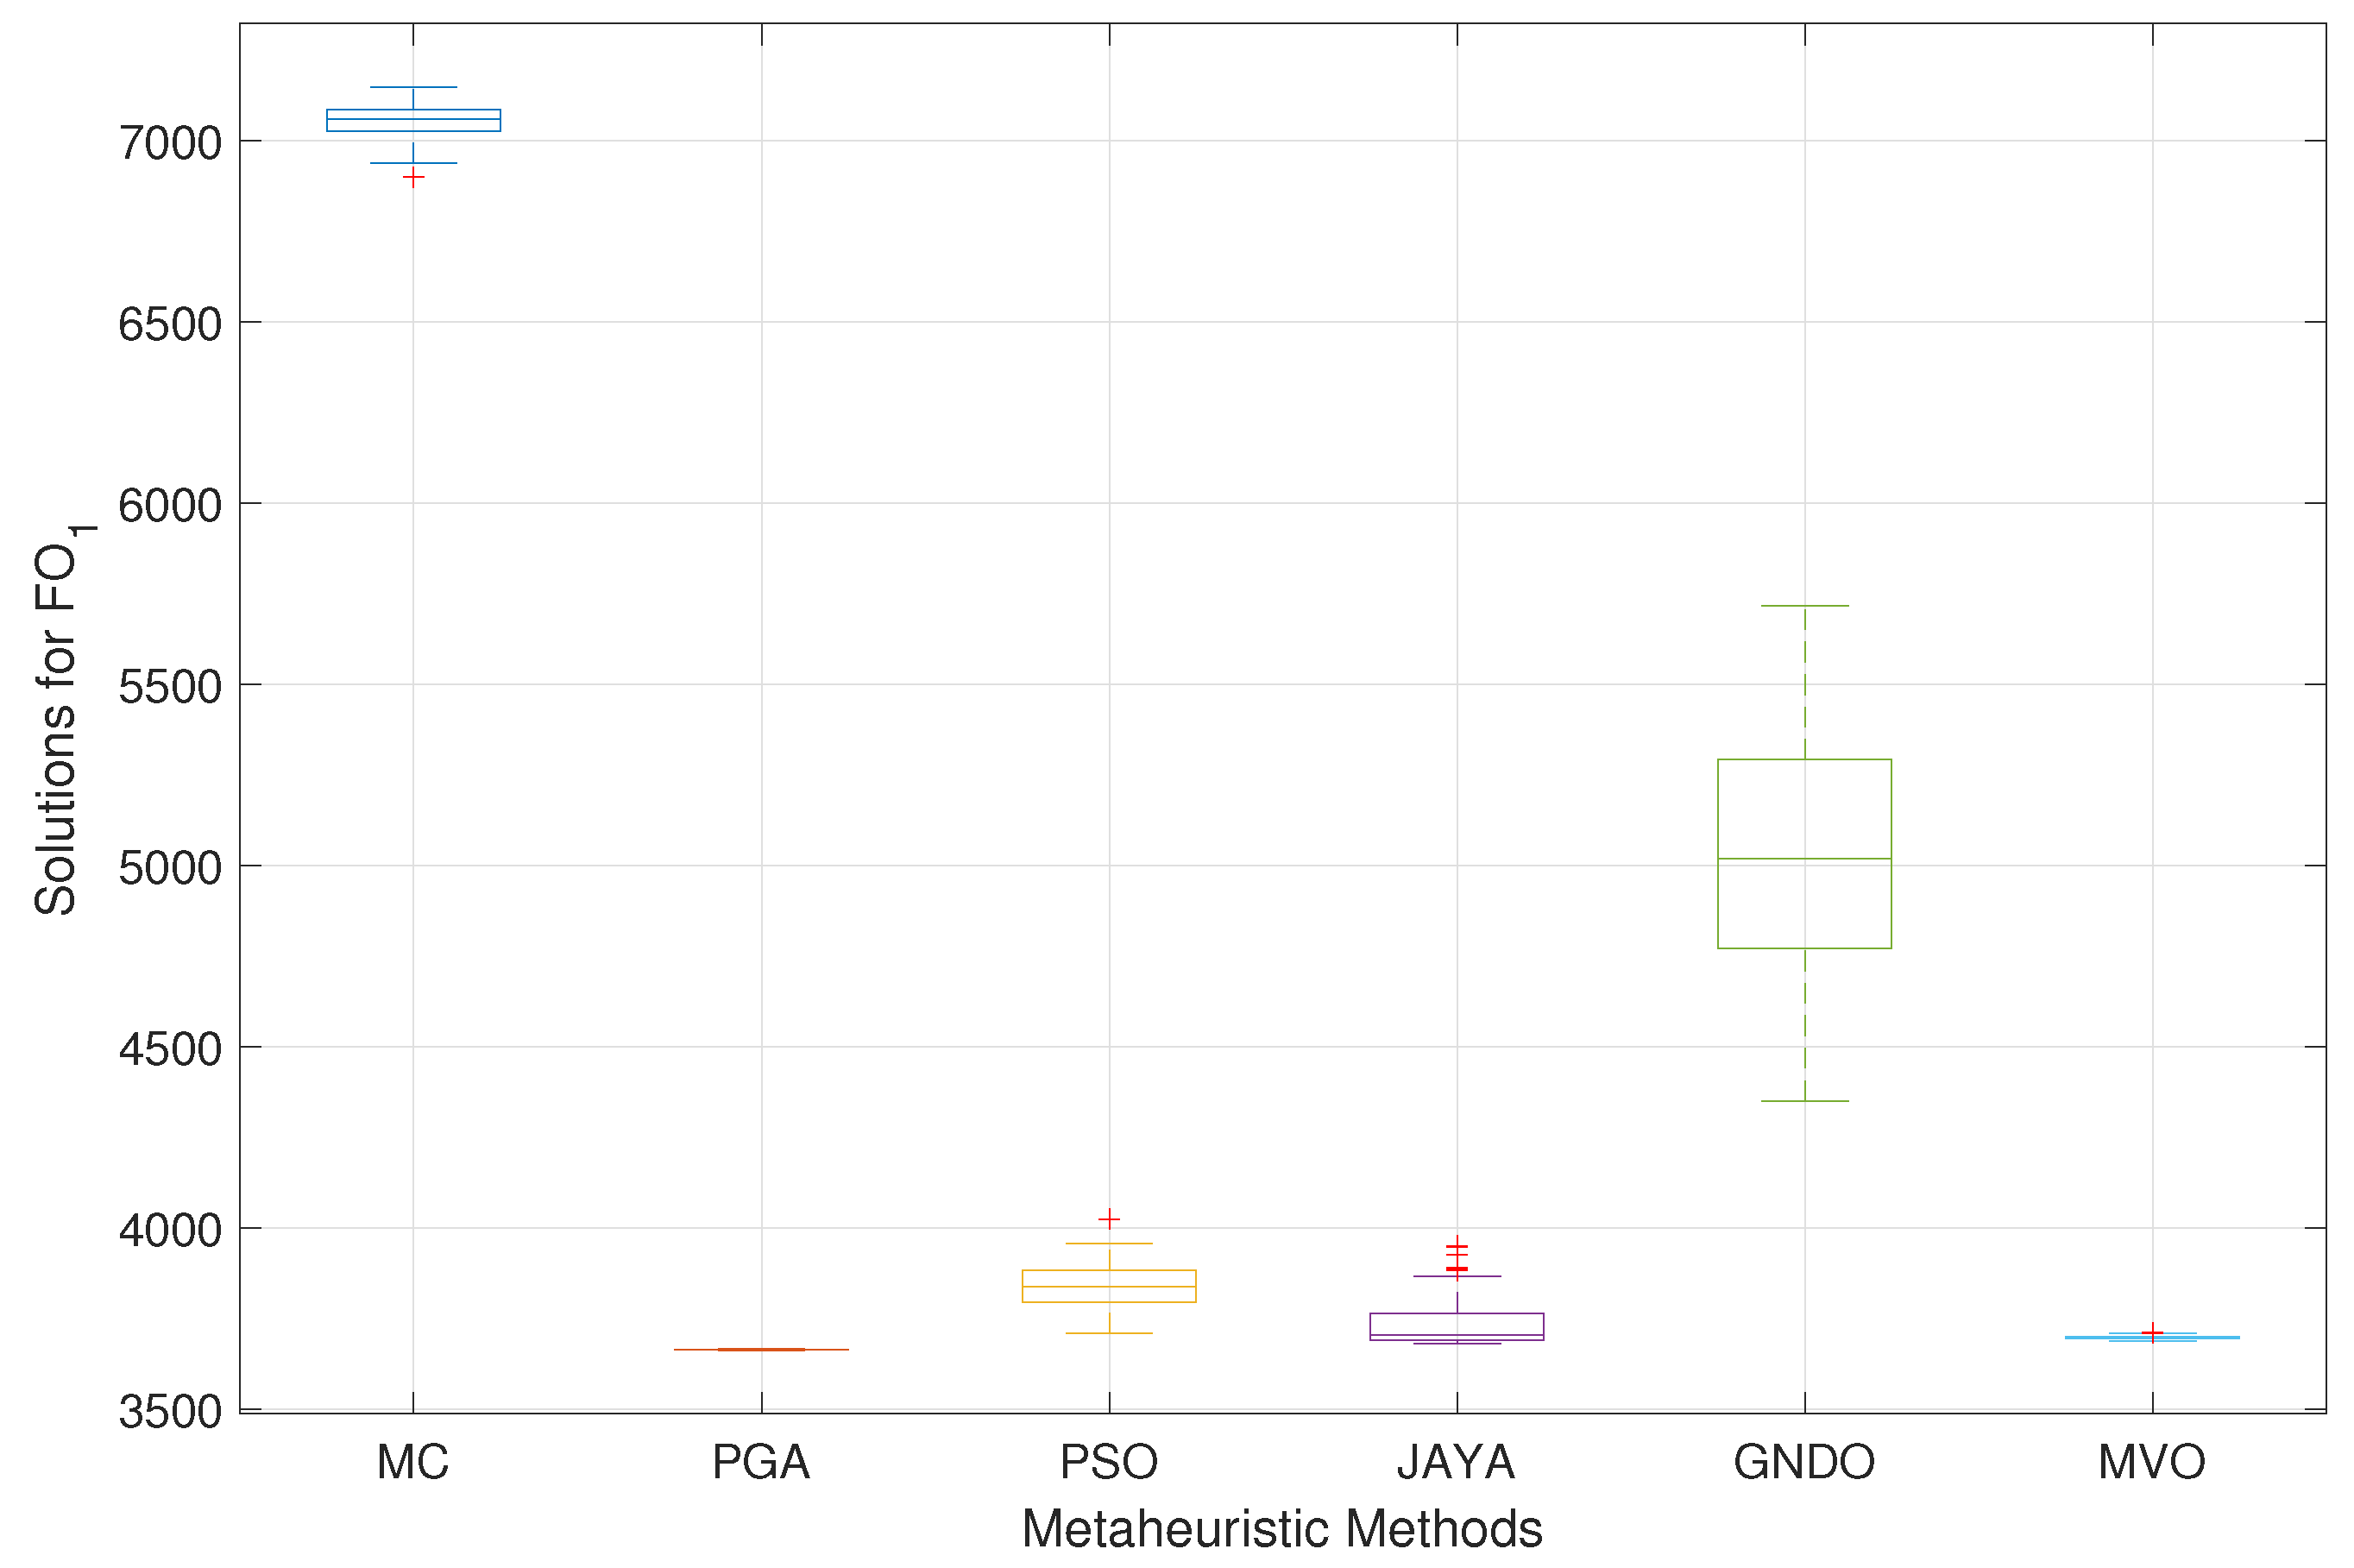
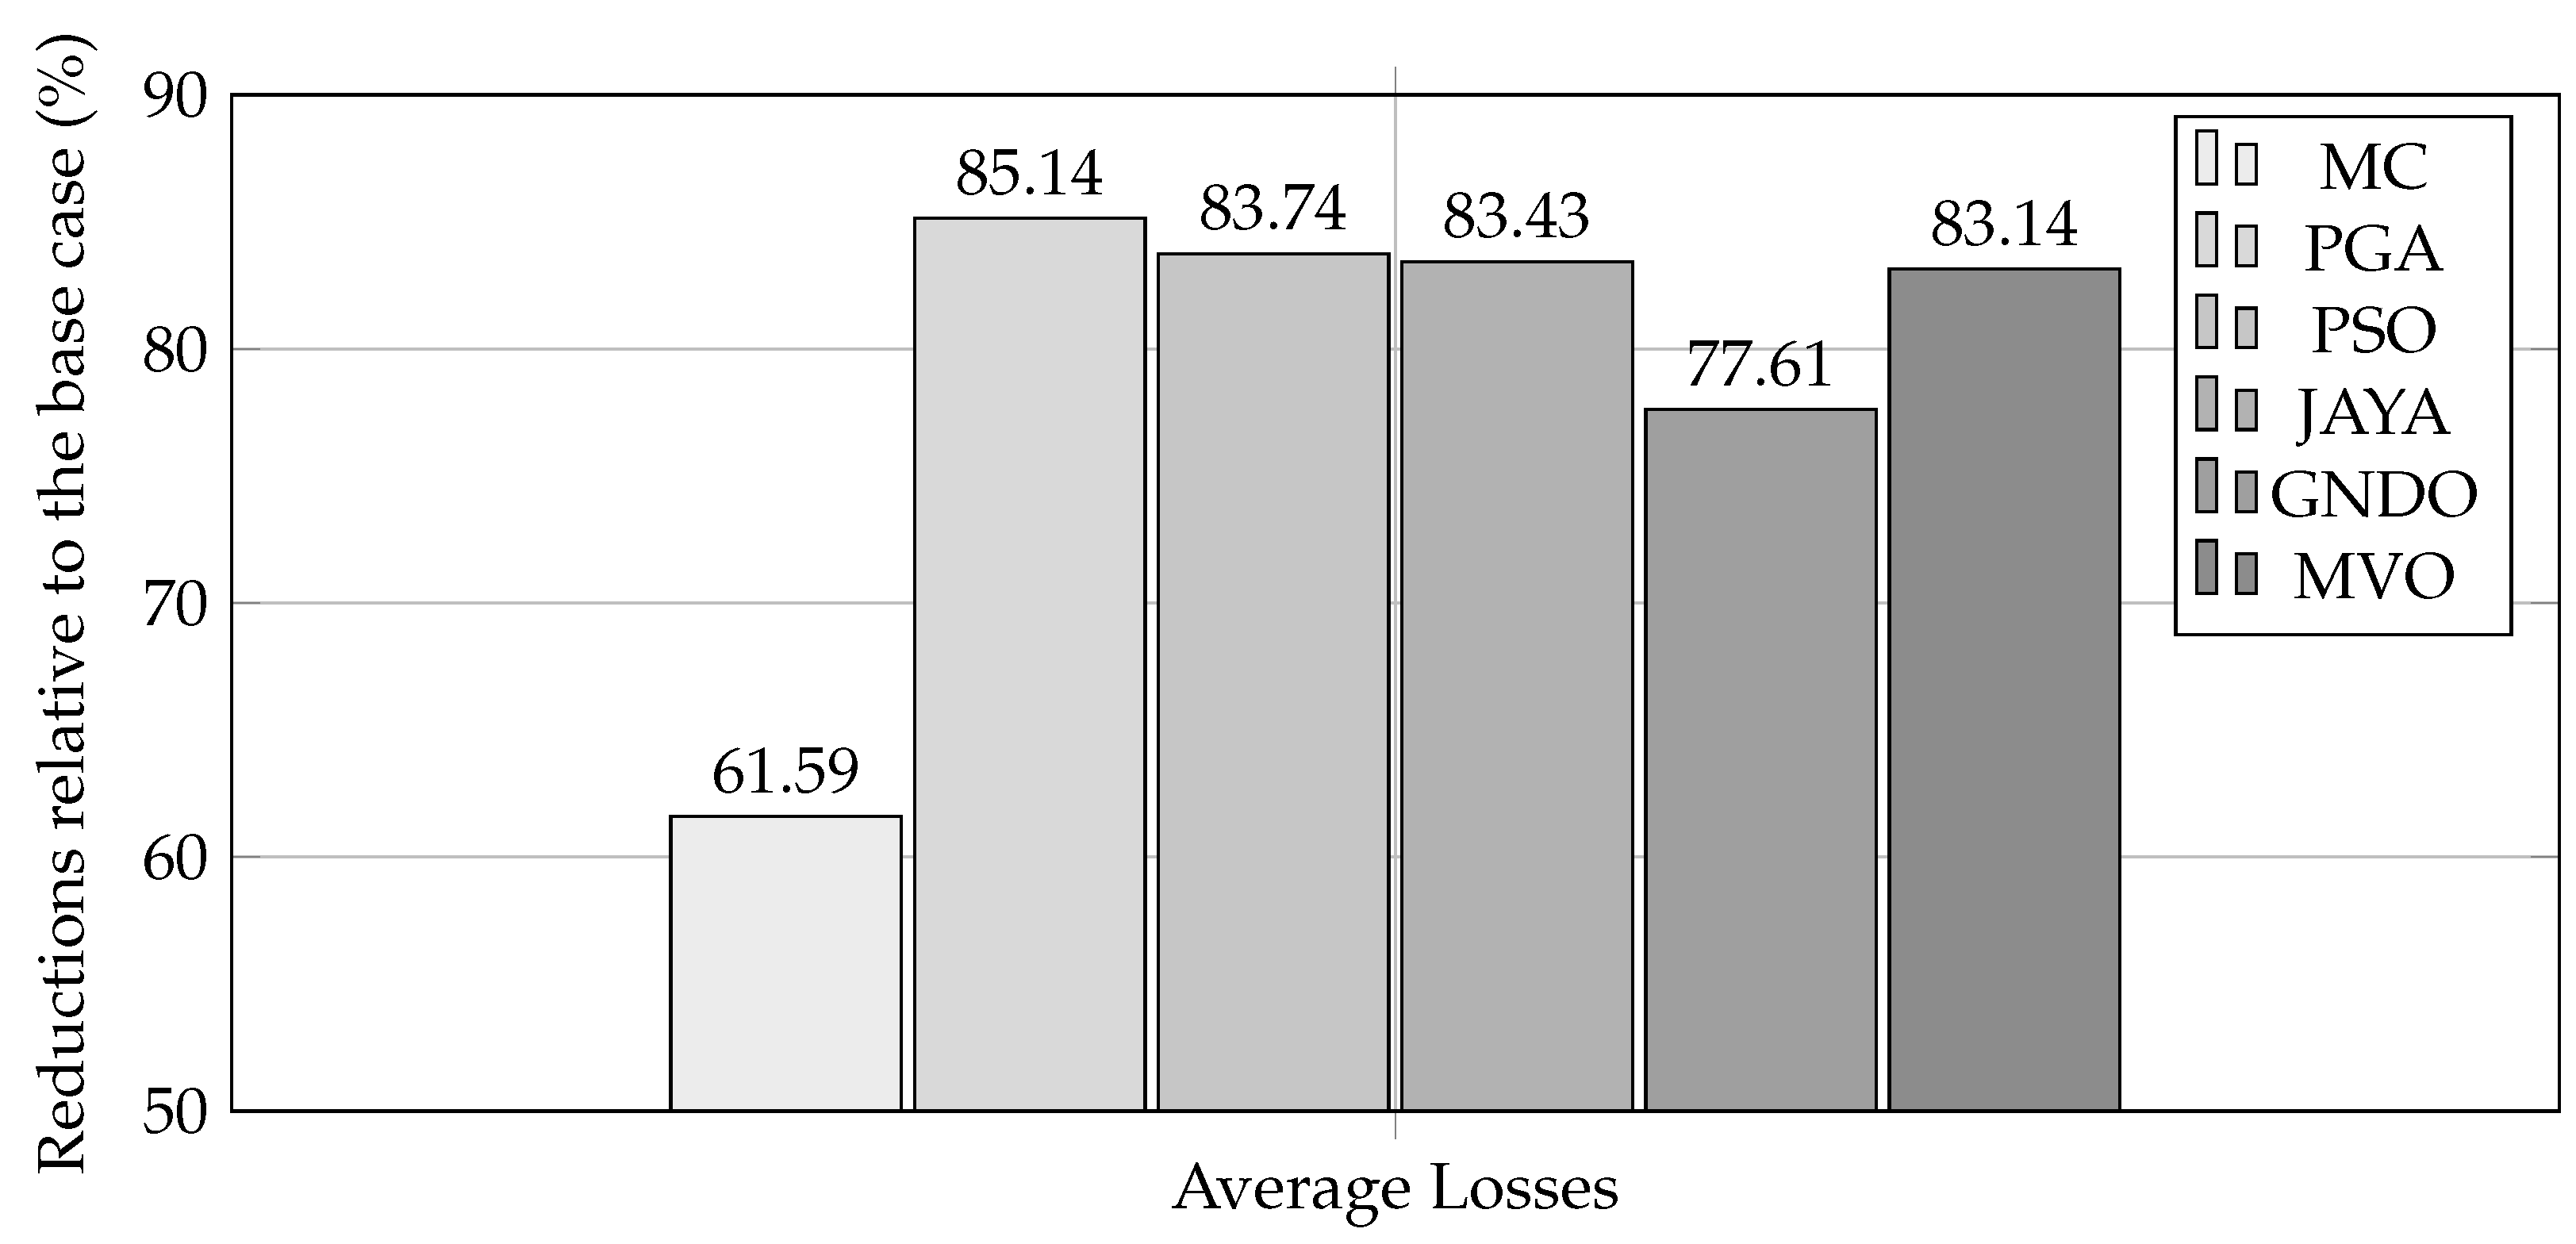

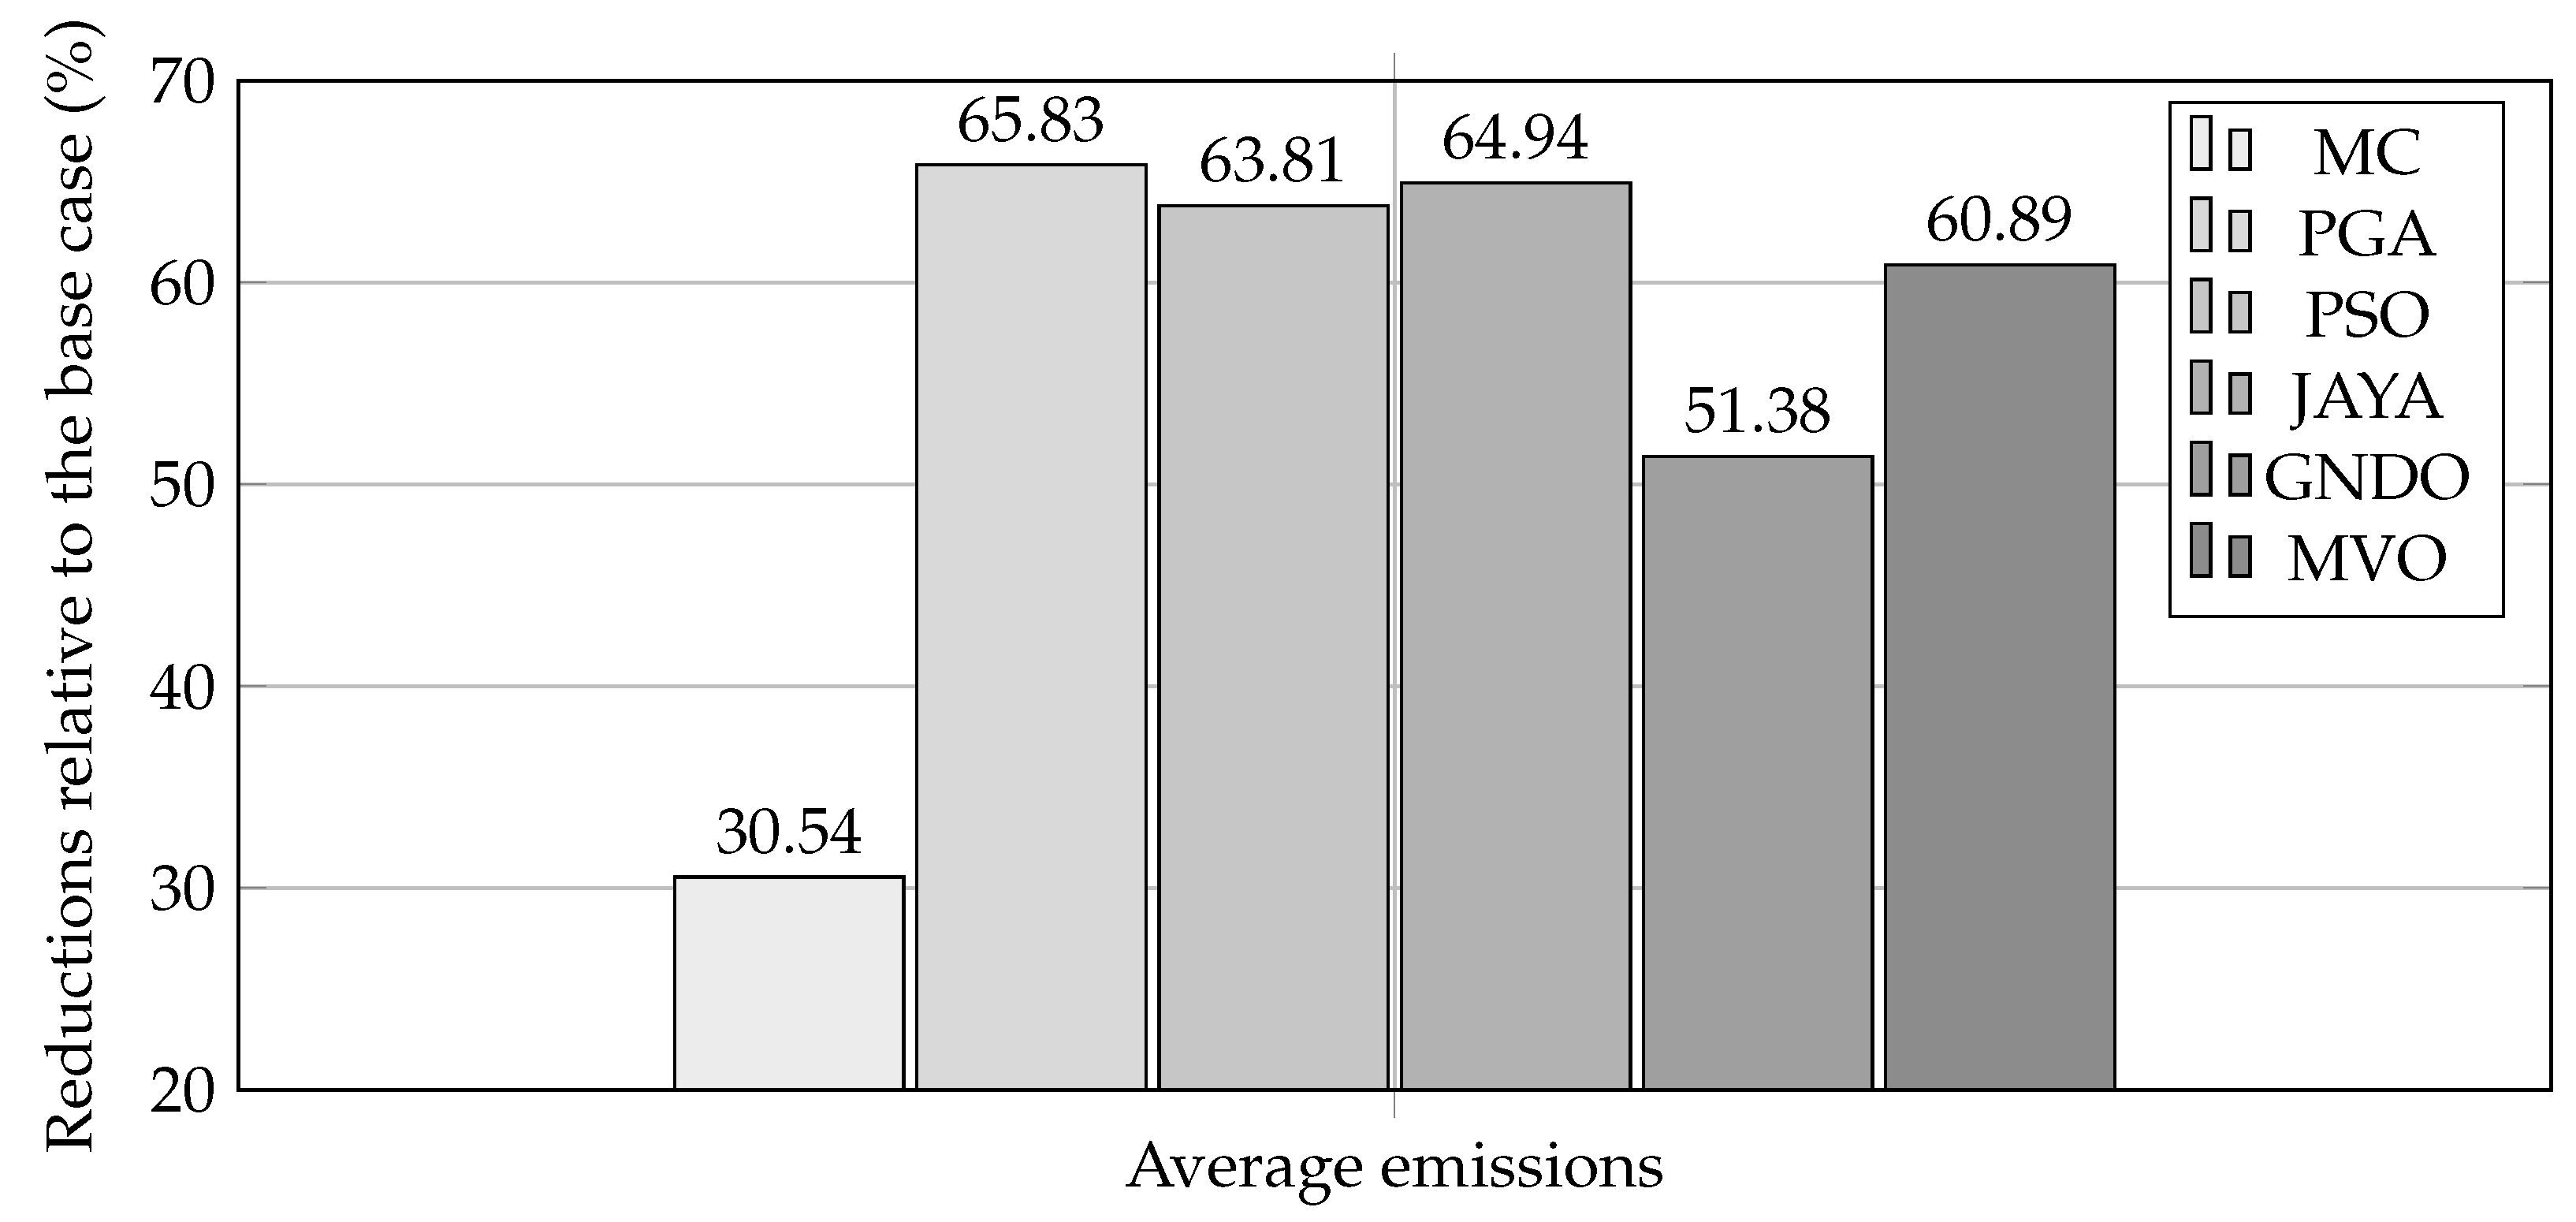
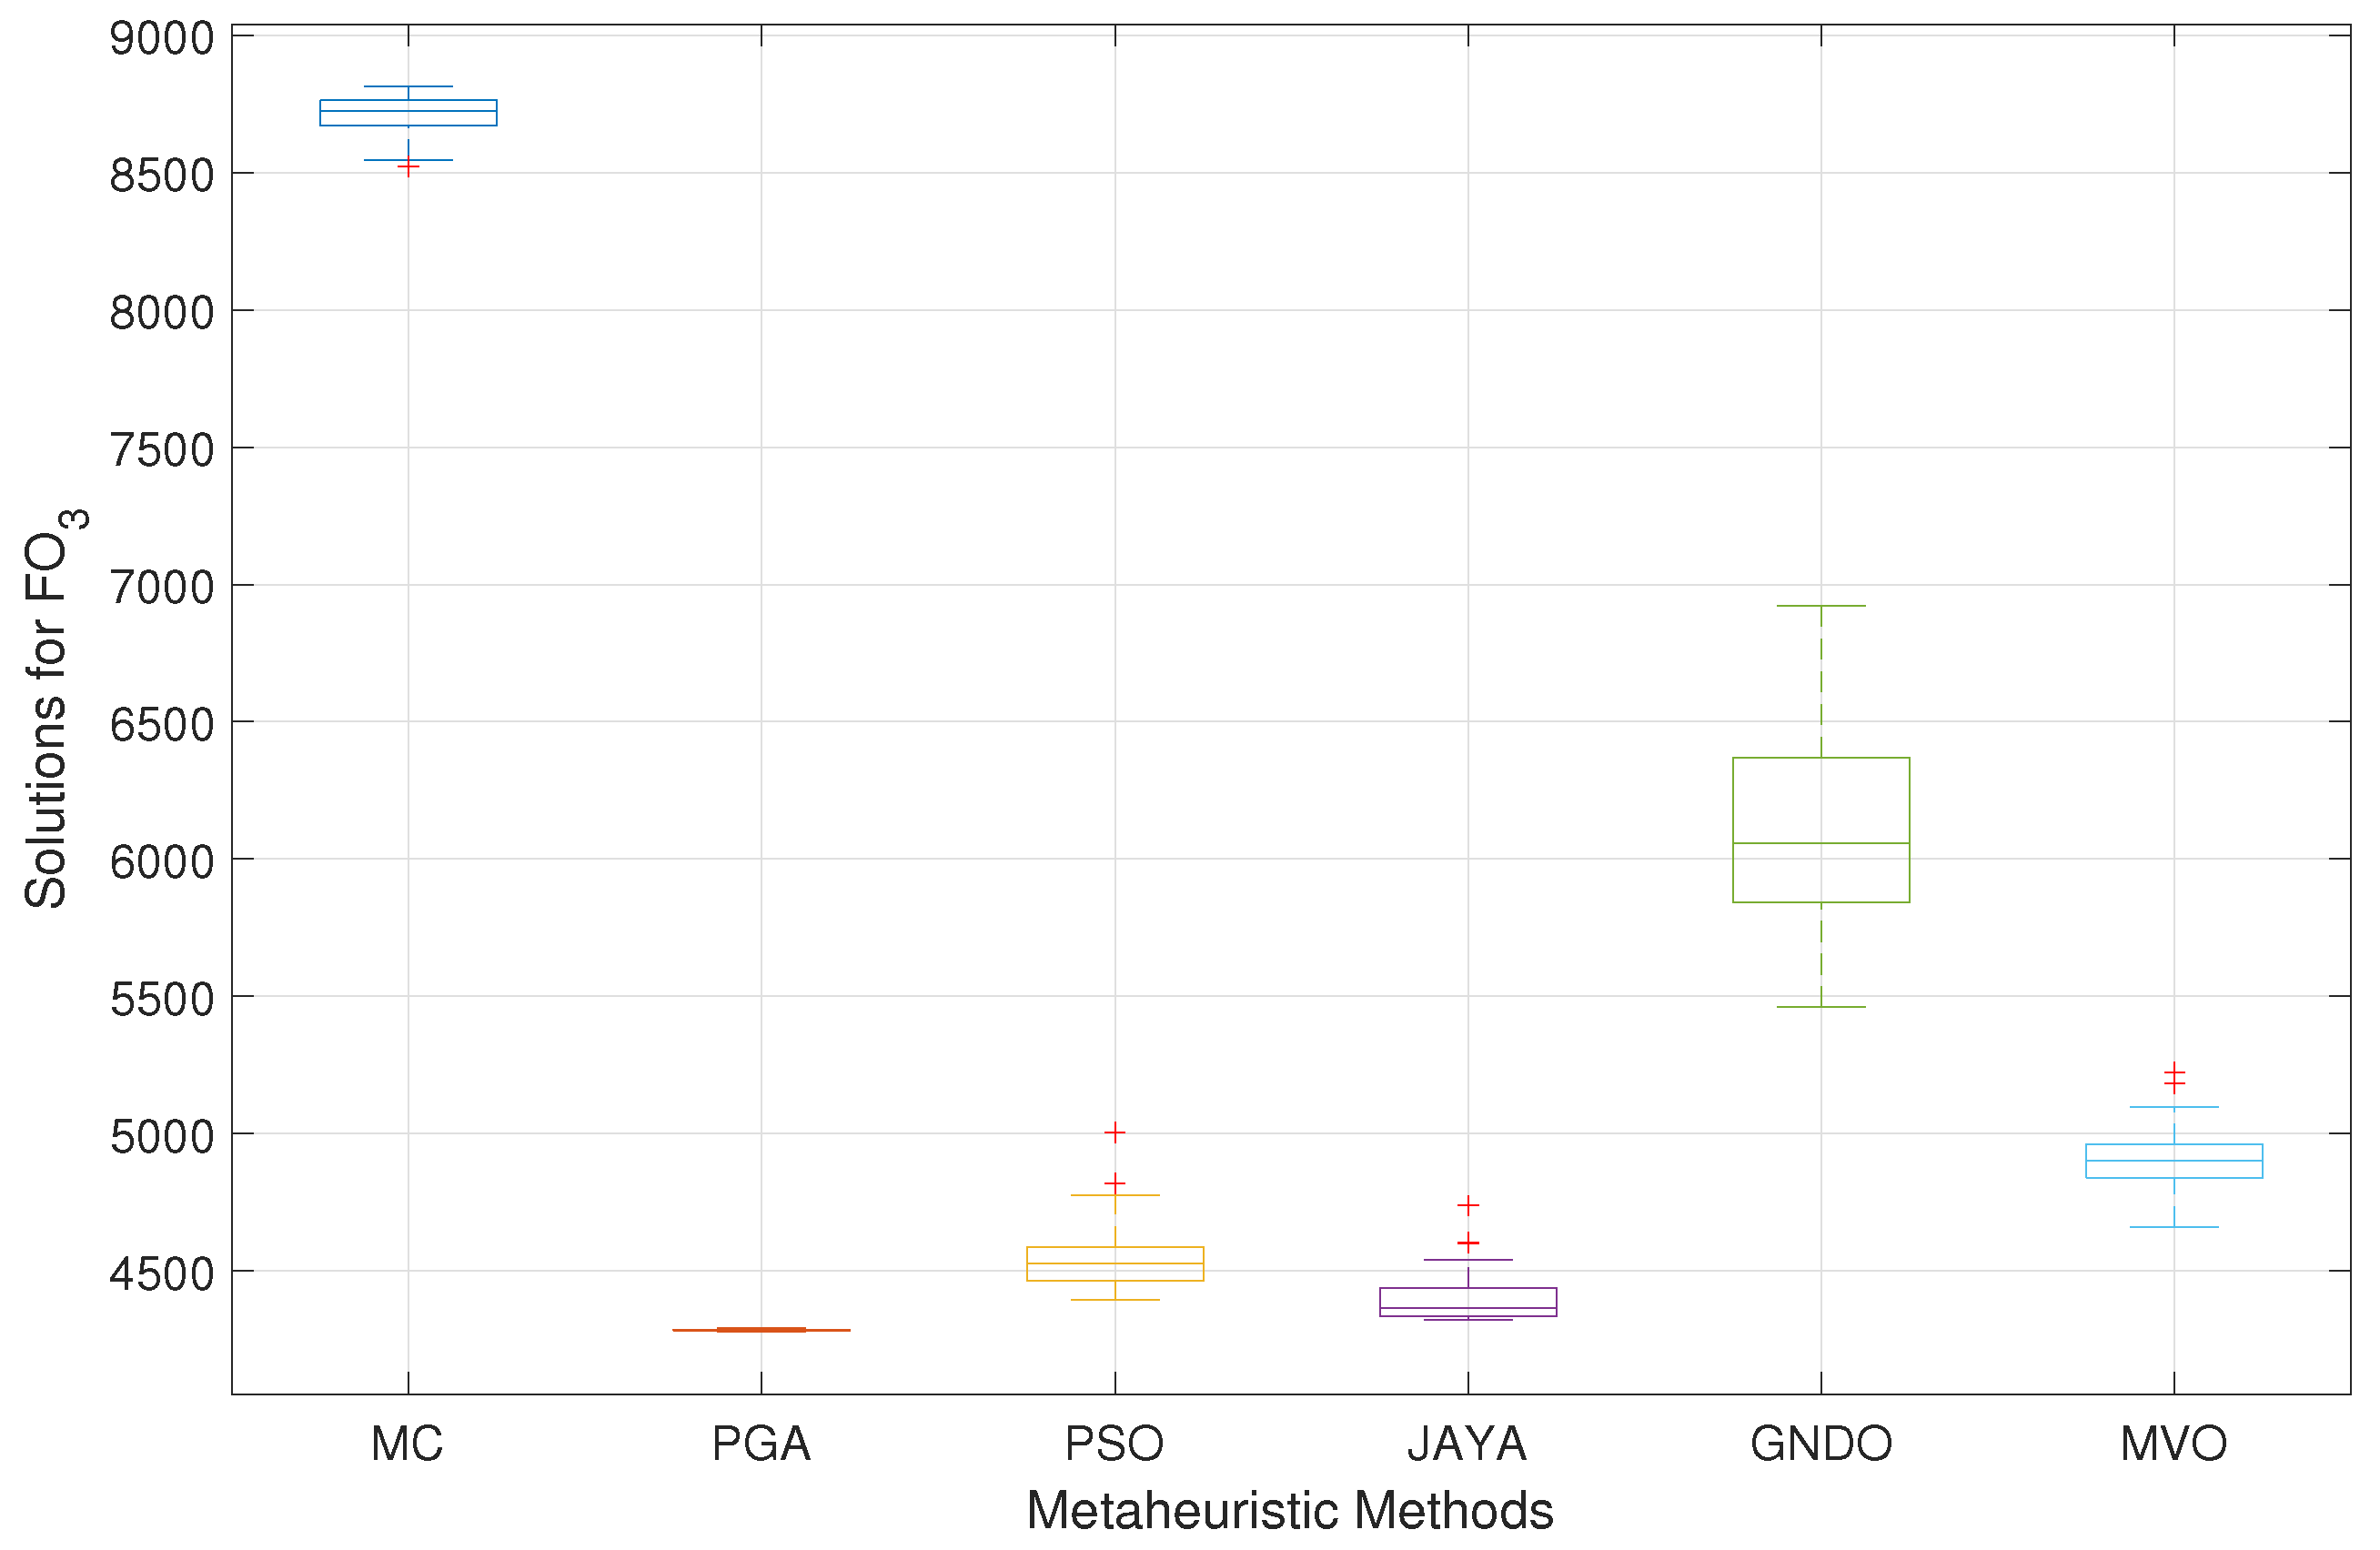

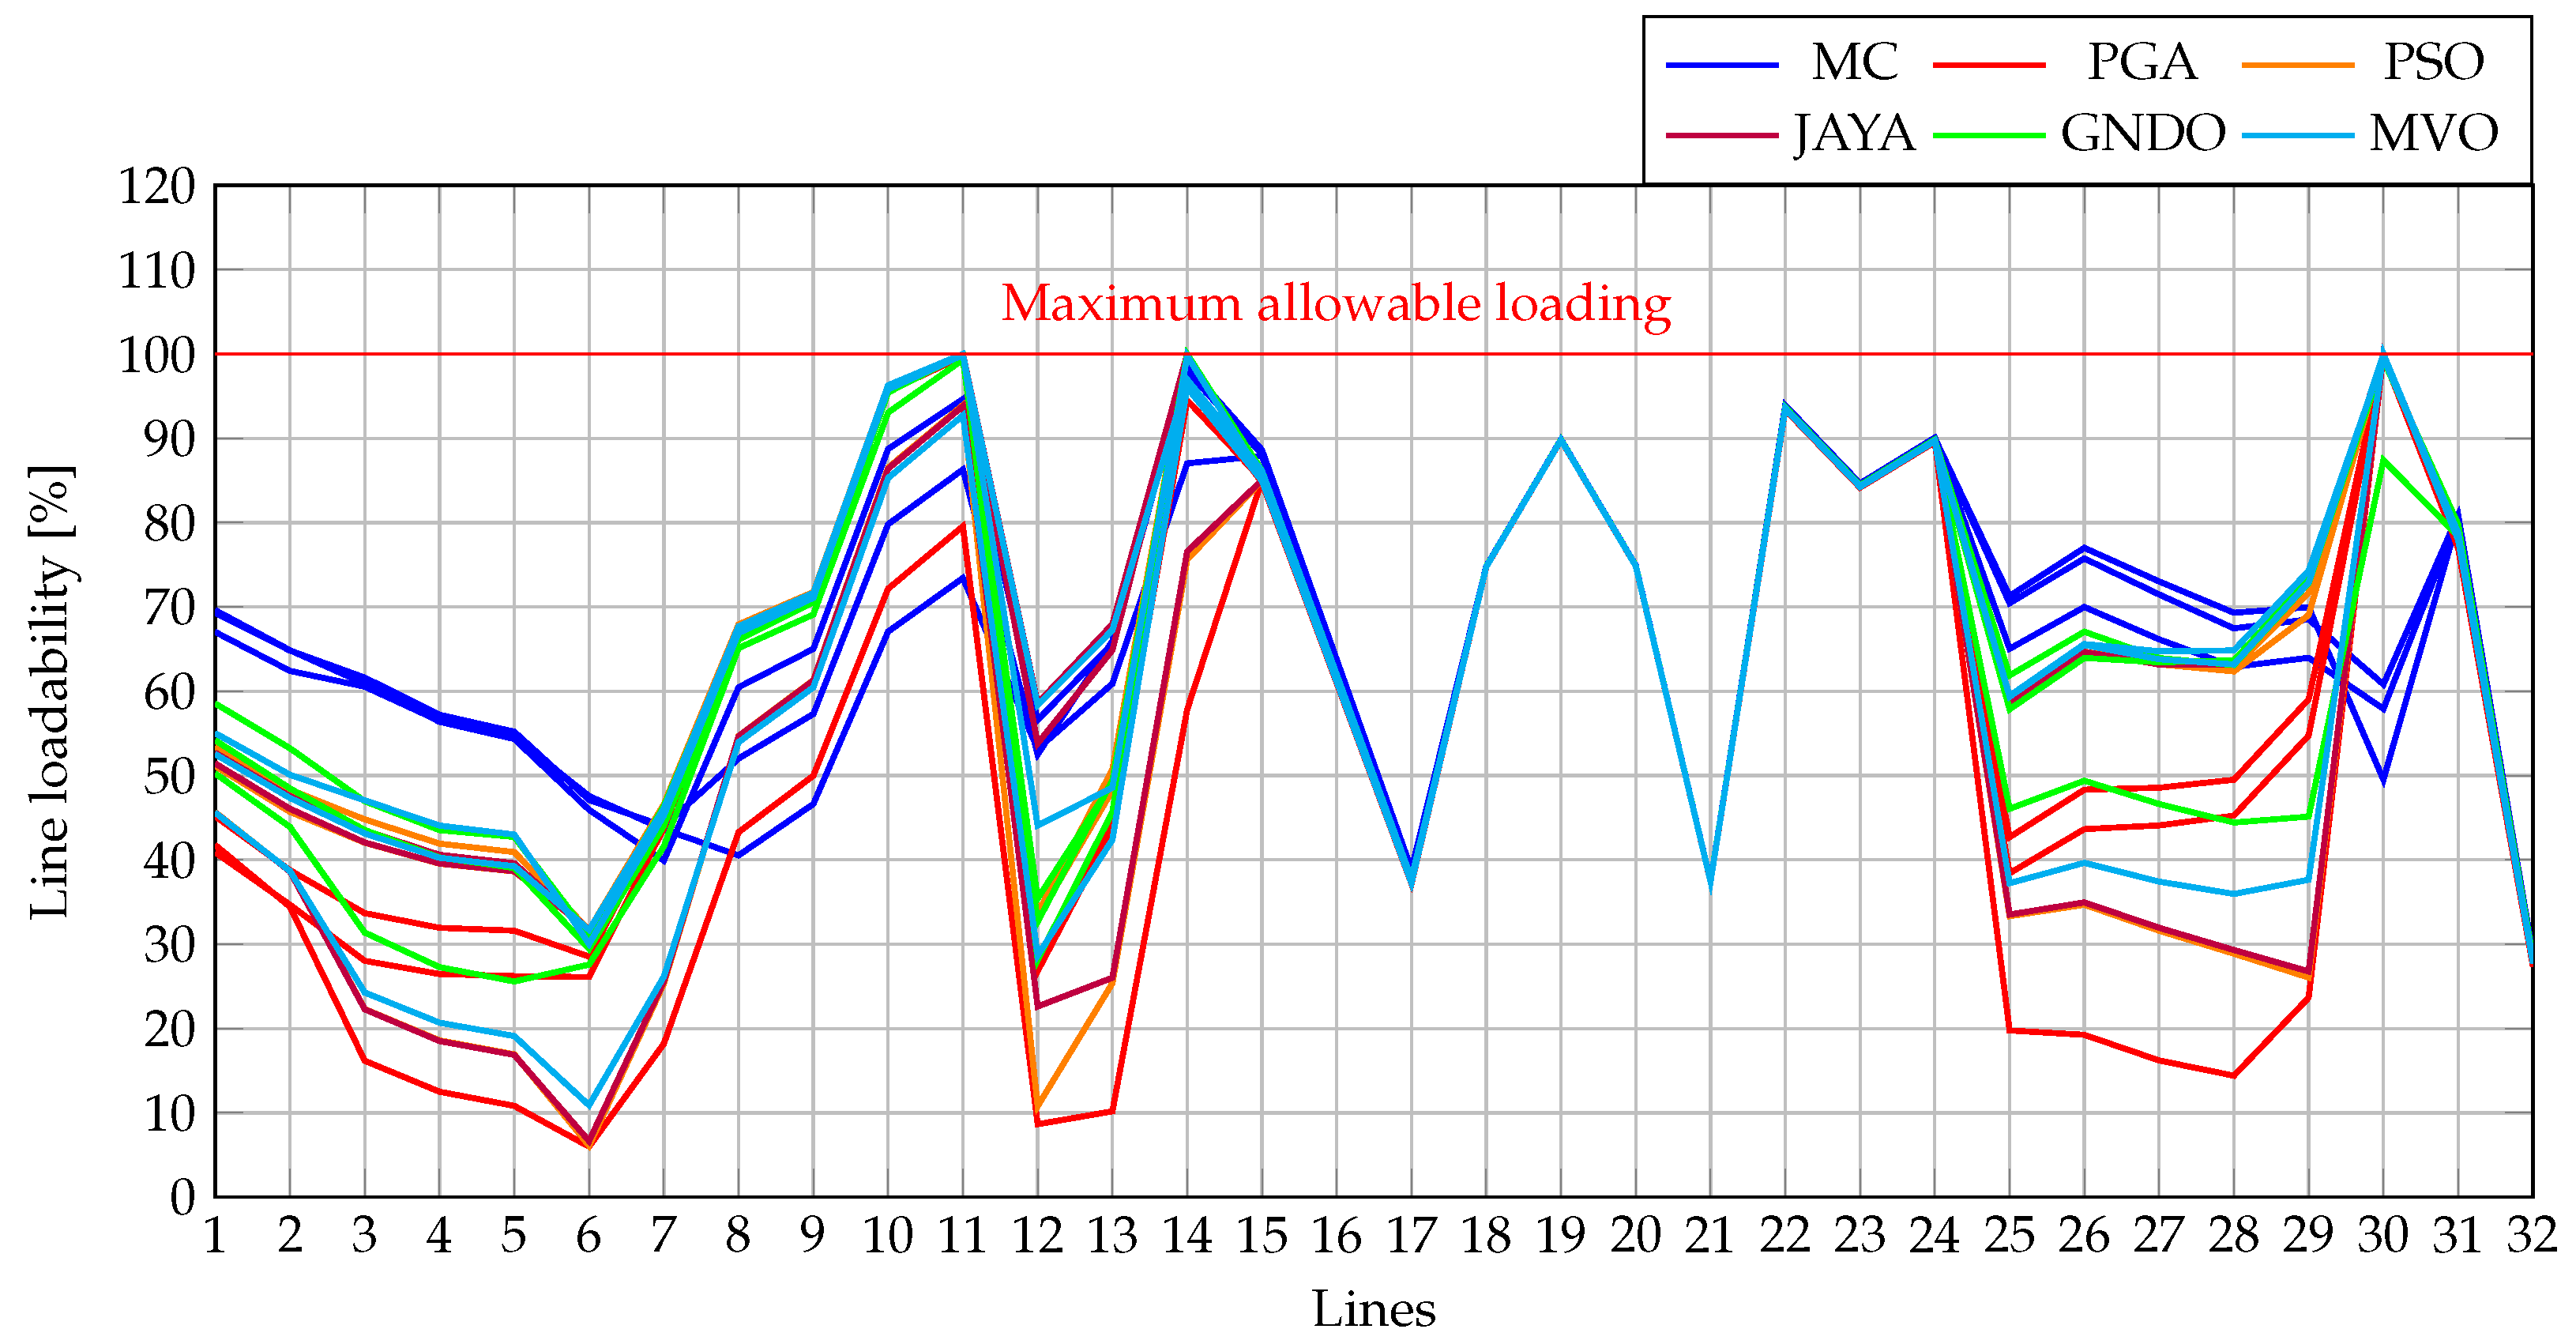
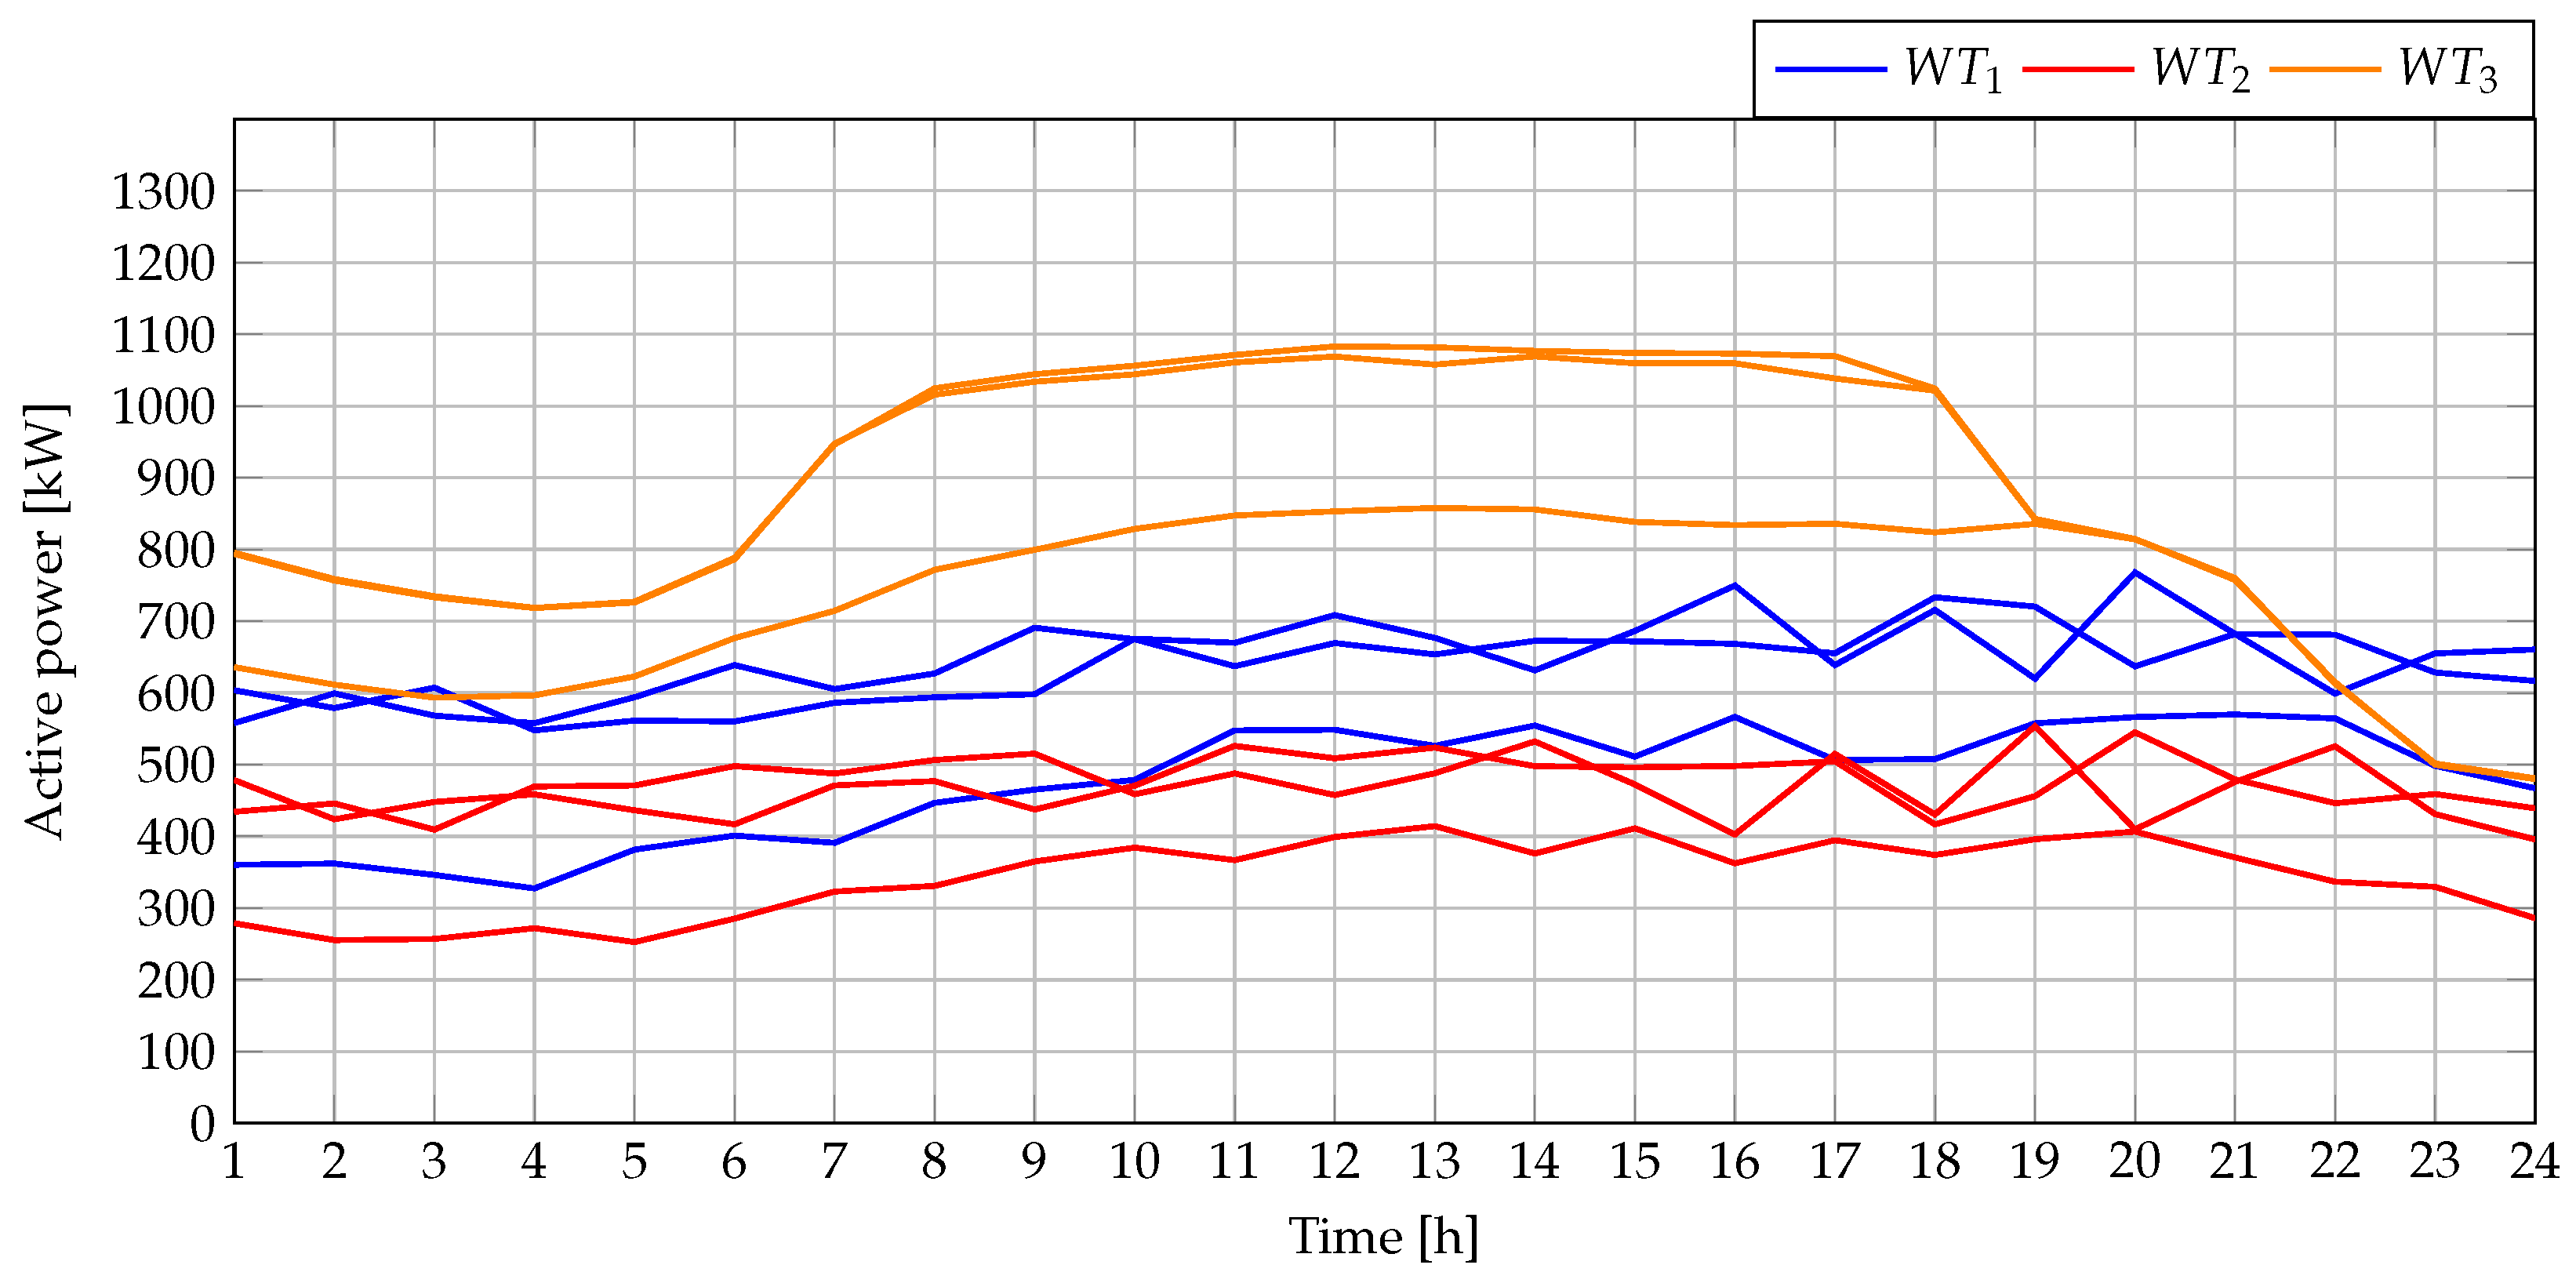
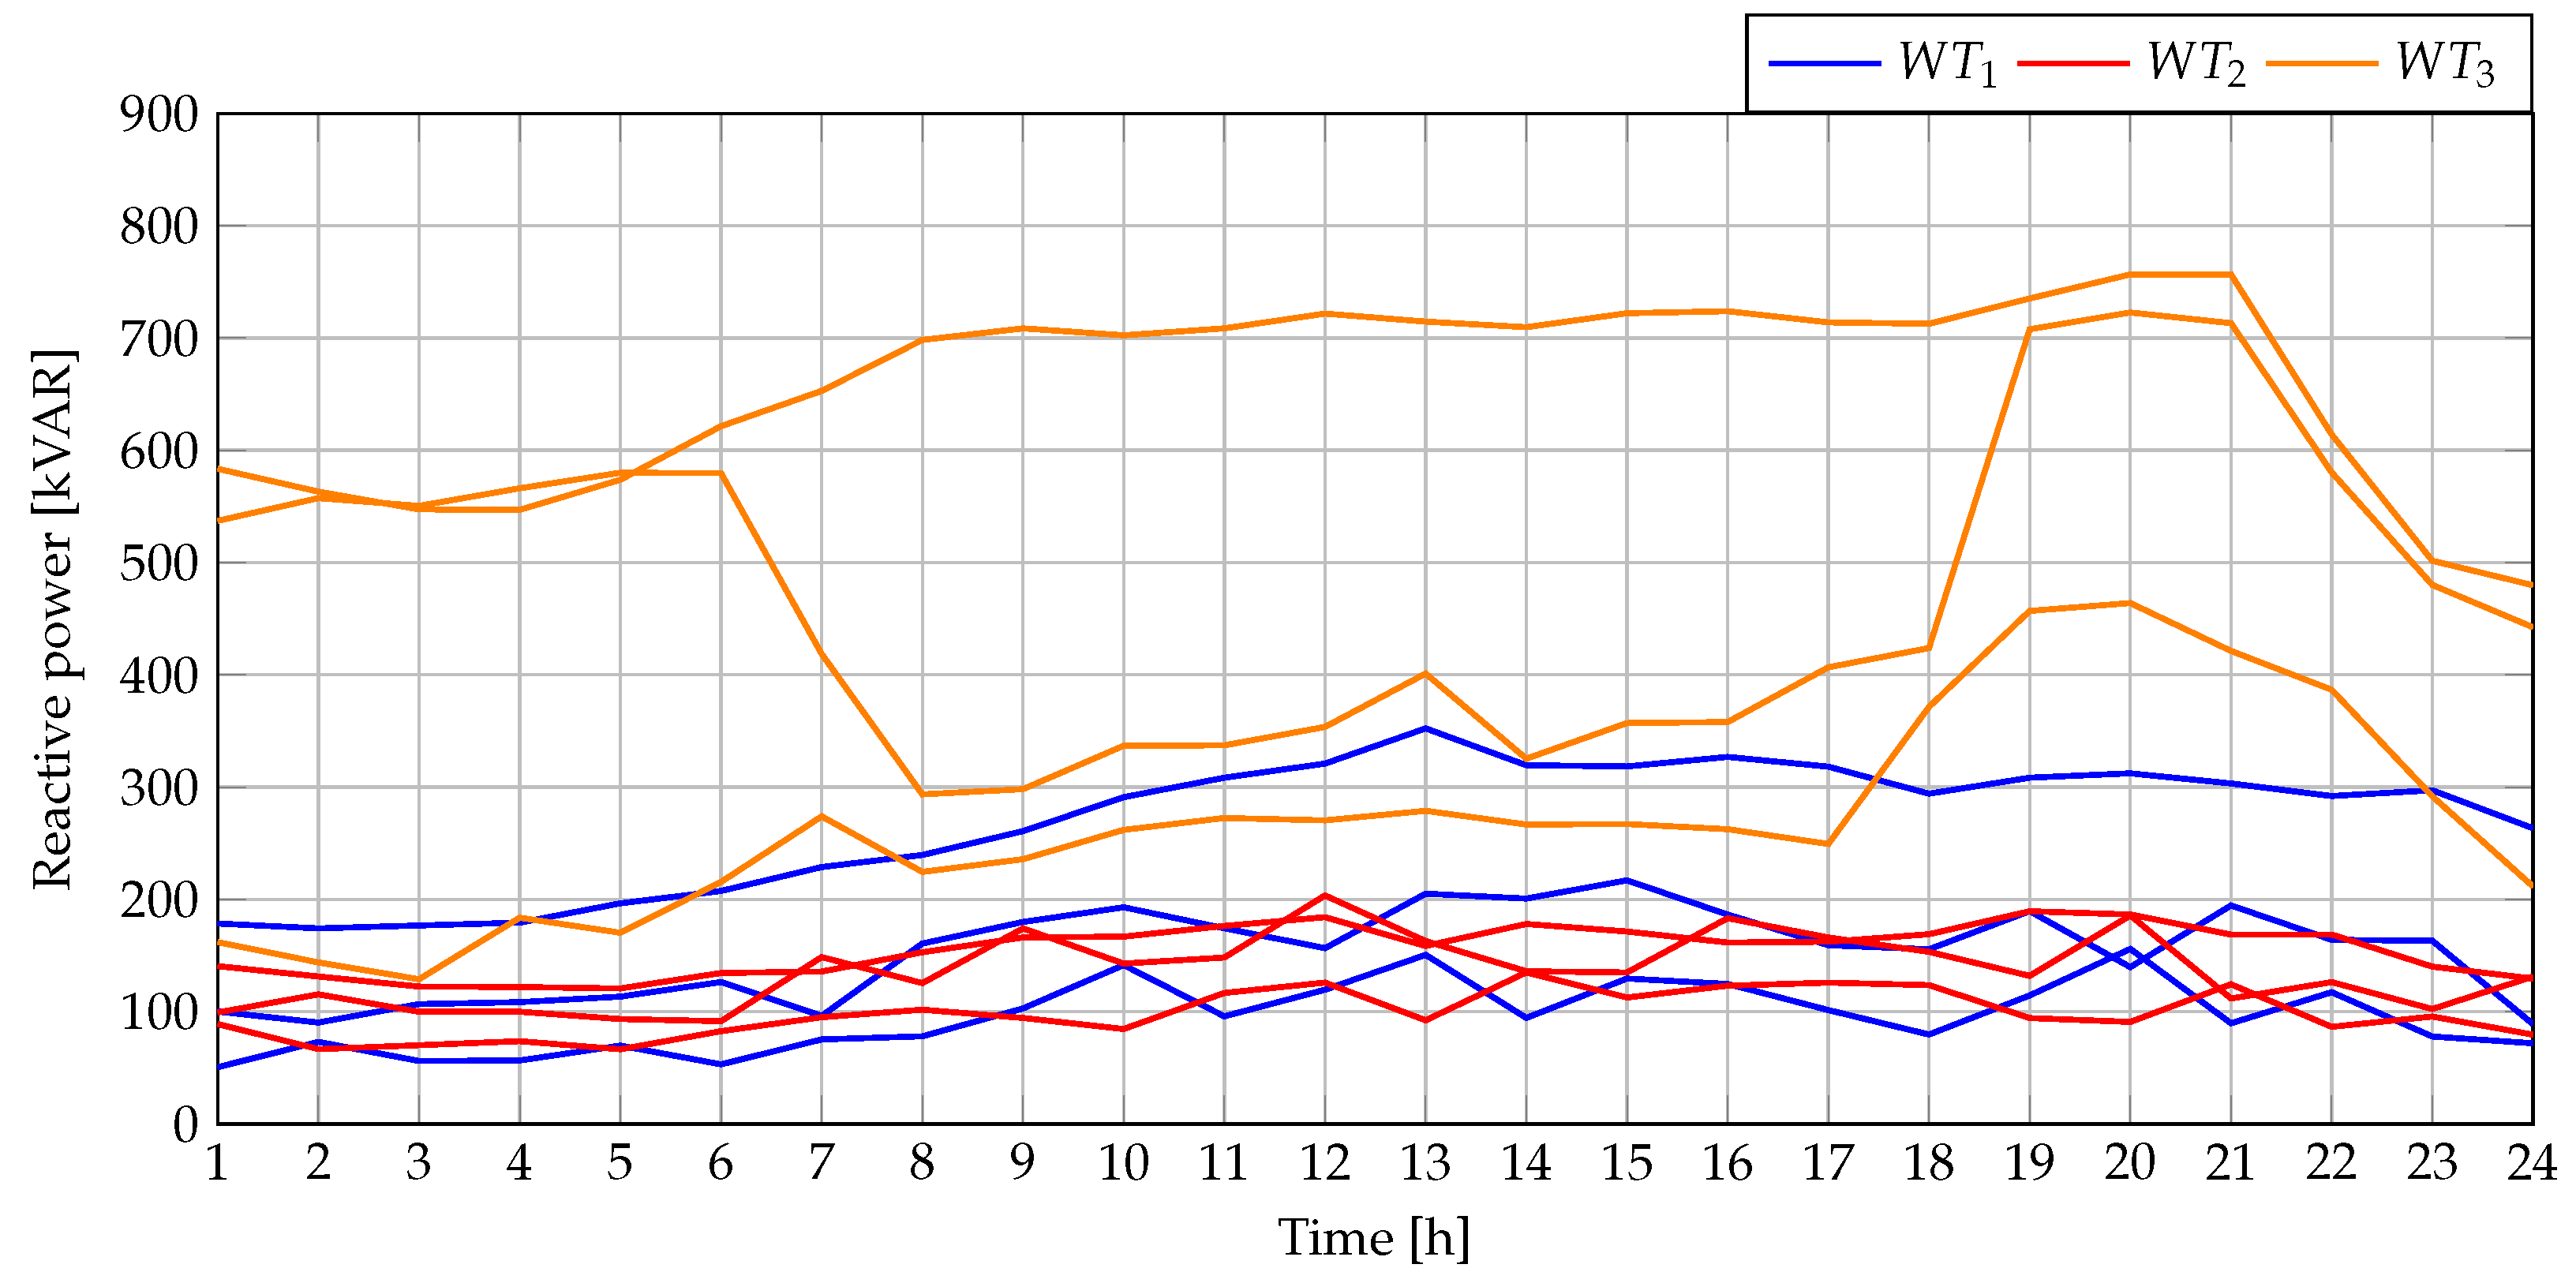
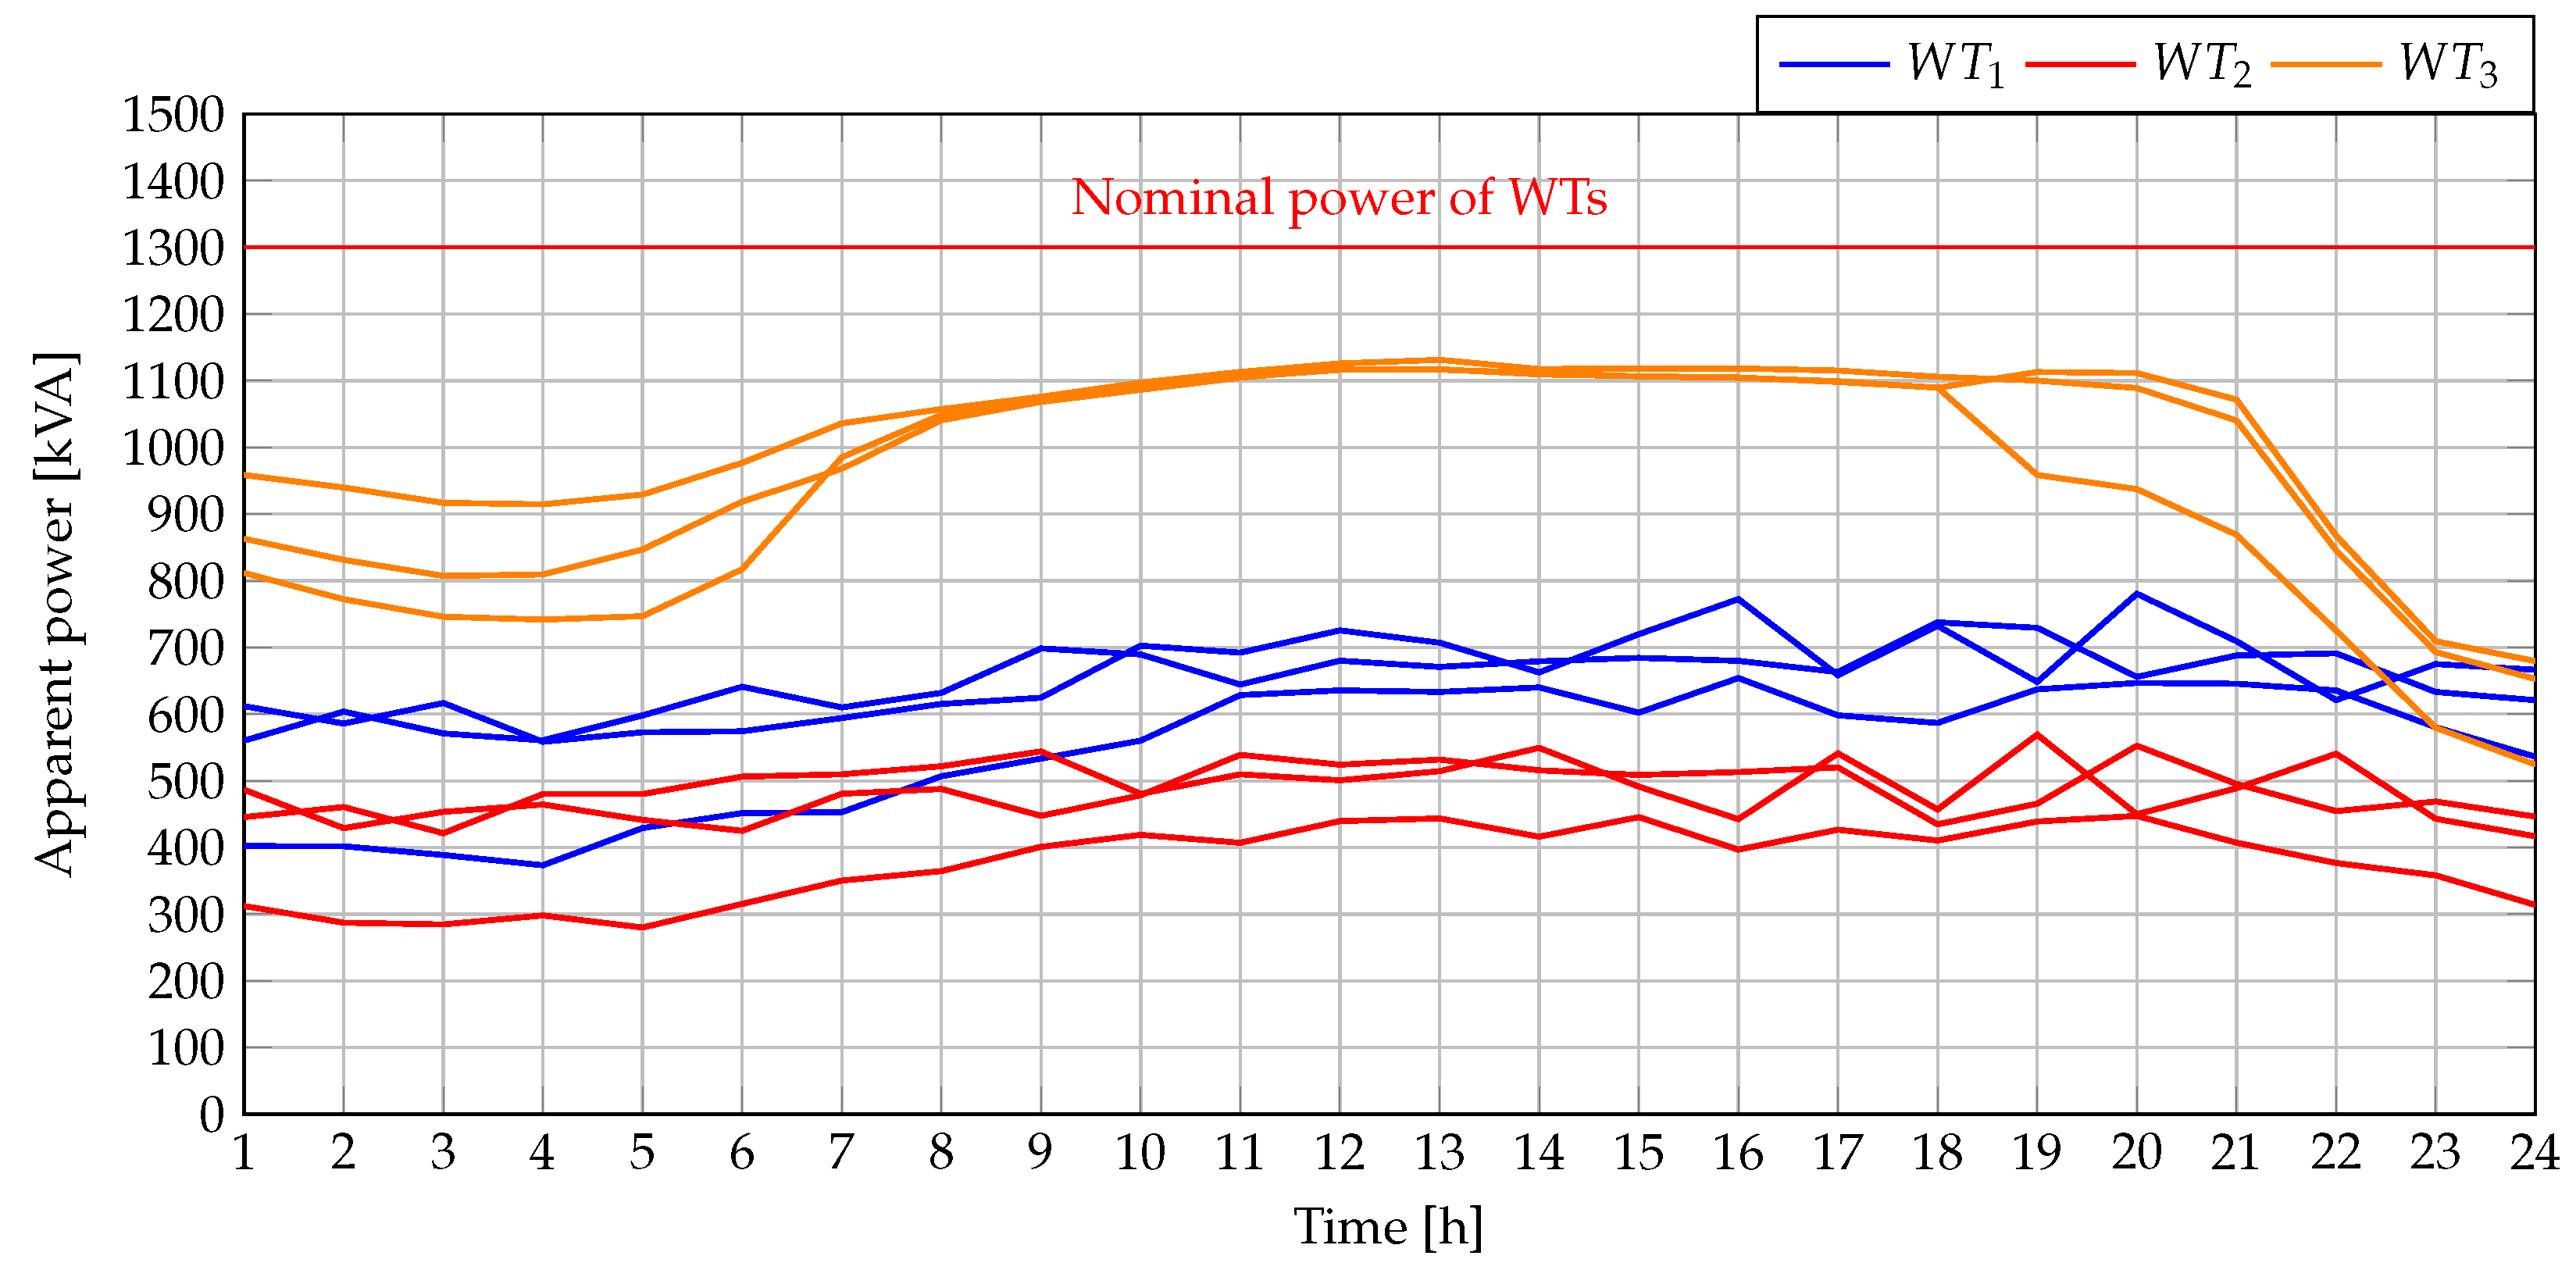
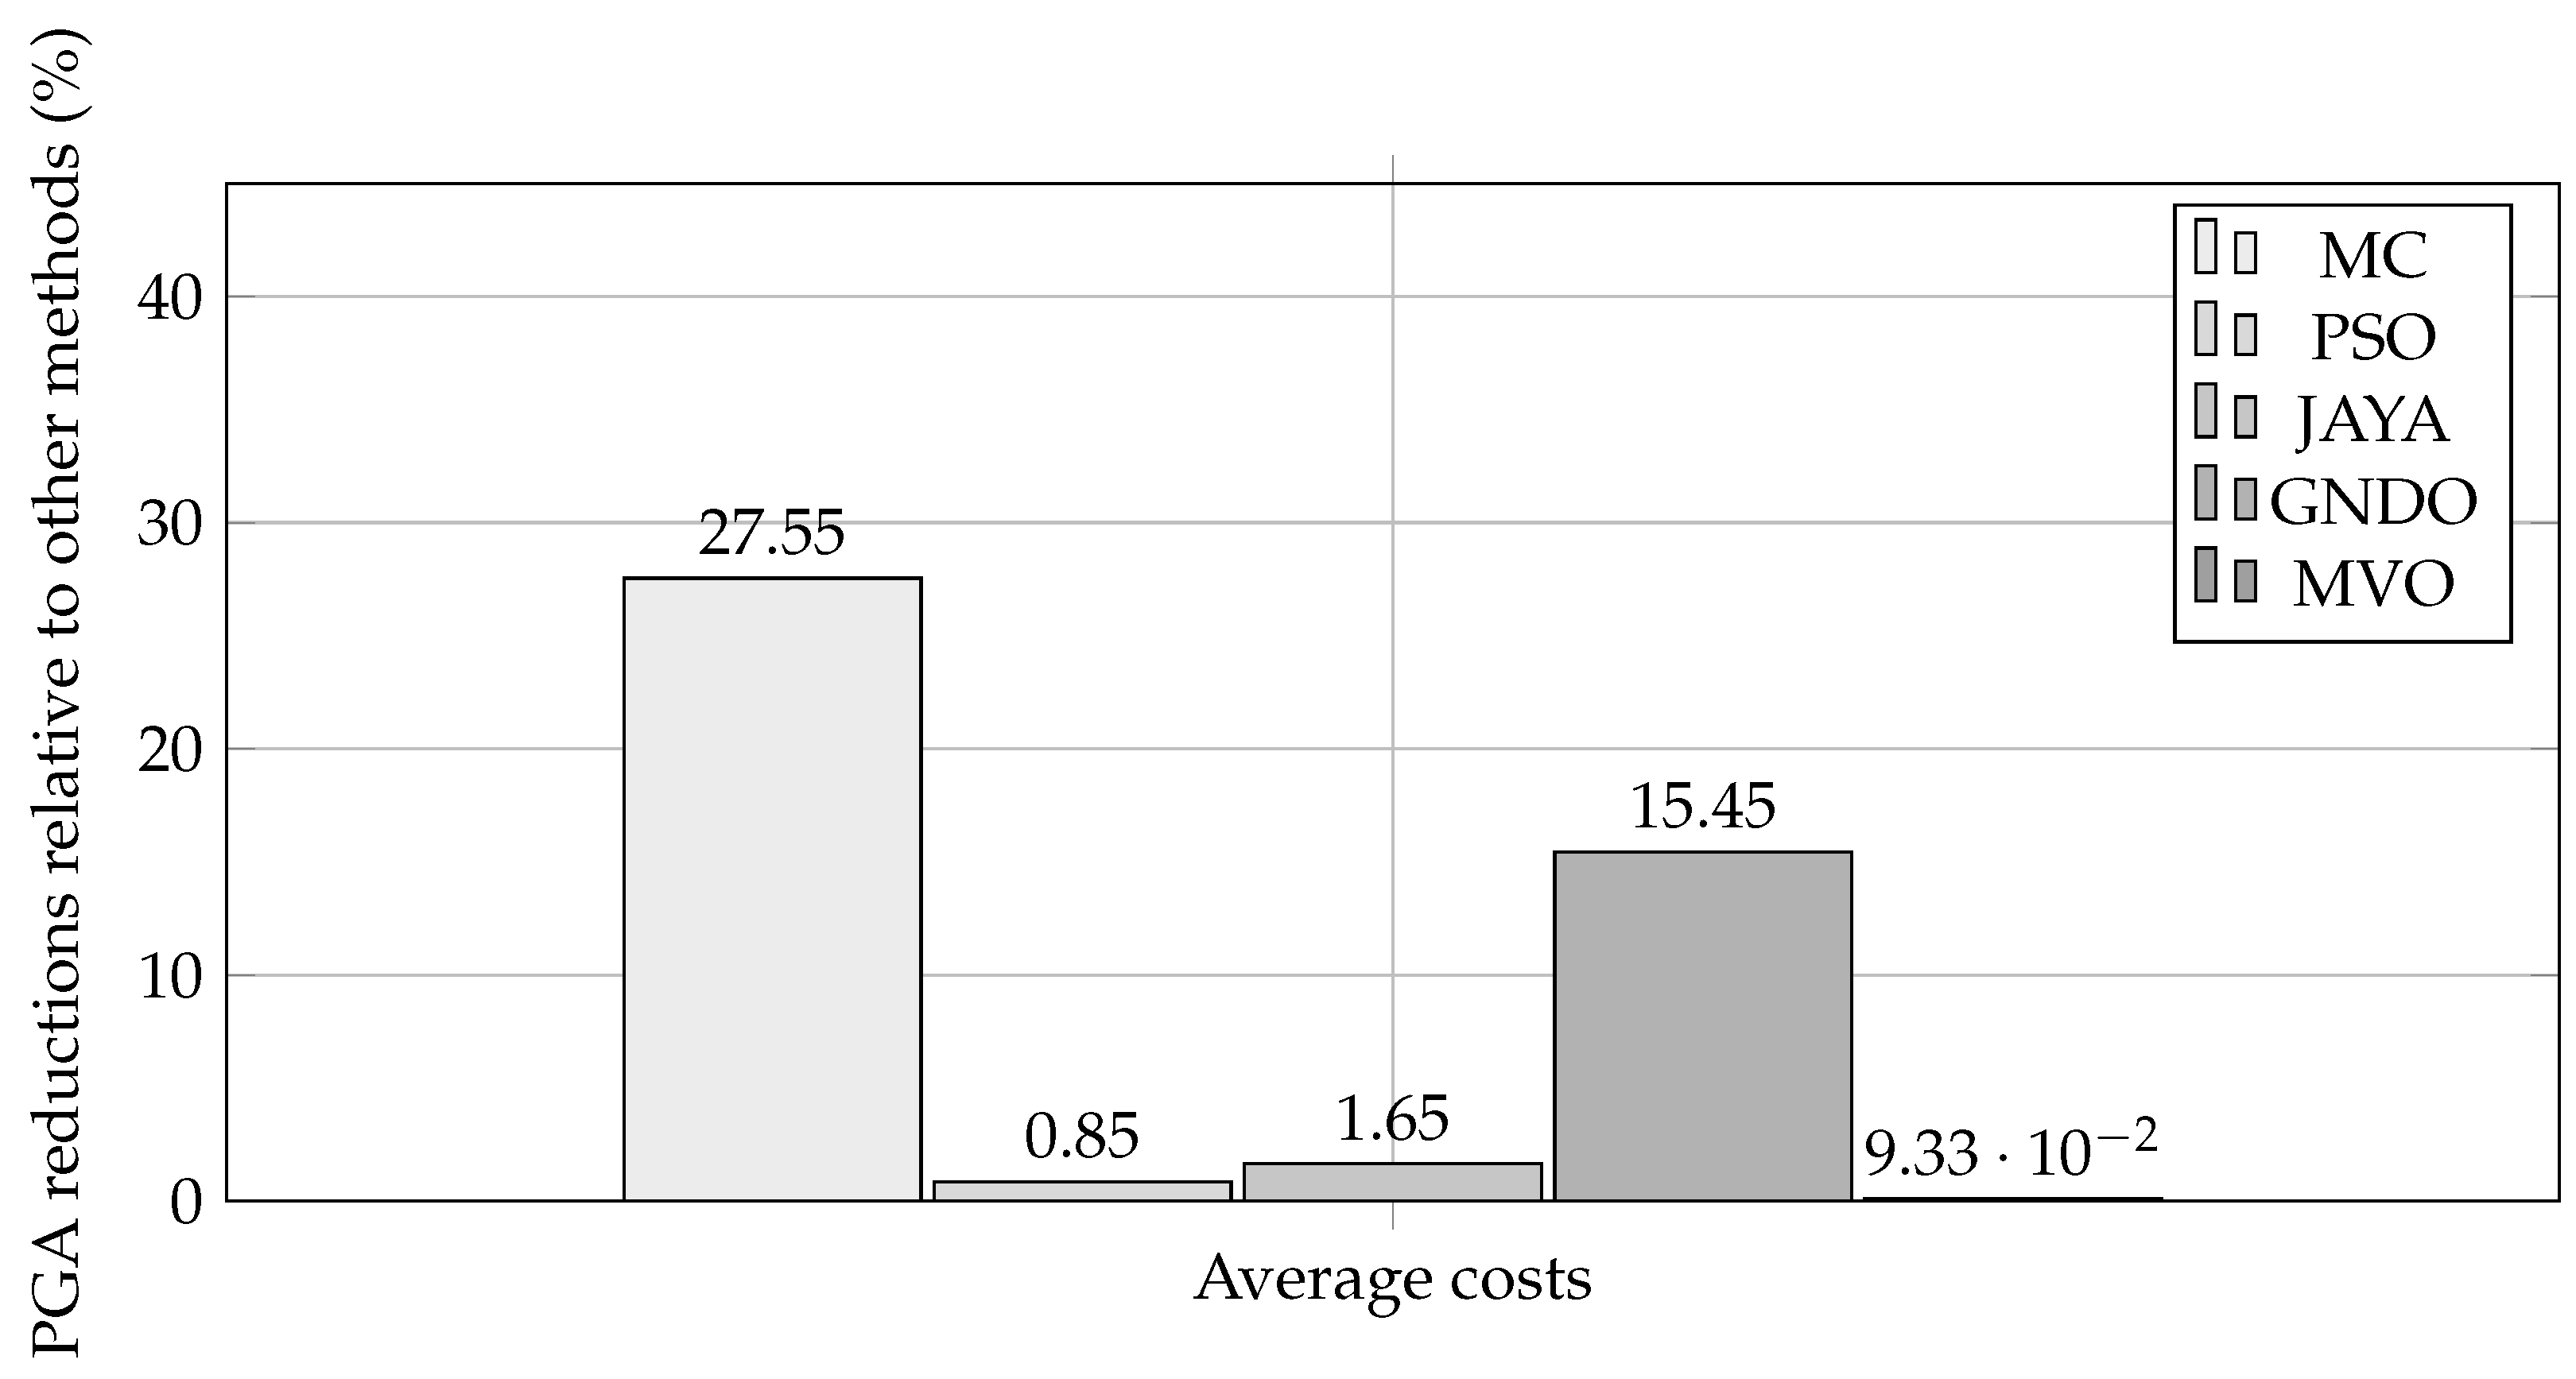
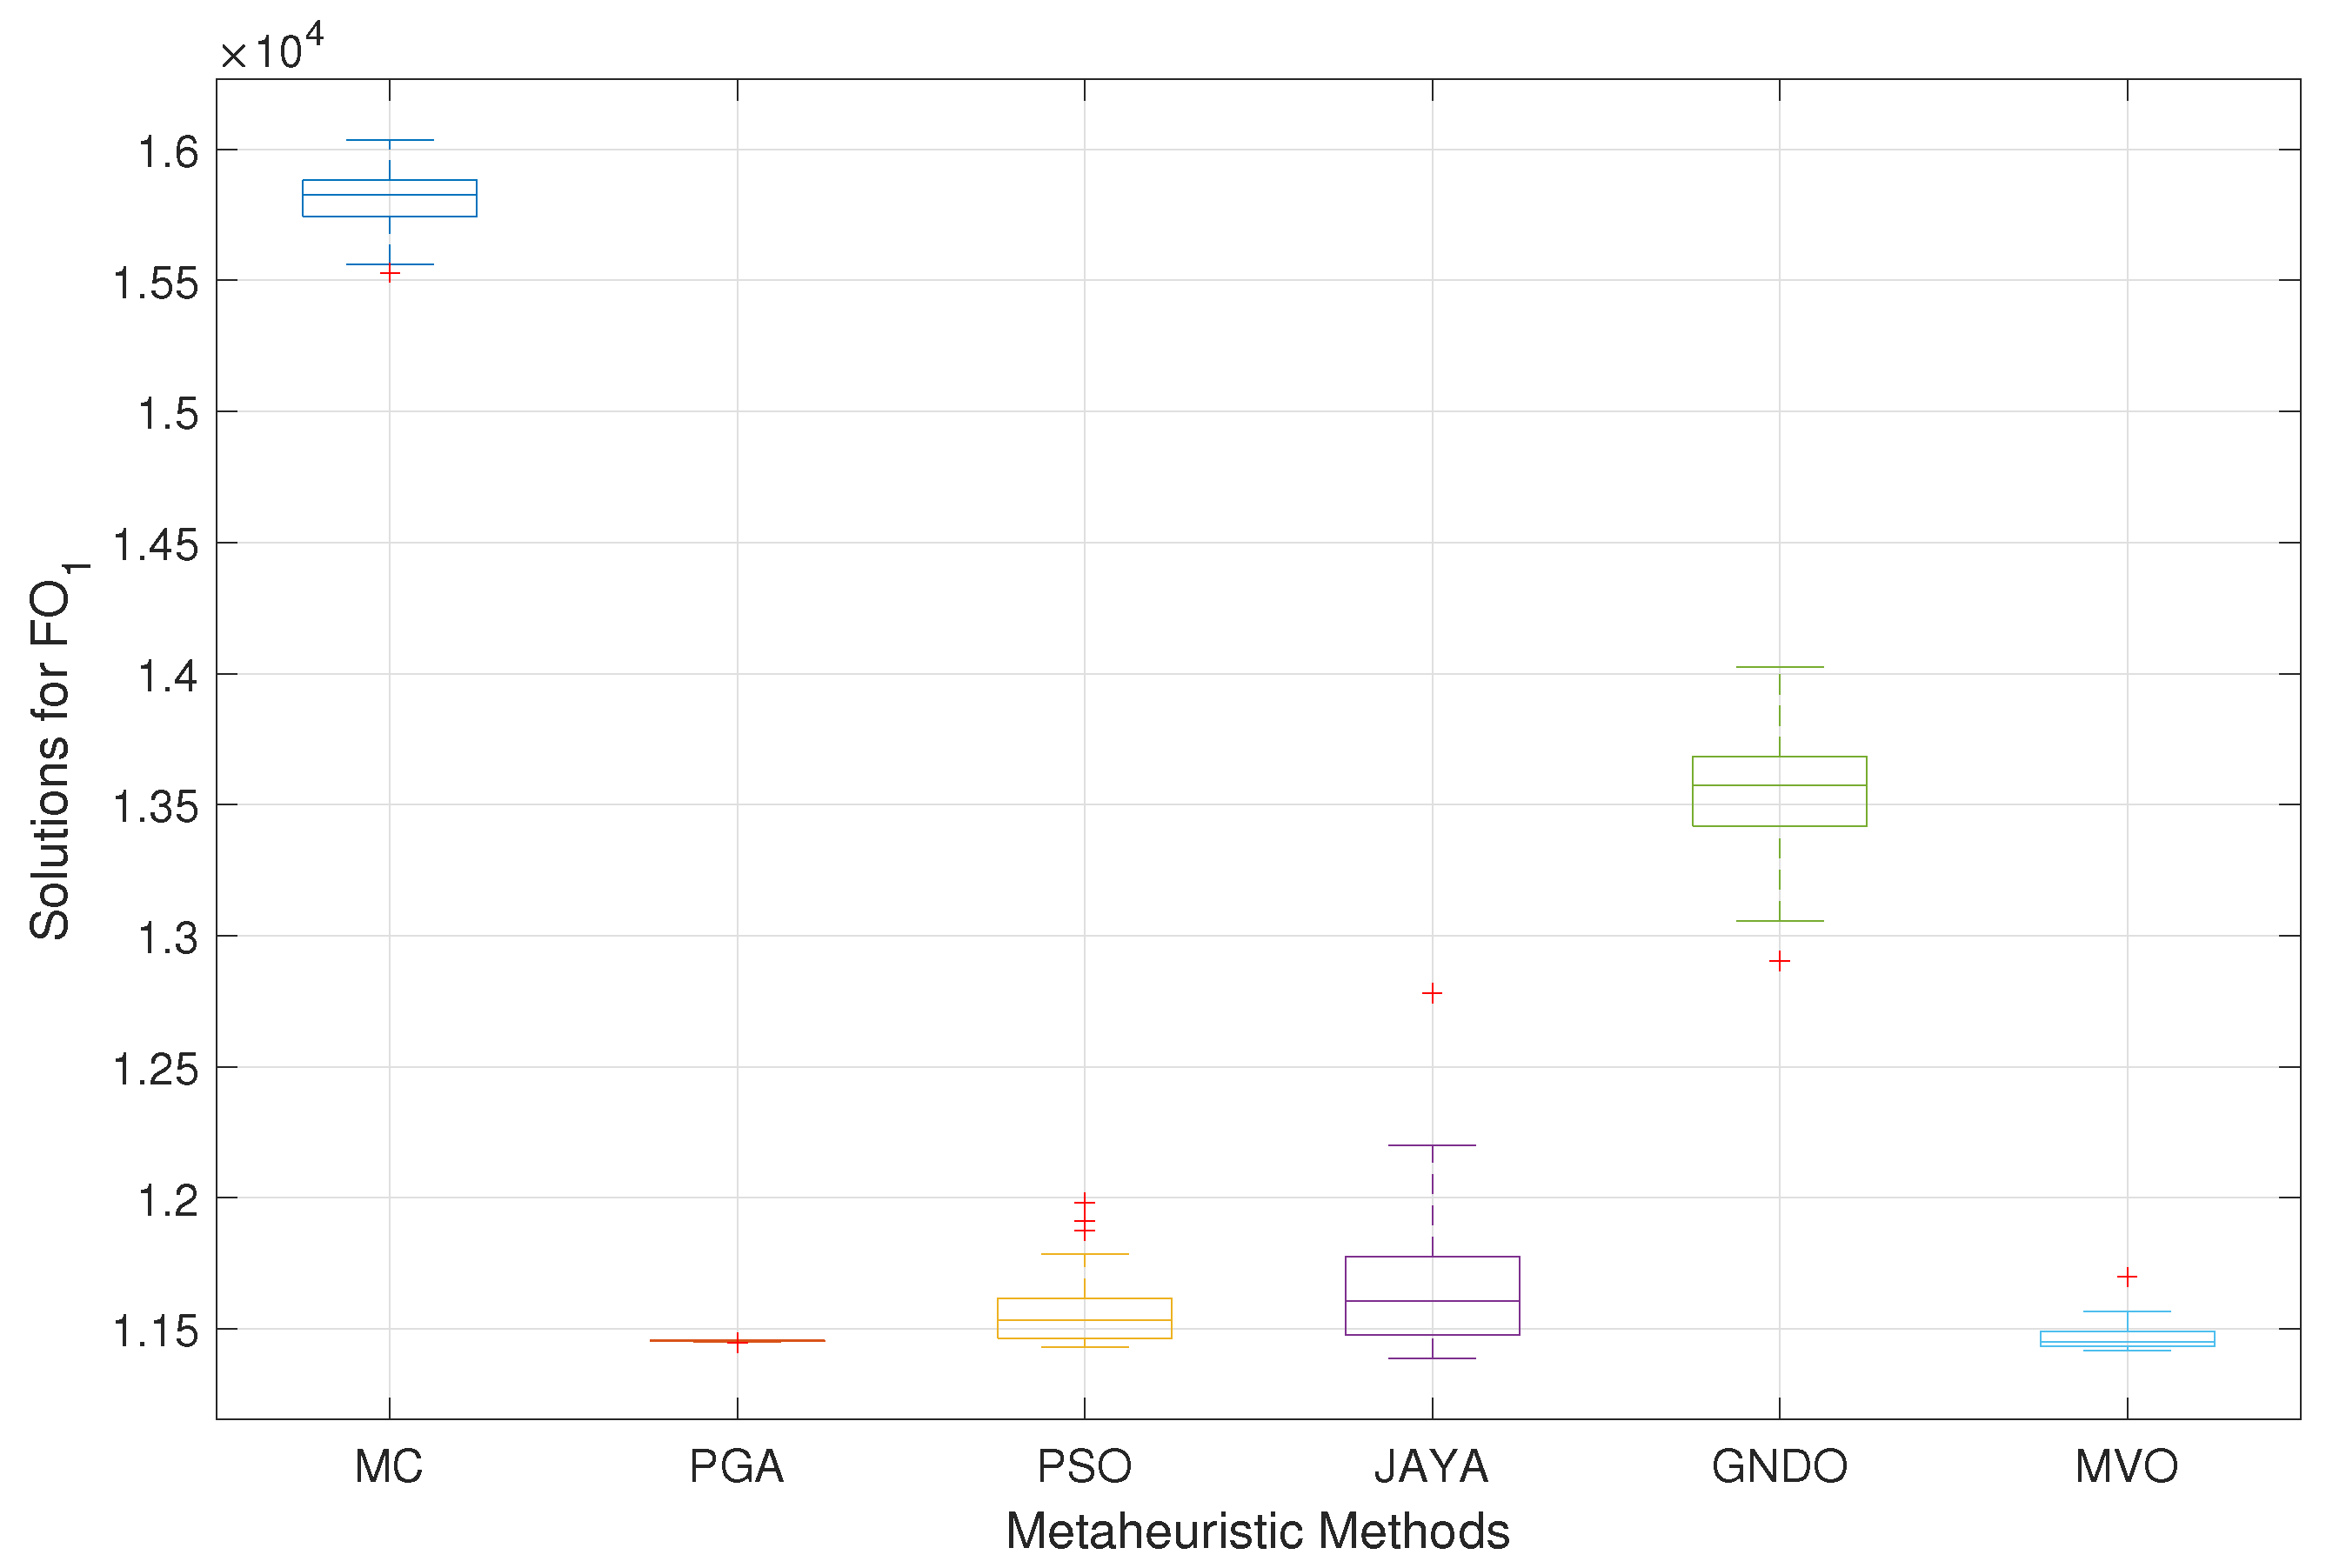
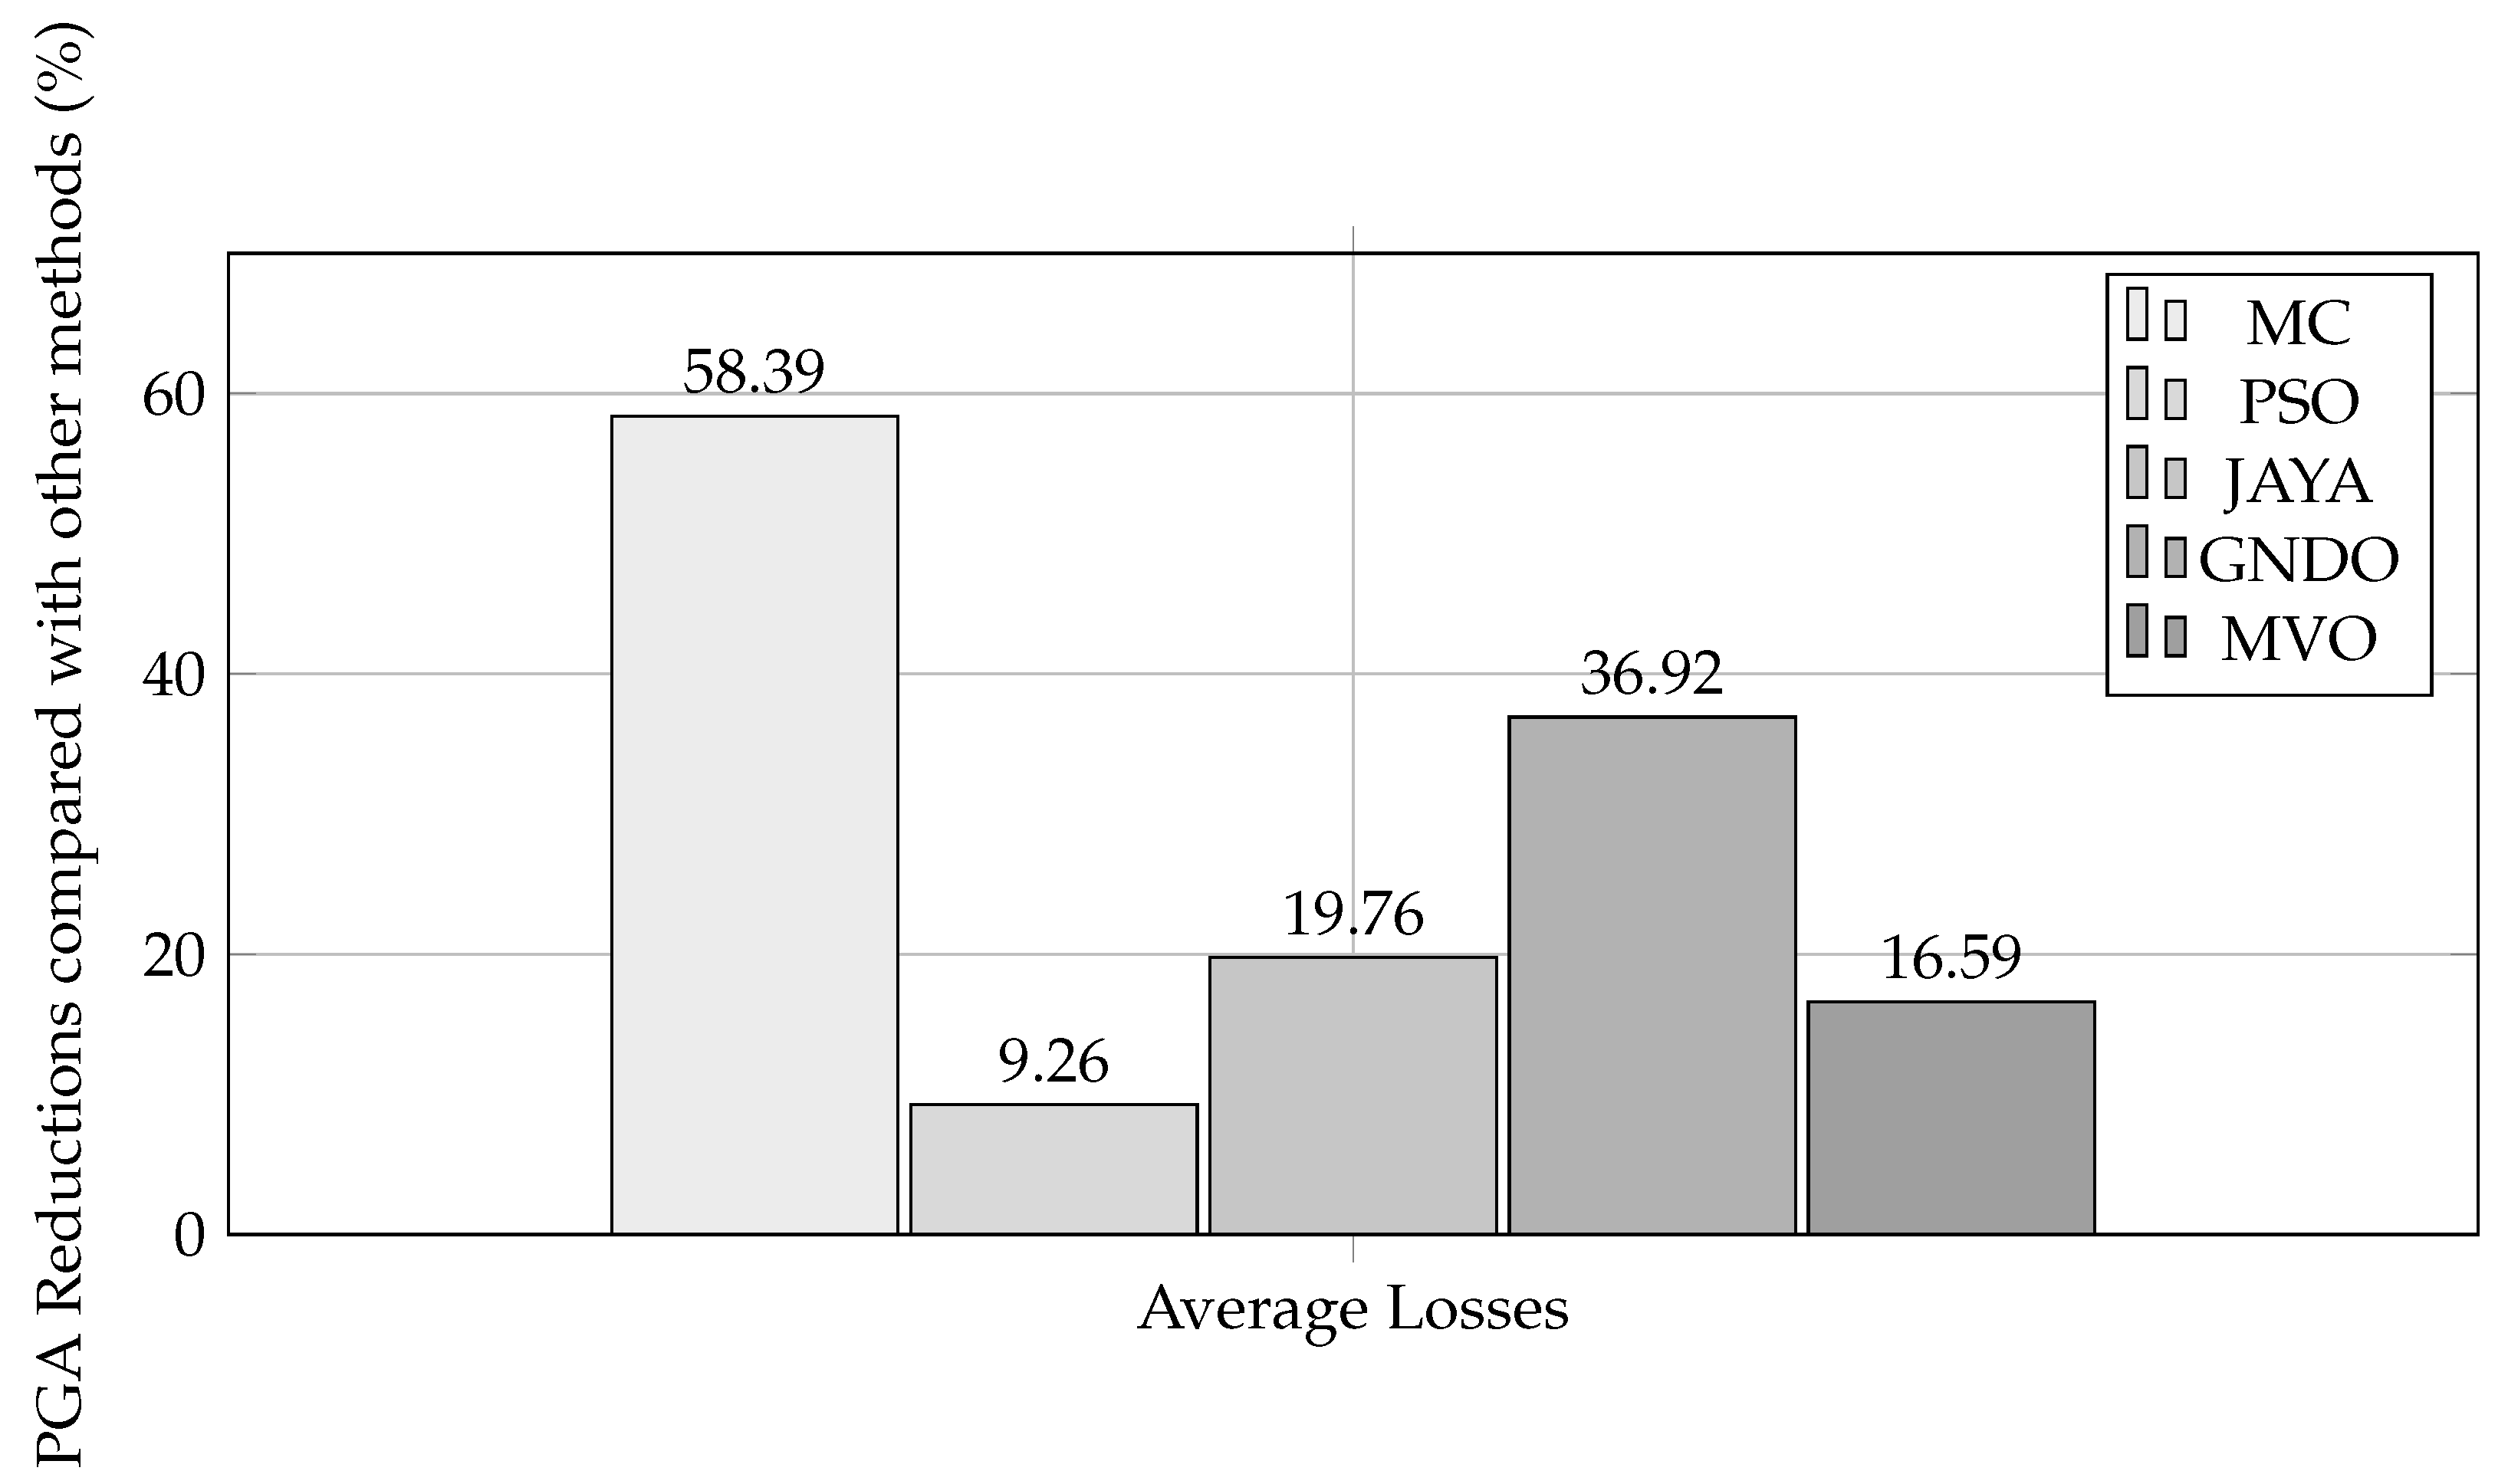

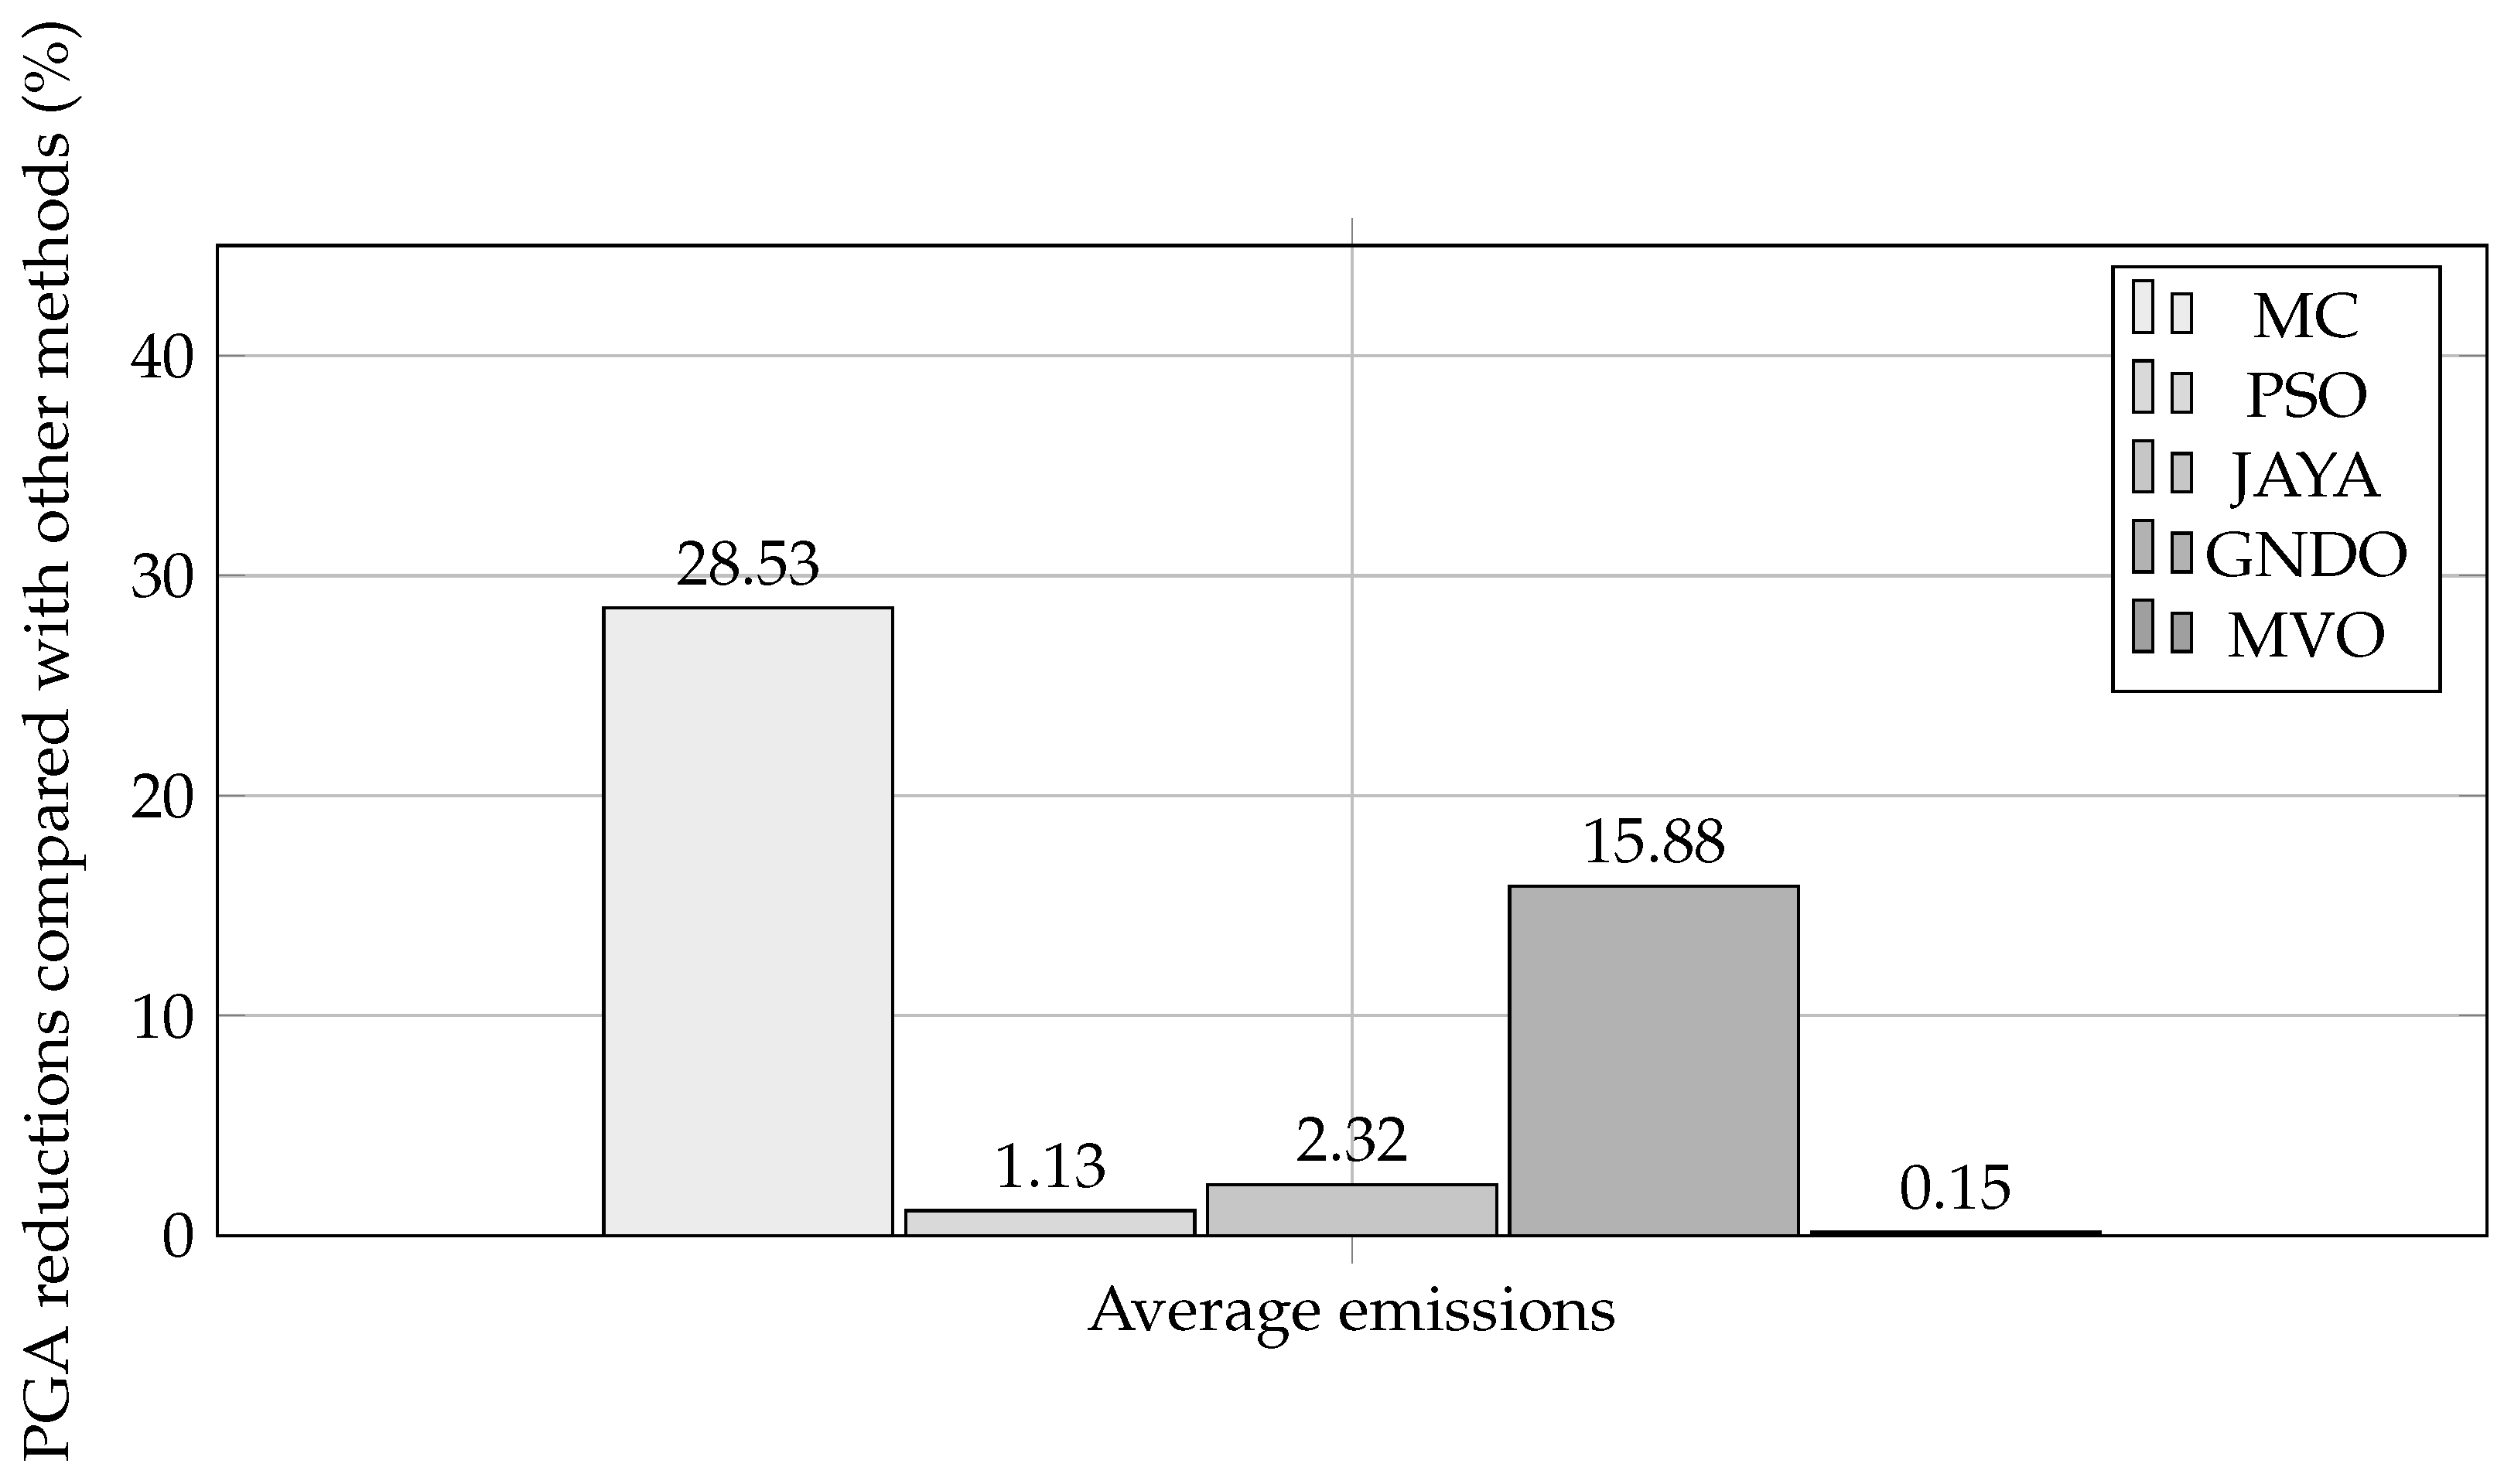
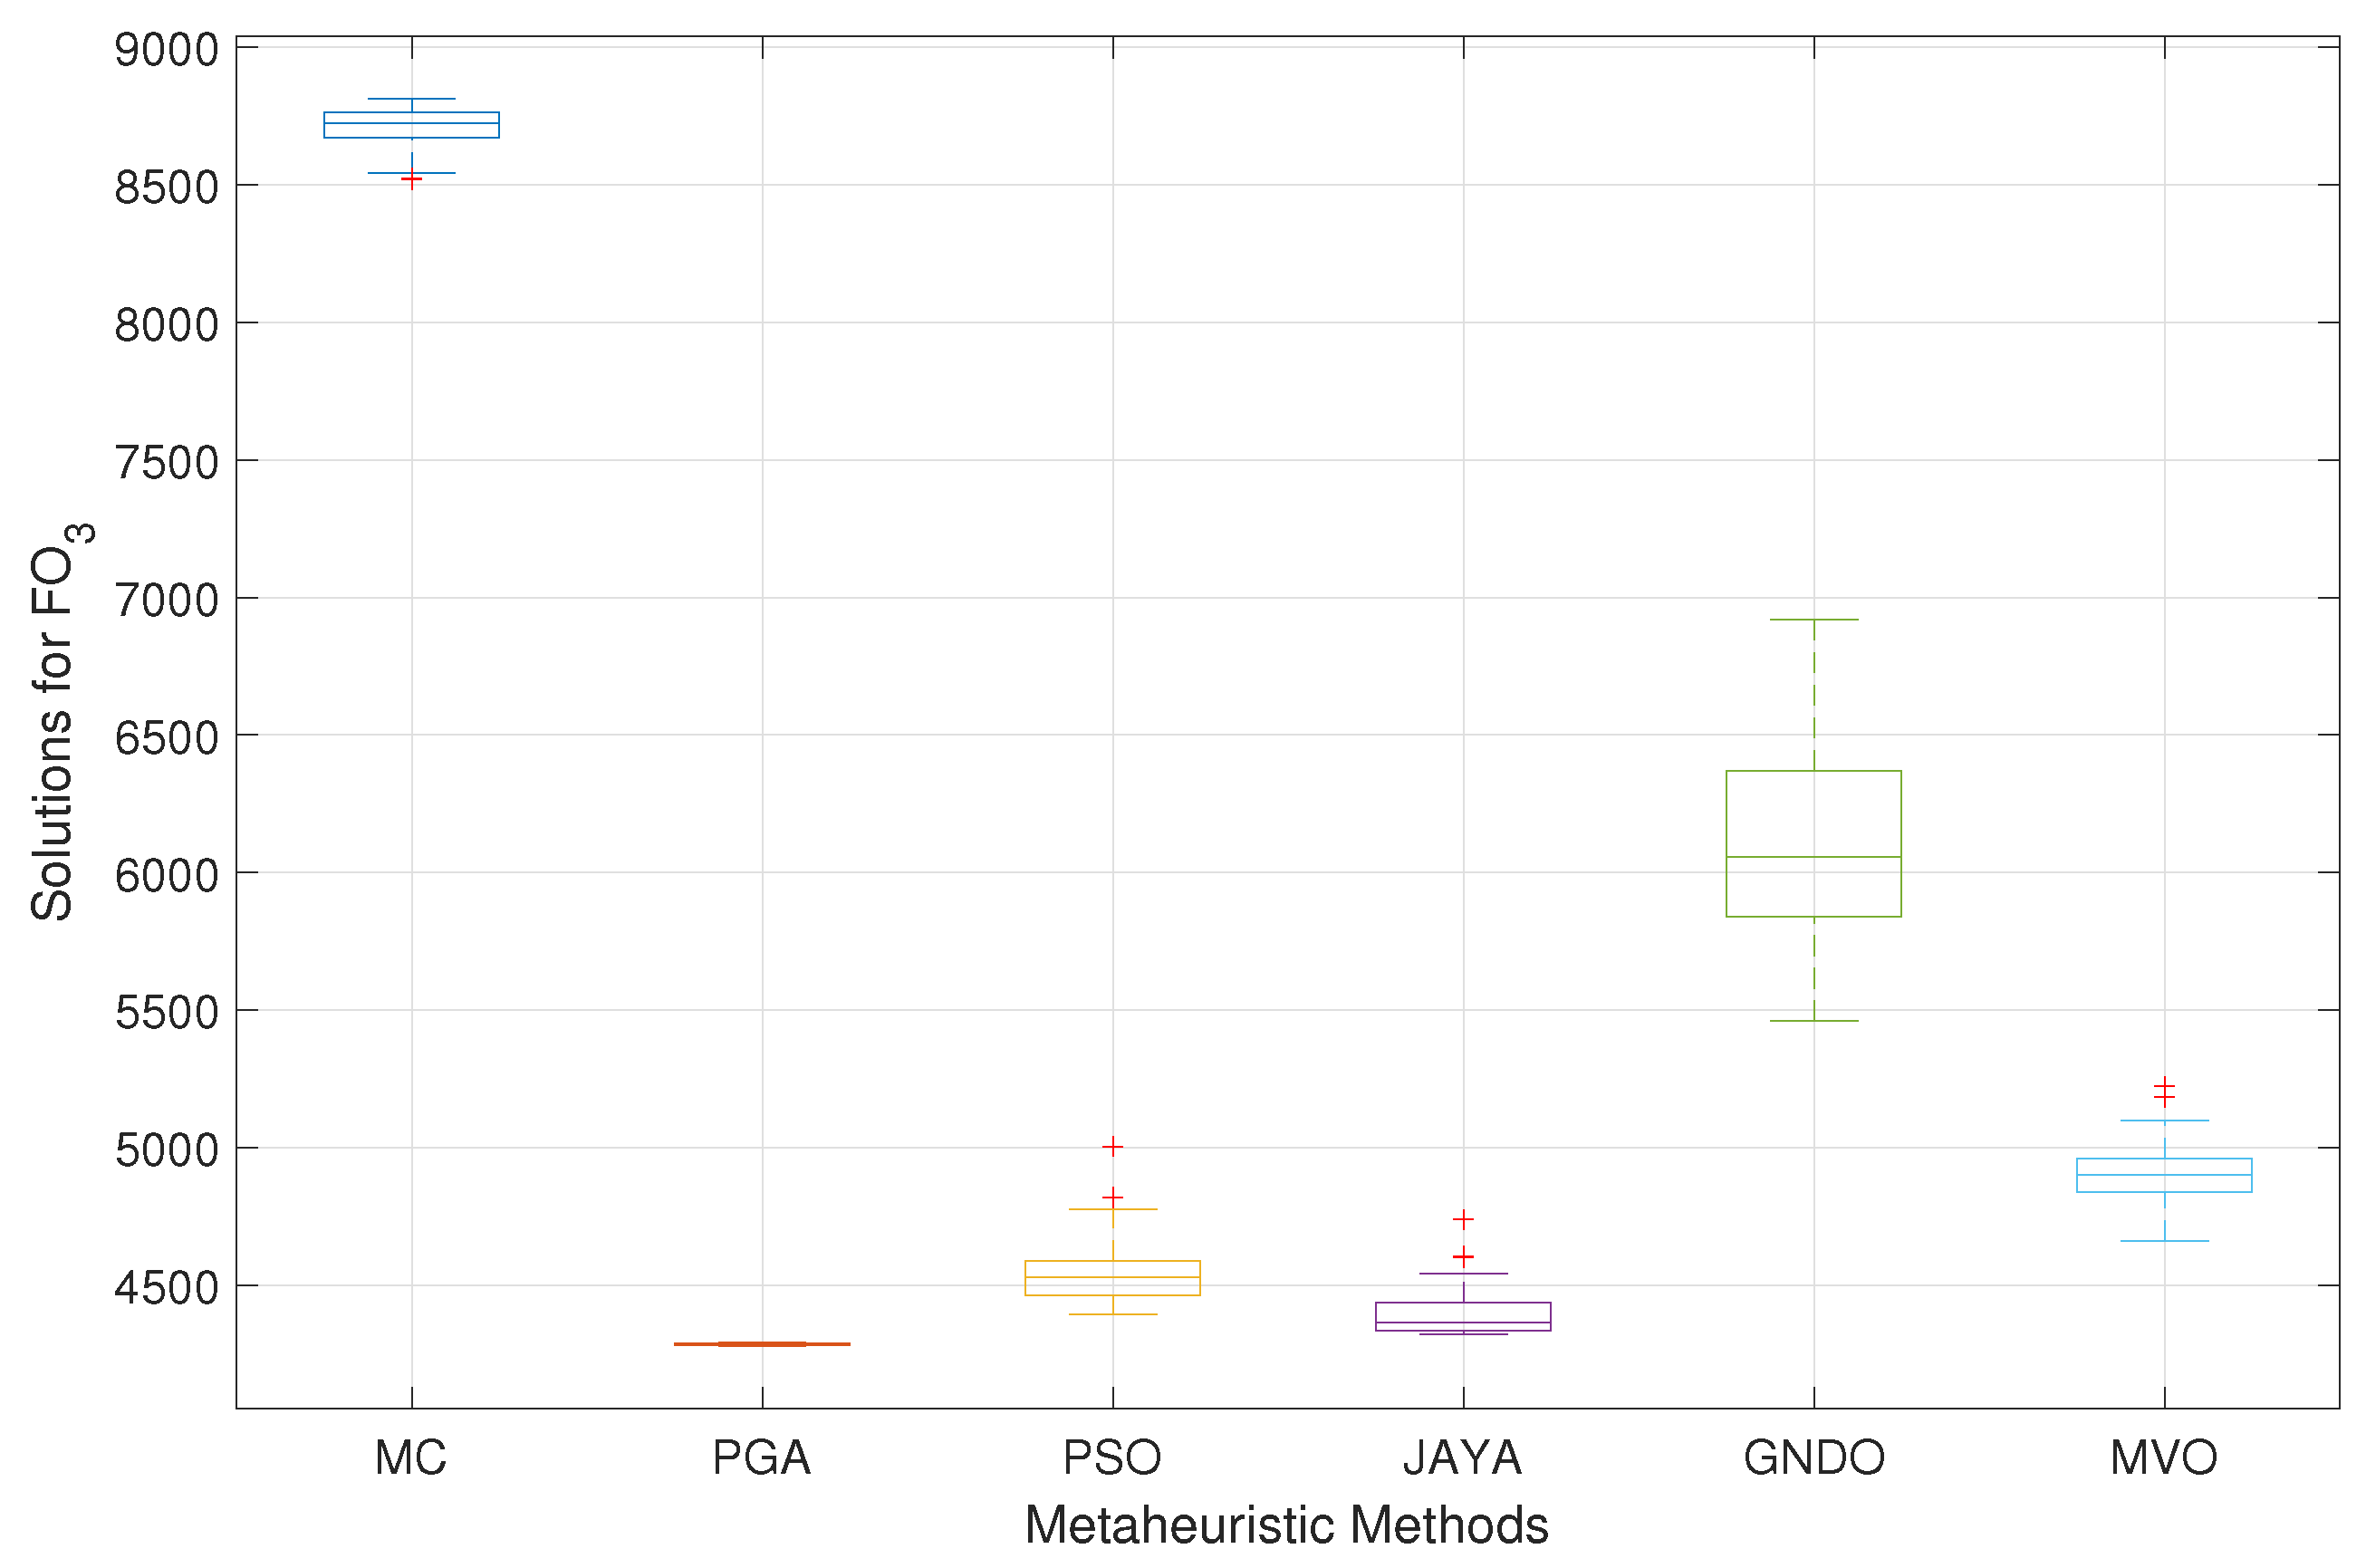
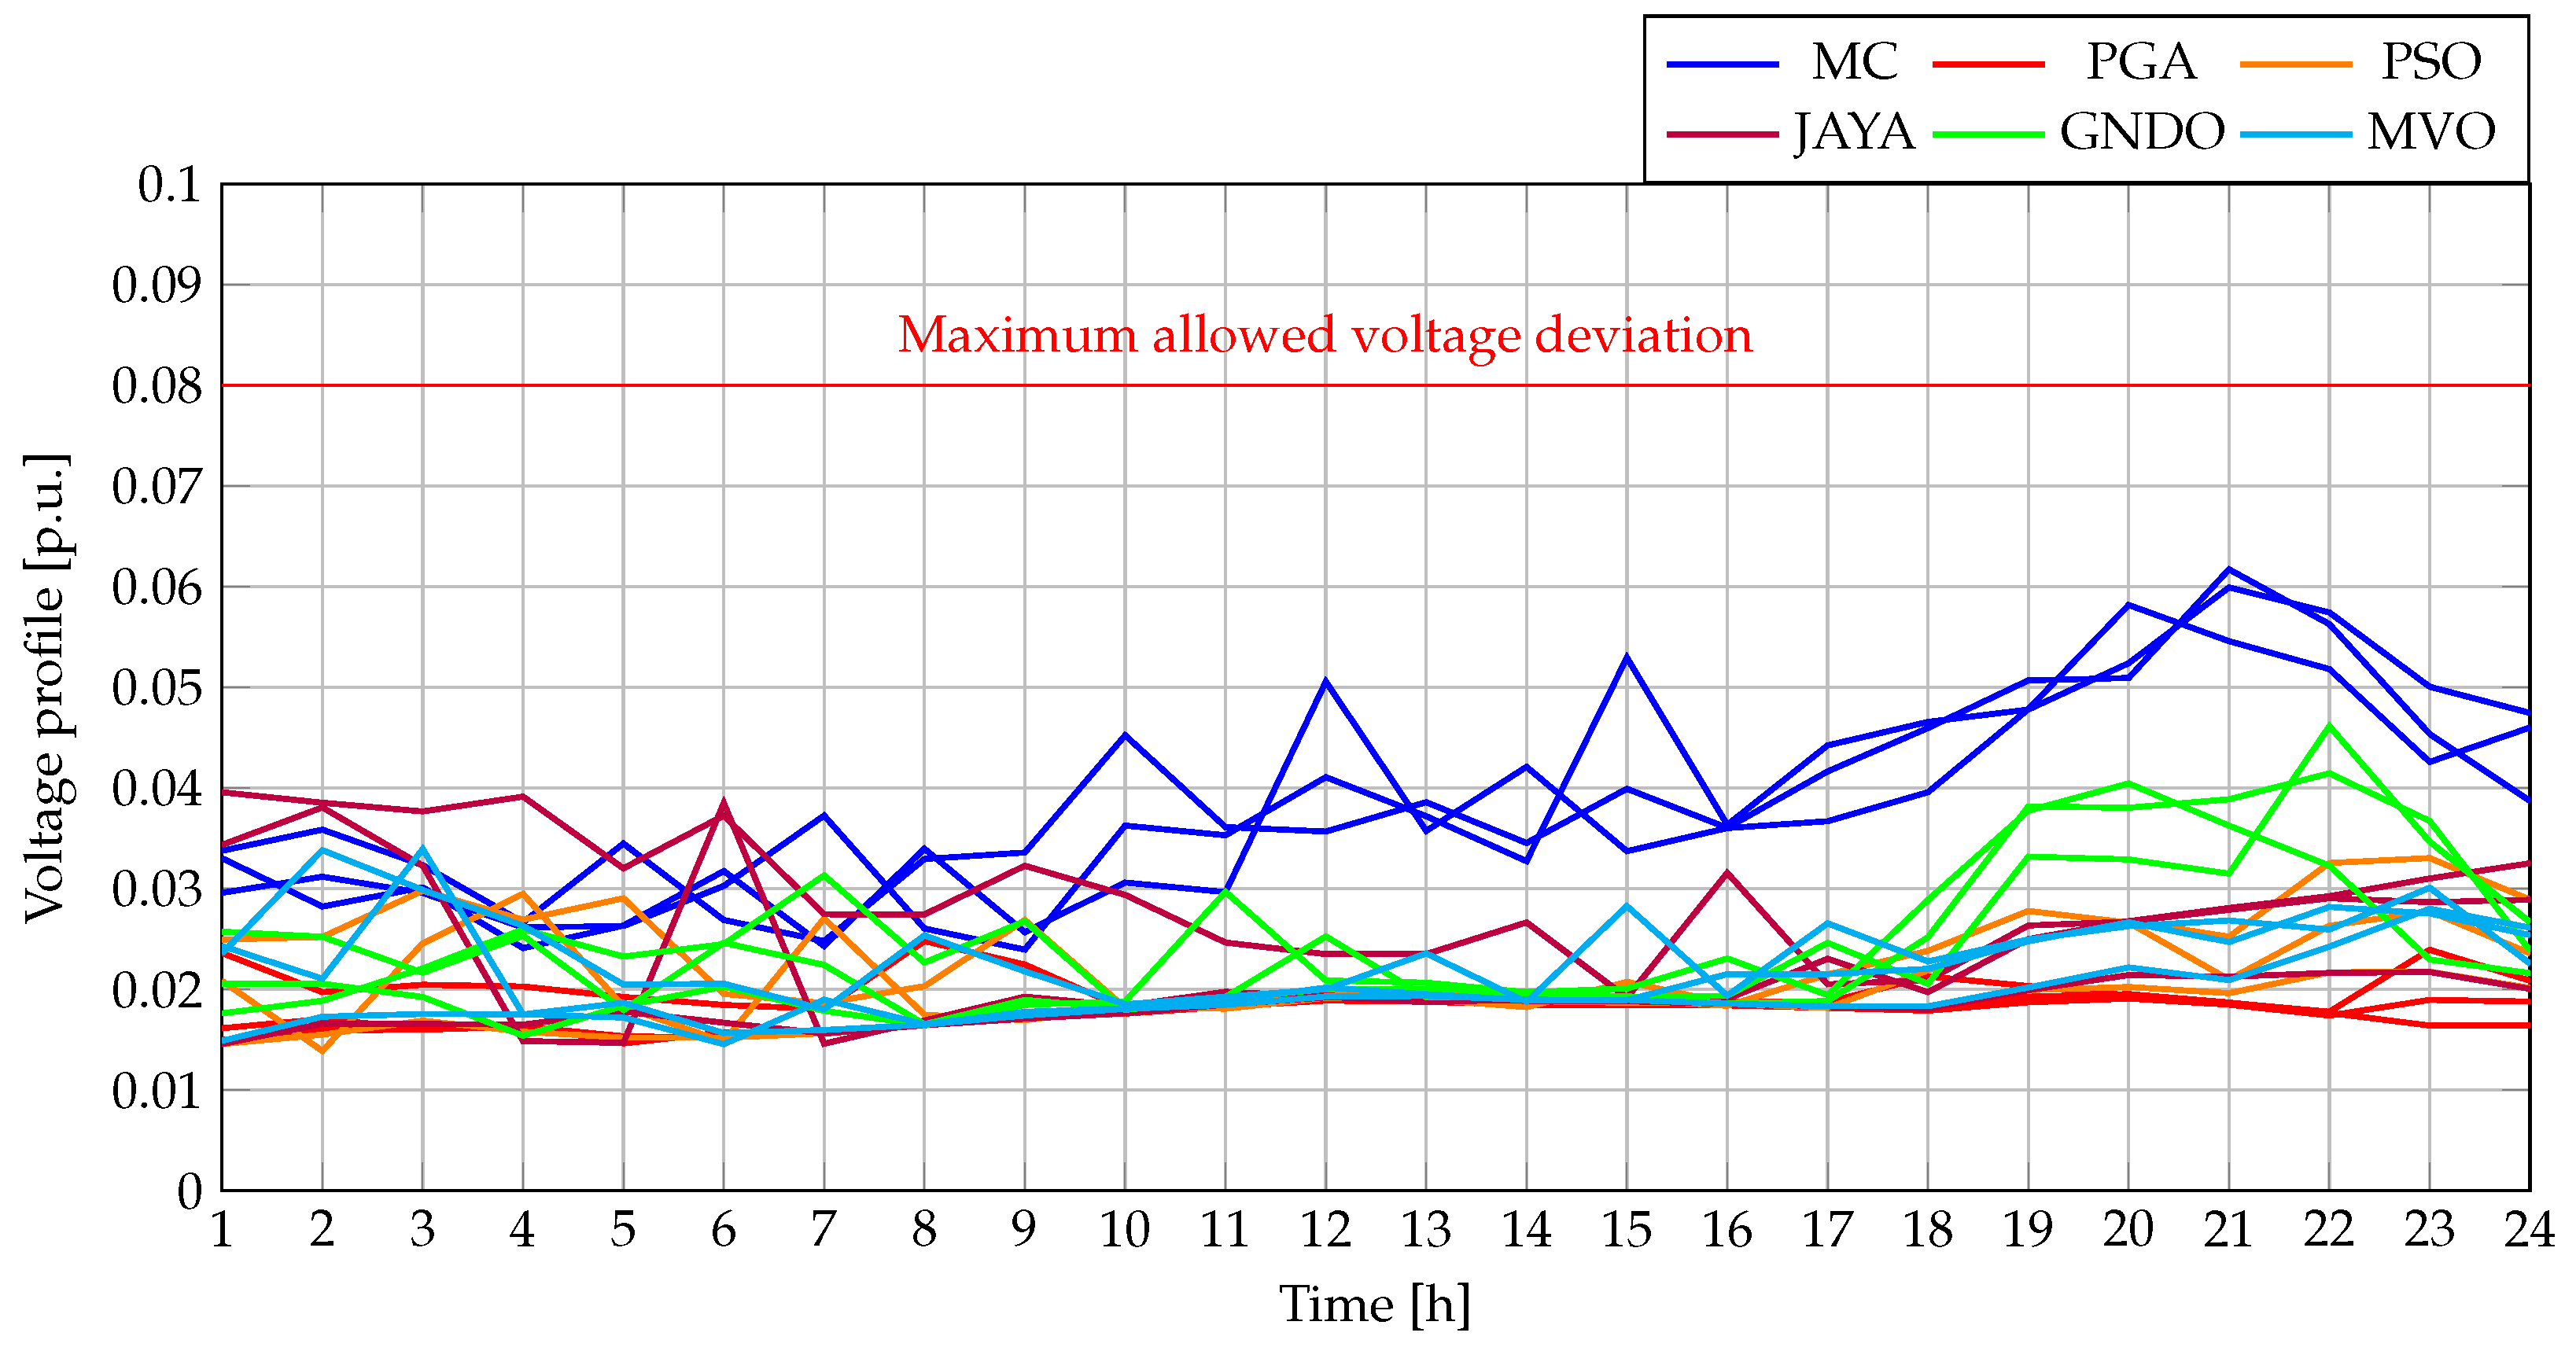

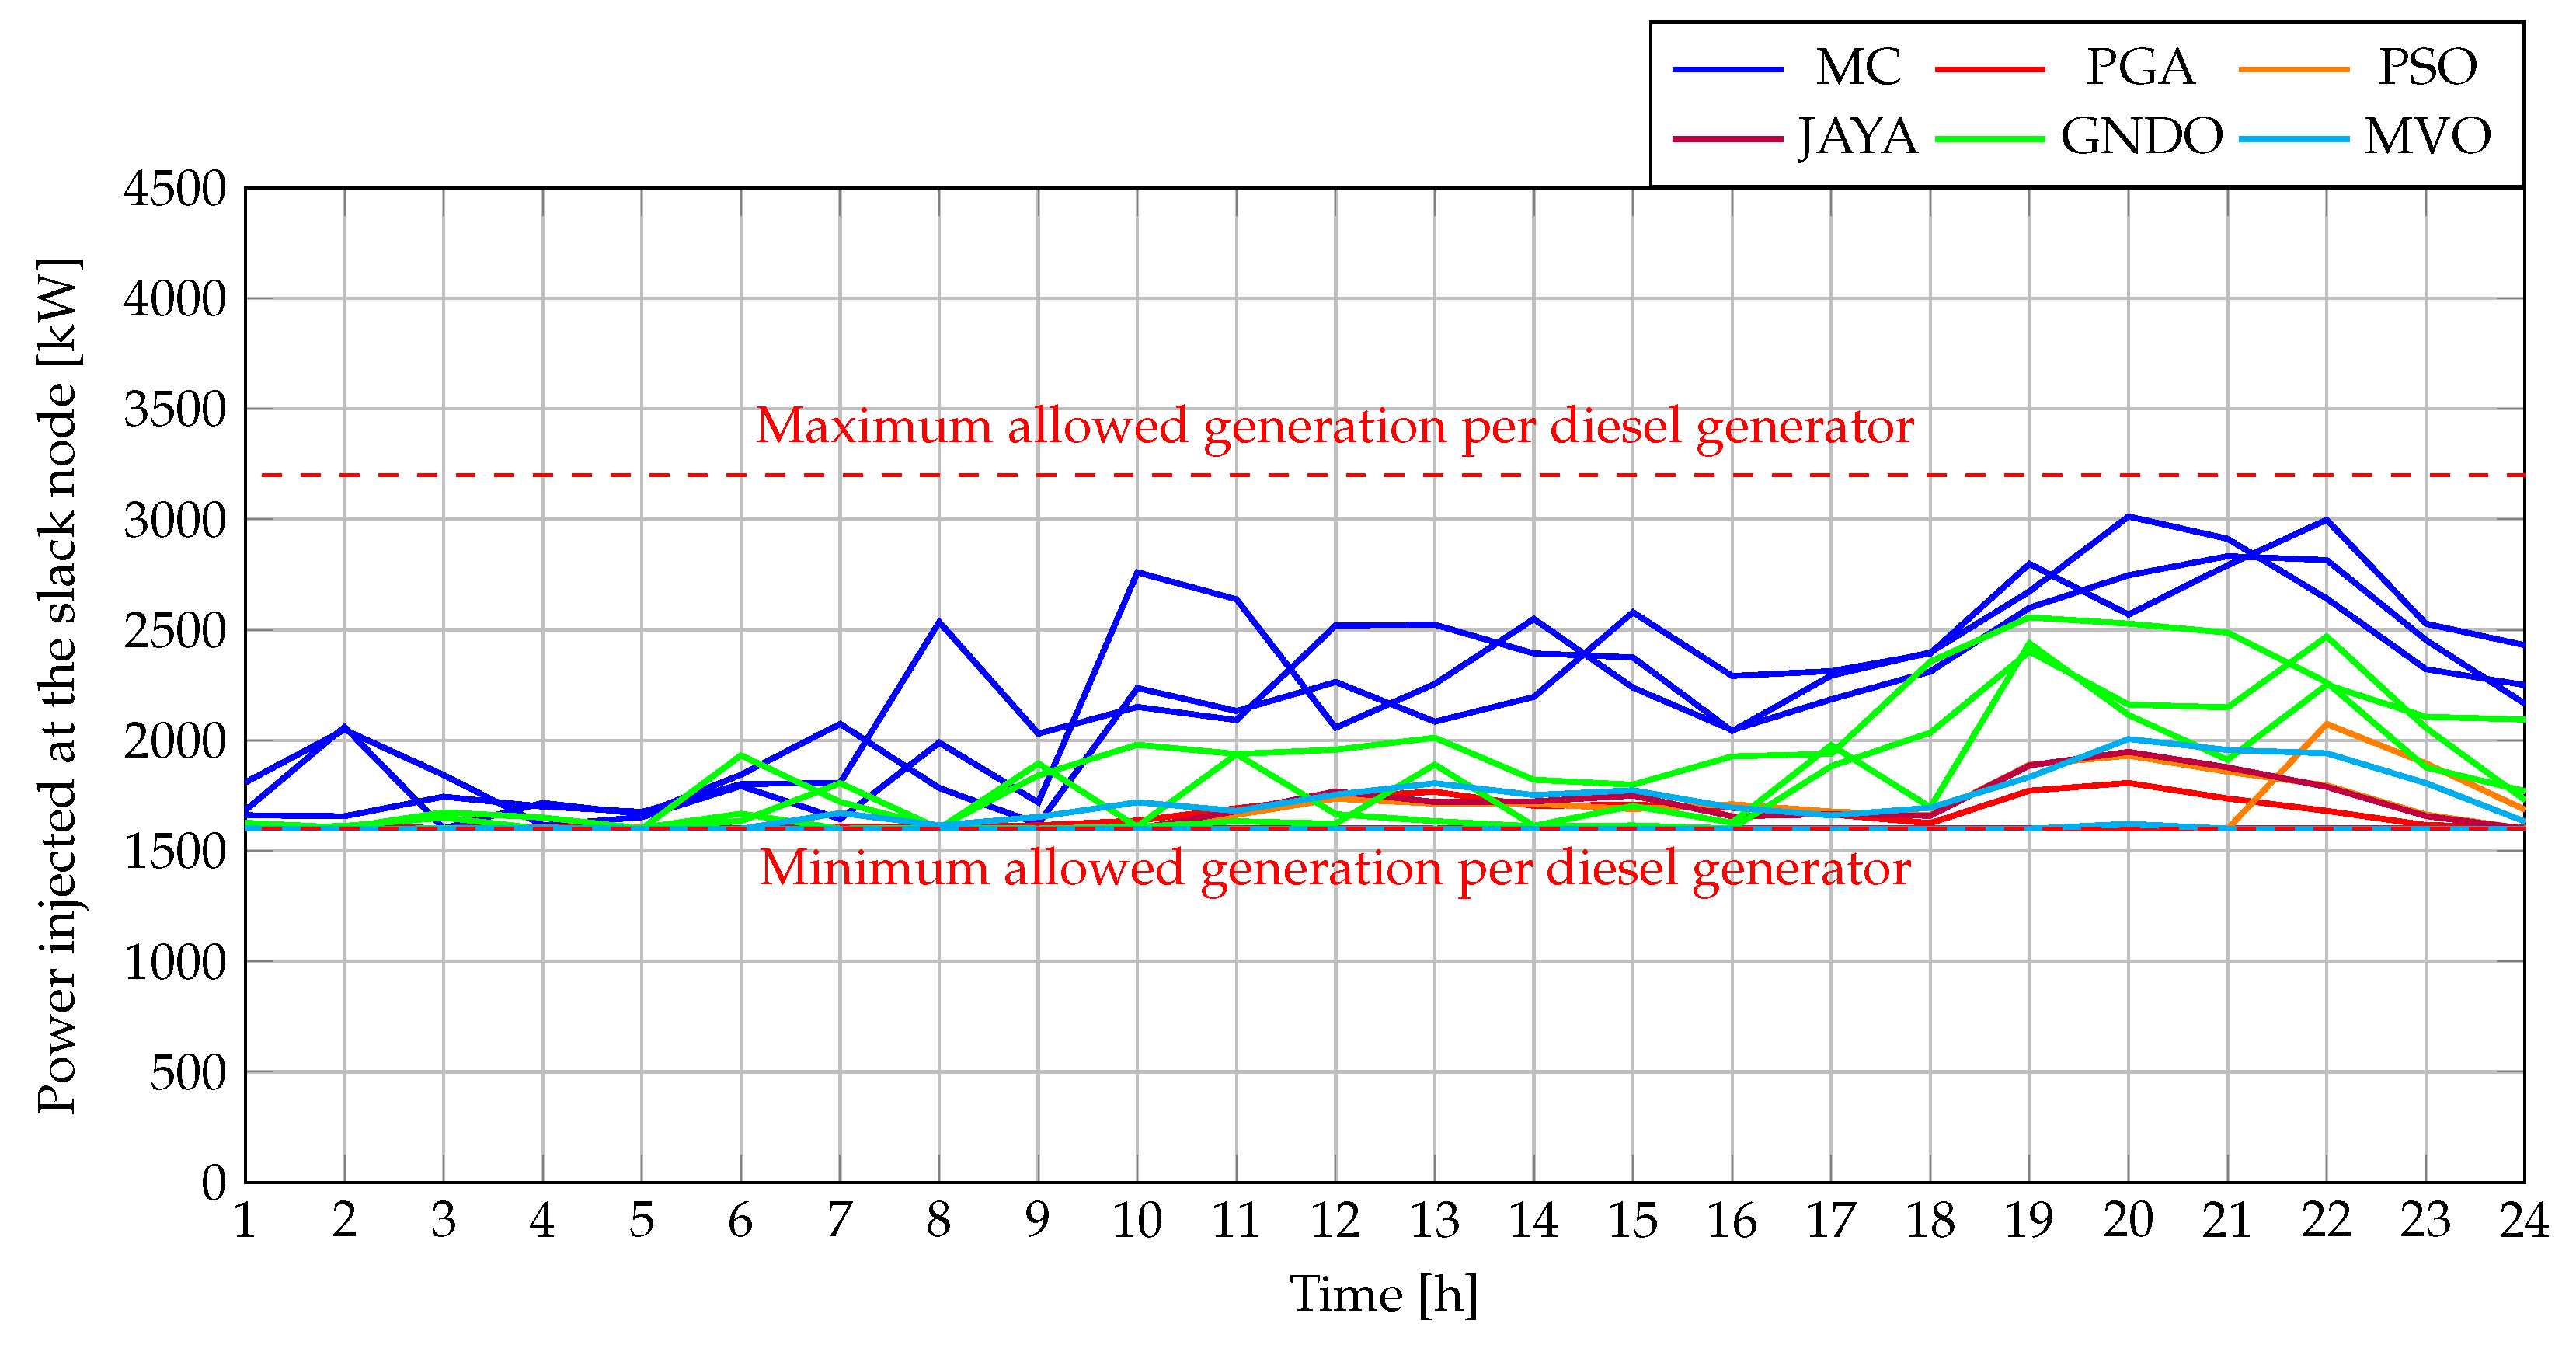

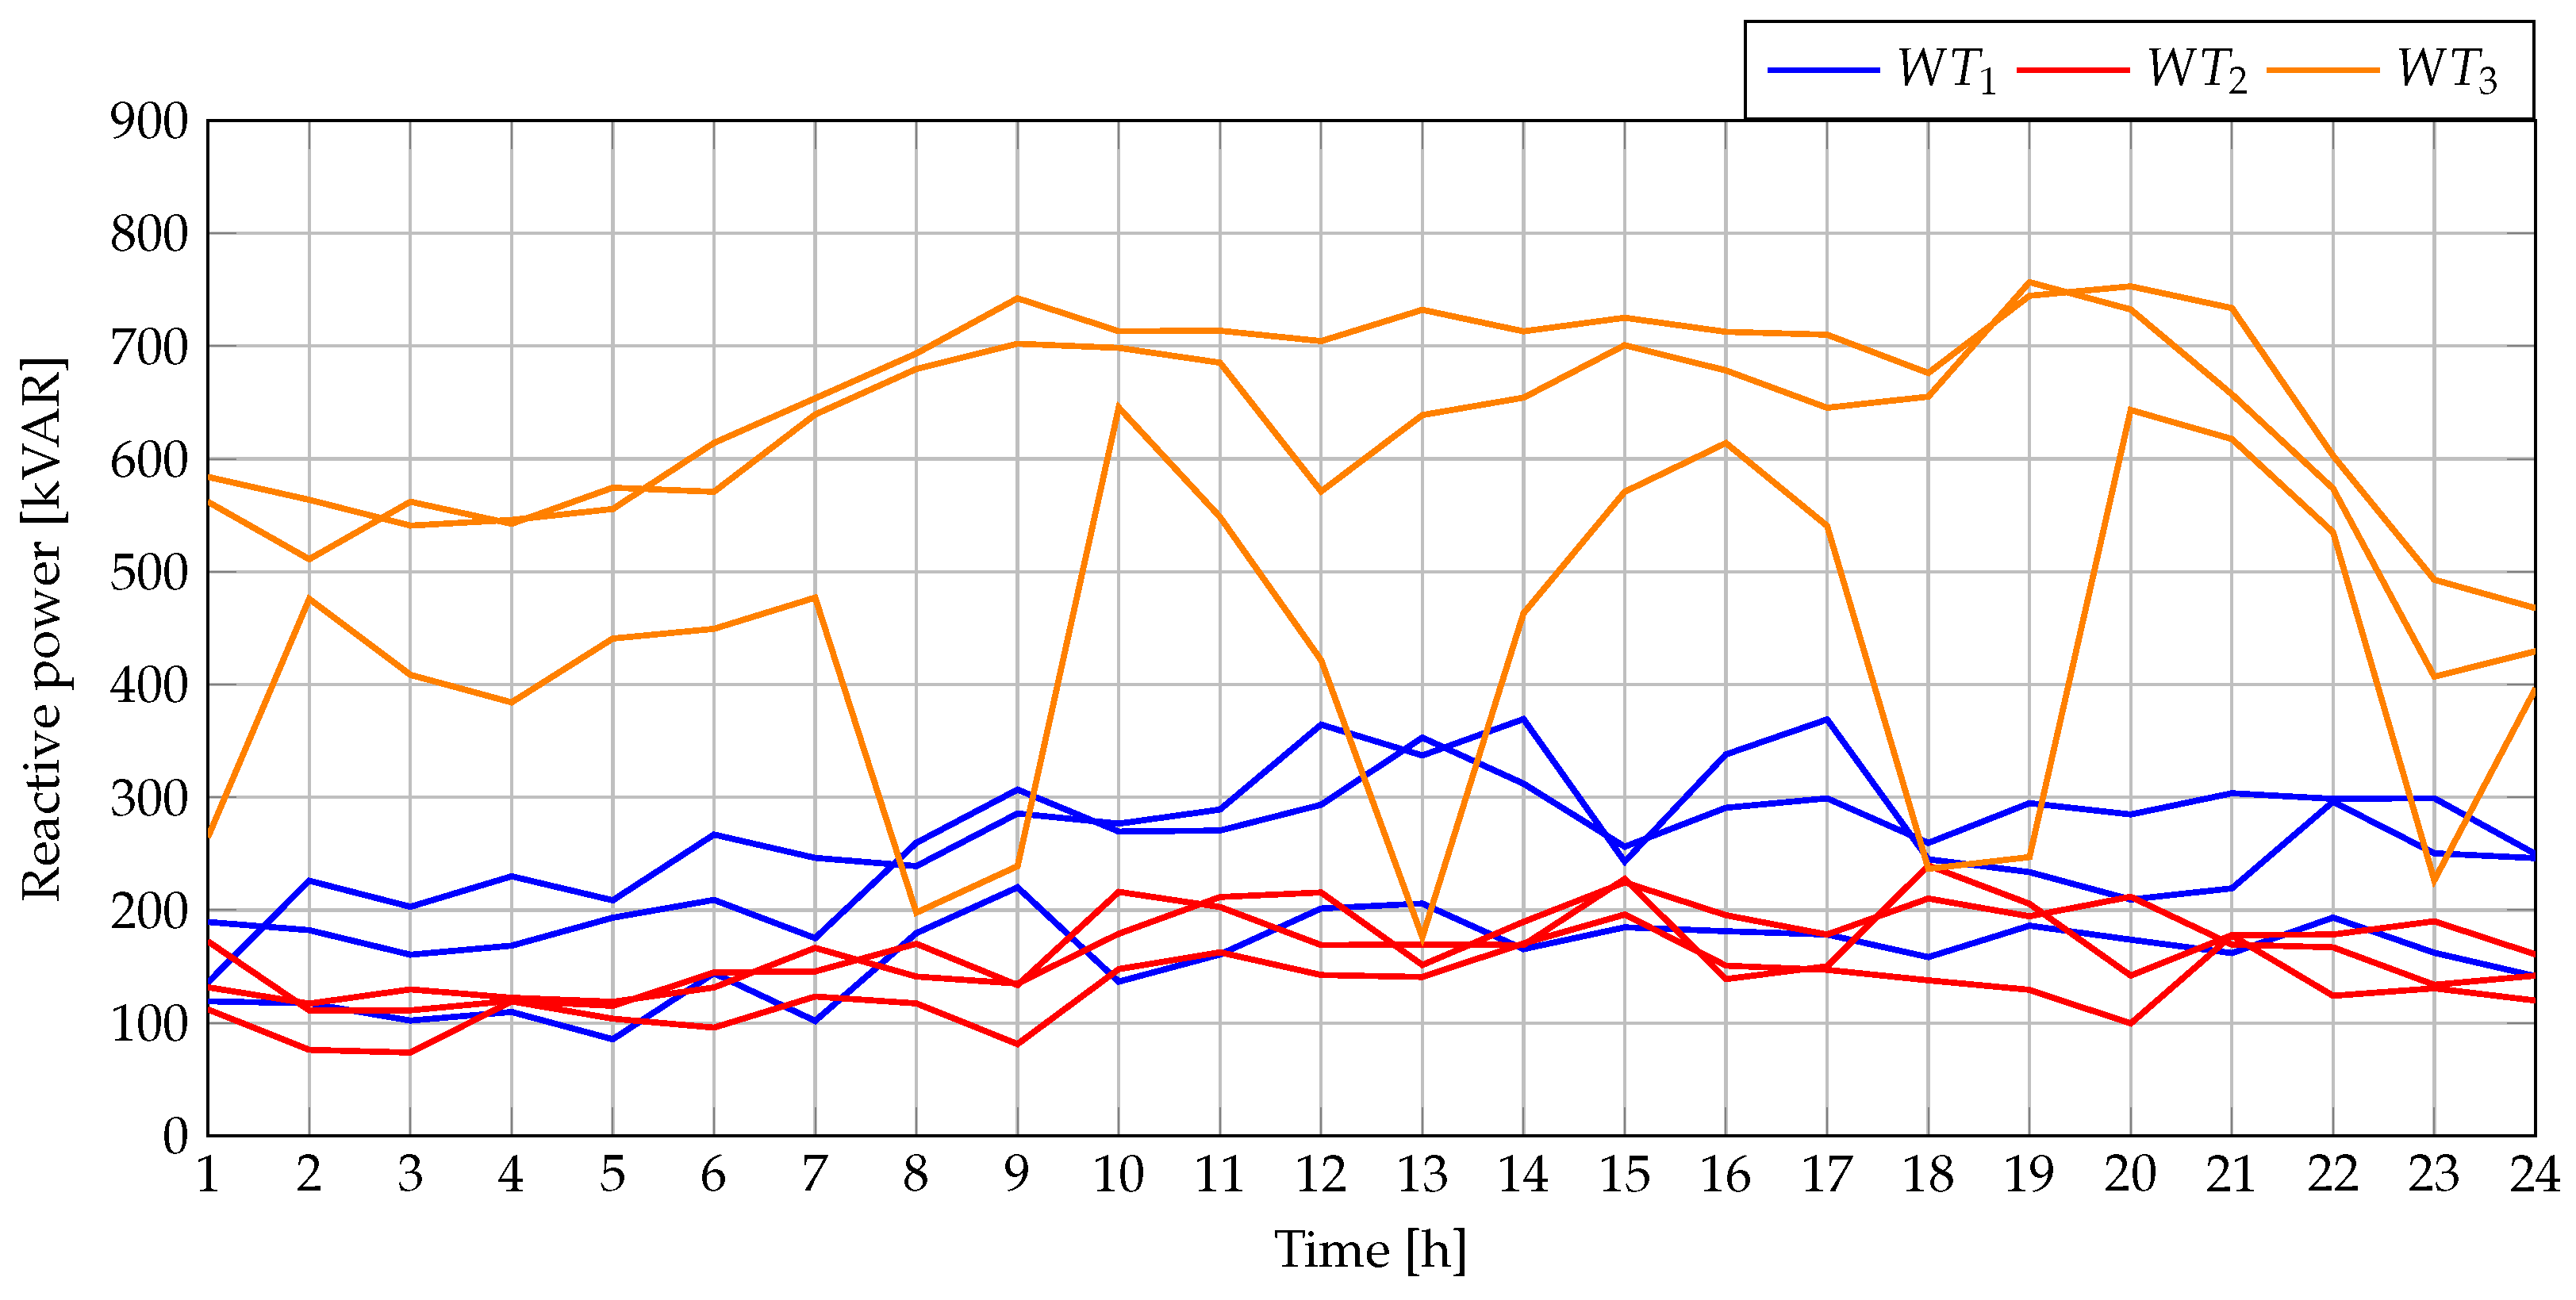
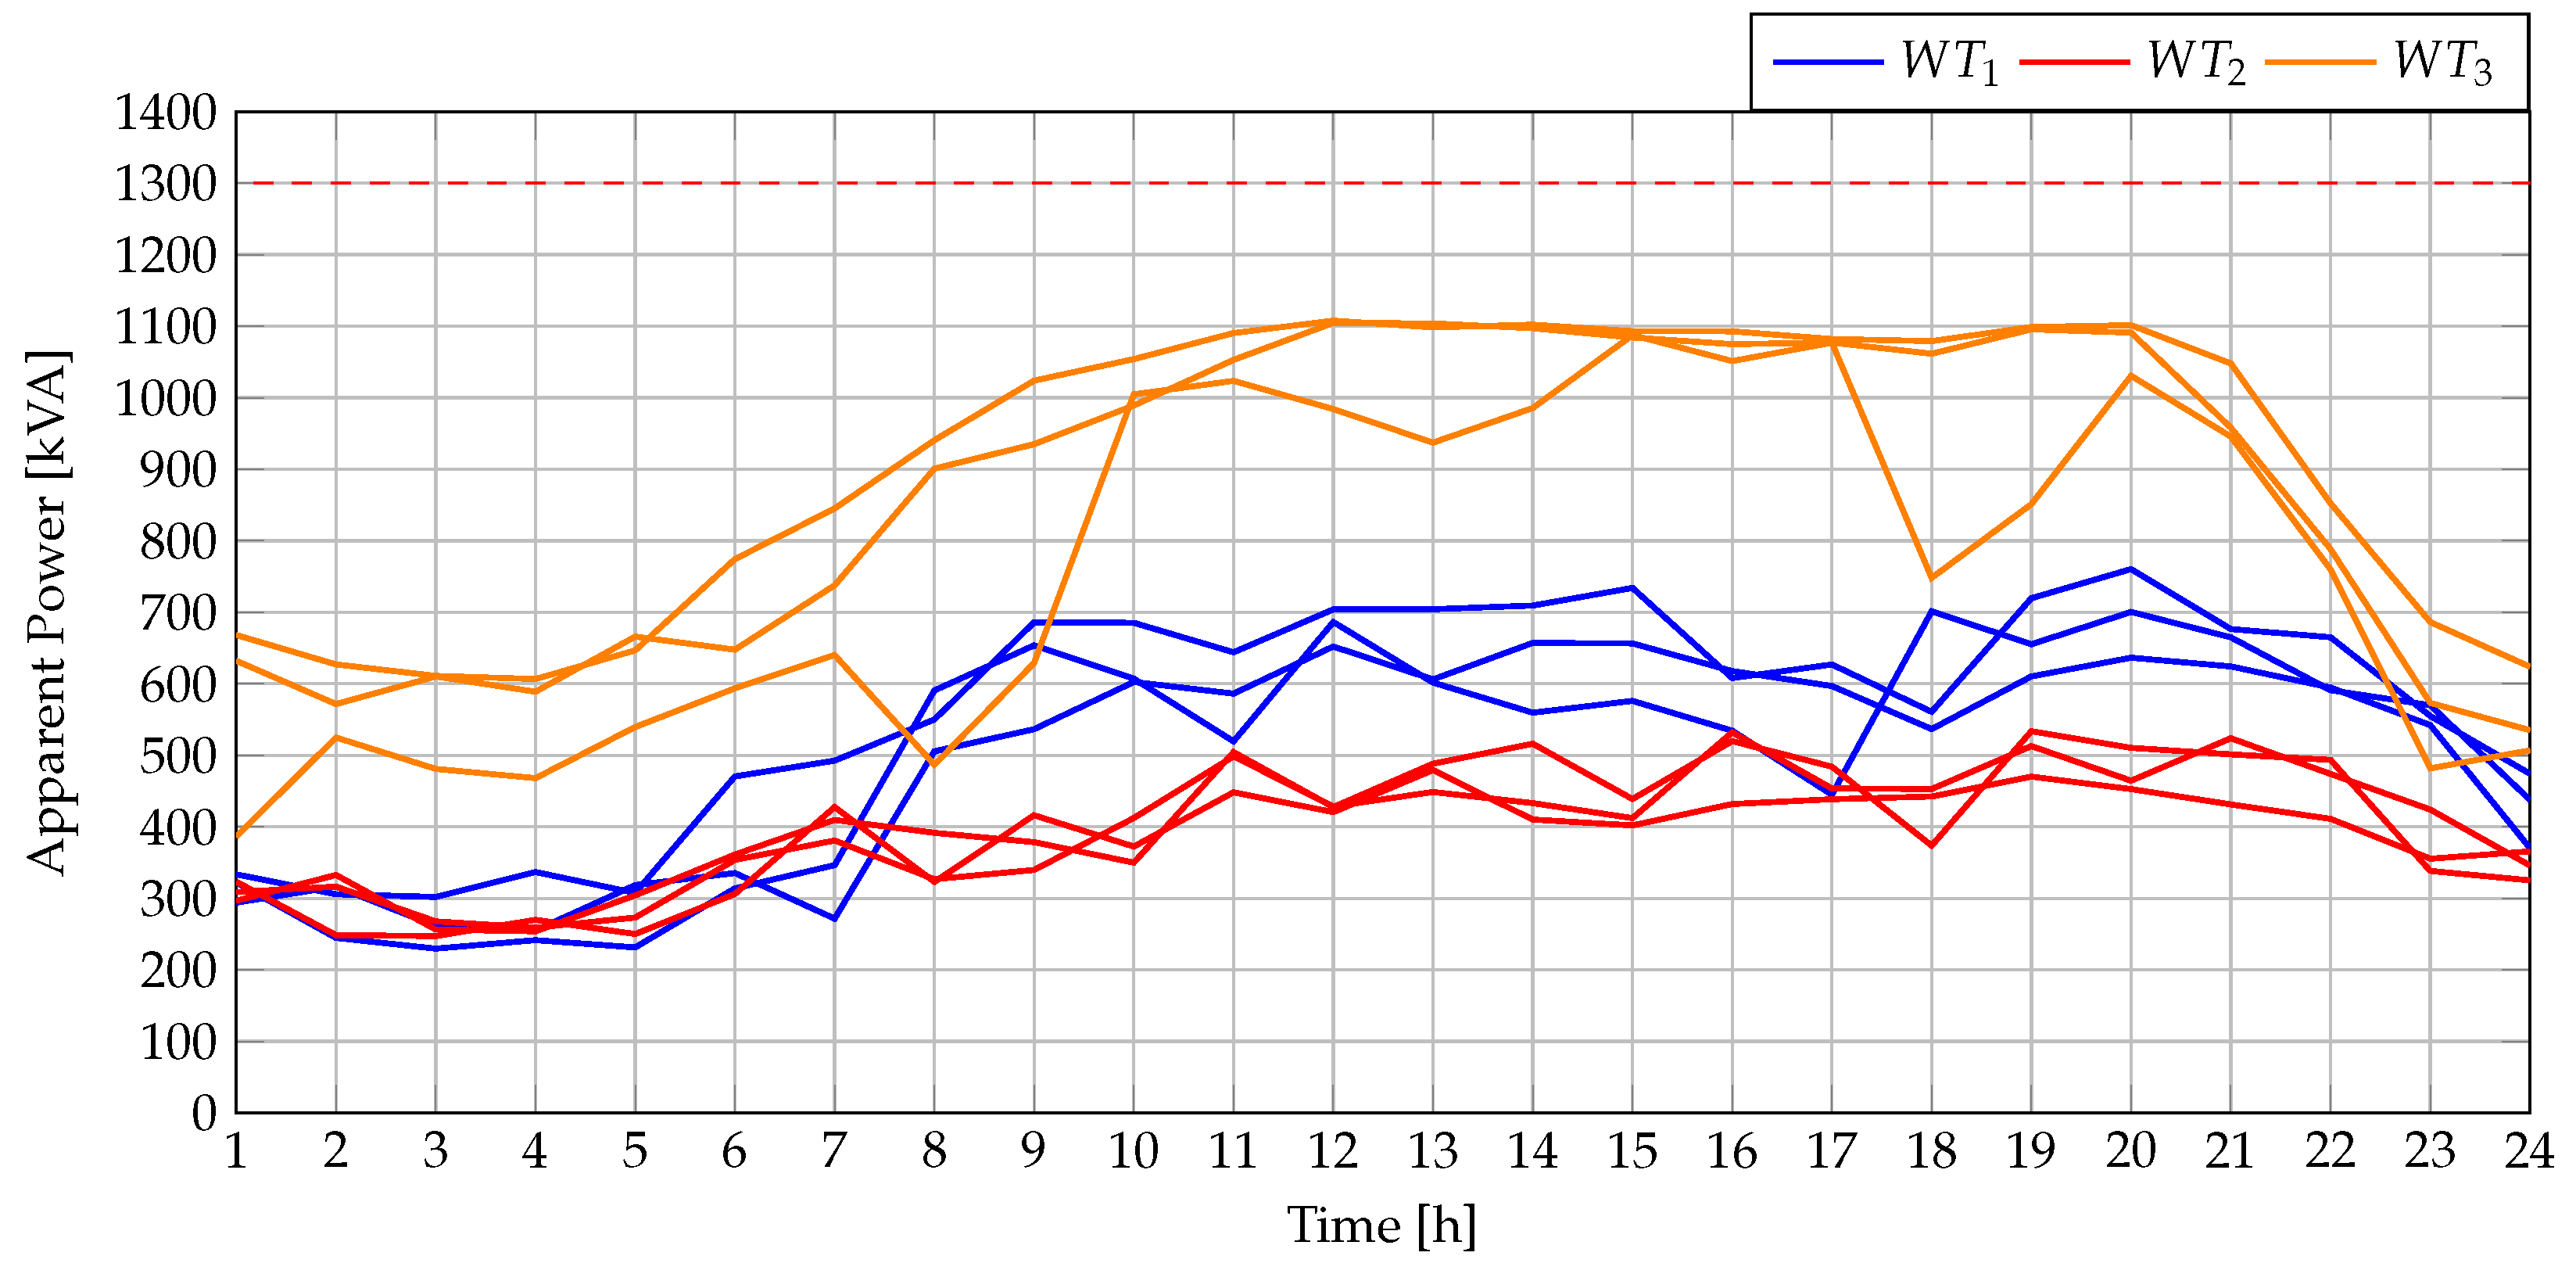
Disclaimer/Publisher’s Note: The statements, opinions and data contained in all publications are solely those of the individual author(s) and contributor(s) and not of MDPI and/or the editor(s). MDPI and/or the editor(s) disclaim responsibility for any injury to people or property resulting from any ideas, methods, instructions or products referred to in the content. |
© 2025 by the authors. Published by MDPI on behalf of the International Institute of Knowledge Innovation and Invention. Licensee MDPI, Basel, Switzerland. This article is an open access article distributed under the terms and conditions of the Creative Commons Attribution (CC BY) license (https://creativecommons.org/licenses/by/4.0/).