Abstract
As voice cloning technology rapidly advances, the risk of personal voices being misused by malicious actors for fraud or other illegal activities has significantly increased, making the collection of speech data increasingly challenging. To address this issue, this study proposes a data augmentation method based on XText-to-Speech (XTTS) synthesis to tackle the challenges of small-sample, multi-class speech recognition, using profanity as a case study to achieve high-accuracy keyword recognition. Two models were therefore evaluated: a CNN model (Proposed-I) and a CNN-Transformer hybrid model (Proposed-II). Proposed-I leverages local feature extraction, improving accuracy on a real human speech (RHS) test set from 55.35% without augmentation to 80.36% with XTTS-enhanced data. Proposed-II integrates CNN’s local feature extraction with Transformer’s long-range dependency modeling, further boosting test set accuracy to 88.90% while reducing the parameter count by approximately 41%, significantly enhancing computational efficiency. Compared to a previously proposed incremental architecture, the Proposed-II model achieves an 8.49% higher accuracy while reducing parameters by about 98.81% and MACs by about 98.97%, demonstrating exceptional resource efficiency. By utilizing XTTS and public corpora to generate a novel keyword speech dataset, this study enhances sample diversity and reduces reliance on large-scale original speech data. Experimental analysis reveals that an optimal synthetic-to-real speech ratio of 1:5 significantly improves the overall system accuracy, effectively addressing data scarcity. Additionally, the Proposed-I and Proposed-II models achieve accuracies of 97.54% and 98.66%, respectively, in distinguishing real from synthetic speech, demonstrating their strong potential for speech security and anti-spoofing applications.
1. Introduction
As bullying in schools becomes increasingly prevalent, parents and educational institutions are growing more concerned about verbal aggression among students. Speech recognition technology has been widely applied to wake word detection [1], voice control [2], and specific keyword spotting [3]. Consequently, leveraging artificial intelligence to detect insulting speech has emerged as a critical research direction. In previous work [4], Zhu et al. developed an insult speech recognition system for four categories of Minnan insult sentences using Mel-Frequency Cepstrum Coefficient (MFCC) features and Convolutional Neural Networks (CNNs), achieving an average accuracy of 91.9%. However, when extended to 16 insult categories, the accuracy dropped significantly to 55.35%, indicating that insufficient speech data limits the model’s learning capacity and degrades its classification performance.
To improve speech recognition accuracy, the most effective approach typically involves collecting a large volume of speech data to provide a broader and more diverse set of training samples, thereby enhancing model generalization. Additionally, with the rapid advancement of AI voice cloning technologies, such as OpenVoice [5], XText-to-Speech (XTTS) [6], and Fish-Speech [7], highly realistic synthetic voices can be generated from just 10 to 30 s of speech samples. While innovative, these technologies raise security concerns, as they can be exploited by malicious actors for voice-based fraud. Research by Adánez-Pérez et al. [8] demonstrates that voice cloning can deceive Amazon’s Alexa speech recognition system with a success rate of up to 63%, and that 50% of 200 test participants were unable to distinguish between real and synthetic voices. These risks have significantly reduced public willingness to provide personal voice data, making speech data collection more challenging. Currently, publicly available datasets such as LibriSpeech [9], Speech Commands [10], and AISHELL-1 [11] are widely used for English and Mandarin speech recognition, but primarily contain standard speech, lacking coverage of Minnan or context-specific corpora. Consequently, additional recordings or data augmentation are required for specific languages or application scenarios to supplement training needs, a process that is not only time-consuming and labor-intensive, but that also carries the risk of the malicious exploitation of recorded speech.
Conventional data augmentation techniques, such as Pydub [12] and Librosa [13], have limitations in speech transformation. For instance, Pydub’s [12] volume adjustment amplifies or reduces noise alongside the original audio, potentially exacerbating interference from noisy recordings and impairing model learning. Similarly, its speed adjustment modifies frame rates, altering pitch alongside tempo and causing the model to learn distorted features. In contrast, Librosa [13] offers time-stretching algorithms that partially mitigate pitch shifts during speed adjustments, but acoustic constraints still limit the adjustment range. Additionally, Librosa’s [13] pitch adjustments suffer from distortion issues similar to those of Pydub [12], failing to fully preserve natural speech qualities. Consequently, in data-scarce scenarios, relying solely on these traditional methods cannot sufficiently enhance sample diversity, hindering the model’s ability to adapt to real-world speech variations and reducing practical system performance.
To address data scarcity without increasing the risk of speech leakage, the proposed framework introduces a data augmentation approach tailored to extremely limited corpora, leveraging speech synthesis to expand training data. Using XTTS [6], the proposed framework generates diverse, keyword-specific speech samples from public datasets like AISHELL-3 [14], which are then integrated with real human speech (RHS) and processed with MFCC feature extraction for CNN-based (Proposed-I) and CNN-Transformer-based (Proposed-II) classification. This approach reduces reliance on extensive manual data collection while enhancing keyword classification performance, making the system more suitable for real-world applications like insult speech monitoring.
This study’s contributions are summarized as follows:
- We propose a generative corpus method based on XTTS [6], combining preprocessing with minimal raw data. This approach reduces reliance on large raw corpora and leverages diverse voices from public datasets, enhancing sample variety and significantly boosting keyword recognition performance;
- Through experimental data analysis, we investigate the impact of training, validation, and test set ratios on model performance, further optimizing the proportion of synthetic versus real speech to determine the best configuration;
- The proposed novel data augmentation technique expands the dataset multiple fold, improving system accuracy by 33.55% and demonstrating its effectiveness in addressing data scarcity through speech synthesis;
- By integrating real and synthetic corpora, we not only alleviate data shortages but also enable discrimination between synthetic and real speech within the same model architecture, achieving high-accuracy true–false speech identification.
The remainder of this paper is structured as follows: Section 2 elaborates on the proposed methodology, encompassing the XTTS-based data augmentation technique, the speech signal preprocessing pipeline, the design of sliding window and confidence score statistics mechanisms, the architectural details and implementation of the CNN-based Proposed-I model and CNN-Transformer hybrid Proposed-II model, and ethical considerations addressing the potential misuse and implications of the proposed techniques. Section 3 presents the experimental results, comparing the impact of different dataset ratios, data augmentation strategies, and sliding window techniques on model performance, alongside an analysis of real versus synthetic speech identification. Section 4 summarizes the key findings of this study, discusses the practical implications of the proposed approach, and outlines directions for future research.
2. Proposed Methods
This section introduces a speech recognition method to address the challenges of small-sample, multi-class speech recognition by integrating XTTS speech generation technology [6] with deep learning models for data augmentation and classification to enhance system performance. The proposed approach comprises the following steps. Initially, we employ XTTS with the AISHELL-3 dataset [14] to generate synthetic speech. By integrating this synthetic speech with authentic human speech, we enrich the training dataset, thereby enhancing the model’s learning capabilities. Next, we apply volume normalization, voice activity detection (VAD), and MFCC feature extraction to standardize the input features and reduce non-speech interference. Subsequently, we design two classification architectures—CNN-based and CNN-Transformer-based—to process the extracted features. Figure 1 shows the function blocks of the proposed recognition algorithm. The following subsections elaborate on the methodology, detailing how speech generation, data preprocessing, and classification techniques collectively improve the accuracy and generalization of insult speech recognition.
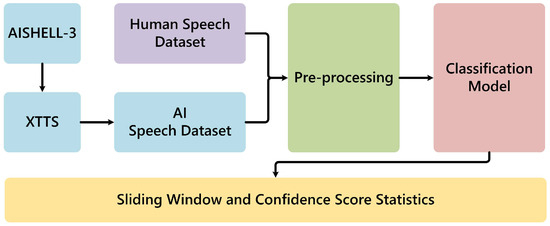
Figure 1.
Function blocks of the proposed recognition algorithm.
2.1. Data Augmentation
Typically, data augmentation entails generating new data by applying subtle modifications to the original dataset, thereby expanding the volume of training data for model development. In contrast, this study employs the publicly available AISHELL-3 dataset [14] as the source for target audio files. We apply VAD technology to concatenate speech segments from these files, ensuring compliance with the 10 s uninterrupted speech requirement recommended by XTTS [6]. Next, we generate synthetic speech using a customized keyword list. This is followed by integrating a small set of real human-recorded keyword speech samples with the synthetic data to complete the augmentation process, facilitating subsequent model training. The detailed architecture is illustrated in Figure 2.

Figure 2.
Data augmentation architecture diagram.
2.2. Preprocessing
Prior to model training, audio data undergoes preprocessing to standardize inputs and minimize non-speech interference. The detailed preprocessing workflow is depicted in Figure 3.

Figure 3.
Preprocessing flowchart.
First, given the variability in individual voice volumes, we employ the Root Mean Square (RMS) normalization method [15] to adjust the audio corpus volume, mitigating potential model misjudgments due to volume discrepancies. The formula for RMS normalization is provided in (1):
In this process, represents the normalized audio, denotes the number of signal samples, is the target volume level in decibels (dB) set to −23 based on the EBU R 128 standard [16], and indicates the audio samples. Subsequently, WebRTC Voice Activity Detection (VAD) [17] removes silent and non-speech segments, enhancing data quality.
Next, Mel-Frequency Cepstral Coefficients (MFCCs) were extracted as the primary features, supplemented by Delta and Delta-Delta dynamic features to capture temporal variations and enhance expressiveness. As illustrated in Figure 4, the extraction process involves the following steps: the audio signal is first pre-emphasized with a coefficient of 0.96875 to enhance high-frequency components; it is then segmented into 25 ms frames (400 samples) with 50% overlap; each frame undergoes a 400-point Fast Fourier Transform (FFT) to convert it to the frequency domain, followed by mapping to 20 Mel filter banks; the filter bank outputs are logarithmically compressed and transformed via a Discrete Cosine Transform (DCT) to yield 13 static cepstral coefficients; and Delta and Delta-Delta features are then computed, resulting in a total of 39 coefficients per frame.
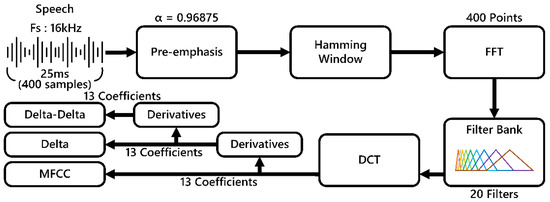
Figure 4.
MFCC architecture diagram. The distinct colors represent different Mel filter banks utilized in the feature extraction process.
To ensure consistent feature length, MFCC features shorter than 96 frames are zero-padded to reach 96 frames, while those exceeding 96 frames are retained in full to preserve both the integrity of short sequences and the rich time–frequency information of longer sequences. Subsequently, a sliding window with a step size of 1 frame segments the features into 80 fixed frame segments, as depicted in Figure 5. This process not only increases the data volume, but also enhances the model’s generalization ability by exposing it to diverse data combinations.

Figure 5.
Padding and segmentation process diagram. (Yellow represents features post-MFCC, blue indicates regions with particularly strong energy).
2.3. Proposed Classification Models
2.3.1. CNN-Based Algorithm (Proposed-I)
The Proposed-I model is a CNN-based classification model using preprocessed speech features with an input size of 80 × 39, comprising six convolutional layers and fully connected layers to 16 output classes, as shown in Figure 6. The model applies a convolution operation, defined in (2), to transform input feature map into output feature map using weights for the -th channel and bias . ReLU activation, defined in (3), is applied after each convolution to enhance nonlinearity and mitigate vanishing gradients. The architecture includes six convolutional layers with 32, 32, 64, 32, 16, and 3 filters, respectively, using 3 × 3 kernels, stride 1, and padding 1 to preserve feature map dimensions, followed by fully connected layers for classification, as detailed in Table 1. This design effectively captures local speech patterns, improving keyword recognition in small-sample, multi-class scenarios.
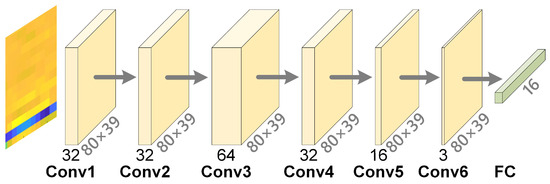
Figure 6.
Architecture design of the proposed CNN-based classification model. (Yellow in the input represents features post-MFCC, blue indicates regions with particularly strong energy, light yellow denotes convolution operations, green signifies fully-connected layers).

Table 1.
Layer information of the proposed CNN-based classification model.
2.3.2. CNN-Transformer-Based Algorithm (Proposed-II)
To enhance sequential speech feature modeling, we propose a CNN-Transformer hybrid architecture, as shown in Figure 7, integrating a CNN feature extractor, a format conversion module, and a three-layer Transformer encoder to combine local and global feature modeling. The CNN module includes four convolutional layers with 24, 48, 24, and 4 filters, respectively, each using 3 × 3 kernels, stride 1, padding 1, and batch normalization after each layer. A 2 × 2 max-pooling layer after the second convolution reduces the feature map from 80 × 39 to 40 × 19, lowering computational complexity. The output is processed through Permute and Reshape layers into a sequence and projected to a 64-dimensional embedding space . The Transformer encoder, with three layers, each containing 8 attention heads and a 128-dimensional feedforward network , applies a 0.1 dropout rate to prevent overfitting, capturing long-range dependencies to enhance speech pattern recognition. Finally, features are flattened and passed through a fully connected layer for 16-class prediction, optimized with Adam, and processed via a Softmax function to compute class probabilities, with the highest probability determining the result. The detailed layer structure is presented in Table 2.

Figure 7.
Architecture design of the proposed CNN-Transformer-based classification model. (Yellow in the input represents features post-MFCC, blue indicates regions with particularly strong energy, light yellow represents convolution operations, red represents batch normalization layers, purple represents pooling layers, light gray represents reshaping and dimension conversion, gray represents projection operations, light blue represents Transformer layers, orange represents flattening operations, light orange represents dropout operations, and green represents fully connected layers).

Table 2.
Layer information of the proposed CNN-Transformer-based classification model.
2.4. Sliding Window and Confidence Score Statistics
Since repeated words may occur within a speech segment, a single frame often struggles to accurately distinguish features across categories. To address this, we employ a sliding window strategy to progressively scan each frame and compute confidence scores for each category. The final predicted category is determined by (4).
Here, represents the total number of windows, and denotes the probability of category for the -th window. The category with the highest confidence score is selected as the final prediction result. The detailed process is illustrated in Figure 8. When given an input speech segment, we apply a 50% overlapping sliding window to segment the signal and extract multiple MFCC feature sequences. These feature segments are then individually fed into the classification model to generate prediction results along with corresponding confidence scores. To obtain a robust final prediction and mitigate any confusion caused by repetitive or similar-sounding keywords, we accumulate the confidence scores of each class across all segments. The class with the highest total confidence score is selected as the final output.
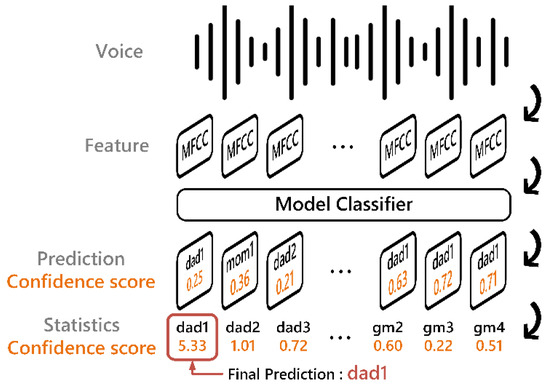
Figure 8.
Post-processing flowchart.
2.5. Ethical Considerations
The proposed speech recognition method, utilizing XTTS for synthetic speech generation and targeting profanity recognition, raises ethical concerns due to its potential for misuse and privacy implications. The ability of XTTS to generate highly realistic synthetic speech could enable voice-based fraud or deceptive audio content, potentially compromising personal privacy and societal trust. To mitigate these risks, we advocate for robust ethical safeguards, including limiting synthetic speech data to specific research purposes, implementing secure access controls, and developing advanced real-versus-synthetic speech detection techniques, as demonstrated in this study’s high-accuracy identification approach. Additionally, profanity recognition, intended to monitor verbal aggression in contexts such as school safety, may raise concerns about privacy or inappropriate surveillance. To address this, its deployment must be restricted to clearly defined scenarios, with transparency ensured through user notification and explicit consent obtained prior to implementation. By integrating real and synthetic speech data and achieving robust real-versus-synthetic speech classification, this study contributes to ethical safeguards for secure speech applications, balancing technological advancements with responsible use.
3. Experimental Results and Comparisons of Various Algorithms
3.1. Real Human Speech Dataset (RHS Dataset)
The dataset used in this study is identical to the Minnan speech corpus employed in the verbal insult detection system [4]. This corpus was recorded by 70 participants aged 18 to 30 in a quiet environment. The audio files are in mono format, with a sampling rate of 16 kHz, with each segment intended to last 1.5 s and saved in WAV format. The dataset comprises 1120 audio samples in total, encompassing 16 common Minnan insult phrases, as listed in Table 3. This study further subdivides them into 16 categories, resulting in 70 speech samples per category. The dataset is publicly accessible at https://shorturl.at/2l8Pq (accessed on 17 June 2025).

Table 3.
List of profanities and insult targets.
Figure 9 displays the audio file duration distribution, revealing that the durations of the insult phrases are consistently under 1.5 s, with a median duration of approximately 1.2 s across categories. The interquartile range (IQR) spans from 1.0 to 1.4 s, indicating that 50% of the samples fall within this range, while the maximum duration reaches 1.47 s, with minimal outliers. This uniformity in short durations supports the dataset’s consistency, confirming the reliability of the recorded insult phrases for model training.
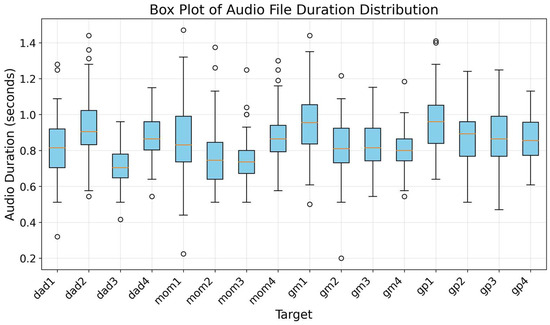
Figure 9.
Box plot of audio file duration distribution. The circles in the figure represent outliers with durations significantly shorter or longer than the majority.
3.2. Experimental Setup
Experiments with real human data as the test set were conducted using Python 3.8.11 with PyTorch 1.8.1 (a machine learning framework) for training and validation. The hardware setup included an Intel i7-13700 processor (Intel Corporation, 2200 Mission College Blvd., Santa Clara, CA, USA), 128 GB of RAM, and an NVIDIA RTX 4090 GPU (24 GB VRAM). Detailed training parameters are provided in Table 4. The loss function utilized was CrossEntropyLoss, widely adopted for classification tasks, with a batch size of eight to ensure stable gradient updates. The total number of training epochs was set to 150, with an initial learning rate (LR) of . A CosineAnnealingLR scheduler was employed to dynamically adjust the learning rate, improving model convergence efficiency.

Table 4.
Hyperparameter settings for experiments.
3.3. Performance Evaluation on RHS Dataset for the Proposed-I Algorithm
We conducted classification experiments using a pure RHS dataset [4], evaluating the impact of different training, validation, and test set ratios of 5:3:2, 6:2:2, and 7:1:2 on model performance under fixed test set conditions. This approach establishes a baseline performance for the dataset without any adjustments. The experimental results indicate that as the training set proportion increases, the model’s average accuracy rises, peaking at 61.33%, while the average loss decreases correspondingly, reaching a minimum of 2.258. Detailed results are presented in Table 5.

Table 5.
Dataset ratio of RHS for the Proposed-I algorithm.
3.4. Performance Evaluation with Mixed Speech for the Proposed-I Algorithm
The test set in this section consists of a mixture of RHS and synthetic speech data, split into a 7:1:2 ratio for training, validation, and testing, respectively. This was paired with 5-fold cross-validation, where training and validation data accounted for 80%, and the test set comprised 20%, with swapping performed to assess model robustness. The results, presented in Figure 10, Figure 11 and Figure 12, indicate that the average test accuracy for segmented data reached 88.92%, with the average loss reduced to 1.9873. Following adjustments with the statistical mechanism, the overall average test accuracy further improved to 93.35%. From validation to testing, the statistical mechanism effectively mitigated classification errors due to lexical similarities between categories, significantly enhancing the model’s recognition accuracy. These results demonstrate the classification model’s high efficiency and robust performance in a mixed-data environment.
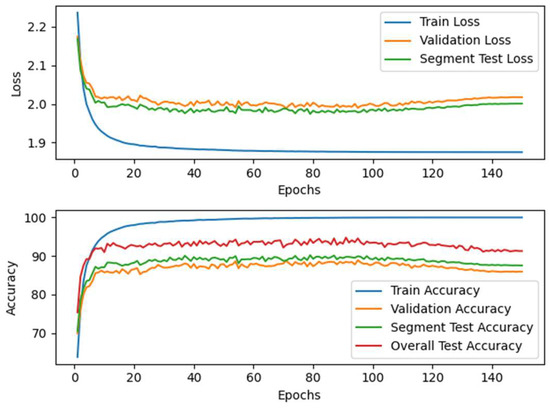
Figure 10.
Loss and accuracy curves of the Proposed-I model on the mixed speech dataset. The model exhibits stable convergence and robust performance when trained on real and synthetic data.
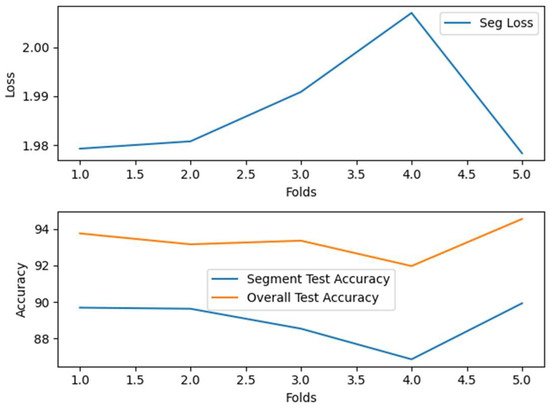
Figure 11.
Average loss and accuracy of the Proposed-I model in cross-validation on the mixed speech dataset. The results indicate consistently high accuracy across folds, confirming the model’s stable generalization capability.
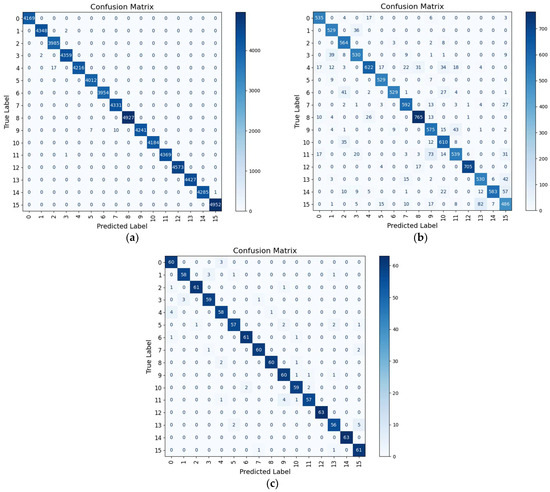
Figure 12.
Confusion matrix analysis of Proposed-I on the mixed speech dataset: (a) Training, (b) validation, and (c) test. Most categories achieve high accuracy with limited confusion, demonstrating effective keyword recognition on real–synthetic data.
3.5. Performance Evaluation with RHS Dataset for the Proposed-I Algorithm
The test set in this study comprises entirely real human speech (RHS). We augmented the RHS training dataset with synthetic speech data at a 5:3:2 ratio for training, validation, and testing, applying data augmentation with enhancement multipliers ranging from 1× to 4×. The experimental results, presented in Table 6, show that increasing the amount of synthetic speech data improves the average accuracy from 58.18% to 62.50%, indicating that a moderate amount of synthetic data enhances classification performance. Building on the robust classification capabilities of the 7:1:2 real speech dataset, we expanded the enhancement multiplier range to 1×–11×. The results demonstrate that accuracy increases from 62.50% to a peak of 68.15% at a 10× multiplier, but declines to 65.17% at 11×, suggesting that excessive synthetic data may impair performance. Training times also rise, requiring 5 h at a 5× multiplier and 9.67 h at a 10× multiplier. Considering hardware constraints and accuracy trade-offs, we selected a 5× multiplier for subsequent experiments under the 7:1:2 configuration, achieving significant accuracy gains while maintaining model stability and computational efficiency for practical applications.

Table 6.
Selection of real to synthetic speech ratios for Proposed-I.
To further validate the selection of XTTS [6] as the synthetic speech generation tool, we conducted a comparative analysis with two other text-to-speech (TTS) methods, Fish-Speech [7] and OpenVoice [5], evaluating their performance across various test set ratios. The results, detailed in Table 7, consistently show XTTS outperforming both Fish-Speech and OpenVoice. XTTS achieves the highest average test accuracy of 66.97%, surpassing Fish-Speech’s 57.89% and OpenVoice’s 61.61% across all tested ratios. This consistent superiority highlights XTTS’s ability to generate high-quality synthetic speech that closely mimics RHS, thereby boosting the model’s classification performance when integrated with real speech data. Consequently, XTTS was selected as the primary TTS method for data augmentation in this study to maximize recognition effectiveness.

Table 7.
Comparison of TTS methods on test set average accuracy for Proposed-I.
3.6. Evaluation Metrics
To comprehensively assess the classification performance of the model, this study adopts the F1 Score, Area Under the Receiver Operating Characteristic Curve (AUROC), and mean Average Precision (mAP) as the primary evaluation metrics. The metrics are described in the following sections.
In classification tasks, model predictions can be categorized into four outcomes: True Positive (TP), True Negative (TN), False Positive (FP), and False Negative (FN). Based on these fundamental measures, we calculate Precision, Recall, and F1 Score. Precision quantifies the proportion of samples predicted as positive that are actually positive, while Recall measures the proportion of actual positive samples correctly identified by the model. The formulas for these metrics are provided in (5) and (6).
There is typically a trade-off between Precision and Recall. For instance, in medical diagnosis applications, Recall is prioritized, whereas in spam email classification, Precision is of greater concern. To balance these two metrics comprehensively, we employ the F1 Score, calculated as shown in (7). The F1 Score ranges between 0 and 1, with higher values indicating a better balance between Precision and Recall.
AUROC evaluates the model’s ability to distinguish between classes, reflecting its effectiveness in classification tasks. The Receiver Operating Characteristic (ROC) curve, which plots the True Positive Rate (TPR) (6) against the False Positive Rate (FPR) (8), is used to compute the area under the curve. The Area Under the ROC Curve (AUROC) is typically calculated using numerical methods, such as the trapezoidal rule, which approximates the area by summing the areas of trapezoids formed between consecutive points and on the ROC curve. The formula for this approximation is given in (9), where n is the number of points on the ROC curve. An AUROC value closer to 1 indicates superior keyword discrimination capability, while a value near 0.5 suggests that the model’s discriminative performance is comparable to random guessing.
mAP serves as an evaluation metric in multi-class classification problems, commonly applied to object detection and classification models. It is calculated by integrating Precision across different Recall levels, as shown in (10) and (11). The mAP is then derived by averaging the Average Precision (AP) across all categories . A higher mAP value indicates better predictive performance across all classes.
3.7. Sliding Window and Confidence Score Statistics Integration
The test set in this section consists purely of RHS. We employed 8-fold cross-validation [18] and, to maintain consistency with the baseline established in prior results, utilized the swapping method depicted in Figure 13 to ensure that the test set aligned with that used in previous experiments. Consequently, the cross-validation results are derived from the remaining 70% training set and 10% validation set.
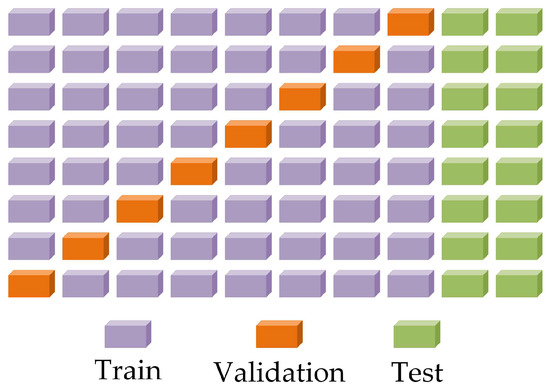
Figure 13.
Cross-validation diagram.
After optimizing dataset ratios with synthetic speech data, the model’s accuracy significantly improved. We further analyzed performance using sliding window and confidence score statistical mechanisms alongside cross-validation. As shown in Figure 14, the average test accuracy for segmented data reached 76.46%, with a mean loss of 2.1114, improving to 80.36% after applying the confidence score mechanism. Figure 14 demonstrates that the post-adjustment sequence accuracy significantly surpasses the segmented accuracy, indicating the effective correction of local classification errors. Additionally, Figure 15 shows that the confidence score mechanism enhances accuracy across all cross-validation folds, enriching feature data and significantly improving the model’s generalization and classification accuracy.
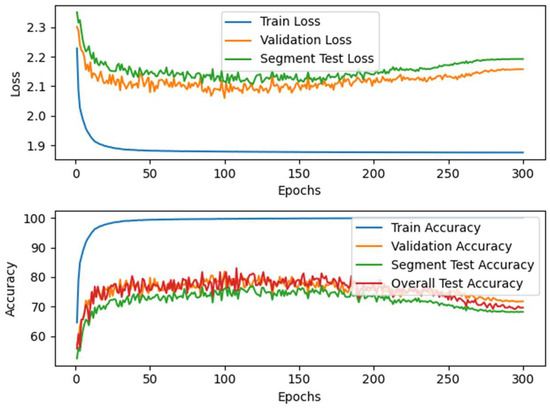
Figure 14.
Loss and accuracy curves of Proposed-I. Results show improved accuracy through the integration of a confidence score mechanism, validating its effectiveness in error correction.
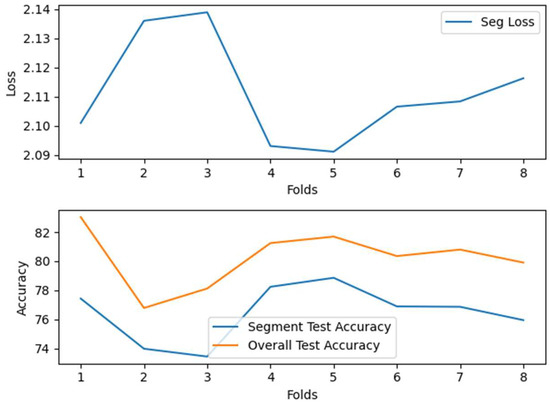
Figure 15.
Average loss and accuracy of Proposed-I during cross-validation. The model achieves consistent accuracy improvements across folds, indicating robustness against lexical overlap.
We evaluated the classification performance of the Propose-I model using a confusion matrix and AUROC curves. As shown in Figure 16, the training set’s performance aligns with the mixed dataset results reported earlier, while the validation and test sets, comprising only RHS, exhibit slightly lower accuracy due to differences between synthetic and real speech. This use of RHS for validation and testing enhances the model’s practical applicability. The confusion matrix reveals near-zero classification errors for categories 5, 10, and 12, indicating strong discriminative ability. Additionally, Figure 17 presents AUROC curves, with most categories achieving AUC scores near 1.00, confirming the model’s robust stability across classification thresholds.
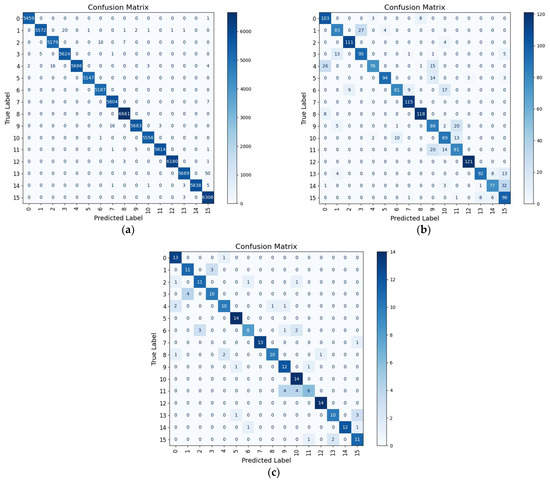
Figure 16.
Confusion matrix analysis of Proposed-I: (a) Training, (b) validation, and (c) test. Several categories exhibit near perfect classification with minimal confusion, indicating stable recognition performance on real speech.
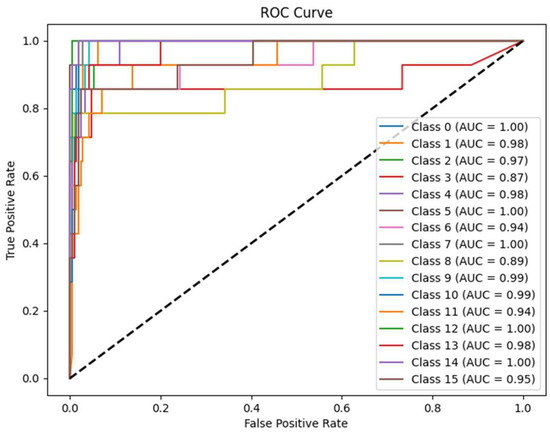
Figure 17.
AUROC analysis of Proposed-I on the test set. Most categories reach near perfect AUC values, demonstrating the model’s stable discrimination even with overlapping features. The dotted line represents the baseline; the closer the solid line is to the dotted line, the poorer the classification performance.
However, the confusion matrix reveals higher misclassification rates for categories 6 and 11, likely due to feature similarities between these classes, leading to confusion in hard classification outcomes. Additionally, the AUROC curves indicate relatively lower AUC scores for categories 3 and 8, suggesting significant feature overlap with other categories, which weakens the model’s discriminative power at different thresholds.
Overall, the Propose-I model performs exceptionally well across most categories, effectively distinguishing between real and synthetic speech, with perfect classification achieved in certain categories. Despite minor confusion in a few categories, these results strongly affirm the model’s robust speech classification capabilities.
3.8. Cross-Dataset Performance Evaluation for the Proposed-I Algorithm
To validate the robustness and effectiveness of the proposed XTTS-based data augmentation method, as well as its generalization capability across diverse languages, we conducted extensive performance evaluations on multiple datasets, including the Qualcomm English dataset (4 classes) [19], the ASR-SCKwsptSC Mandarin dataset (18 classes) [20], the RHS Minnan dataset (16 classes) [4], the Arabic Speech Command dataset (16 classes) [21], and the Google Speech Command dataset (16 classes) [10]. All datasets consisted of real speech samples and were standardized to 70 samples per class, aligning with the benchmark of the RHS dataset used in this study. The proposed augmentation method significantly improved model accuracy across these linguistically diverse datasets, demonstrating consistent and superior performance, as detailed in Table 8. These findings not only highlight the robustness and cross-lingual generalization capability of the proposed method, but also confirm its efficiency and applicability in low-resource speech recognition scenarios while maintaining computational efficiency.

Table 8.
Accuracy improvements with XTTS-based augmentation across datasets.
3.9. Performance Evaluation on RHS Dataset for the Proposed-II Algorithm
This study aims to enhance the performance of speech keyword detection. Beyond proposing a CNN-based architecture combined with data augmentation, preprocessing, and sliding window techniques resulting in significant accuracy improvements, we further developed a hybrid CNN-Transformer model. The Proposed-II model leverages CNNs to extract local information from speech features, followed by a Transformer module to capture long-range dependencies between features, markedly improving keyword recognition capabilities. With these enhancements, the model’s accuracy increased from 80.36% in Proposed-I to 88.90%. Concurrently, the parameter count decreased substantially from 201,363 to 118,516, and the multiply–accumulate operations (MACs) dropped from 80.27 M to 44.81 M, significantly reducing computational complexity.
As shown in Figure 18, the statistical mechanism significantly improves the Proposed-I model’s accuracy, consistent with prior results, confirming its effectiveness in enhancing overall performance. Figure 19 demonstrates that the Proposed-II model achieves greater stability across cross-validation folds, consistently outperforming traditional CNNs in accuracy. This indicates that incorporating long-range dependency modeling effectively reduces performance fluctuations due to data distribution variations, markedly improving model generalization. The confusion matrix in Figure 20 and the AUROC curves in Figure 21 reveal that Proposed-II achieves substantial accuracy improvements in both fragment and full-signal evaluations during validation and testing. Most categories attain AUC scores near 1.00, indicating robust class differentiation across thresholds. Compared to traditional CNNs, CNN-Transformer significantly reduces the misclassification rates for categories 6 and 11 and shows notable improvements in AUC scores for categories 3 and 8, underscoring its superior capability in addressing feature overlap challenges.
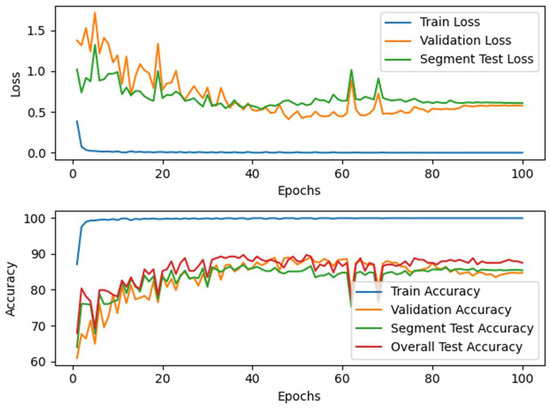
Figure 18.
Loss and accuracy curves of Proposed-II. The model shows stable convergence and achieves higher accuracy than Proposed-I, highlighting the advantages of the CNN-Transformer architecture.
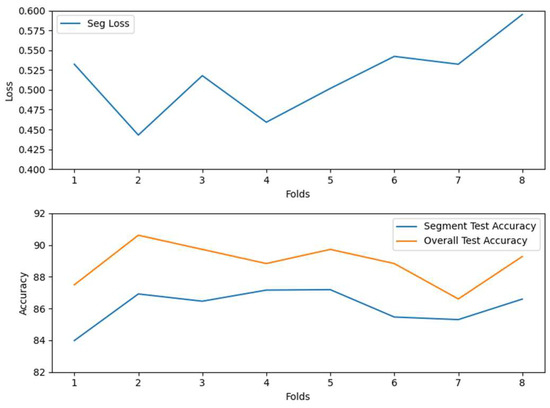
Figure 19.
Average loss and accuracy of Proposed-II during cross-validation. The results demonstrate stable performance and higher accuracy than the CNN baseline, validating the model’s enhanced generalization ability.
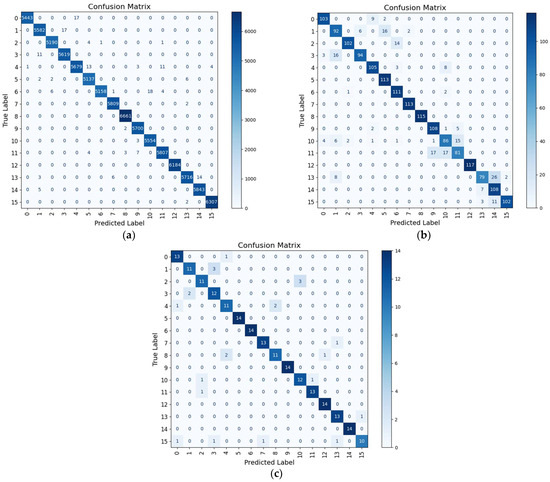
Figure 20.
Confusion matrix analysis of Proposed-II: (a) Training, (b) validation, and (c) test. The model reduces misclassifications compared to Proposed-I, achieving perfect recognition in key test categories.
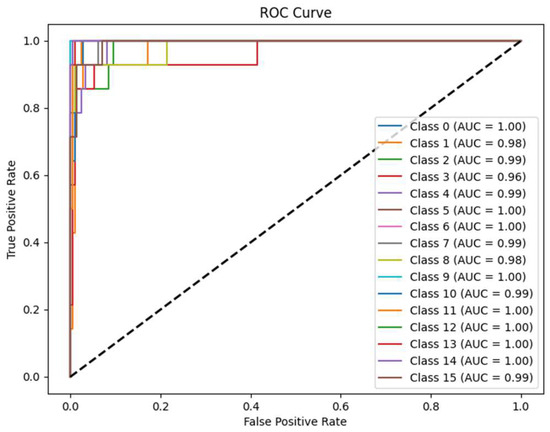
Figure 21.
AUROC analysis of Proposed-II. The model achieves near 1.00 AUC in most categories, outperforming Proposed-I particularly in overlapping classes, confirming its superior discriminative capability. The dotted line represents the baseline; the closer the solid line is to the dotted line, the poorer the classification performance.
To comprehensively evaluate the performance of the Proposed-II model, we systematically compared it with other methods and analyzed their respective strengths and weaknesses. First, Librosa data augmentation combined with the HMM classification method [22], proposed in 2024, excels in its extremely low computational complexity, making it ideal for resource-constrained devices while achieving modest accuracy improvements. Next, DCGAN data augmentation paired with a CNN-RNN hybrid classification model [23], proposed in 2022, improved accuracy by approximately 9.03% compared to the Librosa-HMM method [22]. However, this comes at the cost of significantly increased computational complexity, reflecting a trade-off between performance and resource demands. In 2021, a method [24] utilizing TTS and Librosa for data augmentation, combined with Wav2Vec 2.0 and CNN for feature extraction and classification, achieved an accuracy of 87.5% while substantially reducing the parameter count and MACs compared to the DCGAN-CNN-RNN method [23]. This approach enables high-accuracy keyword spotting on devices with sufficient computational resources. The SpecAugment data augmentation with LAS classification method [25], proposed in 2019, reduced MACs by approximately 98.47% compared to Wav2KWS while achieving an accuracy of 82.43%, making it well-suited for platforms with limited computational resources. Finally, the augmentation architecture proposed by Rezaul, K.M. et al. in 2024 [26] closely resembles the performance of our Proposed-I model. In comparison, the Proposed-II model achieves an 8.49% accuracy improvement on the RHS test set, with a parameter reduction of approximately 98.81% and a MAC reduction of about 98.97%, demonstrating exceptional resource efficiency and performance. Table 9 provides a comprehensive comparison of the aforementioned methods, clearly highlighting the Proposed-II model’s significant advantages in accuracy, parameter count, and MACs, further emphasizing its balance between resource efficiency and performance. In summary, the Proposed-II architecture, with its lightweight design and high accuracy on the RHS test set, is particularly well-suited for deployment in low-end devices, showcasing significant practical value and technical superiority.

Table 9.
Performance comparison of various algorithms.
3.10. Real vs. Synthetic Speech Identification
Previous experiments revealed that an excessively high proportion of synthetic speech data degrades model performance on the RHS dataset. To investigate this phenomenon, we employed Proposed-I and Proposed-II, without statistical mechanisms, on a combined RHS and synthetic speech dataset, with labels redefined as “real” or “synthetic” to learn feature distinctions. As shown in Figure 22, both Proposed-I and Proposed-II exhibit rapid convergence and low loss. Proposed-I achieved 97.54% accuracy on the mixed test set, with its confusion matrix (Figure 23) indicating consistent classification across training, validation, and testing. Proposed-II outperformed it, achieving 98.66% accuracy, with its confusion matrix (Figure 24) showing superior consistency. The AUROC curves indicate consistent result distribution due to the absence of statistical mechanisms. Proposed-II performed even better, achieving an accuracy of 98.66%, with its confusion matrix being consistent with previous experiments and superior to Proposed-I in showing results. The AUROC curves in Figure 25 confirm both models’ exceptional ability to distinguish real from synthetic speech, demonstrating significant feature-level differences. These results suggest that excessive synthetic speech impairs real speech identification accuracy. This approach validates real–synthetic speech distinguishability and supports applications like detecting fraudulent impersonation in voice authentication systems, enhancing security and reliability.
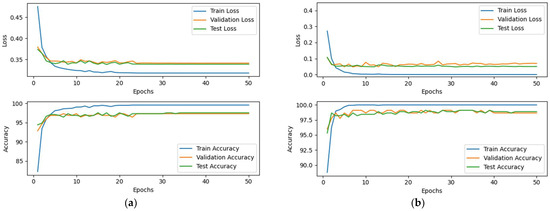
Figure 22.
Loss and accuracy of (a) Proposed-I and (b) Proposed-II in real vs. synthetic speech identification. Both models demonstrate rapid convergence and low loss, confirming their efficiency in distinguishing between real and synthetic speech.

Figure 23.
Confusion matrix of Proposed-I in real vs. synthetic speech identification: (a) Training, (b) validation, and (c) test. The model achieves a stable classification distribution, with 97.54% accuracy on the mixed test set, confirming identification consistency.

Figure 24.
Confusion matrix of Proposed-II in real vs. synthetic speech identification: (a) Training, (b) validation, and (c) test. The model exhibits fewer misclassifications and achieves 98.66% accuracy, outperforming Proposed-I.
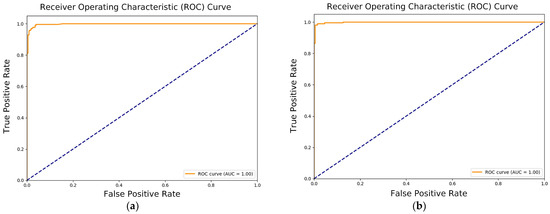
Figure 25.
AUROC curves of (a) Proposed-I and (b) Proposed-II in real vs. synthetic speech identification. Both models achieve near-perfect AUC scores, confirming strong capability in distinguishing real from synthetic speech. The dotted line represents the baseline; the closer the solid line is to the dotted line, the poorer the classification performance.
4. Conclusions
This study addresses the challenges of extremely small-sample, multi-class speech recognition scenarios by proposing a data augmentation method based on XTTS speech generation to enhance the accuracy of keyword recognition systems. By integrating real and synthetic speech, we effectively overcame data scarcity issues and further improved recognition performance using a CNN model combined with a sliding window mechanism. Experimental results show that, starting with a mere 1120 samples, the proposed approach expands the dataset multiple fold, increasing recognition accuracy by 25.01% to 80.36%. In mixed speech data tests, accuracy peaks at 93.35%. To further enhance performance, we introduced a CNN-Transformer hybrid model, which leverages CNN’s local feature extraction and Transformer’s long-range dependency modeling, elevating accuracy to 88.90% while significantly reducing computational complexity. Additionally, we confirmed distinct feature differences between synthetic and real speech, achieving a 97.54% accuracy in real vs. synthetic speech identification tests, highlighting the method’s potential in speech security and anti-spoofing applications. This research not only offers a practical solution for low-resource speech recognition, but also validates the feasibility and effectiveness of AI-generated speech in data augmentation. The incorporation of the CNN-Transformer architecture further demonstrates its superiority in balancing accuracy and efficiency. Future studies could explore the effects of different languages and pronunciation variations, optimize synthetic speech quality to reduce reliance on real human voices, and enhance the adaptability and robustness of recognition systems. Moreover, given its strong potential for speech security applications, such as detecting voice forgery and fraud, this method merits further development and validation.
Author Contributions
Conceptualization, S.-C.L.; Data curation, J.-K.T.; Funding acquisition, W.-K.T.; Investigation, Y.-C.Z. and S.-T.W.; Methodology, Y.-C.Z.; Project administration, W.-K.T.; Resources, S.-C.L. and J.-K.T.; Software, Y.-C.Z.; Validation, Y.-C.Z.; Writing—original draft, Y.-C.Z. and S.-T.W.; Writing—review and editing, S.-C.L., Y.-C.Z., S.-T.W., Y.-C.C. and Y.-H.H. All authors have read and agreed to the published version of the manuscript.
Funding
This research was funded by the National Science and Technology Council, Taiwan, grant number NSTC 113-2221-E-150-002, and the Smart Machinery and Intelligent Manufacturing Research Center, National Formosa University.
Data Availability Statement
The data presented in this study are openly available in Google Drive at https://shorturl.at/2l8Pq (accessed on 17 June 2025), reference number [4].
Conflicts of Interest
The authors declare no conflicts of interest. The funders had no role in the design of the study; in the collection, analyses, or interpretation of data; in the writing of the manuscript; or in the decision to publish the results.
Abbreviations
The following abbreviations are used in this manuscript:
| AP | Average Precision |
| AUROC | Area Under the Receiver Operating Characteristic Curve |
| CNN | Convolutional Neural Network |
| dB | Decibels |
| DCGAN | Deep Convolutional Generative Adversarial Network |
| DCT | Discrete Cosine Transform |
| FFT | Fast Fourier Transform |
| FN | False Negative |
| FP | False Positive |
| FPR | False Positive Rate |
| HMM | Hidden Markov Model |
| IQR | Interquartile Range |
| LAS | Listen, Attend, and Spell |
| MACs | Multiply–Accumulate Operations |
| mAP | mean Average Precision |
| MFCC | Mel-Frequency Cepstrum Coefficients |
| RHS | Real Human Speech |
| RMS | Root Mean Square |
| RNN | Recurrent Neural Network |
| ROC | Receiver Operating Characteristic |
| TN | True Negative |
| TP | True Positive |
| TPR | True Positive Rate |
| VAD | Voice Activity Detection |
| XTTS | XText-to-Speech |
References
- Bonet, D.; Cámbara, G.; López, F.; Gómez, P.; Segura, C.; Luque, J. Speech Enhancement for Wake-Up-Word Detection in Voice Assistants. arXiv 2021. [Google Scholar] [CrossRef]
- Supriya, N.; Surya, S.; Kiran, K.N. Voice Controlled Smart Home for Disabled. In Proceedings of the 2024 International Conference on Intelligent and Innovative Technologies in Computing, Electrical and Electronics (IITCEE), Bengaluru, India, 24–25 January 2024; pp. 1–4. [Google Scholar] [CrossRef]
- Alatawi, H.S.; Alhothali, A.M.; Moria, K.M. Detecting White Supremacist Hate Speech Using Domain Specific Word Embedding with Deep Learning and BERT. IEEE Access 2021, 9, 106363–106374. [Google Scholar] [CrossRef]
- Zhu, Y.C.; Hung, Y.H.; Chang, Y.C.; Tang, J.K.; Tsai, W.K.; Lai, S.C. Speech Abusive Language Detection System Using MFCC Speech Feature Extraction and Convolutional Neural Network. In Proceedings of the IEEE International Conference on Consumer Technology–Pacific 2025 (ICCT-Pacific 2025), Matsue, Japan, 29–31 March 2025. [Google Scholar] [CrossRef]
- Qin, Z.; Zhao, W.; Yu, X.; Sun, X. OpenVoice: Versatile Instant Voice Cloning. arXiv 2023, arXiv:2312.01479. [Google Scholar] [CrossRef]
- Casanova, E.; Davis, K.; Gölge, E.; Göknar, G.; Gulea, I.; Hart, L.; Aljafari, A.; Meyer, J.; Morais, R.; Olayemi, S.; et al. XTTS: A Massively Multilingual Zero-Shot Text-to-Speech Model 2024. arXiv 2024, arXiv:2406.04904. [Google Scholar]
- Liao, S.; Wang, Y.; Li, T.; Cheng, Y.; Zhang, R.; Zhou, R.; Xing, Y. Fish-Speech: Leveraging Large Language Models for Advanced Multilingual Text-to-Speech Synthesis 2024. arXiv 2024, arXiv:2411.01156. [Google Scholar]
- Wenger, E.; Bronckers, M.; Cianfarani, C.; Cryan, J.; Sha, A.; Zheng, H.; Zhao, B.Y. “Hello, It’s Me”: Deep Learning-Based Speech Synthesis Attacks in the Real World. In Proceedings of the ACM Conference on Computer and Communications Security, Virtual, 15–19 November 2021; pp. 235–251. [Google Scholar] [CrossRef]
- Panayotov, V.; Chen, G.; Povey, D.; Khudanpur, S. Librispeech: An ASR Corpus Based on Public Domain Audio Books. In Proceedings of the 2015 IEEE International Conference on Acoustics, Speech and Signal Processing (ICASSP), Brisbane, Australia, 19–24 April 2015; pp. 5206–5210. [Google Scholar] [CrossRef]
- Warden, P. Speech Commands: A Dataset for Limited-Vocabulary Speech Recognition. arXiv 2018, arXiv:1804.03209. [Google Scholar] [CrossRef]
- Bu, H.; Du, J.; Na, X.; Wu, B.; Zheng, H. AISHELL-1: An Open-Source Mandarin Speech Corpus and a Speech Recognition Baseline. In Proceedings of the 2017 20th Conference of the Oriental Chapter of International Committee for Coordination and Standardization of Speech Databases and Assessment Techniques, O-COCOSDA 2017, Seoul, Republic of Korea, 1–3 November 2017; pp. 1–5. [Google Scholar] [CrossRef]
- Robert, J. Pydub. Available online: https://github.com/jiaaro/pydub (accessed on 14 January 2025).
- McFee, B.; Raffel, C.; Liang, D.; Ellis, D.; Mcvicar, M.; Battenberg, E.; Nieto, O. Librosa: Audio and Music Signal Analysis in Python. In Proceedings of the Python in Science Conference, Austin, TX, USA, 6–12 July 2015; pp. 18–24. [Google Scholar] [CrossRef]
- Shi, Y.; Bu, H.; Xu, X.; Zhang, S.; Li, M. AISHELL-3: A Multi-Speaker Mandarin TTS Corpus and the Baselines 2021. arXiv 2020, arXiv:2010.11567. [Google Scholar]
- Sharma, G.; Umapathy, K.; Krishnan, S. Trends in Audio Signal Feature Extraction Methods. Appl. Acoust. 2020, 158, 107020. [Google Scholar] [CrossRef]
- EBU. Tech 3341 Loudness Metering: “Ebu Mode” Metering to Supplement EBU R 128 Loudness Normalization; EBU: Geneva, Switzerland, 2023. [Google Scholar]
- Wiseman, D. Py-Webrtcvad. Available online: https://github.com/wiseman/py-webrtcvad (accessed on 15 January 2025).
- Raschka, S. Model Evaluation, Model Selection, and Algorithm Selection in Machine Learning. arXiv 2018, arXiv:1811.12808. [Google Scholar] [CrossRef]
- Kim, B.; Lee, M.; Lee, J.; Kim, Y.; Hwang, K. Query-by-Example on-Device Keyword Spotting. In Proceedings of the 2019 IEEE Automatic Speech Recognition and Understanding Workshop, ASRU 2019—Proceedings, Singapore, 14–18 December 2019; pp. 532–538. [Google Scholar] [CrossRef]
- ASR-SCKwsptSC: A Scripted Chinese Keyword-Spotting Speech Corpus—MagicHub. Available online: https://magichub.com/datasets/mandarin-chinese-scripted-speech-corpus-keyword-spotting-2/ (accessed on 15 June 2025).
- Ghandoura, A.; Hjabo, F.; Al Dakkak, O. Building and Benchmarking an Arabic Speech Commands Dataset for Small-Footprint Keyword Spotting. Eng. Appl. Artif. Intell. 2021, 102, 104267. [Google Scholar] [CrossRef]
- Galić, J.; Marković, B.; Grozdić, Đ.; Popović, B.; Šajić, S. Whispered Speech Recognition Based on Audio Data Augmentation and Inverse Filtering. Appl. Sci. 2024, 14, 8223. [Google Scholar] [CrossRef]
- Bahmei, B.; Birmingham, E.; Arzanpour, S. CNN-RNN and Data Augmentation Using Deep Convolutional Generative Adversarial Network for Environmental Sound Classification. IEEE Signal Process. Lett. 2022, 29, 682–686. [Google Scholar] [CrossRef]
- Seo, D.; Oh, H.S.; Jung, Y. Wav2KWS: Transfer Learning from Speech Representations for Keyword Spotting. IEEE Access 2021, 9, 80682–80691. [Google Scholar] [CrossRef]
- Park, D.S.; Chan, W.; Zhang, Y.; Chiu, C.-C.; Zoph, B.; Cubuk, E.D.; Le, Q.V. SpecAugment: A Simple Data Augmentation Method for Automatic Speech Recognition. In Proceedings of the Annual Conference of the International Speech Communication Association, INTERSPEECH 2019, Graz, Austria, 15–19 September 2019; pp. 2613–2617. [Google Scholar] [CrossRef]
- Rezaul, K.M.; Jewel, M.; Islam, M.S.; Siddiquee, K.N.e.A.; Barua, N.; Rahman, M.A.; Shan-A-Khuda, M.; Sulaiman, R.B.; Shaikh, M.S.I.; Hamim, M.A.; et al. Enhancing Audio Classification Through MFCC Feature Extraction and Data Augmentation with CNN and RNN Models. Int. J. Adv. Comput. Sci. Appl. 2024, 15, 37–53. [Google Scholar] [CrossRef]
Disclaimer/Publisher’s Note: The statements, opinions and data contained in all publications are solely those of the individual author(s) and contributor(s) and not of MDPI and/or the editor(s). MDPI and/or the editor(s) disclaim responsibility for any injury to people or property resulting from any ideas, methods, instructions or products referred to in the content. |
© 2025 by the authors. Published by MDPI on behalf of the International Institute of Knowledge Innovation and Invention. Licensee MDPI, Basel, Switzerland. This article is an open access article distributed under the terms and conditions of the Creative Commons Attribution (CC BY) license (https://creativecommons.org/licenses/by/4.0/).