Article

Complexity of Supply Chains Using Shannon Entropy: Strategic Relationship with Competitive Priorities

by
Miguel Afonso Sellitto
1,*,
Ismael Cristofer Baierle
2 and
Marta Rinaldi
3
1
Production and Systems Graduate Program, University of Vale do Rio dos Sinos, Avenida Unisinos 950, São Leopoldo 93022-180, Brazil
2
Agroindustrial Systems and Processes Graduate Program, Universidade Federal de Rio Grande, FURG, Cel. Francisco Borges de Lima 3005, Santo Antônio da Patrulha 95500-000, Brazil
3
Dipartimento di Ingegneria Industriale, Università degli Studi di Salerno, Via Giovanni Paolo II, 84084 Fisciano, Italy
*
Author to whom correspondence should be addressed.
Appl. Syst. Innov. 2025, 8(4), 105; https://doi.org/10.3390/asi8040105
Submission received: 2 July 2025 / Revised: 16 July 2025 / Accepted: 25 July 2025 / Published: 29 July 2025

Abstract

Entropy is a foundational concept across scientific domains, playing a role in understanding disorder, randomness, and uncertainty within systems. This study applies Shannon’s entropy in information theory to evaluate and manage complexity in industrial supply chain management. The purpose of the study is to propose a quantitative modeling method, employing Shannon’s entropy model as a proxy to assess the complexity in SCs. The underlying assumption is that information entropy serves as a proxy for the complexity of the SC. The research method is quantitative modeling, which is applied to four focal companies from the agrifood and metalworking industries in Southern Brazil. The results showed that companies prioritizing cost and quality exhibit lower complexity compared to those emphasizing flexibility and dependability. Additionally, information flows related to specially engineered products and deliveries show significant differences in average entropies, indicating that organizational complexities vary according to competitive priorities. The implications of this suggest that a focus on cost and quality in SCM may lead to lower complexity, in opposition to a focus on flexibility and dependability, influencing strategic decision making in industrial contexts. This research introduces the novel application of information entropy to assess and control complexity within industrial SCs. Future studies can explore and validate these insights, contributing to the evolving field of supply chain management.

1. Introduction

Entropy serves as a foundational concept in various scientific domains, encompassing fields such as physics, chemistry, computer science, or information theory [1]. In physics, entropy functions as a metric for the degree of disorder or randomness within a system. The second law of thermodynamics posits that the entropy of an isolated system tends to increase over time, ultimately reaching a state of maximal disorder. In chemistry, entropy finds relevance in its association with the distribution of energy among the microscopic states of particles within a system. During a chemical reaction, alterations in entropy can signify a system’s inclination towards either a more disorganized or a more ordered state. In essence, entropy can be seen as intricately linked to the dispersion of energy within a given system [2].
Moving to computer science, particularly information theory, entropy extends beyond its thermodynamic origins, serving as a measure of uncertainty or unpredictability related to a source of information [3]. For instance, measuring the uncertainty of a neural network output is relevant in AI applications such as deep learning-based image classification. In this context, the entropy of the output can serve as a reliable metric for gauging the level of uncertainty in the system [4].
When considering a sequence of symbols in a message, an increase in entropy corresponds to a higher level of unexpectedness for the subsequent symbol. Beyond apparent disorder, entropy reveals the inherent uncertainty in a message represented by a sequence of data, essentially acting as a measure of outcome likelihoods for a random event. Claude Shannon’s seminal 1948 article [5] introduced information entropy, a metric designed to quantify the average information content within a message. A core tenet of Shannon’s theory posits a direct correlation between uncertainty and information: the greater the uncertainty surrounding an event’s outcome, such as the next symbol in a message, the more information it conveys when it occurs [6]. In short, Shannon entropy assigns a value based on the probability of each message outcome. Less probable outcomes contribute more significantly to the overall entropy, as their unexpected nature translates to more informational content [7].
In industrial management, a significant challenge arises from the inherent complexity that emerges when multiple companies collaborate to form a supply chain (SC). At least one prior, recent investigation [8] posits that SCs can be regarded as complex adaptive systems (CASs), often evolving autonomously and independent of a deliberate creation process. Like other types of CASs, it proves beneficial to assess and manage the level of complexity that an SC accrues during its evolution [9], as demonstrated by previous related studies. Among many others, ref. [10] analyzed the underpinning structure of SCs, refs. [11,12] identified drivers that may boost the complexity level in SCs, and refs. [13,14] examined how complexity can influence business performance in SCs, while ref. [15] studied a dedicated tool conceived to measure complexity in SCs. Finally, ref. [16] presents an entropy-based algorithm tailored to measure complexity in SCs. These last two approaches both have a similar gap, which this study aims to bridge.
Each company within the collaboration scenario depicted by the SC pursues distinct objectives, spanning areas such as raw material supply, engineering services, transportation, warehousing, manufacturing, and distribution. Despite having individual goals, they all have a shared overarching objective: collectively meeting the requirements of a specific customer type [17]. Beyond their unique operational strategies tailored to meet local objectives, companies operating within an SC must adhere to a meta-strategy that governs the entire system. This meta-strategy outlines global objectives, encompassing the collective goals of all members involved in activities [18]. The success of an SC operation hinges not only on each company achieving its partial or local objectives but on the attainment of global objectives that entail satisfying customer requirements [19]. In short, only the achievement of global objectives ensures the overall success of the SC. This study focuses on applying entropy, as conceived in information theory, to the realm of administrative sciences, more specifically, supply chain management (SCM). It employs Shannon entropy to assess the required information exchanged between agents during SCM. The underlying assumption is that information entropy serves as a proxy measure for the complexity within the SC.
Complexity is not the same as complicatedness [20]. In scientific realms, complexity refers to the inherent nature of a system composed of many interconnected and mutually dependent parts, usually exhibiting emergent, non-linear properties that cannot be explained by individual, isolated components [21]. Replacing even a single component yields sensible variation in outcomes, as the replacement influences internal mutually dependent relationships. Complicatedness refers to a system that is difficult to understand or deal with due to having a high number of parts, but these parts are mutually independent [22]. Replacing one part with another that is similar does not change outcomes. In essence, complexity is inherent to nature, while complicatedness arises from the number of parts. For example, an aircraft engine that entails thousands of parts may be complicated but not complex. A soccer team, even entailing only eleven agents, may be complex but is not complicated. In short, complex systems may show emergent behavior difficult to predict and control, while complicated systems, even when difficult to handle, can be predicted and linearly escalated [23].
Given the uncertainties in SCM, it becomes important to not only assess but also manage the inherent complexity that arises from SC dynamics [24]. Controlling complexity does not solely imply reduction; in some instances, it may imply an increase. For example, in stable environments, reducing complexity can translate to cost reduction, making the SC more efficient. In unstable scenarios, in which innovation and variety are essential, an increase in complexity is often required, making the SC more flexible [25].
This study employs a measure of entropy that connects the concepts of uncertainty and complexity. According to this measure, as a system becomes more uncertain, it also becomes more complex [11]. To describe and monitor a complex system, it is necessary to access a range of information to manage unpredictability, underscoring a fundamental relationship. The greater the complexity, the more information is required to understand the system’s behavior and anticipate possible outcomes presented by complex systems due to their unpredictable nature.
A search on Scopus from 2020 to 2025 using the keywords “Complexity” AND “Supply Chains” yielded 4468 results. In contrast, the search for “Complexity measurement” AND “Supply Chain” returned only three results, and there was just one article found for “Complexity” AND “Supply Chains” AND “Shannon entropy”. This indicates that while the topic of complexity in SCs is significant, there are gaps in the recent, high-impact literature concerning the measurement of complexity and, specifically, the application of Shannon entropy.
Therefore, the purpose of the study is to propose a quantitative modeling method, employing Shannon’s entropy model as a proxy to assess the complexity in SCs. The research method is quantitative modeling. The core principle is to use the theoretical framework of Shannon’s entropy to quantify informational flow entropy as a proxy variable of complexity. The model measures the uncertainty in the flow of information permeating the SC. The underlying assumption is that the complexity of the SC is directly proportional to the amount of information required to manage it effectively [26]. The research subject includes four focal companies of an industrial SC, two from the agrifood industry and two from the metalworking industry, all located in Southern Brazil. This study contributes to SCM studies by encompassing four SC meta-strategies, four competitive priorities, and an entropy-based measure in a single study.
The subsequent sections are structured to provide a comprehensive review of SC complexity, delineate the methodology, present and discuss the results, and draw conclusions from the findings. This systematic approach ensures a thorough exploration and understanding of the intricate dynamics surrounding complexity in industrial SCs.

2. Background Literature

2.1. Complexity and Strategy in Industrial SCs

In industrial SCs, the central entity, often referred to as the focal company, typically is the manufacturing unit. This unit usually is involved in product design and specifying engineering services and has primacy in defining strategic goals and action plans [27]. An illustrative industry exemplifying such dynamics is the automotive sector, in which the car manufacturer usually has the strategic primacy [28].
Manufacturing companies within industrial SCs predominantly concentrate on competitive priorities [29]. These priorities encompass various aspects, such as cost-effectiveness, quality, flexibility, dependability, and innovation. A substantial body of literature has already been developed in this regard, delving into various competitive priorities [30]. Authors and studies have compiled comprehensive sets of priorities, which include subpriorities like environmental concerns or customer satisfaction (a subpriority of quality), lean production (a subpriority of cost-effectiveness), time-to-market and innovation (subpriorities of flexibility), and reliability or timeliness of deliveries (subpriorities of dependability) [31]. This study specifically concentrates on the four primitive competitive priorities outlined in the seminal study [32]: cost, quality, flexibility, and dependability. Cost reduction involves meeting customer requirements in a standardized and competitive market, in which lower prices typically prevail in competition. A focus on quality ensures adherence to standards and minimal variability in product parameters, relevant in standardized markets. Flexibility refers to the company’s capacity to swiftly adjust production parameters, including lot size, production mix, product features, fabrication processes, or delivery points, without compromising other priorities. Dependability signifies the assurance provided by the company to its customers, ensuring high performance in delivery parameters such as speed, reliability, integrity, and punctuality [31].
Industrial SCs also manage overall strategies. This relatively recent area of study has prompted scholars in the literature to highlight well-established meta-strategies within SCs, defined by keywords such as efficient, resilient, responsive, and agile [33]. In brief, an efficient SC is geared towards resolving familiar issues with well-established solutions, aligning with business environments characterized by stable demand and supply. It ensures cost reduction [34]. A resilient SC is designed to address familiar issues with innovative solutions, aligning with business environments in which the demand is stable and supply may be affected by huge or catastrophic situations, such as climate or geopolitical events. It ensures continuous high-quality standards [35]. A responsive SC tackles emerging challenges with well-established solutions, aligning with business environments marked by uncertain demand and stable supply. It ensures a high level of dependability for customers [36]. Lastly, an agile SC is tailored to confront emerging challenges with innovative solutions, aligning with business environments characterized by uncertainty in both demand. It ensures a high level of flexibility [37]. Figure 1, based on the framework proposed by [38], depicts the relationship between SC meta-strategies, competitive priorities, and the levels of uncertainty on both the demand and supply sides.
The meat industry is an example of an activity that relies on efficient SCs due to stable local markets and supply [39]. On the other hand, the renewable energy industry requires resilient SCs since the supply of renewable energy can be disrupted by seasonal and climate events despite high and stable local demand for energy [40]. The fast fashion industry necessitates responsive SCs due to the volatile nature of local demand for trendy clothing, even with a stable supply of raw materials [30]. Lastly, the technology industry typically requires agile SCs due to the highly unpredictable nature of both local markets and the supply of new, fast-evolving technological materials [41].
Several structural factors can contribute to the transformation of an SC from a simple and complicated system to a complex one [42]. This transformation hinges on the creation of interrelationships and mutual dependencies between factors such as, but not limited to the following: (i) The globalization of operations: when international and domestic operations become intertwined, the SC landscape becomes more intricate [43]; (ii) Product variety with shared components: extensive product variety, particularly when leveraging common parts across products, fosters mutual dependencies within the SC [44,45]; (iii) Technological integration: the implementation of shared control systems across diverse operations introduces a layer of complexity, as these systems become interdependent [46]; and (iv) Climate and geopolitical disruptions [47]: events like political instability or climate change have the potential to destabilize SCs. Regarding climate change, the Fukushima disaster in 2011 had a significant impact on Toyota’s operations. An earthquake, followed by a tsunami, damaged the company’s SC infrastructure, disrupting production and delivery schedules [48]. The crisis highlighted the importance of ensuring the resilience of the SC in the face of external disruptions, leading Toyota to re-evaluate its risk mitigation strategies. Ref. [49] explored the disruptions before and after the disaster, with a particular focus on the complex relationship between SC complexity and resilience.
The convergence of such multiple factors creates a more intricate and interdependent array, boosting complexity. Uncertainty emerges as a recurring element in both SC strategies and manufacturing priorities. This recognition underscores the need for adaptive and dynamic approaches within industrial SCM to effectively navigate the complexities posed by fluctuating demand and uncertain supply scenarios [47].

2.2. Related Studies

Previous studies have comprehensively approached the relationship involving strategy and complexity in SCs. Table 1 shows related studies and their specific contributions, positioning the current study at the forefront of the relevant literature.
The following analysis reflects the individual and comparative contributions of selected previous studies [9,10,11,12,13,14,15,16].
Study [9] addresses complexity in SCs by mitigating the ripple effects of disruptions. It aims for a balance among robustness, complexity, and efficiency rather than simply minimizing complexity. By strategically managing the number of suppliers, product differentiation, and interrelationships, this study posits that a balanced approach to complexity can lead to broader objectives, such as reduced vulnerability to disruptions. The complexity is examined in a systemic manner, considering its interactions with other performance objectives.
Study [10] introduces a theoretical development of an entropy-based metric to assess the structural complexity of SCs. It lays foundational theoretical and conceptual frameworks for quantifying complexity through information theory, particularly Shannon’s entropy. Prior to this work, complexity was primarily addressed qualitatively or with ad hoc metrics, and this study pioneers a quantitative approach that facilitates comparisons of complexity across different SCs.
Study [11] identifies empirical drivers of complexity within SCs through a methodological framework combining SAP-LAP and AHP, specifically within the context of mining equipment manufacturing in India. This study not only validates existing theoretical perspectives on complexity drivers but also offers empirical evidence and prioritization. By applying structured methodologies to a practical case study, it transitions the discourse on complexity drivers from abstraction to actionable insights, enabling managers in analogous contexts to pinpoint specific sources of complexity.
Study [12] conducts a comprehensive literature review outlining the various drivers of complexity present in SCs. It synthesizes existing knowledge related to operational, structural, and informational complexities, serving as an essential foundation for understanding what contributes to the intricate nature of SCs.
Study [13] illustrates the detrimental impact of complexity on specific SC objectives, such as reducing deforestation in the palm oil SC. It identifies key drivers and demonstrates how multiple actors, geographical factors, and flow dynamics can obstruct crucial sustainability commitments.
Study [14] explores the relationship between complexity and performance, establishing a methodological and empirical linkage between SC complexity and manufacturing operational performance. It quantifies how complexity, influenced by plant design and operational strategy, directly impacts manufacturing outcomes, thereby reinforcing the relevance of complexity management as a vital component of performance improvement.
Study [15] analyzes SC complexity through the lens of performance measurement and system dynamics. This research posits that examining performance indicators can enhance the understanding of complexity while acknowledging that complexity itself significantly influences performance. It identifies impactful complexity drivers that warrant further investigation.
Finally, study [16] expands upon the entropy-based approaches introduced in study [10] by developing an algorithm for assessing SC complexity that incorporates the notion of conditional (relative) complexity. This innovative methodology enables a more focused assessment of specific SC components, enhancing the applicability of complexity metrics for managerial diagnosis and decision making.
In summary, the selected studies can be categorized into four thematic areas:
  • Transition from a qualitative understanding of complexity [12] toward quantitative, metric-driven approaches [10,16];
  • Identification and analysis of complexity drivers [11,12,15];
  • Exploration of performance as a resultant outcome from complexity [13,14,15];
  • Conceptualization of complexity as a management variable rather than a static attribute [9], required to achieve other objectives, such as efficiency and agility.
Our study aligns with these thematic groups by offering a quantitative approach, identifying and quantifying drivers of complexity, investigating the performance–complexity relationship as a point for future exploration, and framing complexity as a variable to be optimized rather than merely reduced. Therefore, the research hypothesis is that it is possible to measure complexity in SCs by a quantitative model that identifies drivers and serves as a feedback loop to control complexity according to strategic concerns.

2.3. Employing Shannon’s Entropy as a Proxy to Complexity in SCs

Shannon entropy can be helpful for evaluating complexity by measuring the uncertainty or average unexpectedness associated with a random variable or, in the context of information theory, the amount of information contained in a message [50]. The flow of information exchanged between agents within an SC can be considered as a message, in which the necessity of the next symbol or lack thereof (a piece of managerial information) is the outcome of a random variable. Equation (1) gives Shannon’s entropy H(P), subject to Equation (2), for the discrete outcomes of a random variable that will be employed in this study. The resulting unit is expressed in bits [7].
H P = i = 1 n p i · l o g ( p i )
i = 1 n p i = 1  
where:
  • H(P) = entropy of a random variable;
  • pi is the probability of the ith outcome;
  • n is the number of possible outcomes.
The function H(P) serves as a measure to quantify the level of uncertainty inherent in a probability distribution. This study handles the amount of information necessary to coordinate the actions necessary to meet orders’ requirements within SCs. Higher values of H(P) indicate increased uncertainty or randomness in the distribution, while lower values suggest a higher degree of predictability and reduced uncertainty. This predictability reduces the need for coordination, leading to decreased internal complexity. In simpler terms, a higher H(P) means more information is required to dissipate uncertainty in fulfilling orders, whereas a lower H(P) implies the opposite. When dealing with systems exceeding a single dimension [51], such as the multiple agents actuating in an SC, Shannon’s entropy adopts the multidimensional form presented in Equation (3).
H P = k = 1 m i = 1 n p i k · l o g ( p i k )  
where:
  • n is the number of possible outcomes for each variable;
  • m is the number of elements in a given dimension of the problem;
  • are further dimensions of the problem;
  • pi…k are the probabilities of the possible outcomes for the variables.
For a continuous random variable X with a continuous probability distribution p(x), Equation (4) shows the Shannon entropy, subject to Equation (5) [52].
H X = p x · l o g p x d x  
p x = 1  
where:
  • x is the continuous random variable whose entropy is being calculated; and
  • p(x) is the probability density function of X.
A case of interest for this study occurs when n = 2, which is the so-called binary Shannon entropy, when the maximum entropy occurs when pi = 0.5. In this case, the Shannon entropy assumes the form shown in Equation (6). Figure 2 showcases the binary H(P), which is a concave function with a maximum at p = 0.5 and an outcome of Hbin(p) = 1 bit [7].
H b i n p = p · log p 1 p · log 1 p  
Entropy is inversely proportional to the diversity of possible outcomes. As the likelihood of a specific group of symbols occurring becomes dominant, the overall entropy of the system decreases [7]. After applying Shannon entropy to a random variable, it is useful to compare the result to the maximum possible entropy, which occurs when the probabilities are uniformly distributed. Taking the derivative of Equation (1) and setting it equal to zero yields the point of maximum entropy. Treating Shannon’s entropy as a relative or percentage rather than an absolute measurement is beneficial, as entropy is influenced not only by the probability distribution but also by the number of possible outcomes and symbols in the message. A system with numerous outcomes and symbols should exhibit a higher absolute value for entropy. Comparing the current entropy to the maximum entropy helps gauge the amount of missing information or the level of uncertainty present in the variable, regardless of the size of the string and the number of possible outcomes [53].

3. Materials and Methods

According to [54], complexity can stem from three distinct sources: materials, finances, and information flows. This study acknowledges that when both material and financial uncertainties arise, it can lead to unanticipated requirements for additional information exchange. Hence, by monitoring the information flow in relevant channels, mainly uncommon requests for further information, all three sources of complexity can be effectively managed. Therefore, the primary research assumption is that to evaluate complexity, the SCM must manage relevant flows of information to fulfill the manufacturing orders received by the focal company. A previous study [55] has established a list of twenty different types of information (j = 1, …, 20) that may or may not be necessary to complete a manufacturing order. Whether or not information j is required to fulfill an order is a binary output for a random event (i = 1 if the information is required; 0 otherwise). Future studies should consider intermediate levels in which information may be partially required (in this case, the outcome would be discrete, not binary). Moreover, the study has identified five relevant paths (k = 1, …, 5) that the 20 pieces of information can follow. For each SC, the study must compute one hundred probabilities of information j being required in path k to fulfill a manufacturing order. Equation (7) uses these probabilities to calculate Shannon entropy.
H P = k = 1 5 j = 1 20 i = 1 2 p i j k · l o g ( p i j k )
where:
  • 2 is the number of possible outcomes for a piece of information (required or not); 20 is the number of types of information of interest;
  • 5 is the number of agents considered in the SC;
  • pijk are the probabilities of the information jk (20 pieces and 5 agents) that is required (i = 1) or not (i = 2).
Setting all probabilities to 0.5 results in the maximum possible entropy. Dividing the first result (Equation (7)) by the second provides the percentage entropy, which is more useful in managing the inherent complexity of the SC. Furthermore, given that [p1jk + p2jk] = 1, that is, the sum of the probability of the information jk that is required and the probability of the information that is not required must equal 1, it follows that both probabilities cannot exceed or drop below 0.5 at the same time. For example, if p1jk = 0.25, then it is necessary that p2jk = 0.75. Since the study must focus only on one value, we chose the lowest one, regardless of whether the character is active or inactive. Switching will not affect the uncertainty.
The study followed a particular methodology, divided into the following steps:
  • Four focal companies were selected: two from the agrifood industry and two from the metalworking industry. In each industry, one company prioritizes competition according to cost/quality and the other according to dependability/flexibility;
  • At the headquarters of companies, two managers were interviewed together, one responsible for manufacturing and the other for logistics activities. The interviews lasted around two hours. The respondents answered two rounds of questions in consensus. In the first round, they prioritized the four competition objectives. In the second round, they estimated the probabilities. To make the estimate, respondents previously consulted the fifty most important manufacturing orders from the most recent days and counted how many times information j was requested in path k. Further information on orders from all respondents is confidential;
  • After the first meeting, managers had enough time to search the orders’ documentation to identify the number of times each piece of information was required. Managers had the chance to contact practitioners to clarify doubts. The number was rounded to facilitate communication. The experience of managers and practitioners, the accuracy of internal documents, and the triangulation during the interviews ensure the reliability of the measurement;
  • Equation (7), which expresses the Shannon entropy, was used to calculate maximum entropy and percentage entropy, a proxy variable that describes relative complexity of the SC [16];
  • In a final meeting, the results and some avenues for future complexity control were discussed with managers.
Table 2 and Figure 3, respectively, present the twenty pieces of information and the five paths included in the research.
Regarding Table 2, there are five groups responsible for managing twenty pieces of information. These groups include planning and scheduling, which handles manufacturing capacity and deadlines; logistics, which handles raw materials and deliveries; workforce, which handles operators’ skills required to fulfill orders’ requirements; finance, which handles cash flows; and technology and innovation, which handles the technical demands and abilities necessary to satisfy customers’ needs. Figure 3 outlines five essential pathways (R1, R2, R3, R11, and R21) for tracking information exchange. These include the R1 flow of stocked raw materials in continuous demand, the R2 flow of specific engineered materials utilized only as needed, and the R3 flow of engineering and design services engaged on an as-needed basis. Additionally, the manufacturing to distribution pathway R11 encompasses fabrication, maintenance, transportation, and warehousing. Finally, the customer service pathway R21 covers delivery and technical support services. Additional information or pathways should be explored in future studies.

4. Results and Discussion

4.1. The Companies

Company A is an agrifood industry player that specializes in producing soybean meal and oil. The company prioritizes highly standardized products originating from soy cultures. Supplier and customer markets are reasonably stable. Company A relies on large distributors and local distribution channels that serve retailers and companies specializing in agrifood products. Although the company does not frequently modify its product designs, any changes undergo rigorous scrutiny by technical and engineering services for certification before being approved for production and sale.
Company B is an agrifood industry player that specializes in producing fertilizers from the three main mineral groups: nitrogen, phosphate, and potassium, with production capacity across all three. The company incorporates technological advances in processes and products and must rely on specialized technical assistance extended to customers. The company is constantly innovating its product lines to offer its customers, mainly farmers, production enhancements and cost reductions in rural activity. The company operates primarily in markets in which raw material offers and prices are stable, while consumer markets can vary owing to climate events and seasonality. The company sells its products through large distributors and national and international distribution channels that supply large retailers. Any product design changes must undergo technical services that certify their quality before being released for production and sale.
Company C is a metalworking industry player that specializes in producing metallic components for large industrial items, specifically catering to the machinery and equipment industries, as well as the automotive industry. The company uses metallic plates received in large lots for the steelmaking industry, metal closures, safety devices, and, eventually, wood packaging such as pallets. The company operates with stable raw material markets and moderately variable consumer markets. To distribute its products, it uses both local and national logistics operators that store and supply large quantities to buyers.
Company D is a metalworking industry player that specializes in engineered solutions of high complexity to specific markets. The company uses metallic, electric, and electronic parts received in medium and small lots from various suppliers. The raw material markets are somehow unstable, and the consumer markets are highly variable. The company often receives manufacturing orders that require prior engineering designs. The company works with local and national logistics operators who store and transport large parts to buyers with stringent safety requirements. Innovation is continuous, and safety is a requirement, which means that any product design modifications undergo technical services that certify them before their release for production and sale.
Concerning the competitive priorities of focal companies A, B, C, and D, certain patterns emerge in their strategic emphasis.
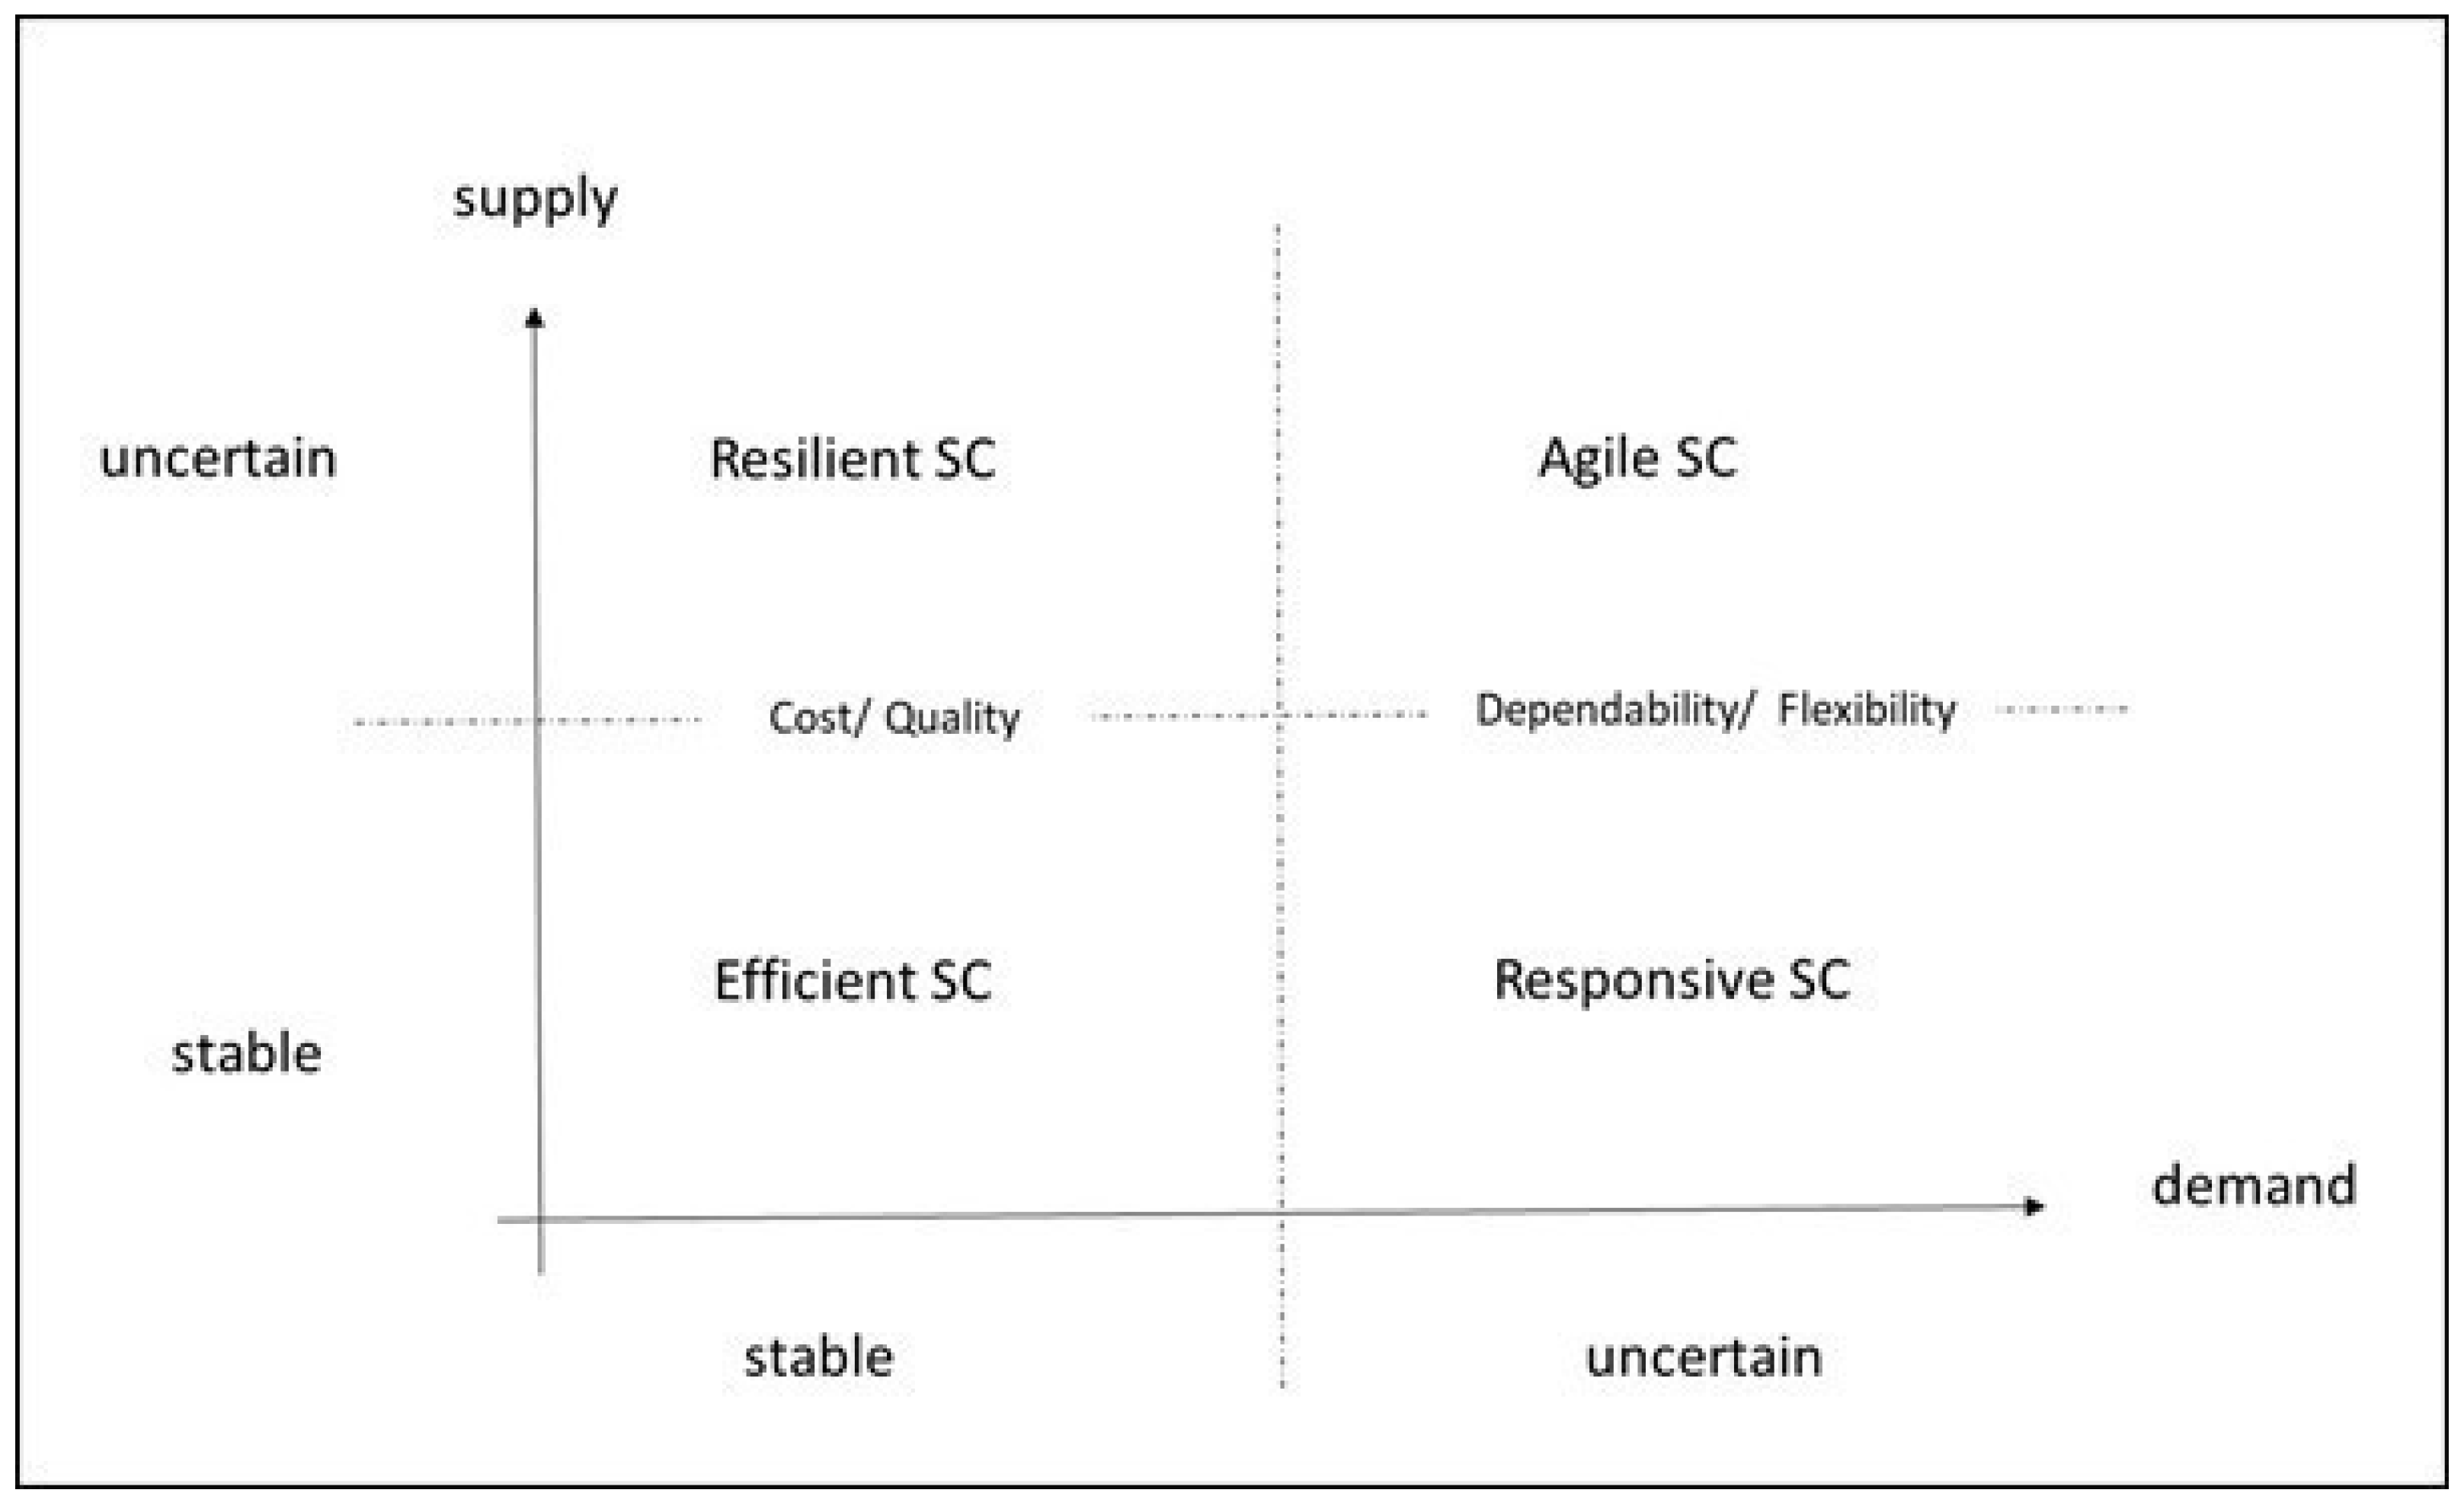
Focal company A prioritizes compliance with quality standards, primarily driven by stringent food safety requirements. The next is cost reduction, given the intense competition in the sector, in which pricing plays a pivotal role in consumer choices. Flexibility and dependability assume diminished significance for this company, attributed to its management of substantial inventories that promptly cater to unforeseen demands. Among the four SC meta-strategies, the SC is closer to the efficient pattern.
Focal company B prioritizes flexibility due to the changing nature of agrifood activity and the inherent uncertainty in climate conditions. Subsequently, dependability assumes prominence, driven by the temporal commitments of farmers tied to seasonality and prices in the global market. The second is quality, particularly due to the difficulty for customers of handling manufacturing errors. Cost reduction (and consequently price reduction) occupies a relatively lower position on the priority scale, given that the competition in the sector is not too fierce. Among the four SC meta-strategies, the SC is closer to the responsive pattern.
Focal company C prioritizes cost reduction. The standardization of its product influences this strategic choice, its relative ease of production, and the heightened competition within the sector. The second is quality, due to the difficulty for customers of dealing with dimensional, structural, and appearance errors in raw material supplied to other industries. Flexibility and dependability assume less critical roles, given the company’s effective management of substantial inventories to promptly address unexpected demands. Among the four SC meta-strategies, the SC is closer to the efficient pattern.
Finally, focal company D prioritizes dependability. This emphasis is underscored by the industrial market’s stringent deadlines and narrow delivery windows, in which any lapse could result in a loss of business. Flexibility assumes the secondary position, driven by the swift variations in project features and uncertainties surrounding the definition of standardized batches. Quality follows, as manufacturing errors are difficult to amend by the company’s delivery model. Cost reduction, though not irrelevant, takes a less central role, as the packaging cost in industrial deliveries has a less influential role. Among the four SC meta-strategies, the SC is closer to the agile pattern.

4.2. Entropy Calculation

Table 3 and Table 4 synthesize the results of the evaluations conducted by managers and the entropies (the sign minus in the entropy was omitted for clarity), respectively. In the first row of Table 4, together with the name of the focal company, it is possible to find the percentage entropy of each SC. The maximum entropy for all applications is 100 bits.
Table 5 provides the relationship between the percentage entropy and priorities of the focal company, as well as the number of empty cells in each dashboard. An empty cell means no need to randomly exchange (it is not required or was never required) that kind of information and, consequently, an absence of uncertainty and related complexity.
The cases show that SCs focusing on cost and quality tend to be less complex than those emphasizing flexibility and dependability in the same industry. Companies prioritizing cost and quality have fewer empty cells, indicating fewer complex aspects, than those prioritizing flexibility and dependability.
Table 6 shows the percentage entropy per group of information per company.
The table reveals that companies that prioritize flexibility and dependability have a greater value in planning and scheduling (company B), finance, and technology and innovation (company D). In contrast, one of the companies (company A) that prioritizes cost and quality has a greater value in logistics. The workforce is a less relevant source of uncertainty in the studied sample of companies. Therefore, company A should care about logistics while companies B and D should focus on planning and scheduling and technology and innovation as the main sources of uncertainty.
Moving to Table 7, the table shows the average entropy per path per company.
The table reveals that the most significant difference between the average entropies is observed in R2 and R11, corresponding to specially engineered products and deliveries from the manufacturer, respectively. In R2 and R11, companies A and C, prioritizing cost and quality, exhibit notably lower average entropies than companies B and D. This suggests that ensuring flexibility and dependability requires greater organizational complexity in SCM in relation to manufactured products and agile deliveries. Such drivers require greater coordination efforts, which increases complexity. Conversely, companies emphasizing cost reduction and quality assurance tend to employ standardized products and larger transfer batches, which reduce concerns regarding project and product development, as well as agile deliveries, variable batches, and changes in the mix. Such drivers require less coordination effort, which decreases complexity.
This may not be a coincidence. Future studies should conduct surveys to test the following hypothesis: Companies that prioritize cost and quality generally exhibit an SCM system with lower relative complexity compared to companies that rely on flexibility and dependability for competition.

5. Final Remarks

The purpose of the study was to propose a quantitative modeling method, employing Shannon’s entropy model as a proxy to assess the complexity in SCs. This study’s object was four SCs in the agrifood and metalworking industries of Southern Brazil. The study’s findings suggest that companies that prioritize cost and quality tend to have lower SCM complexity than those that prioritize flexibility and dependability. The study observed significant differences in the average entropies of specific paths related to engineered products and deliveries. These observations indicate that organizational complexities vary based on competitive priorities.
The findings have implications for industrial practitioners. Companies that prioritize cost and quality may benefit from lower complexity, which leads to streamlined processes. In contrast, those who prioritize flexibility and dependability may need more complex organizational structures to meet dynamic market demands. In summary, the study provided valuable insights for industrial practitioners, including how to align competitive priorities with the inherent complexity of SCs. The study’s findings suggest that prioritizing cost and quality can lead to lower SCM complexity, while flexibility and dependability may lead to higher organizational complexities.
Looking ahead, future research can delve deeper into testing the hypothesis that companies prioritizing cost and quality exhibit lower SCM complexity. The study also suggests exploring the broader applicability of information entropy in assessing and controlling complexity across diverse industries, other types of systems, and global SCs. This exploration would contribute to the evolving field of SCM.
In terms of external validity, the current methodology demonstrates both generalizability and extensibility across various production system typologies. The core principle—quantifying informational flow entropy as an indicator of complexity—remains universally applicable, grounded in Shannon entropy’s theoretical framework for assessing informational complexity. When extending the methodology to other systems, several considerations should be included. (i) Information granularity and diversity: Future models could integrate a wider and more varied array of informational elements, such as sustainability metrics, regulatory compliance parameters, or cybersecurity data. Additionally, incorporating intermediate states (information partially required) could refine entropy measurement and address further nuances of uncertainty. (ii) Multitier interactions: For broader applicability, the mapping scope should include interactions beyond the focal company to encompass second- and third-tier agents. (iii) Large-scale data acquisition: While interview-based methodologies prove effective for detailed case studies, achieving broader generalizability requires collecting transactional data from enterprise resource planning (ERP) and SCM systems. Automated data collection may provide probability calculations with greater statistical significance.
Future research should also include the meta-strategy of the SC. One possibility is to lead four similar surveys, each one focusing on a different meta-strategy to gather enough data to compare outcomes. Another possibility is the use of multicriteria methods to calculate weights in the case of multiple strategies and multiple priorities. At least one study [30] uses confidence intervals to address the inherent uncertainty observed in multicriteria studies focused on investigating the strategic aspects of and preferences in SCs.
One important topic that the study should have addressed, which could be the focus of future research, is the relationship between complexity and performance in SCs. Among other approaches, performance can be measured using the framework provided by the SCOR (Supply Chain Operations Reference) model, as demonstrated in [56]. Among many others, some indicators that can be connected to measure performance are raw material cost, process inventory, and design and sales cost (cost priority); percentage of rework, client satisfaction, and percentage of waste (quality priority); lead time to orders, back orders, and on-time deliveries (dependability priority); and time-to-market, setup time, and average mix of products (flexibility priority).
This study observed that the SCs that prioritize flexibility and dependability generate more uncertainty in planning and scheduling and technology and innovation. On the other hand, one of the SCs that prioritizes cost and quality generates more uncertainty in logistics. These findings can help practitioners identify key areas for future performance improvement actions. Furthermore, it remains to be seen whether there is an analytical relationship between complexity and performance. The need for more information is a result of the need for greater coordination of activities, regardless of the level of complexity. It is also reasonable to assume that too much coordination can lead to reduced performance due to an excess of intermediate activities. At the same time, too little coordination can lead to errors in operations and reduced performance. Therefore, a U-shaped relationship may exist between performance and complexity: an optimal level of complexity maximizes SC performance. This topic is worth exploring further in future research.

Author Contributions

Conceptualization, M.A.S. and I.C.B.; methodology, M.A.S.; validation, I.C.B. and M.R.; investigation, M.A.S. and I.C.B. data curation, I.C.B. and M.R.; writing—review and editing, M.A.S. and M.R. All authors have read and agreed to the published version of the manuscript.

Funding

This research was funded by FAPERGS, the regional research agency of Rio Grande do Sul, under grant number 24/2551-0001201-0. The co-author M.S. was funded by the APC.

Institutional Review Board Statement

Not applicable.

Data Availability Statement

The original contributions presented in this study are included in the article. Further inquiries can be directed to the corresponding author.

Conflicts of Interest

The authors declare no conflicts of interest.

References

  1. Çengel, Y.A. On entropy, information, and conservation of information. Entropy 2021, 23, 779. [Google Scholar] [CrossRef]
  2. Purvis, B.; Mao, Y.; Robinson, D. Entropy and its application to urban systems. Entropy 2019, 21, 56. [Google Scholar] [CrossRef]
  3. Kuzemsky, A.L. Probability, information, and statistical physics. Int. J. Theor. Phys. 2016, 55, 1378–1404. [Google Scholar] [CrossRef]
  4. Amanova, N.; Martin, J.; Elster, C. Finding the input features that reduce the entropy of a neural network’s prediction. Appl. Intell. 2024, 54, 1922–1936. [Google Scholar] [CrossRef]
  5. Shannon, C. A Mathematical Theory of Communication. Bell Syst. Tech. J. 1948, 27, 379–423. [Google Scholar] [CrossRef]
  6. Li, D.; Deng, Y.; Cheong, K.H. Multisource basic probability assignment fusion based on information quality. Int. J. Intell. Syst. 2021, 36, 1851–1875. [Google Scholar] [CrossRef]
  7. Saraiva, P. On Shannon entropy and its applications. Kuwait J. Sci. 2023, 50, 194–199. [Google Scholar] [CrossRef]
  8. Psychogiou, E.E.; Tsoulfas, G.T. Critical Factors Affecting Trust in the Wine Supply Chain in Greece: A Grey DEMATEL Approach. Logistics 2024, 8, 24. [Google Scholar] [CrossRef]
  9. Monostori, J. Mitigation of the ripple effect in supply chains: Balancing the aspects of robustness, complexity and efficiency. CIRP J. Manuf. Sci. Technol. 2021, 32, 370–381. [Google Scholar] [CrossRef]
  10. Cheng, C.; Chen, T.; Chen, Y. An analysis of the structural complexity of supply chain networks. Appl. Math. Model. 2014, 38, 2328–2344. [Google Scholar] [CrossRef]
  11. Chand, P.; Thakkar, J.J.; Ghosh, K.K. Analysis of supply chain complexity drivers for Indian mining equipment manufacturing companies combining SAP-LAP and AHP. Resour. Policy 2018, 59, 389–410. [Google Scholar] [CrossRef]
  12. Serdarasan, S. A review of supply chain complexity drives. Comput. Ind. Eng. 2013, 66, 533–540. [Google Scholar] [CrossRef]
  13. Lyons-White, J.; Knight, A. Palm oil supply chain complexity impedes implementation of corporate no-deforestation commitments. Glob. Environ. Change 2018, 50, 303–313. [Google Scholar] [CrossRef]
  14. Bozarth, C.; Warsing, D.; Flynn, B.; Flynn, E. The impact of supply chain complexity on manufacturing plant performance. J. Oper. Manag. 2009, 27, 78–93. [Google Scholar] [CrossRef]
  15. Cagliano, A.; Carlin, A.; Rafele, C. Understanding supply chain complexity with performance measurement. IFAC Proc. Vol. 2009, 42, 1126–1131. [Google Scholar] [CrossRef]
  16. Kriheli, B.; Levner, E. Entropy-Based Algorithm for Supply-Chain Complexity Assessment. Algorithms 2018, 11, 35–50. [Google Scholar] [CrossRef]
  17. Kache, F.; Seuring, S. Challenges and opportunities of digital information at the intersection of Big Data Analytics and supply chain management. Int. J. Oper. Prod. Manag. 2017, 37, 10–36. [Google Scholar] [CrossRef]
  18. Ivanov, D.; Dolgui, A.; Sokolov, B. The impact of digital technology and Industry 4.0 on the ripple effect and supply chain risk analytics. Int. J. Prod. Res. 2019, 57, 829–846. [Google Scholar] [CrossRef]
  19. Queiroz, M.M.; Telles, R.; Bonilla, S.H. Blockchain and supply chain management integration: A systematic review of the literature. Supply Chain. Manag. Int. J. 2020, 25, 241–254. [Google Scholar] [CrossRef]
  20. Williams, T.A.; Gruber, D.A.; Sutcliffe, K.M.; Shepherd, D.A.; Zhao, E.Y. Organizational response to adversity: Fusing crisis management and resilience research streams. Acad. Manag. Ann. 2017, 11, 733–769. [Google Scholar] [CrossRef]
  21. Jiang, P.; Van Fan, Y.; Klemeš, J.J. Network Complexity and Resilience Analysis of Global Supply Chain Management. J. Clean. Prod. 2019, 240, 118242. [Google Scholar]
  22. Rivkin, J.W.; Siggelkow, N. Complexity and the Synthesis of Managerial Choices. Strateg. Manag. J. 2018, 39, 1645–1667. [Google Scholar]
  23. Mihm, J.; Loch, C.H.; Wilkinson, D. How Complexity Affects Project Performance in the Presence of Slack. IEEE Trans. Eng. Manag. 2020, 67, 171–183. [Google Scholar]
  24. Gerschberger, M.; Fawcet, S.E.; Fawcett, A.M.; Gerschberger, M. Why supply chain complexity prevails: Mapping the complexity capability development process. Int. J. Logist. Manag. 2024, 35, 112–135. [Google Scholar] [CrossRef]
  25. Kalogiannidis, S.; Chatzitheodoridis, F.; Giannarakis, G.; Mavrommati, A. Business Organizations’ Flexibility as an Innovation Tool: Factors Affecting Flexibility in Organizations. J. Logist. Inform. Serv. Sci. 2022, 9, 259–312. [Google Scholar]
  26. Al-Rawashdeh, O.M.; Jawabreh, O.; Ali, B.J. Supply Chain Management and Organizational Performance: The Moderating Effect of Supply Chain Complexity. Inf. Sci. Lett. 2023, 12, 1673–1684. [Google Scholar]
  27. Rebs, T.; Thiel, D.; Brandenburg, M.; Seuring, S. Impacts of stakeholder influences and dynamic capabilities on the sustainability performance of supply chains: A system dynamics model. J. Bus. Econ. 2019, 89, 893–926. [Google Scholar] [CrossRef]
  28. Jacobides, M.G.; MacDuffie, J.P.; Tae, C.J. Agency, structure, and the dominance of OEMs: Change and stability in the automotive sector. Strateg. Manag. J. 2016, 37, 1942–1967. [Google Scholar] [CrossRef]
  29. Sahoo, S. Aligning operational practices to competitive strategies to enhance the performance of Indian manufacturing firms. Benchmarking Int. J. 2021, 28, 131–165. [Google Scholar] [CrossRef]
  30. Prabhu, M.; Nambirajan, T.; Abdullah, N.N. Analytical review of competitive priorities for operations under manufacturing firms. J. Ind. Eng. Manag. 2020, 13, 38–55. [Google Scholar] [CrossRef]
  31. Sellitto, M.A.; Valladares, D.R.F.; Pastore, E.; Alfieri, A. Comparing competitive priorities of slow fashion and fast fashion operations of large retailers in an emerging economy. Glob. J. Flex. Syst. Manag. 2022, 23, 1–19. [Google Scholar] [CrossRef]
  32. Ward, P.T.; McCreery, J.K.; Ritzman, L.P.; Sharma, D. Competitive priorities in operations management. Decis. Sci. 1998, 29, 1035–1046. [Google Scholar] [CrossRef]
  33. Sharma, V.; Raut, R.D.; Mangla, S.K.; Narkhede, B.E.; Luthra, S.; Gokhale, R. A systematic literature review to integrate lean, agile, resilient, green and sustainable paradigms in the supply chain management. Bus. Strategy Environ. 2021, 30, 1191–1212. [Google Scholar] [CrossRef]
  34. Olatunji, O.O.; Ayo, O.O.; Akinlabi, S.; Ishola, F.; Madushele, N.; Adedeji, P.A. Competitive advantage of carbon efficient supply chain in manufacturing industry. J. Clean. Prod. 2019, 238, 117937. [Google Scholar] [CrossRef]
  35. Sabouhi, F.; Jabalameli, M.S.; Jabbarzadeh, A. An optimization approach for sustainable and resilient supply chain design with regional considerations. Comput. Ind. Eng. 2021, 159, 107510. [Google Scholar] [CrossRef]
  36. Nayeri, S.; Sazvar, Z.; Heydari, J. Towards a responsive supply chain based on the industry 5.0 dimensions: A novel decision-making method. Expert. Syst. Appl. 2023, 213, 119267. [Google Scholar] [CrossRef]
  37. Raji, I.O.; Shevtshenko, E.; Rossi, T.; Strozzi, F. Industry 4.0 technologies as enablers of lean and agile supply chain strategies: An exploratory investigation. Int. J. Logist. Manag. 2021, 32, 1150–1189. [Google Scholar] [CrossRef]
  38. Lee, H.L. Aligning supply chain strategies with product uncertainties. Calif. Manag. Rev. 2002, 44, 105–119. [Google Scholar] [CrossRef]
  39. Nara, E.; Sordi, D.; Schaefer, J.; Schreiber, J.; Baierle, I.; Sellitto, M.; Furtado, J. Prioritization of OHS key performance indicators that affecting business competitiveness—A demonstration based on MAUT and Neural Networks. Saf. Sci. 2019, 118, 826–834. [Google Scholar] [CrossRef]
  40. Adami, V.; Júnior, J.A.; Sellitto, M. Regional industrial policy in the wind energy sector: The case of the State of Rio Grande do Sul, Brazil. Energy Policy 2017, 111, 18–27. [Google Scholar] [CrossRef]
  41. Ameri, F.; Patil, L. Digital manufacturing market: A semantic web-based framework for agile supply chain deployment. J. Intell. Manuf. 2012, 23, 1817–1832. [Google Scholar] [CrossRef]
  42. Khajouei, M.; Pilevari, N.; Radfar, R.; Mohtashami, A. Complex adaptive systems, agent-based modeling and supply chain network management: A systematic literature review. J. Ind. Eng. Manag. Stud. 2022, 8, 54–92. [Google Scholar]
  43. Orlanyuk-Malitskaya, L.; Plakhova, T.; Sakulyeva, T.; Glazkova, I. The impact of globalisation processes on supply chain management. Innov. Infrastruct. Solut. 2024, 9, 35. [Google Scholar] [CrossRef]
  44. Modrak, V.; Soltysova, Z. Assessment of product variety complexity. Entropy 2023, 25, 119. [Google Scholar] [CrossRef] [PubMed]
  45. Trattner, A.; Hvam, L.; Forza, C.; Herbert-Hansen, Z.N.L. Product complexity and operational performance: A systematic literature review. CIRP J. Manuf. Sci. Technol. 2019, 25, 69–83. [Google Scholar] [CrossRef]
  46. Vaičiūtė, K.; Išoraitė, M. Technological integration of marketing in the supply chain of a transport company. Bus. Theory Pract. 2023, 24, 584–593. [Google Scholar] [CrossRef]
  47. Grzybowska, K.; Stachowiak, A. Global changes and disruptions in supply chains—Preliminary research to sustainable resilience of supply chains. Energies 2022, 15, 4579. [Google Scholar] [CrossRef]
  48. Yun, N.Y.; Ülkü, M.A. Sustainable Supply Chain Risk Management in a Climate-Changed World: Review of Extant Literature, Trend Analysis, and Guiding Framework for Future Research. Sustainability 2023, 15, 13199. [Google Scholar] [CrossRef]
  49. Wiedmer, R.; Rogers, Z.S.; Polyviou, M.; Mena, C.; Chae, S. The dark and bright sides of complexity: A dual perspective on supply network resilience. J. Bus. Logist. 2021, 42, 336–359. [Google Scholar] [CrossRef]
  50. Jafarian, A.; Rabiee, M.; Tavana, M. A novel multi-objective co-evolutionary approach for supply chain gap analysis with consideration of uncertainties. Int. J. Prod. Econ. 2020, 228, 107852. [Google Scholar] [CrossRef]
  51. Levner, E.; Ptuskin, A. An entropy-based approach to identifying vulnerable components in a supply chain. Int. J. Prod. Res. 2015, 53, 6888–6902. [Google Scholar] [CrossRef]
  52. Hertz, A.; Cerf, N.J. Continuous-variable entropic uncertainty relations. J. Phys. A Math. Theor. 2019, 52, 173001. [Google Scholar] [CrossRef]
  53. Isik, F. An entropy-based approach for measuring complexity in supply chains. Int. J. Prod. Res. 2010, 48, 3681–3696. [Google Scholar] [CrossRef]
  54. Modrak, V.; Bednar, S. Topological Complexity Measures of Supply Chain Networks. Procedia CIRP 2016, 40, 295–300. [Google Scholar] [CrossRef]
  55. Sellitto, M.; Borchardt, M.; Pereira, G.; Guimarães, M. Relative complexity measurement of a supply chain based on information theory. In Proceedings of the IMCIC 2010—International Multi-Conference on Complexity, Informatics and Cybernetics, Orlando, FL, USA, 29 June–2 July 2010; Volume 1, pp. 133–138. [Google Scholar]
  56. Sellitto, M.A.; Pereira, G.M.; Borchardt, M.; Silva, R.I.; Viegas, C.V. A SCOR-based model for supply chain performance measurement: Application in the footwear industry. Int. J. Prod. Res. 2015, 53, 4917–4926. [Google Scholar] [CrossRef]
Figure 1. Relationship between meta-strategies in SCs and uncertainty. Source: Authors’ own creation based on [38].
Asi 08 00105 g001
Figure 2. The binary Shannon entropy function H b i n p . Source: Authors’ own creation based on [7].
Asi 08 00105 g002
Figure 3. Graphical representation of paths and functions in the SC. Source: Authors’ own creation.
Asi 08 00105 g003
Table 1. Related studies and their contributions, along with the positioning of this study.
StudyMain Features
[9]Handles resilience and efficiency by managing the number of suppliers, degree of differentiation, and interrelationships in the SC
[10]Evaluates complexity by theoretically developing an entropy-based measure
[11]Evaluates complexity by identifying drivers and applying AHP
[12]Provides an extensive and insightful review of complexity drivers in SC
[13]Studies drivers that boost complexity in SC and propose mechanisms to overcome their effects and reduce complexity
[14]Provides a useful methodology to link SC complexity with plant performance, considering plant design and operation strategy, which will be useful in future research
[15]Manages SC complexity by system dynamics tool, highlighting more effective drivers for complexity level
[16]Provides a theoretical description of an entropy-based measure as a proxy variable for complexity in SCs and introduces conditional (relative) complexity, which was employed in our study.
Our studyManages complexity to achieve efficiency, resilience, responsiveness, and agility in SC. The evaluation uses twenty key information elements encompassing five aspects: planning, logistics, workforce, finance, and technology. The study also relates complexity to competitive priorities.
Table 2. Information exchanged within the SC.
GroupTagInformation
Planning and schedulingI1Forecasting and sales history
I2Manufacturing capacity
I3Scheduled maintenance
I4Lead times and deadlines
LogisticsI5Scheduled shipments
I6Scheduled arrivals
I7Shared inventory situation
I8Shared transportation situation
WorkforceI9Availability of skilled operators
I10Availability of skilled designers
FinanceI11Cash flow situation
I12Shared purchases situation
I13Credit, payments, and loans
I14Shared financing
Technology and innovationI15Product development
I16Process development
I17Shared investments
I18Shared machine situation
I19Technology transfer
I20Technical support
Source: [55].
Table 3. Probabilities of information required for SCM.
Tag
CompanyPathI1I2I3I4I5I6I7I8I9I10I11I12I13I14I15I16I17I18I19I20
A R140%10% 50%30%30%30%10%10% 30%30% 30% 10%
R210% 10% 10% 10% 30%
R340% 10% 10%
R11 10% 10%
R2110%10% 30%10%10%30%50%
BR110%25%25%30%10%10% 10%5% 30% 30% 10% 20%
R210%25%25%40% 20%10% 10% 20% 30%10% 30%
R310% 30%
R1110%20%30%30%10%10% 10%15% 20% 20%
R2120% 40% 10% 30% 30% 10% 10%
CR1 20% 10% 10% 20% 20%
R2 30% 20%
R3 20% 10% 20%
R1110% 30% 40% 10%
R21 40% 40%40% 50% 20%
DR120% 40% 10% 35% 35% 10%10%
R240%45% 10% 50%50% 20%
R345% 20% 20%20% 45%
R1110%10%30%20% 40% 50% 50%30%10%10% 10%
R2140% 45%40% 40%40% 45% 45%25% 50% 40%
Source: Authors’ own creation.
Table 4. Entropies associated with the probabilities of information required for SCM.
Tag
CompanyPathI1I2I3I4I5I6I7I8I9I10I11I12I13I14I15I16I17I18I19I20
A R10.970.47 1.000.880.880.880.470.47 0.880.88 0.88 0.47
(19.8%)R20.47 0.47 0.47 0.47 0.88
R30.97 0.47 0.47
R11 0.47 0.47
R210.470.47 0.880.470.470.881.00
BR10.470.810.810.880.470.47 0.470.29 0.88 0.88 0.47 0.72
(27.9%)R20.470.810.810.97 0.720.47 0.47 0.72 0.880.47 0.88
R30.47 0.88
R110.470.720.880.880.470.47 0.470.61 0.72 0.72
R210.72 0.97 0.47 0.88 0.88 0.47 0.47
CR1 0.72 0.47 0.47 0.72 0.72
(14.0%)R2 0.88 0.72
R3 0.72 0.47 0.72
R110.47 0.88 0.97 0.47
R21 0.97 0.970.97 1.00 0.72
DR10.72 0.97 0.47 0.93 0.93 0.470.47
(31.7%)R20.970.99 0.47 1.001.00 0.72
R30.99 0.72 0.720.72 0.99
R110.470.470.880.72 0.97 1.00 1.000.880.470.47 0.47
R210.97 0.990.97 0.970.97 0.99 0.990.81 1.00 0.97
Source: Authors’ own creation.
Table 5. Synthesis of the results.
CompanyIndustryCompetitive PrioritiesPercentage EntropyEmpty Cells
AAgrifoodCost/quality19.8%29
BAgrifoodFlexibility/dependability27.9%42
CMetalworkingCost/quality14.0%19
DMetalworkingFlexibility/dependability31.7%39
Source: Authors’ own creation.
Table 6. Percentage entropy per group of information and company.
Group of Information
CompanyPlanning and SchedulingLogisticsWorkforceFinanceTechnology and InnovationTotal
A7.6%5.9%0.9%2.2%3.2%19.8%
B11.2%4.0%1.4%6.2%5.2%27.9%
C5.3%2.4%1.9%1.2%3.2%14.0%
D9.6%2.4%1.9%8.3%9.5%31.7%
Average8.4%3.7%1.5%4.5%5.3%
Table 7. Average entropy per path and company.
CompanyR1R2R3R11R21Priority
A/C0.430.190.180.170.42Cost/Quality
B/D0.510.500.260.500.57Flexibility/Dependability
Δ%15%62%31%65%26%
Source: Authors’ own creation.
Disclaimer/Publisher’s Note: The statements, opinions and data contained in all publications are solely those of the individual author(s) and contributor(s) and not of MDPI and/or the editor(s). MDPI and/or the editor(s) disclaim responsibility for any injury to people or property resulting from any ideas, methods, instructions or products referred to in the content.

