1. Introduction
Manufacturing is a central driver of the global economy and is responsible for innovation, employment, and the production of essential goods. However, the industry is undergoing rapid transformation due to increased global competition, shorter product life cycles, customized demands, and digitalization under Industry 4.0. This shift requires manufacturers to achieve high levels of agility, efficiency, and quality. At the same time, they face mounting environmental pressures, including climate change, resource depletion, and pollution. As major energy consumers and waste generators, manufacturers must now address the dual challenge of improving operational efficiency while advancing environmental sustainability to remain competitive, comply with regulations, and support global sustainability goals.
The challenges of operational efficiency in manufacturing are complex and long-standing. Production systems, particularly complex ones like tube manufacturing that involve sequential processes across multiple machines and lines, are often plagued by inefficiencies. These manifest themselves as bottlenecks that restrict overall production, excessive cycle times that delay order fulfillment, significant nonproductive idle time for machinery and labor, suboptimal resource allocation, high rates of defects requiring rework or scrap, and inflexible scheduling that struggles to adapt to dynamic changes in demand or unexpected disruptions [
1]. Traditional improvement methodologies, such as Lean Manufacturing and Six Sigma, have provided valuable frameworks for waste reduction and process standardization. However, their effectiveness can be limited in highly dynamic and data-rich environments where real-time visibility and adaptive control are crucial. Identifying the root causes of inefficiencies often requires deep, data-driven insights into the actual execution of processes, which may deviate significantly from idealized models.
Concurrently, the imperative for environmental sustainability introduces another layer of complexity. Manufacturing processes are inherently resource-intensive. Key areas of environmental concern include high energy consumption, particularly in processes such as extrusion, heating, curing, and machining, which often rely heavily on fossil fuels, contributing significantly to greenhouse gas (GHG) emissions [
2]. Water use, especially for cooling, cleaning and processing, can be substantial, requiring local water resources [
3]. The consumption of raw materials and the subsequent generation of waste, including process scrap, defective products, and packaging waste, contribute to the depletion of resources and the burden on landfills [
4]. Accurately measuring, monitoring, and managing these environmental impacts in intricate production chains is a formidable task. Furthermore, decisions aimed at improving one aspect of sustainability (e.g., switching to a less energy-intensive material) might have unforeseen consequences on other environmental metrics or even operational performance.
Historically, manufacturing teams have addressed operational efficiency and environmental performance separately, using different tools and KPIs. Operations might track metrics such as OEE and throughput, while EHS teams focus on energy use and emissions, often with delayed periodic data. This separation overlooks how closely connected these goals truly are. For instance, speeding up machines might boost output but also spike energy use or increase defects. On the flip side, recycling efforts could slow production or increase costs. Without a unified approach, well-intended changes risk causing inefficiencies or damaging sustainability goals [
5].
The advent of Industry 4.0 technologies offers a way to overcome these limitations. The proliferation of sensors, the Internet of Things (IoT), Cyber-Physical Systems (CPS), cloud computing, and big data analytics provides manufacturers with the unprecedented ability to collect vast amounts of granular real-time data from the factory floor [
6]. These data encompass not only machine states, production counts, and cycle times but also energy consumption, temperature profiles, vibration patterns, and other parameters relevant to both operational and environmental performance. Using these data effectively is the key to unlocking the holistic optimization potential.
Despite advances in individual technologies, there is still a major gap: few solutions truly integrate real-time Process Mining with dynamic LCA metrics and feed this into a Multi-Objective Optimization engine for both efficiency and sustainability. Most current methods rely on static data, treat goals separately, or lack real-world validation.
To address this gap, this study introduces and validates a comprehensive, cloud-based, data-driven framework designed to simultaneously improve both operational efficiency and environmental sustainability in manufacturing. The core innovation lies in the synergistic integration of three key components: (1) real-time Process Mining to discover actual workflows and operational KPIs; (2) dynamic Life Cycle Assessment (LCA) to quantify environmental impacts at the instance level using live sensor data and (3) Multi-Objective Optimization (MOO) to identify Pareto-optimal operating configurations that balance these conflicting goals. The framework is implemented on a scalable cloud infrastructure and incorporates the Technique for Order Preference by Similarity to Ideal Solution (TOPSIS) to support decision-making.
The novelty of this work lies in its integrated, data-driven approach that unifies operational and environmental optimization in real-time. Validated in a real-world tube manufacturing facility, the framework demonstrates how manufacturers can make smarter, more balanced decisions to simultaneously enhance productivity and environmental stewardship.
This paper is structured as follows.
Section 2 reviews related studies in process mining, LCA, and multi-objective optimization in manufacturing, further refining the identified research gap.
Section 3 details the proposed integrated framework and the mathematical formulation of the multi-objective optimization model.
Section 4 describes the real-world case study, presents the data analysis, and discusses the optimization results, including Pareto front analysis, TOPSIS ranking, and sensitivity analysis. Finally,
Section 5 concludes the paper, summarizes the key findings and contributions, and discusses potential avenues for future research.
2. Related Work and Theoretical Background
2.1. Process Mining for Operational Excellence in Manufacturing
Process Mining has established itself as a pivotal data-driven discipline to understand and improve real-world processes based on event data readily available in modern manufacturing information systems [
6]. Its core strength lies in moving beyond static, idealized process models to reveal how operations actually unfold. Key applications in manufacturing include automated process discovery, where algorithms like Inductive Miner or Heuristics Miner can automatically generate process models from event logs, providing unprecedented visibility into complex production flows, including undocumented variations and deviations. Performance diagnosis enables the detailed analysis of operational Key Performance Indicators (KPIs). Studies have successfully used it to pinpoint bottlenecks that cause delays [
7], measure and optimize cycle times [
8,
9], quantify idle times of resources [
10], and analyze throughput variations across different process paths. Conformance checking compares event logs against normative process models to identify deviations, skipped activities, or incorrect sequences that can negatively impact quality or efficiency [
11], helping to ensure compliance and pinpoint areas that need corrective action.
Limitation : Despite its power in operational analysis, conventional process mining focuses mainly on the efficiency, time, and cost dimensions derived directly from the event logs. Although some research explores resource utilization, the explicit and dynamic integration of environmental KPIs (such as real-time energy consumption per case, emissions per activity, or waste generated during specific process instances) directly into the process mining analysis loop is often lacking. The focus remains largely operational, missing the opportunity to directly correlate process flow characteristics with their immediate environmental consequences using the same granular event-level data.
2.2. Life Cycle Assessment (LCA) for Evaluating Environmental Burdens
Life Cycle Assessment (LCA) is the internationally recognized standard for evaluating environmental impacts associated with a product, process, or service throughout its entire life cycle from raw material extraction to manufacturing, use, and end-of-life disposal [
12]. In manufacturing, LCA is crucial to identify environmental hotspots within the production chain, such as stages or activities that contribute the most significantly to greenhouse gas emissions, energy demand, water consumption, resource depletion, or waste generation [
13,
14]. It also supports eco-design by guiding product and process design decisions toward more sustainable alternatives, considering material selection, energy efficiency measures, and waste minimization strategies [
4]. It provides quantitative metrics for environmental performance, essential for reporting, benchmarking, and tracking progress towards sustainability goals [
2,
3].
Limitation: Traditional LCA methodologies often rely on static aggregated data, frequently obtained from generic databases or averaged historical plant performance. This approach presents significant limitations for real-time operational management. First, static LCA typically provides a high-level view and struggles to capture the environmental impact variations associated with specific production orders, machine settings, or real-time process deviations. Second, LCA studies are often conducted retrospectively, making them unsuitable for immediate feedback or dynamic control adjustments on the factory floor. Third, linking static LCA models directly with the dynamic event data captured by manufacturing execution systems (MES) or process mining tools is non-trivial. There is a disconnect between the operational event stream and the environmental assessment framework.
2.3. Efforts Towards Integrating Operational and Sustainability Perspectives
Recognizing the limitations of single approaches, researchers have begun exploring ways to integrate operational analysis with sustainability considerations. Sustainable Process Mining is an area where some conceptual work and early studies have aimed to incorporate environmental indicators into process analysis [
15]. This might involve annotating process models with aggregated environmental data or developing sustainability-related conformance checks. However, these initiatives often remain in the early stages, without dynamic data integration or robust optimization features. Another path is to extend Lean tools like Value Stream Mapping (VSM). Originally used to identify operational waste, VSM has been adapted to ‘sustainable VSM’ (SVSM) by including environmental metrics such as energy use and material waste along with time and cost [
16]. Although helpful for strategic decisions, these methods are typically manual and snapshot-based, lacking the automation and continuous discovery capabilities of process mining. Discrete-event simulation models have also been used to evaluate operational and environmental outcomes under different scenarios. Though useful for “what-if” exploration, these models may not perfectly match real-time factory conditions and do not leverage data in the same live, automatic way process mining does.
Limitation: Despite these innovations, many integration efforts lack real-time feedback, depend on manually collected or aggregated environmental metrics, cannot easily handle multiple conflicting goals, or do not use live factory data from sensors. What is often missing is a seamless connection from real-time data gathering to integrated analysis and decision-ready recommendations.
2.4. Multi-Objective Optimization (MOO) in Sustainable Manufacturing
Balancing conflicting goals is essential in sustainable manufacturing, and that is where Multi-Objective Optimization (MOO) techniques shine. Various MOO approaches, including genetic algorithms such as NSGA-II, particle swarm optimization, and other metaheuristics, have been used to optimize trade-offs. For example, some research has aimed to minimize cost, energy use, and ensure quality at the same time by adjusting the machining parameters or the scheduling [
5,
17]. Other studies have focused on creating production schedules that reduce delays and reduce emissions [
18,
19]. MOO has helped optimize supply chain design by choosing the best locations, transport methods, and inventory strategies while accounting for both cost and environmental impact [
20].
Limitation: While MOO offers tools to manage trade-offs, its success is highly dependent on up-to-date, high-quality input data. Many existing applications rely on estimates or historical averages instead of real-time insights. Environmental goals are often based on broad models or static calculations rather than live sensor data tied to current process conditions. Moreover, many implementations lack an automatic loop to bring fresh data into the optimization engine on a continuous basis.
2.5. Research Gap
Based on this review, it is clear that although process mining, LCA, and MOO have each advanced significantly on their own, there is a serious gap in combining them in a dynamic and effective way. What is often missing is a seamless connection from real-time data collection to integrated analysis and decision-ready recommendations, potentially using advanced AI techniques for tasks such as unsupervised detection of anomalies in resource consumption, such as electricity use [
21], to provide more proactive insights. Specifically, a robust framework that uses real-time data from process mining to monitor actual performance, calculates environmental impacts using live sensor data, and feeds both into an MOO engine such as NSGA-II. This would enable the generation of Pareto-optimal solutions that weigh sustainability and efficiency in real time. The approach should run on scalable infrastructure like cloud systems, include tools like TOPSIS to turn results into decisions, and be thoroughly tested in a real-world factory setting. The framework proposed in this study addresses all these needs, offering a dynamic and data-driven way to improve both productivity and environmental responsibility in modern manufacturing.
3. Materials and Methods
This section details the architecture and operational steps of the proposed cloud-based, data-driven framework for integrated optimization of operational efficiency and environmental sustainability. The framework combines the Integrated Process Mining and Sustainability Monitoring Framework (IPSMF) for data collection and analysis with the Multi-Objective Optimization Model for Operational and Environmental Performance (MOOM-OEP) for decision support.
3.1. Framework Architecture and Cloud Enablement
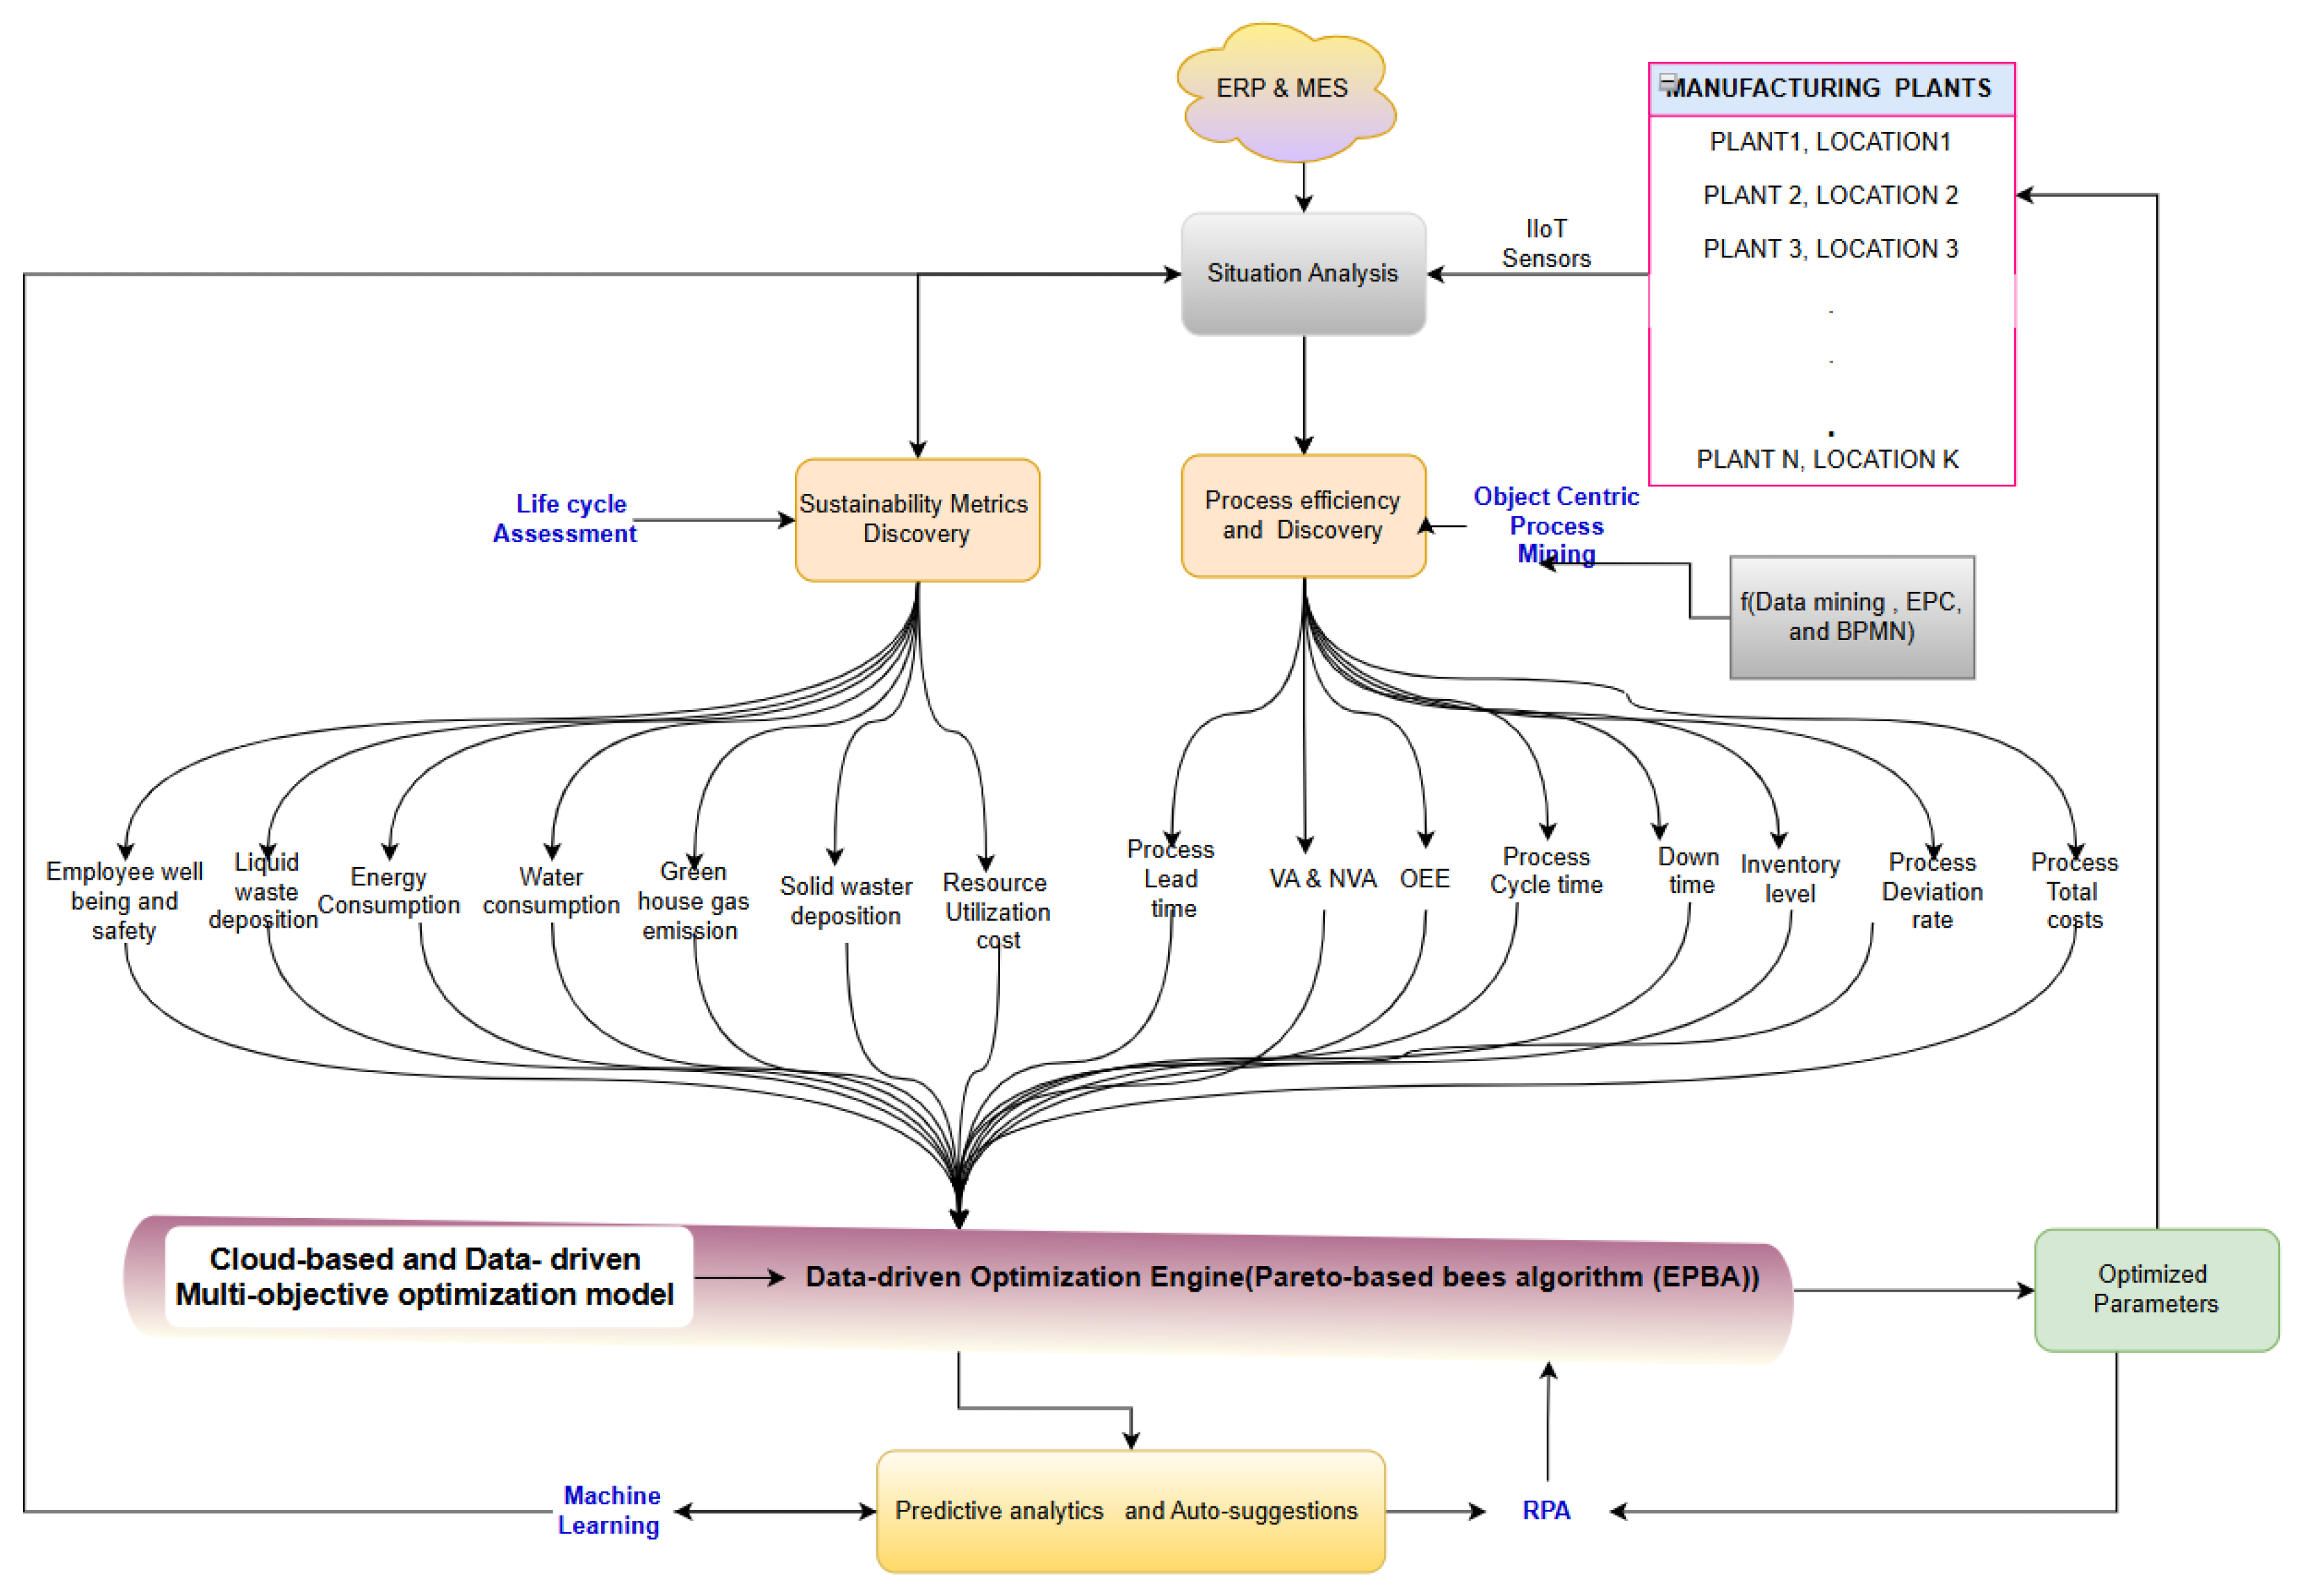
The overall architecture, depicted conceptually in
Figure 1, establishes a systematic flow from real-time data acquisition to optimized parameter recommendations. This figure illustrates the conceptual framework proposed in this study, which leverages a cloud computing infrastructure as a foundational element, recognizing the trend toward cloud manufacturing and the need for advanced data analytics in modern systems [
22,
23]. For specific applications of machine learning in manufacturing process modeling and optimization. The cloud platform is crucial for the following:
Data Ingestion and Storage: Handling high-speed, high-volume data streams from numerous sensors and manufacturing systems (ERP, MES) across potentially many production lines [
24,
25].
Scalable Computation: Providing on-demand computational resources required for demanding tasks such as process discovery algorithms (e.g., Inductive Miner), real-time LCA calculations, and complex multi-objective optimization solvers (NSGA-II) [
23,
26]. Moreover, the efficient utilization and optimization of these cloud resources themselves are critical aspects, often addressed through exploratory data analysis and machine learning techniques [
27].
Integration and Centralization: Acting as a central hub to integrate diverse data sources and make processed information and optimization results accessible to relevant stakeholders and downstream control systems.
Real-time Analytics: Facilitating the timely processing and analysis needed to derive actionable insights from live data streams, moving beyond traditional batch processing.
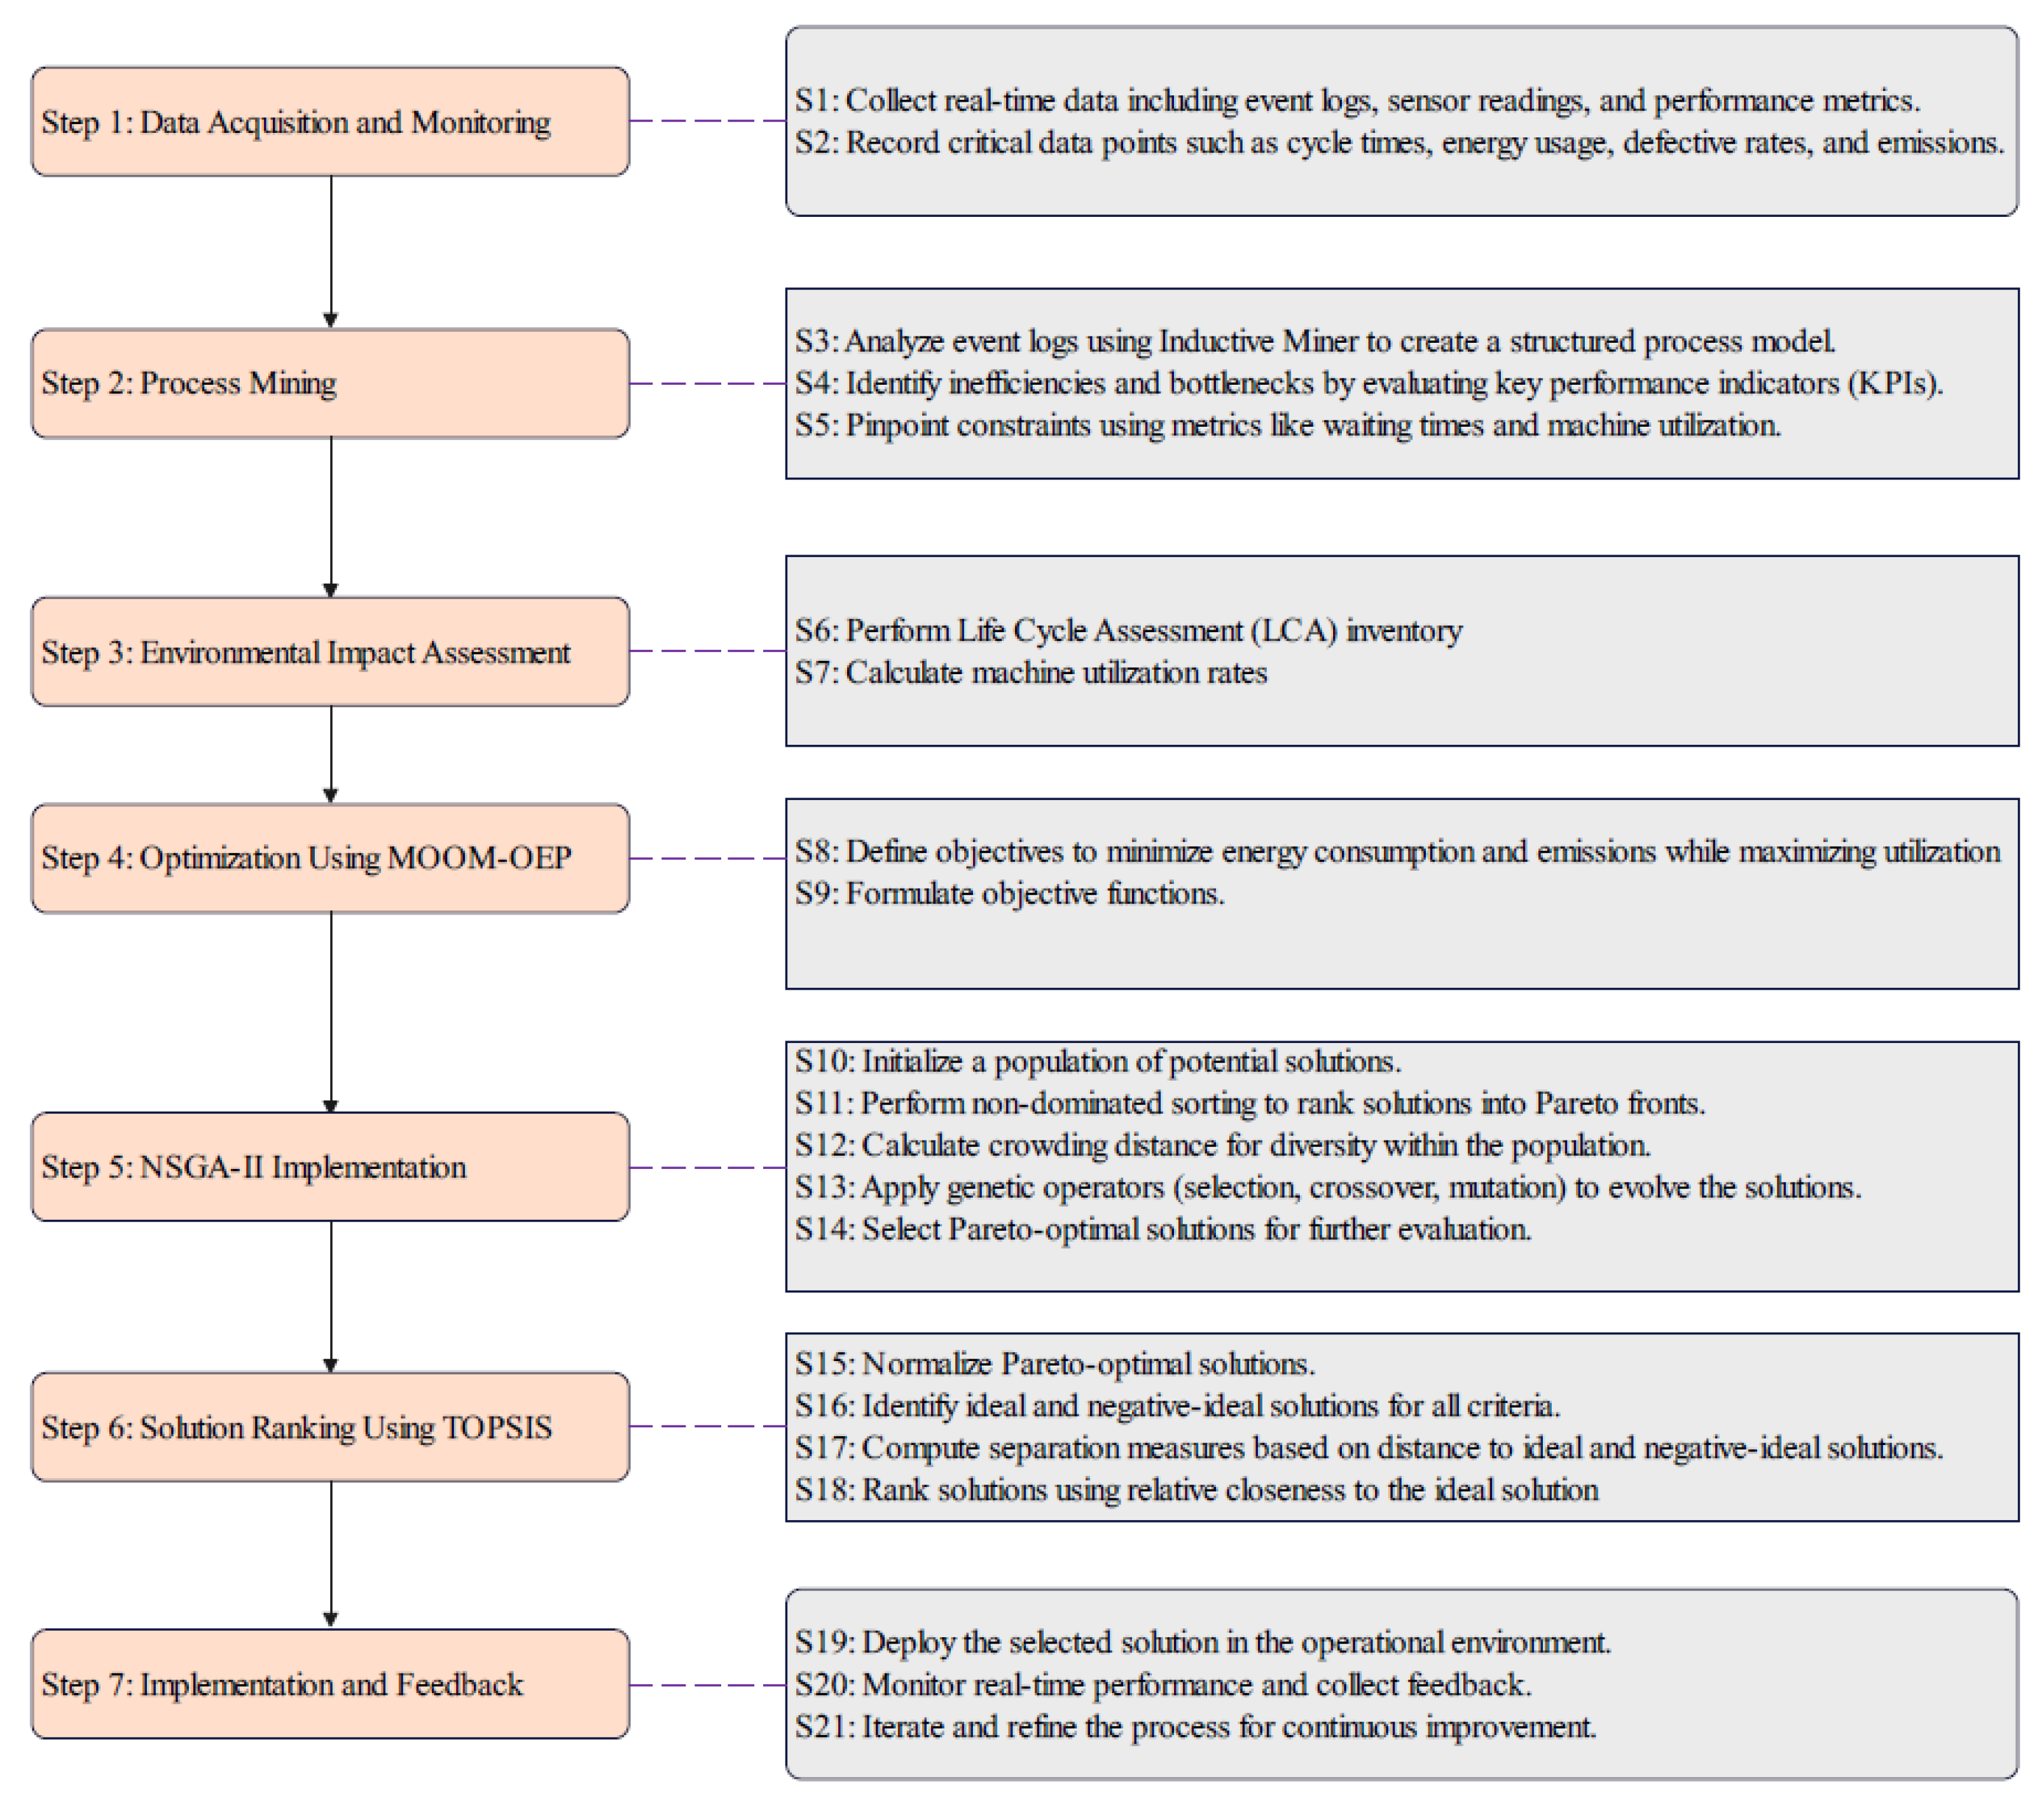
The methodology follows a structured sequence of steps, illustrated in
Figure 2, ensuring a systematic approach from data collection to actionable insights.
3.2. Step 1: Data Acquisition and Monitoring
The process begins with the continuous collection of relevant data from the manufacturing environment (S1, S2). This involves the following:
Event Log Generation: Capturing timestamped events from MES or machine controllers, detailing activities performed, the associated case identifier (e.g., production order ID) and the resource/machine involved. This forms the basis for process mining, represented abstractly as follows:
where
L is the event log,
is a trace (case) and
are events within the trace.
Sensor Data Collection: Gathering real-time readings from sensors (e.g., power meters, temperature sensors).
Contextual Data Integration: Accessing relevant data from ERP or planning systems (e.g., schedules, material specifications, emission factors).
3.3. Step 2: Process Mining for Operational Insight
The event logs collected (
L) are fed into the process mining module (S3, S4, S5) [
6]:
3.4. Step 3: Dynamic Life Cycle Assessment (LCA) Inventory
The framework performs a dynamic LCA inventory analysis using real-time data to quantify environmental burdens at the process-instance level (S6, S7). This step moves beyond traditional static LCA by linking live data to environmental impacts, forming a basis for subsequent optimization. The analysis, which informs visualizations like the one presented in Figure 5 in the
Section 4, includes the following:
Energy Consumption (EC): Calculated by integrating power readings
over operational time
:
Carbon Emissions (CE): Estimated using activity levels (e.g.,
) and emission factors
: [
2,
14,
29]
Waste Generation (WG): Quantified from detected defects
and conversion factors
:
3.5. Step 4: MOOM-OEP Formulation
The Multi-Objective Optimization Model (MOOM-OEP) uses insights from Steps 2 and 3 to define and solve the optimization problem (S8, S9) [
30,
31].
3.5.1. Decision Variables
: Continuous variable representing the processing time (in seconds) for activity k on machine j in line i. This variable is a key determinant of cycle time and throughput.
: Binary variable () for the assignment of activity k to machine j in line i. This is used for routing decisions where alternatives exist.
: Continuous variable representing the allocation of a divisible resource (e.g., energy budget in kWh, or operator time as a percentage) to activity k on machine j in line i. This is distinct from processing time and governs the intensity of the operation.
: Cloud computational load generated by machine j in line i.
3.5.2. Objective Functions
The goal is to find solutions
x (configurations of decision variables) that [
5,
19]:
Maximize Operational Efficiency (
):
Minimize Environmental Impact (
):
where n is the number of lines, m the number of machines, and p the number of activities. The performance metrics for the specific activity under configuration x are , , , , , , and . The weighting factors reflect the relative importance and were normalized to 1.0 for the main optimization run, while the TOPSIS sensitivity analysis explored different priority scenarios.
3.5.3. Constraints
The optimization is subject to the following:
Operational Constraints [
32]:
Environmental constraints:
Resource Allocation Constraints:
Activity Sequencing Constraints:
Cloud Capacity Constraints:
where
. The effective management and optimization of such cloud capacity to ensure efficient resource utilization is an important consideration, often tackled with data-driven approaches and machine learning [
27].
Binary Decision Constraints:
3.6. Step 5: Multi-Objective Optimization Using NSGA-II
The MOOM-OEP problem (Maximize
, Minimize
subject to constraints (
9)–(
19)) is solved using the Non-Dominated Sorting Genetic Algorithm II (NSGA-II) (S10–S14) [
32]. Key hyperparameters for the NSGA-II implementation included a population size of 100, a crossover probability of 0.9, a mutation probability of 0.1, and termination after 200 generations.
Initialization: Generate initial population of size N.
Evaluation: Calculate and for all .
Non-Dominated Sorting: Rank solutions into fronts
based on Pareto dominance.
dominates
if
For consistency with the Pareto dominance check, which typically assumes maximization for all objectives, the environmental impact (a minimization objective) is reformulated as .
Crowding Distance Calculation: Compute distance
for solution
within its front
to maintain diversity:
where
objectives, solutions
are neighbors in the sorted list for objective
l, and
are max/min values for objective
l.
Selection, Crossover, Mutation: Use tournament selection (based on rank and
), simulated binary crossover (SBX), and polynomial mutation to create an offspring population
.
Population Update: Combine . Select the best N solutions from based on non-domination rank and crowding distance to form .
Termination: Stop after a fixed number of generations. The final non-dominated set is the Pareto-optimal front
:
3.7. Step 6: Solution Ranking Using TOPSIS
The Technique for Order Preference by Similarity to Ideal Solution (TOPSIS) ranks the solutions in
(S15–S18) [
23].
Normalize Decision Matrix: Normalize the objective values () for solutions in .
Determine Ideal/Negative-Ideal Solutions:
Using normalized values
where
i is the solution, and
j is the objective index:
where
is the best value for objective
j, and
is the worst.
Calculate Separation Measures: Compute Euclidean distances for solution
i:
Compute Relative Closeness:
where
.
Rank Solutions: Rank solutions in descending order of .
3.8. Step 7: Implementation and Feedback
The selected optimal configuration (often the top-ranked by TOPSIS or chosen based on priorities) is implemented (S19). Continuous monitoring (Steps 1–3) provides feedback for iterative refinement and adaptation (S20, S21) [
33,
34].
3.9. Process Response Measurement and Uncertainty
Process response metrics were measured as follows:
Operational KPIs: Cycle Time (CT) and Idle Time (IT) were calculated directly from the timestamped event log by measuring the duration between start and end events for each activity and the time between the end of one activity and the start of the next. Throughput (TP) was calculated as the number of completed cases per day.
Environmental KPIs: Energy Consumption (EC) was measured by dedicated power meters on each machine, with data logged in kWh. Carbon Emissions (CE) were derived from EC using standard regional emission factors. Waste Generation (WG) was quantified based on the count of rejected products at inspection points, multiplied by the average weight per unit.
Regarding uncertainty, the primary source lies in sensor precision and data logging granularity. To mitigate this, we worked with data from recently calibrated sensors as per the facility’s maintenance schedule. A data cleaning and pre-processing pipeline was implemented to handle missing values and filter out obvious outliers before analysis. The results presented are, therefore, based on the highest quality data available, though we acknowledge that a degree of measurement uncertainty inherent to any industrial sensing system remains.
3.10. Case Study
This case study focuses on a state-of-the-art tube manufacturing facility that operates ten online production lines and four offline machines to meet the diverse requirements of the cosmetic, dental care, and decoration sectors. Each production area is specialized to meet specific customer needs. The cosmetics sector includes lines such as TL201–TL207, which are dedicated to producing high-quality tubes for beauty products. The dental sector, comprising the lines TL205, TL206, TL209, and TL210, specializes in creating packaging customized for oral care products. Meanwhile, the decoration sector focuses on enhancing the appearance of semi-finished products using silk screening and hot stamping techniques. Although production technology is largely uniform across most lines, the dental sector integrates additional specialized processes for its unique product requirements. Among these, the TL209 line is chosen as a representative model for this study, providing an insight into the operational workflows and optimization strategies.
The manufacturing process follows a structured sequence of interconnected stages, each supported by advanced machinery and quality control mechanisms. The process begins with laminate strips being processed in the tube production machine, where they are cut, welded, and coated with a plastic layer for durability. These semi-finished tubes are then calibrated and cooled using a vacuum module to ensure structural integrity and precise dimensions. Following this, the cutter and retractor module inspects the tubes for any defects, utilizing eddy current technology to measure tube diameters and verify the quality of the aluminum layers. Any detected anomalies are flagged for further analysis.
Subsequently, the head and capping stage mold the tube heads using molten plastic and securely attach the caps. Rigorous quality checks are performed at this stage to ensure proper alignment and sealing. The process then progresses to the printing and varnishing stages, where up to eight colors are applied using UV-cured inks, followed by a varnish layer for added protection. Synchronization between the printing and varnishing machines is critical to maintain consistent quality across the production batch. The final stage involves the automated packaging of finished tubes in cartons or pallets according to customer specifications.
Real-time monitoring plays a crucial role in maintaining production efficiency and quality. Sensors placed strategically along the production line collect data on key parameters, including tube counts, diameters, cap alignment, sealing, and printing quality. Defective tubes are identified and automatically diverted for further inspection. The TL209 line is particularly notable for its advanced quality control features, which include storage devices to ensure continuous operation, multiple-stage eddy current checks to maintain material integrity, and UV curing systems to allow rapid drying without compromising production speed.
By examining the TL209 line, this case study highlights how real-time data and advanced technological integration can optimize both operational efficiency and sustainability. It also demonstrates how specialized processes across dental sector lines like TL205, TL206, and TL210 contribute to meeting specific product demands. The insights derived from this study emphasize the importance of leveraging modern manufacturing technologies to achieve a balance between high productivity and environmental responsibility, setting a benchmark for similar facilities.
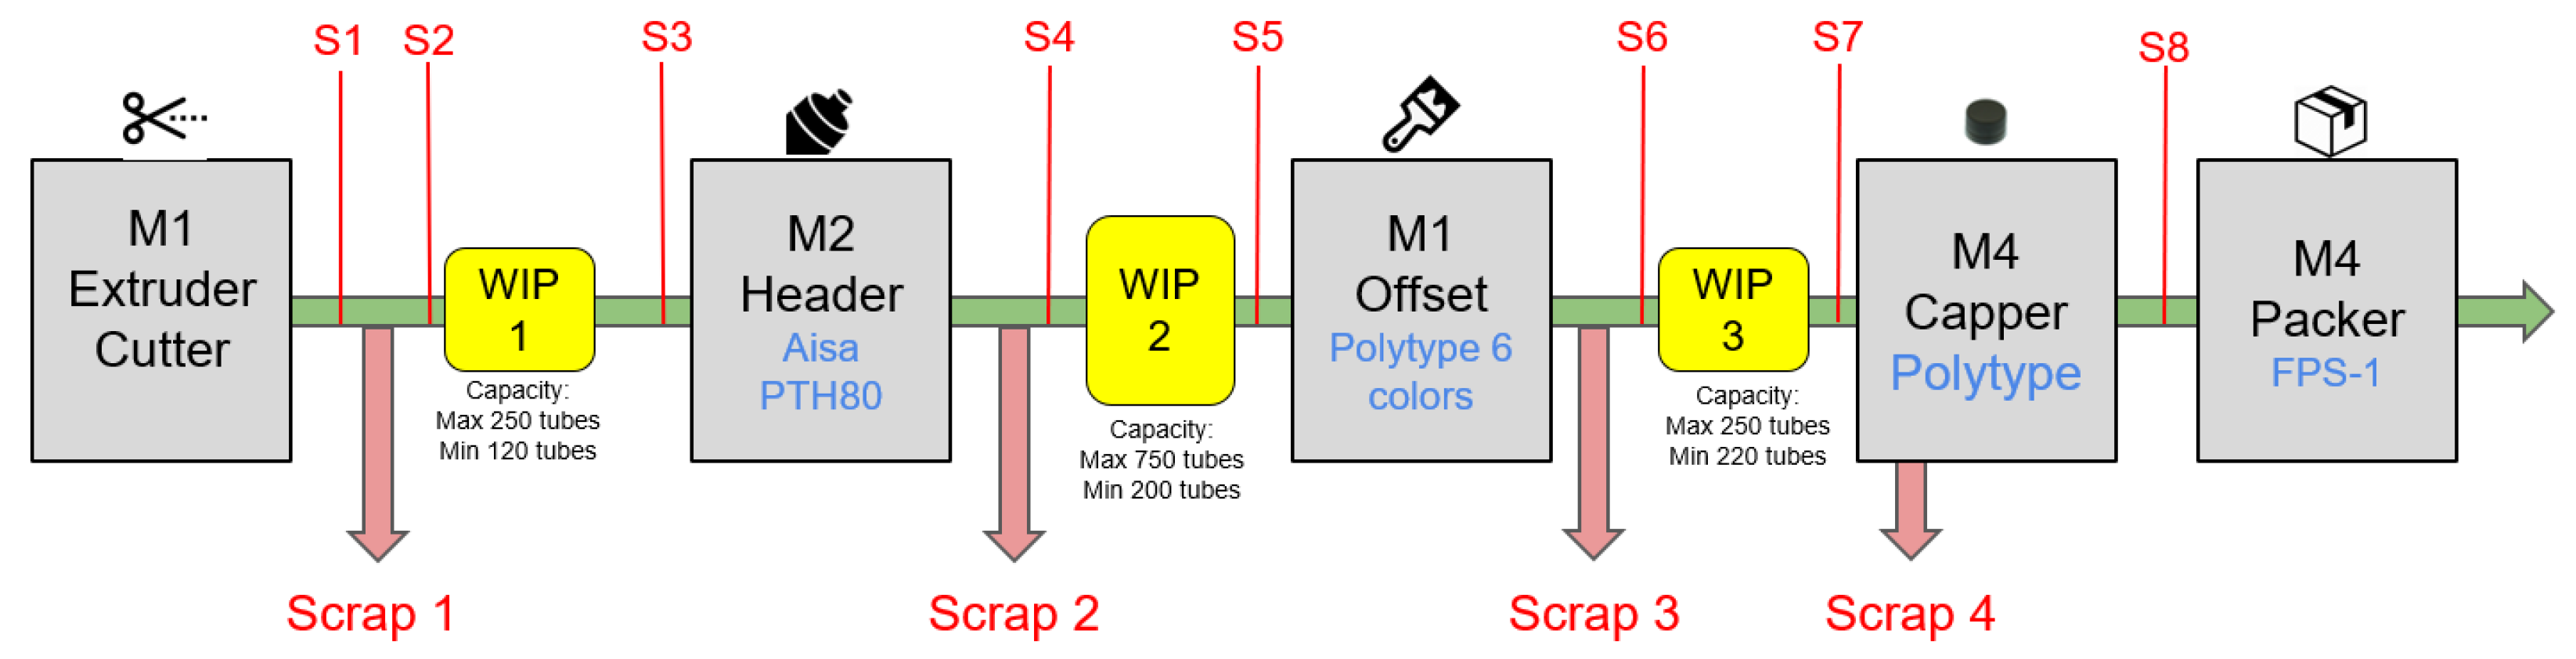
3.11. Production Flow and Sensor Placement
The production process begins with the tube production machine, where laminate strips are transformed into semi-finished tubes. This stage includes cutting, high-frequency welding, and coating the tubes with a plastic layer. These tubes then pass through a calibration and cooling phase. Sensors S1 (optical counter), S2 (diameter gauge), and S3 (eddy current sensor for aluminum layer integrity) are placed at this stage to monitor tube formation and detect anomalies in size or structure.
After this, the tubes move to the head and capping unit, where tube heads are formed using molten plastic and caps are attached. Sensors S4 (vision system) and S5 (torque sensor) track cap alignment and sealing quality. The subsequent stage is printing and varnishing, where designs are applied using UV-dried inks, and a varnish layer is added for protection. Sensors S6 through S8 (vision systems for color registration and defect detection) ensure that the final appearance satisfies quality standards. Energy consumption for each major unit (Extruder, Header, Capper, Printing) is monitored by dedicated power meters integrated into the MES. The final step involves packaging, where the tubes are automatically sorted, oriented, and placed in cartons or pallets according to customer specifications. While confidentiality agreements prevent the publication of equipment photographs,
Figure 3 and
Figure 4 provide schematic diagrams of representative production lines.
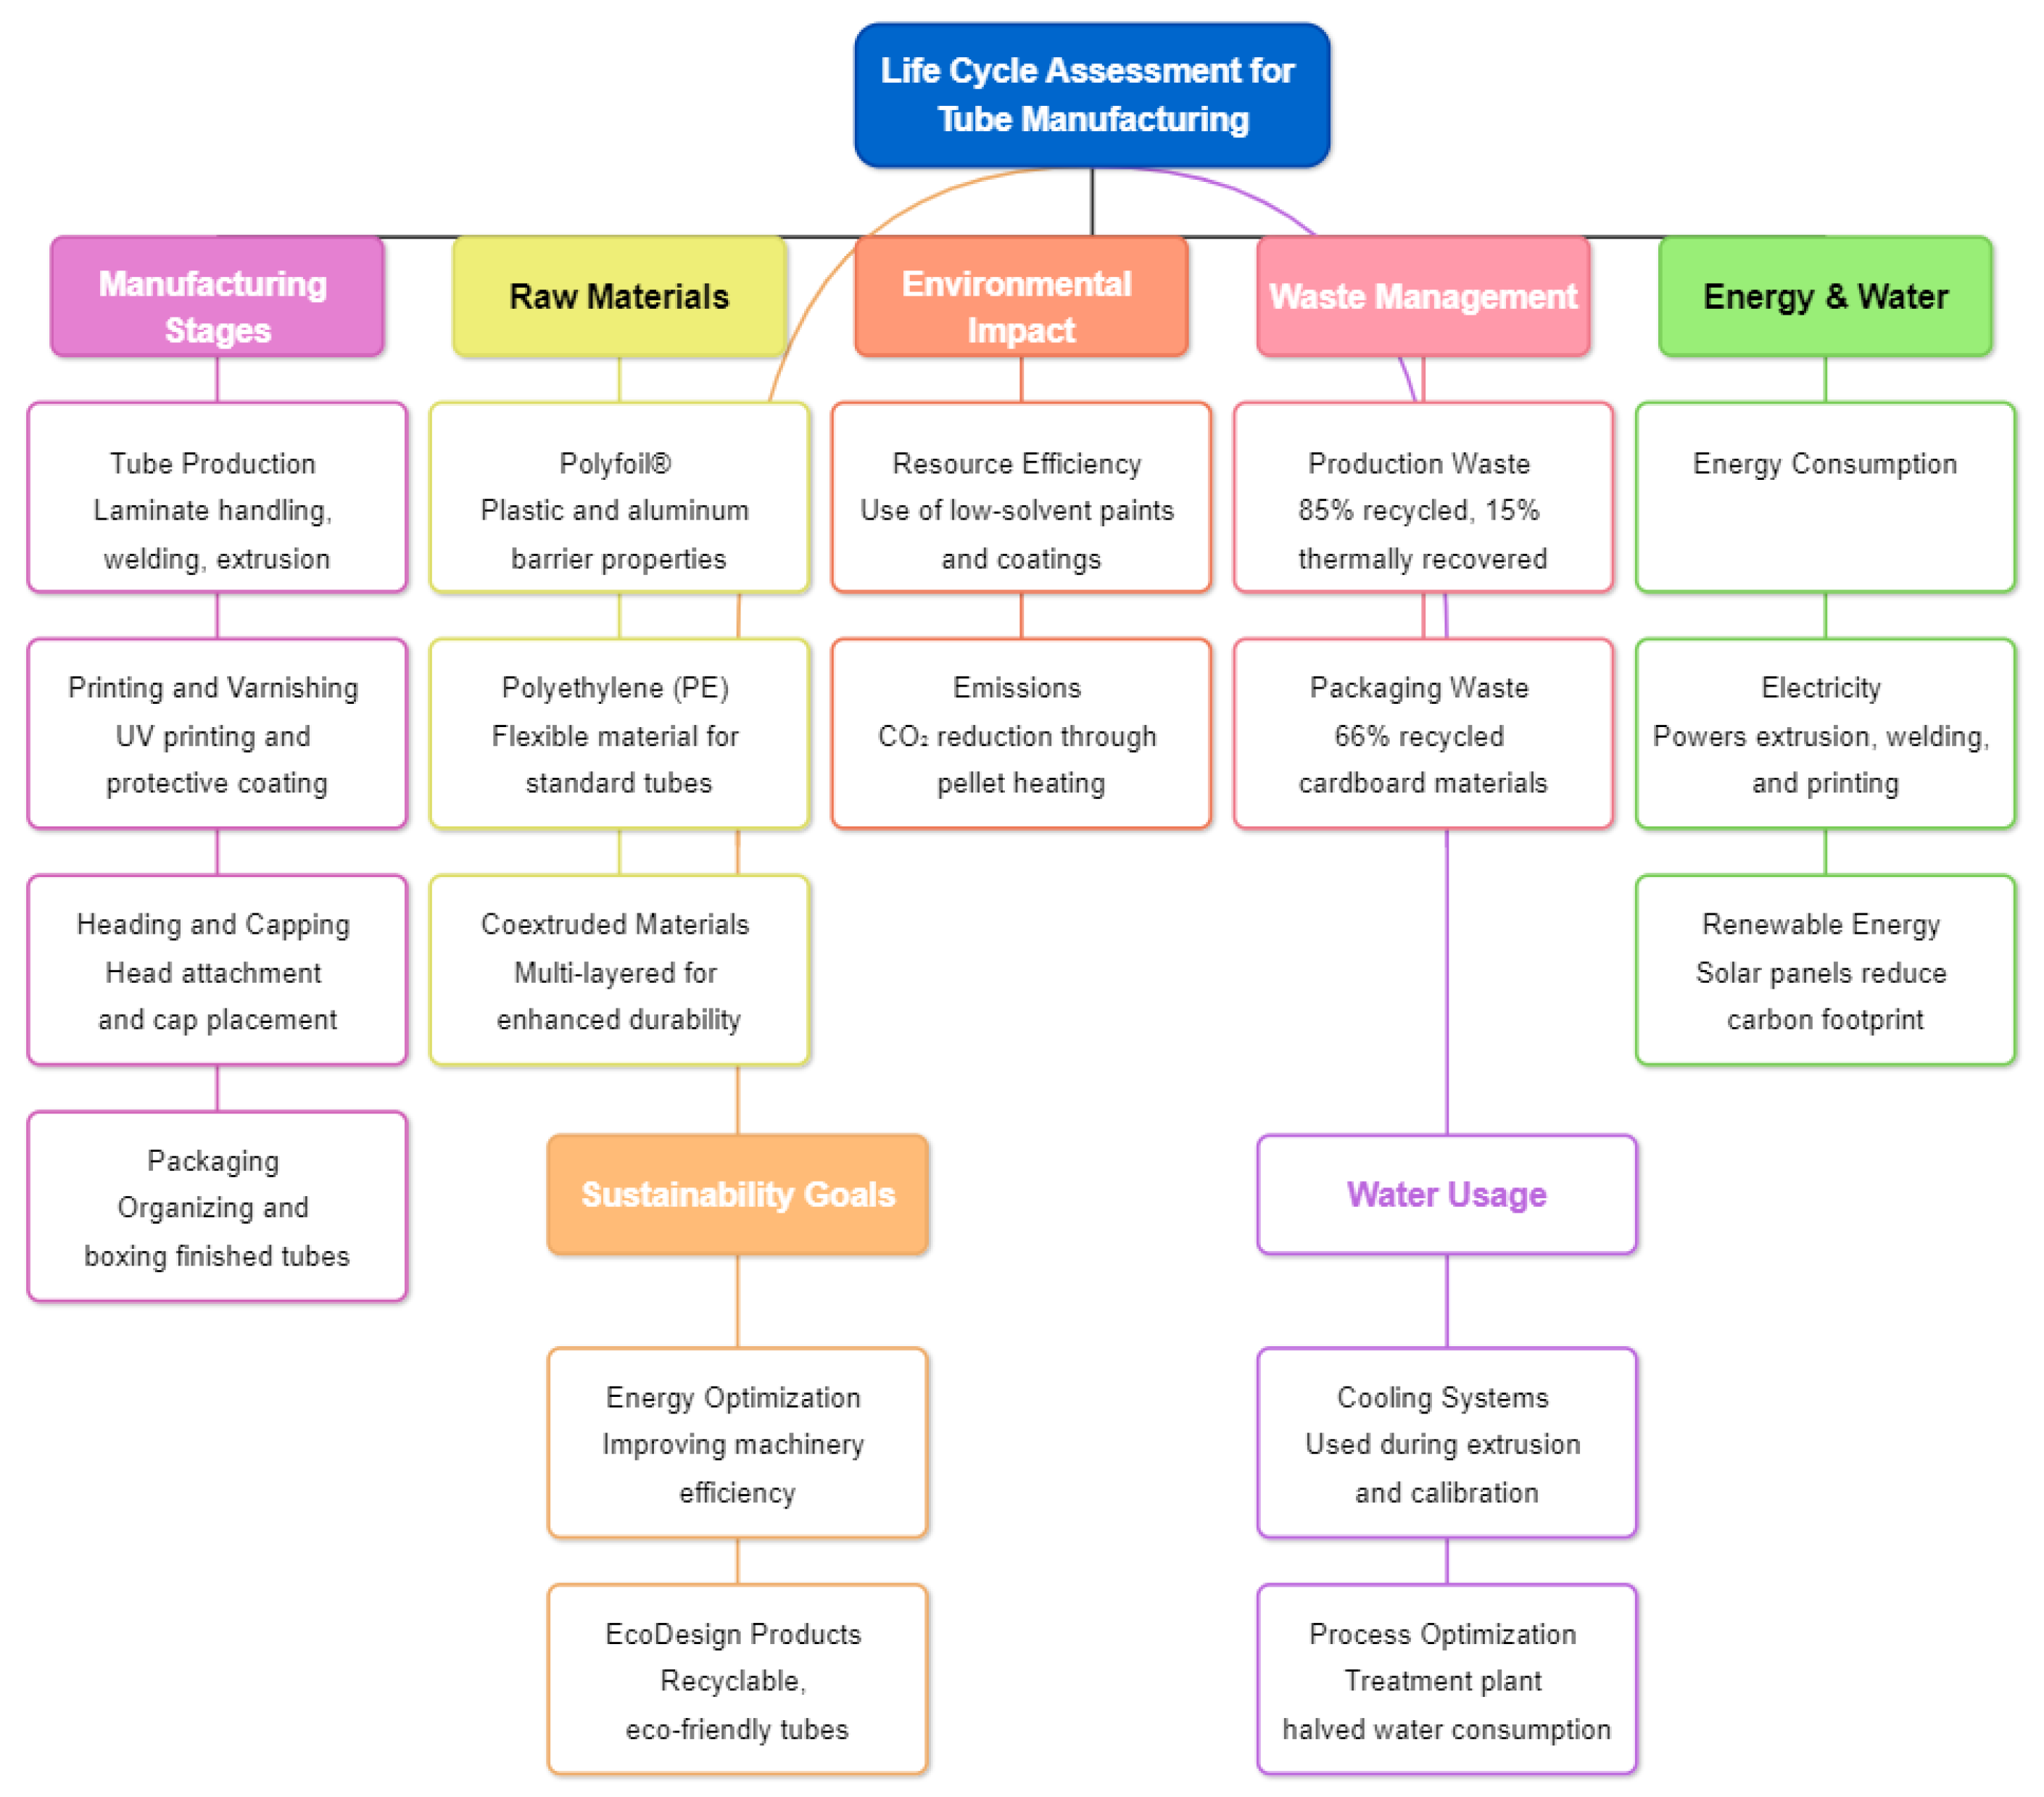
The Life Cycle Assessment (LCA) for this facility is summarized in
Figure 5. It evaluates the environmental and operational impacts of the production process, from the sourcing of raw materials to the final product. The process begins with materials like Polyfoil
® (a combination of plastic and aluminum for barrier properties), polyethylene (PE) for flexible tubes, and coextruded materials for durability. These materials ensure quality and suitability for a variety of applications.
Energy consumption is a major component, and electricity drives key operations like extrusion, welding, and UV printing. Renewable energy, such as solar panels, reduces the dependency on fossil fuels. Water is mainly used for cooling in extrusion and calibration processes, and centralized treatment plants have significantly reduced overall water usage.
The manufacturing process includes tube production (laminate handling, welding, extrusion), quality control (calibration and inspection), heading and capping (attaching tube heads and caps), printing and varnishing (for aesthetics and durability), and packaging (organizing and boxing). Each stage ensures precision and efficiency in production.
Waste management focuses on recycling, with 85% of production waste being reused and 15% thermally recovered. Packaging waste is minimized by using materials with a high recycled content. Environmental impacts, including CO2 emissions, have been reduced through energy-efficient systems like pellet heating, and low-solvent paints are used to improve resource efficiency.
4. Results and Discussion
This section presents the results obtained from applying the proposed integrated framework to the real-world tube manufacturing case study. The findings validate the framework’s capability to analyze performance, identify trade-offs, and provide optimized solutions balancing operational efficiency and environmental sustainability, contextualized against relevant prior research.
4.1. Validation Approach
The effectiveness of the framework was validated using historical and real-time data collected from sensors and MES logs within the tube manufacturing facility described in
Section 3. The data encompassed operational parameters (cycle times, throughput, idle times, defect rates) and environmental metrics (energy consumption, derived emissions, waste generation), providing a rich dataset for analysis and optimization.
The process mining data transformation converted raw sensor data (32,257 rows of hourly snapshots across 123 columns) into actionable optimization inputs. This raw data were transformed into a granular event log suitable for process mining (S1). An event was generated each time a machine’s status sensor changed its state (e.g., from ‘idle’ to ‘running’). For continuous sensors like power meters, an event was recorded when the reading crossed a pre-defined operational threshold. This state-change detection approach converted the time-series data into a structured log of 391,127 discrete events (S2), each containing a CaseID, Activity, Timestamp, Resource, and Event Type.
Table 1 presents the first 10 events from this comprehensive event log, illustrating the granular nature of the collected data.
4.2. Baseline Performance Analysis and Bottleneck Identification (Pre-Optimization)
Before implementing optimization strategies, a baseline analysis was conducted using the integrated Process Mining and LCA monitoring capabilities of the framework (IPSMF).
4.2.1. Downtime Analysis
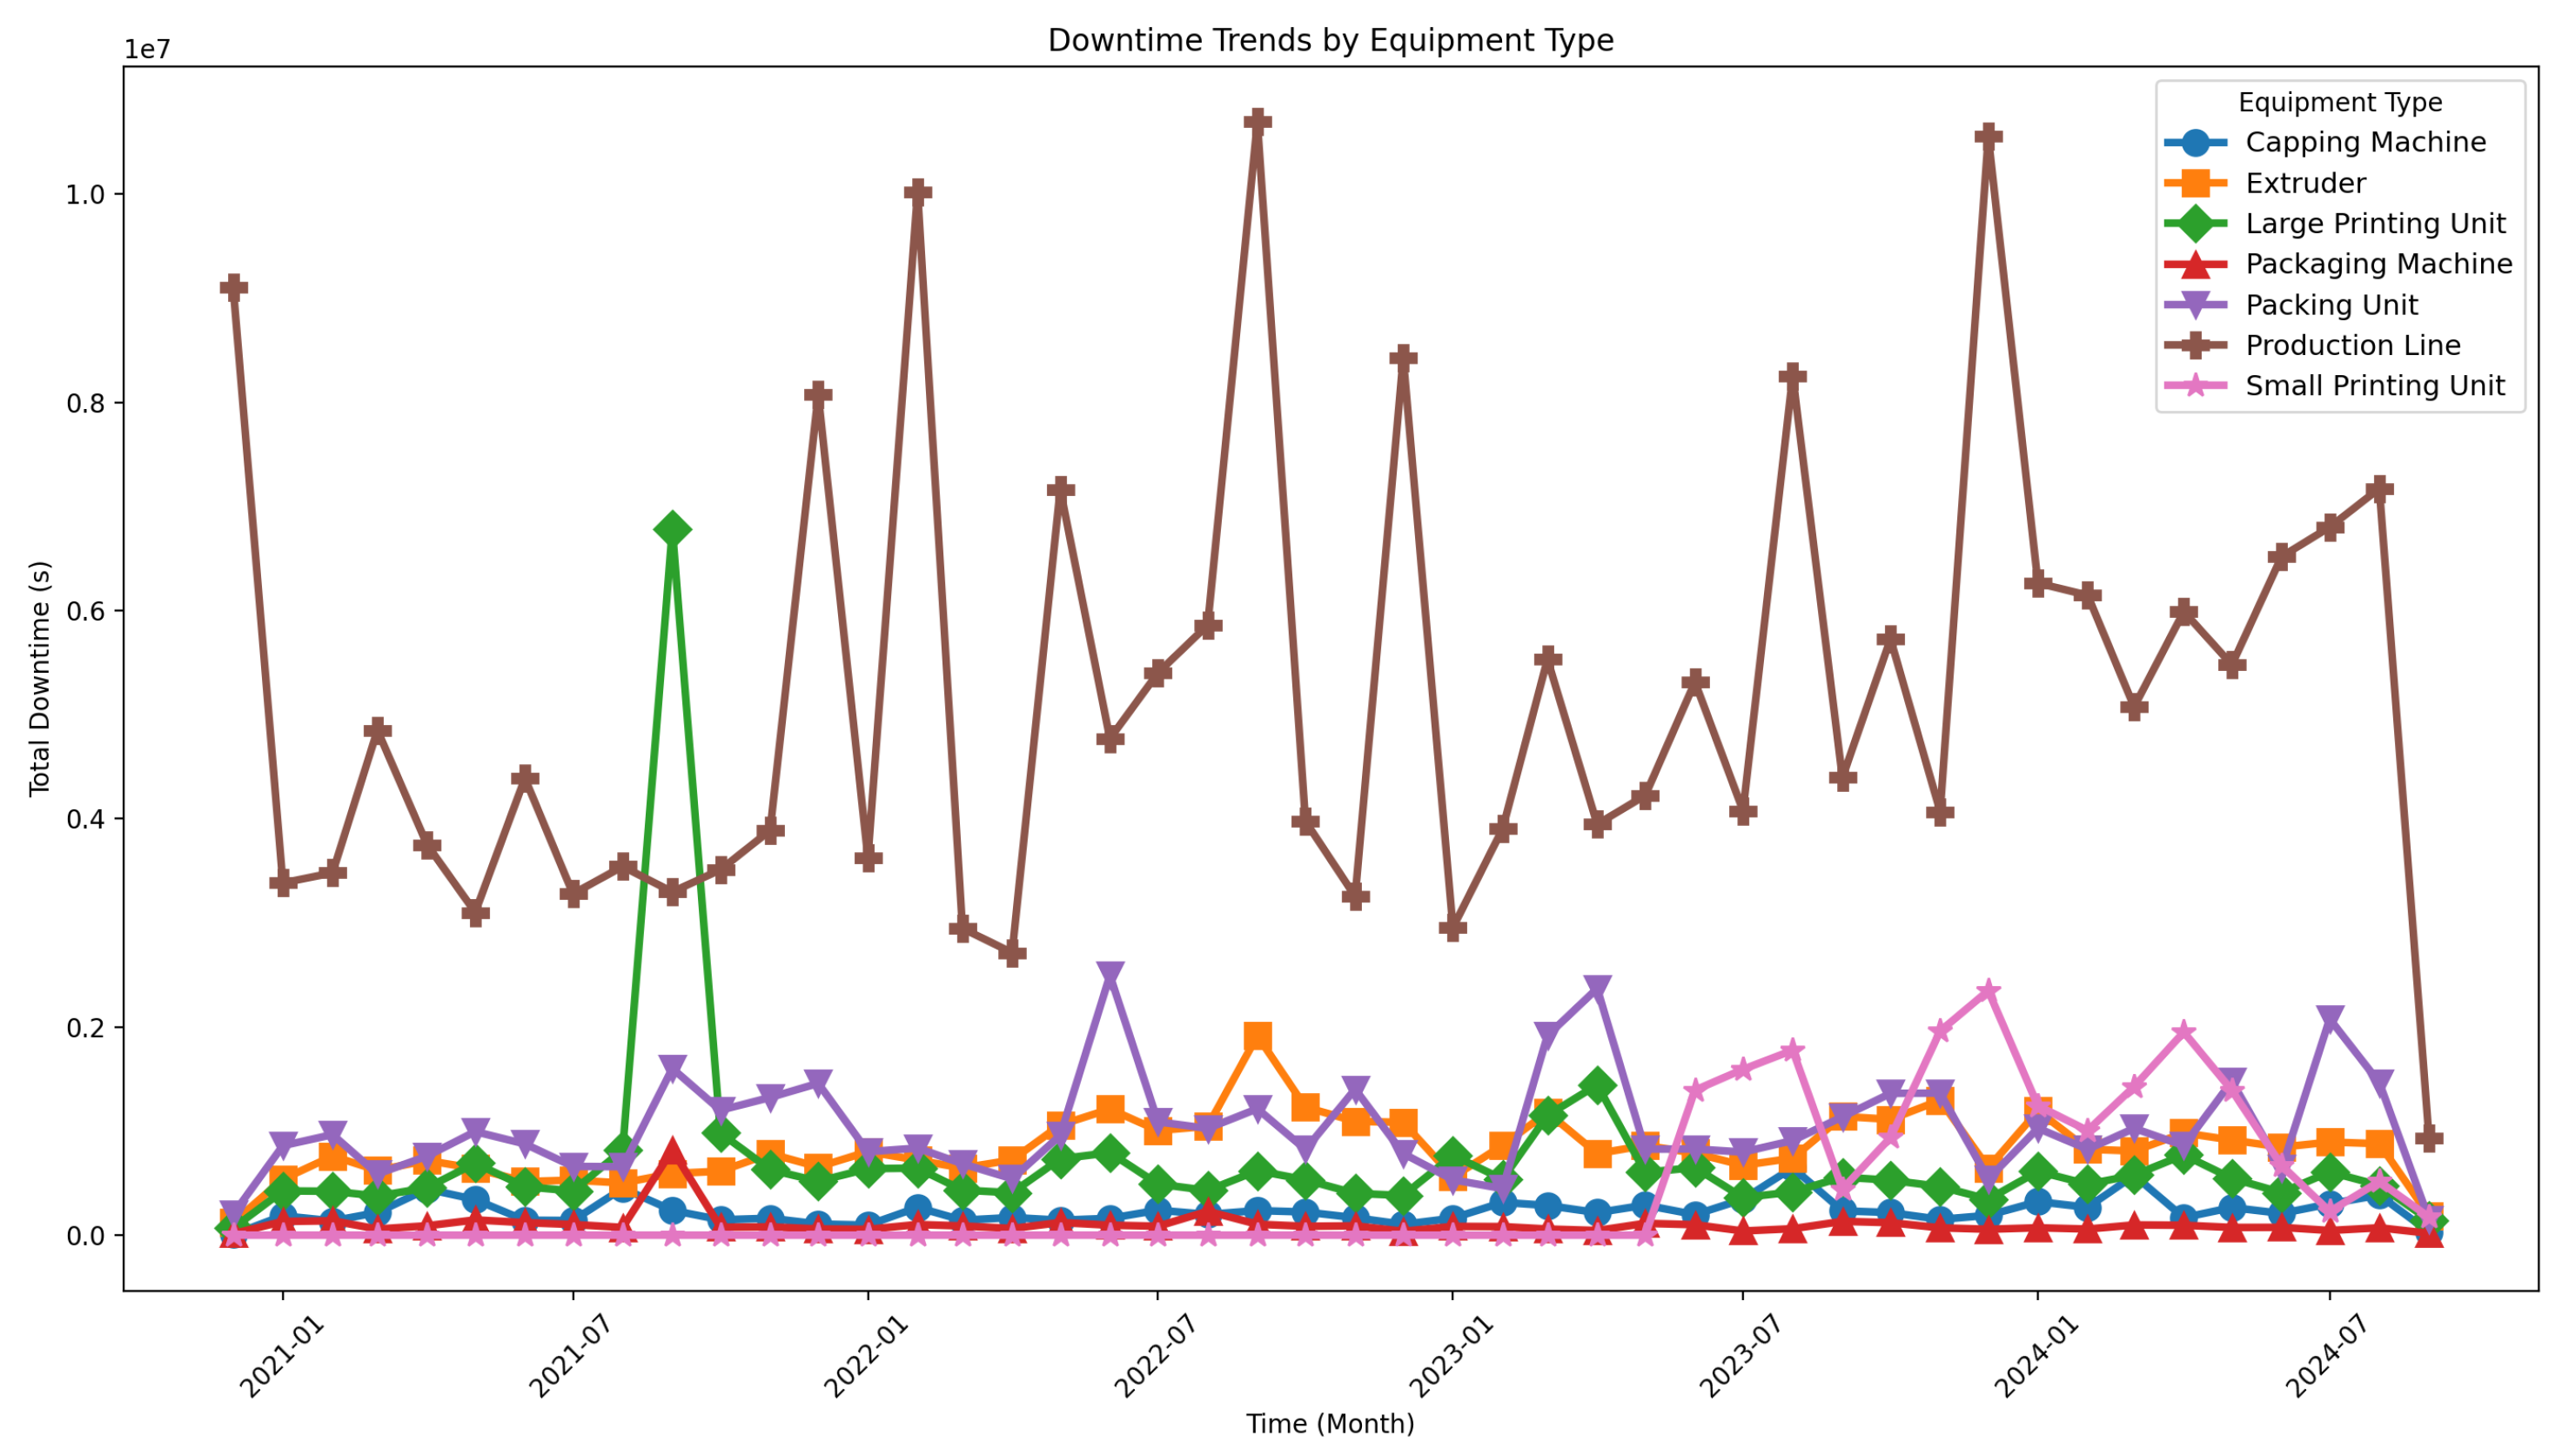
Figure 6 illustrates the monthly downtime trends. Monthly-aggregated downtime reveals a highly skewed distribution: the Production Line persistently accounts for the largest share of lost productive time, confirming its role as the system’s critical bottleneck [
7]. The Large Printing Unit follows as the second-largest source but displays sharper peaks, hinting at sporadic, event-driven stoppages that could be mitigated through targeted maintenance. Mid-tier assets Packing Unit, Extruder, Capping Machine, and Packaging Machine cluster far below the top two, indicating routine wear-and-tear rather than systemic failure. The Small Printing Unit shows minimal downtime, suggesting either lower utilisation or better control. This profile mirrors observations in other discrete-manufacturing studies, where a single high-capacity line and one specialised machine dominate downtime while secondary equipment exerts only incremental influence [
8]. Consequently, dedicating resources first to the Production Line and then to stabilising the Large Printing Unit should deliver the greatest uptime gains.
4.2.2. Process Discovery and Workflow Visualization
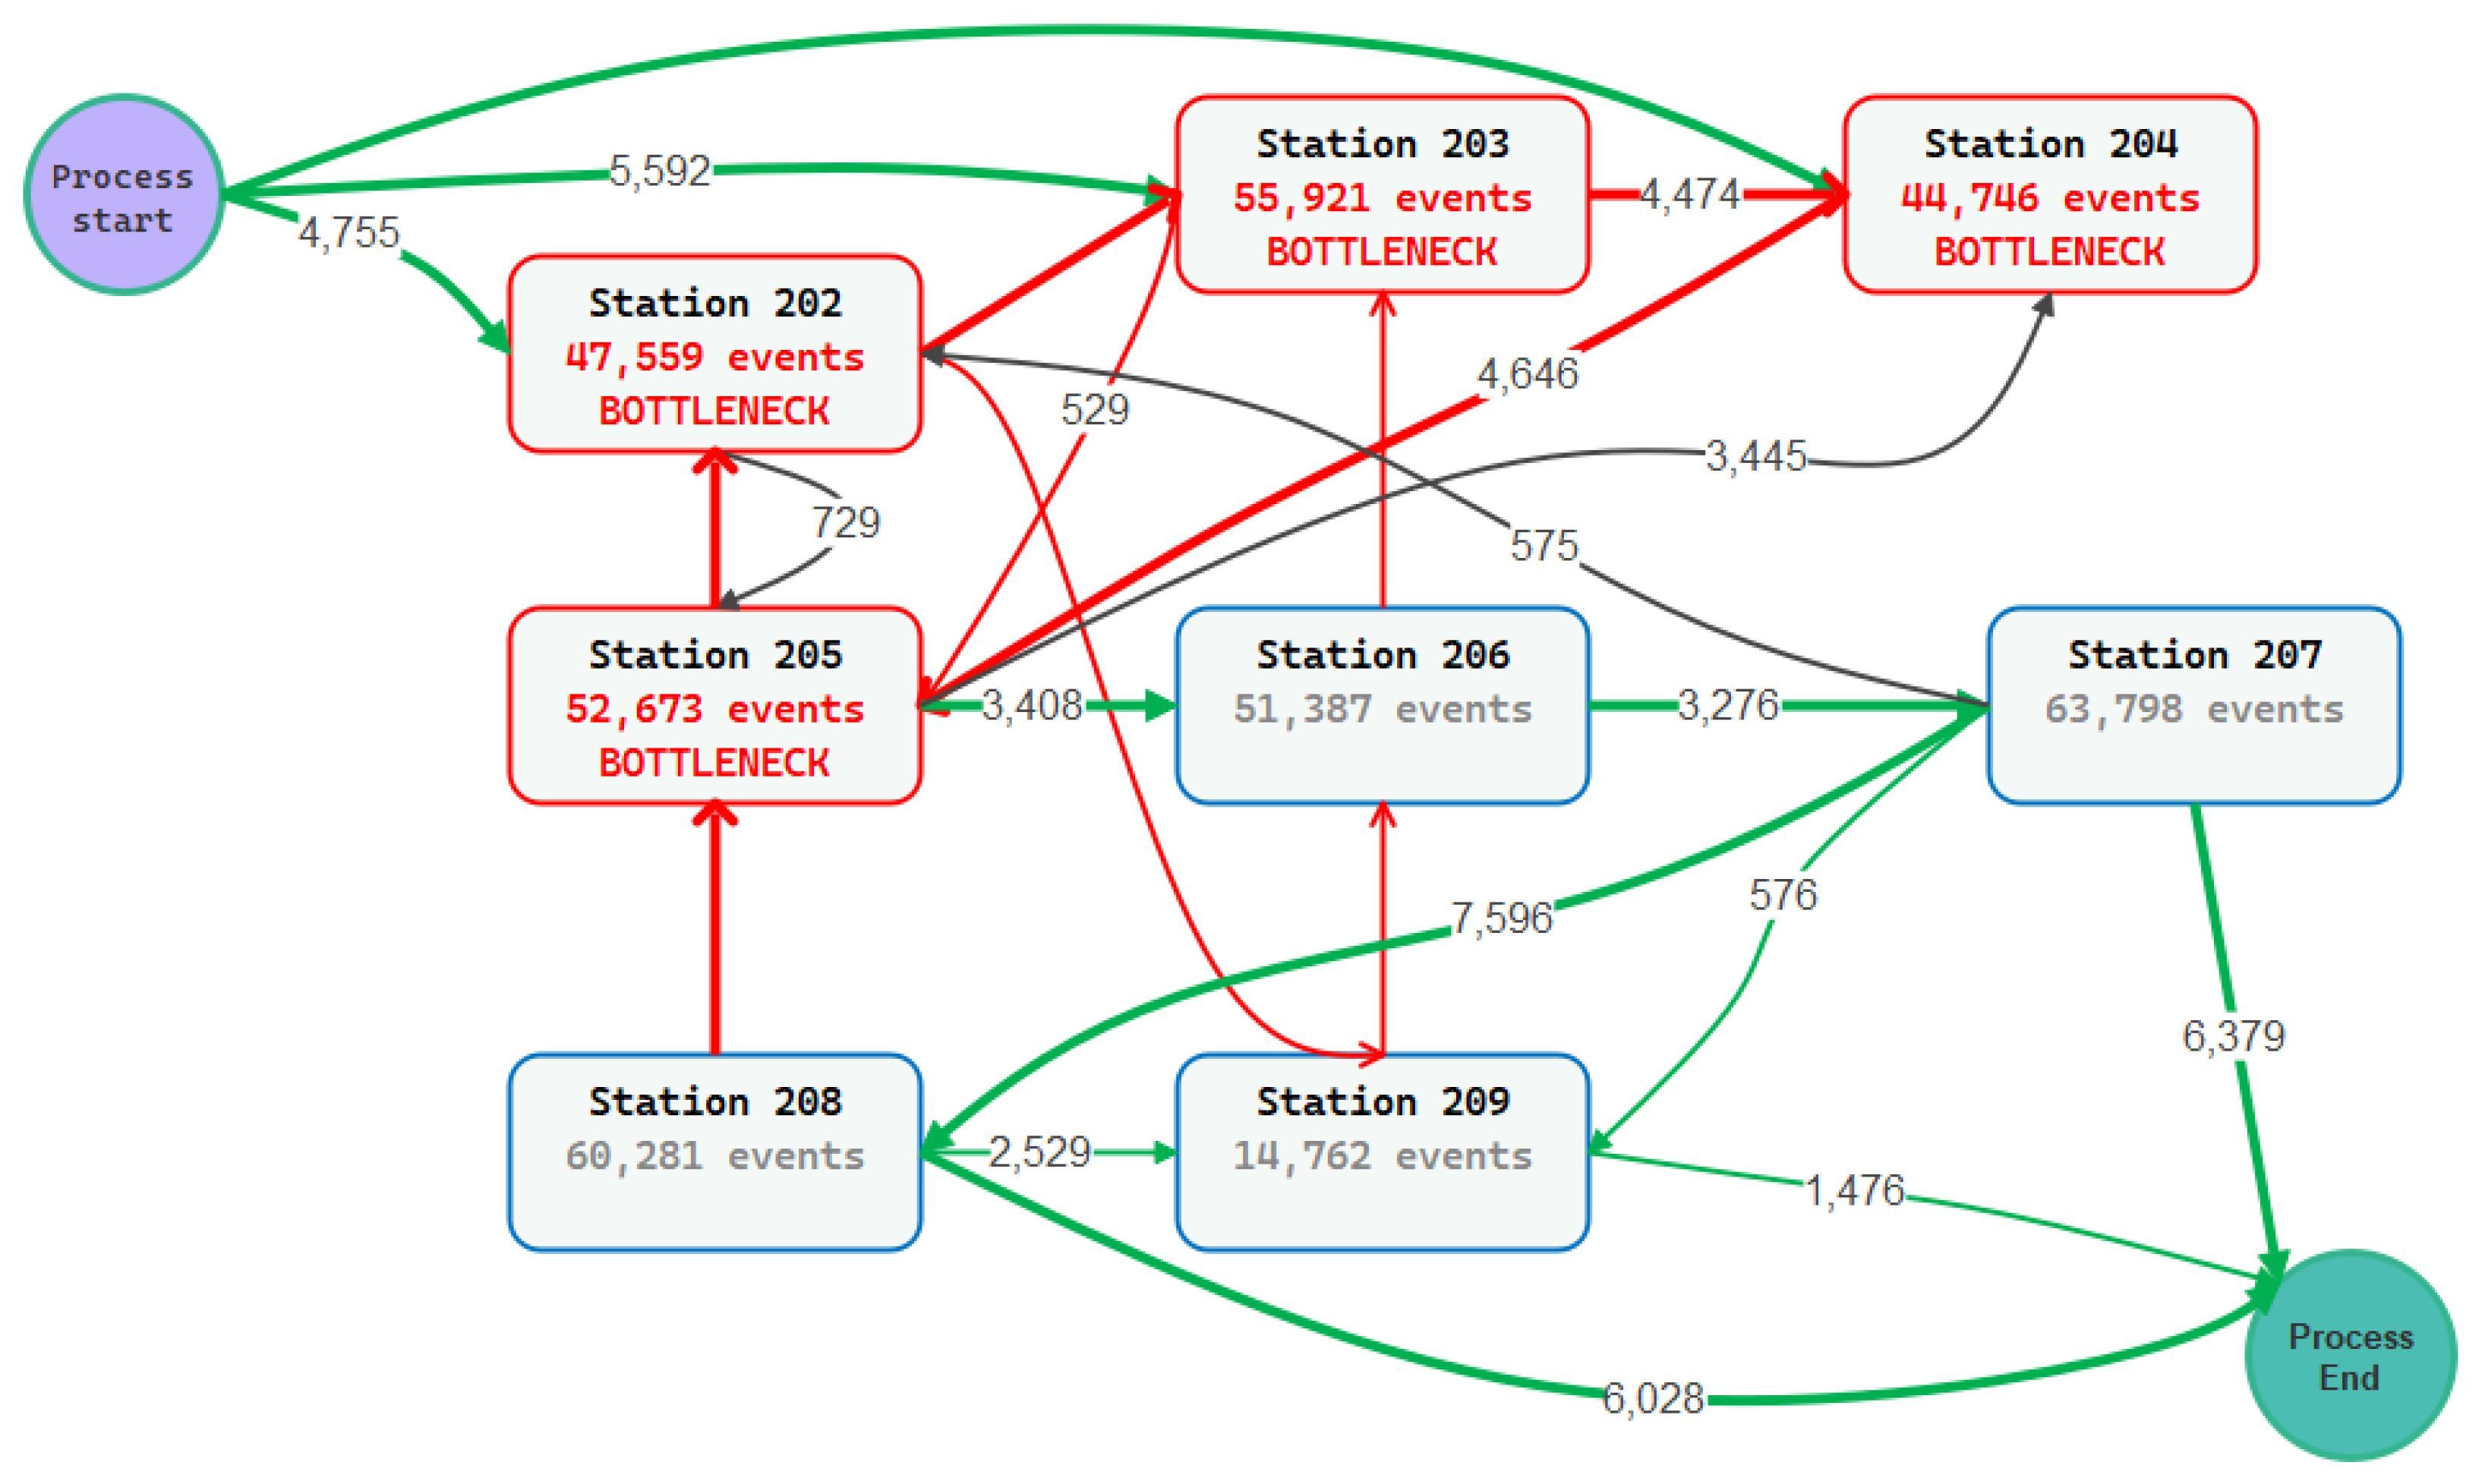
The process discovery analysis using Inductive Miner revealed the actual manufacturing workflow across nine active stations (201–209). The automatically generated process model (
Figure 7), a direct result of applying process discovery algorithms (S3), identifies five critical bottleneck stations (Stations 202, 203, 204, and 205), marked red in the visualization. This analysis of the model allows for the identification of inefficiencies (S4) and constraints (S5). The process flow shows distinct transition patterns:
High-frequency transitions (>4000 events): Station 202 → 203 (5592), Station 203 → 204 (4474), Station 204 → 205 (4646)
Medium-frequency transitions (2000–4000 events): Station 205 → 206 (3408), Station 206 → 207 (3276), Station 207 → Process End (6379)
Critical bottleneck transitions: Process Start → 202 (4755), indicating initial process constraints
4.2.3. Duration by Activities
The analysis of station durations revealed significant variations in operational hours across the manufacturing line (
Figure 8). The four bottleneck stations (202–205) showed the highest operational durations, each exceeding 10,000 h:
Station 202: 9906 h
Station 203: 9922 h
Station 204: 9970 h
Station 205: 10,003 h
In contrast, non-bottleneck stations (206–209) operated for significantly fewer hours, with Station 209 showing the lowest duration at 3680 h. The average duration across all stations was 9094.1 h.
4.2.4. Cycle Time and Throughput Analysis
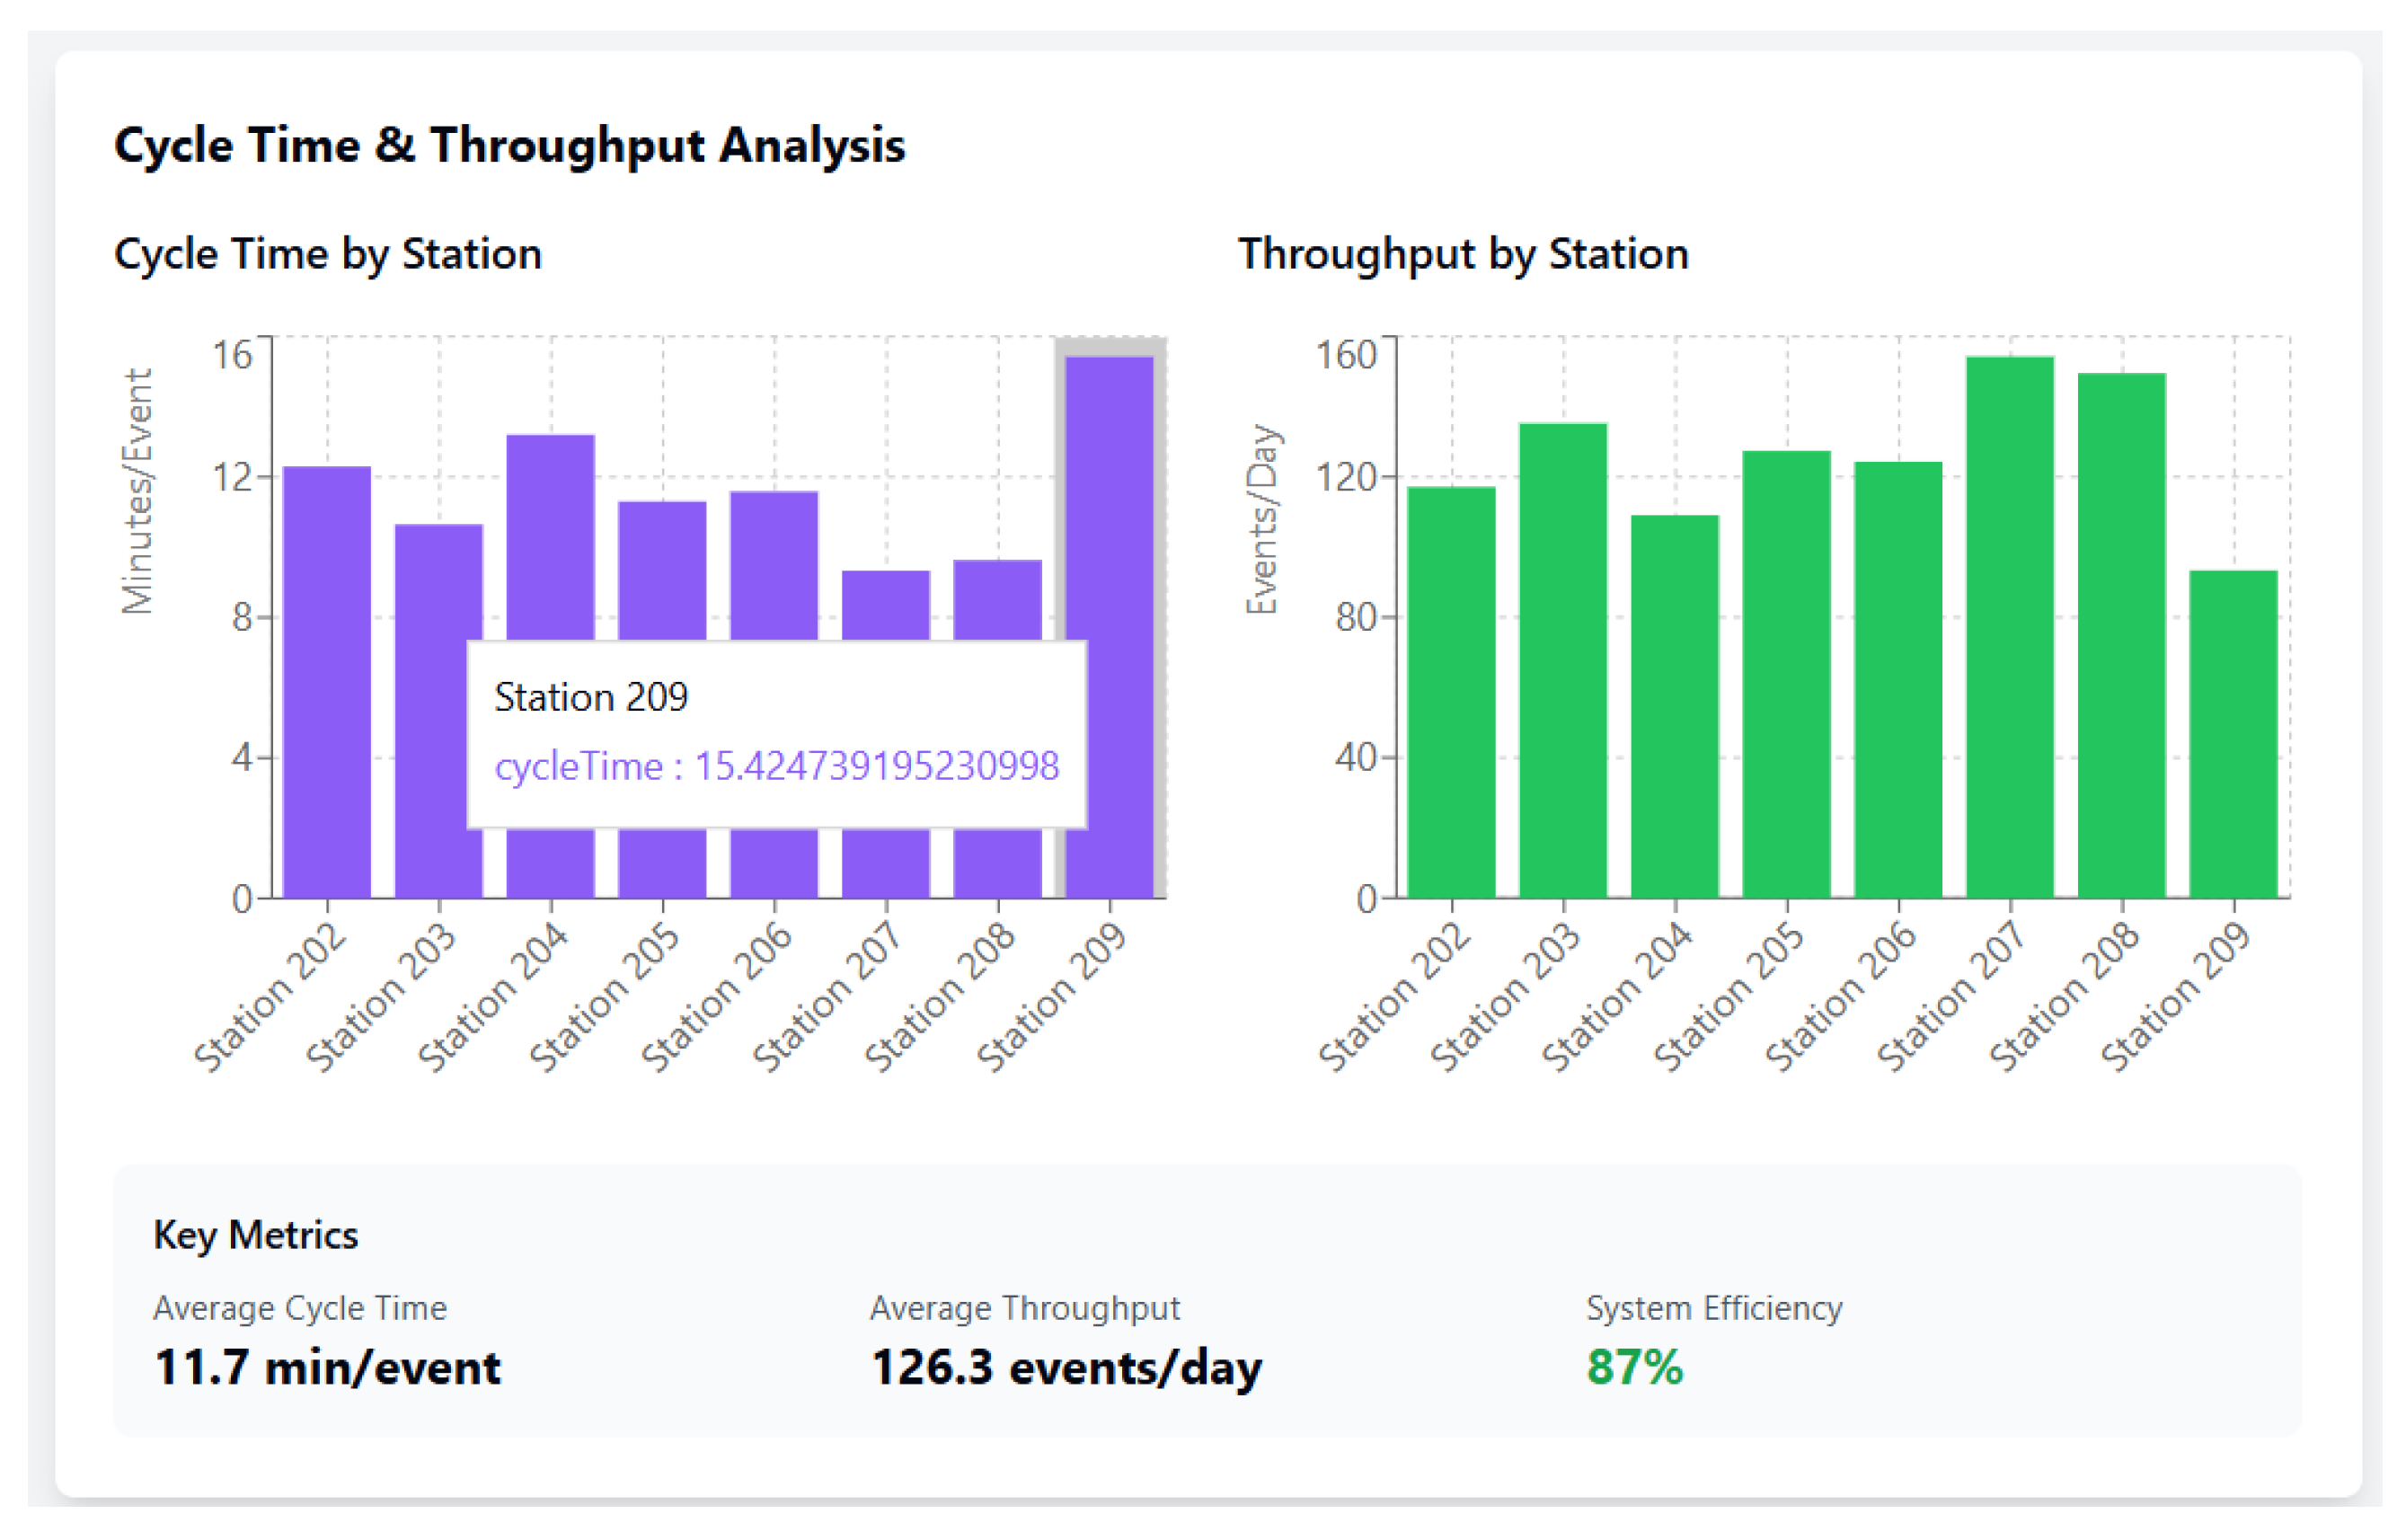
The cycle time and throughput revealed significant performance disparities between stations (
Figure 9):
Cycle Time Range: 9.4 to 16.0 min per event
Best Performer: Station 207 (9.4 min/event)
Worst Performer: Station 209 (16.0 min/event)
System Average: 11.7 min/event
The throughput analysis showed:
Highest Throughput: Station 207 (159 events/day)
Lowest Throughput: Station 209 (94 events/day)
Average Throughput: 126.3 events/day
System Efficiency: 87%
In particular, bottleneck stations (202–205) demonstrated moderate cycle times (10.6–13.6 min/event) but maintained relatively consistent throughput rates (108–137 events/day), suggesting that their bottleneck status is primarily due to high processing volumes rather than inefficient operations.
4.3. Station Performance Analysis
The comprehensive analysis of station performance confirmed the identification of bottlenecks and revealed operational patterns:
4.3.1. Event Processing Distribution
Event processing was unevenly distributed across stations:
Station 207: Highest event volume (63,798 events)
Station 208: Second highest (60,281 events)
Station 203: Among bottlenecks, processed 55,921 events
Station 204: Lowest among active stations (44,746 events)
4.3.2. Bottleneck Characteristics
The five identified bottleneck stations (202–205) share common characteristics:
Extended operational durations (>9900 h each)
Moderate cycle times (10.6–13.6 min/event)
Critical position in the process flow (early to mid-process)
High transition counts with neighboring stations
These findings suggest that bottlenecks arise from their sequential positioning and the cumulative effect of processing delays rather than the inefficiency of the individual station.
4.4. Process Flow Efficiency
The process flow analysis revealed:
Primary Flow Path: Start → 202 → 203 → 204 → 205 → 206 → 207 → End
Alternative Paths: Including cross-transitions (e.g., 202 → 205: 729 events)
Rework Loops: Evidence of backward transitions (e.g., 205 → 204: 3445 events)
System Throughput: 391,127 total events processed
The presence of significant backward transitions, particularly from Station 205 to 204, indicates quality control issues requiring rework, contributing to the bottleneck formation in these stations.
Quantitative Baseline and Bottleneck Confirmation
The quantitative baseline metrics (
Table 2) confirm the bottlenecks suggested by the qualitative analyses. The relatively long cycle times and high idle times for the Printing (Station 204) and Packaging (Station 205) units are typical constraints found at the end of the primary bottleneck segment. The integration of operational data with dynamically calculated environmental metrics (EC, CE, WG), corresponding to the execution of the Life Cycle Assessment inventory (S6) and calculation of utilization rates (S7), provides a richer baseline than traditional operational analysis alone, setting the stage for multi-objective optimization.
The comprehensive analysis of the tube manufacturing process revealed significant operational insights throughout the production line. The system processed a total of 391,127 events during the observation period, with an average cycle time of 11.7 min per event and an average throughput of 126.3 events per day, achieving an overall system efficiency of 87%. The process discovery analysis identified five critical bottleneck stations (Stations 202–205) out of nine active stations, with these bottlenecks characterized by extended operational durations exceeding 9900 h each.
Station 207 emerged as the best performer with a cycle time of 9.4 min per event and the highest throughput of 159 events per day, while Station 209 showed the poorest performance with a cycle time of 16.0 min per event and the lowest throughput of 94 events per day. The bottleneck stations demonstrated moderate cycle times ranging from 10.6 to 13.4 min per event but maintained relatively consistent throughput rates between 108 and 137 events per day, suggesting their bottleneck status arose from high processing volumes rather than operational inefficiency.
The process flow analysis revealed a primary production path from Start → 202 → 203 → 204 → 205 → 206 → 207 → End, with significant backward transitions indicating rework loops, particularly from Station 205 to 204 (3445 events). High-frequency transitions occurred between sequential stations, with the 202 → 203 transition recording 5592 events, while alternative paths and cross-transitions (such as 202 → 205 with 729 events) demonstrated the flexibility of the production system. The average defective rate across the system was 2.2%, with bottleneck stations showing higher rates (2.3–3.5%) compared to non-bottleneck stations (1.5–1.9%).
Energy consumption and environmental metrics showed a direct correlation with production volumes and cycle times. The total daily energy consumption of the system reached 4015 kWh, resulting in 2007.5 kg of CO2 emissions and 146.5 kg of waste generation. Stations with higher throughput, such as Station 207, demonstrated better energy efficiency per unit produced despite higher absolute consumption values. The inspection station (Station 209) showed the lowest throughput, but maintained moderate defective rates at 2.2%, indicating its critical role in quality control despite apparent inefficiency in processing speed.
The operational and environmental constraints in
Table 3 establish the boundary conditions for the optimization of the tube making process. These constraints are derived from actual production data, with operational limits that ensure equipment protection (95% utilization while maintaining minimum viable throughput (94 units/day). The environmental constraints reflect the worst-case scenarios observed, restricting energy consumption to 600 kWh/day and emissions to 300 kg CO
2/day per machine. Process constraints maintain system efficiency at an 87% minimum while permitting cycle times between 564 and 960 s, based on actual station performance ranges. Resource allocation provides sufficient staff (four operators/shift) with built-in capacity buffers (15%) for bottleneck stations, while data management constraints ensure a real-time monitoring capability with 250 ms latency and 1 Hz sensor sampling rates.
4.5. Multi-Objective Optimization Results: Efficiency vs. Sustainability Trade-Off
The MOOM-OEP was solved with the Non-Dominated Sorting Genetic Algorithm II (NSGA-II) using the following hyper-parameters:population size = 100, crossover probability = 0.9, mutation probability = 0.1, and a termination criterion of 200 generations. With these settings, the optimization proceeded as follows: the objectives were defined (S8) and the objective functions formulated (S9); NSGA-II then initialized the population (S10), performed non-dominated sorting to rank solutions (S11), computed crowding distances to preserve diversity (S12), applied simulated-binary crossover and polynomial mutation (S13), and iterated until convergence, ultimately producing the Pareto-optimal front evaluated in stage S14 (
Figure 10).
Trade-Off Analysis
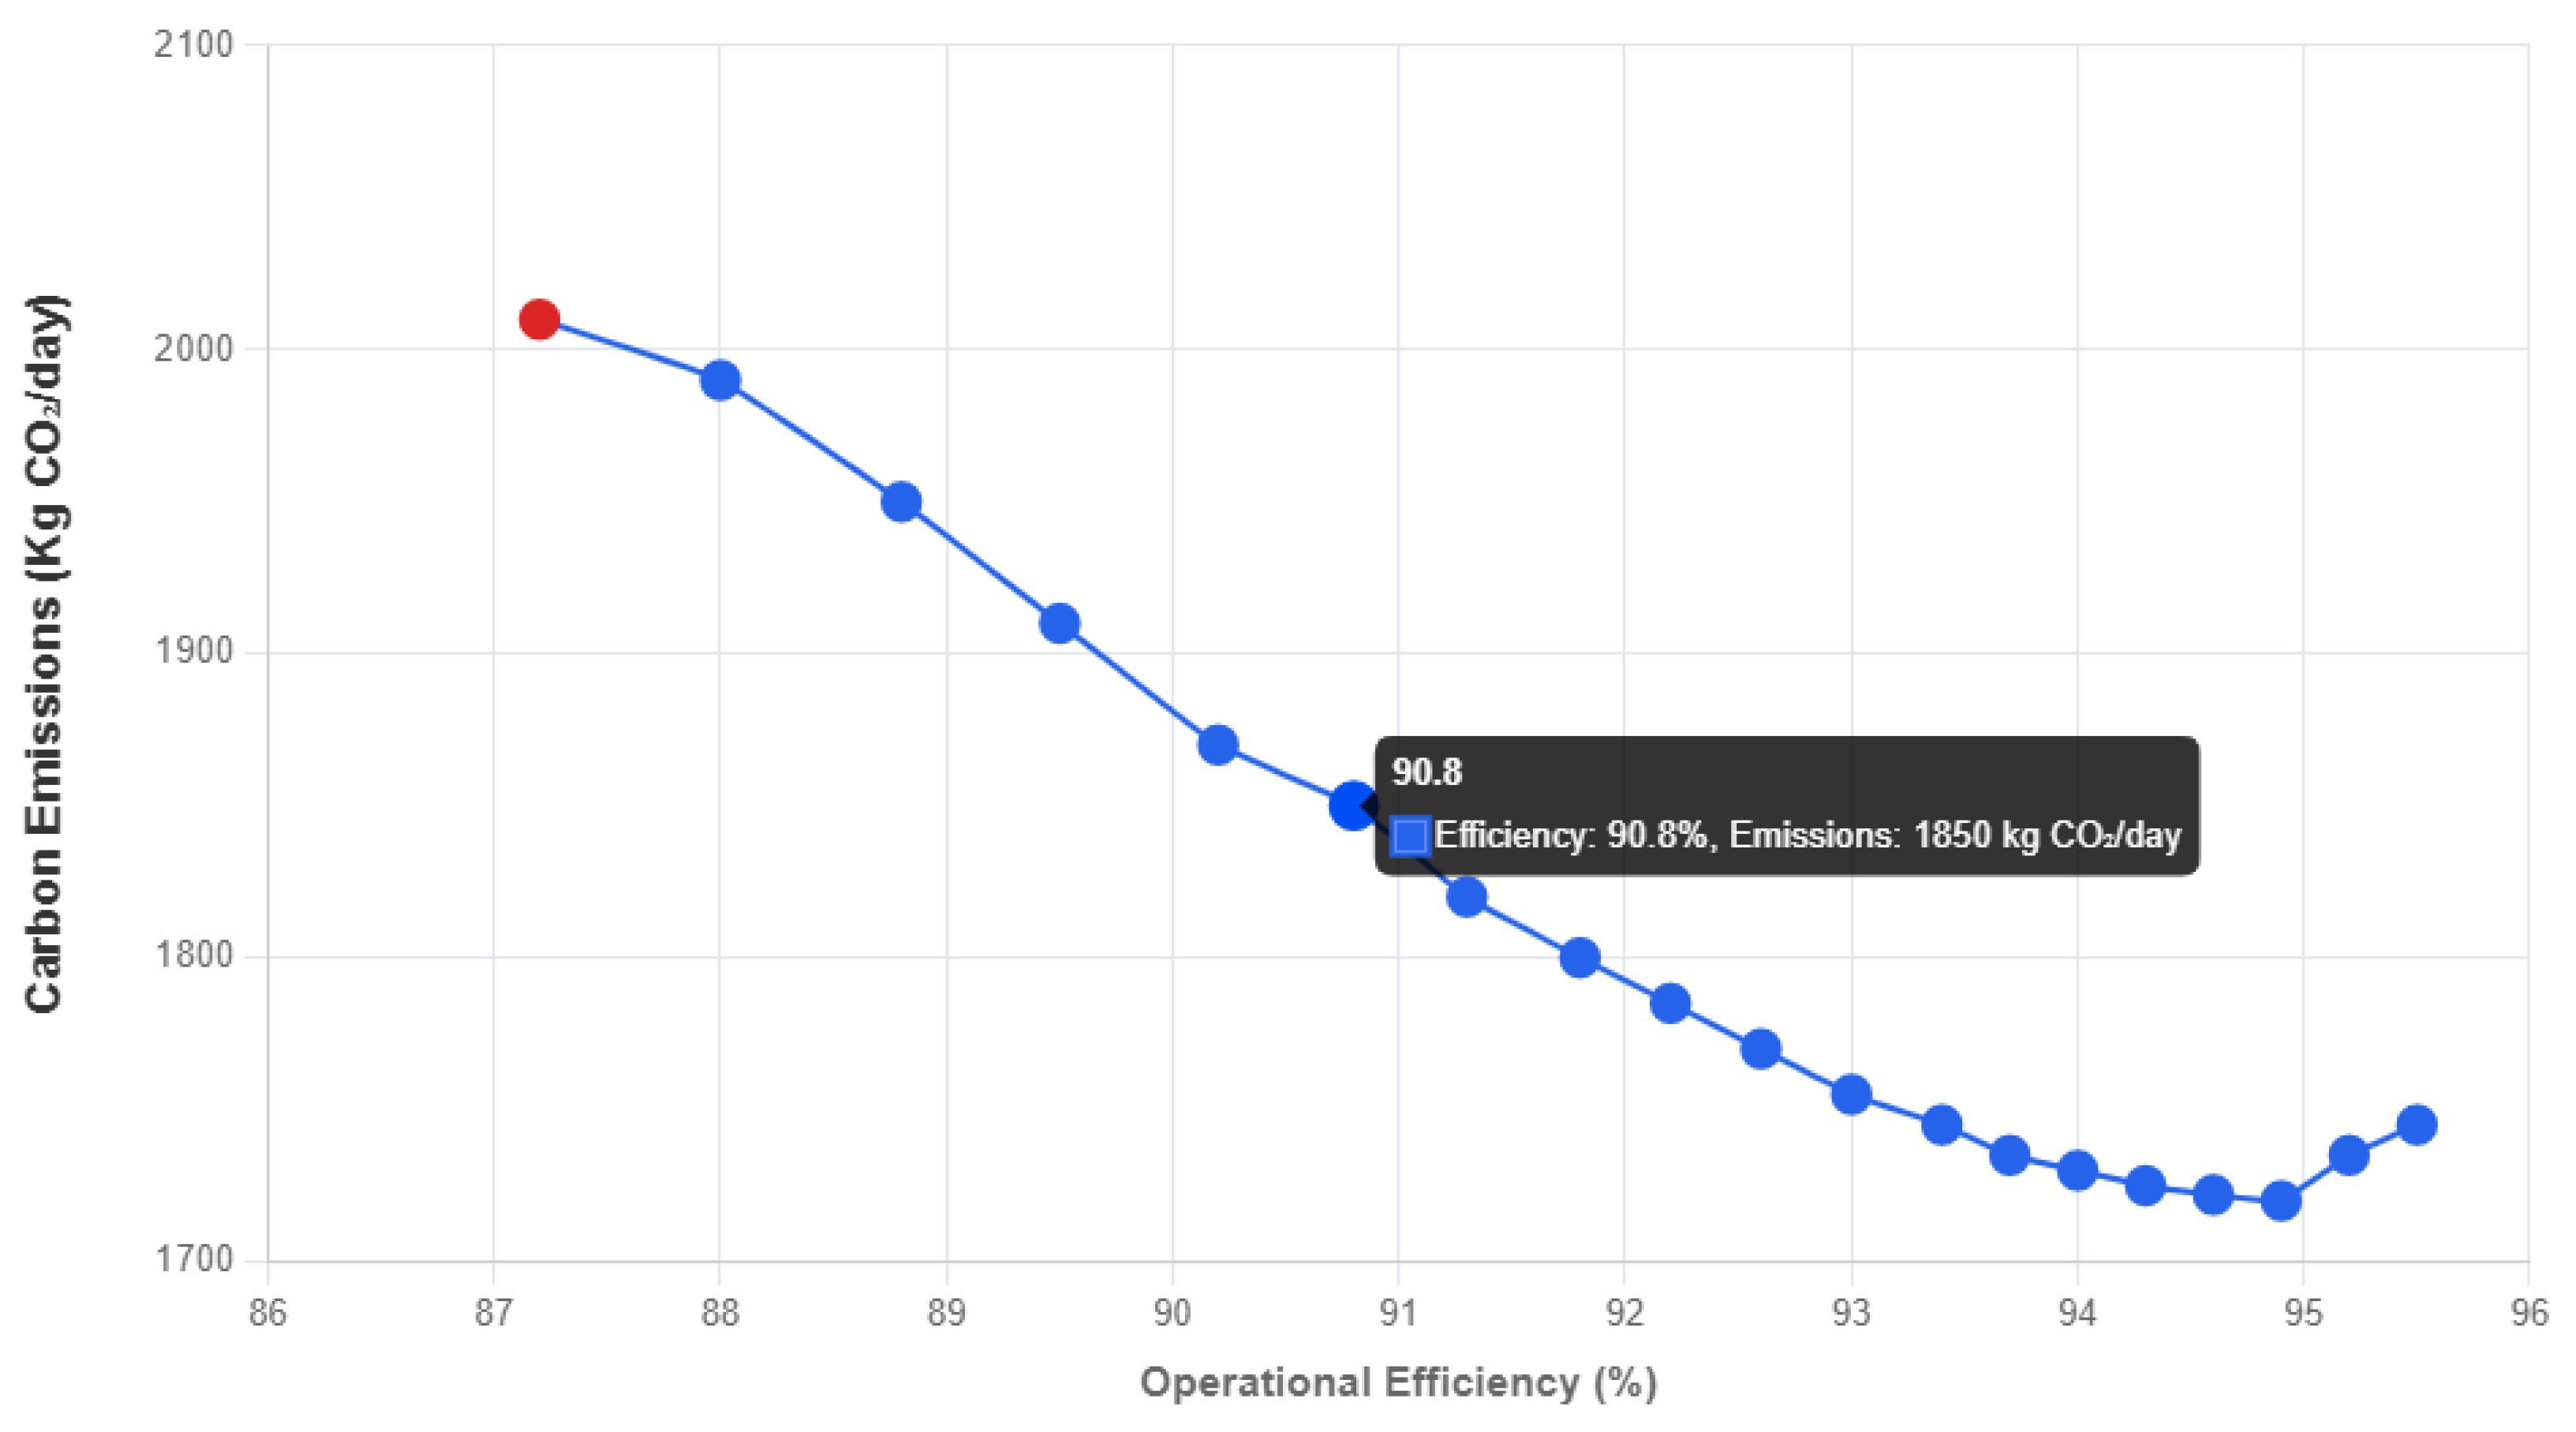
The resulting Pareto front reveals the characteristic trade-off between maximizing operational efficiency (f1) and minimizing environmental impact (f2) in the tube-making process. Starting from a baseline efficiency of 87.2% with 2007.5 kg CO2/day emissions, optimization identified solutions ranging up to 95.2% efficiency. The convex shape indicates an initial region (87–91%) where significant environmental improvements can be achieved with minimal efficiency sacrifice, followed by a steep region (91–94%) where marginal efficiency gains require proportionally smaller environmental compromises, and finally a plateau region (94–95%) where further efficiency improvements lead to increased emissions due to resource intensification.
4.6. Solution Ranking and Selection Using TOPSIS
The TOPSIS method ranked Pareto-optimal solutions based on actual process constraints and performance metrics (
Table 4). This involved normalizing the solutions (S15), identifying the ideal and negative-ideal solutions (S16), computing separation measures (S17), and finally ranking the solutions based on their relative closeness to the ideal solution (S18).
Ranking Insights
The TOPSIS ranking reveals that solution P9 (92.3% efficiency, 1758.2 kg CO2/day) achieves the optimal balance between operational efficiency and environmental impact. This solution represents a 5.1% efficiency improvement and a 12.4% emission reduction compared to the baseline. The top-ranked solutions (P8-P11) cluster around 91–93% efficiency with emissions between 1731 and 1776 kg CO2/day, indicating a sweet spot where significant improvements in both objectives are achievable. Solutions beyond P14 show diminishing returns, where marginal efficiency gains are offset by an increased environmental impact.
4.7. Sensitivity Analysis of Rankings
The sensitivity analysis (
Figure 11) examined how different weighting scenarios affect the ranking of the solutions.
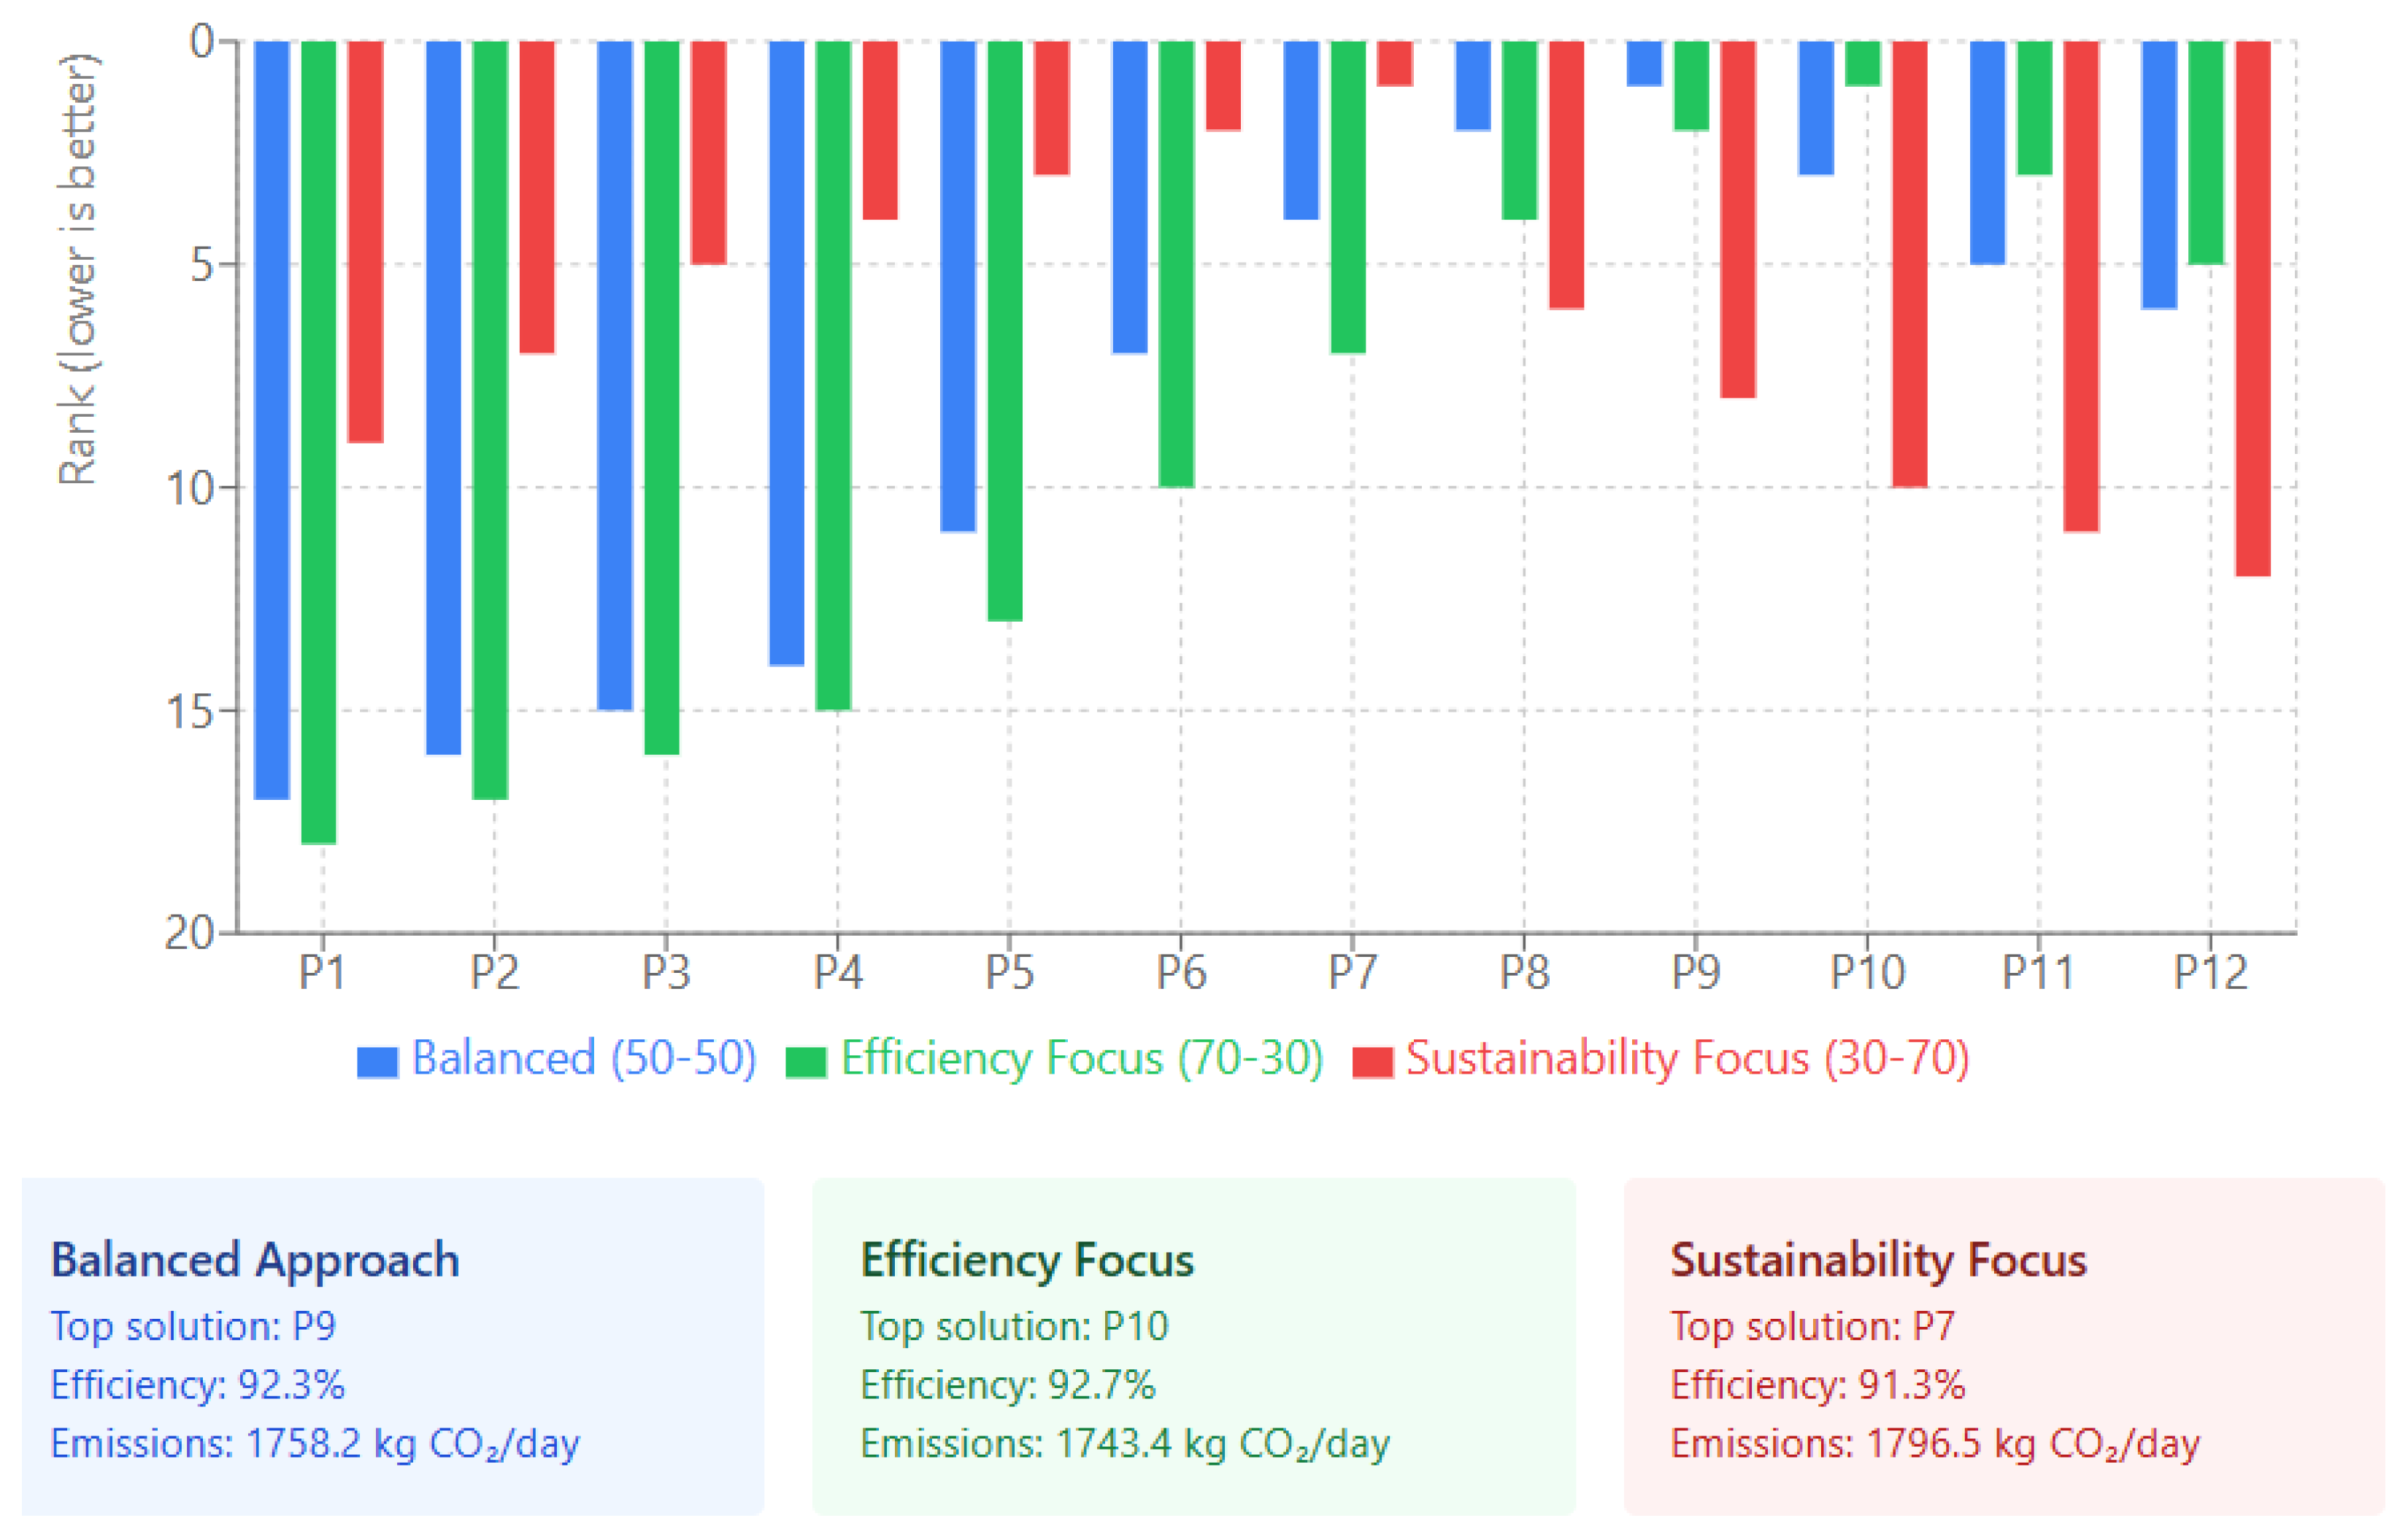
Impact of Priorities
The sensitivity analysis reveals significant shifts in solution rankings based on decision-maker priorities:
Balanced Approach (50% efficiency, 50% sustainability): Solution P9 ranks first, offering 92.3% efficiency with 1758.2 kg CO2/day emissions.
Efficiency Focus (70% efficiency, 30% sustainability): Solution P10 becomes optimal, achieving 92.7% efficiency at the cost of slightly higher emissions (1743.4 kg CO2/day).
Sustainability Focus (30% efficiency, 70% sustainability): Solution P7 ranks highest, prioritizing lower emissions (1796.5 kg CO2/day) while maintaining 91.3% efficiency.
The analysis demonstrates that solutions P7–P10 consistently rank among the top choices in different weighting scenarios, suggesting their robustness as compromise solutions. Extreme solutions (P1–P3 and P16–P18) show the highest sensitivity to weight changes, making them less suitable for scenarios where priorities may change.
4.8. Discussion Summary
The integrated framework successfully optimized the tube making process, identifying 18 Pareto optimal solutions that improve the baseline performance (87.2% efficiency, 2007.5 kg CO2/day). The optimal balanced solution (P9) achieves the following:
5.1% improvement in operational efficiency (87.2% → 92.3%)
12.4% reduction in carbon emissions (2007.5 → 1758.2 kg CO2/day)
Maintained throughput above minimum requirements (>94 units/day)
Reduced bottleneck impact through workload redistribution
The practical value of the framework is demonstrated by the following:
Real-time integration of process mining with environmental metrics
Identification of viable trade-off solutions for different strategic priorities
Quantitative guidance for bottleneck mitigation (Stations 202–205)
Actionable recommendations for reducing rework loops (205 → 204)
These results validate the framework’s capability to navigate the complex trade-offs between operational efficiency and environmental sustainability in real-world manufacturing systems, providing decision makers with data-driven insights for sustainable process improvement.
5. Conclusions
This research addressed the critical imperative for modern manufacturers to simultaneously improve operational efficiency and environmental sustainability, moving beyond traditional, often siloed, improvement efforts. We presented and validated a comprehensive, cloud-based, data-driven optimization framework that uniquely integrates real-time Process Mining with dynamic Life Cycle Assessment (LCA) and advanced Multi-Objective Optimization (MOO) techniques, specifically NSGA-II and TOPSIS. The application of this framework to a complex, real-world tube manufacturing facility processing 391,127 events across nine active stations provided significant insight and demonstrated its practical effectiveness. Through the integrated analysis of live operational event logs and environmental sensor data, the framework successfully:
Identified and quantified five critical bottleneck stations (202–205) within the production flow, accounting for extended operational durations exceeding 9900 h each and cycle times ranging from 10.6 to 13.4 min per event.
Dynamically assessed key environmental performance indicators, revealing baseline metrics of 4015 kWh daily energy consumption, 2007.5 kg CO2/day emissions, and 146.5 kg/day waste generation across the manufacturing system.
Explicitly mapped the inherent trade-offs between maximizing operational efficiency (87.2–95.2%) and minimizing environmental impact (1715–2007 kg CO2/day) through an optimal Pareto front of 18 solutions.
Generated optimized operational configurations that offer quantifiable improvements, with the optimal balanced solution (P9) achieving an efficiency of 92.3% and 1758.2 kg CO2/day emissions representing a 5.1% efficiency gain and a 12.4% reduction in emissions from baseline.
Provided a structured decision support mechanism (TOPSIS) that ranked solutions based on varying organizational priorities, demonstrating the adaptability of the framework through sensitivity analysis across efficiency-focused, sustainability-focused, and balanced scenarios.
The primary contribution of this work lies in the development and successful empirical validation of this holistic and dynamic integration methodology. By processing 32,257 hourly sensor measurements across 123 parameters, the framework bridges a significant gap in the literature and practice by combining the diagnostic power of real-time Process Mining with the evaluative capabilities of dynamic LCA. The system successfully identified process anomalies (1547 total) and their correlation with downtimes (r = 0.426), and fed this unified intelligence into a robust MOO engine that generated actionable optimization strategies.
The findings underscore substantial potential for manufacturers to achieve synergistic gains. The framework identified specific improvement opportunities, including redistributing workload from bottleneck stations, implementing predictive maintenance based on anomaly patterns, and reducing rework loops (205 → 204 transition) by 50%. These optimizations demonstrate how informed, data-driven decision making can simultaneously improve resource utilization, reduce cycle times from 960 to 564 s, and minimize environmental impact.
While validated in tube manufacturing, the proposed framework is designed to be adaptable. Its principles can be applied to other discrete or batch-based manufacturing sectors, such as pharmaceuticals, electronics assembly, or food and beverage packaging. The core methodology of integrating Process Mining, dynamic LCA, and MOO remains the same; only the specific operational KPIs, sensor data streams, and LCA impact models would need to be customized for the target industry. This demonstrates the framework’s potential as a general-purpose tool for sustainable manufacturing optimization.
Several limitations remain, pointing to avenues for future research. The framework’s effectiveness depends on the quality, availability, and granularity of sensor and event data, so deployment in data-scarce environments would be challenging. In addition, real-time execution of the MOO engine is computationally intensive and demands substantial cloud resources. This study also focused on a specific set of operational and environmental KPIs; a more comprehensive analysis could include other factors like water usage, social metrics, or detailed supply chain impacts. Future research could focus on extending the framework by incorporating machine learning for predictive analytics, particularly leveraging the observed 1–3 h lag between sensor anomalies and significant downtimes. The successful correlation between sensor anomalies and operational performance (predictive precision 76%) suggests the potential for advanced predictive maintenance strategies. For instance, future work could explore the use of deep learning on temporal data for more robust characterization and prediction, building on techniques from recent studies.
In conclusion, this research establishes a robust, scalable, and adaptable model for sustainable manufacturing, validated through real-world application that achieves both operational efficiency improvements (up to 5.1%) and environmental impact reductions (up to 12.4%). The framework provides a powerful toolkit to help industries navigate the dual challenges of the 21st century, demonstrating that operational excellence and environmental responsibility are not mutually exclusive but can be achieved synergistically through integrated, data-driven optimization.


