An important aspect to highlight is the execution time of the algorithms. While PMVO required slightly more computational time compared to CBGA and PVSA, it consistently outperformed them in both operational and environmental objectives. However, this increased execution time is not a drawback in this context. Since the planning problem addressed here is executed offline and not in a real-time environment, the solution time is not a critical constraint. BESS operations are scheduled within a vast planning horizon (e.g., hourly or daily forecasts), allowing for more computationally intensive algorithms without compromising practical feasibility. The standard deviations() reported quantify the variability of each algorithm’s performance over 100 independent runs. A low value indicates consistent convergence behavior and high robustness of the optimization strategy, which is particularly important in microgrid applications where repeatable scheduling enhances operational reliability. The PMVO algorithm consistently achieved the lowest standard deviations in both energy losses and CO2 emissions, confirming its repeatability and stability across multiple executions. For example, in the self-powered mode, PMVO achieved for energy losses and for emissions, outperforming PVSA and CBGA in both metrics. This stability reinforces the suitability of PMVO for planning applications where dependable outcomes are as important as optimal performance.
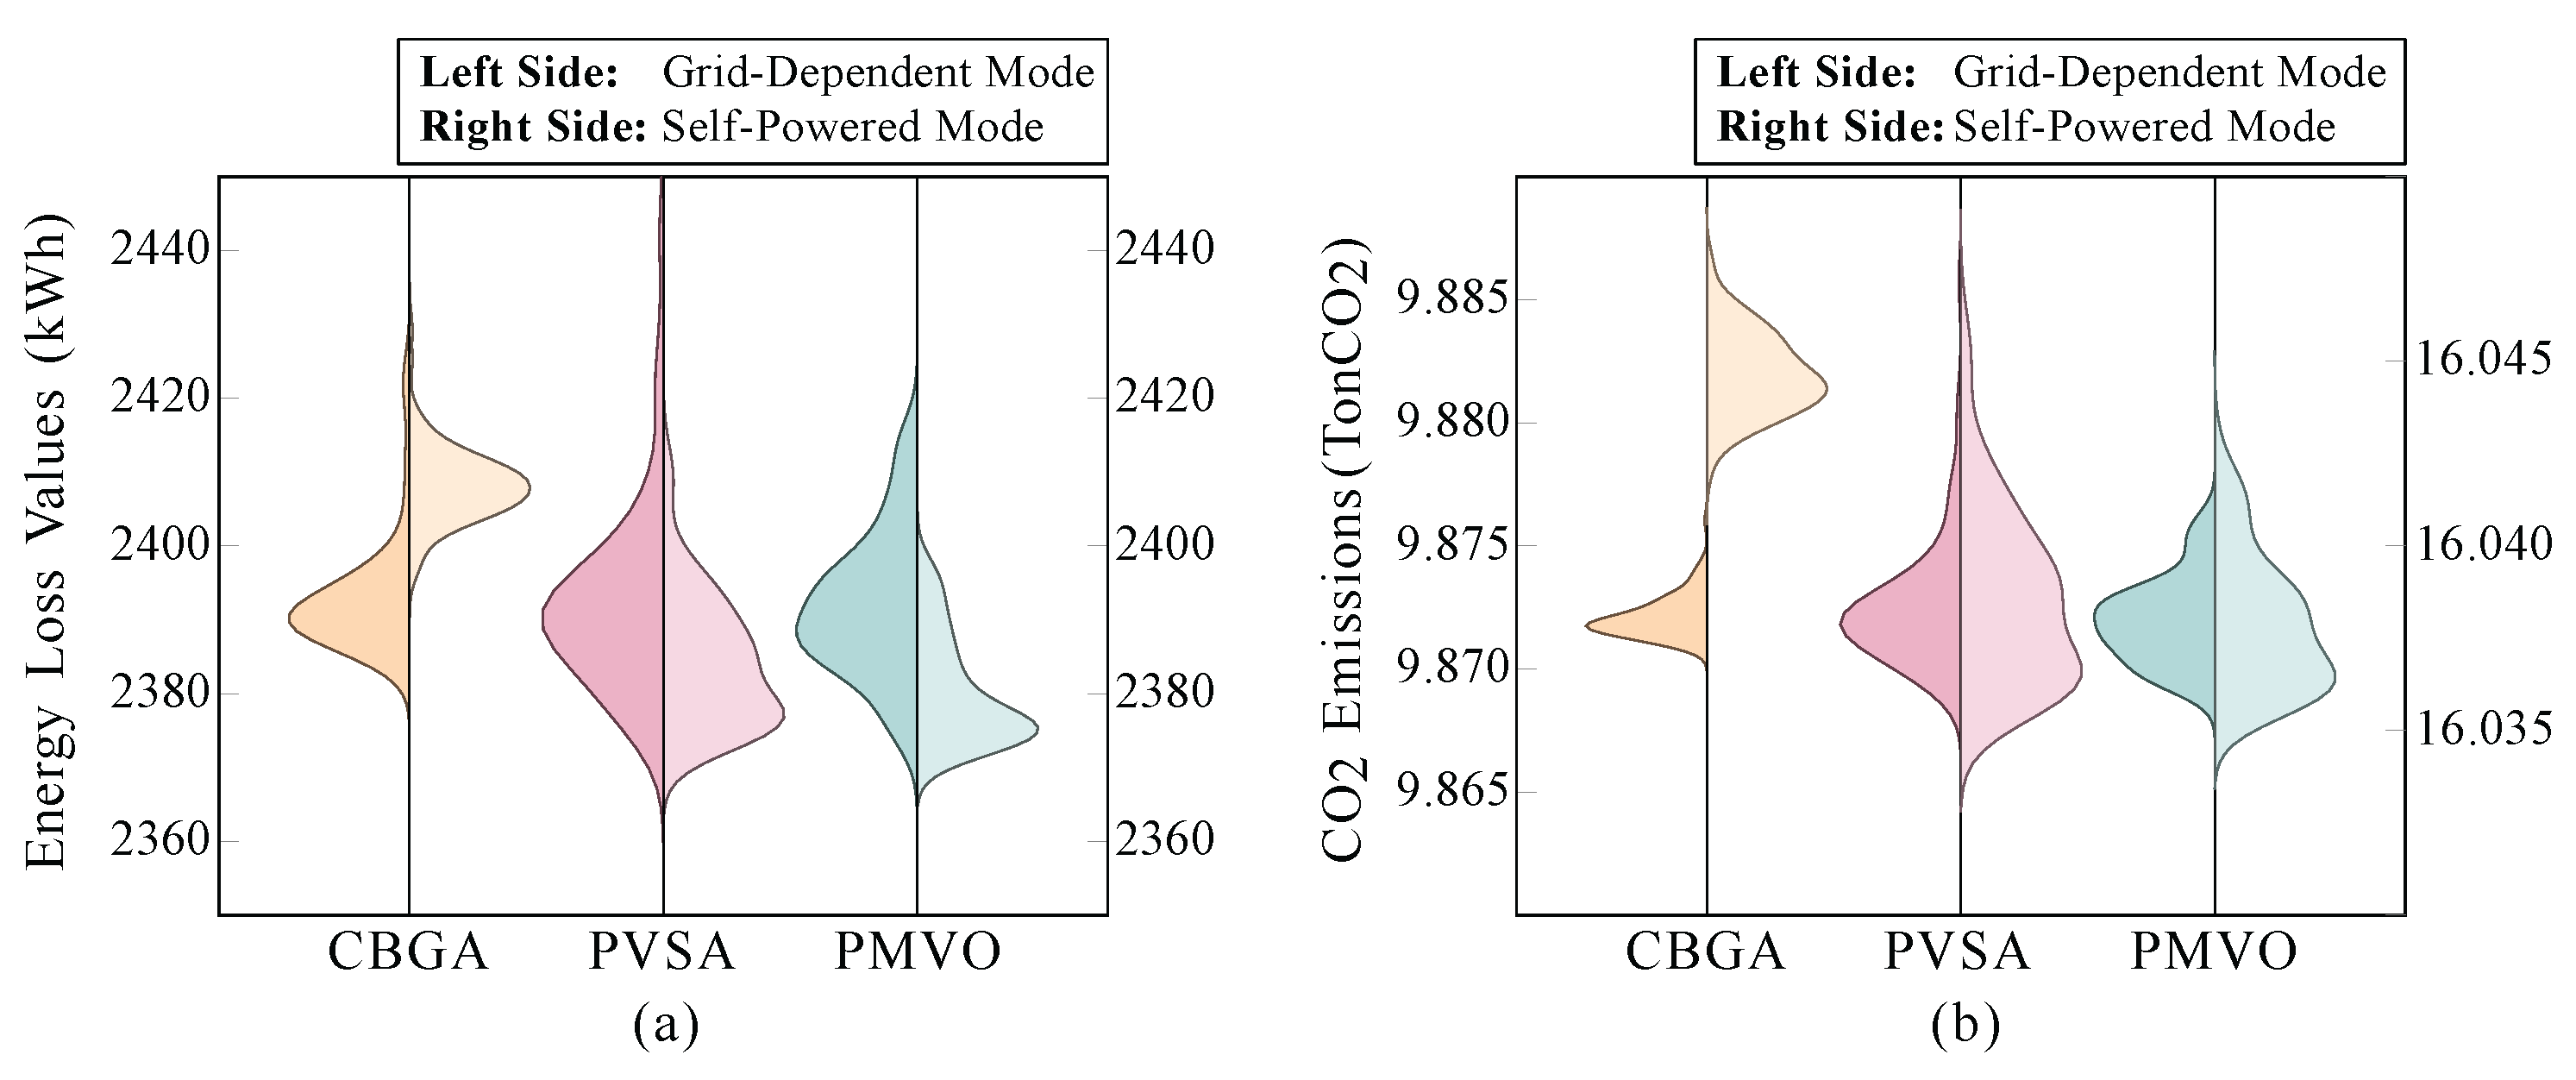
In terms of overall ranking, PMVO ranked first in both scenarios, followed by PVSA and CBGA. This reinforces the robustness and reliability of the PMVO algorithm in addressing the multi-objective problem formulated for energy loss and emissions minimization. The consistent dominance of PMVO across both configurations demonstrates its adaptability and superior search capabilities under different operational conditions of the microgrid.
These violin-scatter plots offer a visual confirmation of the robustness and reliability of the PMVO approach. The plots highlight that not only does PMVO achieve the best average and best-case performance, but it also maintains tighter distributions across optimization runs, which is an important feature in practical planning contexts where reproducibility and consistency are desirable.
It is worth reiterating that although the PMVO algorithm involves a longer computational time, the nature of the BESS scheduling problem (executed offline within a broad planning window) renders the solution time a non-critical factor. Therefore, selecting a strategy that guarantees higher quality and consistency in the solutions, such as PMVO, is more valuable than prioritizing minimal computation time.
5.4. Validation of the Methodology on a 136-Bus Microgrid
To further validate the proposed PMVO approach, it was applied to a 136-bus microgrid [
53] over a full week, encompassing both grid-connected and islanded modes. This larger, more complex system tests the algorithm’s robustness and flexibility across different microgrid sizes.
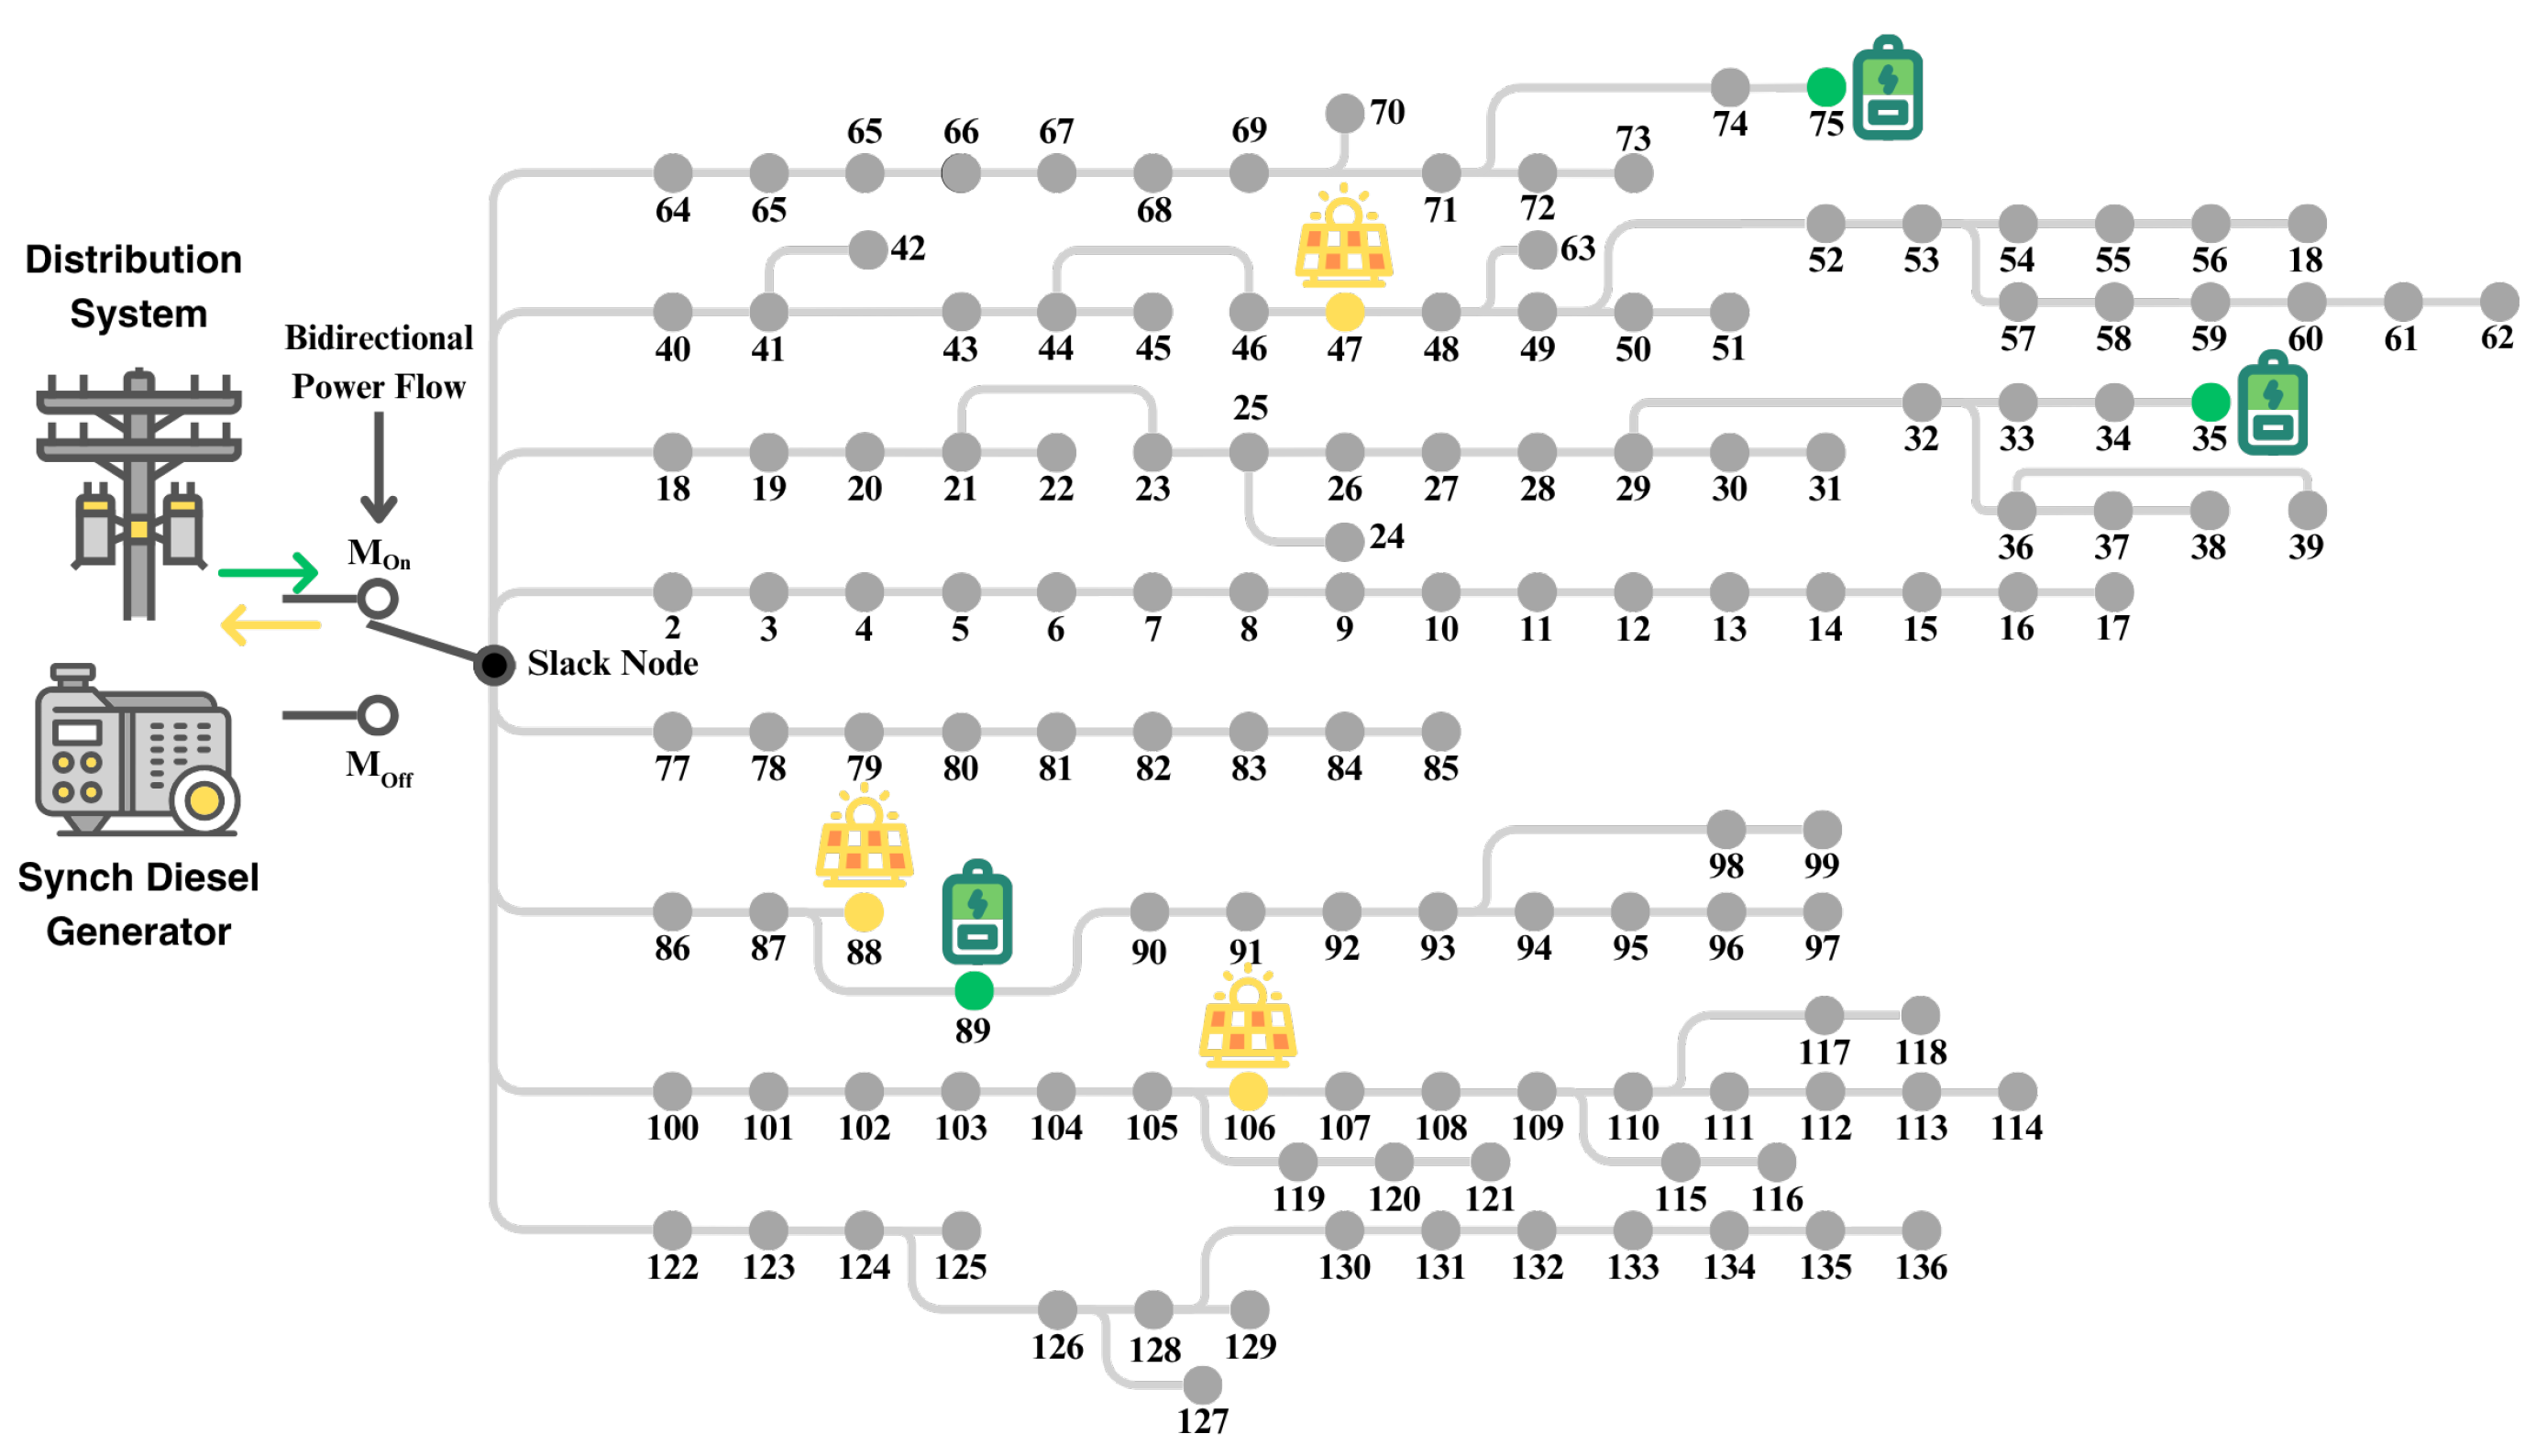
Figure 14 shows the 136-bus microgrid layout, where node 1 serves as the slack bus, connected either to the main grid or a 4000 kW diesel generator operating between 40% and 80% capacity, following the same constraints as the 33-bus system. Three PV units rated 1125, 1320, and 999 kW are located at nodes 106, 88, and 47. The base values are 13.8 kV and 100 kVA, with environmental parameters consistent with
Section 4.1.
The system includes three lithium-ion BESS units with the same characteristics as those described in
Section 4.1, located at buses 89, 75, and 35, respectively. The selection of these nodes was based on their higher power demand levels, which makes them critical points in the network. By placing storage systems at these locations, the BESS can effectively support the local load and alleviate stress on the distribution network, particularly during peak demand or islanded operation.
The technical parameters of the 136-node microgrid (MG) employed in this study are presented in
Table A1, located in
Appendix A. The description of these parameters follows the same criteria as those detailed in
Table 1. For this MG, the maximum allowable voltage deviation is ±10% of the nominal voltage.
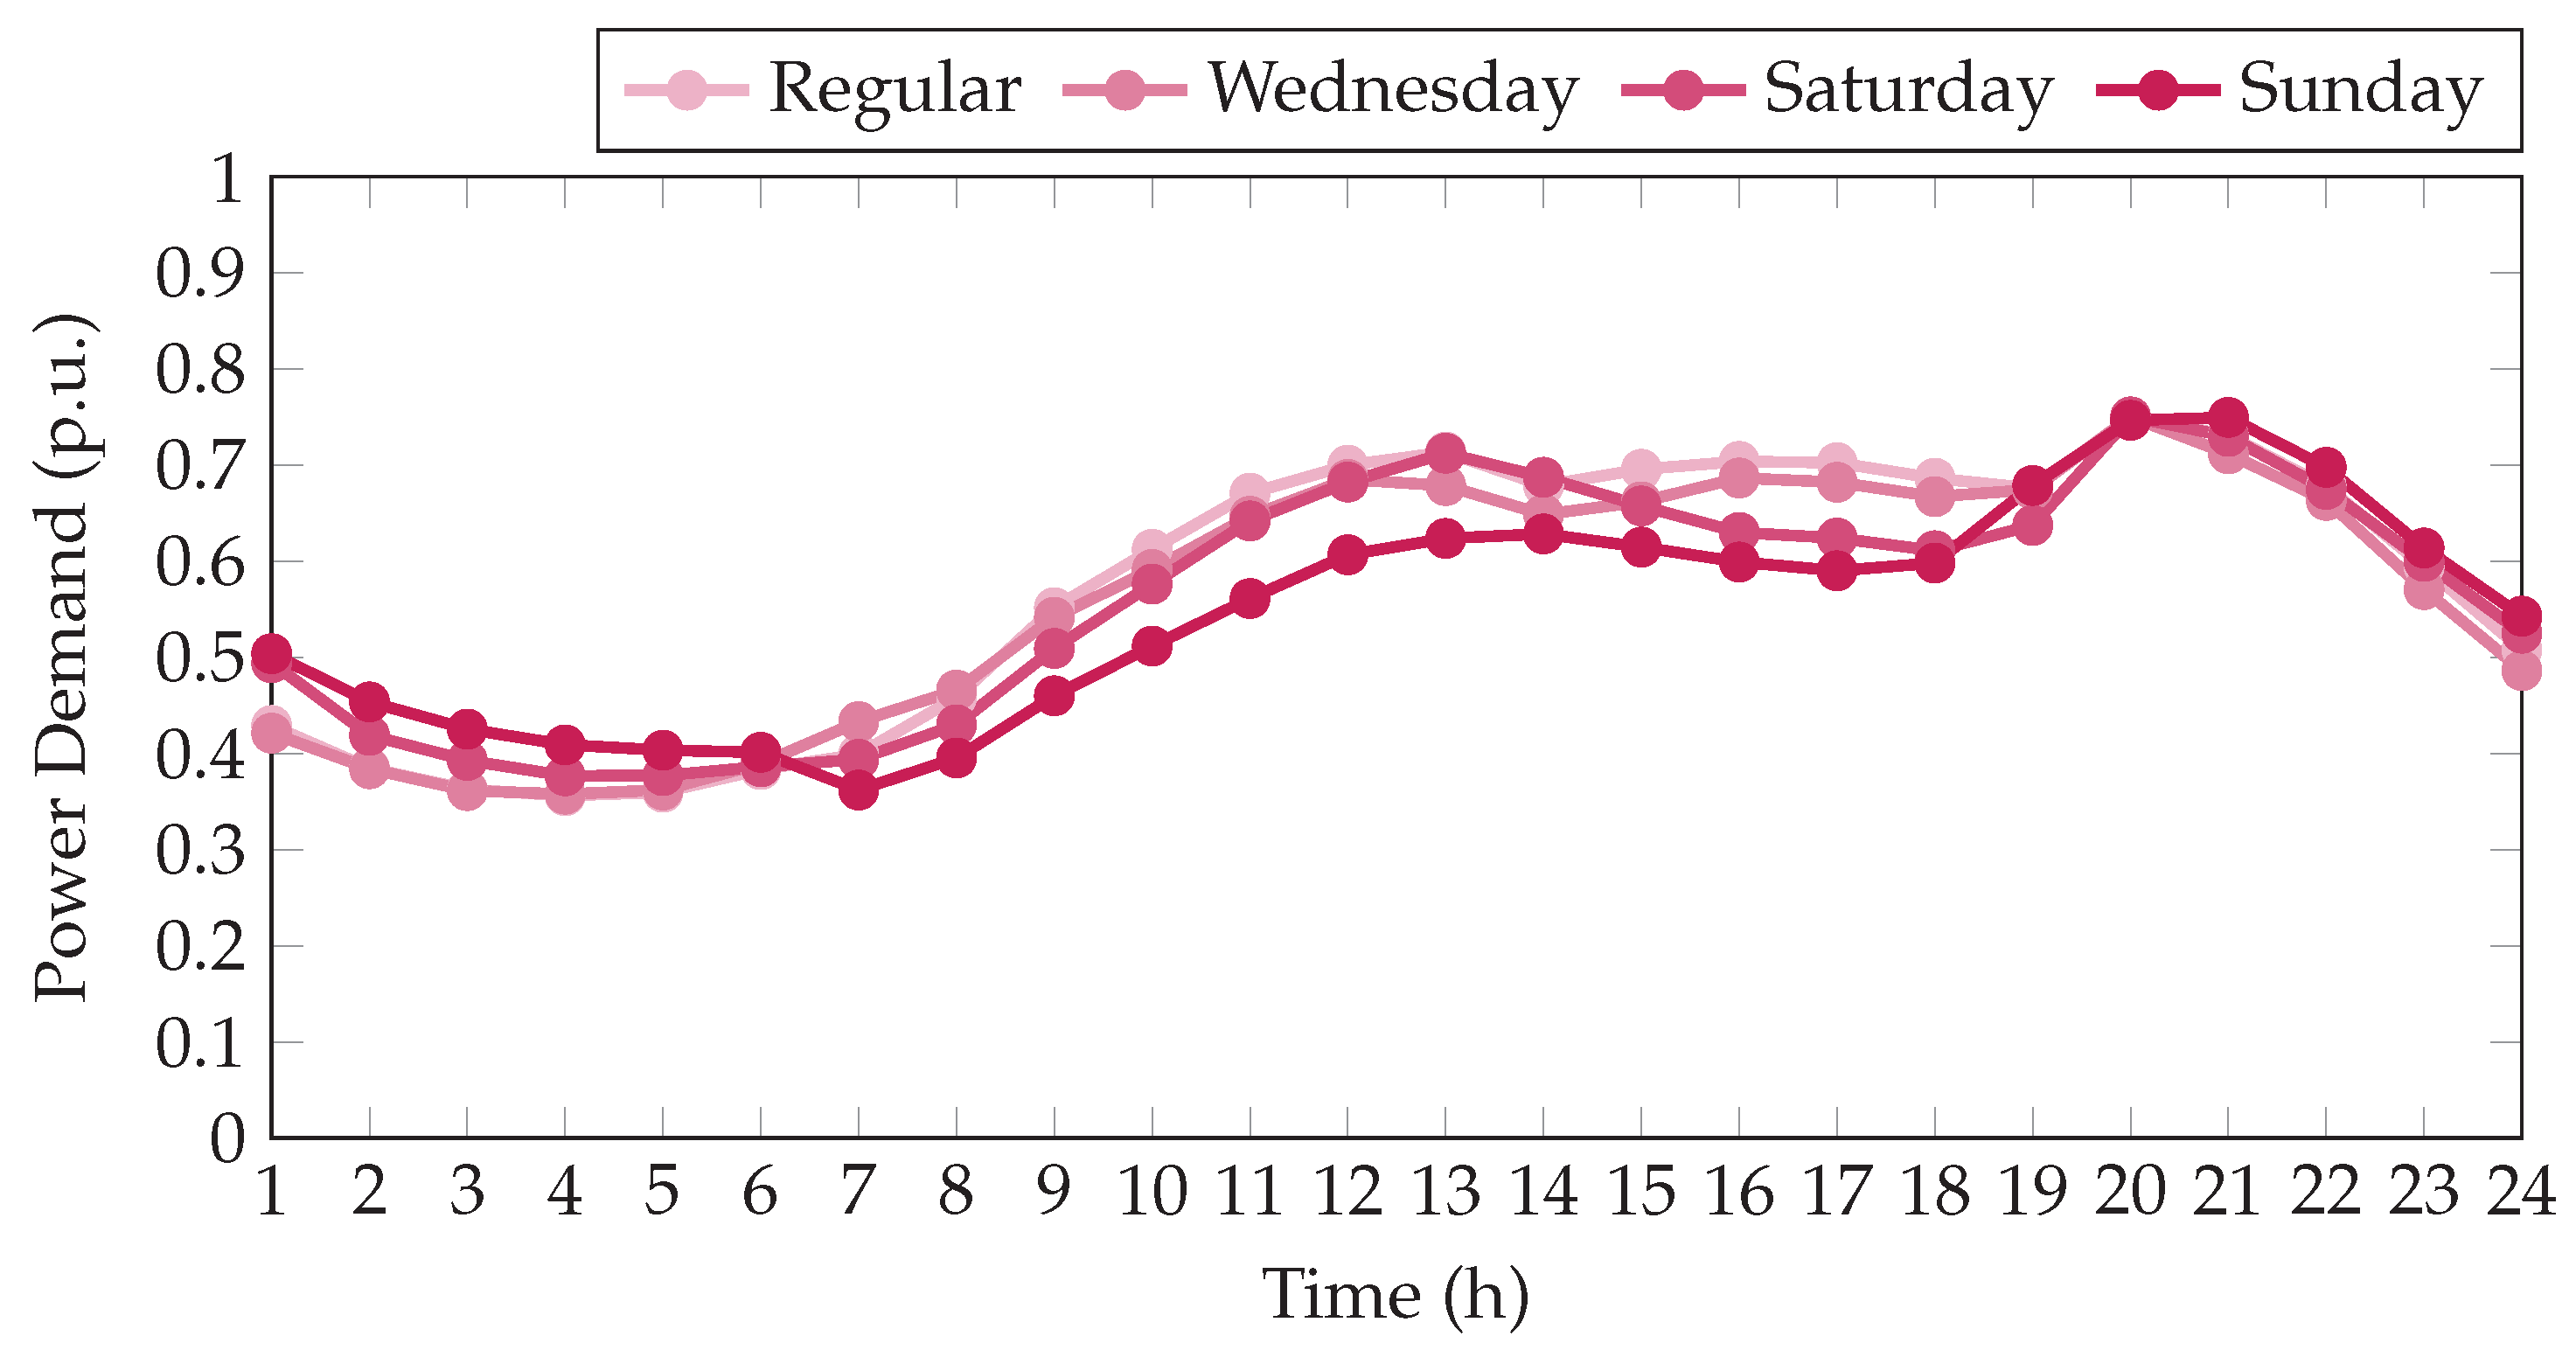
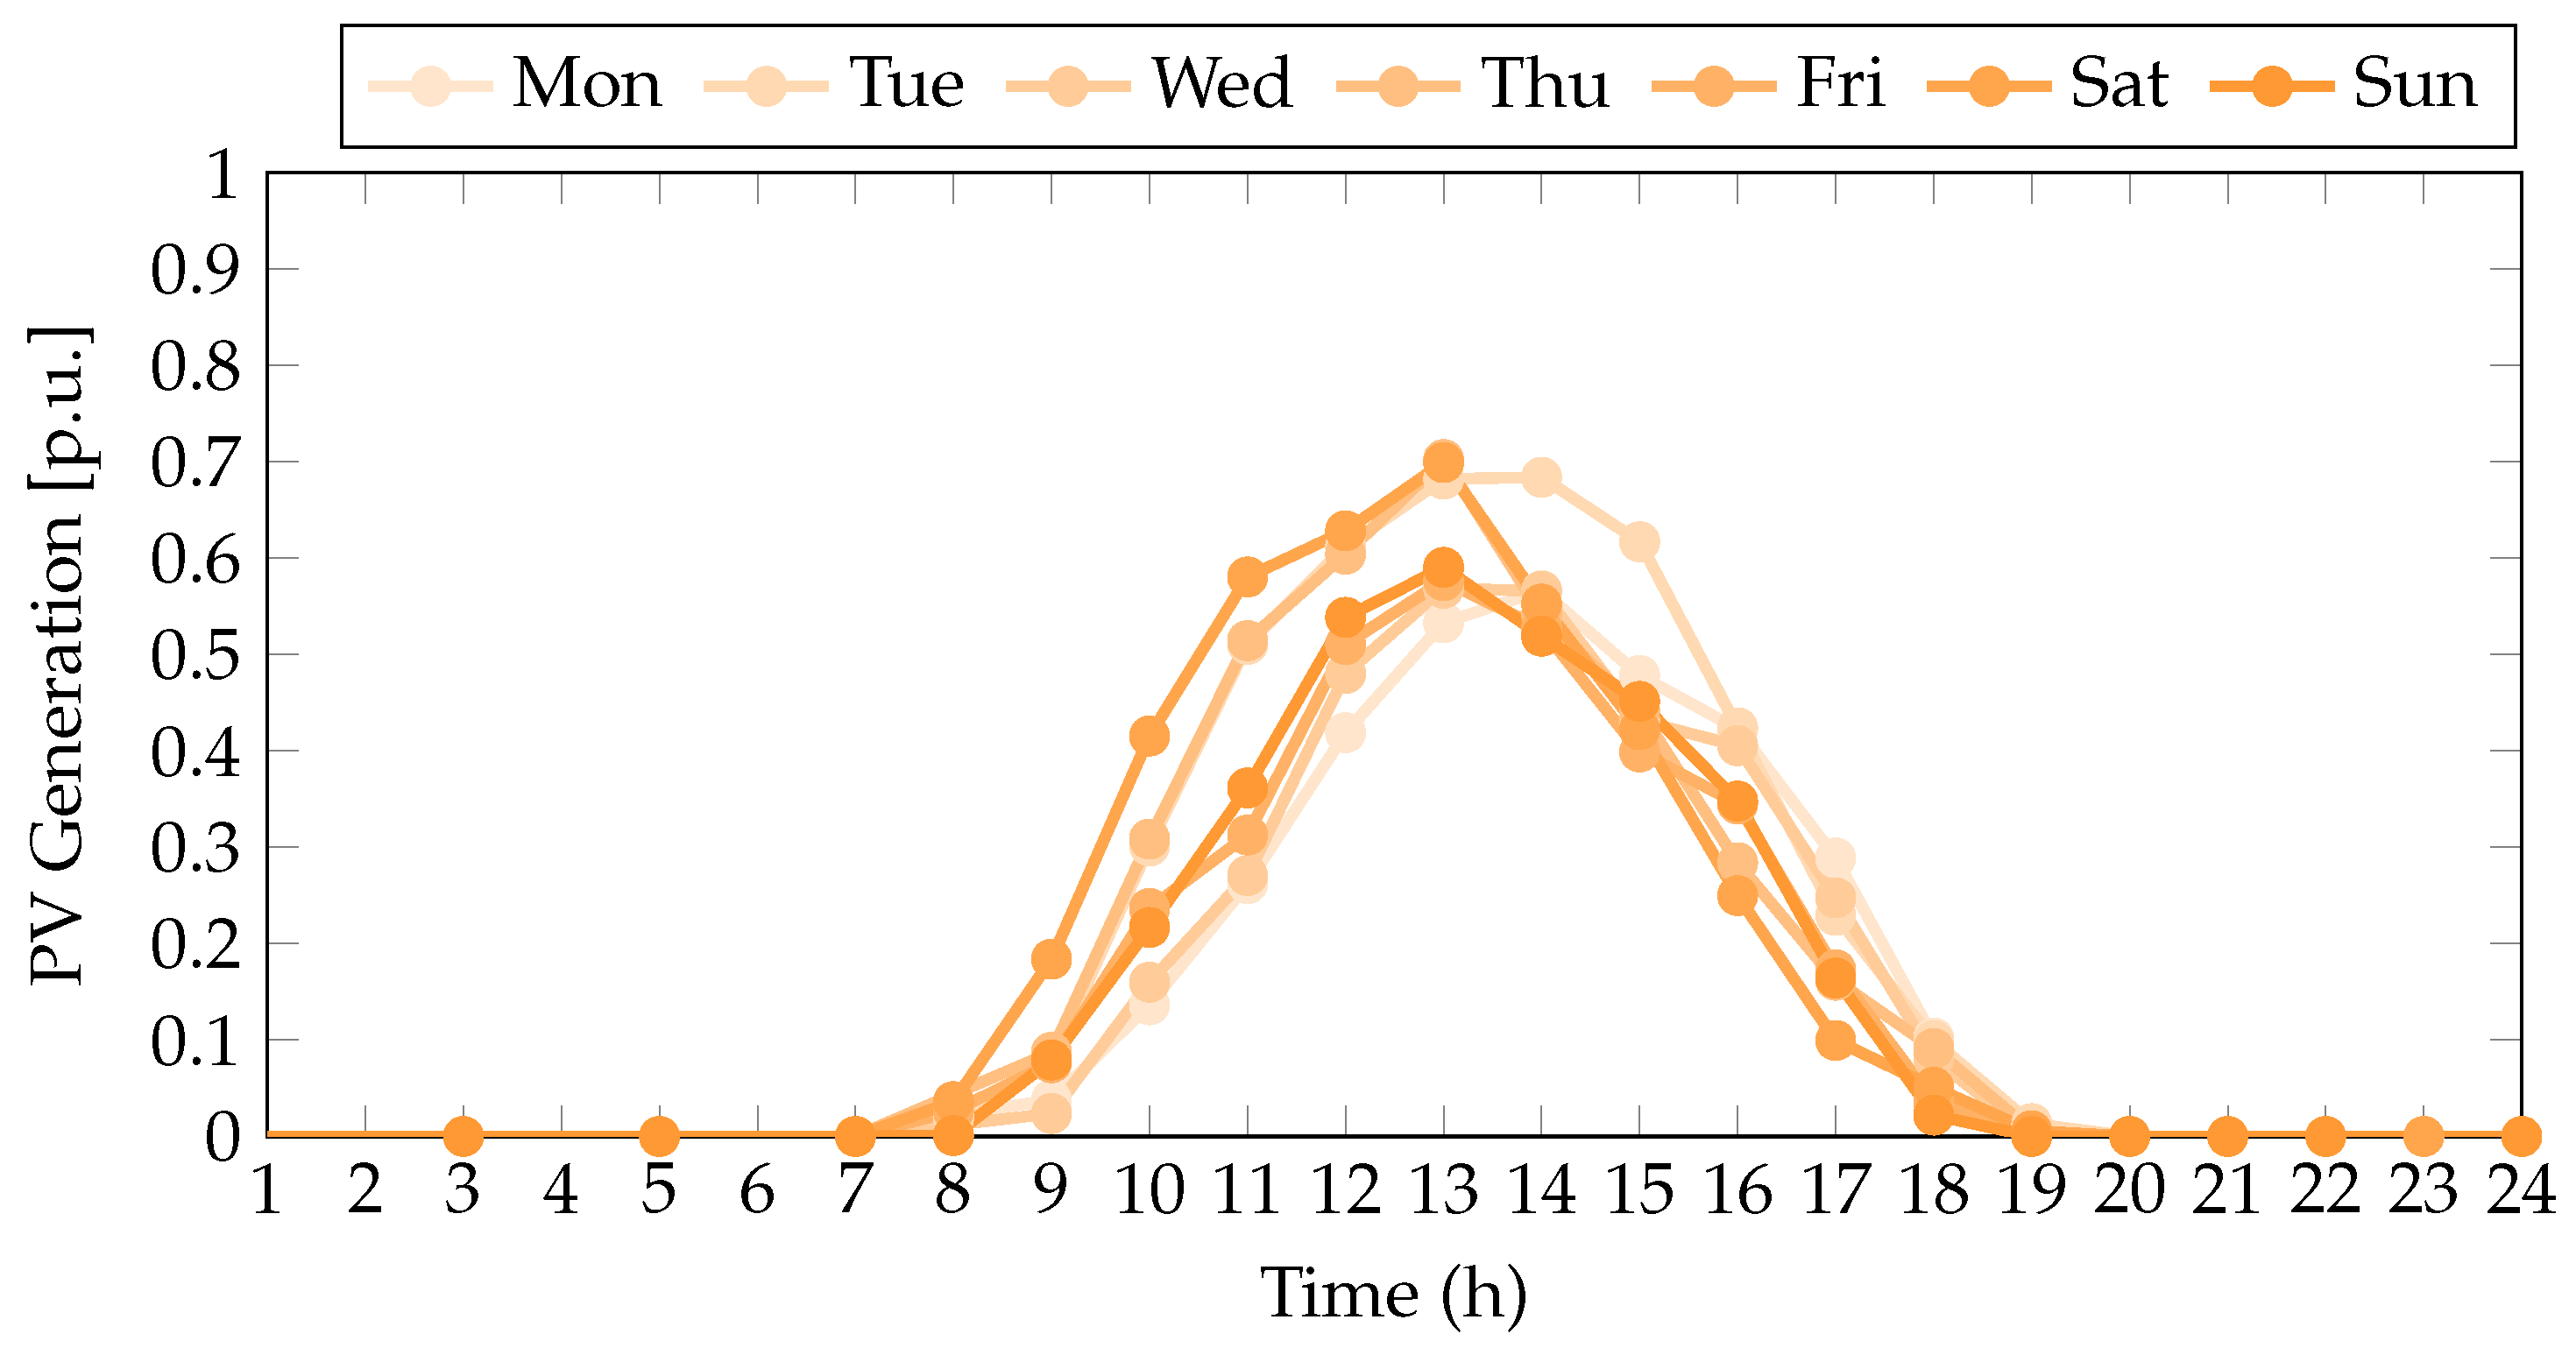
The load profile used in this study was sourced from a Colombian distribution company, while the PV generation profile was produced through an artificial neural network (ANN) trained with climatic data from a specific region in Colombia [
27]. This ANN was developed by incorporating real meteorological variables, including time, temperature, solar radiation, humidity, and atmospheric pressure, and was employed to simulate hourly PV generation and power demand profiles over a representative 7-day period.
Figure 15 shows the weekly load variation, where the “regular” curve represents the typical demand pattern observed on Monday, Tuesday, Thursday, and Friday. The remaining curves illustrate the distinctive behavior of the other days of the week. Meanwhile,
Figure 16 presents the corresponding photovoltaic generation profiles for each day.
Table 5 summarizes the results obtained by applying the PMVO to the 136-node microgrid under grid-connected operation. The table reports the values of the different objective functions considered in this work, including the baseline cases for each day of the week and the corresponding outcomes achieved by the PMVO.
In terms of energy losses, the PMVO achieved an average weekly reduction of 87.5718 kWh, representing a technical improvement of 0.5261% compared to the base case. Daily absolute reductions ranged from 7.6175 kWh to 14.4985 kWh. The standard deviation over the week was approximately 2.8377%, reflecting the stable and consistent performance of PMVO under varying operating conditions.
In addition, the proposed methodology required an average execution time of 91.1643 s per day to solve the energy loss minimization problem, i.e., approximately 1.52 min. This result highlights the practicality of the approach for day-ahead or short-term operational planning.
Similarly, in the case of CO2 emissions, the PMVO achieved a weekly average reduction of 14.3062 kgCO2 compared to the base scenario, representing an average improvement of 0.0052%. Daily absolute reductions ranged from 1.6691 to 2.2718 kgCO2. With a weekly standard deviation of approximately 1.7562%, these results highlight the robustness and consistency of the PMVO under different operational scenarios.
The average computation time required to solve the CO2 emissions minimization problem was approximately 89.1909 s per day (1.49 min), which is consistent with the execution time observed for energy loss minimization. These results confirm the practicality and scalability of the proposed optimization framework for multi-objective operation planning in both real-time and day-ahead contexts.
To further evaluate the robustness of the proposed methodology under more restrictive conditions, the PMVO was also applied to the same 136-node microgrid operating in self-powered (islanded) mode.
Table 6 presents the results obtained in this scenario, including daily performance for each objective function and the corresponding baseline cases.
In terms of energy losses, the PMVO achieved a weekly average reduction of 3.3938 kWh compared to the base case, which corresponds to a technical improvement of approximately 0.3635%. Daily absolute reductions ranged from 26.5283 Wh to 1.1961 kWh. The low standard deviation of approximately 3.3871% across the week indicates that the energy loss reductions were consistently achieved each day, regardless of operational variability.
Regarding execution time, the methodology required an average of 389.7953 s per day (approximately 6.49 min) to solve the energy loss minimization problem. Although this represents a higher computational demand compared to the grid-connected case, it remains reasonable for offline planning or short-term scheduling in more constrained systems.
For CO2 emissions, the PMVO reported a weekly average reduction of 2.8774 kgCO2, representing an average improvement of 0.0028%. The standard deviation, measured at 2.2336%, suggests stable behavior in emissions reduction throughout the week, with the algorithm adapting effectively to day-to-day variations in system conditions.
The corresponding average computation time for solving the emissions minimization problem was 160.3519 s per day (approximately 2.67 min), which is consistent across the week and aligned with the performance observed in the energy loss case. These results confirm that the proposed framework maintains its effectiveness and computational feasibility even in isolated microgrid conditions, reinforcing its applicability for diverse operational contexts.
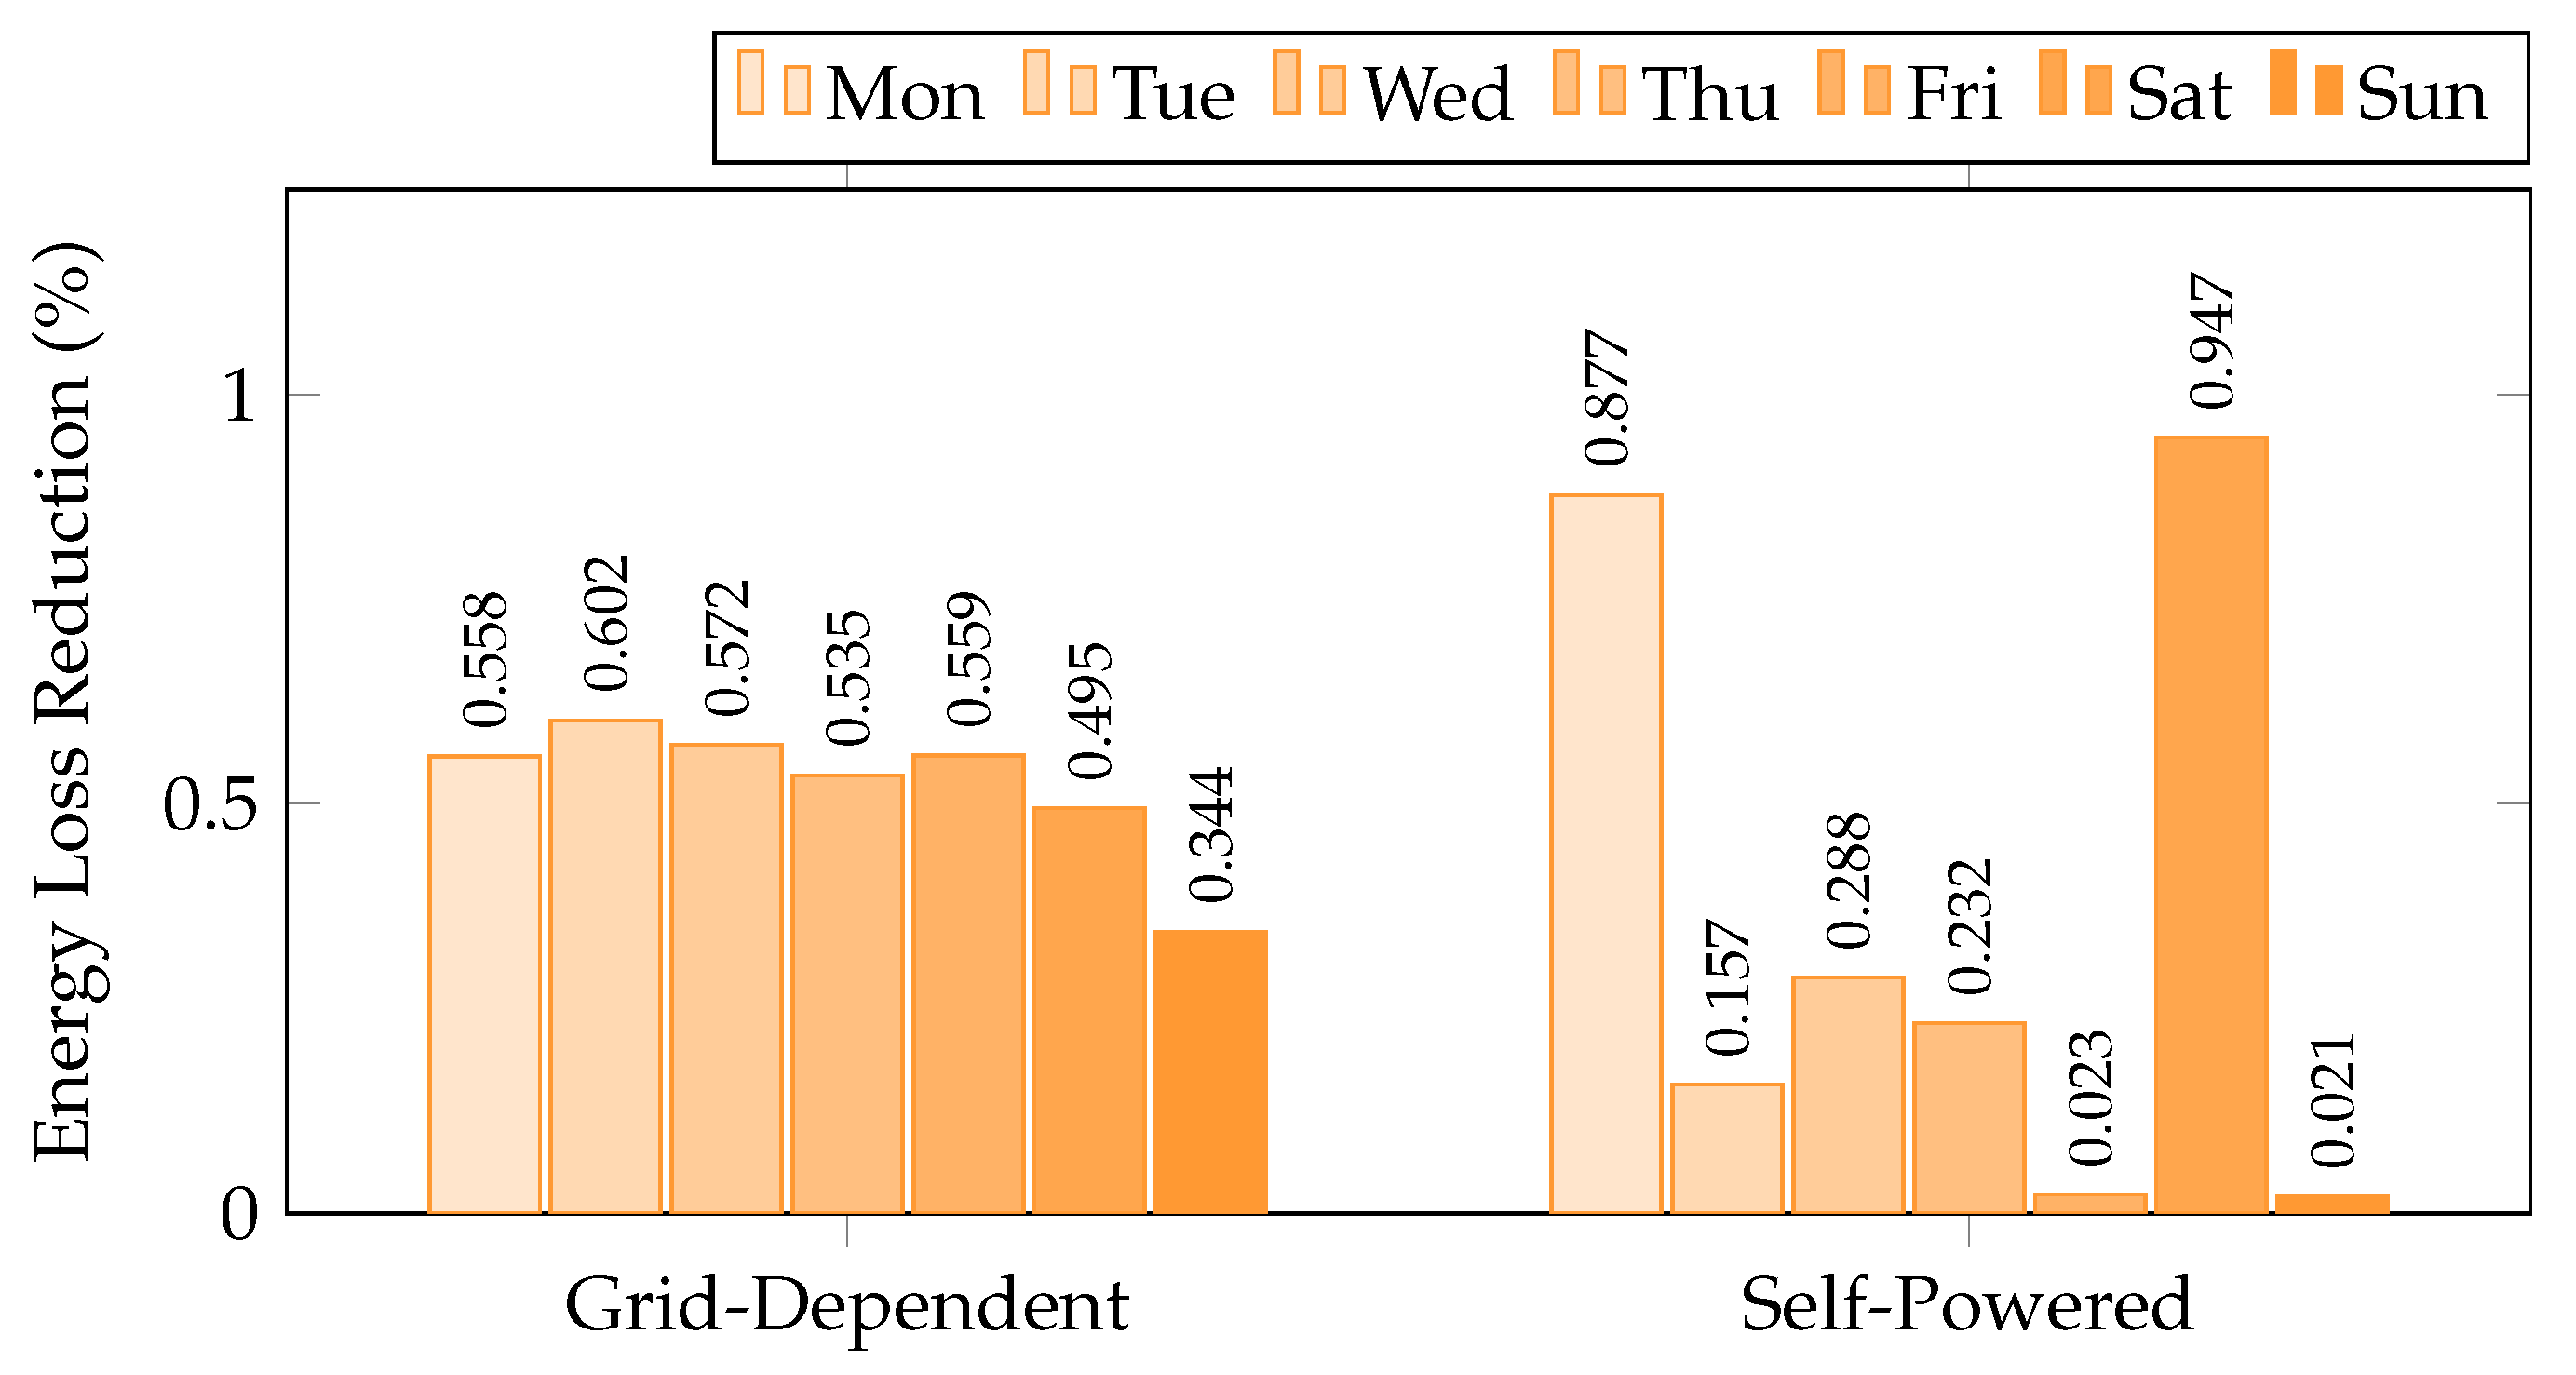
Figure 17 and
Figure 18 illustrate the weekly performance of the PMVO algorithm in terms of daily energy loss and CO
2 emission reductions for the 136-node system under both grid-dependent and self-powered configurations.
In
Figure 17, PMVO demonstrates noticeable variability in daily energy loss reductions depending on the operation mode. In the grid-dependent configuration, the reductions fluctuate between 0.344% (Sunday) and 0.602% (Tuesday), whereas, in the self-powered mode, the range is broader, from as low as 0.021% (Sunday) to a peak of 0.947% (Saturday). The weekly average energy loss reduction for the grid-dependent case is approximately 0.5236%, with a standard deviation of 0.0815%, indicating relatively stable but modest performance across the week. In contrast, the self-powered mode yields a higher variability, with a weekly mean of 0.3636% and a standard deviation of 0.3391%, reflecting the influence of local generation dynamics and load profiles on the performance of PMVO.
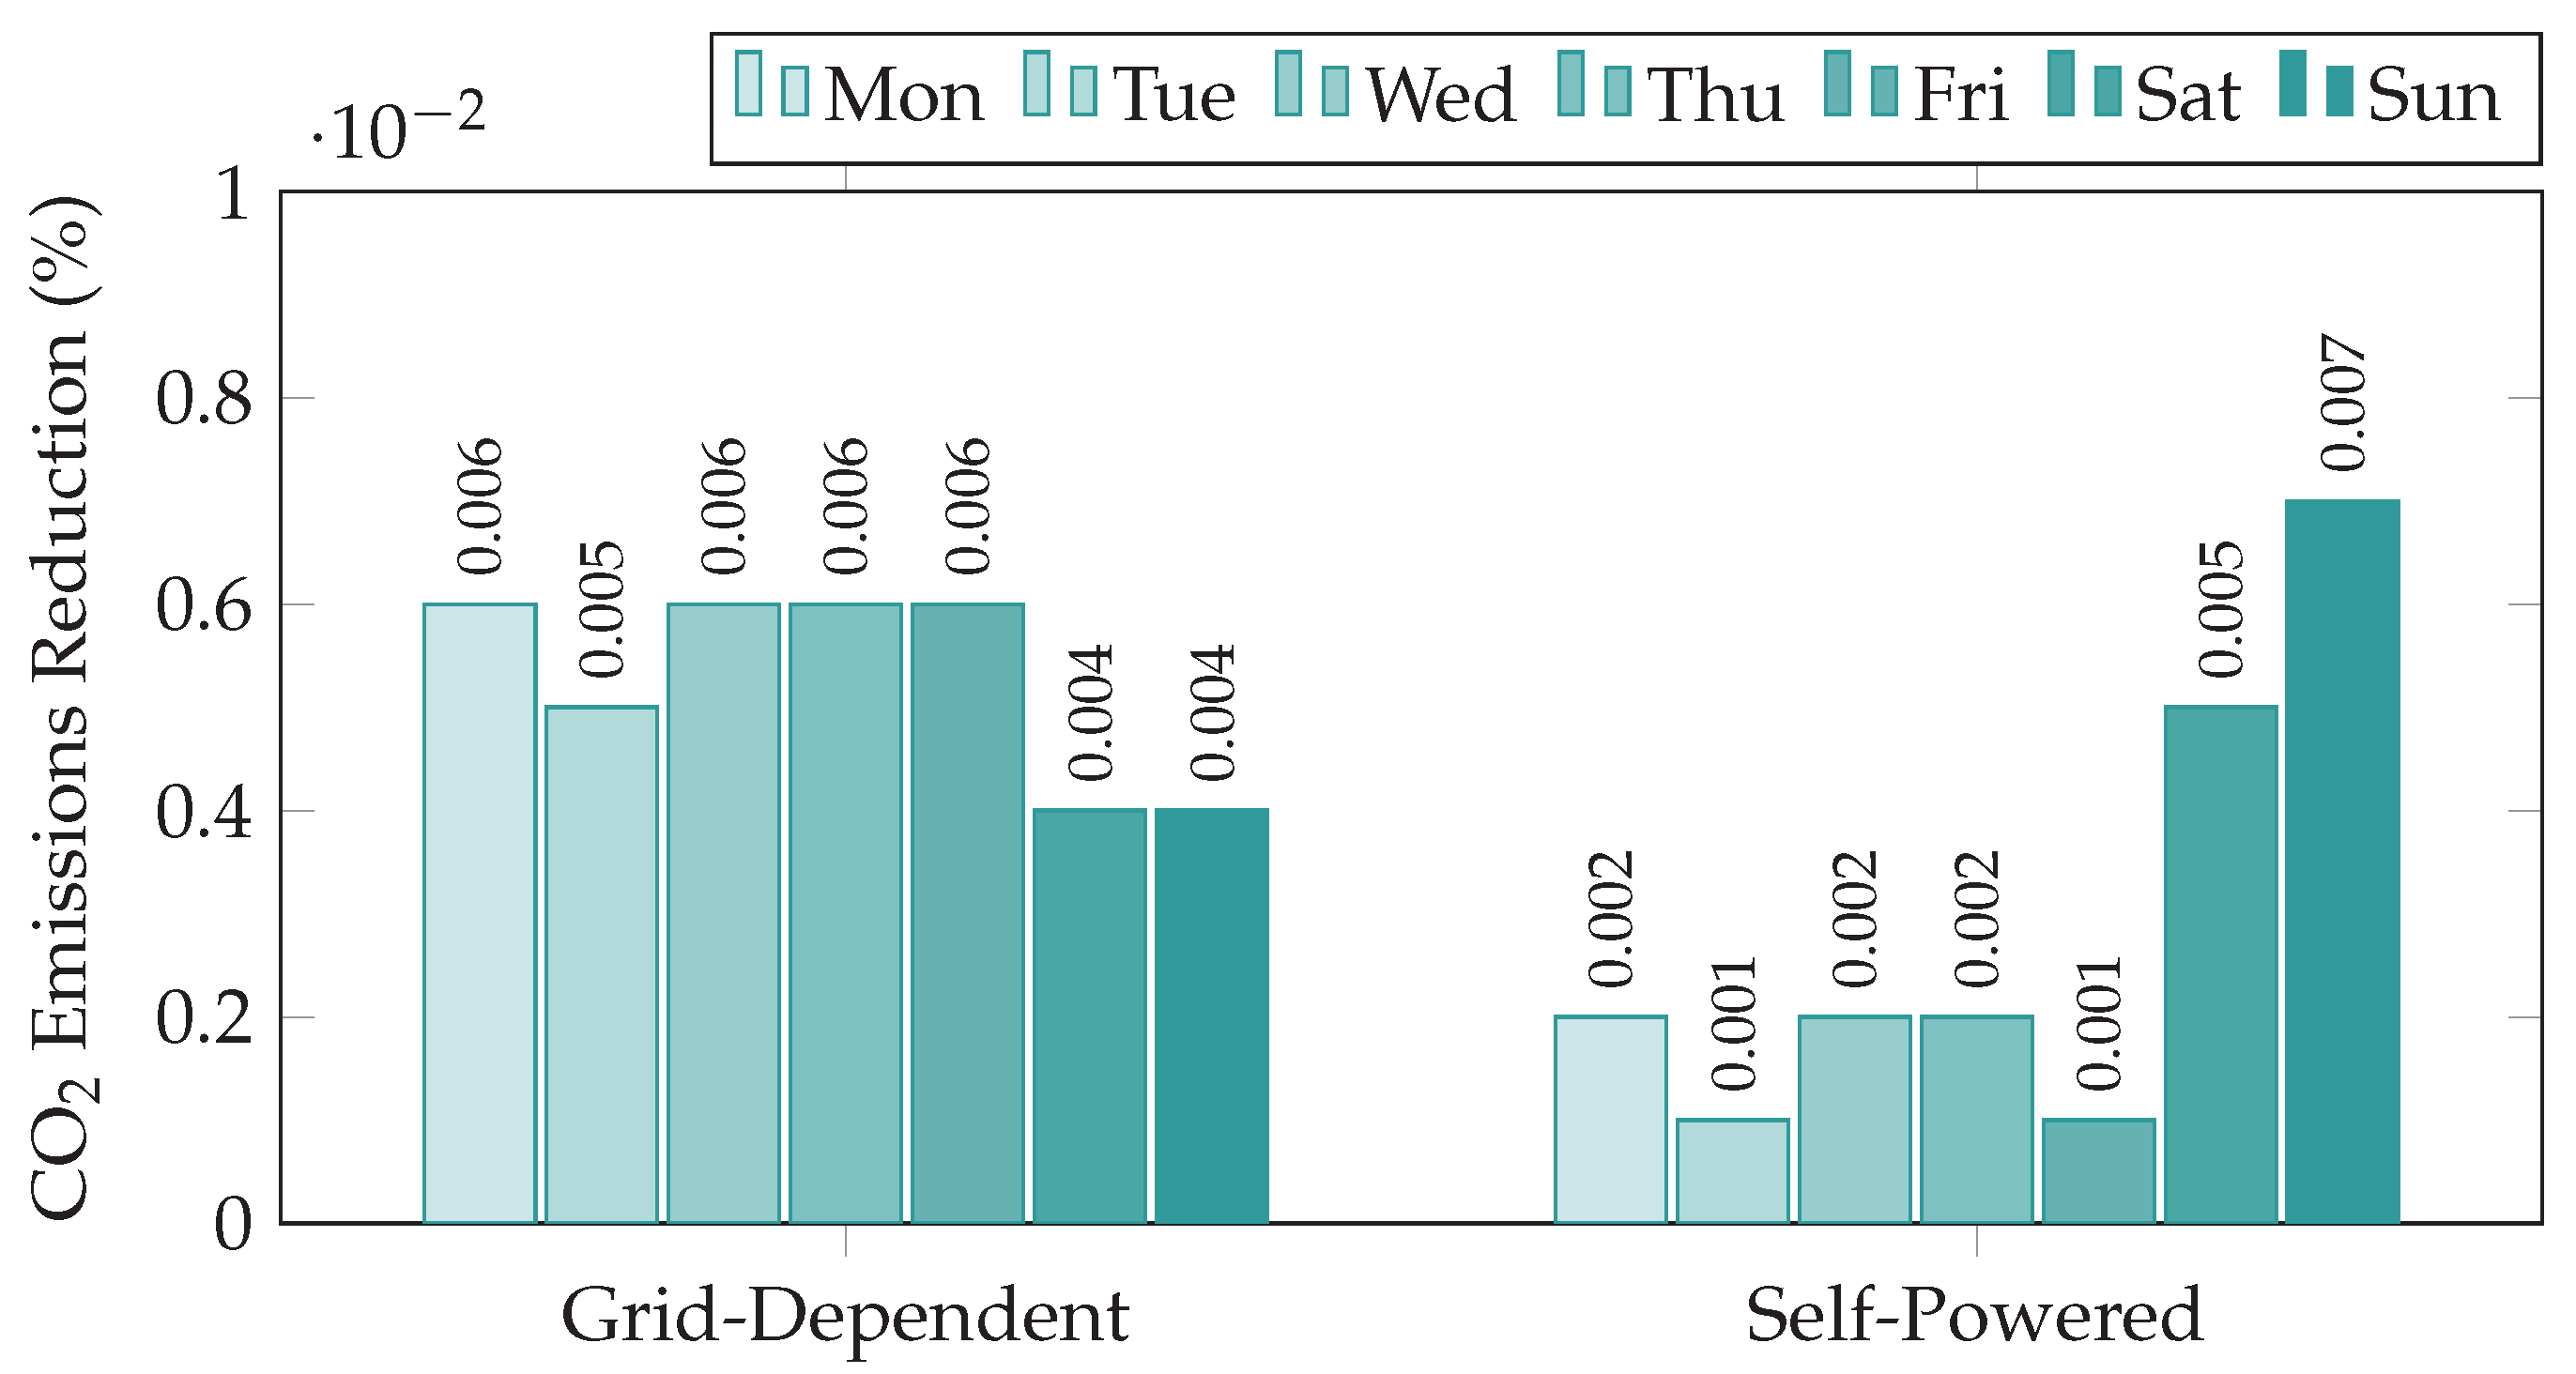
Figure 18 presents the corresponding CO
2 emission reductions. Although the absolute values are lower due to the nature of the metric, the overall trend aligns with the observed pattern in energy losses. In the grid-dependent configuration, reductions range from 0.004% to 0.006%, with a weekly average of 0.0053% and a standard deviation of 0.0009%, indicating stable performance throughout the week. In contrast, the self-powered mode exhibits greater variability, with values spanning from 0.001% to 0.007%, a weekly average of 0.0029%, and a higher standard deviation of 0.0021%. This increased dispersion reflects the effects of intermittent power flows and the absence of centralized dispatch control.
These results highlight that the algorithm’s performance, both in terms of energy loss and CO2 emission reductions, is strongly influenced by the specific configuration of the distribution network, particularly the placement of photovoltaic generators and battery systems. It is worth noting that the 136-node test system originally lacked both PV generation and storage units; consequently, these components were assigned to arbitrary locations within the network. While the reported outcomes demonstrate the algorithm’s potential, they could likely be enhanced through an optimized siting strategy for DERs, a topic beyond the scope of this study but identified as a direction for future research.
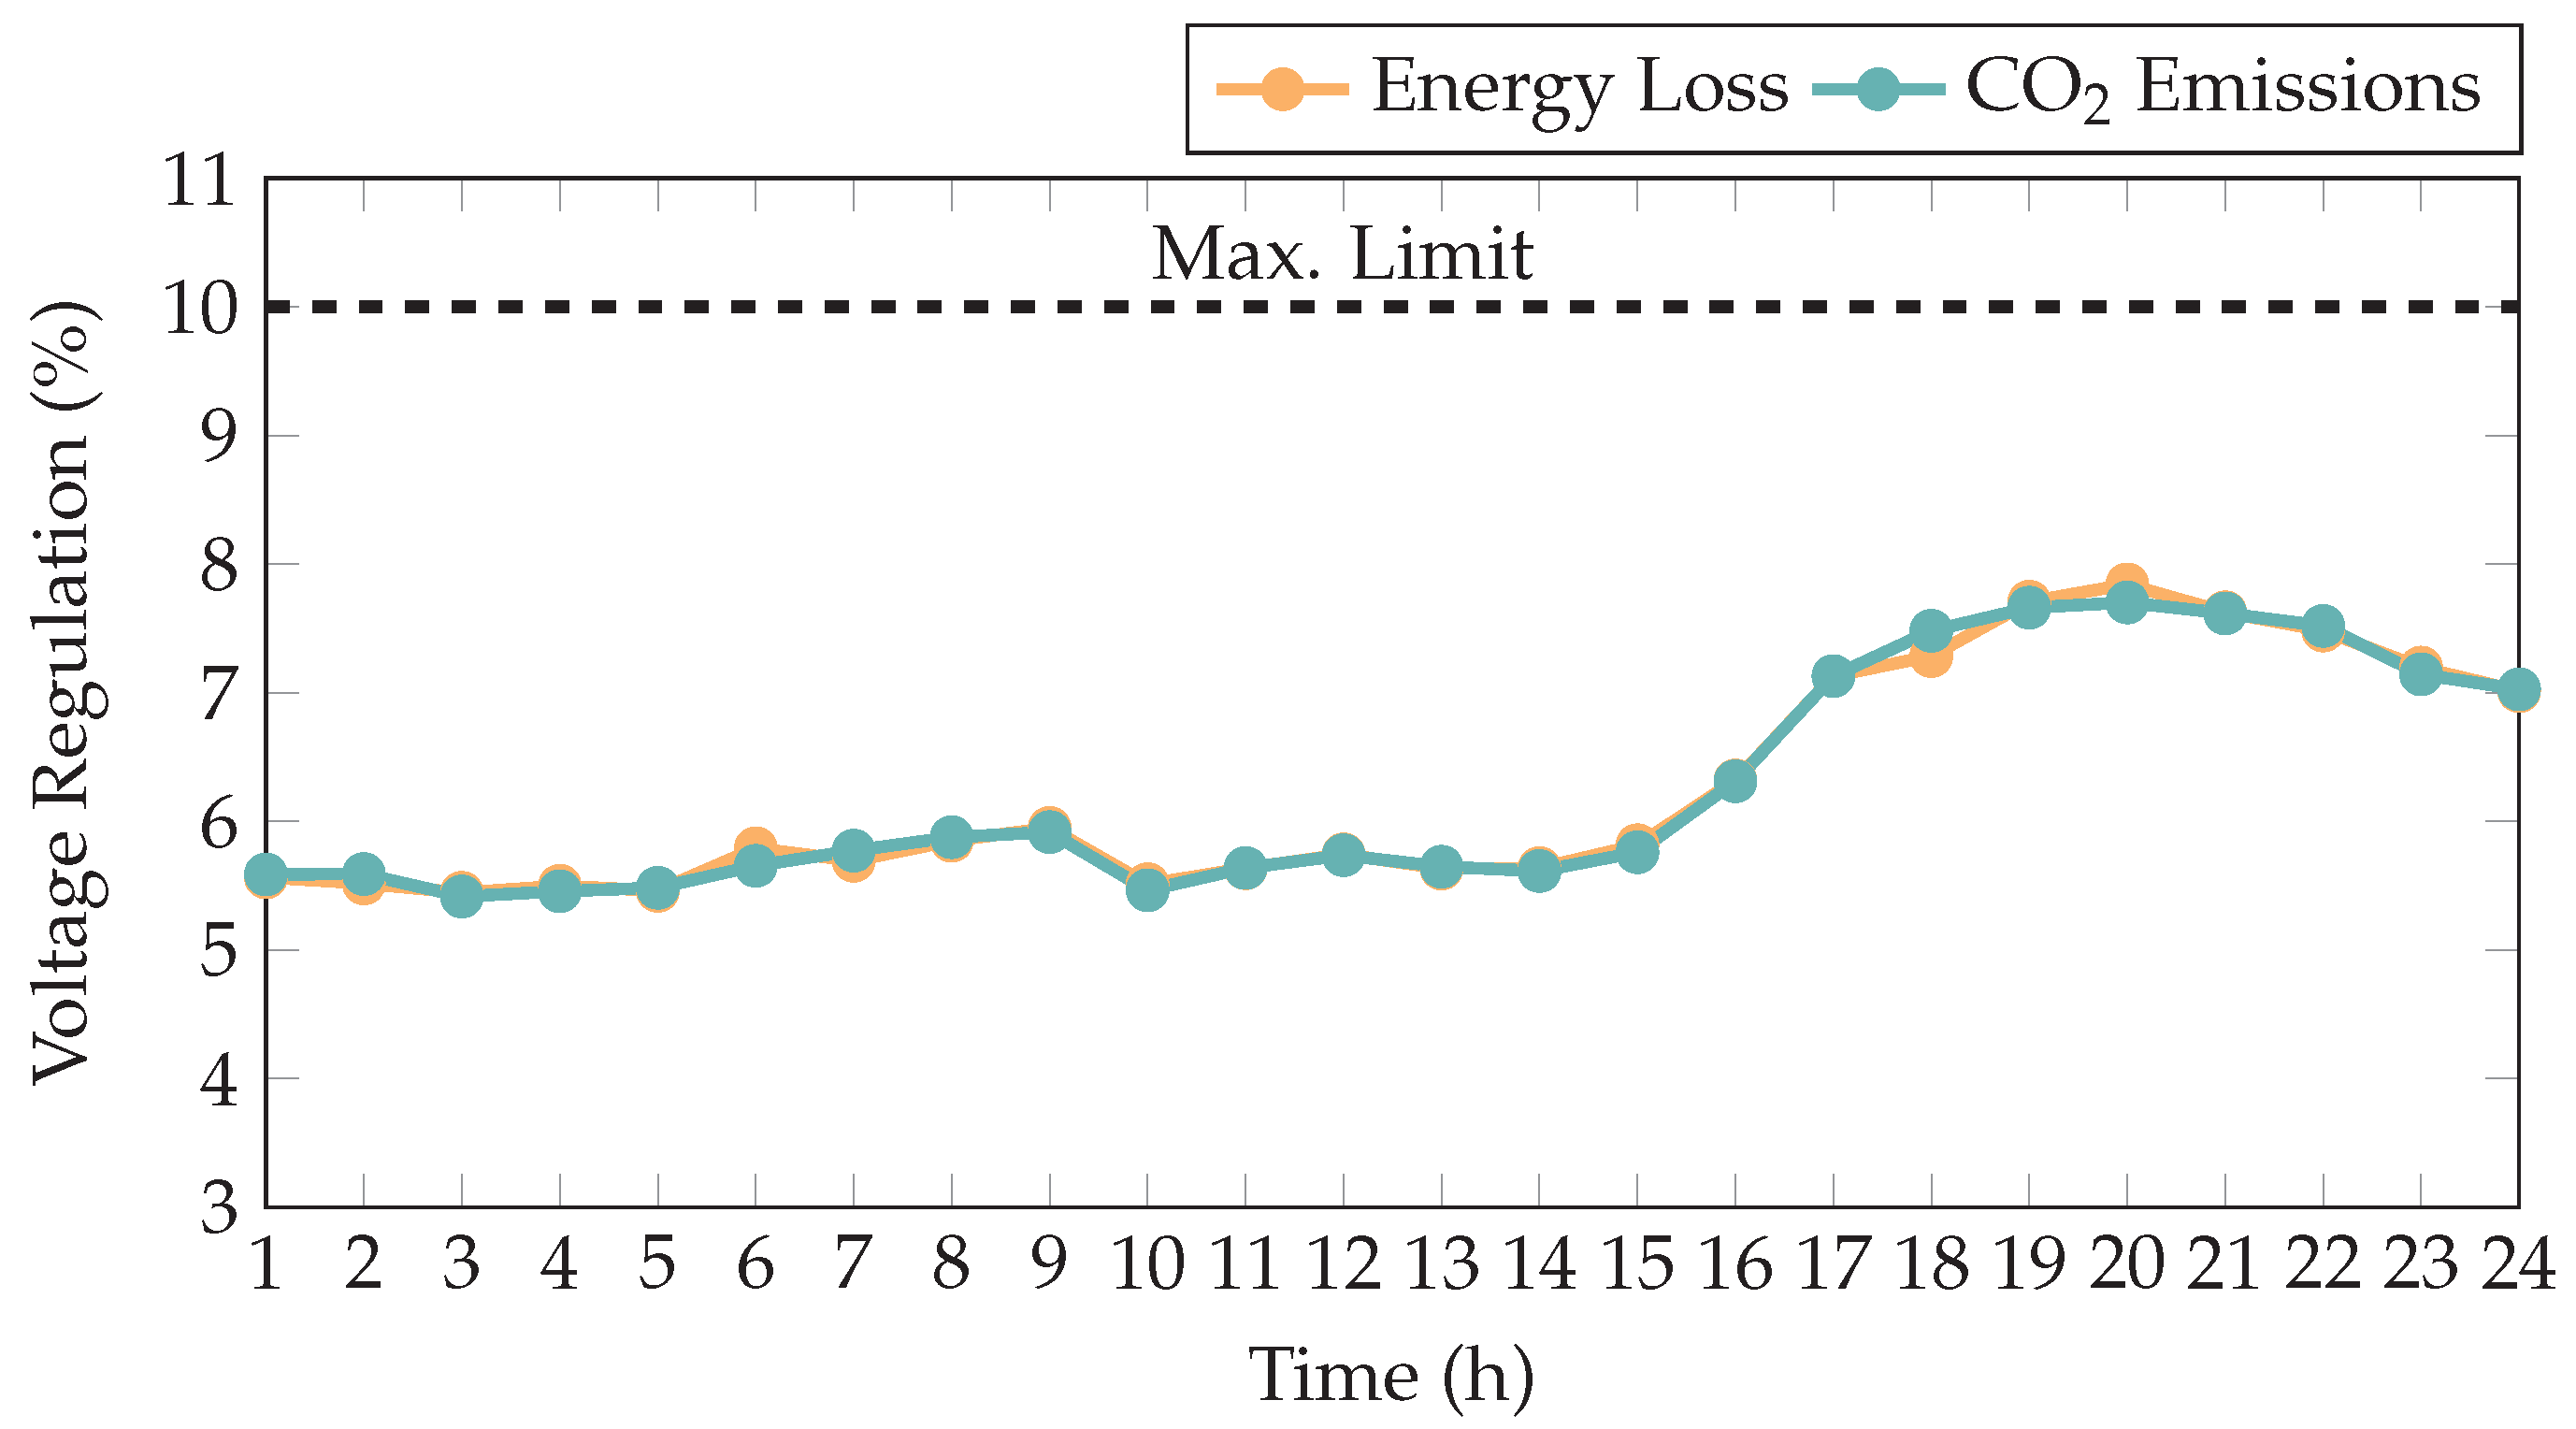
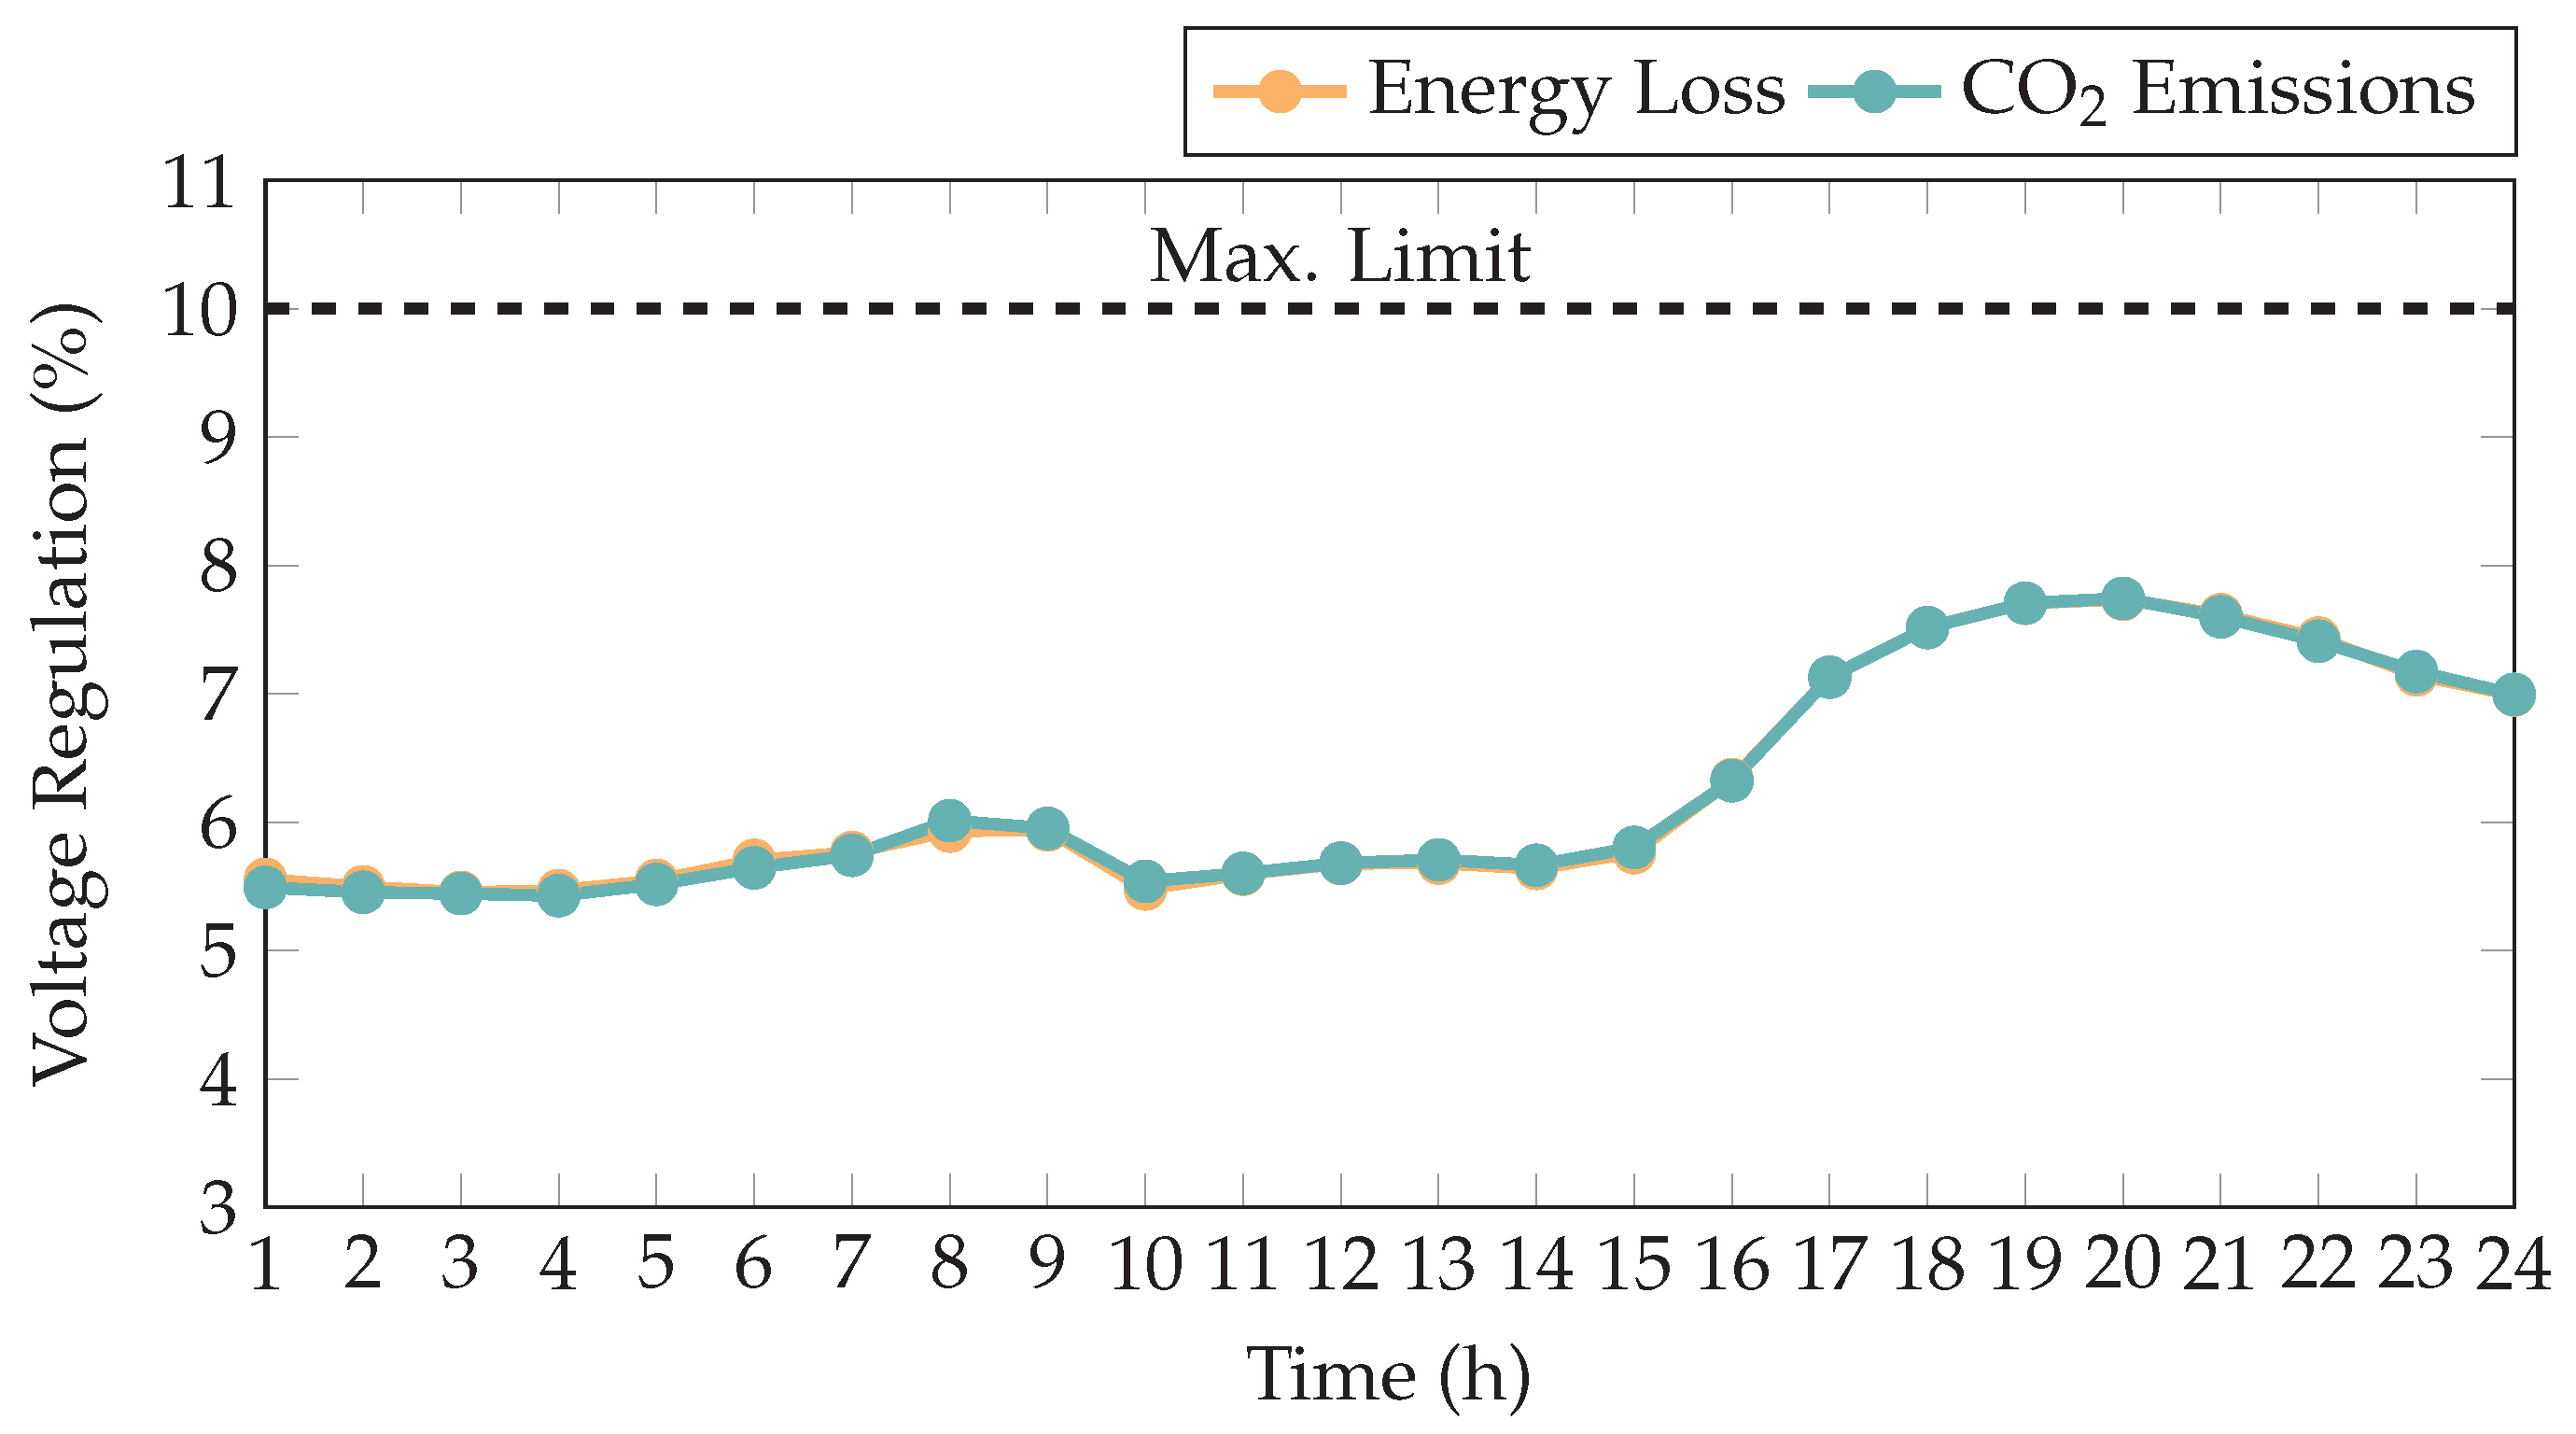
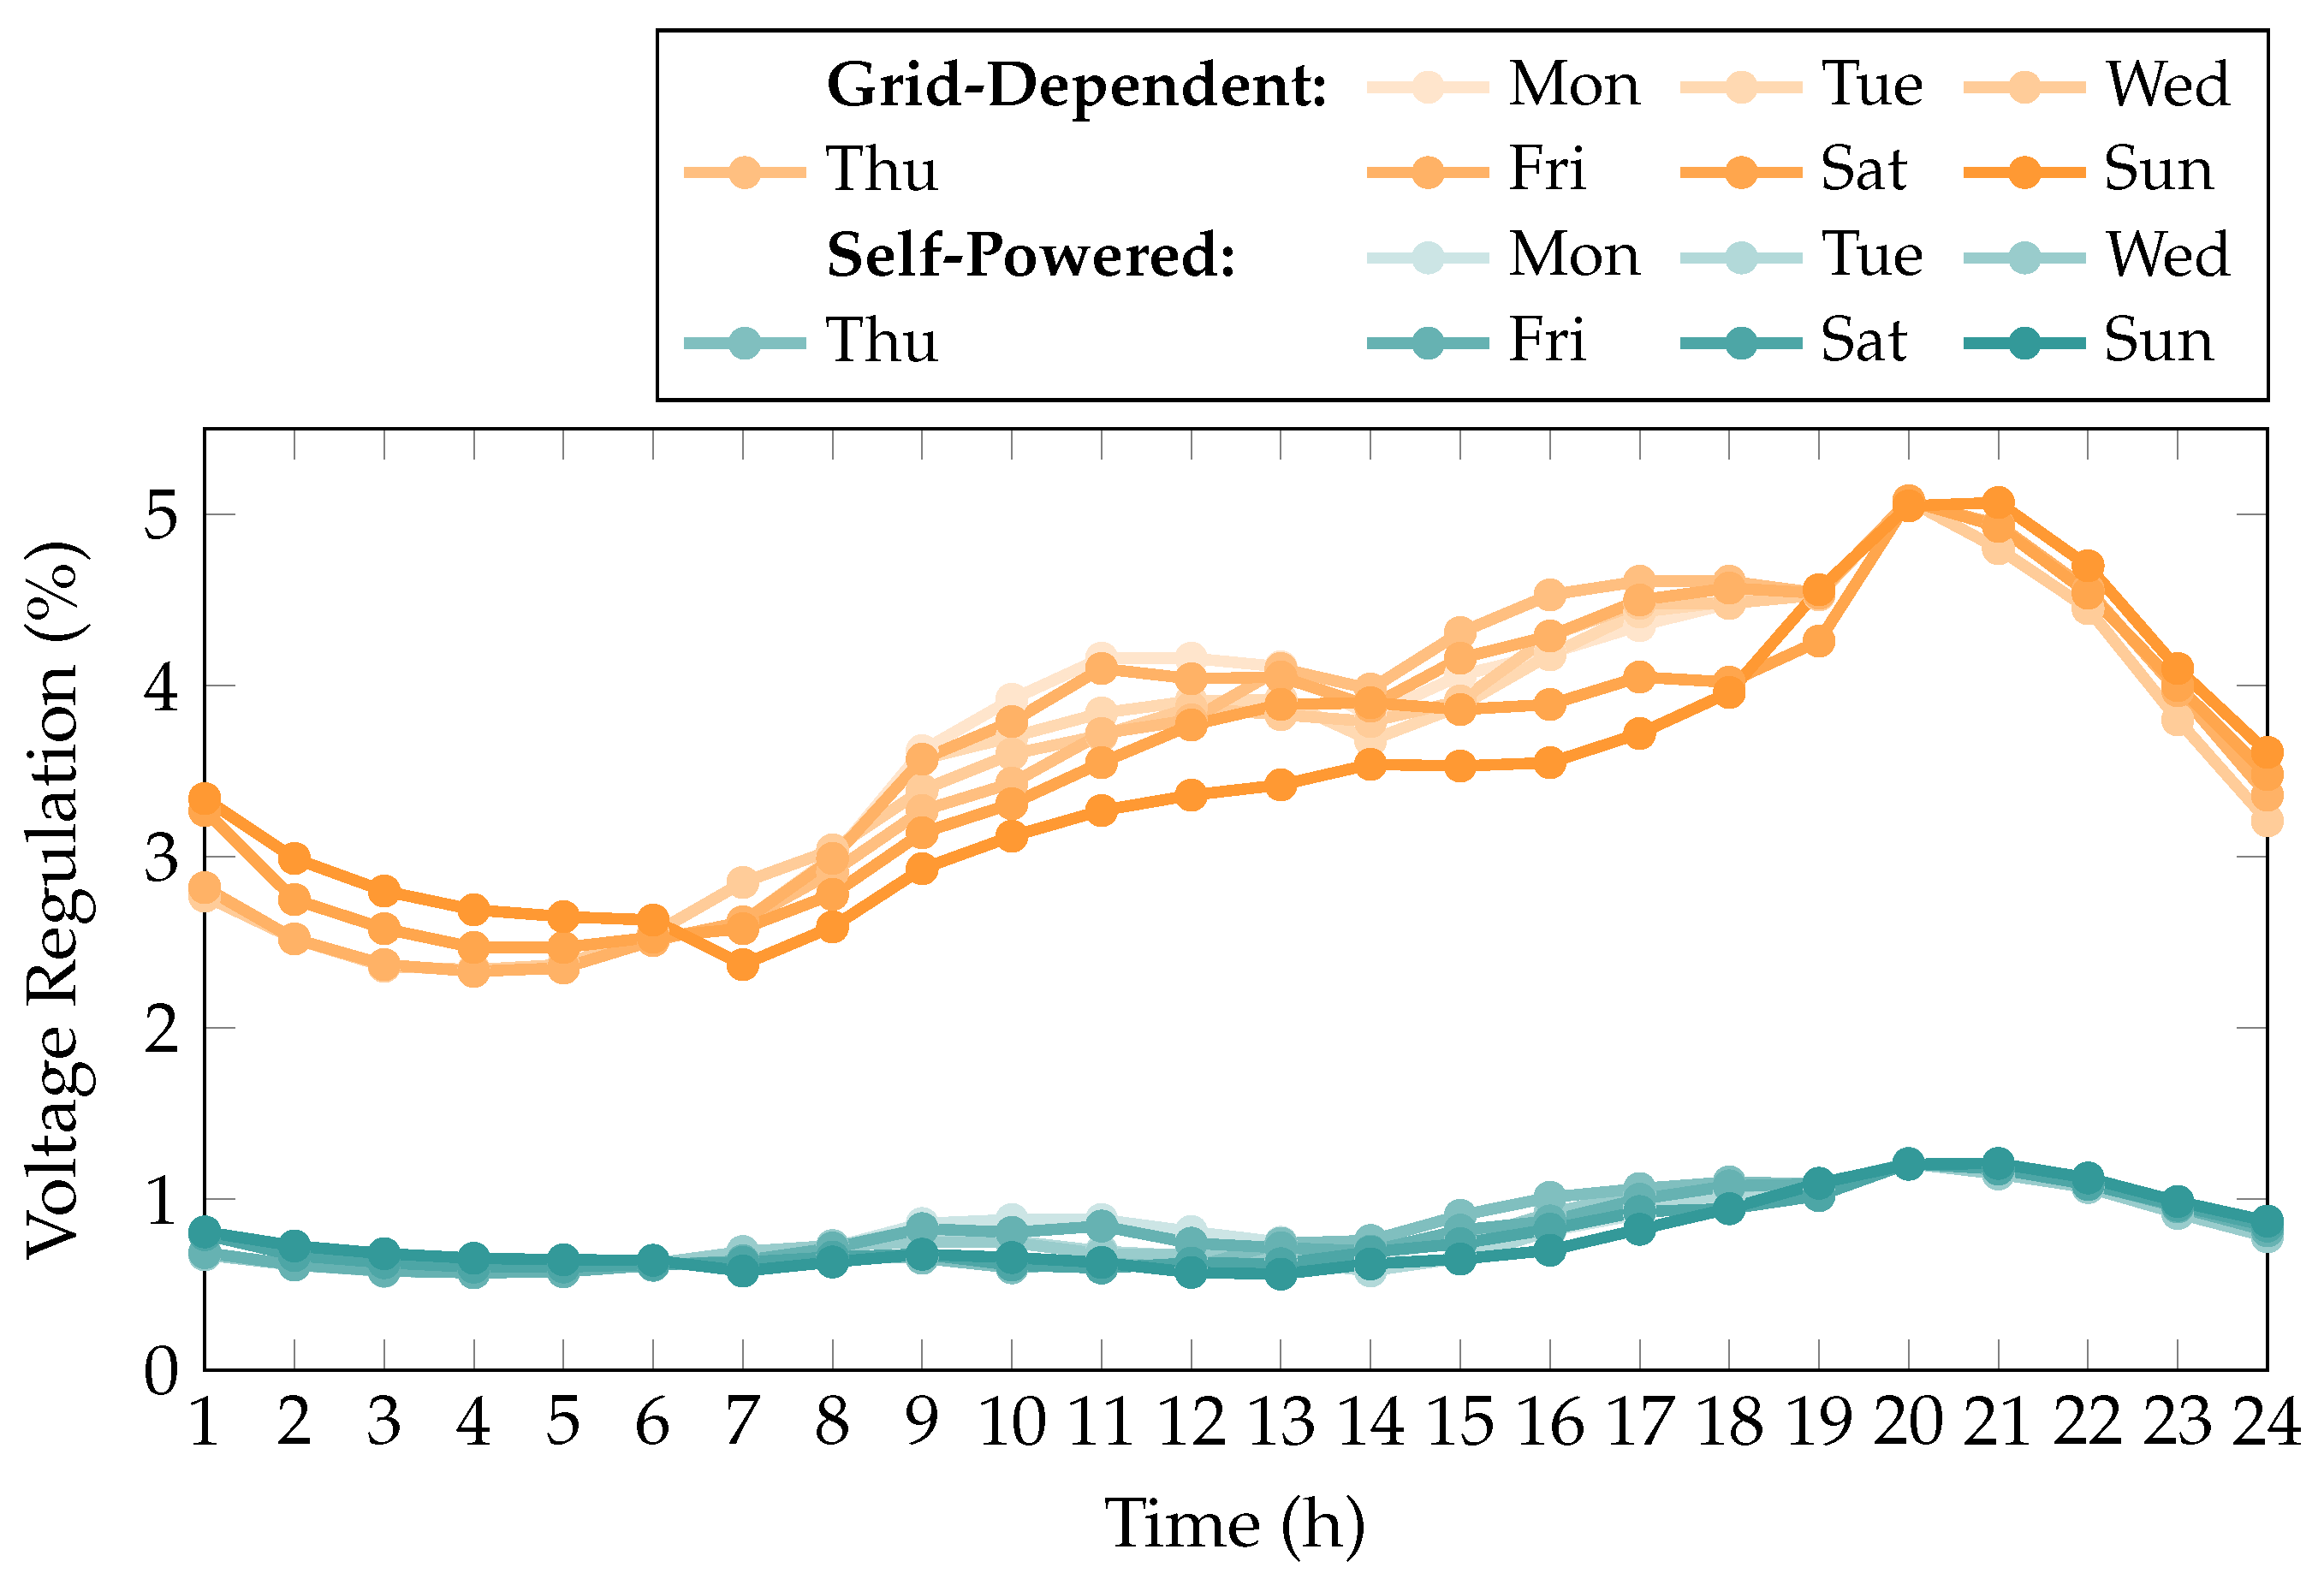
Figure 19 displays the hourly voltage regulation of a 136-node distribution network optimized with the PMVO algorithm under both grid-connected and self-powered configurations, using daily operational profiles over a full week to capture typical load and generation fluctuations.
In the grid-connected mode, voltage regulation remains within 2.3% to 5.08%, always below the 10% operational limit. The lowest deviations occur in the early morning hours (1–6), with regulation levels near 2.3–2.6% due to lower demand and system stress. Voltage deviations increase gradually during the day, peaking consistently at hour 20 with a maximum of 5.08%, reflecting evening peak demand. Despite day-to-day variability, the algorithm maintains a narrow voltage band with minimal fluctuations between days, demonstrating robustness against variable operating conditions.
Under the self-powered scenario, voltage regulation is even more constrained, ranging from 0.57% to 1.21%, with similar daily trends. These lower values stem from a different voltage reference related to slack-less operation. Peak deviations occur, again, near hour 20, with all days converging at around 1.208%, confirming the repeatability of this peak pattern.
The results confirm that the PMVO algorithm effectively controls voltage within safe operational limits over a larger, more complex network, achieving a similar regulation quality to that previously demonstrated in a 33-node system. The use of detailed daily profiles covering multiple days illustrates the algorithm’s capacity to handle typical variability and suggests its suitability for integration into EMS frameworks with frequent updates. This implies that the approach can adapt to forecast uncertainties and changing conditions, providing reliable voltage regulation in both grid-supported and islanded microgrid configurations.
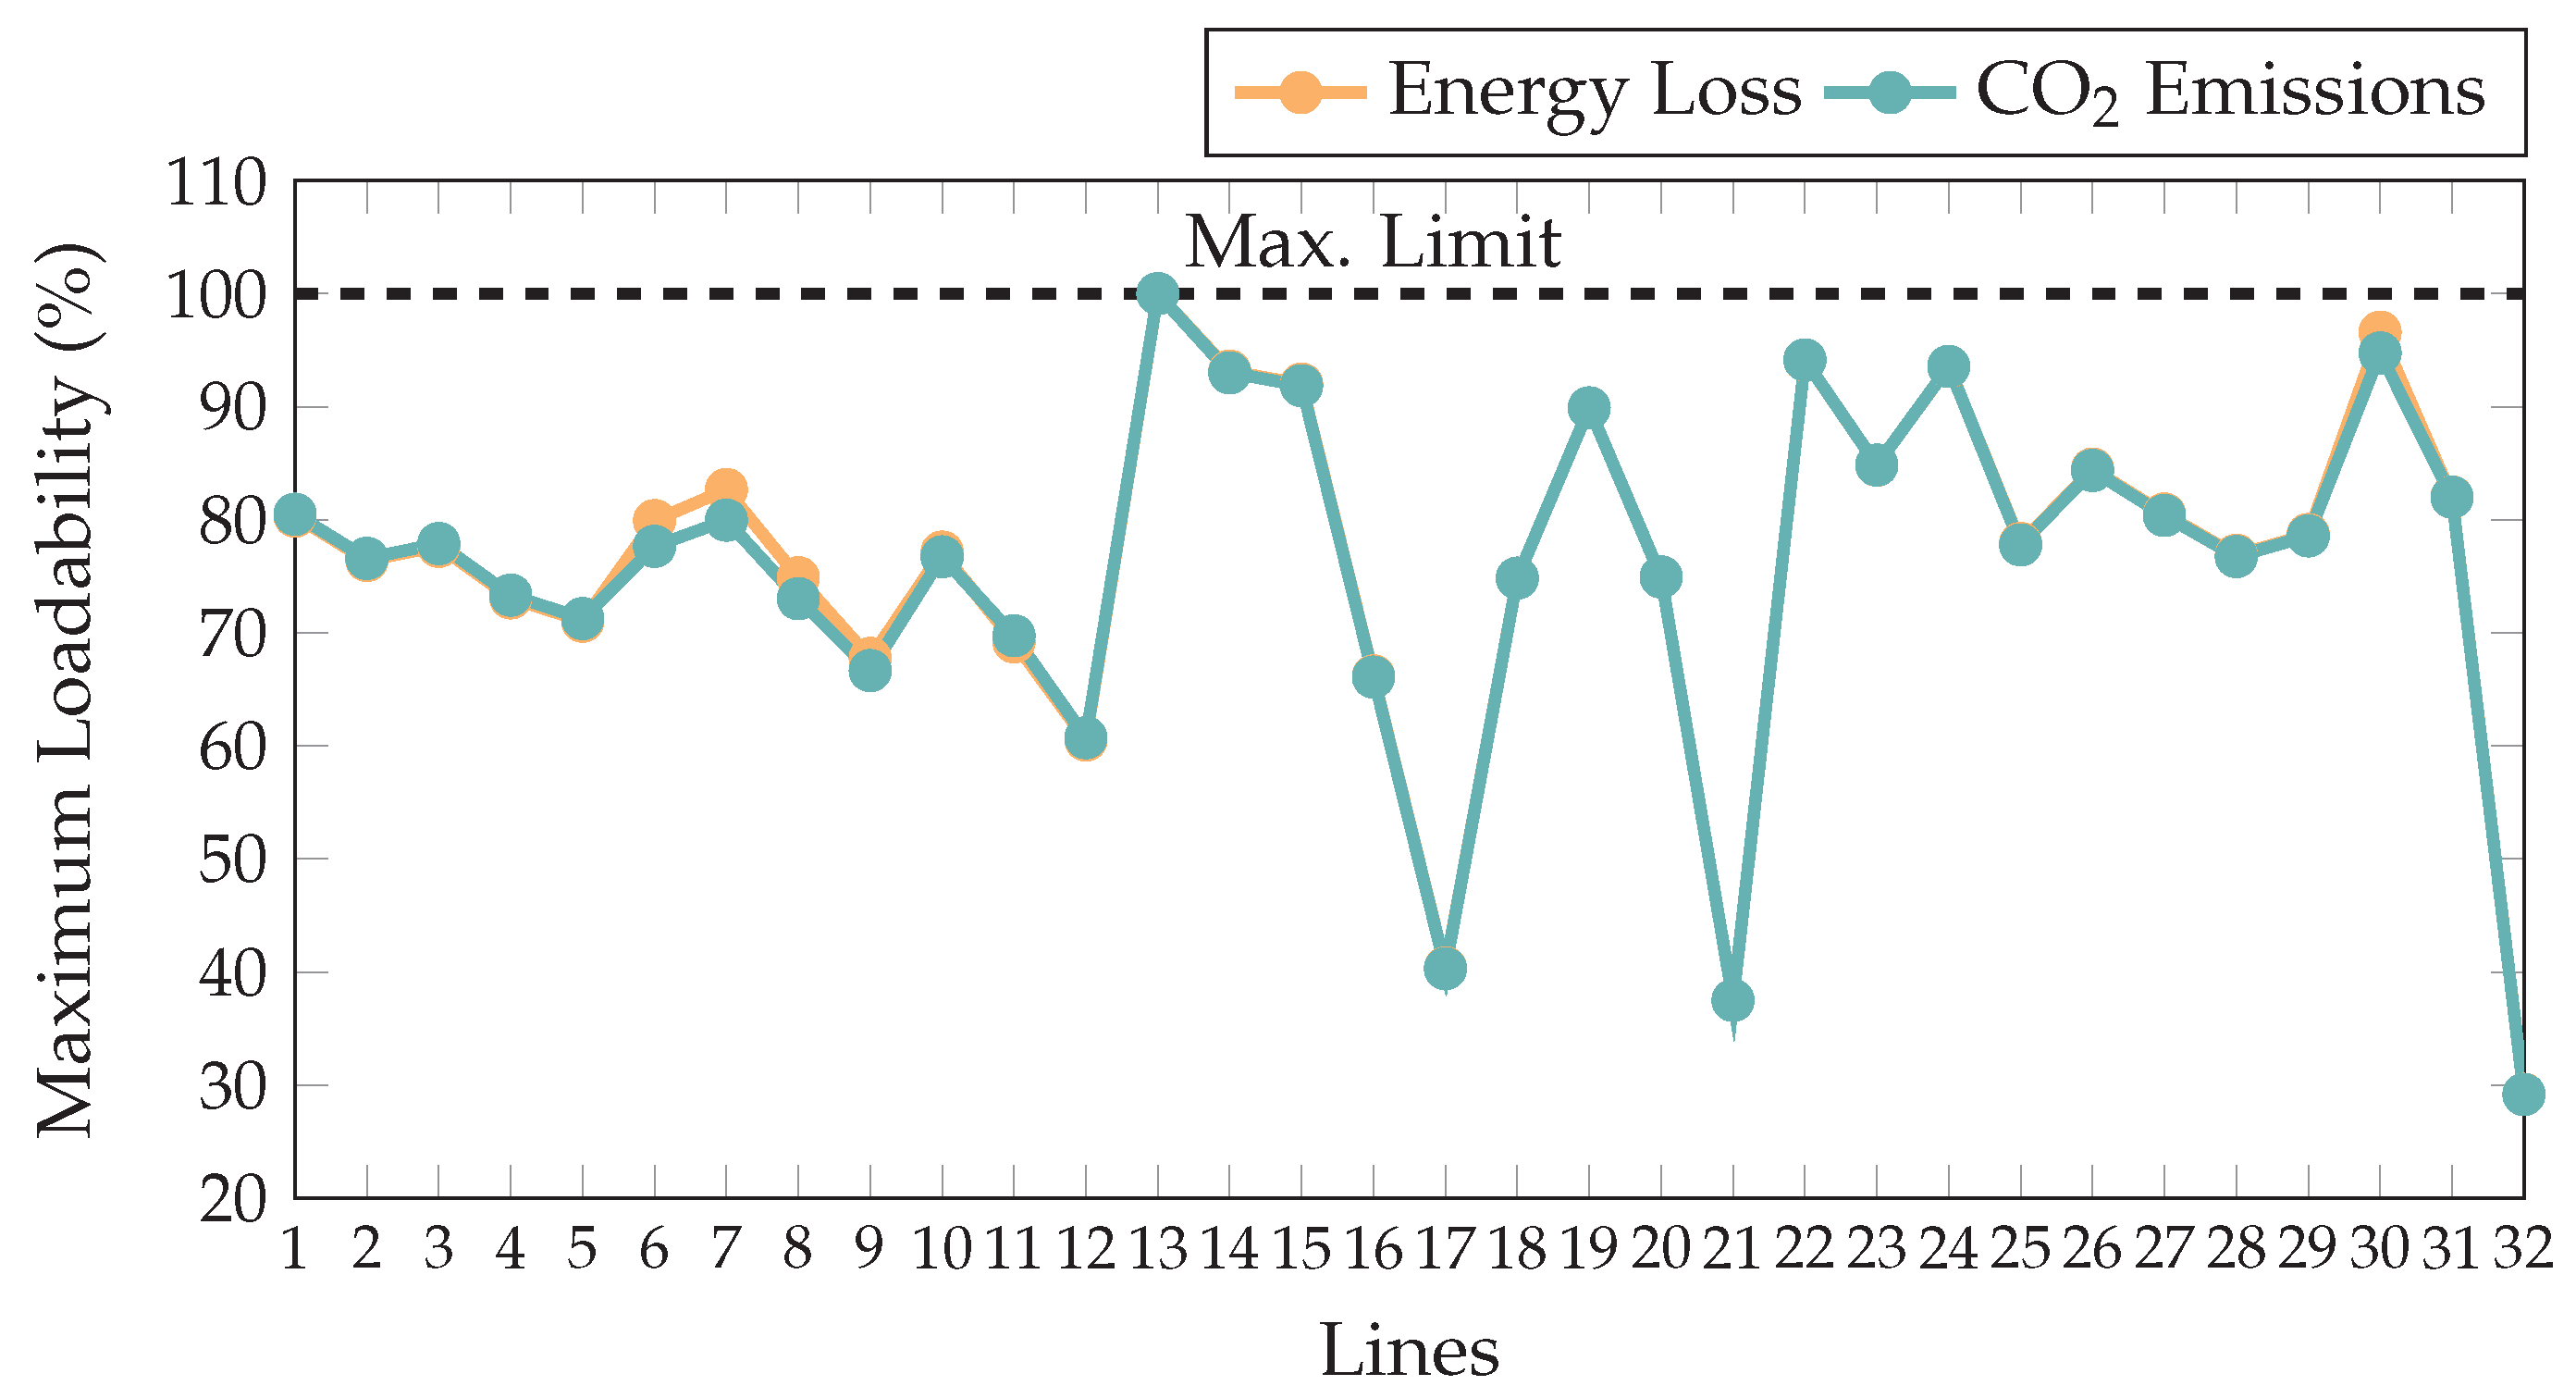
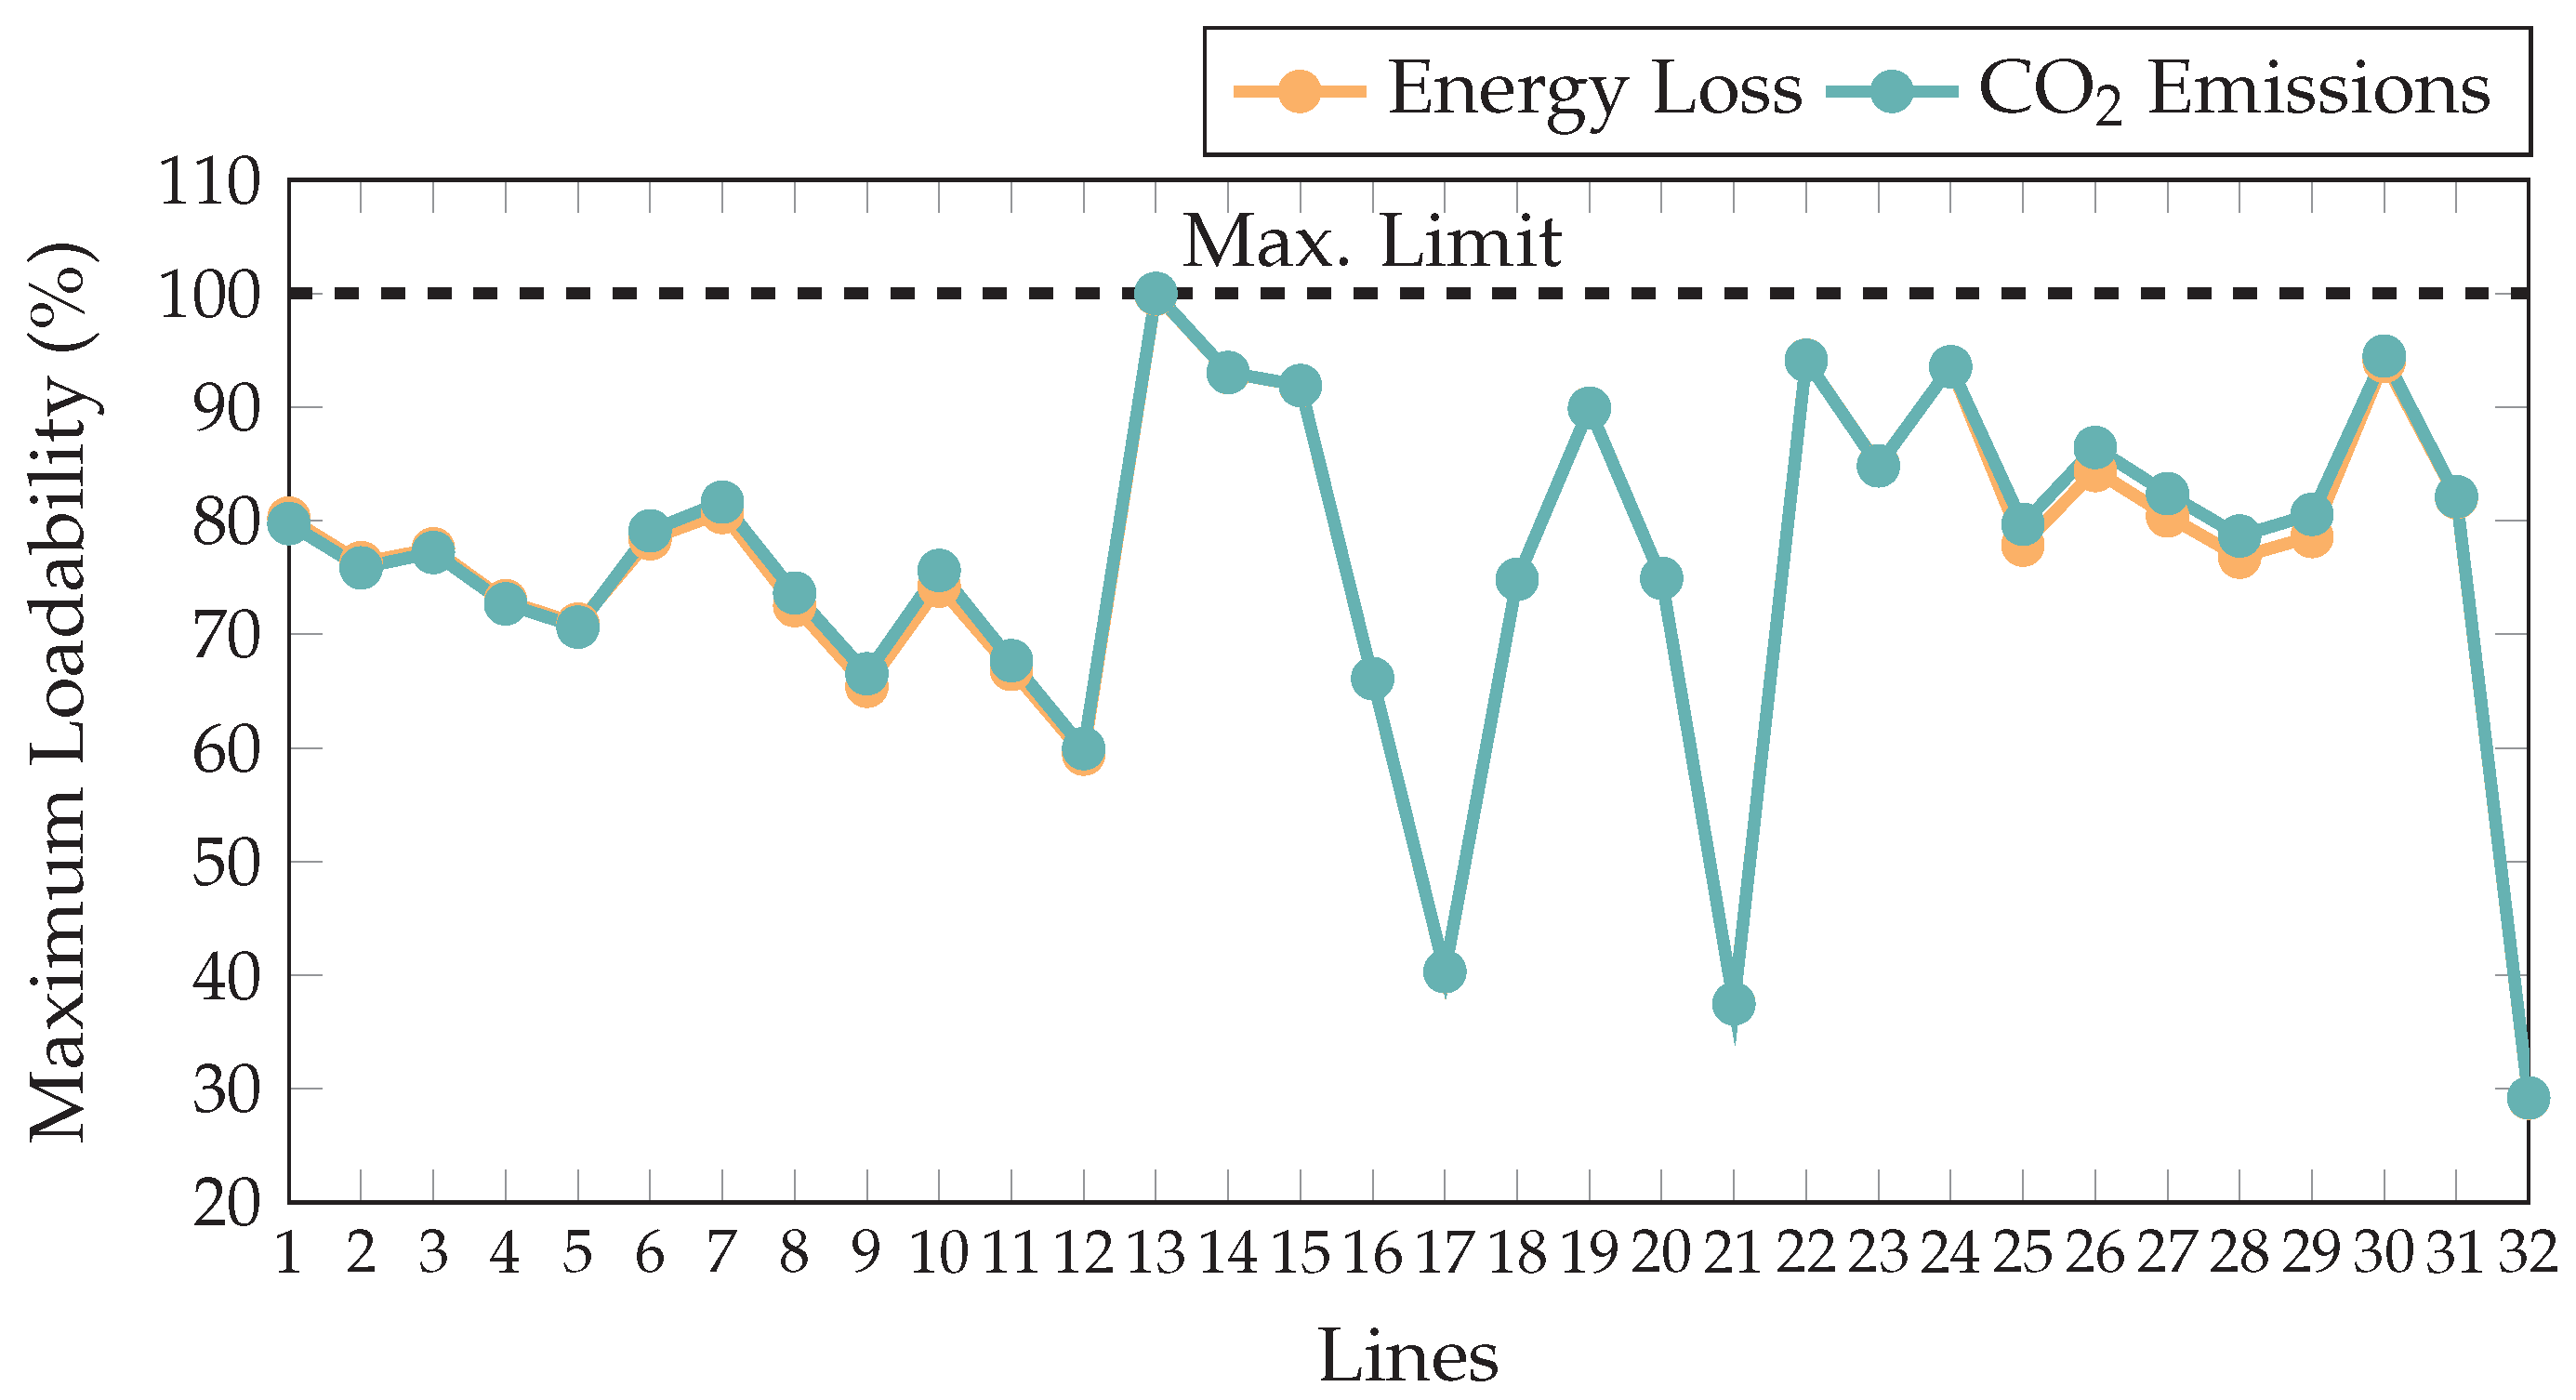
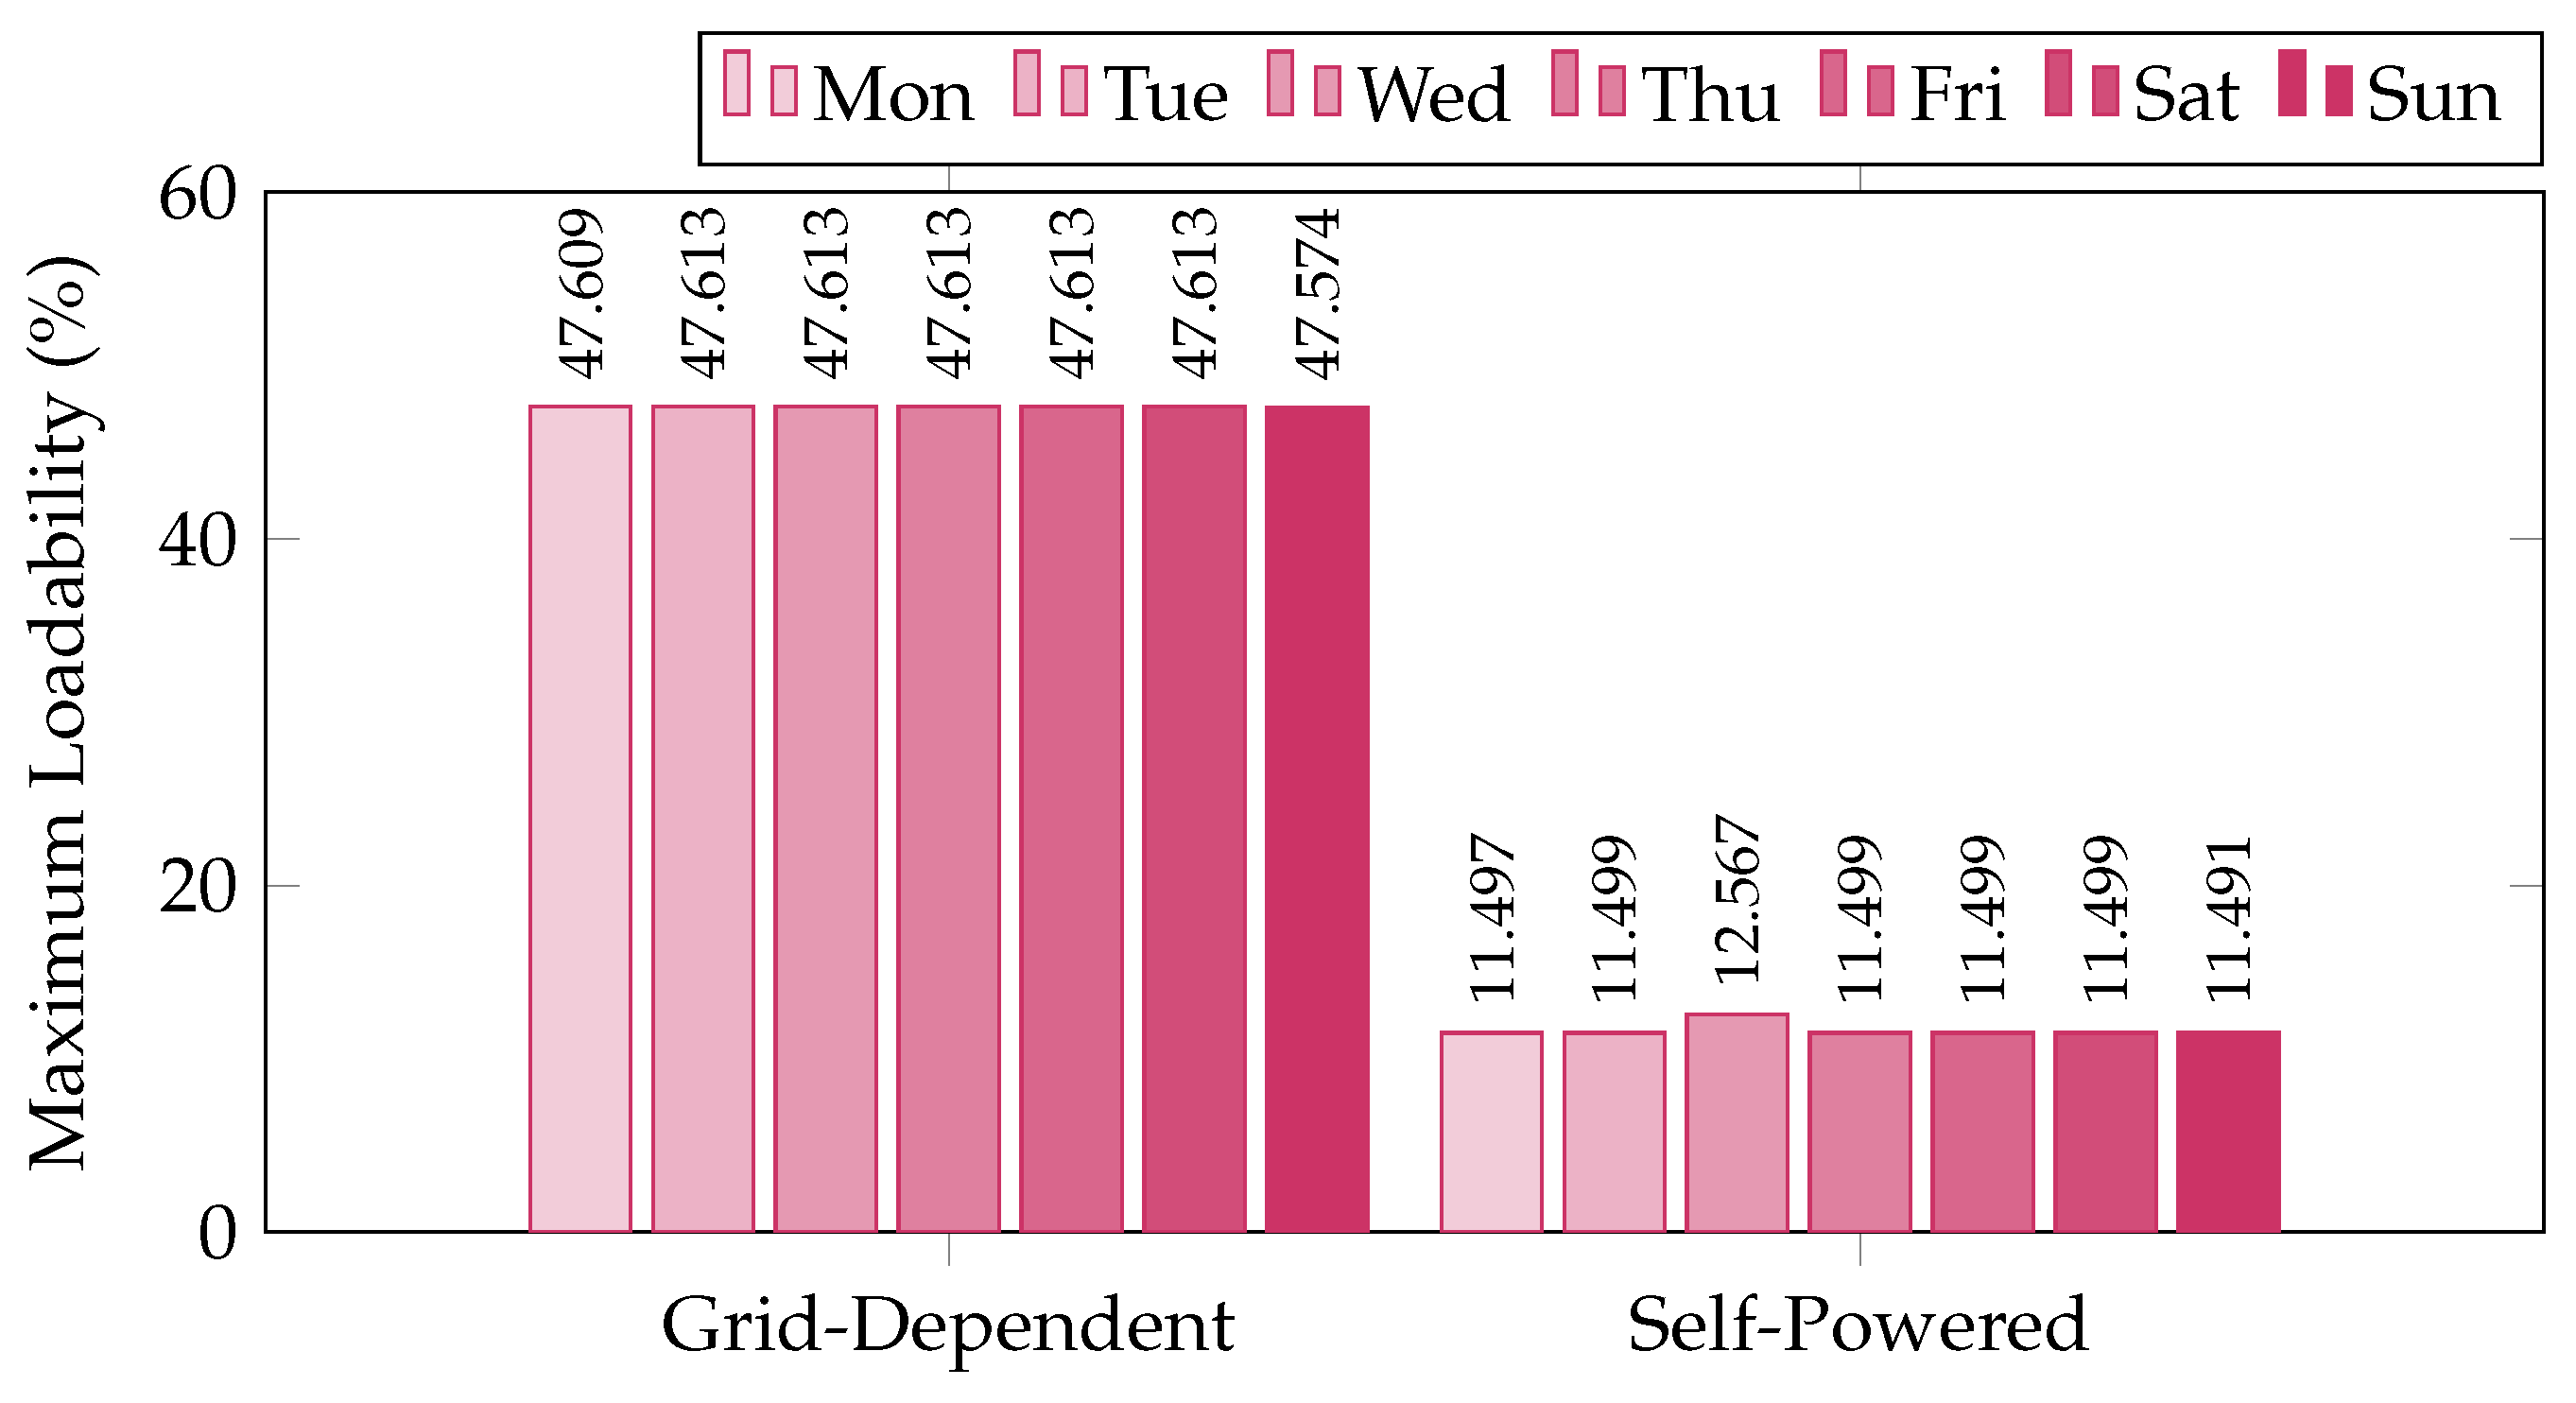
Figure 20 presents the maximum loadability percentages of the 136-node distribution system for each day of the week under grid-connected and self-powered configurations based on the optimal dispatch of BESS, which is found by the PMVO algorithm.
In the grid-dependent mode, the system exhibits relatively stable maximum loadability values of around 47.6% across all days, well below the 100% operational limit, indicating a comfortable margin against line overloads. This consistent performance suggests that the algorithm effectively balances power flows, preventing any single line from reaching critical loading levels. The minor day-to-day variations (less than 0.05%) reflect the system’s response to typical daily demand and generation patterns without compromising safety or reliability.
Under the self-powered configuration, maximum loadability values are significantly lower, ranging from 11.5% to 12.6%. This reduction is expected since the system operates relying solely on local generation and storage, limiting power transfers over the lines and, thus, reducing line stress. Slightly higher values observed midweek (Wednesday) indicate minor load shifts but remain far from critical levels, showcasing the algorithm’s adaptability to different operating modes while preserving network integrity.
Overall, the PMVO algorithm maintains line loadings at safe, moderate levels regardless of the operation mode, demonstrating its capability to manage power flows effectively in a large-scale network. The stable and repeatable loadability profile over the week highlights the robustness of the dispatch strategy against demand variability. These results reinforce the scalability of the approach and suggest that it can reliably ensure operational security in complex microgrids under varying configurations.
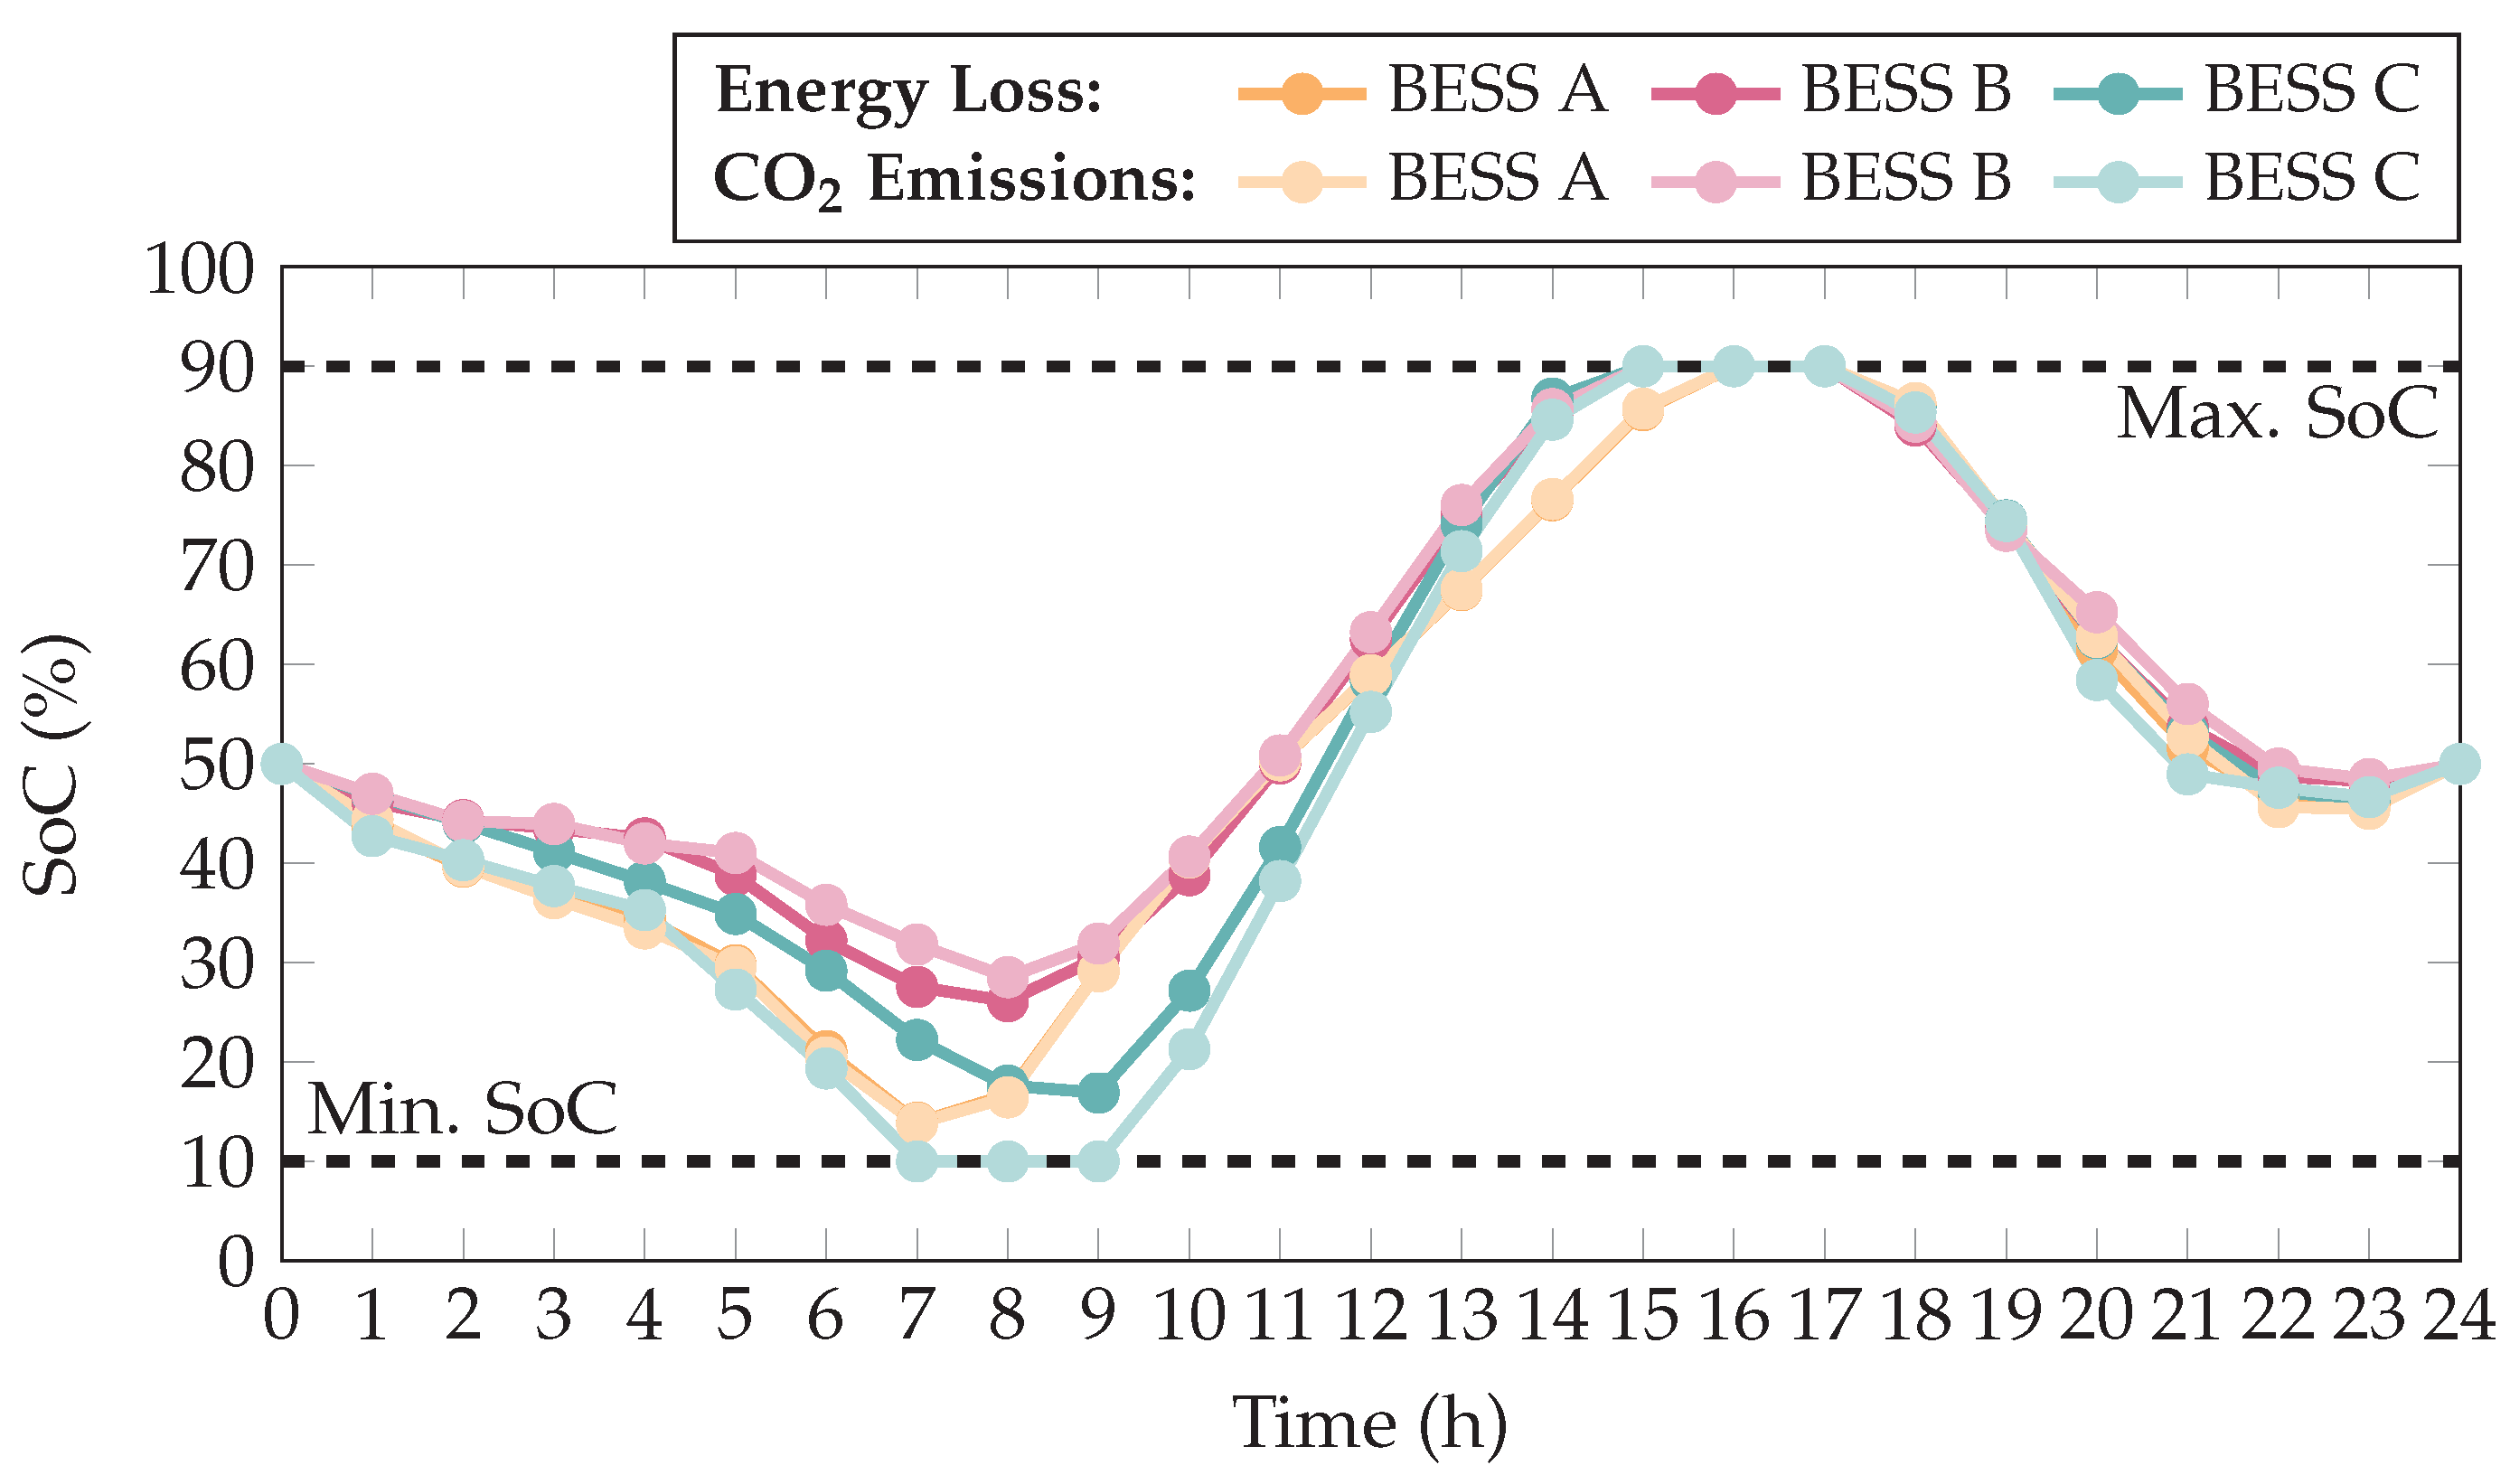
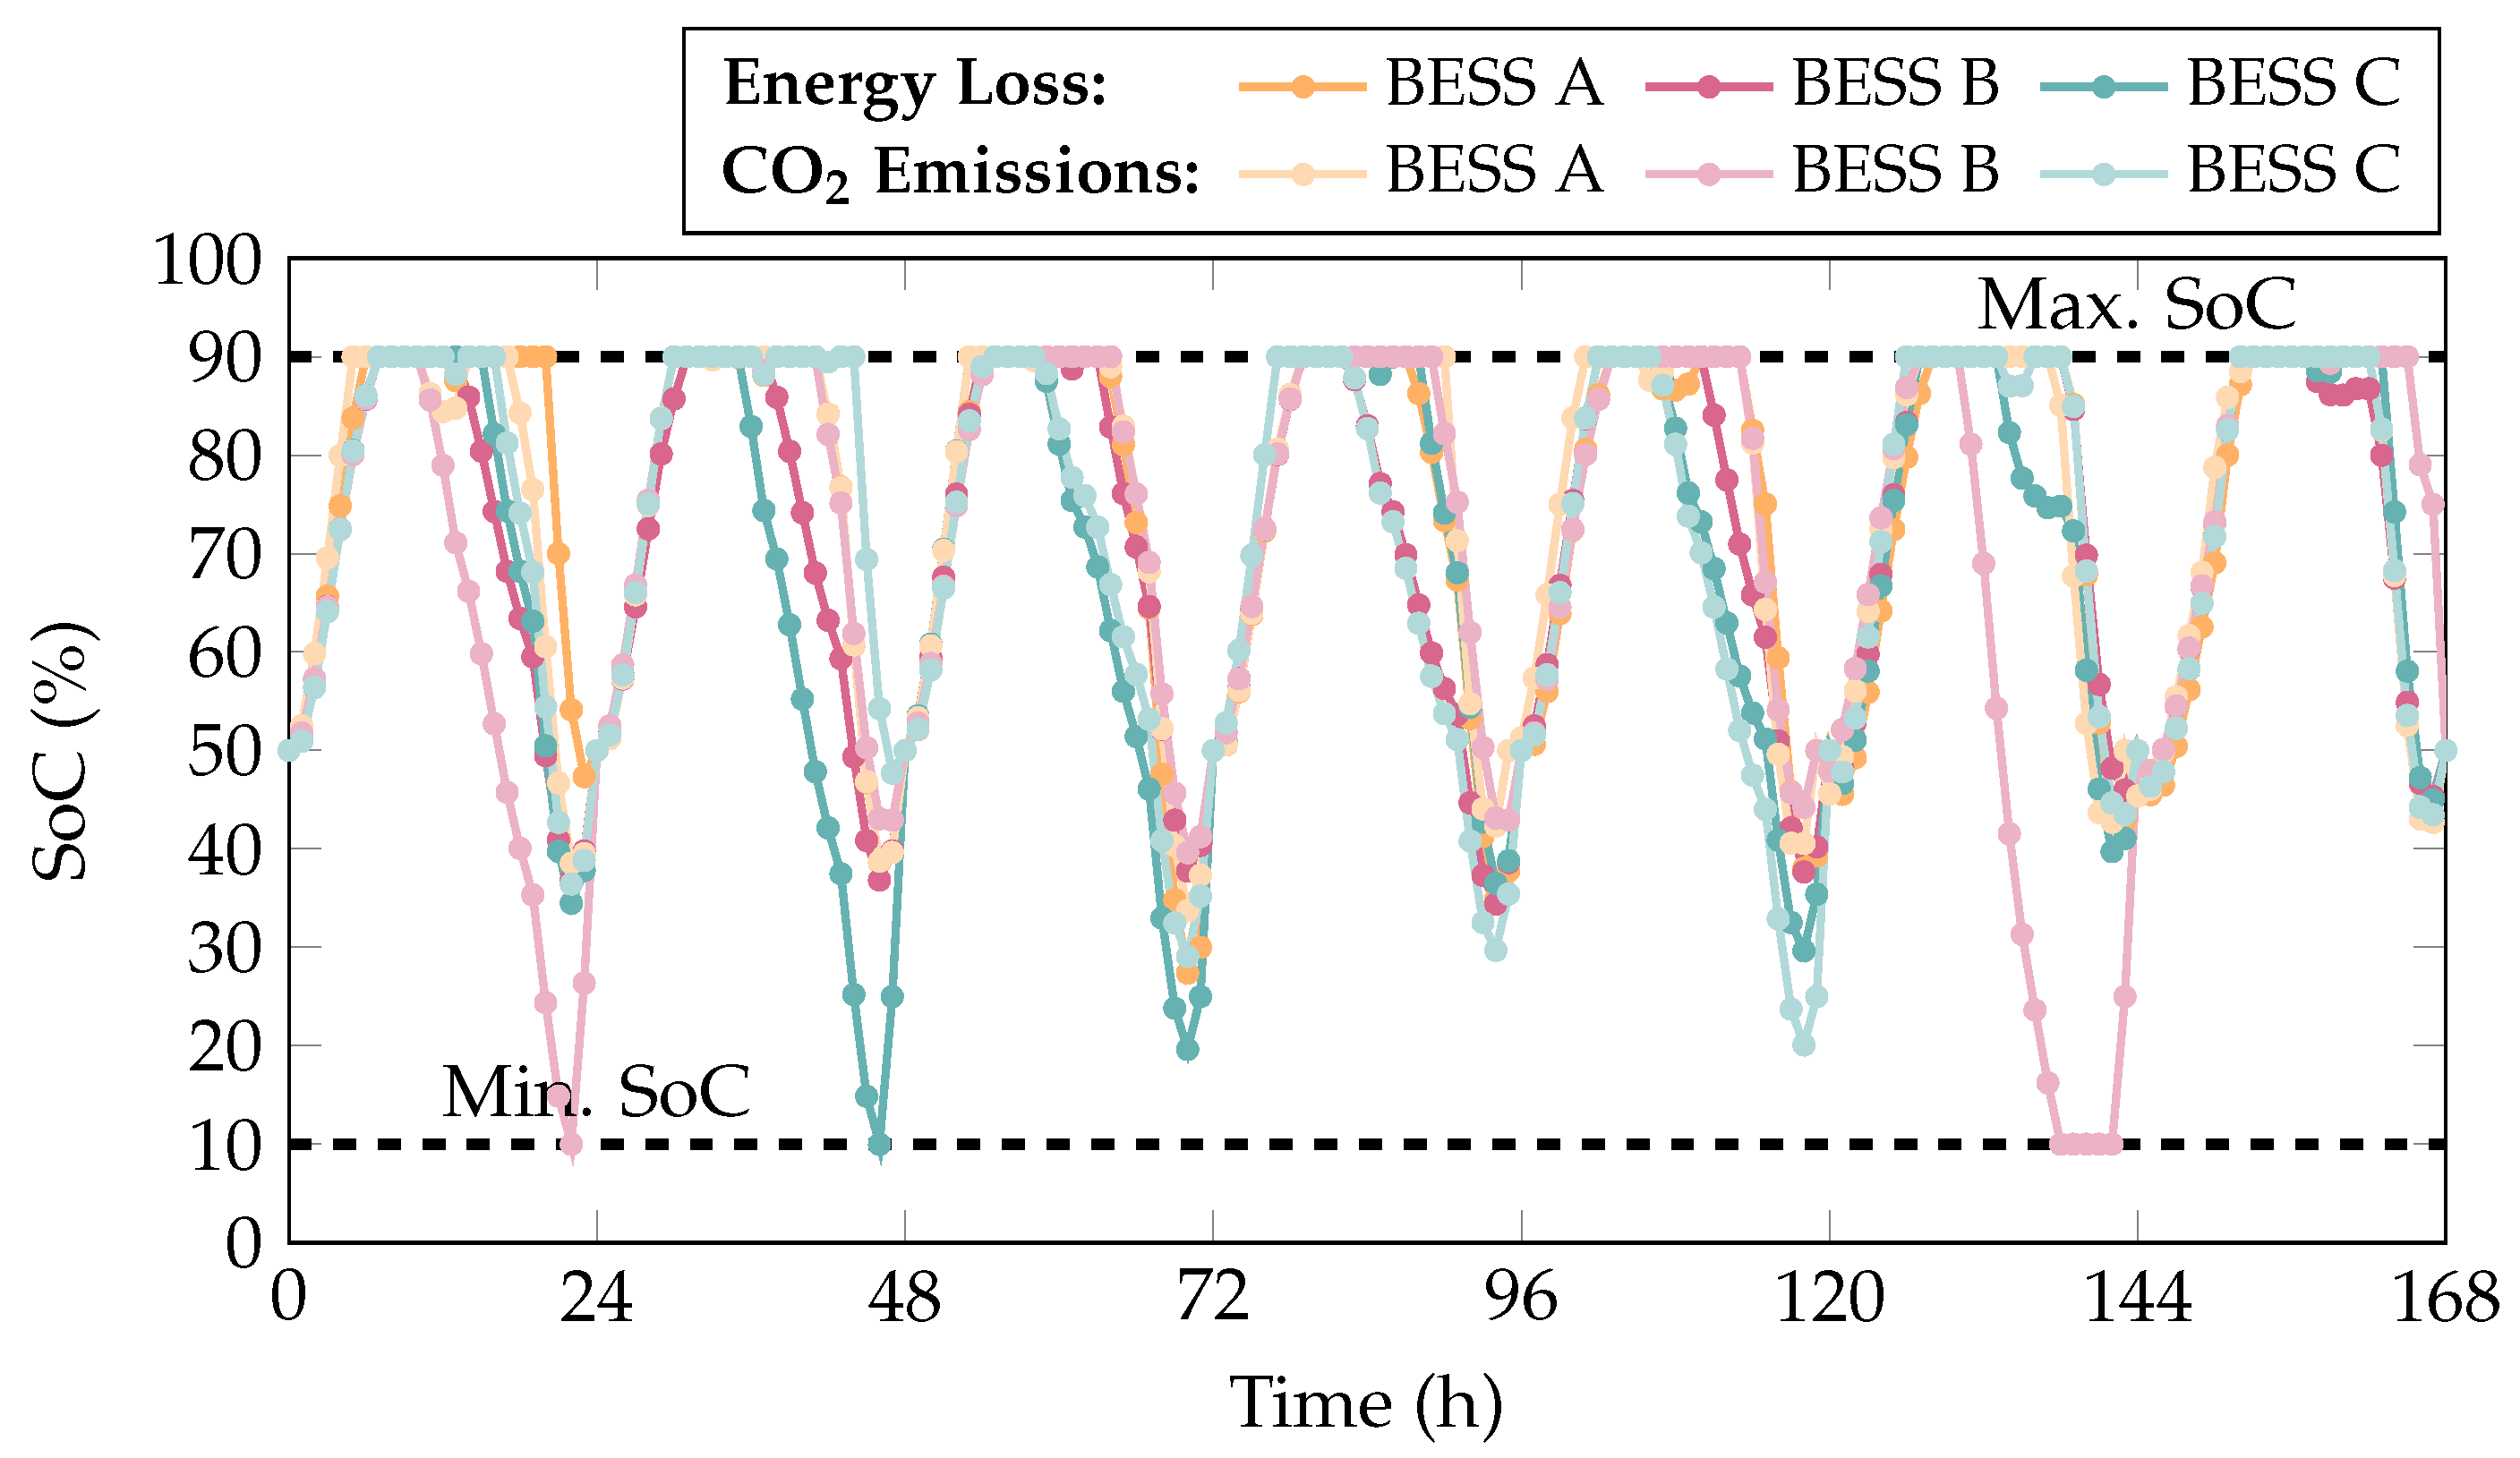
The SoC profiles in
Figure 21 demonstrate the coordinated operation of BESS units within safe operating limits (10–90%) under grid-dependent mode over the course of a full week of operation, accounting for the variability of both demand and generation. Analysis reveals three distinct operational strategies: BESS C serves as the primary flexible resource with aggressive cycling (minimum 10% SoC on Day 2); BESS B maintains stable operation (SoC > 35%) for grid stabilization; and BESS A provides intermediate support with adaptive cycling (27.38% discharge on Day 3). All units exhibit synchronized daily patterns with midday solar charging and evening discharge while maintaining complementary weekly operation that balances battery health preservation with grid support requirements. The system achieves optimal performance through this tiered operational approach, where each BESS unit fulfills specific grid support functions according to its cycling characteristics.
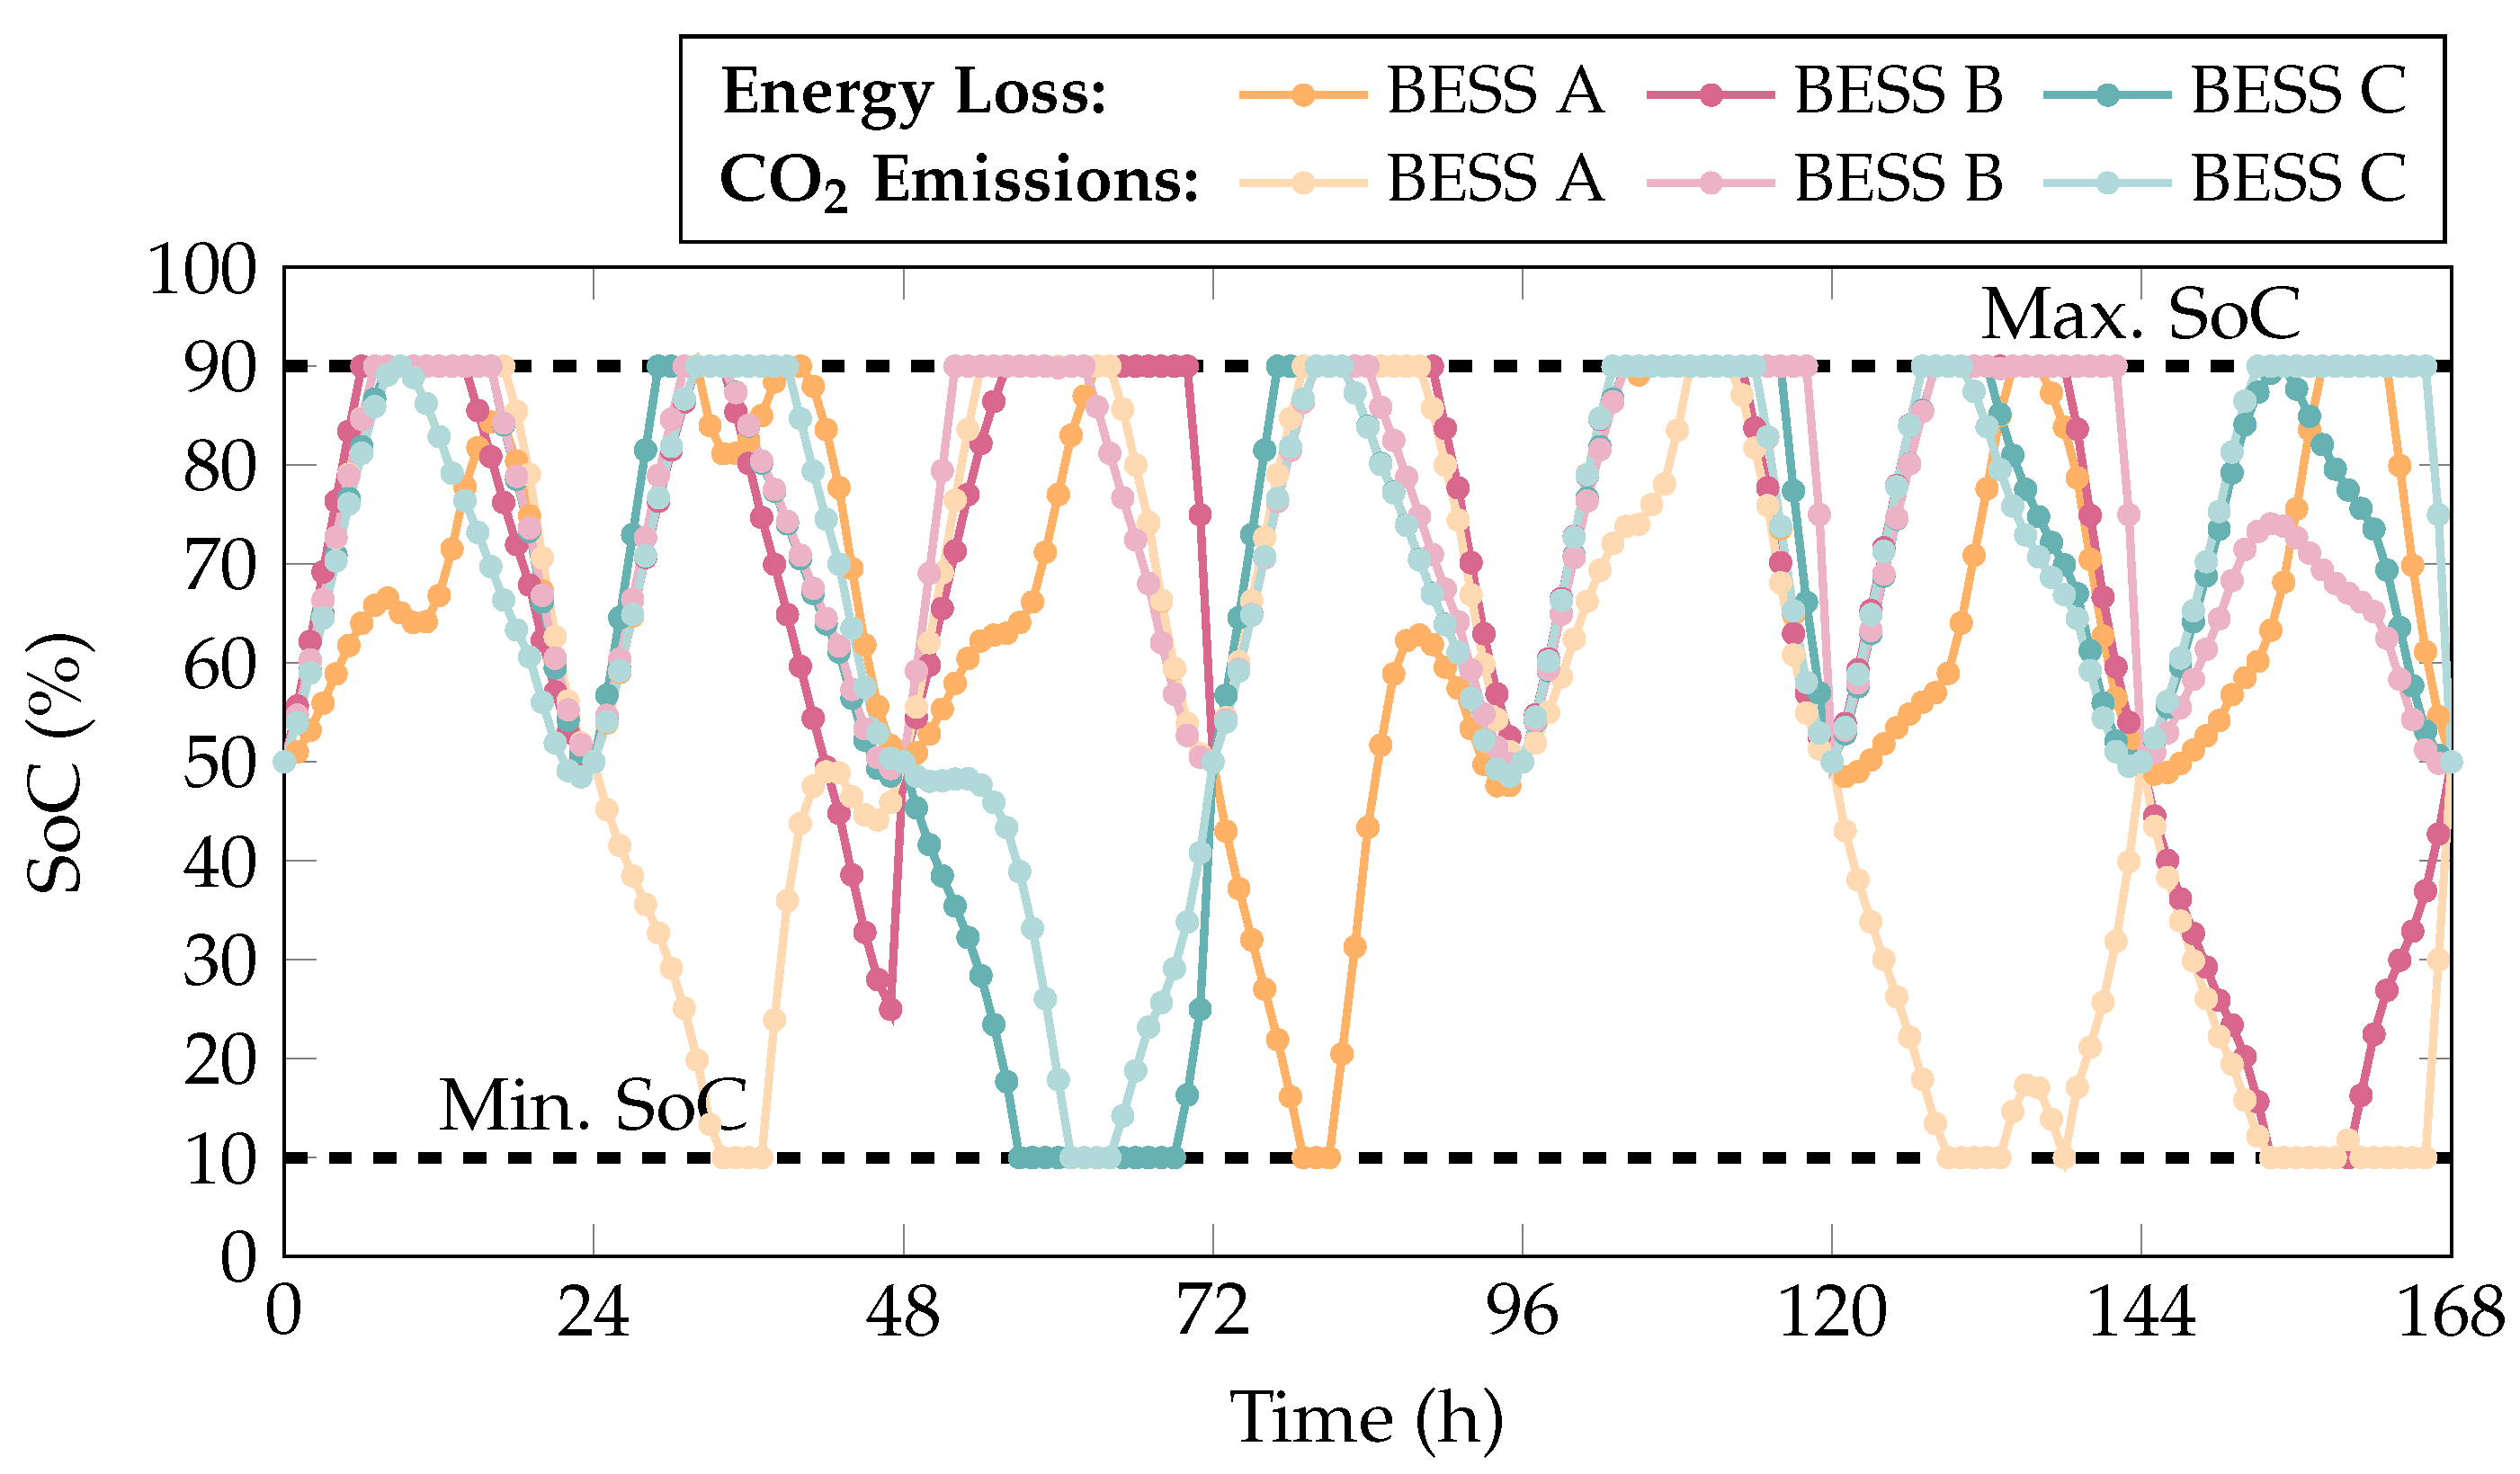
The SoC profiles in
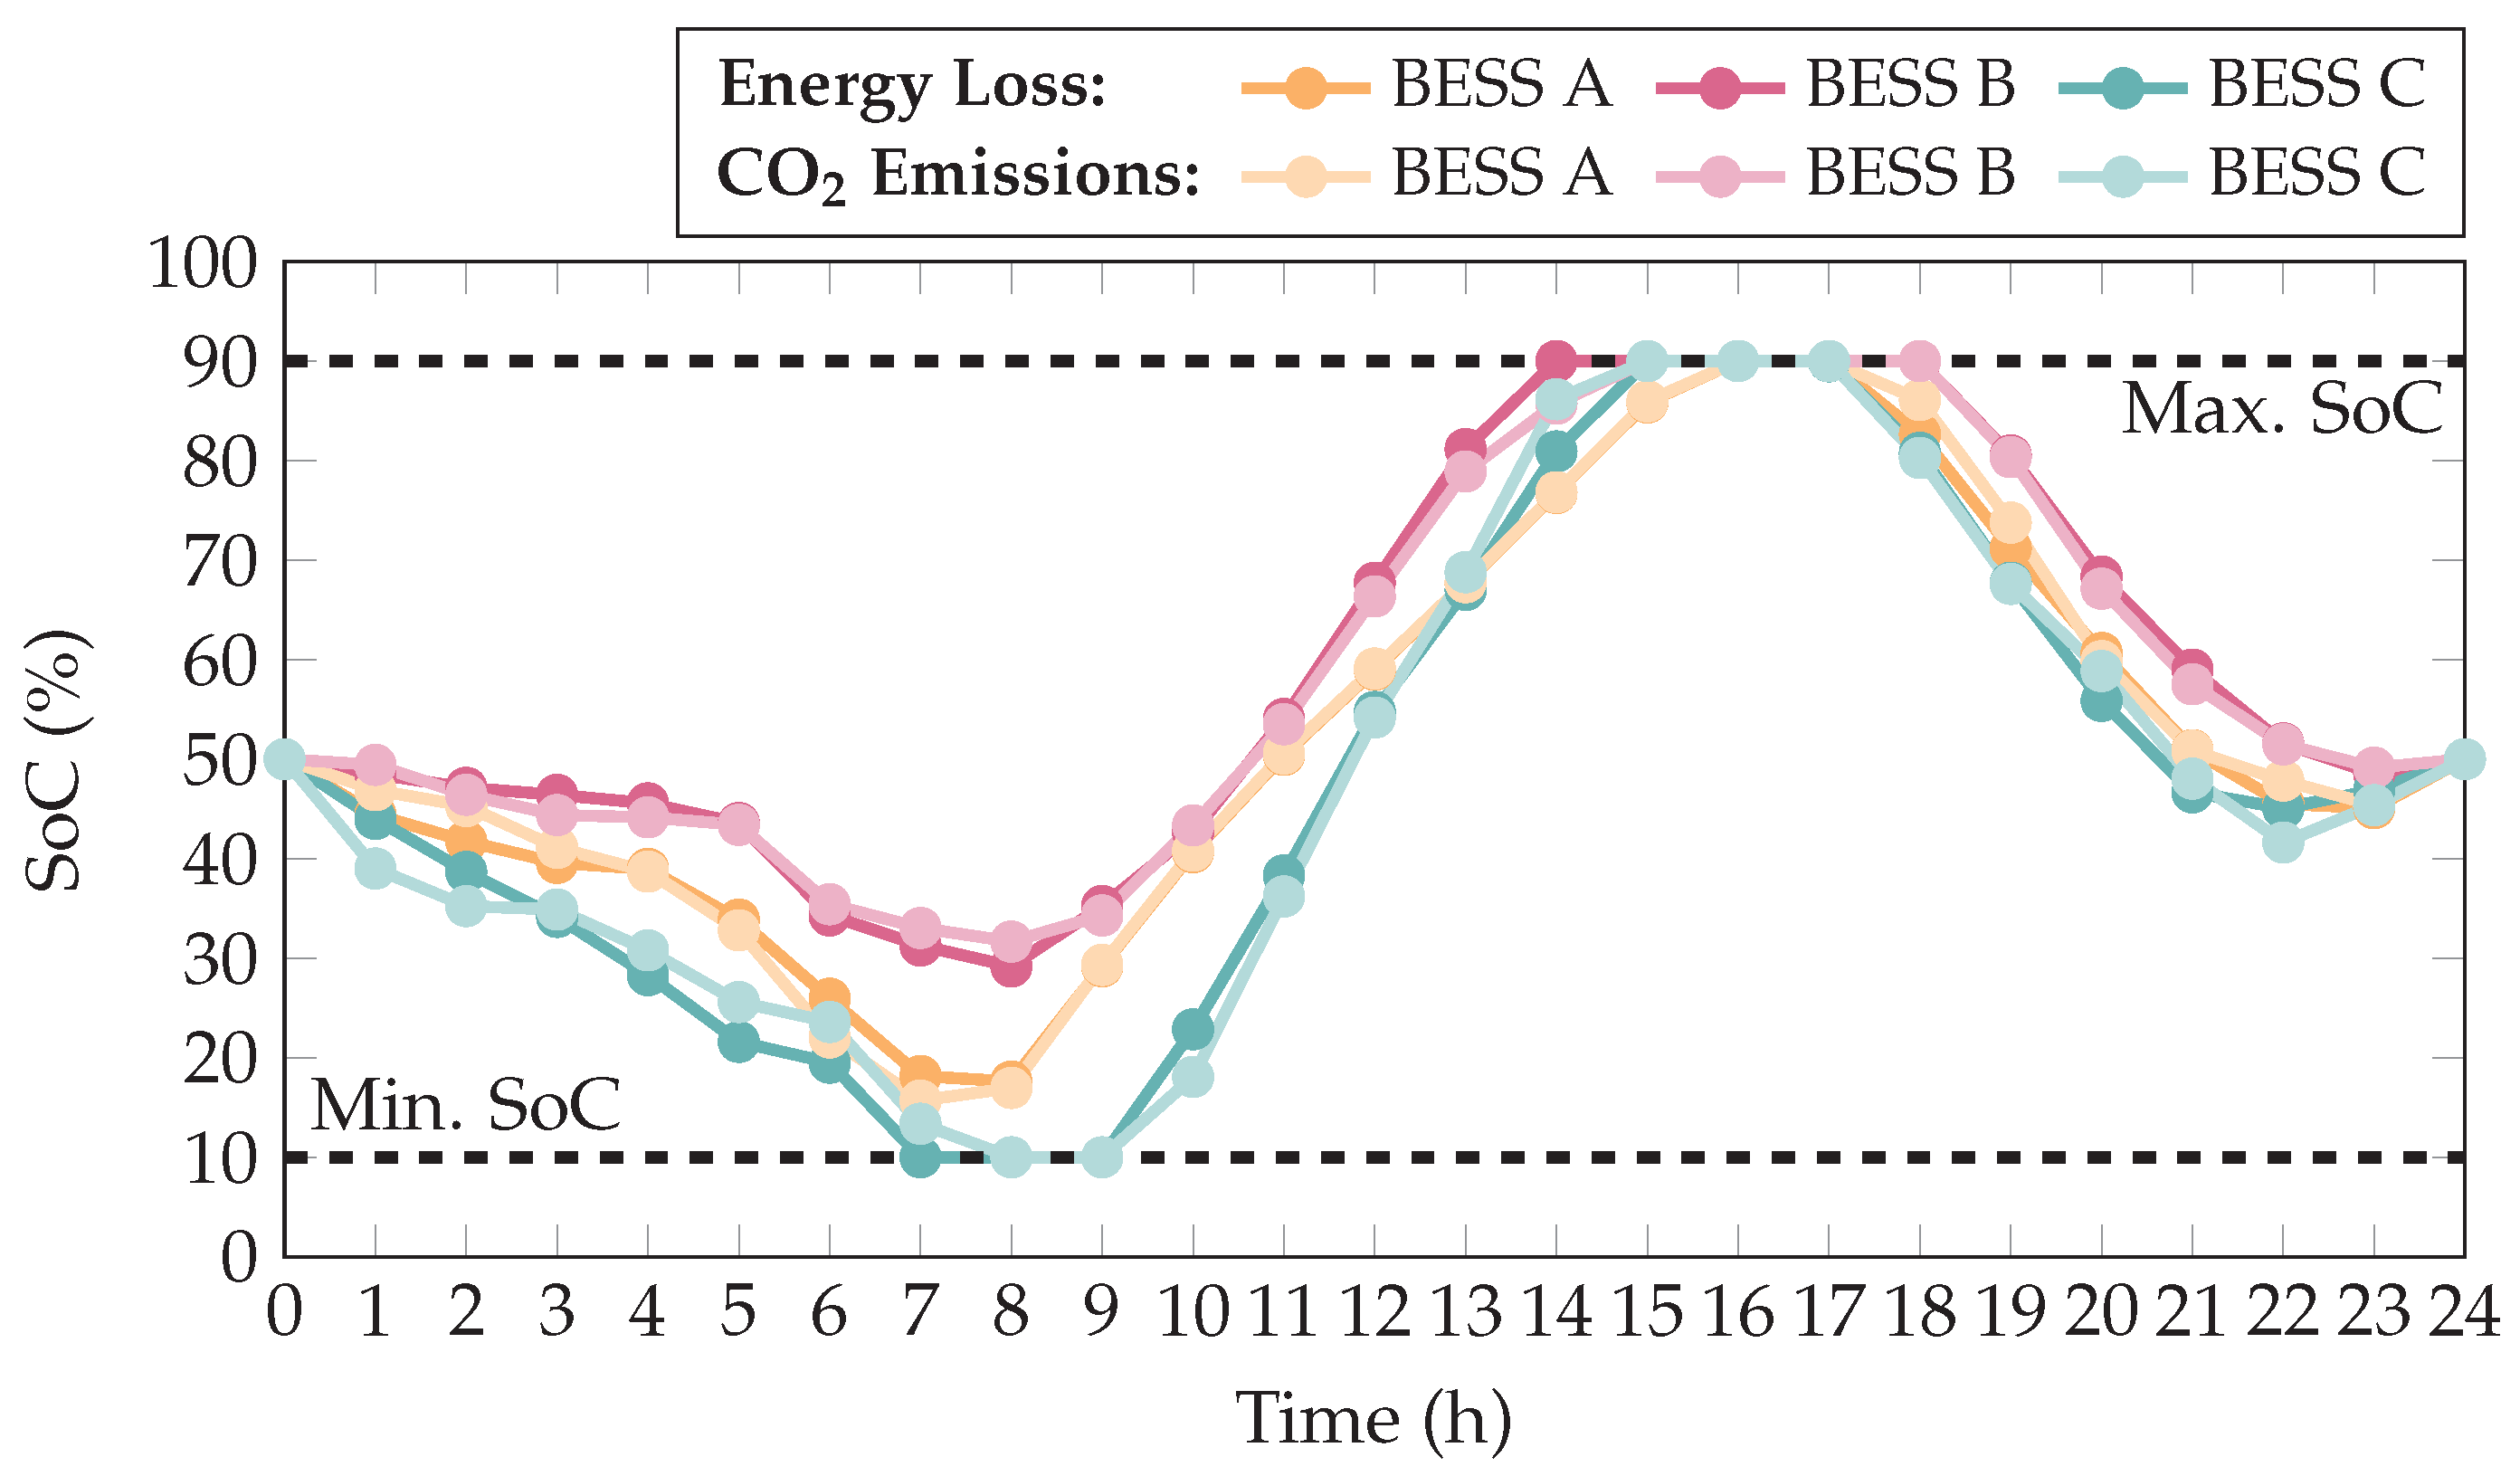
Figure 22 reveal distinct operational strategies for BESS units in self-powered mode with the objective of minimizing energy losses, with all systems maintaining safe operating limits (10–90%). BESS A demonstrates moderate cycling with gradual charge–discharge patterns, typically operating between 30–90% SoC, except for a strategic deep discharge to 10% during hours 79–81 to address critical system needs. BESS B shows more aggressive utilization, frequently charging to 90% capacity and undergoing periodic deep discharges (reaching 10% during hours 154–160), suggesting its role as the primary energy buffer. BESS C exhibits intermediate behavior with regular full recharge cycles but avoids extreme depletion, except for the period between hours 57 and 69.
On the other hand, for the objective function focused on minimizing emissions,
Figure 22 illustrates different SoC dynamics. BESS A displays a highly fluctuating SoC pattern, with frequent charging and discharging cycles, indicating a reactive strategy to counter emission peaks. BESS B maintains prolonged discharge intervals, especially between hours 0–16 and 52–117, likely aimed at supporting the system during high-demand or high-emission periods. In contrast, BESS C shows smoother transitions with a significant charging period between hours 57 and 72, possibly aligning with lower-emission windows. This behavior suggests that BESS C pursues a more balanced trade-off between operational stability and emission reduction.
Notably, the weekly operation shows consistent alignment with renewable generation patterns, strategic depth-of-discharge allocation based on unit function, and adaptive responses to changing grid conditions while maintaining safe operating limits. This configuration demonstrates an effective multi-objective optimization strategy that simultaneously addresses grid stability, renewable integration, and battery longevity requirements.
These results further support the scalability of the proposed technique, demonstrating its applicability to larger networks without compromising performance. Moreover, the method has shown strong adaptability to scenarios with high variability in both renewable generation and demand, making it a robust tool for the optimal operation of microgrids under dynamic and realistic conditions. This operational flexibility is particularly valuable in modern systems, where uncertainty and variability play a central role in decision-making.


 ,
, 

